Embed Size (px)
DESCRIPTION
Development of a New Type of Epoxy Coating for Crude Oil Storage Tanks
Citation preview
ISSN (Print): 2328-3491, ISSN (Online): 2328-3580, ISSN (CD-ROM): 2328-3629
American International Journal of Research in Science, Technology, Engineering & Mathematics
AIJRSTEM 13-143; © 2013, AIJRSTEM All Rights Reserved Page 127
AIJRSTEM is a refereed, indexed, peer-reviewed, multidisciplinary and open access journal published by International Association of Scientific Innovation and Research (IASIR), USA
(An Association Unifying the Sciences, Engineering, and Applied Research)
Available online at http://www.iasir.net
Development of a New Type of Epoxy Coating for Crude Oil Storage Tanks
*Haider H. Jasim
a *, Ala'aa A. Jasim
a , Aziz H. Al-Hilfi
b
aChemical Engineering Department, Basrah University, Iraq.
bMaterials Engineering Department, Basrah University, Iraq.
I. Introduction
Crude oil is one of the most important raw materials for the production of energy and crude oil tanks play a
strategic role in its storages. Corrosion is considered the most important factor leading to failures of tanks
structures. There are many reasons for crude oil tanks to be effected by corrosion. Firstly, tanks are exposed to
very corrosive conditions, crude oil when full; moist atmosphere when empty; cyclic heating and cooling from
atmospheric exposure. Secondly, often comes from having large surface and highly stressed areas, such as
corners, edges, and welded seam areas. Thirdly, tank coating is a very complex job with many ramifications [1].
Crude oil has a complex composition and it varies widely in their physical/chemical properties. Crude oils
do not come out of the ground pure; there are always various by-products. Typically have a variety of impurities
such as: water, CO2, H2S, various salts (Na+, K
+, Ca
+2, Cl
-... etc.) and organic acids. Oxygen (O2) is not present
in produced fluids, but it can be introduced into the oil during the processing operations with fluids that are
added. All these corrosive species lead to the corrosion in storage tanks. Various protection mechanisms to
control the corrosion in crude oil tanks have been developed including barrier protection, corrosion inhibitors,
and cathodic protection. The barrier protection deals with the disconnection of metal surface from the corrosive
environment such as coatings on the metal surface using paint and epoxy coats [2].
Epoxy coat is one of the most common coating materials used in severe corrosion environments including
crude oil environment. Due to the chemical groups of cured epoxy structure such as hydroxyl group (–OH),
carboxyl group (C = O) and amino group (N–H) that have unpaired electron, epoxy has exhibited the superior
properties when exposed to crude oil environment. The efficiency with which protection is provided is
determined by a number of properties of the total coated system, which consists of the coatings film, the metal
substrate, and it's pretreatment. The epoxy coating consists from two parts which are mixed shortly before use.
The main component of part A (Base) is a epoxy molecule group containing two so called epoxy-groups, while
the part B is a thinner (Hardener). When the two substances are mixed, a cross linked network is created,
resulting in a hard substance that can be very strong [3].
In Iraq, the crude oil storage tanks are building and distributed over many regions. One of the most difficult
problems occurring in these tanks are corrosion which causes in most cases lack and loss of crude oil which
leads to pollutions of the environments and extra cost to the economy. Jotun and Hampel coatings have trade
mark and are broader used as lining for oil tanks. These coating have high cost and need complicated during
maintenance.
The research objective of present work is to develop an epoxy coat characterized by containing both the
hydroxyl group and amine group, then tested in crude oil solutions collected from various fields located in
Abstract: A new type of epoxy coating characterized by containing both the hydroxyl group and amine
group has been developed to provide protection for crude oil storage tanks. Corrosion behavior and
flexibility were studied by using the immersion test method. The coating developed is slightly easier to apply
and have 4:1 mix ratios of Base to Hardener. The coating was tested for evolution of corrosion resistance
in the six various crude oils which collected from six fields (lower Zubair, upper Zubair, Nahr Umr, South
Rumaila, North Rumaila and west Qurna,) which lie in Basrah city of southern Iraq. A mathematical model
including the effect of pH and temperature was developed and applied in evolutions of the corrosion rate.
The results of the corrosion tests towards coated carbon steel (ASTM A537) show that the coat develops
had good resistance to crude oil corrosion and show best protection compared with other commercial (
Jotun and Hampel) coatings which were tested in same crude oil solutions. The Lower Zubair crude oil field
gives lower values of corrosion rate and west Qurna crude oil field give higher value and other fields show
moderate values of corrosion rates.
Keywords: crude oil, epoxy coating, immersion test, corrosion rate, effective groups.

H. Jasim et al., American International Journal of Research in Science, Technology, Engineering & Mathematics, 2(1), March-May, 2013,
pp. 127-137
AIJRSTEM 13-143; © 2013, AIJRSTEM All Rights Reserved Page 128
Basrah city of southern Iraq. Corrosions behavior and flexibility were studied by using immersion test method.
The effect of temperature and pH values on corrosion rate of coating developed has been studied and evaluates.
The corrosion rate of develop coats are compared with two types of coatings (Jotun and Hampel) that tested in
same crude oil solution.
II. Composition of the Coating Developed
Table1 and table 2 are list of components and amount of each of the component used for the Base and of that
for the Hardener material used. The epoxy resin and the hardener are mixed together in 1:4 hardener/Base ratios.
The ratio selected depended on the stoichiometry of the epoxy resin system. The amount and quantity of
components is choice by trial and testing of various quantities and then choosing the best sample quantity and
concentration.
Table1 Compositions and amount of base
components
Components Quantity
Phenol C6H6O 80 gm/l
Phenol4,4/-(1-methylethylidene) 300 ml
2, 2/-(1- methylethylidene) 55 ml
bis (4, 1-phenylenoxymethylene) 300 ml
oxirane C2H4O 1000ppm/100 ml solvent
m-xylene C6H4(CH3)2 45ml
Zinc phosphate Zn3P2 40 gm/l
Benzyl alcohol C7H8O 120 ml
III-Preparation and Coating of the Specimens
The test samples were cut from plate storage tank, carbon steel (ASTM A537) with the following
compositions: Fe (97.58%), C (0.24%), Mn (0.035%), S (0.035%), Cr (0.025%), Si (0.5%), Mo (0.08%), Ni
(0.25%), Cu (0.35%) [4]. The coupons have the dimensions of (25 x 50 x 6) mm for the purpose of immersion
test. Test coupons were prepared in the engineering college machine shop. A hole was drilled in the meddle of
each specimen. The specimen were polished by using a different metallographic grade (180, 500, and 800) of
emery paper then cleaned by distilled water and dried in a stream of air at room temperature. A total of 100
coupons were processed for testing. The coating was applied as coats and then it is left to dry for two weeks at
room temperature and atmospheric pressure before being exposed to solution test. Figure 1, A and B show
specimen before and after coating.
IV-Crude Oil Samples
The crude oil samples were collected from six various fields located in the Basrah region (North Rumaila,
South Rumaila, Upper Zubair, Lower Zubair, Nahr Umr and West Qurna). The crude oil heavy metals analysis
using a spectrophotometer was carried at the Basrah Refinery laboratory, south oil company of Iraq. The other
physical properties and dissolved gases are analyzed in chemical engineering laboratory of Basrah University,
Iraq . Table 3 and table 4 show material composition, physical characteristic and dissolved gases of crude oil
samples. The viscosity, specific gravity and dielectric constant of crude oils are measured laboratory and
illustrated in table 5.
Figure 1 Specimen before and after coating with developed epoxy coating
B- After coating
A-Before coating
Table 2 Characteristic and concentration
of thinner components
Components Concentration
m-xylene C6H4(CH3)2 60 %
solvent naphtha 10 %
light aromatic (Benzene) 7 %
Polyamine
(triethylenetetramine)
23 %

H. Jasim et al., American International Journal of Research in Science, Technology, Engineering & Mathematics, 2(1), March-May, 2013,
pp. 127-137
AIJRSTEM 13-143; © 2013, AIJRSTEM All Rights Reserved Page 129
Table 3 Material composition of different crude oils
Field
Metals ppm wt
North
Rumaila
South Rumaila Zubair -
Upper
Zubair -
Lower
Nahr -
Umr
West-
Qurna
Iron 3 1.4 2.25 1.6 2 7
Copper 5 7 0.8 0.2 9 14
Vanadium 43 55.7 40.1 31 49 62
Nickel 8.2 11 10 8.7 10.5 9.8
Cadmium 0.1 0.17 0.64 0.02 2 3
Zinc 0.13 0.07 0.41 0.04 0.08 0.89
Aluminum 0.2 0.16 0.11 0.03 0.06 0.09
Manganese 0.10 0.07 0.04 0.02 0.03 0.18
Table 4 Physical properties of crude oils
Field
Property
North
Rumaila
South
Rumaila
Zubair Upper Zubair Lower Nahr Umr West-
Qurna
API 33.8 30.2 34.3 34.1 33.6 32.31
Carbon residue % 7.3 6.33 5.99 3.95 3.1 8.4
Sulfur % 3.9 2.92 2.95 1.1 2.1 4.3
Water content % by volume 1 0.75 0.8 0.2 0.6 0.9
N2 (g) % 0.13 0.98 0.08 0.09 0.81 0.79
TAN mgKOH/gm oil 0.37 0.112 0.2 0.06 0.11 0.333
Salt NaCl ppm 14 13 11 3.8 5 10.81
Asphaltenes % 2.2 1.45 1.2 0.5 0.77 0.94
H2S (g) ppm 1.1 1 2 0.7 1 1.5
CO2 (g) ppm 3 3 2 2 2.3 3.5
O2 (g) % 1 1.1 0.9 0.9 0.9 1.1
Table 5 Viscosity, specific gravity and dielectric constant of crude oils
Property
Fields
North
Rumaila
South
Rumaila
Zubair
Lower Zubair Upper Nahr Umr West Qurna
Viscosity (cst)
40oC 12.1 17.6 5.8 9.8 16 28.3
50oC 11.4 13.8 5.3 9.1 15.8 21.2
60oC 8.6 12.1 4.5 6.7 11.9 16.4
Specific gravity
40oC 0.8860 0.8952 0.8745 0.9047 0.8572 0.9073
50oC 0.8801 0.8707 0.8702 0.8902 0.8503 0.8973
60oC 0.8533 0.8648 0.8678 0.8813 0.8433 0.8854
Dielectric
constant
40oC 2.414 2.261 1.921 1.988 2.102 2.509
50oC 2.353 2.207 1.864 1.945 2.006 2.492
60oC 2.305 2.152 1.833 1.892 1.989 2.432
V-Apparatus and Test Procedure
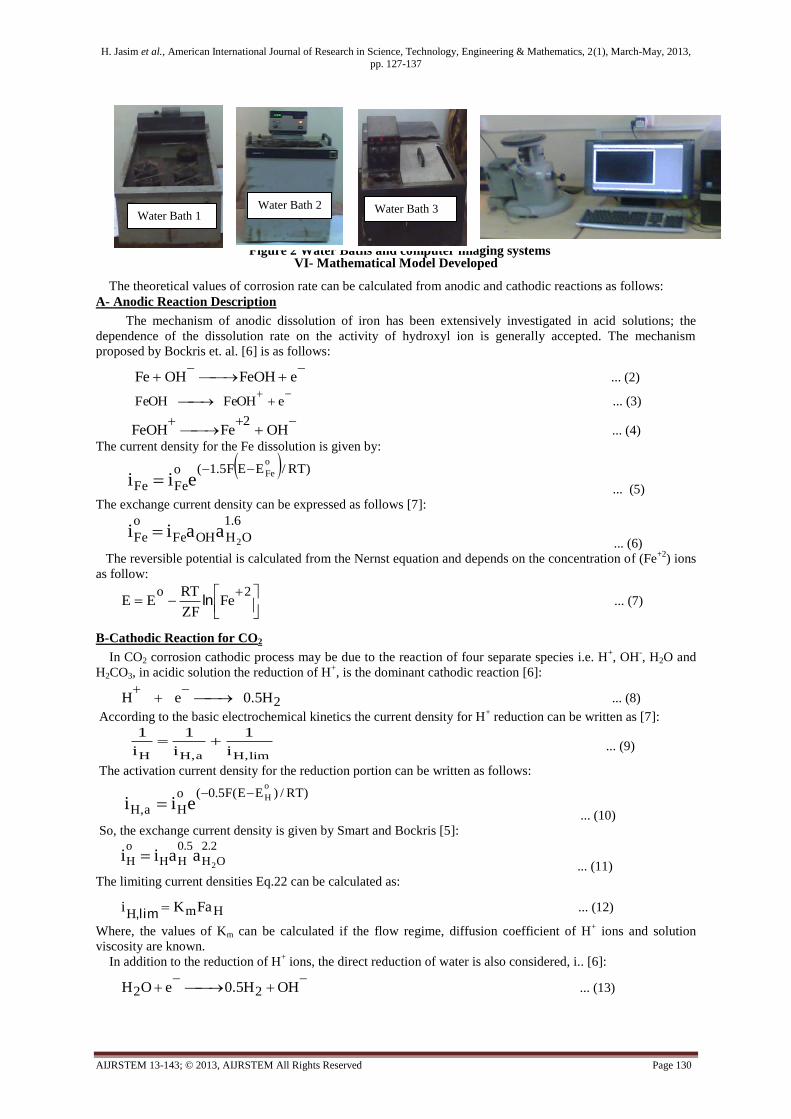
The equipment used for the experiment are three water baths, Beakers 500ml., sensitive weighting balance,
Digital pH meter, long pin and nylon thread for suspended the specimens in beakers. A computerize Carl Zeiss
Jena imaging system, using microscope provided by camera smart technical have (22 Mega pixels) used to
photo the surface of specimen before and after test. The apparatus are shown in figure 4.
After taking the initial weight of the coated coupons, the coupons were suspended inside the 500 ml Beaker
containing crude oil solution balanced with 10% NaOH and 0.1N HCl solution to obtain the pH value of the
crude oil solutions are equal to 5, 6 and 7. Immersion test was carried out at a set of temperature range between
(40°C to 60°C). The temperature is regulated using water bathes, for an exposure period of 180 days. After each
15 day of coated coupon immersion, the coupons were extracted from the crude oils and cleaned, then weighed.
The corrosion rate is calculated assuming uniform corrosion over the entire surface of the coupon in (mm/year)
using the expression [5]:
tA
W10768CR
s
4
*. … (1)
H. Jasim et al., American International Journal of Research in Science, Technology, Engineering & Mathematics, 2(1), March-May, 2013,
pp. 127-137
AIJRSTEM 13-143; © 2013, AIJRSTEM All Rights Reserved Page 130
VI- Mathematical Model Developed
The theoretical values of corrosion rate can be calculated from anodic and cathodic reactions as follows:
A- Anodic Reaction Description
The mechanism of anodic dissolution of iron has been extensively investigated in acid solutions; the
dependence of the dissolution rate on the activity of hydroxyl ion is generally accepted. The mechanism
proposed by Bockris et. al. [6] is as follows:
eFeOHOHFe ... (2)
eFeOHFeOH ... (3)
OHFeFeOH2
... (4)
The current density for the Fe dissolution is given by:
)RT/EEF5.1(o
FeFe
o
Feeii
... (5)
The exchange current density can be expressed as follows [7]:
6.1
OHOHFe
o
Fe 2aaii
... (6)
The reversible potential is calculated from the Nernst equation and depends on the concentration of (Fe+2
) ions
as follow:
2oFe
ZF
RTEE ln ... (7)
B-Cathodic Reaction for CO2
In CO2 corrosion cathodic process may be due to the reaction of four separate species i.e. H+, OH
-, H2O and
H2CO3, in acidic solution the reduction of H+, is the dominant cathodic reaction [6]:
2H50eH .
... (8)
According to the basic electrochemical kinetics the current density for H+ reduction can be written as [7]:
lim,Ha,HH i
1
i
1
i
1
The activation current density for the reduction portion can be written as follows:
)RT/)EE(F5.0(o
Ha,H
o
Heii
... (10)
So, the exchange current density is given by Smart and Bockris [5]:
2.2
OH
5.0
HH
o
H 2aaii
... (11)
The limiting current densities Eq.22 can be calculated as:
HmHFaKi
l im, ... (12)
Where, the values of Km can be calculated if the flow regime, diffusion coefficient of H+ ions and solution
viscosity are known.
In addition to the reduction of H+ ions, the direct reduction of water is also considered, i.. [6]:
OHH50eOH 22 . ... (13)
Figure 2 Water Baths and computer imaging systems
Water Bath 1
Water Bath 2
Water Bath 3
... (9)

H. Jasim et al., American International Journal of Research in Science, Technology, Engineering & Mathematics, 2(1), March-May, 2013,
pp. 127-137
AIJRSTEM 13-143; © 2013, AIJRSTEM All Rights Reserved Page 131
The water reduction does not have limiting current density because there are no diffusion limitations for the
transport of H2O molecules to the surface. Thus the current density can be express as:
)RT/EEF5.0(o
OHOH
o
H
22eii
... (14)
Thus the exchange current density is given by the following equation [7]:
22
OH
50
HOH
o
OH222
aaii..
At (pH > 4) reduction of carbonic acid (H2CO3) becomes the dominant cathodic process and carbonic acid
results from the hydration of dissolved CO2, i.e.
3222 COHOHCO ... (16)
The H2CO3 reduction is under chemical reaction control so,
limCOHCOHCOH 32a,3232
i
1
i
1
i
1
The activation current is given by [12]:
)RT/EEF(o
COHCOH
o
H3CO2H
32a,32eii
The exchange current density for H2CO3 reduction can be expressed as:
5.0
HCOHCOH
o
COH aaii323232
... (19)
Following Nesic et. al. [8] the limiting current density can be expressed as follows:
50
fCOHCOHCOHCOHCOH 3232323232
KKDFai.
lim,*
... (20)
Where,
scm10D25
COH32
/
, 3
COH1071K
32
*.
The values of f
3CO2HK at any temperature are calculated from the expression developed by Nesic et al. [8]:
T
11715TLog532169
10f
3CO2HK
)(.
... (21)
For all partial process the generalized Arrhenius equation can be expressed as follows [8]:
oTT
T
1
T
1
RT
Gii
oexp
* ... (22)
And the applied current density ( i* ) is:
)exp(*
RT
G
A
zAi
w
a
According to mixed potential theory:
.corranodecathode III
Faraday’s law used to calculate the corrosion rate ( CR) in mm/year for uniform corrosion as follows [9]:
wm
cor3E
I10273CR
.**. ... (25)
C- Calculation of crude oil activity
Bromley, show a method for the calculating of activity coefficient as followers [10]:
IBI
IZZ
511
ZZB60060
I1
IZZAij2
ijdi
.
..log
... (26)
Where, 2iiZm
2
1I ,
3
br
Ad
TkDi4
e
3
N2A
***
AND BBB
The coefficients for the Bromley equation are given in table 6.
... (23)
... (15)
... (18)
... (17)
... (24)
H. Jasim et al., American International Journal of Research in Science, Technology, Engineering & Mathematics, 2(1), March-May, 2013,
pp. 127-137
AIJRSTEM 13-143; © 2013, AIJRSTEM All Rights Reserved Page 132
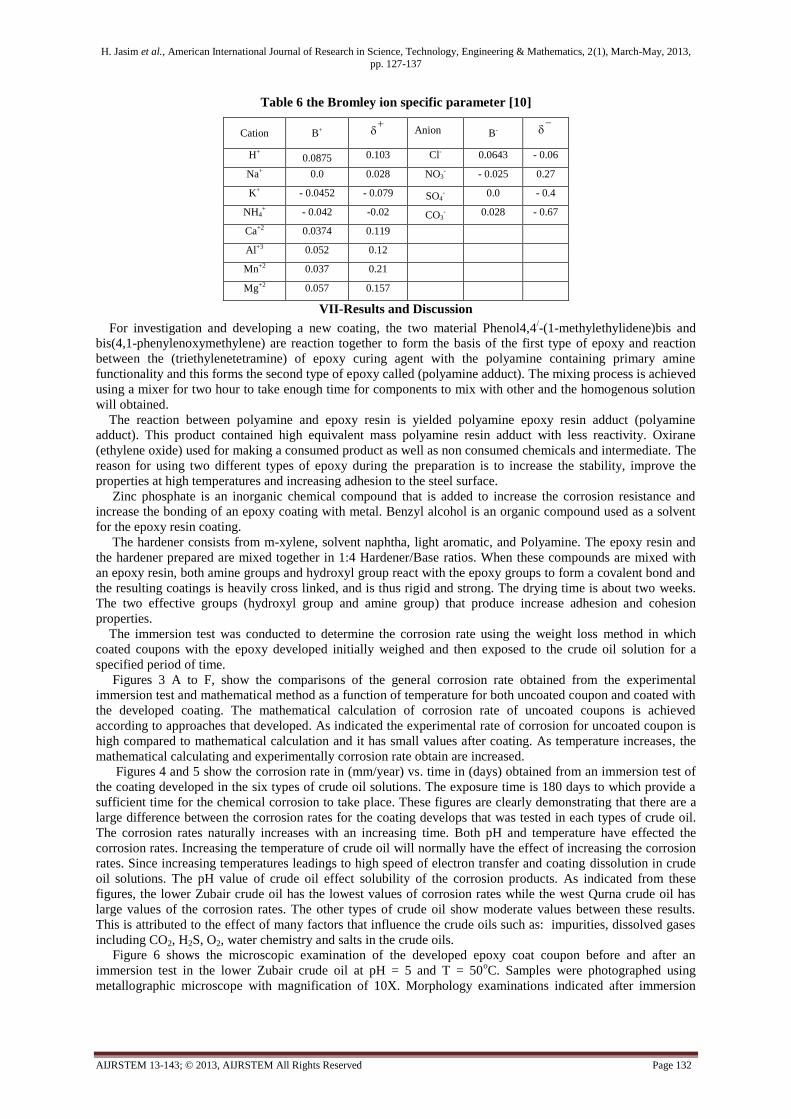
Table 6 the Bromley ion specific parameter [10]
Cation B+
Anion B-
H+
0.0875 0.103 Cl- 0.0643 - 0.06
Na+ 0.0 0.028 NO3- - 0.025 0.27
K+ - 0.0452 - 0.079 SO4- 0.0 - 0.4
NH4+ - 0.042 -0.02 CO3
- 0.028 - 0.67
Ca+2 0.0374 0.119
Al+3 0.052 0.12
Mn+2 0.037 0.21
Mg+2 0.057 0.157
VII-Results and Discussion
For investigation and developing a new coating, the two material Phenol4,4/-(1-methylethylidene)bis and
bis(4,1-phenylenoxymethylene) are reaction together to form the basis of the first type of epoxy and reaction
between the (triethylenetetramine) of epoxy curing agent with the polyamine containing primary amine
functionality and this forms the second type of epoxy called (polyamine adduct). The mixing process is achieved
using a mixer for two hour to take enough time for components to mix with other and the homogenous solution
will obtained.
The reaction between polyamine and epoxy resin is yielded polyamine epoxy resin adduct (polyamine
adduct). This product contained high equivalent mass polyamine resin adduct with less reactivity. Oxirane
(ethylene oxide) used for making a consumed product as well as non consumed chemicals and intermediate. The
reason for using two different types of epoxy during the preparation is to increase the stability, improve the
properties at high temperatures and increasing adhesion to the steel surface.
Zinc phosphate is an inorganic chemical compound that is added to increase the corrosion resistance and
increase the bonding of an epoxy coating with metal. Benzyl alcohol is an organic compound used as a solvent
for the epoxy resin coating.
The hardener consists from m-xylene, solvent naphtha, light aromatic, and Polyamine. The epoxy resin and
the hardener prepared are mixed together in 1:4 Hardener/Base ratios. When these compounds are mixed with
an epoxy resin, both amine groups and hydroxyl group react with the epoxy groups to form a covalent bond and
the resulting coatings is heavily cross linked, and is thus rigid and strong. The drying time is about two weeks.
The two effective groups (hydroxyl group and amine group) that produce increase adhesion and cohesion
properties.
The immersion test was conducted to determine the corrosion rate using the weight loss method in which
coated coupons with the epoxy developed initially weighed and then exposed to the crude oil solution for a
specified period of time.
Figures 3 A to F, show the comparisons of the general corrosion rate obtained from the experimental
immersion test and mathematical method as a function of temperature for both uncoated coupon and coated with
the developed coating. The mathematical calculation of corrosion rate of uncoated coupons is achieved
according to approaches that developed. As indicated the experimental rate of corrosion for uncoated coupon is
high compared to mathematical calculation and it has small values after coating. As temperature increases, the
mathematical calculating and experimentally corrosion rate obtain are increased.
Figures 4 and 5 show the corrosion rate in (mm/year) vs. time in (days) obtained from an immersion test of
the coating developed in the six types of crude oil solutions. The exposure time is 180 days to which provide a
sufficient time for the chemical corrosion to take place. These figures are clearly demonstrating that there are a
large difference between the corrosion rates for the coating develops that was tested in each types of crude oil.
The corrosion rates naturally increases with an increasing time. Both pH and temperature have effected the
corrosion rates. Increasing the temperature of crude oil will normally have the effect of increasing the corrosion
rates. Since increasing temperatures leadings to high speed of electron transfer and coating dissolution in crude
oil solutions. The pH value of crude oil effect solubility of the corrosion products. As indicated from these
figures, the lower Zubair crude oil has the lowest values of corrosion rates while the west Qurna crude oil has
large values of the corrosion rates. The other types of crude oil show moderate values between these results.
This is attributed to the effect of many factors that influence the crude oils such as: impurities, dissolved gases
including CO2, H2S, O2, water chemistry and salts in the crude oils.
Figure 6 shows the microscopic examination of the developed epoxy coat coupon before and after an
immersion test in the lower Zubair crude oil at pH = 5 and T = 50oC. Samples were photographed using
metallographic microscope with magnification of 10X. Morphology examinations indicated after immersion

H. Jasim et al., American International Journal of Research in Science, Technology, Engineering & Mathematics, 2(1), March-May, 2013,
pp. 127-137
AIJRSTEM 13-143; © 2013, AIJRSTEM All Rights Reserved Page 133
test, there are some pits on the coated surface of the coat coupon and degradation in coating, besides, the color
of the surface is found to be changes.
The different concentration of water and dissolved gases of crude oil samples make it different in corrosion
effects. In general, increase of water concentration increases the corrosion rate. As seen from crude oil
composition, the water percent of lower Zubair fields is the lowest value while the West Qurna and North
Rumaila have the large values. This attributed as believe that West Qurna field is near the Euphrates river that
passed through field and middle it into two parts phase1 and phase2, while lower Zubair and upper Zubair field
lays in desert regions.
The lower Zubair field contains low sulfur and high asphalt. The presence of asphalting in the crude oil
causes a reduction in corrosion rate and as the concentration of asphalting increases the corrosion rate decreases.
An asphalting forms a strong protective layer on the steel surface which acts as a barrier for corrosive agents and
reduces the corrosion. West Qurna Crude oils contain high concentrations of sulphur constituents and this can
cause high levels corrosion when these components react with water to form acidic compounds. Sulphur is
cathodic by nature and can promote the formation of an active corrosion cell
Figure 7 shows comparison between developed coating and commercial Jotun and Hampel coating
manufactured by Sharja Company, United Arab Emirates, which used in Iraq in a broader range. As indicate
that the best protection was provided by the develop coatings which exhibit low corrosion losses, and provide
better overall performance than the other coatings and deemed a viable corrosion control system. Whereas
Hampel coating exhibits the greatest amount of weight loss due to corrosion. This is attributed to the
composition of the coatings and reactivity of the effective groups found. The effective hydroxyl and amine
group in developed coatings strongly improves the barrier properties and lowers the permeability of dissolved
gases. The effective groups are initiate high links covalent through material coats which make the components
are very cohesive, decreased the porosity and increase hardness, this lead to increased resistance to corrosion
rates under various temperature and pH values.
VIII - Conclusions
From the previous discussion the following remarks can be concludes:
1- Good agreements obtained from both mathematical and experimental immersion test method for uncoated
coupon under different temperature and pH values.
2- Developed, Jotun and Hampel coatings show good resistance to crude oil solution, but Hampel show large
corrosion rates compared with others coatings that tested.
3- The lower Zubair petroleum has lower rate of corrosion while west Qurna petroleum has the large value of
corrosion rate this due to composition of each types of petroleum.
4-The developed coating was excellent with good adherence and cohesion strength as observed prior to and after
exposure to crude oil solution.
IX - References
[1] M. L. Medvedena and T. D. Tiam, “Classification of corrosion damage in Steel Storage Tanks”, Chemical and Petroleum Eng., vol.34,
no.9, 1998, pp. 621-622. [2] Lana Skrtic, Hydrogen Sulfide, Oil and Gas, and People’s Health, M. Sc. Thesis, University of California, Berkeley, USA, 2006.
[3] J. H. W. De Wit, D. H. Van Der Weijde and G. Ferrari, Organic Coatings, Chapter 19, in Corrosion Mechanism in Theory and Practice,
Second Edition, Philippe Marcus, France, 2002. [4] ASTMA537 CL2 steel plate/sheet for Weldable normalized fine grained pressure vessel steel, Report of Henan Bebon International Co.
Ltd., 2012.
[5] A. Anderko, P. Mckenzie and R. D. Young, “Computation rate of general corrosion using electrochemical and the thermodynamic models”, paper No. 479, Corrosion 2000, Orlando, USA.
[6] N. G. Smart and J. O. Bockeris, “Effect of Water Activity on Corrosion”, Corrosion 92, vol.48, 1992. [7] A. Anderko and R. D. Young, “Simulation of CO2/H2S corrosion using thermodynamic and electrochemical models”, Report of OLI
System Inc., 2004.
[8] W. Sun and S. Nesic, “A mechanistic model of SH2 corrosion of mild steel”, paper no.07665, Corrosion 2007, NACE Report.
[9] Standard Practice for Calculation of Corrosion Rates and Related Information from Electrochemical Measurements, G 102, Report of
American Society for Testing and Materials, USA, (1999). [10] I. Bromly, “Thermodynamic Properties of Strong Electrolyte in Aqueous Solution”, AICHE Journal, vol.19, no. 2, 1973, pp.313-320.
X Acknowledgment
The authors express thanks to staff of the chemical engineering laboratories, Basrah Universityand stuff
engineer at Basrah petroleum refinery. Also the authors would also like to thank Dr. Rudolf Dölling from the
Bank Elektronik - Intelligent Controls GmbH, Germany for his help and useful remarks.
Nomenclature
As Exposed specimen area cm2 Kb Boltzman constant J/K
io Exchange current density A/m2 Zi Valance of ion i -
Icorr. Corrosion current density A/m2 Di Dielectric constant -
E Electrode potential V t Immersion exposed time hr.
Eeq Equilibrium potential V W Mass loss g
Km Mass transfer coefficient cm/s I Ionic strength -

H. Jasim et al., American International Journal of Research in Science, Technology, Engineering & Mathematics, 2(1), March-May, 2013,
pp. 127-137
AIJRSTEM 13-143; © 2013, AIJRSTEM All Rights Reserved Page 134
F Faraday constant - Ew Equivalent weight -
R Universal gas constant - Aw Atomic weight of element g/mol
NA Avogadro number - r Permittivity in vacuum C2/J.m
T Applied Temperature K c Density of crude oil Kg/m3
To Reference temperature K G Free energy charge kJ/mol
Ad Debye-Huckel constant - Symmetry coefficient -
B+, B- Bromly constants - Density of coupon -Kg/m3
Z+ , Z- cation and anion charge -
OHa ,
Ha Activity of hydroxyl ion and
hydrogen ion, -
Fig. 3 Comparison between analytical and experimental method at pH = 5 and different temperature for developed
epoxy coating for: A- Lower Zubair B- Upper Zubair C – South Rumaila D- North Rumaila E - Nahr Umr
F-West Qurna crude oil.
0.07
0.104
0.138
0.172
0.206
0.24
35 40 45 50 55 60 65
Temperature ( )
Co
rro
sio
n r
ate
(m
m/y
ea
r)
Immersion test of developed coating
Immersion test of uncoated coupon
Analytical method of uncoated coupon
C
o
0.06
0.094
0.128
0.162
0.196
0.23
35 40 45 50 55 60 65
Temperature ( )
Co
rro
sio
n r
ate
(m
m/y
ea
r)
Immersion test of developed coating
Immerson test of uncoated coupon
Analytical method of uncoated coupon
C
o
0.02
0.04
0.06
0.08
0.1
0.12
0.14
0.16
0.18
0.2
35 40 45 50 55 60 65
Temperature ( )
Co
rro
sio
n r
ate
(m
m/y
ea
r)
Immersion test method for developed coating
Immersion test method for un coated coupon
Analytical method for uncoated coupon
C
o
0.04
0.06
0.08
0.1
0.12
0.14
0.16
0.18
0.2
35 40 45 50 55 60 65
Temperature ( )
Co
rro
sio
n r
ate
(m
m/y
ea
r)
Immersion test method for developed coating
Immersion test method for uncoated coupon
Analytical method uncoated coupon
C
o
A B
C D
0.04
0.06
0.08
0.1
0.12
0.14
0.16
0.18
0.2
0.22
35 40 45 50 55 60 65
Temperature ( )
Co
rro
sio
n r
ate
(m
m/y
ea
r)
Immersion test method for developed coating
Immersion test method for uncoated coupon
Analytical method for uncoated coupon
C
o
0.08
0.12
0.16
0.2
0.24
0.28
0.32
0.36
35 40 45 50 55 60 65
Temperature ( )
Co
rro
sio
n r
ate
(m
m/y
ea
r)
Immersion test of developed coating
Immersion test of uncoated coupon
Analytical method for uncoated coupon
C
o
E F

H. Jasim et al., American International Journal of Research in Science, Technology, Engineering & Mathematics, 2(1), March-May, 2013,
pp. 127-137
AIJRSTEM 13-143; © 2013, AIJRSTEM All Rights Reserved Page 135
0
0.0095
0.019
0.0285
0.038
0.0475
0.057
0.0665
0.076
0.0855
0.095
0 20 40 60 80 100 120 140 160 180
Time of immersion (day)
Co
rro
sio
n r
ate
(
mm
/ y
ea
r)
South Rumaila
Zubair Upper
Zubair Lower
Nahr Umr
North Rumaila
West Qurna
0
0.0094
0.0188
0.0282
0.0376
0.047
0.0564
0.0658
0.0752
0.0846
0.094
0 20 40 60 80 100 120 140 160 180
Time of immersion (day)
Co
rro
sio
n r
ate
( m
m/ y
ea
r)
South RumailaZubair UpperZubair LowerNahr UmrNorth RumailaWest Qurna
A B
0
0.0082
0.0164
0.0246
0.0328
0.041
0.0492
0.0574
0.0656
0.0738
0.082
0 20 40 60 80 100 120 140 160 180
Time of immersion (day)
Co
rro
sio
n r
ate
(
mm
/ y
ea
r)
South RumailaZubair UpperZubair LowerNahr UmrNorth RumailaWest Qurna
0
0.0115
0.023
0.0345
0.046
0.0575
0.069
0.0805
0.092
0.1035
0.115
0 20 40 60 80 100 120 140 160 180
Time of immersion (day)
Co
rro
sio
n r
ate
(
mm
/ y
ea
r)
South Rumaila
Zubair Upper
Zubair Lower
Nahr Umr
North Rumaila
West Qurna
C D
Fig. 4 Comparison the corrosion rate vs. time obtained from immersion test for different crude oil at
A- pH = 5 , T = 40oC B- pH = 6 , T = 40
oC C- pH = 7 , T = 50
oC D- pH = 5 , T = 50
oC
E- pH = 6 , T = 50oC F- pH = 7 and T = 50
oC for developed coating
0
0.0096
0.0192
0.0288
0.0384
0.048
0.0576
0.0672
0.0768
0.0864
0.096
0 20 40 60 80 100 120 140 160 180
Time of immersion (day)
Co
rro
sio
n r
ate
( m
m/
ye
ar)
South RumailaZubair Upper
Zubair LowerNahr Umr
North RumailaWest Qurna
0
0.0087
0.0174
0.0261
0.0348
0.0435
0.0522
0.0609
0.0696
0.0783
0.087
0 20 40 60 80 100 120 140 160 180
Time of immersion (day)
Co
rro
sio
n r
ate
(
mm
/ y
ea
r)
South Rumaila
Zubair Upper
Zubair Lower
Nahr Umr
North Rumaila
West Qurna
E F

H. Jasim et al., American International Journal of Research in Science, Technology, Engineering & Mathematics, 2(1), March-May, 2013,
pp. 127-137
AIJRSTEM 13-143; © 2013, AIJRSTEM All Rights Reserved Page 136
Fig.6 Surface morphologies for develop coat a) before immersion test
b) after immersion test in lower Zubair crude oil at pH = 5 and T = 50oC.
a) Before immersion test b) After immersion test
10 X 10 X
0
0.0132
0.0264
0.0396
0.0528
0.066
0.0792
0.0924
0.1056
0.1188
0.132
0 20 40 60 80 100 120 140 160 180
Time of immersion (day)
Co
rro
sio
n r
ate
(
mm
/ y
ea
r)
South Rumaila
Zubair Upper
Zubair Lower
Nahr Umr
North Rumaila
West Qurna
0
0.015
0.03
0.045
0.06
0.075
0.09
0.105
0.12
0 20 40 60 80 100 120 140 160 180
Time of immersion (day)
Co
rro
sio
n r
ate
( m
m/ y
ea
r)
South Rumaila
Zubair Upper
Zubair Lower
Nahr Umr
North Rumaila
West Qurna
0
0.011
0.022
0.033
0.044
0.055
0.066
0.077
0.088
0.099
0.11
0 20 40 60 80 100 120 140 160 180
Time of immersion (day)
Co
rro
sio
n r
ate
(
mm
/ y
ea
r)
South RumailaZubair UpperZubair LowerNahr UmrNorth RumailaWest Qurna
Fig. 5 Comparison the corrosion rate vs. time obtained from immersion test for different crude oil at
A- pH = 5 , T = 60oC B- pH = 6 , T = 60
oC C- pH = 5 , T = 60
oC for developed coating
A B
C

H. Jasim et al., American International Journal of Research in Science, Technology, Engineering & Mathematics, 2(1), March-May, 2013,
pp. 127-137
AIJRSTEM 13-143; © 2013, AIJRSTEM All Rights Reserved Page 137
A
0
0.05
0.1
0.15
0.2
0.25
0 20 40 60 80 100 120 140 160 180 200
Time ( days)
Co
rro
sio
n R
ate
(m
m/y
ear)
Develop coats
Jotun coats
Hampel coats
B
0
0.05
0.1
0.15
0.2
0.25
0 20 40 60 80 100 120 140 160 180 200
Time (days)
Co
rro
sio
n r
ate
(m
m/y
ear)
Dvelop coats
Jotun coats
Hampel coats
C
0
0.05
0.1
0.15
0.2
0.25
0.3
0 50 100 150 200
Time (days)
Co
rro
sio
n R
ate
(m
m/y
ear)
Develop coats
Jotun coats
Hampel coats
D
0
0.05
0.1
0.15
0.2
0.25
0.3
0 20 40 60 80 100 120 140 160 180 200
Time (days)
Co
rro
sio
n R
ate
(m
m/y
ear)
Develop coats
Jotun coats
Hampel coats
E
0
0.05
0.1
0.15
0.2
0.25
0.3
0.35
0 50 100 150 200
Time (days)
Co
rro
sio
n R
ate
(m
m/y
ear0
Develop coats
Jotun coats
Hampel coats
Fig.7 Comparison between coating developed with Jotun and Hampel coatings after test at pH = 5 and T= 50oC
in A- lowe Zubair B- upper Zubair C- Nahr Umr D-south Rumaila E- north Rumail F-west Qurna
F
0
0.02
0.04
0.06
0.08
0.1
0.12
0.14
0.16
0.18
0.2
0 20 40 60 80 100 120 140 160 180 200
Time (days)
Co
rro
sio
n R
ate
(m
m/y
ear)
Develiop coats
Jotun coats
Hampel coats