Embed Size (px)
Citation preview

This item was submitted to Loughborough's Research Repository by the author. Items in Figshare are protected by copyright, with all rights reserved, unless otherwise indicated.
Development of a multi-step synthesis and workup sequence for anDevelopment of a multi-step synthesis and workup sequence for anintegrated, continuous manufacturing process of a pharmaceuticalintegrated, continuous manufacturing process of a pharmaceutical
PLEASE CITE THE PUBLISHED VERSION
http://dx.doi.org/10.1021/op400294z
PUBLISHER
© American Chemical Society
VERSION
AM (Accepted Manuscript)
PUBLISHER STATEMENT
This work is made available according to the conditions of the Creative Commons Attribution-NonCommercial-NoDerivatives 4.0 International (CC BY-NC-ND 4.0) licence. Full details of this licence are available at:https://creativecommons.org/licenses/by-nc-nd/4.0/
LICENCE
CC BY-NC-ND 4.0
REPOSITORY RECORD
Heider, Patrick L., S.C. Born, S. Basak, Brahim Benyahia, Richard Lakerveld, Haitao Zhang, R. Hogan, et al..2014. “Development of a Multi-step Synthesis and Workup Sequence for an Integrated, ContinuousManufacturing Process of a Pharmaceutical”. Loughborough University. https://hdl.handle.net/2134/17593.

Subscriber access provided by LOUGHBOROUGH | UNIVERSITY LIBRARY
Organic Process Research & Development is published by the American ChemicalSociety. 1155 Sixteenth Street N.W., Washington, DC 20036Published by American Chemical Society. Copyright © American Chemical Society.However, no copyright claim is made to original U.S. Government works, or worksproduced by employees of any Commonwealth realm Crown government in the courseof their duties.
Full Paper
The application of an automated control strategy foran integrated continuous pharmaceutical pilot plant
Richard Lakerveld, Brahim Benyahia, Patrick Louis Heider, Haitao Zhang, Aaron Wolfe, Chris Testa, SeanOgden, Devin R. Hersey, Salvatore Mascia, James Evans, Richard Dean Braatz, and Paul Inigo Barton
Org. Process Res. Dev., Just Accepted Manuscript • DOI: 10.1021/op500104d • Publication Date (Web): 01 Aug 2014
Downloaded from http://pubs.acs.org on August 5, 2014
Just Accepted
“Just Accepted” manuscripts have been peer-reviewed and accepted for publication. They are postedonline prior to technical editing, formatting for publication and author proofing. The American ChemicalSociety provides “Just Accepted” as a free service to the research community to expedite thedissemination of scientific material as soon as possible after acceptance. “Just Accepted” manuscriptsappear in full in PDF format accompanied by an HTML abstract. “Just Accepted” manuscripts have beenfully peer reviewed, but should not be considered the official version of record. They are accessible to allreaders and citable by the Digital Object Identifier (DOI®). “Just Accepted” is an optional service offeredto authors. Therefore, the “Just Accepted” Web site may not include all articles that will be publishedin the journal. After a manuscript is technically edited and formatted, it will be removed from the “JustAccepted” Web site and published as an ASAP article. Note that technical editing may introduce minorchanges to the manuscript text and/or graphics which could affect content, and all legal disclaimersand ethical guidelines that apply to the journal pertain. ACS cannot be held responsible for errorsor consequences arising from the use of information contained in these “Just Accepted” manuscripts.

1
The application of an automated control strategy for
an integrated continuous pharmaceutical pilot plant
Richard Lakerveld,*,† Brahim Benyahia,
‡ Patrick L. Heider, Haitao Zhang, Aaron Wolfe, Chris
Testa, Sean Ogden, Devin R. Hersey, Salvatore Mascia, James M.B. Evans, Richard D. Braatz,
and Paul I. Barton
Department of Chemical Engineering, Massachusetts Institute of Technology, Cambridge,
Massachusetts, USA
ABSTRACT
Continuous manufacturing offers potential opportunities for the improved manufacturing of
pharmaceutical products. A key challenge is the development of an appropriate control strategy.
The experimental application of an automated control strategy is presented for an end-to-end
continuous pharmaceutical pilot plant. The process starts from an advanced intermediate
compound and finishes with the tablet formation steps. The focus of the experimental results is
on the design and performance of the control loops needed to produce a slurry of an active
pharmaceutical ingredient and a solvent with specified material properties. The results
demonstrate that automated control can successfully keep critical material attributes close to
desired set points for a sustained period of operation. This work aims to contribute to the
Page 1 of 44
ACS Paragon Plus Environment
Organic Process Research & Development
123456789101112131415161718192021222324252627282930313233343536373839404142434445464748495051525354555657585960

2
development of future continuous pharmaceutical processes by providing a realistic case study of
automated control of an integrated continuous pharmaceutical pilot plant.
INTRODUCTION
The pharmaceutical industry is challenged by the need for more reliable, cost-effective, and
sustainable manufacturing processes. Continuous manufacturing has the potential to provide
substantial improvements to pharmaceutical manufacturing compared to traditional batch-wise
manufacturing.1 To facilitate such a transition, research efforts are directed towards
understanding and exploiting the potential benefits of operating pharmaceutical unit operations
in continuous flow mode such as chemical synthesis in flow,2 crystallization,3-5 drying,6
blending,7 and roller compaction.8,9 In addition, system-wide benefits may exist by designing
recycle systems to improve the overall yield of the process. Furthermore, process control based
on real-time understanding of the dynamic development of final product quality can be
harnessed, which in principle allows for corrective action to be taken within the process before
large quantities of product go off-spec. As a result, continuous manufacturing may for certain
applications reduce batch-to-batch variations, rejection of product, ecological footprint, time-to-
market due to easier scale-up, and costs. A recent survey revealed a significant interest in
continuous manufacturing from pharmaceutical companies.10 However, in order for the
pharmaceutical industry to embrace fully continuous manufacturing, numerous challenges have
to be met. One of these challenges is the design of an integrated plant-wide control strategy.
In order to avoid laborious post-batch testing of product quality, pharmaceutical process
development typically defines a so-called design space, which is the multi-dimensional space of
input variables and process parameters for which the final product has been demonstrated to
Page 2 of 44
ACS Paragon Plus Environment
Organic Process Research & Development
123456789101112131415161718192021222324252627282930313233343536373839404142434445464748495051525354555657585960

3
meet product quality requirements.11 The control strategy then focuses on monitoring and
possibly controlling the critical process parameters (CPPs) within the design space. Although a
design space provides flexibility in the sense that changes to the process within the design space
can be implemented directly,12 distinct challenges exist, which include scale-up and the effort
needed to identify the complete design space a priori without neglecting attractive regions of
operation.13 The challenge of revealing a sufficiently large design space a priori is likely to be
more profound for continuous manufacturing as essentially a high-dimensional parameter space
is created by linking all process units into a single manufacturing system. On the other hand, if
the critical material attributes (CMAs) of streams within the process can be measured online,
active feedback control can be employed by using the CPPs as manipulated variables in
automated control loops. A strategy of actively controlling CMAs is a more intuitive approach,
which is expected to facilitate easier scale-up and would shift the focus of pharmaceutical
process development from the documentation of a design space towards development of an
active control system.13 However, in order to apply an approach based on active control of the
CMAs, the availability of online process analytical technology (PAT) tools is of crucial
importance. In addition, suitable pairings of CMAs with CPPs need to be identified to construct
automated control loops. From that perspective, the use of process modeling and process systems
engineering tools are of interest to, for example, compute sensitivities of CMAs with respect to
CPPs, which can provide a basis for development of a plant-wide control strategy.9,14,15 A key
question that remains is how such a control strategy would perform on a pilot-plant scale for an
integrated continuous pharmaceutical process starting from an advanced chemical intermediate
to a final tablet in a fully continuous fashion for a realistic pharmaceutical product.
Page 3 of 44
ACS Paragon Plus Environment
Organic Process Research & Development
123456789101112131415161718192021222324252627282930313233343536373839404142434445464748495051525354555657585960

4
The objective of the current work is to investigate the experimental application of an
automated control strategy for an integrated continuous pharmaceutical plant. In prior work, we
studied a plant-wide dynamic model of a process, which was inspired by an end-to-end
continuous pharmaceutical pilot plant.16 Subsequently, the model was used to synthesize a plant-
wide control structure for the modeled process.15 Finally, key elements of the synthesized control
structure have been translated to an integrated end-to-end continuous pharmaceutical pilot plant.
In this paper, we present the experimental performance of this control system at the pilot-plant
scale. Although key elements of the control structure that resulted from the model-based design
studies have been implemented in the pilot plant, the implemented control structure is not
identical to the control structure that was obtained from the model-based studies.15 For example,
features such as recycles that were included in the model-based studies were not implemented in
the pilot plant, which simplifies the experimental plant-wide control compared to model-based
studies. In general, plant-wide control is a well-studied topic in process control. The main
contribution of the current work is the experimental application of known design concepts for
plant-wide control to an end-to-end continuous pharmaceutical process.
This paper is part of a series that reports our experimental findings concerning the continuous
pharmaceutical pilot plant that has been constructed within the Novartis-MIT Center for
Continuous Manufacturing at MIT. The pilot plant produces a pharmaceutical product from start
(advanced intermediate) to finish (molded tablets in final dosage form) in a continuous fashion.
The produced tablets passed several tests of product quality.17 This paper presents in detail the
design and performance of the control system that was used to produce these tablets. The focus
of the experimental results is on the performance of the series of control loops that are needed to
produce a slurry of an active pharmaceutical ingredient and a solvent with specified material
Page 4 of 44
ACS Paragon Plus Environment
Organic Process Research & Development
123456789101112131415161718192021222324252627282930313233343536373839404142434445464748495051525354555657585960

5
properties. A detailed discussion about the design of the pilot plant itself and product quality
tests is presented elsewhere.17 Furthermore, detailed discussions about the design and operation
of the chemical synthesis including workup steps and of the continuous crystallization of the API
are the subjects of separate papers.18,19 Finally, a short account of our work has been published in
conference proceedings.20 The focus of the current paper is on the interactions between various
control loops and the ability of the control system to maintain key intermediate CMAs close to a
desired value in the presence of disturbances both on short and long time scales.
APPROACH
Process and experimental description
The continuous pharmaceutical pilot plant produces tablets with a final dosage of aliskiren
hemifumarate as active pharmaceutical ingredient (API). The design of the pilot plant is
presented in detail elsewhere17 and summarized in this section for completeness. The key
chemical reactions are given in Scheme 1 and a flowsheet of the plant is given in Figure 1. The
process starts by contacting 1 with an excess of 2 in a tubular reactor (R1) with a volume of 2.7
L and in the presence of catalyst 3 at elevated temperature to produce the first intermediate 4.
The conversion of the reaction is equilibrium limited.21 The reagent 2 and catalyst 3 are
dissolved in water and unreacted 1 and 4 are dissolved in ethyl acetate in a mixer (M2). The
aqueous phase and organic phase are separated by a membrane device (S1).22 The intermediate
compound 4 is crystallized in two sequential mixed suspension mixed product removal
(MSMPR) crystallizers (Cr1,Cr2) for which two 15 L glass vessels with overhead stirrer
(Heidolph, RZR 2052) are used. Supersaturation is generated by reducing the temperature and by
the addition of an anti-solvent (heptane).5 The crystals are separated from the mother liquor by
Page 5 of 44
ACS Paragon Plus Environment
Organic Process Research & Development
123456789101112131415161718192021222324252627282930313233343536373839404142434445464748495051525354555657585960
6
an in-house-made continuous filtration stage (W1). The slurry is distributed on a perforated plate
by a weir to create a cake with uniform thickness and ethyl acetate is sprayed on top of the slurry
to reduce the amount of mother liquor that adheres to the crystal surface. In addition, ethanol is
used to remove traces of water from the slurry to prevent accumulation of water downstream.
The filter cake is collected from the plate by a scraper and transported via an auger into a 5 L
well-mixed glass vessel (D1) with an overhead stirrer (Heidolph, RZR 2052) to which ethyl
acetate is added to reduce the concentration of 4.
A T-mixer is used to contact the slurry with 4 with aqueous hydrochloric acid to synthesize 5.
The reaction is brought to completion in several minutes in a tubular reactor (R2) at room
temperature. The acid is neutralized by adding aqueous sodium hydroxide in an in-line static
mixer. The organic phase with 5 is, subsequently, separated from the aqueous phase inside a 5 L
glass settler (S3) and diluted with ethyl acetate in a T-mixer downstream of the settler. A number
of microfiltration membranes (0.45 µm Pellicon XL 50, Millipore) are installed to retain any
solid sodium chloride that may have precipitated (S4). The solubility of the API is known to be
water sensitive, so adsorption with 3Å molecular sieves packed in two 35 L dehydration columns
(S5) is used to remove traces of water prior to crystallization. At the end of the column, a 1 L
glass buffer vessel (B1) is used before the mixture with 5 is mixed with fumaric acid in a 2-stage
reactive crystallization (Cr3,Cr4) to crystallize 6 (API).4,19 The crystallizers are 15 L glass
MSMPR crystallizers with an overhead stirrer (Heidolph, RZR 2052). The crystals of API are
separated from the mother liquor in a similar continuous washing and filtration stage (W2) as
used upstream to filter crystals of 4 before being diluted in a 5 L well-mixed buffer tank (D2)
with overhead stirrer (Heidolph, RZR 2052). The slurry with API is mixed with a slurry of
silicon dioxide to improve flowability of the dried powder before being fed to a two-stage in-
Page 6 of 44
ACS Paragon Plus Environment
Organic Process Research & Development
123456789101112131415161718192021222324252627282930313233343536373839404142434445464748495051525354555657585960

7
house-made continuous dryer, which consists of a drum dryer (S6) followed by a tubular dryer
with a rotating screw to convey the powder (S7). Finally, the API powder is mixed with 6000
molecular weight polyethylene glycol in an extruder (Leistritz, Nano16) equipped with two
gravimetric feeders (Schenk, Purefeed DP4). The final tablets are shaped by a custom-made
mold (Mold Hotrunner Solutions) installed at the exit of the extruder (E1).
Scheme 1. Main chemical reactions occurring within the pharmaceutical process leading to the
active pharmaceutical ingredient 6 (adapted from Heider et al.18). Compound 7 is a key impurity.
Page 7 of 44
ACS Paragon Plus Environment
Organic Process Research & Development
123456789101112131415161718192021222324252627282930313233343536373839404142434445464748495051525354555657585960
8
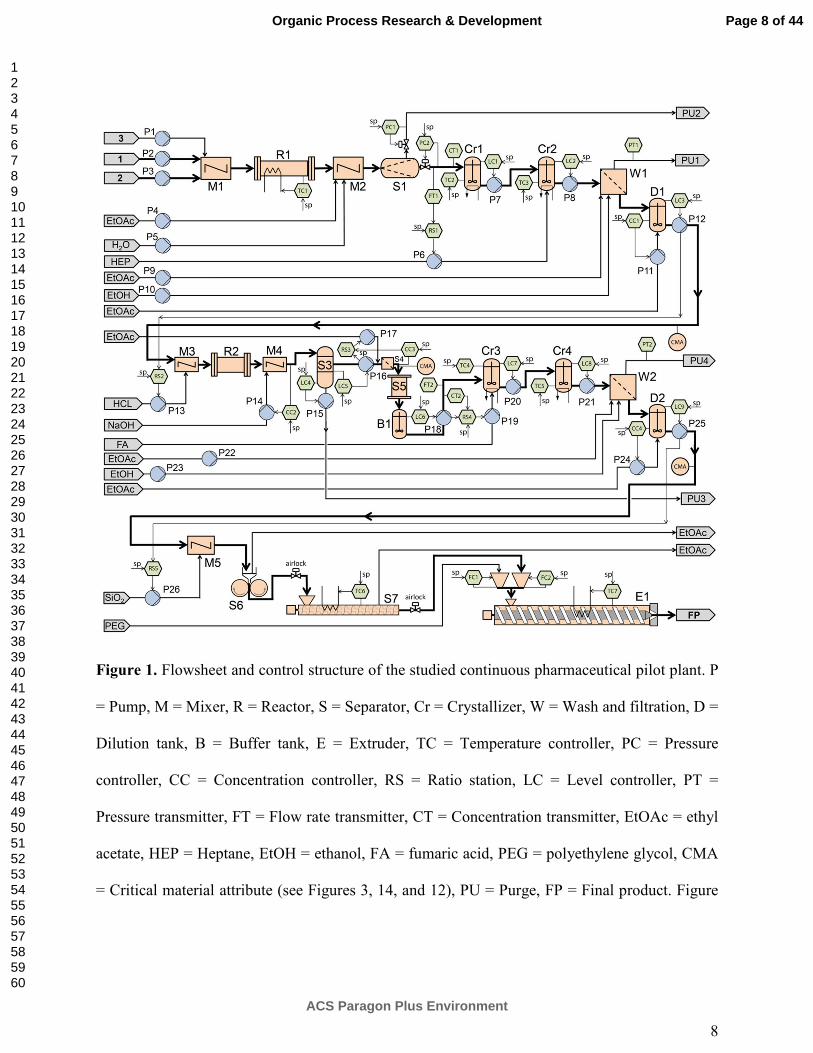
Figure 1. Flowsheet and control structure of the studied continuous pharmaceutical pilot plant. P
= Pump, M = Mixer, R = Reactor, S = Separator, Cr = Crystallizer, W = Wash and filtration, D =
Dilution tank, B = Buffer tank, E = Extruder, TC = Temperature controller, PC = Pressure
controller, CC = Concentration controller, RS = Ratio station, LC = Level controller, PT =
Pressure transmitter, FT = Flow rate transmitter, CT = Concentration transmitter, EtOAc = ethyl
acetate, HEP = Heptane, EtOH = ethanol, FA = fumaric acid, PEG = polyethylene glycol, CMA
= Critical material attribute (see Figures 3, 14, and 12), PU = Purge, FP = Final product. Figure
Page 8 of 44
ACS Paragon Plus Environment
Organic Process Research & Development
123456789101112131415161718192021222324252627282930313233343536373839404142434445464748495051525354555657585960

9
adapted from Mascia et al.17 Copyright ©2013 WILEY-VCH Verlag GmbH & Co. KGaA,
Weinheim. Printed with permission.
Control strategy and equipment
A schematic representation of the control structure that was implemented in the pilot plant is
illustrated in Figure 1. Calibrated volumetric pumps were used to measure and manipulate flow
rates. A model-based analysis of a system inspired by the pilot plant15 is the foundation for the
design of the control structure. In general, the control structure consists of a stabilizing and an
optimizing control layer. The stabilizing control loops are designed first and consist of all level
control loops. Subsequently, optimizing control loops are designed that aim to maintain
intermediate CMAs close to desired values. The design of the optimizing control layer is
challenging due to: (1) a large number of material attributes that can be controlled, (2) various
options to install measurement devices, (3) a large number of variables that can potentially be
used as manipulated variables in automated control loops and (4) relevant time scales that span
several orders of magnitude within the integrated continuous pharmaceutical process.
Fortunately, these challenges to design plant-wide control structures are not unique to
pharmaceutical processes and have received considerable attention in the literature for several
decades.23 A hierarchical approach was utilized to develop a plant-wide control strategy based on
model-based simulations.15 The hierarchical approach facilitates decision making and naturally
disentangles various time scales, which aims to reduce conflicts between short and long-term
control objectives. Several key control loops identified by the model-based studies have been
translated to the pilot plant. In order to satisfy long-term product and process requirements, the
composition of purified slurry with 4 and API (tanks D1 and D2, respectively) and the
corresponding flow rates are identified as key intermediate CMAs and key process requirements,
Page 9 of 44
ACS Paragon Plus Environment
Organic Process Research & Development
123456789101112131415161718192021222324252627282930313233343536373839404142434445464748495051525354555657585960
10
respectively, which aim to ensure the manufacture of a final product with (1) content of impurity
7 below 0.2%, (2) a nominal mass fraction of API of 0.341, (3) solvent content below 5000 ppm
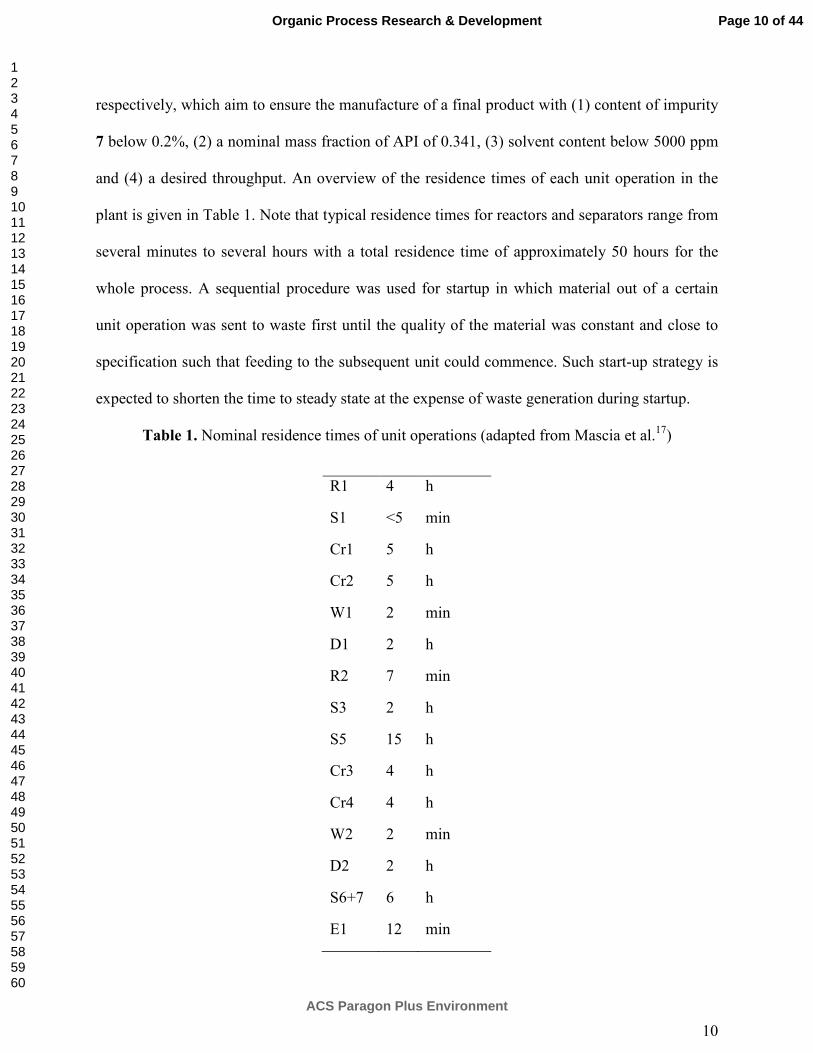
and (4) a desired throughput. An overview of the residence times of each unit operation in the
plant is given in Table 1. Note that typical residence times for reactors and separators range from
several minutes to several hours with a total residence time of approximately 50 hours for the
whole process. A sequential procedure was used for startup in which material out of a certain
unit operation was sent to waste first until the quality of the material was constant and close to
specification such that feeding to the subsequent unit could commence. Such start-up strategy is
expected to shorten the time to steady state at the expense of waste generation during startup.
Table 1. Nominal residence times of unit operations (adapted from Mascia et al.17)
R1 4 h
S1 <5 min
Cr1 5 h
Cr2 5 h
W1 2 min
D1 2 h
R2 7 min
S3 2 h
S5 15 h
Cr3 4 h
Cr4 4 h
W2 2 min
D2 2 h
S6+7 6 h
E1 12 min
Page 10 of 44
ACS Paragon Plus Environment
Organic Process Research & Development
123456789101112131415161718192021222324252627282930313233343536373839404142434445464748495051525354555657585960

11
The feed flow rate of 1 is set to a fixed value. Variations in feed flow rate are unmeasured
disturbances, which have to be compensated for by the sequence of automated level controllers.
The temperature of the first reactor (R1) is maintained constant at elevated temperature in a
temperature-controlled oven (130 °C). The pressure of the organic and aqueous flow rate out of
the membrane contactor are each controlled by a pressure control valve (Proportion-Air
QPV/MPV). The flow rate of organic material leaving the phase separator (S1) is measured by
an in-line flow meter (Omega FPR1501), which is used in a feedforward control loop to dose the
desired amount of anti-solvent to the subsequent continuous crystallizers. The crystallizers are
equipped with feedback temperature control (Thermo Scientific NESLAB RTE Series
Refrigerated Bath and Lauda, Proline RP 845 respectively, equipped with a thermocouple and an
external Pt-100 resistance thermometer, respectively) and feedback level control (calibrated
Omega LVCN414 level sensor). The temperature feedback controllers that use a refrigerated
bath are operated locally (actuator not shown in Figure 1). The level controllers aim to maintain
stable operation and to minimize variations in flow rate propagating downstream. Therefore, the
level controllers of the crystallizers are not tightly controlling the level. Furthermore, the level
controllers use proportional control only since a steady-state offset can be tolerated. The tuning
of the controller gain provides a maximum outlet pump flow rate when the level in the
crystallizer reaches an upper limit, which aims to achieve both stable operation and sufficient
flow filtering to reduce variations in flow rate.24
The impurities that are propagated to buffer tank D1 have a long-term impact on the overall
performance of the process. When the crystals are sufficiently pure, the flow rate of ethyl acetate
used for washing (P9) could in principle be used as an actuator in an automated control loop to
maintain the level of impurities at a desired set point by removing mother liquor adhering to the
Page 11 of 44
ACS Paragon Plus Environment
Organic Process Research & Development
123456789101112131415161718192021222324252627282930313233343536373839404142434445464748495051525354555657585960

12
crystalline surface. However, no suitable in-line PAT tool to measure small quantities of key
impurities could be identified after an extensive search for our case. Therefore, the flow rate of
ethyl acetate was set at a high value to satisfy the required levels of impurities even in the
presence of significant disturbances, at the expense of increased solvent usage and reduced yield.
Both the outlet flow rate of tank D1 and the concentration of 4 in tank D1 are key intermediate
CMAs that have a significant impact on long-term performance of the process. The outlet flow
rate of tank D1 is connected to a calibrated level sensor (Omega LVCN414) within a feedback
level control loop providing long-term stability and a desired residence time for buffering. Sharp
changes in flow rate exiting tank D1 would translate into a strongly varying residence time of the
subsequent reaction, which would pose the risk of excessive production of one of the main
impurities, eventually causing the final product to go off-spec. Tank D1 acts as a buffer vessel to
provide back mixing such that short-term high concentrations of undesired compounds do not
propagate. To control the concentration of 4 in the slurry, an on-line density transmitter (Anton
Paar DPRn 417) is used to manipulate a solvent flow rate (P11) via feedback control (CC1).
The flow rate of aqueous hydrochloric acid (P13) is ratio controlled with the outlet flow rate of
the buffer tank D1 (RS2). Note that the upstream density measurement could be used to adjust
the set point of RS2 in case tighter control is required. A feedback control loop (CC2) with an in-
line pH probe (Hamilton Polilyte Plus electrode with Omega DP24-PH panel meter) is used to
maintain the pH close to a desired set point by using the flow rate of aqueous sodium hydroxide
as manipulated variable. A float-type calibrated level sensor (Omega LVR51) is used to measure
the position of the liquid-liquid interface in the subsequent settler with an additional calibrated
level sensor (Omega LVCN414) mounted in the top of the vessel to measure the total level of the
Page 12 of 44
ACS Paragon Plus Environment
Organic Process Research & Development
123456789101112131415161718192021222324252627282930313233343536373839404142434445464748495051525354555657585960

13
vessel. Each level sensor is connected to a pump within a level control loop to maintain the
holdup of both phases each close to a desired set point.
The concentration of 5 at the inlet of the adsorption column is a local CMA that influences the
operation of the crystallization steps downstream. The concentration of 5 in the mixture has to be
reduced, which is accomplished by a feedforward flow-rate controller (RS3) to dilute the mixture
containing 5 in a fixed ratio using a solvent flow rate (P17) as manipulated variable.
Furthermore, an additional outer feedback control loop (CC3) with an in-line ultraviolet (UV)
sensor (HR2000+, Ocean Optics) is used in a cascade configuration to adjust the ratio of the flow
rates delivered by pumps P16 and P17, which drives the system close to a desired concentration.
The dehydration column (S5) contains a conservative amount of molecular sieves, which aims to
reject any short-term and long-term disturbances in water content at the inlet of the column by
design. The molecular sieves closest to the exit of the column did not saturate during the run,
which could be verified via the color of the molecular sieves. The buffer tank at the outlet of the
dehydration column is equipped with loosely tuned feedback level control (LC6). The dosage of
fumaric acid to synthesize 6 (API) in the subsequent reactive crystallization step (Cr3) is a local
CMA related to obtaining the desired product identity and a sufficient yield as the solubility of
the API is known to be sensitive to the molar ratio of 5 to fumaric acid in the crystallizers.
Therefore, feedforward control (RS4) has been implemented to adjust dosage for disturbances in
flow rate and concentration of 5 via an in-line UV sensor (HR2000+, Ocean Optics). The flow
rate out of buffer tank B1 is used to set the flow rate of fumaric acid according to a ratio that is
optimal for crystallization. The concentration measurement is used to determine the value of this
optimal ratio of flow rates.19 The remaining control loops used for operation of the API
crystallizers, combined washing and filtration stage (W12), and buffer tank (D2) are identical to
Page 13 of 44
ACS Paragon Plus Environment
Organic Process Research & Development
123456789101112131415161718192021222324252627282930313233343536373839404142434445464748495051525354555657585960

14
the crystallizers, washing and filtration device, and buffer tank used for separation of 4 upstream
(Cr1, Cr2, W1, D1, respectively).
A flow of a slurry with silicon dioxide (P26) is ratio controlled (RS5) with the outlet flow rate
of tank D2 (P25). The first dryer (S6) uses two convection-heated drums for temperature control.
The second dryer (S7) uses temperature feedback control with an electrical heating element as
actuator (TC6). Furthermore, a number of control valves are installed at the inlet and outlet of the
tubular dryer (S7), which open and close in an automated sequence to create an airlock. The
screws of the tubular dryer operate at a fixed frequency. The system of automatically operated
control valves and feedback temperature controllers allow for continuous uptake of API slurry at
the inlet of the dryer and continuous delivery of dried powder at the outlet of the dryer with
minimal disturbances to the desired temperatures and pressure for drying. A vacuum conveyor
delivers API powder to a gravimetric feeder. The dried powder of API is mixed with
polyethylene glycol with two gravimetric feeders, which are operated at a constant feed flow
rate. Manual adjustments can be made to regulate the throughput. The mixture of API and
excipients are fed into an extruder operated at high temperature to produce a melt of the final
dosage. The extruder is equipped with a number of automated temperature controllers to
maintain constant temperature in a number of zones.
The nominal set points and tuning parameters of the feedback control loops are given in Table
2 and the nominal set points for the ratio control loops are given in Table 3. All control loops are
implemented in a single process control system (Siemens SIMATIC PCS7) equipped with data
archiving with the exception of the control loops around the gravimetric feeders and extruder,
which are implemented locally.
Page 14 of 44
ACS Paragon Plus Environment
Organic Process Research & Development
123456789101112131415161718192021222324252627282930313233343536373839404142434445464748495051525354555657585960

15
Table 2. Nominal values for set points and proportional-integral (P(I)) tuning parameters of
feedback control loops. The tuning parameters of concentration control loop CC4 were changed
during operation according to the given time intervals.
Set point Gain Integral time
Controller value unit value unit value unit comments
LC1 1.05×10⁻² m3 8.3×10⁻⁴ s-1 - -
LC2 1.15×10⁻² m3 8.3×10⁻⁴ s-1 - -
LC3 3.00×10⁻³ m3 1.7×10⁻³ s-1 - -
LC4 1.20×10⁻³ m3 1.7×10⁻² s-1 - -
LC5 2.65×10⁻³ m3 1.7×10⁻³ s-1 - -
LC6 4.00×10⁻⁴ m3 3.3×10⁻³ s-1 - -
LC7 8.00×10⁻³ m3 8.3×10⁻⁴ s-1 - -
LC8 8.00×10⁻³ m3 8.3×10⁻⁴ s-1 - -
LC9 2.50×10⁻³ m3 8.3×10⁻⁴ s-1 - -
CC1 2.62×101 wt% 4 2.5×10⁻⁵ m3s-1 - -
CC2 1.20×101 - 7.5×10⁻⁹ m3s-1 50 s pH
CC3 7.00×100 wt% 5 5.1×101 - 60 s ratio of RS3
CC4 8.00×100 wt% 6 1.7×10⁻⁴ m3s-1 - - 147.5t < h
1.10×101 wt% 6 1.7×10⁻⁴ m3s-1 - - 147.5h 169t< < h
1.30×101 wt% 6 1.7×10⁻⁴ m3s-1 - - 169t > h
Page 15 of 44
ACS Paragon Plus Environment
Organic Process Research & Development
123456789101112131415161718192021222324252627282930313233343536373839404142434445464748495051525354555657585960

16
Table 3. Nominal set points for ratio control loops
RS1: FT1 ⁄ P6 = 1.89
RS2: P12 ⁄ P13 = 1.75
RS3: P17 ⁄ P16 set by CC3
RS4: Fmol,FA ⁄ Fmol,5 = 0.5
RS5: P25 ⁄ P26 =10.0
RESULTS AND DISCUSSION
This section gives illustrative examples of the performance of the control strategy for the
continuous pharmaceutical pilot plant. The integrated pilot plant was run several times. The data
presented in this section correspond to a single run of approximately 250 h of sustained operation
including start-up and shut-down with a nominal throughput of 41 g h-1 of API unless noted
otherwise. Results from both long- and short-term performance are presented. Short-term results
cover typically a couple of hours, whereas long-term results cover at least a number of days. The
experimental run produced data with a typical archiving frequency of 10 sec for each sensor and
actuator. To accommodate such a large set of data, characteristic examples are presented by
selecting time intervals during the run in which significant disturbances were acting on the
system to demonstrate the performance of the critical control loops under challenging conditions.
Furthermore, the presented data has been filtered, with details as indicated in the caption of the
figures, to reveal only the trends on the process time scales. In general, fluctuations on shorter
time scales are also present, for example, due to measurement noise, short-term disturbances, or
manual interventions.
The design of an appropriate manufacturing process and control strategy are key parts of a
Quality-by-Design approach to pharmaceutical product and process development.11,12 Both
Page 16 of 44
ACS Paragon Plus Environment
Organic Process Research & Development
123456789101112131415161718192021222324252627282930313233343536373839404142434445464748495051525354555657585960

17
automated control loops and design decisions that are implemented to maintain CMAs of the
process within specification are discussed. First, several examples are given of the impact of
disturbances on a number of automated control loops that have a certain hierarchy in priority.
Second, the importance of buffering as a design strategy for robust manufacturing is illustrated.
Third, an example is given on how the combination of feedback and feedforward control in a
cascade configuration can maintain a key intermediate CMA close to a desired value.
Mitigating the effect of disturbances on key intermediate CMAs
To illustrate the interaction between stabilizing and optimizing control loops with different
priorities, the performance of several automated control loops in the first part of the plant, which
includes the crystallizers Cr1, Cr2, and buffer tank D1, will be discussed in this section. A
selection of the control objectives within this part of the plant can be stated in descending order
of priority as follows:
1. guarantee long-term stability,
2. maintain the concentration of 1 in buffer tank D1 below a maximum value,
3. maintain the concentration of 4 in buffer tank D1 at a specific value,
4. minimize the variation in outlet flow rate of tank D1,
5. maintain the levels in the crystallizers Cr1 and Cr2 at a desired value,
6. maintain the level in buffer tank D1 at a desired value.
The automated control loops that are implemented to meet these control objectives consists of
level control loops LC1, LC2, and LC3, and concentration control loop CC1. First consider the
long-term performance of the control loops. The level control loops are part of the stabilizing
control layer, which maintain sufficient holdup in each well-mixed vessel over a prolonged
Page 17 of 44
ACS Paragon Plus Environment
Organic Process Research & Development
123456789101112131415161718192021222324252627282930313233343536373839404142434445464748495051525354555657585960
18
period of time despite a number of significant disturbances during the run as illustrated in Figure
2. The observed variations in level seen in Figure 2 are typically caused by plugging of the
tubing around the crystallizers, which has to be resolved manually. In general, plugging of lines
and process equipment is an important practical risk for continuous pharmaceutical
manufacturing for which early warning systems are important (e.g., via in-line pressure
measurements). The concentration and flow rate of the stream leaving buffer tank D1 (P12) are
identified from prior model-based studies as key intermediate CMAs that have a long-term
impact on the performance of the plant.15 The concentration of 4 in buffer tank D1 is kept close
to a set point by an automated feedback control loop (CC1) for a prolonged period of time as
illustrated in Figure 3. The controller has a large gain, which is reflected by a small steady-state
offset and a strongly fluctuating flow rate of the solvent feed stream (manipulated variable) as
illustrated in Figure 4. This aggressive tuning aims to achieve tight control at the expense of
possibly increased wear due to intensive use of the actuator. Furthermore, it can be seen from
Figure 4 that towards the end of the run on average less solvent is required to maintain the
concentration of 4 close to the set point, which indicates slowly changing performance of
upstream units. Possible causes for this observed change in performance could, for example, be a
variation in the performance of the filter (e.g., partial plugging of the filter plate) or changing
properties of the crystal slurry from crystallizer Cr2 (e.g., in shape, size distribution, or solid
content). Nevertheless, the concentration of 4 in buffer tank D1 can be well controlled based on
the in-line density meter to the end of the experimental run, which is expected to be of crucial
importance to maintain the CMAs of the final product within specification.
Page 18 of 44
ACS Paragon Plus Environment
Organic Process Research & Development
123456789101112131415161718192021222324252627282930313233343536373839404142434445464748495051525354555657585960

19
Figure 2. Dynamic development of the measured level in the crystallizers for separation of 4
(Cr1 and Cr2) and the subsequent buffer tank (D1) during 220 h of operation (controlled
variables of control loops LC1, LC2, and LC3, respectively). Each point represents the median
value of a series of data points collected within 167 min with a sampling frequency of 0.1 Hz.
Figure 3. Dynamic development of the concentration of 4 in buffer tank D1 for 220 h of
operation (controlled variable of control loop CC1). Each data point represents the median value
of a series of data points collected within 150 min with a sampling frequency of 0.1 Hz. The
black dashed line represents the set point of the concentration control loop.
Page 19 of 44
ACS Paragon Plus Environment
Organic Process Research & Development
123456789101112131415161718192021222324252627282930313233343536373839404142434445464748495051525354555657585960

20
Figure 4. Dynamic development of the flow rate of ethyl acetate fed to buffer tank D1 (P11) for
220 h of operation (manipulated variable of control loop CC1). Each data point represents the
median value of a series of data points collected within 150 min with a sampling frequency of
0.1 Hz.
Second, we look at the ability of the automated control loops to mitigate disturbances on a
shorter time scale. To that end, a characteristic example of the impact of a significant disturbance
that is observed 3 d after startup is presented. The outlet flow rates of crystallizers Cr1 and Cr2
after 72 h of operation are illustrated in Figure 5. Note that these flow rates are manipulated
variables in the level control loops around each crystallizer. At the beginning of the time interval,
the flow rates are close to steady-state operation. Then the flow from Crystallizer Cr2 to Tank
D1 comes to a sudden stop at t = 72.5 h due to unintentional plugging of the transfer line
between both vessels. Consequently, the level in crystallizer Cr2 quickly rises as illustrated in
Figure 6b. Since maintaining the level in Crystallizer Cr2 has low priority, the loose tuning of the
feedback level control loop brings the level of the crystallizer back slowly to the set point.
Consequently, the effect of the disturbance on the level in buffer tank D1 downstream is limited
(Figure 6c). The concentration of 4 in tank D1 drops after the disturbance (Figure 7), which is
Page 20 of 44
ACS Paragon Plus Environment
Organic Process Research & Development
123456789101112131415161718192021222324252627282930313233343536373839404142434445464748495051525354555657585960

21
mitigated by a quick reduction of the solvent flow rate towards tank D1 (Figure 8). The loose
tuning of the level control loops in the crystallizers and buffer tanks and a more aggressive
tuning of the concentration control loops aim at maintaining the concentration close to a desired
set point while the disturbance in flow rate is diverted towards the level of the crystallizer. In
case sharp changes in the solvent flow rate are not desired from an operational point of view,
integral action could be added to concentration control loop CC1 to reduce the instantaneous and
step-wise response of a proportional controller.
Figure 5. Dynamic development of the outlet flow rates of crystallizers Cr1 and Cr2 (P7 and P8,
respectively) within a time interval in which a significant disturbance was observed during an
integrated run of an end-to-end continuous pharmaceutical pilot plant (manipulated variables of
control loops LC1 and LC2). Each data point represents the median value of a series of data
points collected within 2 min with a sampling frequency of 0.1 Hz.
Page 21 of 44
ACS Paragon Plus Environment
Organic Process Research & Development
123456789101112131415161718192021222324252627282930313233343536373839404142434445464748495051525354555657585960

22
Figure 6. Dynamic development of the measured level in the crystallizers for separation of 4
(Cr1 and Cr2) and subsequent buffer tank D1 within a time interval in which a significant
disturbance was observed during a run of an end-to-end continuous pharmaceutical pilot plant
(controlled variables of control loops LC1, LC2, and LC3, respectively). Each point represents
the median value of a series of data points collected within 2 min with a sampling frequency of
0.1 Hz. The black dotted lines represent the set points of the level control loops, which are
corrected for a steady-state offset by assuming that the median value of the first 10 data points
during the time interval represents the steady-state level in the tanks.
Page 22 of 44
ACS Paragon Plus Environment
Organic Process Research & Development
123456789101112131415161718192021222324252627282930313233343536373839404142434445464748495051525354555657585960

23
Figure 7. Dynamic development of the concentration of 4 in buffer tank D1 within a time
interval in which a significant disturbance was observed during a run of an end-to-end
continuous pharmaceutical pilot plant (controlled variable of control loop CC1). Each point
represents the median value of a series of data points collected within 2 min with a sampling
frequency of 0.1 Hz. The black dotted line represents the set points of the control loop (CC1),
which has been corrected for a steady-state offset by assuming that the median value of the first
10 data points during the interval represents the steady-state concentration in the tank.
Page 23 of 44
ACS Paragon Plus Environment
Organic Process Research & Development
123456789101112131415161718192021222324252627282930313233343536373839404142434445464748495051525354555657585960

24
Figure 8. Dynamic development of the flow rate of ethyl acetate fed to buffer tank D1 (P11) and
flow rate out of the buffer tank (P12) within a time interval in which a significant disturbance
was observed during a run of an end-to-end continuous pharmaceutical pilot plant (manipulated
variable of concentration control loop CC1 and manipulated variable of level control loop LC3,
respectively). Each point represents the median value of a series of data points collected within 2
min with a sampling frequency of 0.1 Hz.
Figure 9 illustrates a different case, in which a disturbance is observed for several hours that
causes the level in crystallizer Cr1 to oscillate (Figure 9a). Such disturbance may be caused by
sensor failure or by variations in the flow rates of upstream units. Since the feedback level
control loops utilize proportional control only, oscillations in the outlet flow rate of Crystallizer
Cr1 are present as well. However, the loose tuning of the level control loop results in relatively
small variations in the outlet flow rate of crystallizer Cr1. Consequently, the disturbance and the
observed oscillations are strongly reduced in Crystallizer Cr2 (Figure 9b). The dynamic finger
print of the disturbance essentially disappears after crystallizer Cr2 (Figure 9c). Instead, a
different disturbance can be observed at t = 132.5 h in buffer tank D1, which causes the
Page 24 of 44
ACS Paragon Plus Environment
Organic Process Research & Development
123456789101112131415161718192021222324252627282930313233343536373839404142434445464748495051525354555657585960

25
concentration of 4 in the tank to be higher for several hours (Figure 10). Such sudden increase in
concentration could, for example, be caused by the release of material that accumulated in the
filter device. Since maintaining this concentration has high priority, the flow rate of solvent feed
to tank D1 (the manipulated variable of the automated concentration control loop) increases
sharply (Figure 11) at the expense of an increased volume in buffer tank D1 (Figure 9c) and
outlet flow rate (Figure 11). The present disturbance results in deviations from the set points of
the level and concentration control loops around tank D1 for a longer period of time compared to
the previously discussed disturbance at t = 72.5 h (Figures 5 to 8), which indicates a larger
deviation in throughput of compound 4. Note that the number of reaction equivalents of HCl is
preserved by the automated ratio control loop RS2 (Figure 1). Therefore, the increase in outlet
flow rate of buffer tank D1 will only result in a decrease in residence time of reactor R2. The
number of reaction equivalents of HCl was chosen such that maximum robustness with respect to
changes in throughput was achieved with minimum product degradation.18 Finally, only
proportional level control was used and it is expected that more advanced control strategies could
further improve the performance of the control loops. For example, model-based studies have
demonstrated for our case that implementation of so-called optimal averaging level control25 for
buffer tank D1 can reduce significantly variations in outlet flow rate while the performance of
the concentration control loop (CC1) is still satisfactory.26 Such control strategy aims to
minimize variations in outlet flow rate of a buffer tank while maintaining the level between an
upper and lower boundary instead of at a fixed set point, which for our process would minimize
variations in the residence time of reactor R2 downstream.
Page 25 of 44
ACS Paragon Plus Environment
Organic Process Research & Development
123456789101112131415161718192021222324252627282930313233343536373839404142434445464748495051525354555657585960

26
Figure 9. Dynamic development of the measured level in the crystallizers for separation of 4
(Cr1 and Cr2) and subsequent buffer tank D1 within a time interval in which oscillations were
observed in the first crystallizer during a run of an end-to-end continuous pharmaceutical pilot
plant (controlled variables of control loops LC1, LC2, and LC3, respectively). Each point
represents the median value of a series of data points collected within 4 min with a sampling
frequency of 0.1 Hz.
Page 26 of 44
ACS Paragon Plus Environment
Organic Process Research & Development
123456789101112131415161718192021222324252627282930313233343536373839404142434445464748495051525354555657585960

27
Figure 10. Dynamic development of the concentration of 4 in buffer tank D1 within a time
interval in which oscillations were observed in the first crystallizer during a run of an end-to-end
continuous pharmaceutical pilot plant (controlled variable of control loop CC1). Each point
represents the median value of a series of data points collected within 4 min with a sampling
frequency of 0.1 Hz. The black dotted line represents the set points of the control loop (CC1),
which has been taken from Figure 7.
Page 27 of 44
ACS Paragon Plus Environment
Organic Process Research & Development
123456789101112131415161718192021222324252627282930313233343536373839404142434445464748495051525354555657585960

28
Figure 11. Dynamic development of the flow rate of ethyl acetate fed to buffer tank D1 (P11)
and flow rate out of the buffer tank (P12) within a time interval in which a significant
disturbance was observed during a run of an end-to-end continuous pharmaceutical pilot plant
(manipulated variable of concentration control loop CC1 and manipulated variable of level
control loop LC3, respectively). Each point represents the median value of a series of data points
collected within 4 min with a sampling frequency of 0.1 Hz.
Further downstream, a similar automated control strategy is used to keep the concentration of 6
(API) in the buffer tank D2 close to a set point. Figure 12 illustrates the concentration of 6 during
several days of operation including two changes in the set point of control loop CC4. The figure
shows that the control system is well capable to keep the concentration of 6 close to all of the
tested set points. Note that there is no active mechanism to increase the concentration in the
vessel as the manipulated variable dilutes the slurry. As a result, the system responds slowly
when the measured concentration is below the set point and rapidly when the concentration is too
high, which can be seen during the set point changes and the disturbance that is shown in the
inset of Figure 12. This disturbance was caused by the performance of the filter device upstream,
which caused the concentration in the buffer tank D2 to drop over several hours, which
Page 28 of 44
ACS Paragon Plus Environment
Organic Process Research & Development
123456789101112131415161718192021222324252627282930313233343536373839404142434445464748495051525354555657585960

29
eventually saturated the control loop (i.e., no solvent flow rate into buffer tank D2). The
performance of the filter degraded sharply due to a measured loss of vacuum on the permeate
side of the filter around t = 178 h. The vacuum was restored around t = 185 h, which caused the
continuous filter device to produce a thicker slurry again. Subsequently, the concentration of 6
increased and solvent was added when the set point was reached, which closed the control loop
again and kept the concentration of 6 close to the set point for the remainder of the run.
In summary, the automated control loops in the first part of the pilot plant allowed for
production of a slurry with an intermediate compound for a prolonged period of time with CMAs
close to desired set points. Close inspection of several observed disturbances during the run
demonstrates how disturbances can be diverted from critical to non-critical process parameters
(i.e., from flow rate to residence time). A similar control strategy proved to be effective further
downstream for the automated control of the concentration of API in the slurry being fed to the
continuous drying stage.
Figure 12. Dynamic development of the concentration of 6 (API) in the buffer tank D2 as
obtained from an online density measurement device during several days of operation (controlled
variable). The data points represent the median value taken within a measurement period of 30
Page 29 of 44
ACS Paragon Plus Environment
Organic Process Research & Development
123456789101112131415161718192021222324252627282930313233343536373839404142434445464748495051525354555657585960

30
min with a sampling frequency of 0.1 Hz. The dashed black line represents the set point of the
automated concentration control loop (CC4). The inset of the figure illustrates the dynamic
development of the concentration during a significant disturbance from upstream in detail
(median value taken within 6 min of data collection with a sampling frequency of 0.1 Hz). Note
that the control loop is saturated when the measured value of the concentration is below the set
point, as there is no active mechanism to increase the concentration.
Mixing to reduce process variability
The concentration of 1 in the slurry leaving buffer tank D1 is an intermediate CMA of the
process as the compound is a precursor for the main impurity (7) in the final product (Scheme
1).17 Design strategies can be employed to maintain the concentration at a low value and to
prevent strong fluctuations in concentration. First, the solvent flow rate used for washing is set at
a high value to meet specifications even in the presence of challenging conditions such as a high
slurry load. Second, instead of using a mixing device with a short residence time for dilution, a
buffer tank with a residence time of several hours is used, which provides back mixing to dilute
material originating from the filter with an overshoot in the concentration of 1. Throughout most
of the run, the fraction of 1 on the filter plate, expressed by HPLC area, shows a similar variation
compared to the fraction of 1 within the buffer tank (Figure 13a). Towards the end of the run, the
performance of the filter goes down and two events can be detected where temporarily a high
fraction of 1 is present on the filter plate. However, the back mixing in the dilution tank prevents
propagation of a small quantity of material with high impurity content into units downstream
(Figure 13a). Note that the concentration of 1 in the buffer tank steadily goes up towards the end
of the run, which is likely caused by propagation of additional mother liquor from the
Page 30 of 44
ACS Paragon Plus Environment
Organic Process Research & Development
123456789101112131415161718192021222324252627282930313233343536373839404142434445464748495051525354555657585960

31
crystallization steps as the trend coincides with a reduction in solvent addition dictated by
concentration control loop CC1 as discussed in the previous section (Figure 4).
The dynamic development of the fraction of the main impurity (7) within the slurry on the
filter plate W2 and in the dilution tank D2 downstream the process, expressed by HPLC area, is
illustrated in Figure 13b. Although less data is available for filter W2 due to the longer time
needed to approach steady state for filter W2 compared to filter W1, a similar trend as in Figure
13a can be observed. For most of the measurements, a low fraction of 7 in both the slurry on the
filter plate and in the slurry present in dilution tank D2 is measured. However, two events can be
noticed when the fraction of impurity within the slurry on the filter plate is significantly higher
compared to the slurry in the dilution tank. Such events are unlikely in the dilution tank due to
the back mixing, which provides a buffer for propagation of small amounts of material with an
excessive high concentration of impurities into the dryer. Note that knowledge on the mixing in
all units downstream is required to quantify the acceptable levels of impurity compound 7 at this
part of the process. In the period from approximately t = 135 h to t = 152 h, vacuum was lost at
the permeate side of Filter W2 (measured by PT2), which reduced the mother liquor removed
and explains the higher fraction of 7 within that period. Once vacuum was restored, filtration
performance improved and the impurity level decreased. The fraction of 7 steadily increases
towards the end of the run, which may be caused by decreasing performance of the filter or by
additional supply of 7 that results from the increasing concentration of 1 in the dilution tank D1
upstream (Figure 13a).
Page 31 of 44
ACS Paragon Plus Environment
Organic Process Research & Development
123456789101112131415161718192021222324252627282930313233343536373839404142434445464748495051525354555657585960
32
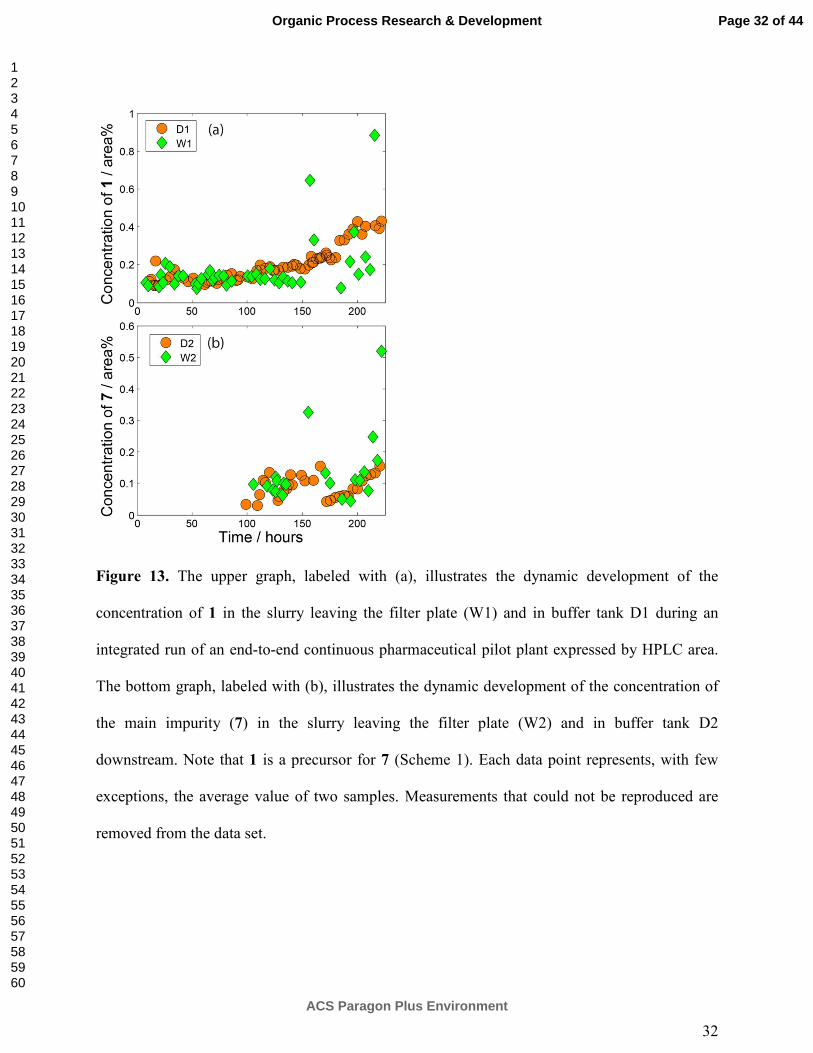
Figure 13. The upper graph, labeled with (a), illustrates the dynamic development of the
concentration of 1 in the slurry leaving the filter plate (W1) and in buffer tank D1 during an
integrated run of an end-to-end continuous pharmaceutical pilot plant expressed by HPLC area.
The bottom graph, labeled with (b), illustrates the dynamic development of the concentration of
the main impurity (7) in the slurry leaving the filter plate (W2) and in buffer tank D2
downstream. Note that 1 is a precursor for 7 (Scheme 1). Each data point represents, with few
exceptions, the average value of two samples. Measurements that could not be reproduced are
removed from the data set.
Page 32 of 44
ACS Paragon Plus Environment
Organic Process Research & Development
123456789101112131415161718192021222324252627282930313233343536373839404142434445464748495051525354555657585960

33
Combined feedforward and feedback in cascade control loops
Feedforward control has the ability to reject disturbances before a controlled variable is affected.
One of the most common forms of feedforward control is ratio control, which typically involves
specifying the flow rate for one stream as a ratio of the measured flow rate of another stream. In
contrast, feedback control relies on deviations of a controlled variable from a set point, which
has the advantage of keeping the controlled variable close to its desired set point. A
configuration that combines ratio control with feedback control is ratio cascade control,27 in
which an outer feedback control loop manipulates the ratio in an inner ratio control loop. This
section demonstrates the importance of this strategy for the integrated continuous pharmaceutical
pilot plant with an example to maintain a CMA of a process stream close to a desired set point in
the presence of fast and slow disturbances. The control loops of interest (RS3,CC3) are installed
around settler S3 and dehydration column S5 (Figure 1). A liquid with 5 dissolved in an organic
phase is separated from an aqueous phase and fed into a dehydration column after dilution. The
concentration of 5 has to be maintained close to a desired set point before entering the
dehydration column. Typical disturbances that can be expected are variations in the flow rate and
concentration of the mixture from the settler. The impact of variations in flow rate on the
concentration after dilution can be mitigated by manipulating the flow rate of the solvent feed
stream with a ratio control loop (inner feedforward loop). Furthermore, an outer feedback control
loop ensures that the concentration after dilution is close to a desired set point by manipulating
the set point of the ratio control loop, which mitigates variations in the concentration of the
mixture from the settler.
The feedback concentration control loop is complicated by a significant delay time between
the mixing point and the UV sensor, because possible salt crystals have to be removed first after
Page 33 of 44
ACS Paragon Plus Environment
Organic Process Research & Development
123456789101112131415161718192021222324252627282930313233343536373839404142434445464748495051525354555657585960
34
mixing to obtain a signal of sufficient quality from the UV sensor. An appropriate tuning of the
control parameters that takes into account this delay time is of crucial importance. Therefore,
prior to the run, two process reaction curves24 were experimentally measured by applying step
inputs of the set point of ratio controller RS3 from which the effective delay time, the process
time constant, and the steady-state gain were estimated. Subsequently, recommended tuning
parameters,28,29 which are based on the Internal Model Control design method,30,31 were used to
obtain an estimated value for the controller gain and integral time of controller CC3.
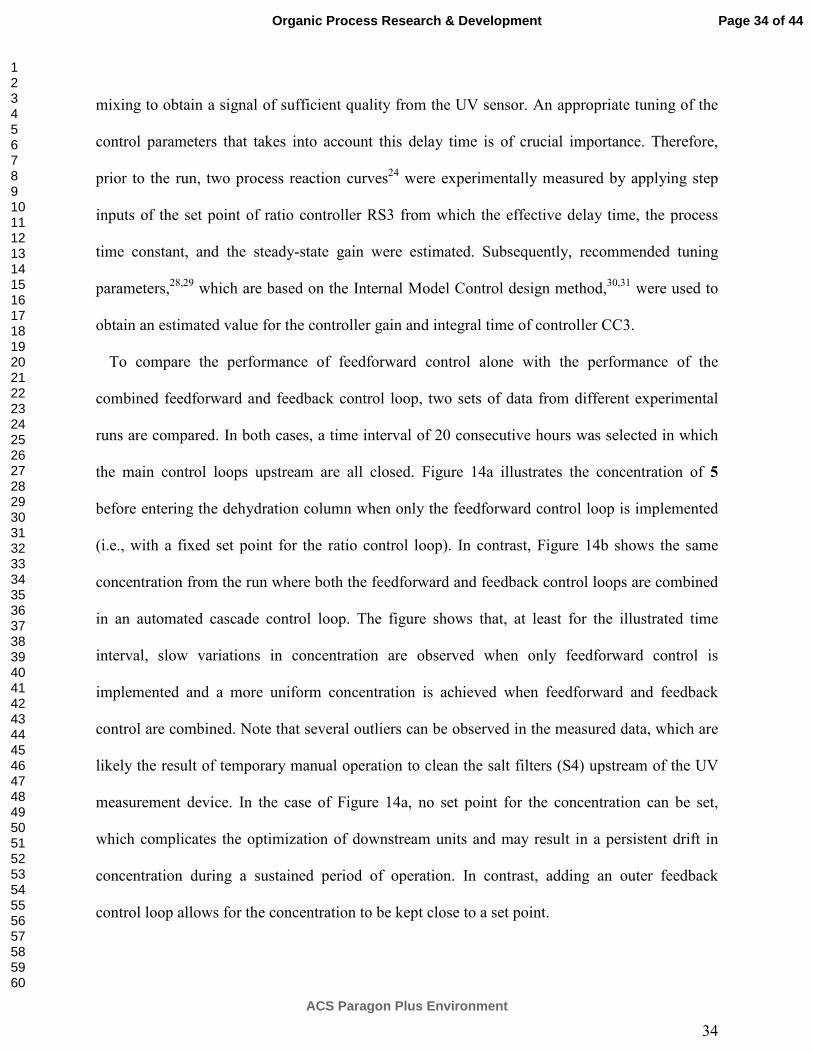
To compare the performance of feedforward control alone with the performance of the
combined feedforward and feedback control loop, two sets of data from different experimental
runs are compared. In both cases, a time interval of 20 consecutive hours was selected in which
the main control loops upstream are all closed. Figure 14a illustrates the concentration of 5
before entering the dehydration column when only the feedforward control loop is implemented
(i.e., with a fixed set point for the ratio control loop). In contrast, Figure 14b shows the same
concentration from the run where both the feedforward and feedback control loops are combined
in an automated cascade control loop. The figure shows that, at least for the illustrated time
interval, slow variations in concentration are observed when only feedforward control is
implemented and a more uniform concentration is achieved when feedforward and feedback
control are combined. Note that several outliers can be observed in the measured data, which are
likely the result of temporary manual operation to clean the salt filters (S4) upstream of the UV
measurement device. In the case of Figure 14a, no set point for the concentration can be set,
which complicates the optimization of downstream units and may result in a persistent drift in
concentration during a sustained period of operation. In contrast, adding an outer feedback
control loop allows for the concentration to be kept close to a set point.
Page 34 of 44
ACS Paragon Plus Environment
Organic Process Research & Development
123456789101112131415161718192021222324252627282930313233343536373839404142434445464748495051525354555657585960

35
Figure 14. Dynamic development of the concentration of 5 after dilution and before entering the
dehydration column (S5) for a representative time interval. The upper graph, labeled with (a), is
taken from a different run compared to the bottom graph, labeled with (b), in which a different
control strategy was tested. The upper graph is from a run in which the outer concentration
feedback control loop (CC3) was not implemented and only a feedforward ratio controller (RS3)
was used. The lower graph corresponds to a run in which both the outer concentration feedback
control loop (CC3) and inner ratio control loop (RS3) were implemented in a cascade
configuration. The black dashed line represents the set point of the outer loop. The data points in
both (a) and (b) represent the median value taken within 10 min of data collection with a
sampling frequency of 0.1 Hz.
CONCLUSIONS
The experimental application of an automated control strategy is presented for an end-to-end
continuous pharmaceutical pilot plant. The results demonstrate the ability to control critical
material attributes (CMAs) related to the properties of slurries with an intermediate compound or
the active pharmaceutical ingredient for a sustained period of operation at least for the tested
Page 35 of 44
ACS Paragon Plus Environment
Organic Process Research & Development
123456789101112131415161718192021222324252627282930313233343536373839404142434445464748495051525354555657585960

36
conditions, which included set point changes. Detailed inspection of the performance of several
control loops within shorter time intervals reveal insights about the interaction between
automated control loops, the importance of buffering, and the performance of a combined
feedforward and feedback cascade control. In particular, the interaction of several automated
level control loops and a concentration control loop around two continuous crystallization units,
filter, and buffer tank shows the diversion of key disturbances to non-critical process parameters.
The filtered slurry can contain relatively small amounts of material with a high impurity content,
which can be mitigated via back mixing in a buffer tank. In general, back mixing has an impact
on the dynamics of product quality and, for example, poses challenging questions for a sampling
strategy. Therefore, there is an increased need to understand the impact of residence time
distribution for continuous pharmaceutical manufacturing.32 Finally, comparison of the
performance of a concentration control loop with only feedforward control and the same
concentration control loop with combined feedforward and feedback control clearly
demonstrates the effectiveness of the latter strategy for tight control of an intermediate CMA
within the process.
The experimentally tested control strategy consisted only of conventional feedback and
feedforward automated control loops. However, it is expected that advanced control strategies
such as model-predictive control (MPC) would offer significantly improved control performance
as was recently demonstrated for our application via model-based studies.33 In addition, the
benefits of MPC have been demonstrated clearly for other configurations of continuous
pharmaceutical processes via model-based studies such as a continuous pharmaceutical tablet
manufacturing process via direct compaction.34 A key advantage of MPC is that process
constraints can be taken into account explicitly. Experimental implementation of MPC requires a
Page 36 of 44
ACS Paragon Plus Environment
Organic Process Research & Development
123456789101112131415161718192021222324252627282930313233343536373839404142434445464748495051525354555657585960
37
validated process model, which could also be used to investigate the allowable variation in
controlled variables in a quantitative way. In addition, process models can be used to investigate
the impact of residence time distribution of a train of unit operations on the final product quality.
Advanced control strategies and dynamic process models for continuous pharmaceutical
manufacturing provide in general interesting directions for future research.
AUTHOR INFORMATION
Corresponding Author
* E-mail: [email protected], Tel:+31152783852.
Present Addresses
† Department of Process & Energy, Delft University of Technology, Delft, The Netherlands.
‡ Department of Chemical Engineering, Loughborough University, Loughborough, UK
Author Contributions
The manuscript was written through contributions of all authors. All authors have given approval
to the final version of the manuscript.
ACKNOWLEDGMENT
Novartis International AG is acknowledged for funding of this research as well as supplying
starting materials 1 and 2. The members of the pilot plant team are acknowledged for their
contribution to building and operating the pilot plant, namely Soubir Basak, Erin Bell, Stephen
C. Born, Louis Buchbinder, Ellen Cappo, Corinne Carland, Alyssa N. D'Antonio, Joshua
Page 37 of 44
ACS Paragon Plus Environment
Organic Process Research & Development
123456789101112131415161718192021222324252627282930313233343536373839404142434445464748495051525354555657585960

38
Dittrich, Ryan Hartman, Rachael Hogan, Bowen Huo, Anjani Jha, Ashley S. King, Tushar
Kulkarni, Timur Kurzej, Aaron Lamoureux, Paul S. Madenjian, Ketan Pimparkar, Joel Putnam,
Anna Santiso, Jose C. Sepulveda, Min Su, Daniel Tam, Mengying Tao, Kristen Talbot, Justin
Quon, and Forrest Whitcher (from MIT). Michael Hogan from Siemens is thanked for assistance
with the implementation and operation of the SIMATIC PCS 7 process control system.
REFERENCES
(1) a) Schaber, S.D.; Gerogiorgis, D.I.; Ramachandran, R.; Evans, J.M.B.; Barton, P.I.;
Trout, B.L. Ind. Eng. Chem. Res. 2011, 50, 10083-10092. b) Plumb, K. Chem. Eng. Res.
Des. 2005, 83, 730-738. c) Roberge, D.M.; Ducry, L.; Bieler, N.; Cretton, P.;
Zimmermann, B. Chem. Eng. Technol. 2005, 28, 318-323. d) Roberge, D.M.;
Zimmermann, B.; Rainone, F.; Gottsponer, M.; Eyholzer, M.; Kockmann, N. Org.
Process Res. Dev. 2008, 12, 905-910. e) Jimenez-Gonzalez, C.; Poechlauer, P.;
Broxterman, Q.B.; Yang, B.S.; Am Ende, D.; Baird, J.; Bertsch, C.; Hannah, R.E.;
Dell’Orco, P.; Noorrnan, H.; Yee, S.; Reintjens, R.; Wells, A.; Massonneau, V.; Manley,
J. Org. Process. Res. Dev. 2011, 15, 900-911. f) LaPorte, T.L.; Wang, C. Curr. Opin.
Drug Discovery Dev. 2007, 10, 738-745.
(2) a) Kockmann, N.; Gottsponer, M.; Zimmermann, B.; Roberge, D.M. Chem. Eur. J. 2008,
14, 7470-7477. b) Hartman, R.L.; McMullen, J.P.; Jensen, K.F. Angew. Chem. Int. Ed.
2011, 50, 7502-7519. c) Wegner, J.; Ceylan, S.; Kirschning, A. Chem. Commun. 2011,
47, 4583-4592. d) Wegner, J.; Ceylan, S.; Kirschning, A. Adv. Synth. Catal. 2012, 354,
17-57. e) Wiles, C.; Watts, P. Green Chem. 2012, 14, 38-54. f) Pollet, P.; Cope, E.D.;
Page 38 of 44
ACS Paragon Plus Environment
Organic Process Research & Development
123456789101112131415161718192021222324252627282930313233343536373839404142434445464748495051525354555657585960

39
Kassner, M.K.; Charney, R.; Terett, S.H.; Richman, K.W.; Dubay, W.; Stringer, J.;
Eckertt, C.A.; Liotta, C.L. Ind. Eng. Chem. Res. 2009, 48, 7032-7036. g) Christensen,
K.M.; Pedersen, M.J.; Dam-Johansen, K.; Holm, T.L.; Skovby, T.; Kiil, S. Chem. Eng.
Sci. 2012, 26, 111-117.
(3) a) Chen, J.; Sarma, B.; Evans, J.M.B.; Myerson, A.S. Cryst. Growth Des. 2011, 11, 887-
895. b) Griffin, D.W.; Mellichamp, D.A.; Doherty, M.F. Chem. Eng. Sci. 2010, 65, 5770-
5780. c) Wong, S.Y.; Tatusko, A.P.; Trout, B.L.; Myerson, A.S. Cryst. Growth Des.
2012, 12, 5701-5707. d) Alvarez, A.J.; Myerson, A.S. Cryst. Growth Des. 2010, 10,
2219-2228. e) Alvarez, A.J.; Singh, A.; Myerson, A.S. Cryst. Growth Des. 2011, 11,
4392-4400. f) Lawton, S.; Steele, G.; Shering, P.; Zhao, L.H.; Laird, I.; Ni, X.W. Org.
Process Res. Dev. 2009, 13, 1357-1363. g) Eder, R.J.P.; Schmitt, E.K.; Grill, J.; Radl, S.;
Gruber-Woelfler, H.; Khinast, J.G. Cryst. Res. Technol. 2011, 46, 227-237. h) Eder,
R.J.P.; Schrank, S.; Besenhard, M.O.; Roblegg, E.; Gruber-Woelfler, H.; Khinast, J.G.
Cryst. Growth Des. 2012, 12, 4733-4738. i) Ferguson, S.; Morris, G.; Hao, H.; Barrett,
M.; Glennon, B. Chem. Eng. Sci. 2013, 104, 44-54. j) Zhao, L.; Raval, V.; Briggs, N.;
Bhardwaj, R.M.; McGlone, T.; Oswald, I.D.H.; Florence, A.J. Crystengcomm 2014, 16,
5769-5780.
(4) Quon, J.; Zhang, H.; Alvarez, A.J.; Evans, J.M.B.; Myerson, A.S.; Trout, B.L. Org.
Process Res. Dev. 2012, 12, 3036-3044.
(5) Zhang, H,; Quon, J.; Alvarez, A.J.; Evans, J.M.B.; Myerson, A.S.; Trout, B.L. Org.
Process Res. Dev. 2012, 16, 915-924.
Page 39 of 44
ACS Paragon Plus Environment
Organic Process Research & Development
123456789101112131415161718192021222324252627282930313233343536373839404142434445464748495051525354555657585960
40
(6) a) Mortier, S.T.F.C.; De Beer, T.; Gernaey, K.V.; Vercruysse, J.; Fonteyne, M.; Remon,
J.P.; Vervaet, C.; Nopens, I. Eur. J. Pharm. Biopharm. 2012, 80, 682-689. b) Gonnissen,
Y.; Remon, J.P.; Vervaet, C. Eur. J. Pharm. Biopharm. 2007, 67, 220-226. c) Gonnissen,
Y.; Goncalves, S.I.V.; De Geest, B.G.; Remon, J.P.; Vervaet, C. Eur. J. Pharm.
Biopharm. 2008, 68, 760-770. d) Wang, M.; Rutledge, G.C.; Myerson, A.S.; Trout, B.L.
J. Pharm. Sci. 2012, 101, 1178-1188. e) Brettmann, B.; Bell, E.; Myerson, A.S.; Trout,
B.L. J. Pharm. Sci. 2012, 101, 1538-1545. f) Brettmann, B.K.; Cheng, K.; Myerson,
A.S.; Trout, B.L. Pharm. Res. 2013, 30, 238-246.
(7) a) Dubey, A.; Vanarase, A.U.; Muzzio, F.J. AIChE J. 2012, 58, 3676-3684. b) Dubey, A.;
Sarkar, A.; Ierapetritou, M.; Wassgren, C.R.; Muzzio, F.J. Macromol. Mater. Eng. 2011,
296, 290-307. c) Portillo, P.M.; Ierapetritou, M.; Muzzio, F.J. Powder Technol. 2009,
194, 217-227.
(8) Hamdan, I.M.; Reklaitis, G.V.; Venkatasubramanian, V. J. Pharm. Innov. 2010, 5, 147-
160.
(9) Singh, R.; Ierapetritou, M.; Ramachandran, R. Int. J. Pharm. 2012, 438, 307-326.
(10) Poechlauer, P.; Manley, J.; Broxterman, R.; Gregertsen, B.; Ridemark, M. Org. Process
Res. Dev. 2012, 16, 1586-1590.
(11) ICH. Guidance for Industry Q8(R2) Pharmaceutical Development. U.S. Food and Drug
Administration, Silver Spring, Maryland, November 2009.
(12) Yu, L.X. Pharm. Res. 2008, 25, 781-791.
Page 40 of 44
ACS Paragon Plus Environment
Organic Process Research & Development
123456789101112131415161718192021222324252627282930313233343536373839404142434445464748495051525354555657585960

41
(13) Lionberger, R.A.; Lee, S.L.; Lee, L.; Raw, A.; Yu, L.X. The AAPS Journal 2008, 10,
268-276.
(14) a) Singh, R.; Gernaey, K.V.; Gani, R. Comput. Chem. Eng. 2009, 33, 22-42. b) Gernaey,
K.V.; Cervera-Padrell, A.E.; Woodley, J.M. Comput. Chem. Eng. 2012, 42, 15-29. c)
Cervera-Padrell, A.E.; Skovby, T.; Kiil, S.; Gani, R.; Gernaey, K.V. Eur. J. Pharm.
Biopharm. 2012, 82, 437-456. d) Gernaey, K.V.; Gani, R. Chem. Eng. Sci. 2010, 65,
5757-5769. e) Gernaey, K.V.; Cervera-Padrell, A.E.;Woodley, J.M. Future Med. Chem.
2012, 4, 1371-1374. f) Boukouvala, F.; Niotis, V.; Ramachandran, R.; Muzzio, F.J.;
Ierapetritou, M.G. Comput. Chem. Eng. 2012, 42, 30-47. g) Sen, M.; Rogers, A.; Singh,
R.; Chaudhury, A.; John, J.; Ierapetritou, M.G.; Ramachandran, R. Chem. Eng. Sci. 2013,
102, 56-66.
(15) Lakerveld, R.; Benyahia, B.; Braatz, R.D.; Barton, P.I. AIChE J. 2013, 59, 3671-3685.
(16) Benyahia, B.; Lakerveld, R.; Barton, P.I. Ind. Eng. Chem. Res. 2012, 51, 15393-15412.
(17) Mascia, S.; Heider, P.L.; Zhang, H.; Lakerveld, R.; Benyahia, B.; Barton, P.I.; Braatz,
R.D., Cooney, C.L.; Evans, J.M.B.; Jamison, T.F.; Jensen, K.F.; Myerson, A.S.; Trout,
B.L. Angew. Chem. Int. Ed. 2013, 52, 12359-12363.
(18) Heider, P.L.; Born, S.C.; Basak, S.; Benyahia, B.; Lakerveld, R.; Zhang, H.; Hogan, R.;
Buchbinder, L.; Wolfe, A.; Mascia, S.; Evans, J.M.B.; Jamison, T.F.; Jensen, K.F. Org.
Process Res. Dev. 2014, 18, 402-409.
Page 41 of 44
ACS Paragon Plus Environment
Organic Process Research & Development
123456789101112131415161718192021222324252627282930313233343536373839404142434445464748495051525354555657585960

42
(19) Zhang, H.; Lakerveld, R.; Heider, P.L.; Tao, M.; Su, M.; Testa, C.J.; D’Antonio, A.N.;
Barton, P.I.; Braatz, R.D.; Trout, B.L.; Myerson, A.S.; Jensen, K.F.; Evans, J.M.B. Cryst.
Growth Des. 2014, 14, 2148–2157.
(20) Lakerveld, R.; Benyahia, B.; Heider, P.L.; Zhang, H.; Wolfe, A.; Testa, C.; Ogden, S.;
Hersey, D.R.; Mascia, S.; Evans, J.M.B.; Braatz, R.D.; Barton, P.I. Proceedings of the
2014 American Control Conference 2014, Portland, Oregon, USA, 3512-3517.
(21) Foley, M.A.; Jamison, T.F. Org. Process Res. Dev. 2010, 14, 1177-1181.
(22) Kralj, J.G.; Sahoo, H.R.; Jensen, K.F. Lab Chip 2007, 7, 256-263.
(23) a) Buckley, P.S. Techniques of Process Control; John Wiley & Sons:New York, 1964. b)
Morari, M.; Arkun, Y.; Stephanopoulos, G. AIChE J. 1980, 26, 220-232. c) Morari, M.;
Stephanopoulos, G. AIChE J. 1980, 26, 232-246. d) Larsson, T.; Skogestad, S. Int. J.
Model. Ident. Control 2000, 21, 209-240. e) Stephanopoulos, G.; Ng, C. J. Process
Control 2000, 10, 97-111.
(24) Seborg, D.E.; Edgar, T.F.; Mellichamp, D.A.; Doyle III, F.J. Process Dynamics and
Control (3rd edition); John Wiley & Sons:Hoboken, New Jersey, 2011, 107-108.
(25) McDonald, K.A.; McAvoy, T.J.; Tits, A. AIChE J. 1986, 32, 75-86.
(26) Lakerveld, R.; Benyahia, B.; Heider, P.L.; Zhang, H.; Braatz, R.D.; Barton, P.I.
Processes 2013, 1, 330-348.
(27) Smith, C. Practical Process Control: Tuning and Troubleshooting; John Wiley &
Sons:Hoboken, New Jersey, 2009, 365-368.
Page 42 of 44
ACS Paragon Plus Environment
Organic Process Research & Development
123456789101112131415161718192021222324252627282930313233343536373839404142434445464748495051525354555657585960

43
(28) Lin, M.G.; Lakshminarayanan, S.; Rangaiah, G.P. Ind. Eng. Chem. Res. 2008, 47, 344-
368.
(29) Skogestad, S. J. Process Contr. 2003, 13, 291-309.
(30) Garcia, C.E.; Morari, M. Ind. Eng. Chem. Process Des. Dev. 1982, 21, 308.
(31) Rivera, D.E.; Morari, M.; Skogestad, S. Ind. Eng. Chem. Process Des. Dev. 1986, 25,
252.
(32) Chatterjee, S. FDA Perspective on Continuous Manufacturing, presented at the 2012
IFPAC Annual Meeting, Baltimore, MD.
(33) Mesbah, A.; Lakerveld, R.; Braatz, R.D. Plant-Wide Model Predictive Control of a
Continuous Pharmaceutical Manufacturing Process, presented at the 2013 AIChE
Annual Meeting, San Francisco, CA.
(34) Singh, R.; Ierapetritou, M.; Ramachandran, R. Eur. J. Pharm. Biopharm. 2013, 85, 1164-
1182.
Page 43 of 44
ACS Paragon Plus Environment
Organic Process Research & Development
123456789101112131415161718192021222324252627282930313233343536373839404142434445464748495051525354555657585960

44
SYNOPSIS
For Table of Contents Only
Page 44 of 44
ACS Paragon Plus Environment
Organic Process Research & Development
123456789101112131415161718192021222324252627282930313233343536373839404142434445464748495051525354555657585960