Embed Size (px)
Citation preview

A sequence stratigraphic synthesis of the Lower Pennsylvanian Pottsville Formation encountered in two drill cores in the Cahaba synclinorium, Alabama
by
Sonnet Wilson Gomes
A thesis submitted to the Graduate Faculty of Auburn University
in partial fulfillment of the requirements for the Degree of
Master of Science
Auburn, Alabama December 8, 2012
Keywords: Pottsville Formation, Cahaba synclinorium, sequence stratigraphy, Alabama
Copyright 2012 by Sonnet Wilson Gomes
Approved by
Ashraf Uddin, Chair, Professor of Geology Charles E. Savrda, Professor of Geology Willis E. Hames, Professor of Geology
Jack C. Pashin, Director, EMD, Geological Survey of Alabama

ii
Abstract
The Lower Pennsylvanian Pottsville Formation is a classic clastic wedge of the
Appalachian mountain system composed of interbedded sandstone, siltstone, claystone,
shale, and coal beds with orthoquartzitic conglomerate at the base. The formation
developed in response to thrust and sediment loading on the convergent margin of the
Laurussian craton during the Alleghanian orogeny. The greatest preserved thickness of
Pennsylvanian strata, more than 2500 m (8000 ft), accumulated in the Cahaba and
Coosa coalfields of the greater Black Warrior Basin. The Carboniferous coalfield, which
hosts the Pottsville Formation in the greater Black Warrior Basin, occurs in large
synclinoria separated by anticlinoria where Cambrian-Ordovician rocks are exposed at
the surface.
Eight lithofacies have been identified within two studied drill cores from the
Cahaba basin on the basis of dominant rock types, color, grain size, and sedimentary
structures. A transition from a tidal through delta-estuarine to fluvial environments has
been identified with the aid of facies analysis. Conformable contacts indicate a gradual
change in the depositional environments from delta front to the delta plain. Laterally
extensive coal beds have been used to demarcate sequence packages in the terrestrial
part, whereas a few localized flooding surfaces have been identified in the marine-
dominated strata. Repetitive fining upward sequences show a wide array of prograding

iii
deltaic and alluvial facies in the highstand system tracts. Conglomerate layers associated
with fluvial scour surfaces reflect the influence of eustacy on sedimentation.
Thin-section petrography shows incongruence between mudstone and
conglomerate measures. Two distinct petrofacies assemblages have been identified
within the sampled intervals of cores, and these may be indicative of changes in base
level, depositional environment, climate, and possibly source terrain. The lower marine
intervals of the studied core may have been sourced from the distal northern
Appalachian Mountains via the Pennsylvanian mega-drainage system. The proximal
southern Appalachian Mountains may have contributed for the deposition of the upper
terrestrial section.
A combination of depositional and genetic sequence stratigraphic models has
been applied to the Pottsville Formation in the study area. The depositional sequence
model is better suited in the terrestrial-dominated upper part of the core due to
abundance of major fluvial erosional discontinuities. The genetic sequence model is
applicable to the marine-dominated lower part, which is characterized by the presence
of marine flooding surfaces and associated condensed sections.

iv
Acknowledgments
My Master’s thesis not only represents a personal academic milestone, but it
also is a tribute to those organizations and individuals who have made it possible. First, I
thank my advisor Dr. Ashraf Uddin, whose unwavering guidance, patience, and pursuit
of knowledge has not only made this research possible, but set the highest of examples,
ultimately making me both a better geologist and person. I also thank committee
member Dr. Jack C. Pashin, not only for his guidance and thoughtful comments but also
for his utmost concern for my personal development in the field of sedimentology and
stratigraphy. I thank Dr. Charles Savrda and Dr. Willis Hames, whose contributions and
criticisms have been instrumental in the success of this project. Additionally, I thank my
classmates for endless hours of help and thoughtful discussions, as well as all my friends
in the Department of Geology, whose friendship has made two years go by far too fast. I
would be remiss in mentioning the Department of Geology without acknowledging the
technical and office staff. Much thanks to these individuals for assuring people like me
are successful in achieving their academic goals. I also would like to acknowledge The
Geological Survey of Alabama, Auburn University’s Graduate School, College of Sciences
and Mathematics, Geological Society of America, and Gulf Coast Association of
Geological Societies for their support of this project. In addition, I thankfully

v
acknowledge the US National Science Foundation (grant no. EAR-0911687) for providing
support for this research.
My heartiest thanks go to Mrs. Janyth Pashin for her care and concern during
my stay in Tuscaloosa for sample collection.
Lastly, and on some levels, most importantly, I would like to thank all members
of my family including, but not limited to, my wife Laticia D. Rozario, my parents Mr.
Francis Gomes and Mrs. Shipra Gomes, and my brother Mr. Samuel Gomes. Without
their unwavering emotional support, this thesis would not have been possible. I
dedicate this thesis to my family.

vi
Table of Contents
PAGE ABSTRACT………………………………………………………………………………………………………………………………ii ACKNOWLEDGEMENT…………………………………………………………………………………………………………..iv LISTS OF FIGURES………………….….…………………………………………………………………………….….......viii LISTS OF TABLES……………….……………….……..…………………………………..………..…….………….….….xiii CHAPTER 1: INTRODUCTION……………………………………………………………………………………………….1
1.0 INTRODUCTION…………………………………………….………………..…………………..…….........1 1.1 POTTSVILLE FORMATION……………………………………..………………………………..…...……..3
1.1.1 GENERAL STRATIGRAPHY……………………………………….……….……3 1.1.2 PENNSYLVANIAN DEPOSITIONAL CYCLES…………………………..…8
CHAPTER 2: METHODS………………………………………………………………………………………………….. 12 2.0 INTRODUCTION………………………………………………………………………..……………………..12 2.1 CORE DESCRIPTION…………………………………………………………………………..…………….12 2.2 FACIES ANALYSIS ………………………………………………………………………………………..…..14 2.3 DEPOSITIONAL ENVIRONMENT ANALYSIS ………………………………………..…………….14 2.4 SANDSTONE PETROGRAPHY………………..………………………………………………………....14
CHAPTER 3: LITHOFACIES DESCRIPTIONS.…………..…………………...……………………………….....17 3.0 INTRODUCTION……………………………….…………………………………………………………….. ...17 3.1 CONGLOMERATE LITHOFACIES…………………………………..…………………………………...17 3.2 SANDSTONE LITHOFACIES…………………………..…………………………………………………..22 3.3 ROOTED MUDSTONE AND SILTSTONE LITHOFACIES …………….…………………………25 3.4 COAL LITHOFACIES…………………………………………………………..………………………….....27 3.5 WAVY BEDDED SHALE AND SANDSTONE LITHOFACIES ………..………………………….27 3.6 GRADED SANDSTONE AND SHALE LITHOFACIES……………………..…………………….…29 3.7 BURROWED MUDSTONE LITHOFACIES ………………………………….………………………..30 3.8 SHALE AND SHELLY SANDSTONE LITHOFACIES……………….…………………………….…32
CHAPTER 4: PETROGRAPHY………………………………….............................................................. 36 4.0 INTRODUCTION…………………………………………….…………………………………………….… 36 4.1 QUARTZOLITHIC PETROFACIES (mean Qt77F6L17)……………………………………………..37 4.2 QUARTZOFELDSPATHOLITHIC PETROFACIES (mean Qt60F12L28)………………………..37
CHAPTER 5: ENVIRONMENTS OF DEPOSITION……………………………………………………………….50 5.0 INTRODUCTION………………………….……………...……………………………………………………50 5.1 CONGLOMERATE LITHOFACIES …………………………….…………………………………………50

vii
5.2 SANDSTONE LITHOFACIES ……………….…………………………..….………………….…………. 53 5.3 ROOTED MUDSTONE AND SILTSTONE LITHOFACIES…………………….…………..…….. 54 5.4 COAL LITHOFACIES ………………………………………………………………………………........... 54 5.5 WAVY BEDDED SHALE AND SANDSTONE LITHOFACIES……….……………………………55 5.6 GRADED SANDSTONE AND SHALE LITHOFACIES………….………………………………..…56 5.7 BURROWED MUDSTONE LITHOFACIES………….…..…………………………………………….56 5.8 SHALE AND SHELLY SANDSTONE LITHOFACIES…………………………………………………56 5.9 VERTICAL DISTRIBUTION OF PALEOENVIRONMENTAL REGIMES………………………57
CHAPTER 6: STRATIGRAPHIC ARCHITECTURE………………………………………………………………….…60 6.0 INTRODUCTION…………………..………………………………………………….………………..… ... 60 6.1 PROGRADATIONAL ELEMENT ………………………………………………………………………. ... 61 6.2 AGGRADATIONAL ELEMENT.…………….………….…………………………………………………63 6.3 BOUNDING DISCONTINUITIES………………………………………………………………………….64
6.3.1 EROSIONAL SURFACES ……………………….……………………………………………………65 6.3.2 FLOODING SURFACES AND CONDENSED SECTIONS……..…………….………..... 68
CHAPTER 7: SEQUENCE STRATIGRAPHIC FRAMEWORK………………………………………………….…71 7.0 INTRODUCTION……………………….………………………………………………………………........ 71 7.1 SEQUENCE STRATIGRAPHIC INTERPRETATION OF BOUNDING DISCONTINUITIE..73 7.2 IDENTIFICATION OF SYSTEMS TRACTS…………………………….……………………….………79
CHAPTER 8: DISCUSSION.......................................................................................................84 8.0 INTRODUCTION……………………………………………………………………………………………….84 8.1 SIGNIFICANCE OF MAJOR SEQUENCE STRATIGRAPHIC SURFACES…………………...84 8.2 HIERARCHY OF SEQUENCE STRATIGRAPHIC SURFACES…….………………………………87 8.3 RELATION BETWEEN SANDSTONE PETROGRAPHY AND STRATIGRAPHIC ARCHITECTURE……………………………………………………………………………………………………..88 8.4 RELATION BETWEEN SANDSTONE PETROGRAPHY AND DEPOSITIONAL ENVIRONMENTS…………………………………………………………………………………………………...91
CHAPTER 9: CONCLUSIONS……………………………………………………………………………………………....92 REFERENCES .........................................................................................................................94

viii
List of Figures
Figure 1.1 (A) Isopach map of Pennsylvanian strata in the greater Appalachian Basin
(modified from Greb et al., 2008). (B) Generalized cross sections across the basin with
subperiods of Pennsylvanian (A–A’ modified from Wanless, 1975; B–B’ and C–C’
modified from Chesnut, 1991)………………………………………………………………………………………4
Figure 1.2: Geological map of foreland basins of the Southern Appalachian thrust belt
(after Pashin et al., 2010)………………………………………………………………………………..……………5
Figure 1.3: Restored structural cross section of Cahaba Basin and adjacent structures
(modified from Thomas and Bayona, 2005; Pashin et al., 2010)…..…………………………………6
Figure 1.4: A) Stratigraphic column of the Pottsville Formation, Cahaba synclinorium and
B) three associated magnafacies. Black arrows and open arrows indicate paleocurrent
directions based on crossbeds and current ripples, respectively (after Pashin et al.,
1995).………………….………………………………………………………………………………………………….……..7
Figure 1.5: Paleogeography of the Cahaba and adjacent basins during Early
Pennsylvanian (modified from Lacefield, 2000)……………………………..……………..…………..…..9
Figure 1.6: Idealized stratigraphic model showing facies relationships and flooding
surfaces in upper Pottsville cyclothems of the Black Warrior coalbed methane fields
(after Pashin and Raymond, 2004)…………………………………………………………………..………..…10
Figure 2.1: Graphic log of the Pottsville Formation in SWEPI2 core in the Cahaba
synclinorium ………………….…………………………………………………………………………………………...13
Figure 3.1: Clast-supported conglomerate from 784 ft (left) and 3819 ft (right). Clasts are
dominated by siderite (brown), shale (gray), basalt (black), and sandstone (light gray).
Coins are used for scale………………….……………………………………………………………..…………….20
Figure 3.2: Schematic diagram illustrating the general distribution of different
conglomerate sublithofacies in typical fining upward succession (not scaled)………………21
A A
A’
ix
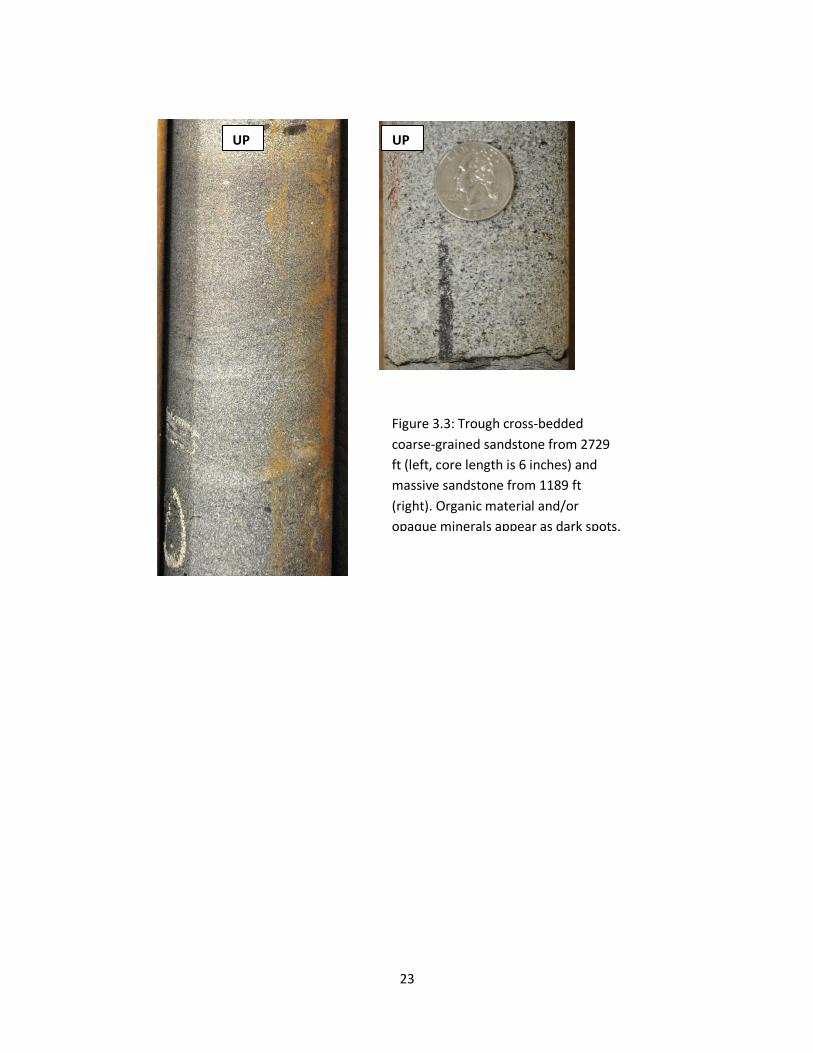
Figure 3.3: Trough cross-bedded coarse-grained sandstone from 2729 ft (left, core
length is 6 inches) and massive sandstone from 1189 ft (right). Organic material and/or
opaque minerals appear as dark spots. ………………….…………………….……………………………..23
Figure 3.4: Schematic diagram of different sublithofacies of sandstone lithofacies in a
typical fining-upward succession...……………………………………………………………………………….24
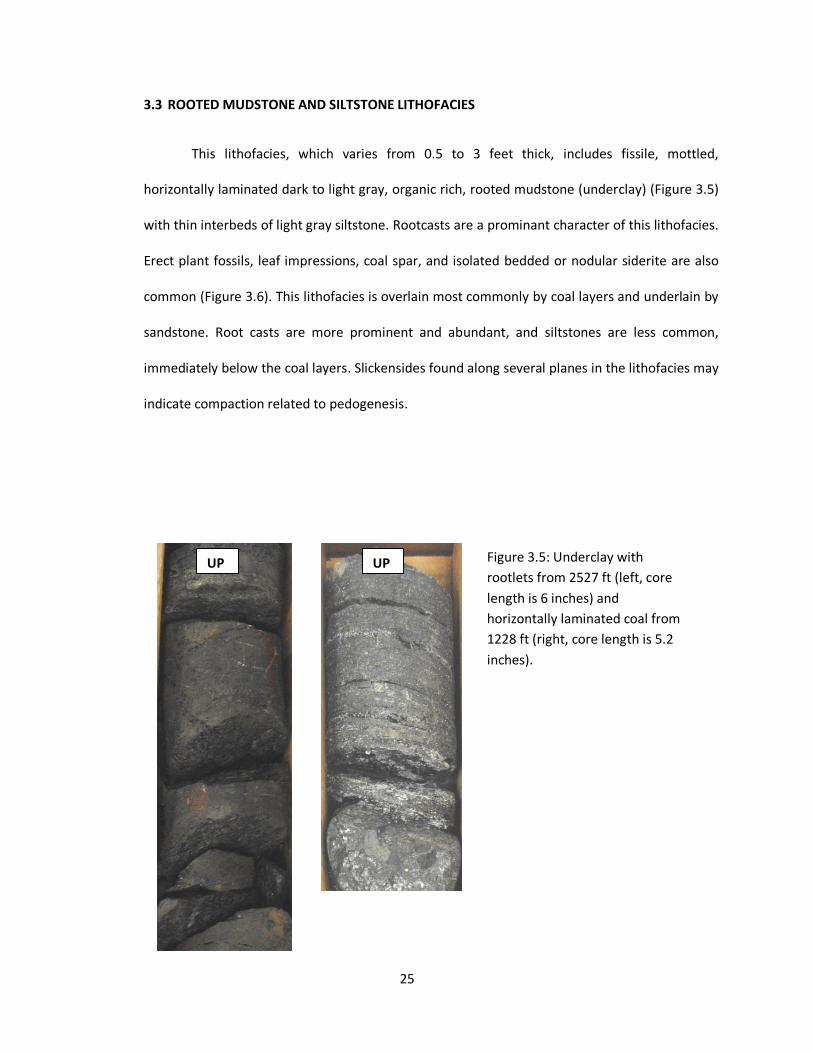
Figure 3.5: Underclay with rootlets from 2527 ft (left, core length is 6 inches) and
horizontally laminated coal from 1228 ft (right, core length is 5.2 inches)……………………25
Figure 3.6: Rooted mudstone and siltstone (left, 1811 ft.). Rooted mudstone (right, 3619
ft)…………………………………………………………….…………………………………………………………………..26
Figure 3.7: Sand lenses within wavy beddings (left core, 3934ft), sand lenses with flaser
bedding (middle core, 4336 ft), and typical wavy bedding with load casts (right core,
4386 ft)….……………………………….……………………………………..………………………………………….…28
Figure 3.8: Graded sandstone and shale (4446 ft). Core length is 7 inches. Arrows
indicate coarsening upward successions..…..………………………………………………………………..29
Figure 3.9: Schematic diagram of graded sandstone and shale associated with rooted
mudstone and coal………………………………………………………………………………………………………29
Figure 3.10: Horizontally laminated mudstone and thin interbeds of sand with burrowing
(left, 4227 ft,right, 4240 ft). ……………………………………………………………………………………….31
Figure 3.11: Laminated, very dark shale with thin layers of isolated sand. Brown siderite
banding (SB) and some burrows are present. Core is from 3208 ft………………………………32
Figure 3.12: Productus semireticulatus fossil in shale and shelly sandstone lithofacies.
The core is from 2730 ft……………………………………………………………………………………………….33
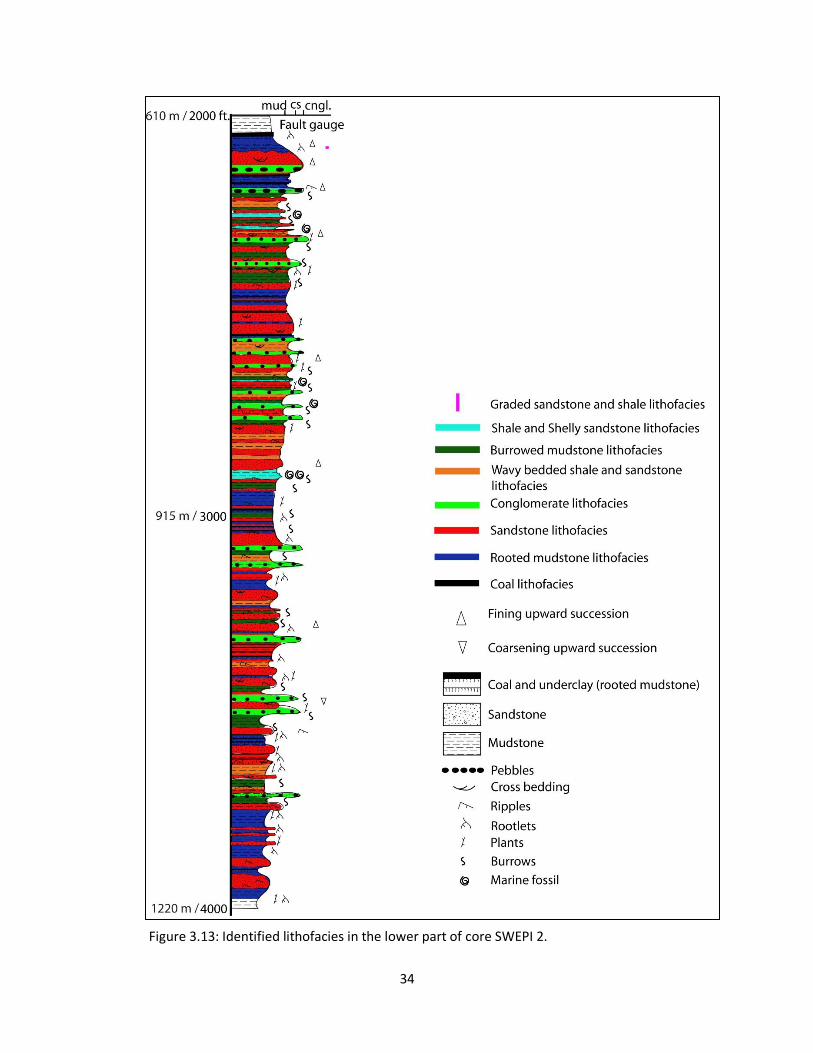
Figure 3.13: Identified lithofacies in the lower part of the core SWEPI 2………………………34
Figure 3.14: Identified lithofacies in the upper part of the core SWEPI 2………………………35
Figure 4.1: Composition of Pottsville sandstone based on Folk’s (1980) classification
scheme. Red and blue fields represent quartzolithic and quartzofeldspatholithic
petrofacies, respectively……………………………………..……………………….………………………………41
Figure 4.2: Representative photomicrographs of Pottsville sandstone. (A)
Quartzofeldspatholithic sandstone with rounded to subangular monocrystalline grains
(Qm) among polycrystalline quartz (Qp), plagioclase feldspar (Plag.), sedimentary (Ls)

x
and metamorphic lithic (Lm) fragments (sample SN-4, crossed polars). (B) Quartzolithic
sandstone with detrital chert and polycrystalline quartz grains (Qp) among lithic grains
(Ls) (sample SN-22, crossed polars)…………………………..………………………………………………….42
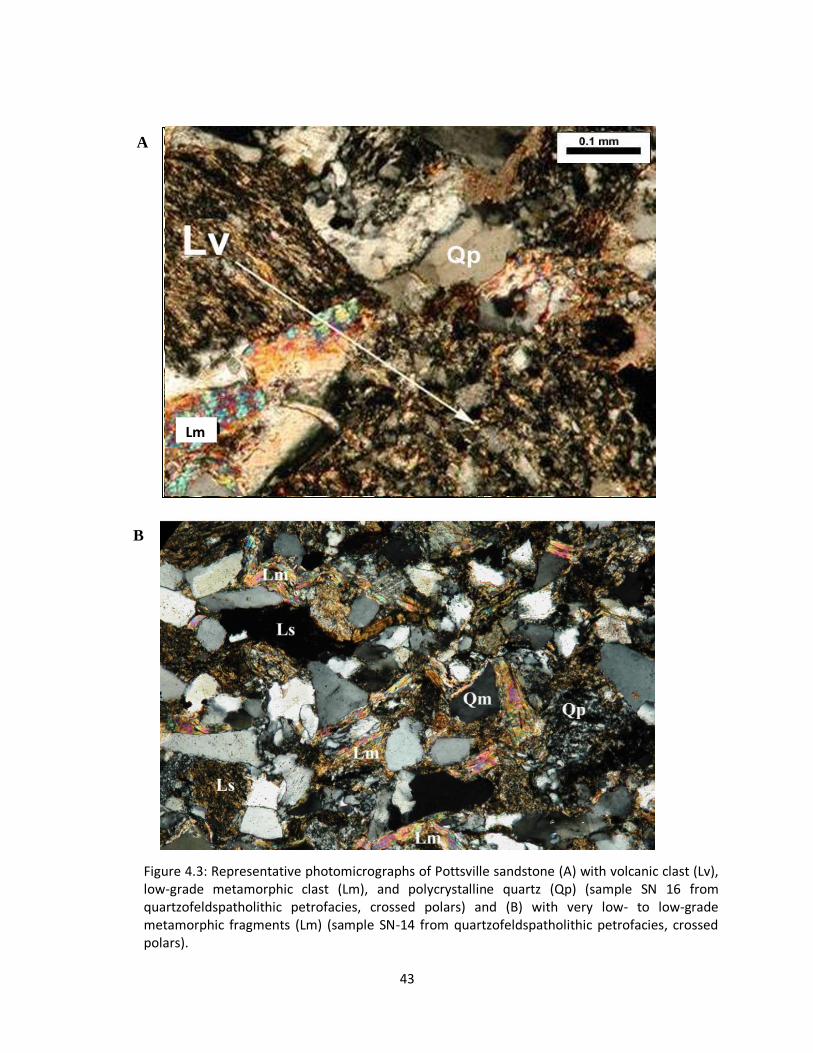
Figure 4.3: Representative photomicrographs of Pottsville sandstone. (A)
Quartzofeldspatholithic sandstone with monocrystalline quartz (Qm) and calcite (sample
SN 10, crossed polars). (B) Quartzolithic sandstone with very low- to low-grade
metamorphic fragments (Lm) (sample SN-14, crossed polars)………………………….………….43
Figure 4.4: Distribution of petrofacies assemblages. The Quartzolithic assemblage and
the quartzofeldspatholithic assemblage correspond to the mudstone and conglomerate
measures, respectively. Red dots represent sample collection levels.………………………….44
Figure 4.5: Profile plot of changes in percentages of total quartz (Qt), feldspar (F), and
lithic fragments (L) through the Pottsville Formation in the Cahaba Basin.……………..……45
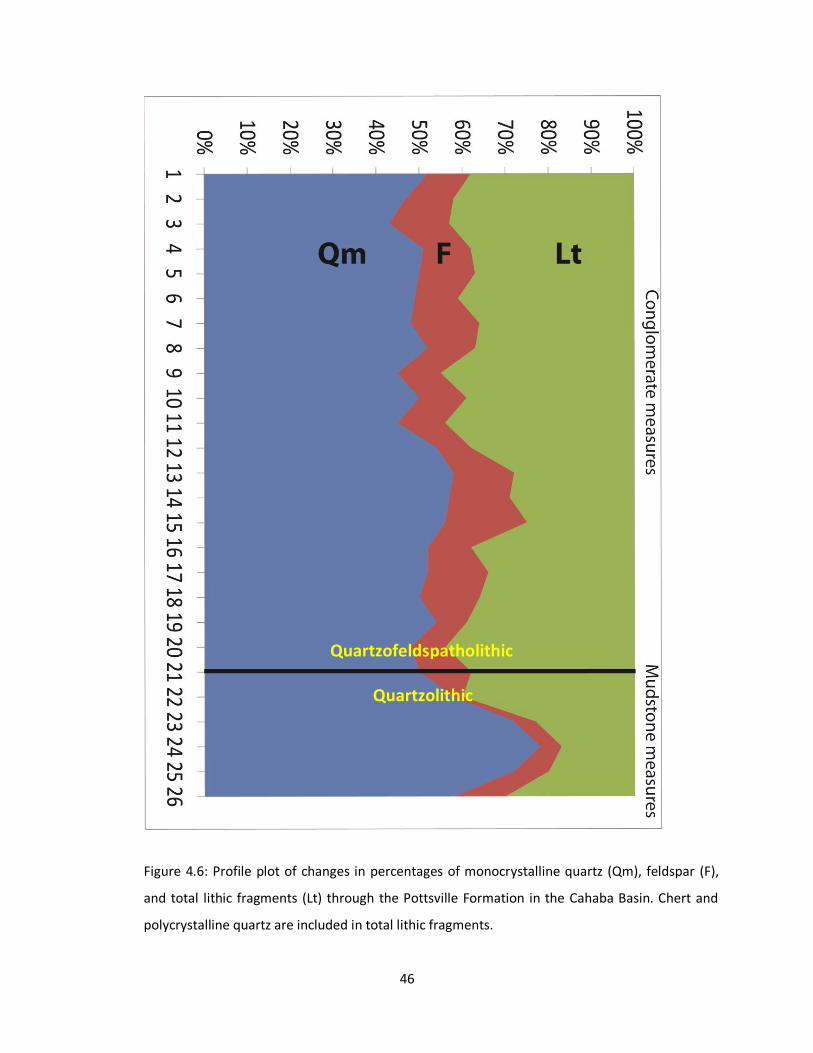
Figure 4.6: Profile plot of changes in percentages of monocrystalline quartz (Qm),
feldspar (F), and total lithic fragments (Lt) through the Pottsville Formation in the
Cahaba Basin. Chert and polycrystalline quartz are included in total lithic
fragments……………………………………………………………………………………………………..…………….46
Figure 4.7: Profile plot of changes in percentages of monocrystalline quartz (Qm),
plagioclase feldspar (P), and potassium feldspar (K) through the Pottsville Formation in
the Cahaba Basin………………………………………………………………………………………………………….47
Figure 4.8: Profile plot of changes in percentages of sedimentary (Ls), volcanic (Lv), and
metamorphic (Lm) lithic fragments through the Pottsville Formation in the Cahaba
Basin.………………………….…………………………………………………………………………………..……………48
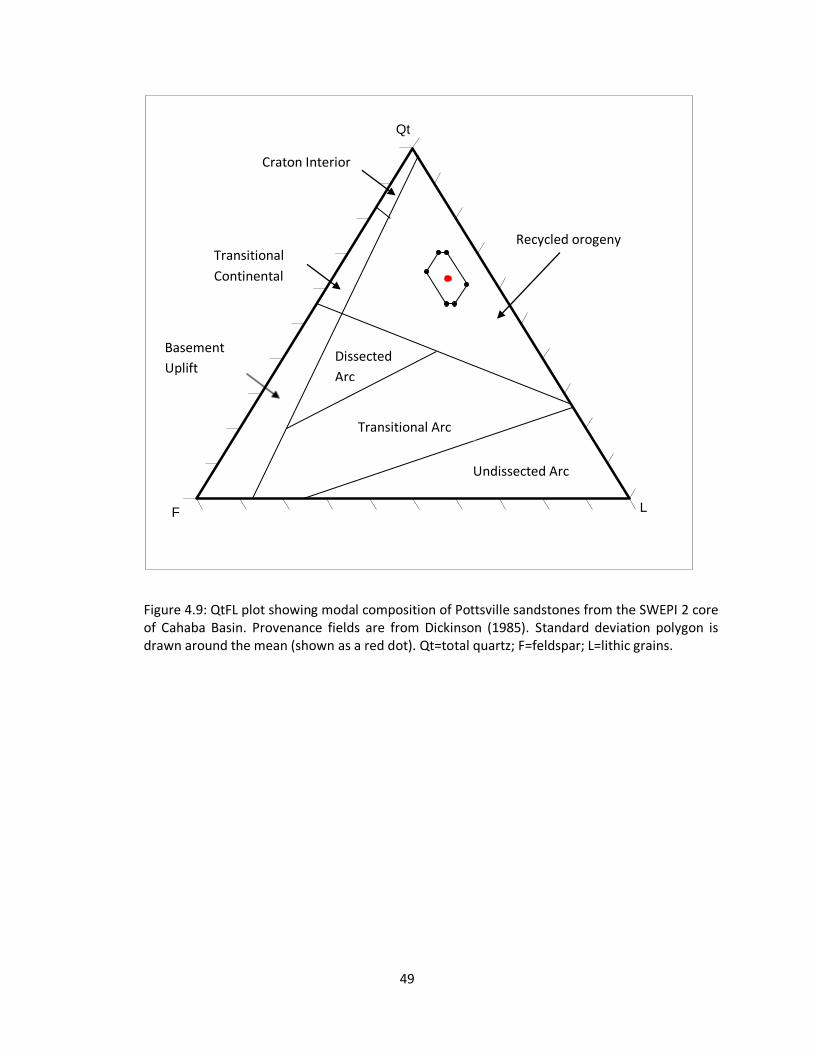
Figure 4.9: QtFL plot showing modal composition of Pottsville sandstones from the
SWEPI 2 core of Cahaba Basin. Provenance fields are from Dickinson (1985). Standard
deviation polygon is drawn around the mean (shown as a red dot). Qt=total quartz;
F=feldspar; L=lithic grains. ……………………………………………….………………………….………………49
Figure 5.1: Reconstruction of the clastic depositional environments of Lower
Pennsylvanian Pottsville Formation in Cahaba synclinorium, Alabama…………………………51
Figure 5.2: Interpreted depositional environments in the lower part of core SWEPI
2………………………………………………………………………………………………………………..…………………58
Figure 5.3: Interpreted depositional environments in the upper part of core SWEPI
2………………………………………………………………………………………………………………..…………………59

xi
Figure 6.1: Overall coarsening upward succession with high frequency, small-scale
coarsening-fining upward successions in the Pottsville Formation of Cahaba
synclinorium representing progradational elements……………………………………………….…..62
Figure 6.2: Overall fining upward succession with small-scale coarsening-fining upward
successions in the Pottsville formation of Cahaba synclinorium representing
aggradational elements………………………………………………………..………………………………………64
Figure 6.3: Hypothetical section across incised valley and interfluves representing key
stratigraphic surfaces in both the distal and proximal part of the Cahaba basin during
Early Pennsylvanian (modified from Posamentier and Allen, 1999)………………………..….66
Figure 6.4: Ravinement surface (rvs) overlain by shallow marine facies in the lower part
of the core……………………………………………………………………………………………………………………67
Figure 6.5: Flooding surfaces (FS) within the marine zones. Marine zones are identified
with abundant fossil content and carbonaceous mud successions……………………….………69
Figure 6.6: Typical condensed section containing minute burrows and sand lenses. Left
core is from 3608 ft and right core is from 3731 ft. The right core is from 2900 ft that
represents a fossil lag. The marine flooding surface (MFS) is at the contact between the
shale and the shelly sandstone. The surfaces within the lag mark minor events
associated with reworking during marine transgression and condensation………………….70
Figure 7.1: Schematic cross section of a Vail-type and a Galloway-type sequence
(modified from Galloway, 1989)……………………………………………………………………………..……72
Figure 7.2(A): Proposed sequence boundaries and systems tracts in the lower-half of the
graphic log at the SWEPI 2 well of Pottsville Formation in Cahaba synclinorium….……...77
Figure 7.2 (B): Proposed sequence boundaries and systems tracts in the upper-half of
the graphic log at the SWEPI 2 well of Pottsville Formation in Cahaba synclinorium….…78
Figure 7.3: Typical vertical succession of a transgressive systems tract in SWEPI 2
recognized between 2555 to 2615 feet…………………………………………………………… ………….82
Figure 7.4: Typical vertical succession of a highstand systems tract in SWEPI 2 recognized
between 3220 to 3400 feet. ……………………………………………………………………….………….……83
Figure 8.1: North American Pennsylvanian mega-drainage system influences the
compositional diversity in the lower and upper part of the Cahaba synclinorium. Blue
polygon represents the probable sediment source terrain for the more mature lower
part of the core whereas the red polygon represents the source area for the less mature

xii
sediments in the upper part of the core (modified from Blakey et al., 1988; Archer and
Greb, 1995)………………………………………………………………………………………………………………….90

xiii
List of Tables
Table 1: Modal parameters of sand and sandstones determined in this study (Dickinson and Suczek, 1979; Dorsey, 1988).…………………….…..………………………………………………………16
Table 2: Summary of the identified lithofacies descriptions an architecture……...…………19
Table 3: Raw point-count data of sandstones from two measures of the Lower Pennsylvanian Pottsville Formation (green samples from conglomerate measures, red ones from mudstone measures)…………………………………………………………………………………..39
Table 4: Normalized modal compositions (in %) of sandstones from two measures of the Lower Pennsylvanian Pottsville Formation. Green samples (SN1 to SN21) are from conglomerate measures and red samples (SN22 to SN 26) are from mudstone measures.……..…………………………………………………………………………………….……………………….40
Table 5: Summary of the identified lithofacies and inferred depositional
environments……………………………………………………………………………………………………………….52

1
CHAPTER 1: INTRODUCTION
1.0 INTRODUCTION
Sequence stratigraphy is important for understanding the genesis of basin fill
(Posamentier et al., 1988; Posamentier and Vail, 1988; Van Wagoner et al., 1990; Hunt and
Tucker, 1992). Stratigraphic surfaces are identified based on a chronostratigraphic framework.
Identification of genetically related strata focuses on the correlation of basinwide coeval stratal
units bounded by quasi-isochronous surfaces (Frazier, 1974; Mitchum, 1977; Galloway, 1989).
Facies analysis leading to the interpretation of paleoenvironments is critical for sequence
stratigraphy.
The nature of contacts between stratigraphic units, e.g., conformable vs.
unconformable, and changes in facies across these contacts are the most important criteria used
to identify the various type of sequence stratigraphic surfaces. These stratigraphic surfaces
provide the framework for correlation necessary to construct sequence stratigraphic models.
The Pottsville Formation in the Cahaba synclinorium is a part of a thick clastic wedge
that accumulated during the Lower Pennsylvanian in response to collisional tectonics (Pashin et
al., 1995). Previous studies have established a general stratigraphic framework for the Pottsville
Formation in the Cahaba synclinorium mostly based on surface exposures and subsurface core
data (Pashin et al., 1995; Pashin and Carroll, 1999; Pashin and Raymond, 2004; Pashin, 2004;
Greb et al., 2008). In spite of extensive studies on general stratigraphy, coal-bearing strata, and

2
cyclic sedimentation of the Cahaba synclinorium, a complete sequence stratigraphic model has
yet to be constructed for the Pottsville Formation.
Petrography reveals substantial information on the geochronology (Peavy, 2008; Uddin
et al., 2010a,b; Moore et al., 2011a,b, 2012) and provenance of the Pottsville Formation (Schlee,
1963; Graham et al., 1976; Mack et al., 1983; Demirpolat, 1989; Liu and Gastlado, 1992; Peavy,
2008) as well as the tectonic and climatic controls (Pashin et al., 1995; Pashin and Carroll, 1999,
Pashin, 2004) on sedimentation. Moreover, petrographic data also can be implemented to
interpret mechanisms that create continental sequence-stratigraphic architecture (Lawton et al.,
2003). A petrographic study by Lawton and others (2003) from southern Utah indicates that
Upper Cretaceous alluvial successions in the southernmost part of the Cordilleran foreland basin
were deposited by fluvial systems of contrasting drainage directions and provenance, and
suggests different mechanisms governed their sequence architecture. This case study motivated
the current research to identify petrographic changes between major marine and non-marine
successions.
The main objective of the research is to establish a sequence stratigraphic framework
for the studied section of the Pottsville Formation in the Cahaba synclinorium, Alabama,
primarily based on facies analysis. An additional objective is to test the relationship, if any,
between marine and non-marine depositional environments and sandstone petrofacies.

3
1.1 POTTSVILLE FORMATION
1.1.1 GENERAL STRATIGRAPHY
The Pottsville Formation is composed of shale, mudstone, siltstone, sandstone, extra-
and intraformational conglomerate, and coal. This Formation developed in response to thrust
and sediment loading on the convergent margin of the Laurentian craton during Appalachian-
Ouachita orogenies (Thomas, 1976, 1995). Discrete depocenters developed along the
Appalachian trend (Figure 1.1) cratonward of promontories on the continental margin in the
Middle to Late Mississippian (Thomas, 1976, 1995; Quinlan and Beaumont, 1984). The base of
the Pottsville Formation has been placed at Namurian C -Langsettian whereas the top is placed
on Langsettian-Duckmantian boundary (Pashin, 2004). An ash layer in the younger strata in
greater Black Warrior basin in Mississippi has been dated as 308.6±2.7 Ma (Uddin et al., 2010).
The greatest preserved thickness of Pennsylvanian strata, more than 2500 m (8000 ft),
accumulated in the Cahaba and Coosa coalfields of the greater Black Warrior Basin (Figure 1.2).
These Carboniferous coalfields in the greater Black Warrior Basin now occur in large synclinoria
separated by faults and anticlinoria (Figure 1.2) where Cambrian-Ordovician rocks are exposed
at the surface (Figure 1.3). The Cahaba and Coosa coalfields are parts of the Appalachian thrust
belt, in which thin-skinned folds and thrust faults are detached in Cambrian shale and come to
the surface along frontal ramps.

4
Figure 1.1 (A) Isopach map of Pennsylvanian strata in the greater Appalachian Basin (modified from Greb et al., 2008). (B) Generalized cross sections across the basin with subperiods of Pennsylvanian (A–A’ modified from Wanless, 1975; B–B’ and C–C’ modified from Chesnut, 1991).
B
C
C’
B’
A
A’

5
Figure 1.2: Geological map of foreland basins of the Southern Appalachian thrust belt (after Pashin et al., 2010). Yellow dot represents the position of the two studied cores (SWEPI 1 and SWEPI 2).
The Cahaba synclinorium, also referred to as the Cahaba coal field, is a synclinorium
located in north-central Alabama (Figures 1.2, 1.3). The Cahaba synclinorium is bordered to the
northwest by the Birmingham anticlinorium. It is separated from the Coosa synclinorium (also
referred to as Coosa coal field; Figure 1.2) to the southeast by the regionally extensive Helena
fault.
A A
A’
Rome – Parkwood Fm. (Cambrian-Mississippian)

6
Figure 1.3: Restored structural cross section of Cahaba Basin and adjacent structures (modified from Thomas and Bayona, 2005; Pashin et al., 2010).
The Cahaba synclinorium is filled mostly with sedimentary rocks of the Lower
Pennsylvanian Pottsville Formation. The formation contains 20 informal coal zones and overlies
the Upper Mississippian-Lower Pennsylvanian Parkwood Formation throughout the basin
(Pashin, 1997). The Pottsville Formation is the youngest unit in the Cahaba synclinorium. The
formation is unconformably overlain by the Upper Cretaceous Coker Formation near the
southwest end of the structure (Pashin and Carroll, 1999). The southeast part of the
synclinorium has a thicker succession of sediment that reflects a greater rate of subsidence
during deposition (Pashin and Carroll, 1999; Pashin, 2004).
The Pottsville Formation of the Cahaba coal field has been subdivided into three
magnafacies (Pashin et al., 1995) (Figure 1.4). From bottom to top, they are (1) quartzarenite, (2)
mudstone, and (3) conglomerate measures. Trough cross-bedded, light gray to white
quartzarenite, along with minor bioturbated mud, dominate the quartzarenite measures. The
mudstone measures contain marine mudstone, as well as numerous gray litharenite bodies and

7
coal beds. The conglomerate measures are composed of litharenite, mudstone, coal and thick
extraformational conglomerate units. This study focuses on the mudstone and conglomerate
measures.
Figure 1.4: A) Stratigraphic column of the Pottsville Formation, Cahaba
synclinorium and B) three associated magnafacies. Black arrows and open
arrows indicate paleocurrent directions based on crossbeds and current
ripples, respectively (after Pashin et al., 1995).
B
A
N

8
1.1.2 PENNSYLVANIAN DEPOSITIONAL CYCLES
Depositional cycles have been recognized in the Pennsylvanian strata of the Appalachian
basin since the 1930s (Weller, 1930; Wanless and Weller, 1932). Weller (1930) attributed
cyclicity to tectonics, whereas Wanless and Shephard (1936) attributed these cycles to global
sea-level changes caused by fluctuations in the volume of Gondwanan ice sheets. Recent debate
has focused on the tectonic and paleoclimatic implications of this cyclicity, which is thought to
be a product of both basin subsidence associated with assembly of the Pangaea supercontinent
and eustasy driven by Gondwanan glaciations (Ross and Ross, 1988; Heckel et al., 1998; Klein,
1990). Through the 1960s and 1970s, an increasing awareness of inherent behavior of alluvial
and deltaic deposystems led many workers to reinterpret cyclothems previously distinguished in
the Appalachian basin as autocyclic in origin (e.g., Ferm, 1970; Donaldson, 1979). Attempts to
correlate mid-continent cycles with those in the Appalachian basin were inhibited by lack of a
detailed biostratigraphic framework for the Appalachian basin, and by the prevailing view that
eustasy would be masked or overshadowed by tectonic and/or autocyclic processes that were
not prevalent in other cratonic basins.
Paleogeographic reconstructions indicate that the Black Warrior basin drifted through
the southern tradewind belt into the equatorial rainy belt during Carboniferous (Figure 1.5)
(Scotese and Golonka, 1992). A transition from red paleosols containing thick carbonate
successions to a siliciclastic-dominated succession containing coal and underclay mark this
migration (Pashin, 1994). This transition in lithology shows a change from a semi-humid or semi-
arid climate to the everwet equatorial climate that prevailed in eastern North America during
the Early Pennsylvanian (Cecil, 1990). Pashin (1994, 1998) defined 13 regionally extensive
9
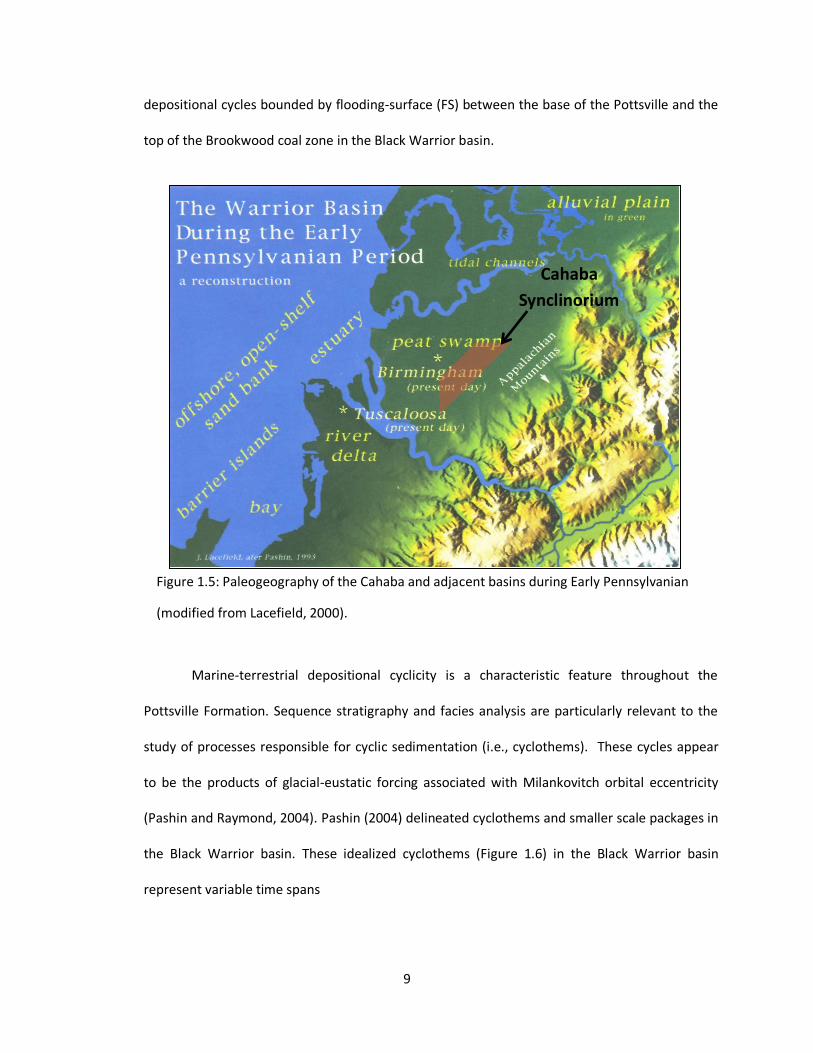
depositional cycles bounded by flooding-surface (FS) between the base of the Pottsville and the
top of the Brookwood coal zone in the Black Warrior basin.
Figure 1.5: Paleogeography of the Cahaba and adjacent basins during Early Pennsylvanian
(modified from Lacefield, 2000).
Marine-terrestrial depositional cyclicity is a characteristic feature throughout the
Pottsville Formation. Sequence stratigraphy and facies analysis are particularly relevant to the
study of processes responsible for cyclic sedimentation (i.e., cyclothems). These cycles appear
to be the products of glacial-eustatic forcing associated with Milankovitch orbital eccentricity
(Pashin and Raymond, 2004). Pashin (2004) delineated cyclothems and smaller scale packages in
the Black Warrior basin. These idealized cyclothems (Figure 1.6) in the Black Warrior basin
represent variable time spans
Cahaba
Synclinorium
10
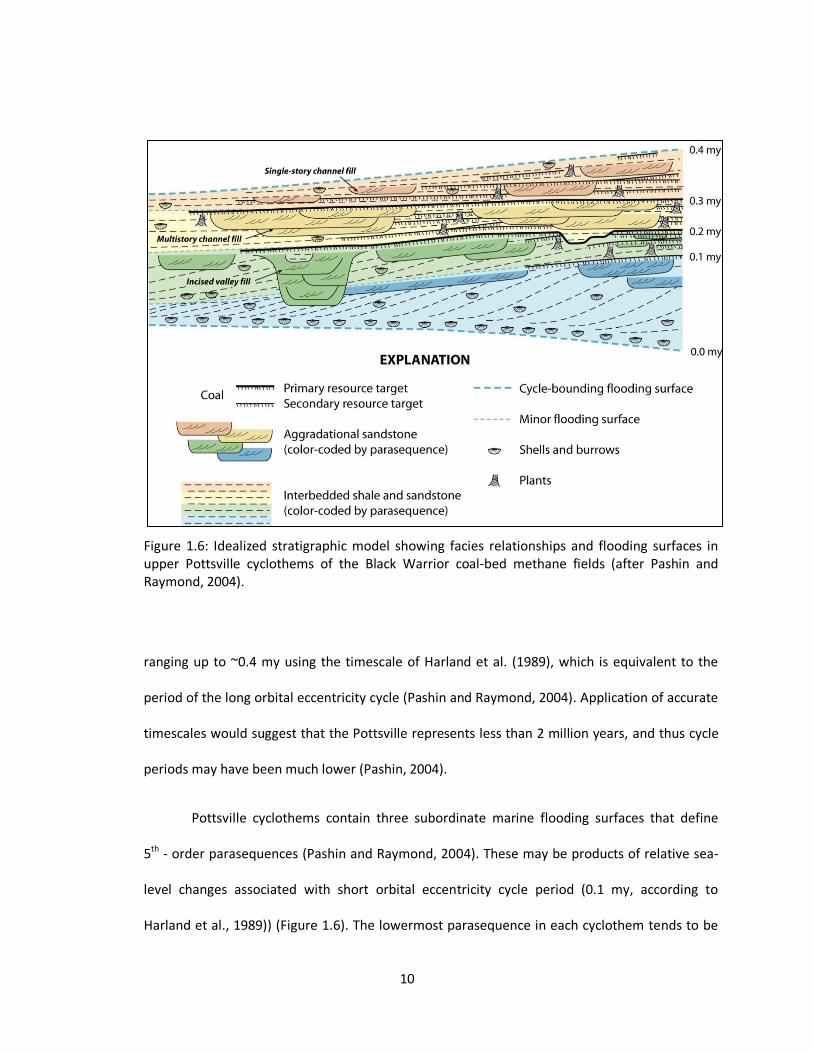
Figure 1.6: Idealized stratigraphic model showing facies relationships and flooding surfaces in upper Pottsville cyclothems of the Black Warrior coal-bed methane fields (after Pashin and Raymond, 2004).
ranging up to ~0.4 my using the timescale of Harland et al. (1989), which is equivalent to the
period of the long orbital eccentricity cycle (Pashin and Raymond, 2004). Application of accurate
timescales would suggest that the Pottsville represents less than 2 million years, and thus cycle
periods may have been much lower (Pashin, 2004).
Pottsville cyclothems contain three subordinate marine flooding surfaces that define
5th - order parasequences (Pashin and Raymond, 2004). These may be products of relative sea-
level changes associated with short orbital eccentricity cycle period (0.1 my, according to
Harland et al., 1989)) (Figure 1.6). The lowermost parasequence in each cyclothem tends to be

11
dominated by progradational deltaic deposits. The second and third parasequences contain a
higher proportion of aggradational deposits and include incised valley fills as thick as 33 m
overlain by widespread reservoir coal beds as thick as 3 m. The uppermost parasequences
commonly contain transgressive tidal deposits.
12
CHAPTER 2: METHODS
2.0 INTRODUCTION
Sequence stratigraphy is a revolutionary paradigm in the field of sedimentary geology.
The concepts embodied by this discipline have resulted in a fundamental change in the way
geologists approach facies and stratigraphic analysis. In this study, sequence stratigraphic
analysis started by describing core leading to lithofacies analysis. After lithofacies identification,
depositional environments were recognized, bounding discontinuities were identified, and
genetic sequences were delineated. In the end, a sequence stratigraphic model for the study
area was formulated.
2.1 CORE DESCRIPTION
Two cores named SWEPI (Shell Western Exploration and Production Inc.) 1 (T24N-R9E
Sec.29) and 2 (T24N-R9E Sec.30) (Figure 1.2) were provided for study in the core repository of
the Geological Survey of Alabama in Tuscaloosa, Alabama. Both cores were drilled near the
southeastern corner of the Cahaba synclinorium in Shelby County, Alabama. Core SWEPI 1
contains a continuous 1030-ft section (140 to 1170 ft subsurface), whereas core SWEPI 2 is a
~4009-ft section (500 to 4509 ft subsurface). Initially, dominant rock types, sedimentary
structures and textures were documented to produce a graphic log of each core. Due to a large
number of missing intervals in core SWEPI 1, only SWEPI 2 was used to produce complete
graphic log (Figure 2.1). Later, more detailed observations (grain-size variations, fossil content)
were added to facilitate facies analysis.

13
F
i
g
u
r
e
2
.
1
:
C
o
m
b
i
n
e
d
Figure 2.1: Graphic log of the Pottsville Formation in SWEPI 2 core in the Cahaba synclinorium.

14
2.2 FACIES ANALYSIS
Facies analysis is a fundamental sedimentological method of characterizing bodies of
rocks with unique lithological, physical, and biological attributes relative to all adjacent deposits
(Walker, 1984; Catuneanu, 2003). Lithofacies in the two cores were identified on the basis of
dominant rock types, colors, bedding styles, sedimentary structures, and fossil content. Eight
lithofacies were identified from the two cores using these criteria.
2.3 DEPOSITIONAL ENVIRONMENT ANALYSIS
Each of the eight lithofacies records either one or several environments of deposition.
Paleoenvironments were interpreted based on the review of relevant publications (McCabe,
1977; Miall, 1978; Middleton, 1978; Walker, 1984; Reineck and Singh, 1986; Shanley and
McCabe, 1991; Reading, 1996; Nichols, 1999) as well as case studies from the Appalachian
basins and areas with similar geological settings (Gastaldo, 1994; Mars, 1995; Pashin, 1997;
Pashin and Carroll, 1999; Gastaldo et al., 2006; Thomas, 2007, Greb et al., 2008).
2.4 SANDSTONE PETROGRAPHY
Sandstone petrography was used to identify provenance of source rocks as well as to
test Lawton’s (2003) approach to deciphering major changes in depositional environments.
Twenty-six intervals were selected for sampling based on visible changes in textural and
sedimentological character through the sections. Twenty-one samples were collected from the
conglomerate measures, whereas five were collected from the underlying mudstone measures.
Most samples are medium-grained sandstone collected from upper sandstone-dominated parts
of core SWEPI 2. Thin sections were commercially prepared and were studied with a
petrographic microscope (Olympus BH-2 BHTP). Grains were counted with the aid of the

15
software Nikon Elements. At least 300 grains were counted for each slide by using the Gazzi-
Dickinson method, which minimizes the control by grain size on sand composition (Dickinson
and Suczek, 1979). Careful attention was paid to the classification of lithic fragments and
feldspar types (Pettijohn et al., 1973; Uddin and Lundberg, 1998).
Compositional parameters (Table 1) distinguished during point counting include: Qt =
total quartz; Qm = monocrystalline quartz grains; Qp = polycrystalline quartz grains, including
chert grains; F = total feldspar grains; P = plagioclase feldspar grains; K = potassium feldspar
grains; L = total lithic fragments; Lt = total unstable lithic fragments; Ls = sedimentary lithic
fragments; Lv = volcanic lithic fragments; Lm = metamorphic lithic fragments.
All twenty-six samples were collected from various sandstone lithofacies. Petrofacies
assemblages were studied to see if there are significant systematic changes that can be linked to
major changes in depositional environments. Petrographic studies also were used to emphasize
grading trends (fining- vs. coarsening-upward). Vertical profiles were studied to distinguish
progradational and retrogradational trends in marine successions, and to outline fluvial
depositional successions in non-marine deposits.

16
Table 1: Modal parameters of sand and sandstones determined in this study (Dickinson and Suczek, 1979; Dorsey, 1988).
Qt = Qm + Qp, where
Qt = total quartz grains
Qm = monocrystalline quartz (>0.625 mm)
Qp = polycrystalline quartz (or chalcedony)
Feldspar Grains (F = P + K)
F = total feldspar grains
P = plagioclase feldspar grains
K = potassium feldspar grains
Unstable Lithic Fragments (Lt = Ls + Lv + Lm)
L = total lithic fragments
Lt = total unstable lithic fragments (L + Qp)
Lv = volcanic/metavolcanic lithic fragments
Ls = sedimentary/metasedimentary lithic fragments
Lm= metamorphic lithic fragments
Recalculated
Recalculated
Recalculated

17
CHAPTER 3: LITHOFACIES DESCRIPTIONS
3.0 INTRODUCTION
Eight distinct lithofacies were identified in the two cores based on rock types, colors,
bedding styles, sedimentary structures, and fossil content (Table 2). Some of these eight
lithofacies were further subdivided into sub-lithofacies, which aid in identifying relevant
depositional environments. In addition, an attempt has been made to distinguish key
stratigraphic elements and surfaces/horizons based on lithofacies descriptions. These elements
and surfaces/horizons have been described in detail in chapter 6. The eight lithofacies are as
follows:
3.1 CONGLOMERATE LITHOFACIES
This lithofacies is composed of variegated pebbles within dark to light gray, massive,
planar laminated or cross-bedded sand matrix (Figure 3.1). The dominant rock type of this
lithofacies is clast- and matrix-supported litharenitic conglomerate with abundant
extraformational and intraformational lithoclasts. The former include chert, granite, basalt, and
volcanic clasts. The latter include siderite nodules, shale rip-up clasts, coal spur, and sandstone.
Extraformational conglomerates form the bases of major fining-upward successions.
These successions have numerous smaller-scale fining-upward sequences that are composed of
clast-supported conglomerate at the base and matrix-supported conglomerate at the upper part
(Figure 3.2). Matrix-supported conglomerates (paraconglomerates) lack internal bedding but
locally show clast imbrication. Individual paraconglomerate beds vary from 3 to 10 cm in

18
thickness. In contrast, clast-supported conglomerates (orthoconglomerates) show horizontal
stratification and clast imbrication. Some beds are lenticular and exhibit erosional bases. These
beds are 3 to 6 cm in thickness and contain tabular cross-bedding. Matrix between clasts in both
types of conglomerates is medium to coarse grained, light gray to medium dark gray sand.

19
Table 2: Summary of the identified lithofacies descriptions and architecture.
No. Lithofacies Sublithofacies Major rock types
Sedimentary structures
Fossils Biogenic activity
Underlain by
Overlain by
LF 1 Conglomerate 1.Orthoconglomerate 2.Paraconglomerate
Lithoclasts, Sandstone
matrix
Massive, horizontal lamination in
sandstone
No No LF 3 LF 2
LF 2 Sandstone 1. Trough and planar-tabular cross bedded 2.current-ripple cross-laminated
3.massive sandstone with lamination, 4.thinly interbedded with
mudstones.
Sandstone Massive, horizontal laminations, current
ripple cross lamination
No No LF 1/LF 3/LF 5/LF7
LF1/LF 3 LF 5/ LF7
LF 3 Rooted mudstone and
siltstone
Mudstone and gritty siltstone
Fissile, horizontally laminated mudstone Massive thin bed of
sandstone
No Rootcasts LF 2 LF 2/LF 4
LF 4 Coal 1.Thin, extended 2. Thick, local
Coal Massive to horizontally laminated
Plant Rootcasts LF 3/LF 7 LF 2
LF 5 Wavy bedded shale and sandstone
Shale and lithic arenite
Wavy, lenticular, and flaser bedding
Plant Burrows LF 2/LF 7 LF 2/LF 7
LF 6 Graded sandstone and
shale
Sandstone and shale
Graded bedding, horizontal lamination,
cross bedding
No Rootcasts LF 2 LF3/LF 4
LF 7 Burrowed mudstone
Mud, thin
sandstone
Horizontal lamination Marine Burrows (very few).
LF 2 LF2/LF 3
LF 8 Shelly sandstone and
shale
Shale and Sandstone
Massive to horizontal lamination in shale.
Minor cross lamination in
sandstone
Marine
Burrows LF 2 LF 5

20
Figure 3.1: Clast-supported
conglomerate from 784 ft
(left) and 3819 ft (right).
Clasts are dominated by
siderite (brown), shale
(gray), basalt (black), and
sandstone (light gray).
Coins are used for scale.
UP UP

21
Figure 3.2: Schematic diagram
illustrating the general
distribution of different
conglomerate sublithofacies in
typical fining upward
succession (not scaled).

22
3.2 SANDSTONE LITHOFACIES
The sandstone lithofacies is characterized by dark to light gray, coarse to fine-grained
lithic sandstone. Bed thickness varies from 6 to 25 ft. Siderite occurs as isolated nodules and
pebbles. Rip-up clasts composed primarily of shale are also present. Coal spar occurs locally
throughout the lithofacies (Figures 3.3, 3.4). Grains are angular to subrounded, and moderately
sorted. This lithofacies is divided into following four sublithofacies based on sedimentary
structures.
(1) Trough and planar-tabular cross bedded sandstone- This sublithofacies is found at
the bases of channel-fill deposits associated with conglomerate lithofacies.
(2) Current-ripple cross-laminated sandstone - Sandstones of this sublithofacies are
composed of fine-grained sand that is comparatively more micaceous and carbonaceous and
typically exhibits reactivation surfaces and mud-draped foresets.
(3) Massive sandstone with minor horizontal lamination -This sublithofacies contains
thin layers (3-5 cm) of intraformational conglomerate dominated by siderite nodules and shale
pebbles.
(4) Sandstones thinly interbedded with mudstones – In this sublithofacies, sandstones
are medium grained and show grading, parallel lamination and in some cases lenticular bedding.
Interbedded mudstones are commonly rooted.
23
Figure 3.3: Trough cross-bedded
coarse-grained sandstone from 2729
ft (left, core length is 6 inches) and
massive sandstone from 1189 ft
(right). Organic material and/or
opaque minerals appear as dark spots.
UP UP

24
Figure 3.4: Schematic diagram of different sublithofacies of sandstone lithofacies in a typical
fining-upward succession (not scaled).
25
3.3 ROOTED MUDSTONE AND SILTSTONE LITHOFACIES
This lithofacies, which varies from 0.5 to 3 feet thick, includes fissile, mottled,
horizontally laminated dark to light gray, organic rich, rooted mudstone (underclay) (Figure 3.5)
with thin interbeds of light gray siltstone. Rootcasts are a prominant character of this lithofacies.
Erect plant fossils, leaf impressions, coal spar, and isolated bedded or nodular siderite are also
common (Figure 3.6). This lithofacies is overlain most commonly by coal layers and underlain by
sandstone. Root casts are more prominent and abundant, and siltstones are less common,
immediately below the coal layers. Slickensides found along several planes in the lithofacies may
indicate compaction related to pedogenesis.
Figure 3.5: Underclay with
rootlets from 2527 ft (left, core
length is 6 inches) and
horizontally laminated coal from
1228 ft (right, core length is 5.2
inches).
UP UP

26
Figure 3.6: Rooted
mudstone and
siltstone (left, 1811
ft.). Rooted mudstone
(right, 3619 ft.). Roots
s
Roots
UP UP

27
3.4 COAL LITHOFACIES
This lithofacies refers to black to dark gray, massive to horizontally laminated coal with
rootlets. Coal lithofacies can be found throughout the cored depth with thicknesses ranging
from 2 to 5 feet. Although coal beds were removed from the core for desorption testing, their
positions in the core are noted in core logs and supporting geophysical well logs. Log data shows
some thin discontinuous as well as regionally extensive coal beds in the Cahaba synclinorium.
Coals may be underlain by burrowed shale lithofacies in deeper part of the core. However, they
are usually underlain by rooted mudstone and siltstone lithofacies.
3.5 WAVY BEDDED SHALE AND SANDSTONE LITHOFACIES
This lithofacies is characterized by thinly interbedded dark gray mudstone and light gray,
structureless to horizontally laminated, current-ripple cross-laminated or convolute laminated,
fine- to medium-grained lithic sandstone (Figure 3.7). Thickness of this lithofacies varies from 8
to 14 ft. Lithic arenite and mudstone are evenly distributed and form flaser and lenticular
bedding. Bedding within the lithofacies changes upsection from lenticular to wavy and to flaser
bedding. Localized burrows and root casts similar to those in the rooted mudstone and
burrowed shale lithofacies occur throughout this lithofacies. Siderite nodules occur in isolated
horizontal layers. This lithofacies is usually overlain by rooted mudstone and underlain by the
sandstone lithofacies.

28
UP
UP UP
Figure 3.7: Sand lenses within
wavy bedding (left core, 3934 ft),
sand lenses within flaser bedding
(middle core, 4336 ft), and typical
wavy bedding with load casts
(right core, 4386 ft).
UP

29
3.6 GRADED SANDSTONE AND SHALE LITHOFACIES
This lithofacies contains graded sandstone-to-shale beds (Figure 3.8). These beds
resemble wavy beds, but grading is obvious and the beds tend to be planar. This lithofacies is
relatively rare in the SWEPI cores but when it occurs it is mostly associated with rooted
mudstone (Figure 3.9).
Figure 3.8: Graded sandstone and
shale (4446 ft). Core length is 7 inches.
Arrows indicate coarsening upward
successions.
UP
Figure 3.9: Schematic diagram of
graded sandstone and shale
associated with rooted mudstone and
coal.

30
3.7 BURROWED MUDSTONE LITHOFACIES
This lithofacies is characterized by fissile, horizontally laminated, black to dark gray and
light gray, locally burrowed mudstone with marine fossils and thinly interbedded sandstone.
Sandstones commonly exhibit unidirectional current-ripple cross lamination and/or convolute
lamination. Localized siderite bands and nodules, rip-up clats, and coal spar are characteristic of
this lithofacies (Figure 3.10).
This lithofacies contains vertical and horizontal burrows with lengths of 2 to 3 cm and
diameters of 0.2 to 0.5 cm. Burrows are filled mostly by fine-grained light gray sand. This
lithofacies is usually overlain by the rooted mudstone and siltstone lithofacies, but rarely is
overlain by coal.

31
Figure 3.10: Horizontally laminated mudstone and thin interbeds of sand with burrows
(left, 4227 ft, right, 4240 ft).
Burrow
Burrows
UP
Burrows
UP

32
3.8 SHALE AND SHELLY SANDSTONE LITHOFACIES
This lithofacies is characterized by thinly laminated, fissile, dark gray to very dark gray
shale with very thin sandstone interbeds, siderite bands, and layers of marine skeletal remains.
At the first glance, this facies looks similar to the wavy bedded shale and sandstone lithofacies.
However, sand layers are very thin and isolated within massive dark shale and mudstone (Figure
3.11). The absence of intense burrowing differentiates this lithofacies from burrowed mudstone
lithofacies. This lithofacies usually is overlain by wavy bedded shale and sandstone and
underlain by the sandstone lithofacies. Strata representing this lithofacies are 5 to 11 ft thick.
Figure 3.11: Laminated,
very dark shale with thin
layers of isolated sand.
Brown siderite banding
(SB) and some burrows
are present. Core is from
3208 ft.
SB
SB
UP

33
This lithofacies contains marine invertebrate body fossils, including brachiopods (e.g.,
Productus semireticulatus) (Figure 3.12), localized small-scale load casts, slump structures,
syndepositional faulting, and burrows. Burrows are filled with fine-grained sand.
Fine- to very fine-grained sandstone mostly occurs as very thin layers encased within
shale. Although the sandstones are mostly structureless, some isolated lenses contain
unidirectional cross-lamination.
Based on identified lithofacies in core SWEPI 2, a graphic log showing vertical
distribution of lithofacies is provided in figures 3.13 and 3.14.
Figure 3.12: Productus
semireticulatus fossil in
shale and shelly sandstone
lithofacies. The core is
from 2730 ft.
34
Figure 3.13: Identified lithofacies in the lower part of core SWEPI 2.

35
Figure 3.14: Identified lithofacies in the upper part of core SWEPI 2.

36
CHAPTER 4: PETROGRAPHY
4.0 INTRODUCTION
The modal composition of the studied Pottsville sandstone samples is Q63F11L26 (Tables 3,
4). According to Folk’s (1980) classification, the sandstones examined in this study are
dominantly feldspathic litharenites and litharenites (Figure 4.1). Quartz grains are subrounded
to subangular, and both monocrystalline (Figure 4.2 A) and polycrystalline grains (Figure 4.2 B)
are common along with detrtital chert. Both plagioclase and K-feldpar are observed in significant
amounts, and plagioclase feldspar is more abundant than K-feldspar (Tables 3, 4). Sedimentary
lithic fragments are dominant. Metamorphic rock fragments (Figure 4.3 B) are predominantly
schistose. Volcanic fragments are least common among the lithic fragments and are particularly
uncommon in samples from the lower part of the core (Tables 3, 4). Muscovite is a relatively
abundant accessory mineral, ranging from 2 to 4% of the total sandstone.
Based on modal composition, two out of four distinct petrofacies proposed by Lawton
et al. (2003) have been identified in the studied core (Figure 4.4). The lower 600 feet are
identified as the quartzolithic (mean Qt77F6L17) petrofacies and the top 2300 feet are identified
as the quartzofeldspatholithic (mean Qt60F12L28) petrofacies (Figure 4.4).

37
4.1 QUARTZOLITHIC PETROFACIES (mean Qt77F6L17)
The quartzolithic petrofacies identified in the lower 600 feet of the studied section (part
of mudstone measures) is generally more quartzose (Figures 4.5-4.7). This section includes
significant amounts of sedimentary lithic fragments; feldspar and volcanic lithic fragments are
rare (Figures 4.6, 4.8) (Table 3, 4). This petrofacies contains mostly monocrystalline quartz with
abundant chert. Feldspar contents average 6 percent of the framework population and both
plagioclase and K-feldspar occur roughly in equal amounts (except in sample 26). Sedimentary
lithics (e.g., argillites) dominate over metamorphic lithics, and volcanic lithic grains are rare or
absent.
4.2 QUARTZOFELDSPATHOLITHIC PETROFACIES (mean Qt60F12L28)
The upper 2300 feet of the core (conglomerate measures) is identified as the
quartzofeldspatholithic petrofacies. While dominated by quartz, the quartzolithic petrofacies
contains comparatively more feldspars and lithic fragments (Figures 4.5-4.7) (Table 3, 4). Like
the quartzolithic petrofacies, quartz grains are dominated by monocrystalline types. Plagioclase
feldspar is more abundant than K-feldspar. Metamorphic and sedimentary lithic grains
(including argillite, siltstone, and phosphatic grains) are relatively more abundant then volcanic
lithic grains (mostly basaltic). Chert grains contain rare recrystallized fossils originally composed
of calcium carbonate, indicating an origin by replacement of carbonate rocks.
Ternary diagrams of the major components (monocrystalline grains and fine-grained
lithic fragments) indicate that all sandstones were derived from a recycled orogen (Figures 4.9).
The high proportions of quartz and limited feldspars (Tables 3, 4) in the quartzolithic petrofacies
show high sediment maturity, which is an indication of longer distance from the source terrane

38
and/or intense reworking. The less mature quartzofeldspatholithic petrofacies, with higher
feldspar and lithic contents reflects less reworking and a different source area close to the basin.
Difference in compositional maturity between the petrofacies may indicate that the
basin was at downstream or distal end of a transportation system during deposition of the lower
section whereas the upper section received sediments from a proximal source.

39
Table 3: Raw point-count data of sandstones from two measures of the Lower Pennsylvanian Pottsville Formation (green samples from conglomerate measures, red ones from mudstone measures) from core SWEPI 2.
Sample Depth (ft) Qm Qp P K Ls Lv Lm
SN1 89 156 15 25 5 50 10 39
SN2 100 141 36 28 6 56 8 26
SN3 200 129 54 42 0 41 15 18
SN4 230 153 27 32 1 30 9 49
SN5 280 150 27 35 4 42 9 33
SN6 355 147 30 13 17 56 6 32
SN7 380 144 24 43 5 43 8 34
SN8 440 156 24 24 9 30 14 44
SN9 510 135 36 21 9 30 12 57
SN10 800 150 21 26 8 39 18 38
SN11 960 135 42 26 7 26 24 40
SN12 1050 162 21 24 0 38 28 27
SN13 1120 174 12 42 0 53 7 12
SN14 1210 171 12 37 5 31 22 23
SN15 1257 168 9 52 5 18 15 33
SN16 1300 156 24 20 10 34 37 19
SN17 1400 156 12 28 14 43 18 29
SN18 1500 150 21 26 16 30 26 30
SN19 1584 162 24 18 4 20 25 48
SN20 1734 144 51 21 3 26 11 45
SN21 2097 150 51 25 11 9 9 45
SN22 2110 174 57 4 2 34 3 26
SN23 2398 216 21 5 10 43 0 5
SN24 2512 234 12 11 4 23 9 7
SN25 2634 216 9 5 19 37 6 8
SN26 2845 174 30 30 6 36 2 22

40
Table 4: Normalized modal compositions (in %) of sandstones from two measures of the Lower Pennsylvanian Pottsville Formation. Green samples (SN1 to SN21) are from conglomerate measures and red samples (SN22 to SN 26) are from mudstone measures.
Sample Qt F L Qm F Lt Qm P K Ls Lv Lm
SN1 57 10 33 52 10 38 84 13 3 51 10 39 SN2 59 11 30 47 11 42 81 16 3 62 9 29 SN3 61 14 25 43 14 43 75 25 0 56 20 24 SN4 60 11 29 51 11 38 82 17 0 34 10 56 SN5 59 13 28 50 13 37 79 19 2 50 11 39 SN6 59 10 31 49 10 41 83 7 10 60 6 34 SN7 56 16 28 48 16 36 75 23 3 51 9 40 SN8 60 11 29 52 11 37 83 12 5 34 16 50 SN9 57 10 33 45 10 45 82 13 6 30 12 58
SN10 57 11 32 50 11 39 82 14 4 41 19 40 SN11 59 11 30 45 11 44 80 16 4 29 27 44 SN12 61 8 31 54 8 38 87 13 0 41 30 29 SN13 62 14 24 58 14 28 81 19 0 74 10 16 SN14 61 14 25 57 14 29 80 18 2 41 29 30 SN15 59 19 22 56 19 25 75 23 2 27 23 50 SN16 60 10 30 52 10 38 84 11 6 38 41 21 SN17 56 14 30 52 14 34 79 14 7 48 20 32 SN18 57 14 29 50 14 36 78 14 8 35 30 35 SN19 62 7 31 54 7 39 89 10 2 21 27 52 SN20 65 8 27 48 8 44 86 12 2 32 13 55 SN21 67 12 21 50 12 38 81 14 6 14 14 72 Mean 60 12 28
SN22 77 2 21 58 2 40 97 2 1 54 5 41 SN23 79 5 16 72 5 23 94 2 4 90 0 10 SN24 82 5 13 78 5 17 94 5 2 60 23 17 SN25 75 8 17 72 8 20 90 2 8 73 11 16 SN26 68 12 20 58 12 30 83 14 3 60 3 37 Mean 76 6 18
Mean
63 11 26 54 11 35 83 13 4 16 16 37 St. Dev.
7 4 6 8 4 8 6 6 3 18 10 15

41
Figure 4.1: Composition of Pottsville sandstone based on Folk’s (1980) classification scheme. Red
and blue fields represent quartzolithic and quartzofeldspatholithic petrofacies, respectively.
QtFLdataset
Average
Q
L
Quartzarenite
Subarkose
Arkose Lithic Arkose
Feldspathic Litharenite
Litharenite
95 95
75 75
25 50
Sublitharenite
F

42
Figure 4.2: Representative photomicrographs of Pottsville sandstone (A) with rounded to sub-angular monocrystalline grains (Qm), polycrystalline quartz (Qp), plagioclase feldspar (Plag), sedimentary (Ls) and metamorphic lithic (Lm) fragments (sample SN-4 from quartzofeldspatholithic petrofacies, crossed polars) and (B) with detrital chert and polycrystalline quartz grains (Qp) among lithic grains (Ls) (sample SN-22 from quartzolithic petrofacies, crossed polars).
B
A
43
Figure 4.3: Representative photomicrographs of Pottsville sandstone (A) with volcanic clast (Lv), low-grade metamorphic clast (Lm), and polycrystalline quartz (Qp) (sample SN 16 from quartzofeldspatholithic petrofacies, crossed polars) and (B) with very low- to low-grade metamorphic fragments (Lm) (sample SN-14 from quartzofeldspatholithic petrofacies, crossed polars).
B
A
Lm

44
Figure 4.4: Distribution of petrofacies assemblages. The quartzolithic assemblage and the
quartzofeldspatholithic assemblage correspond to the mudstone and conglomerate measures,
respectively. Red dots represent sample-collection levels.

45
Figure 4.5: Profile plot of changes in percentages of total quartz (Qt), feldspar (F), and lithic
fragments (L) through the Pottsville Formation in the Cahaba Basin.
Quartzofeldspatholithic
Quartzolithic
46
Figure 4.6: Profile plot of changes in percentages of monocrystalline quartz (Qm), feldspar (F),
and total lithic fragments (Lt) through the Pottsville Formation in the Cahaba Basin. Chert and
polycrystalline quartz are included in total lithic fragments.
Quartzofeldspatholithic
Quartzolithic

47
Figure 4.7: Profile plot of changes in percentages of monocrystalline quartz (Qm), plagioclase
feldspar (P), and potassium feldspar (K) through the Pottsville Formation in the Cahaba Basin.
Quartzofeldspatholithic
Quartzolithic

48
Figure 4.8: Profile plot of changes in percentages of sedimentary (Ls), volcanic (Lv), and
metamorphic (Lm) lithic fragments through the Pottsville Formation in the Cahaba Basin.
Quartzofeldspatholithic
Quartzolithic
49
Figure 4.9: QtFL plot showing modal composition of Pottsville sandstones from the SWEPI 2 core of Cahaba Basin. Provenance fields are from Dickinson (1985). Standard deviation polygon is drawn around the mean (shown as a red dot). Qt=total quartz; F=feldspar; L=lithic grains.
Qt
F L
Recycled orogeny
Undissected Arc
Craton Interior
Transitional
Continental
Basement
Uplift Dissected
Arc
Transitional Arc
50
CHAPTER 5: ENVIRONMENTS OF DEPOSITION
5.0 INTRODUCTION
Depositional environment plays a vital role in defining the physical characteristics of a
facies. A subjective attempt is made here to interpret the depositional environments (Figure 5.1,
Table 5) of the identified lithofacies and sublithofacies, based on previously published criteria
(Miall, 1978; Reineck and Singh, 1986; Pashin et al., 1995; Reading, 1996; Pashin and Carroll,
1999).
5.1 CONGLOMERATE LITHOFACIES
Conglomerate lithofacies in the upper and lower conglomerate measures have been
interpreted to represent bedload-dominated fluvial deposits (Osborne, 1988, 1991; Demirpolat,
1989) (Figure 5.1). Matrix-supported conglomerates (paraconglomerate) with minor clast
imbrication suggest hyper-concentrated sheet floods, especially where the units are tabular and
interbedded with finer sediments. Clast-supported conglomerates (orthoconglomerate),
especially lenticular units with erosive bases, are stream bedload deposits (Reading, 1996).
Horizontal stratification and prominent clast imbrication indicate near-horizontal pavement
deposition either on top of braid bars or as channel-floor lags (Nemec and Postma, 1993).
Intraformational clasts are associated with erosion of overbank floodplain deposits during
channel migration (Reading, 1996). Extraformational clasts are concentrated in lags on scoured
surfaces or on bar tops (Reineck and Singh, 1975). Extraformational conglomerates in the
conglomerate measures indicate continued unroofing of the Appalachian orogen and

51
development of an extensive alluvial plain at the end of Pottsville deposition (Osborne, 1991;
Pashin et al., 1995). Internally stacked fining-upward sequences, along with greater thicknesses
of the conglomerate lithofacies are suggestive of a composite multistory and multilateral fluvial
deposit. Bases of internally stacked fining-upward sequences associated with considerable
thickness of the conglomerate lithofacies have been identified as erosional surfaces.
Figure 5.1: Reconstruction of the clastic depositional environments of Lower Pennsylvanian
Pottsville Formation in Cahaba synclinorium, Alabama. Different colored arrows represent
depositional environments for associated lithofacies.

52
Table 5: Summary of the identified lithofacies and inferred depositional environments.
No. Lithofacies Sublithofacies Major rock types
Sedimentary structures
Fossils Biogenic activity
Environment of deposition
LF 1 Conglomerate 1.Orthoconglomerate 2.Paraconglomerate
Lithoclasts, Sandstone
matrix
Massive, horizontal lamination in
sandstone
No No 1.Hyper-concentrated sheet floods
2. Stream bedload deposits
LF 2 Sandstone 1. Trough and planar-tabular cross bedded 2.current-ripple
cross-laminated 3.massive sandstone with lamination, 4.thinly interbedded with
mudstones.
Sandstone Massive, horizontal laminations, current
ripple cross lamination
No No 1. Anastomosed fluvial system
2. Weak currents as well as high rates of
bed aggradation 3.Floodplain
4. Intertidal flats LF 3 Rooted
mudstone and siltstone
Mudstone and gritty siltstone
Fissile, horizontally laminated mudstone Massive thin bed of
sandstone
No Rootcasts Clastic swamp
LF 4 Coal 1.Thin, discontinuous 2. extensive
Coal Massive to horizontally laminated
Plant Rootcasts 1.Localized swamps 2. Widespread flooding
LF 5 Wavy bedded shale and sandstone
Shale and lithic arenite
Wavy, lenticular, and flaser bedding
Plant Burrows Tidal-flat deposits
LF 6 Graded sandstone and
shale
Sandstone and shale
Graded bedding, horizontal lamination,
cross bedding
No Rootcasts Crevasse splays and associated flood basin
LF 7 Burrowed mudstone
Mud, thin sandstone
Horizontal lamination Marine Burrows Delta-front slope or prodelta
LF 8 Shelly sandstone and
shale
Shale and Sandstone
Massive to horizontal lamination in shale.
Minor cross lamination in
sandstone
Marine
Burrows Deep water
53
5.2 SANDSTONE LITHOFACIES
The sandstone lithofacies is associated with both fluvial and tidal environments (Pashin,
1999) (Figure 5.1). Different sublithofacies based on internal sedimentary structure reflect a
range of depositional process within fluvial, deltaic, and tidal settings.
Trough and planar-tabular cross-bedded sandstone: Trough cross beds are product of
migrating three-dimensional bedforms (Reading, 1996), whereas tabular cross-bed sets are
formed by straight-crested bedforms (e.g., dunes and less commonly scroll bars and chute bars)
(McCabe, 1977). Association of these sandstone units with bed-load dominated fluvial deposits
(conglomerate lithofacies) suggests an anastomosed fluvial system (Rust and Legun, 1983,
Pashin et al., 1995).
Current ripple cross-laminated sandstone: Ripple cross-laminated sandstones reflect
relatively weak currents as well as high rates of bed aggradation (Stear, 1985). The presence of
reactivation surfaces as well as mud-draped foresets indicates water-stage fluctuations in a tidal
channel (Rust and Jones, 1987).
Massive sandstone beds with minor horizontal lamination: These deposits are usually
associated with rapid deposition from suspension during floods. These beds may form in both
channel-bar and channel-bank settings. The association of massive sandstones with prominent
ripple cross-laminated sandstones can be interpreted as anastomosed river deposits (Smith and
Smith, 1980; Rust, 1981; Nadon, 1994; Reading, 1996).
Sandstones thinly interbedded with mudstones: Sandstones with parallel lamination and
lenticular structure are interpreted to represent intertidal flats (Pashin, 1993; 1999). Graded
sandstones interbedded with rooted mudstone probably represent crevasses splays and

54
associated floodplain environments (Allen, 1965). The contact between this sublithofacies and
coal lithofacies represents erosional surface in interfluves.
5.3 ROOTED MUDSTONE AND SILTSTONE LITHOFACIES
Rooted mudstone and siltstone lithofacies usually designate clastic swamp
environments (Pashin, 1993; Diessel et al., 2000) (Figure 5.1). Although this lithofacies can form
in channels, it is mostly confined to floodplains as overbank deposits (Ékes, 1993).
Laminated mudstone and siltstone were deposited under reducing conditions, which is
evidenced by their dark color. The laminated mudstone, which contains banded and layered
siderite, is believed to be deposited from suspension on a floodplain or in abandoned channels
such as oxbow lakes (Reading, 1996). Gray massive siltstones are the result of rapid deposition
by flooding (Fielding, 1984). Floodplain deposits contain plant debris (leaf imprints) and roots.
Well-preserved organic matter reflects water-logged conditions. As a part of repetitive fining-
upward sequences, combined coal and rooted mudstone lithofacies may be overlain by
sandstone lithofacies. In these cases, tops of this lithofacies represent interfluvial erosional
surfaces.
5.4 COAL LITHOFACIES
The Pottsville coal belt in Alabama formed as a widespread system of equatorial peat
swamps (Phillips and Peppers, 1984) (Figure 5.1). High detrital ash content records dominantly
low-lying swamps. However, some low-ash coal has been attributed to doming (Eble et al.,
1994). Sulfur content is higher than 2% in coal with marine roof strata (Williams and Keith, 1963;
Casagrande, 1987), and a wide range of sulfur contents reveals that coals were preserved below
marine through terrestrial roof facies. The variable thickness and extent of Pottsville coal beds

55
further points to diverse origins (Pashin and Gastaldo, 2009). Many of the thin, discontinuous
beds are interpreted to be the products of localized swamps. These beds were prone to erosion
or pass laterally into contemporaneous siliciclastic facies. In contrast, regionally extensive coal
beds provide evidence for widespread flooding and water-clogged environments (paludification)
in the coastal plain (Diessel, 1998). Bases of this lithofacies represent correlative surfaces on
interfluves for the basal erosional discontinuity of major channel fill deposits.
5.5 WAVY BEDDED SHALE AND SANDSTONE LITHOFACIES
This lithofacies is typical of tidal-flat deposits (Figure 5.1). Tidal flats form along
stretches of shoreline and their extent depends on tidal range, sedimentary supply and
shoreline gradient (Nichols, 1999).
The combination of mud and relatively fine-grained sand records a mixed intertidal flat
environment for this lithofacies. Relatively fine-grained sediments are retained here by the
process of flocculation and settling (Reading, 1996). Mixed mud and sand reflect roughly equal
contributions of suspension and bedload deposition. So, with decreasing mud proportion
upsection, lenticular bedding changes to wavy bedding and wavy bedding changes to flaser
bedding (Reineck and Wunderlich, 1968).
Lenticular bedding is composed of isolated ripples of sand completely surrounded by
mud. These are produced when sand ripples are formed on muddy substratum and preserved as
a result of deposition of the next mud layer (Reineck and Singh, 1975). Flaser bedding is
characterized by isolated drapes of mud within cross-laminated sand. Sand is deposited during
periods of current activity, while mud is deposited during current pauses in ripple troughs or
completely covering the ripples (Nichols, 1999). During the next tidal cycle, ripple crests are
eroded away and more sand is deposited as ripples, burying and preserving ripple beds with

56
mud flasers in the troughs. Bifurcated flasers form when previously and newly formed flasers
are in contact, indicating stronger intermittent reworking than simple flaser bedding (Reineck
and Singh, 1986). Intermediate forms called wavy bedding, made up of approximately equal
proportions of sand and mud, reflect equal contributions of suspension and bedload deposition
(Reineck and Singh, 1975). In association with burrowed mudstone, this lithofacies demarcates
ravinement surfaces.
5.6 GRADED SANDSTONE AND SHALE LITHOFACIES
The graded sandstone and shale associated with rooted mudstone are interpreted as
crevasse splays and associated floodplain deposits (Figure 5.1). Graded beds are common in
Pottsville delta-front deposits (Pashin, 1999; Greb et al., 2004) but are relatively rare in the
SWEPI cores.
5.7 BURROWED MUDSTONE LITHOFACIES
This lithofacies is interpreted to be the product of slow deposition of suspended
sediments in areas unaffected by wave or tidal processes, such as a delta-front slope or prodelta
(Figure 5.1). Prodelta environments are closely associated with prograding delta systems. They
comprise relatively stable zones where fine-grained river sediments carried in a buoyant plume
are deposited from suspension to form well-laminated sediments (Reading and Collinson, 1996).
Thinly interbedded sands are believed to reflect short pulses of terrestrial sediment input. This
lithofacies, in association with wavy bedded shale and sandstone, defines ravinement surfaces.
5.8 SHELLY SANDSTONE AND SHALE LITHOFACIES
Interbeds of shale and very thinly laminated sand associated with localized bioturbation
record slower sedimentation rates for this lithofacies. Usually, deep-water sedimentation is

57
much slower than in shallower marine settings and results in much thinner beds (Loutit et al,
1988; Kidwell, 1989). Thus, shales in this lithofacies are interpreted as hemipelagic deposits that
accumulated on a sediment starved shelf. Fossiliferous layers formed as a result of sea-level rise
and condensation.
Based on the occurrence of hemipelagic sediments and layers of marine fossils, this
lithofacies is inferred to represent marine condensed sections. Condensed sections usually form
on the middle to outer shelf, slope, and basin floor during periods of maximum relative sea-level
rise and maximum transgression of the shoreline (Loutit et al, 1988; Nichols, 1999) (Figure 5.1).
Maximum flooding surfaces occur within the condensed sections.
5.9 VERTICAL DISTRIBUTION OF PALEOENVIRONMENTAL REGIMES
Inferred depositional environments from the Pottsville Formation encountered in the
SWEPI2 core represent a progression from tidal/deltaic to terrestrial sedimentation. Stacked
coarsening upward cycles in the lower part (mudstone measures) of core SWEPI2 represents
dominantly tidal and deltaic environments. A few prominent marine zones record transgression
of sea over tidal or deltaic deposits (Figure 5.2). The major shift from tidal/deltaic to dominantly
terrestrial environments is indicated by the appearance of fluvial and clastic swamp deposits at
the top (2000 to 2450 ft) of the lower part of the core.
The upper part of the core (conglomerate measures) mainly represents stacked fining-
upward cycles deposited in fluvial and clastic swamp environments (Figure 5.3). Multistory
channel fills with common amounts of unstable grains (feldspars) represent a terrestrial setting
where the source was close and sediments were distributed through a bedload to mixed-load
dominated fluvial system.

58
Figure 5.2: Interpreted depositional environments in the lower part of core SWEPI 2.
CLS Clastic swamp

59
Figure 5.3: Interpreted depositional environments in the upper part of core SWEPI 2.
CLS Clastic swamp
60
CHAPTER 6: STRATIGRAPHIC ARCHITECTURE
6.0 INTRODUCTION
Stratigraphic architecture is the result of a complex interaction of a wide variety of
physical processes, e.g., rainfall, erosion, flood, ocean currents, waves, storms, seafloor failure,
and tectonic deformation. Identification of key stratigraphic elements within the studied cores is
crucial for the sequence stratigraphic analysis. The log and facies expression of identified
surfaces (in chapter 3) varies considerably with the paleogeographic position in the synclinorium
(Pashin, 1999, Greb et al., 2004). A combination of core, outcrop, well-log, and seismic data are
used for a detailed analysis of both lithostratigraphically and chronostratigraphically significant
surfaces and horizons (Posamentier et al., 1988; Van Wagoner et al., 1990; Bhattacharya, 1992).
The analysis in the current research is based solely on core data. Hence, identified surfaces and
horizons have only lithostratigraphic significance. Nonetheless, they at least provide an idea
about the probable occurrence and nature of base-level changes.
Based on lithofacies descriptions, inferred depositional environments, and
paleogeographic location of the studied cores, the following stratigraphic architectural elements
have been identified: Progradational elements, aggradational elements, erosional surfaces,
flooding surfaces, and condensed sections.

61
6.1 PROGRADATIONAL ELEMENTS
Upward coarsening successions represent progradational elements, which are typically
the most common architectural elements in the deltaic/tidal portion (mudstone measures) of
the Pottsville Formation (Pashin et al., 1995; Greb et al., 2004). Coarsening-upward successions
overlie fining upward successions and are highly variable in thickness, ranging from 5 to 120
feet. Higher-frequency, coarsening-to-fining upward intervals within overall coarsening upward
successions range in thickness from 1 to 50 feet (Figure 6.1). Lower-frequency successions
consist of mudstone, sandstone, conglomerate, and coal. Bases are sharp and overlain by the
shelly sandstone and shale lithofacies which is commonly succeeded by burrowed mudstone
lithofacies. This transition in lithofacies records a shift from deep-water to pro-delta
environments. The latter mudstone coarsens upward and intertongues with sandstone and
merges into sublithofacies of sandstone which form thin interbeds with mudstones. Sand and
mud interbeds form wavy, lenticular and flaser beddings under a tidal environment and are
overlain by fluvial deposits consisting of trough and planar-tabular cross-bedded, ripple
laminated, and massive sandstone sublithofacies and conglomerate lithofacies. Coal lithofacies
usually cap the coarsening-upward successions and are laterally persistent independent of the
extent of the underlying coarse-grained facies (Pashin and Carroll, 1999). Coarsening upward
cycles are typical of fluvial-deltaic deposits. Bases are ravinement surfaces formed by shoreface
erosion followed by prodelta deposition (burrowed mudstone). Interbedded tidal sand and mud
and fluvial sandstone and conglomerate represent delta-front and delta plain deposits.
Coarsening-upward successions are interpreted as deposits of prograding deltas, formed
during late stages of base-level rise through early stages of base-level fall in the Cahaba
synclinorium (Pashin et al., 1995) and adjacent Black Warrior basin (Korus, 2002; Greb and

62
Martino, 2005). An overall coarsening-upward succession may be generated by channel
avulsion, delta-lobe switching or growth faulting (Bodek, 2006). Sandstones, and in some cases
conglomerate lithofacies, of these successions are believed to be anastomosed channel deposits
(Coleman, 1976; Bhattacharya and Walker, 1992; Reading and Collinson, 1996).
These coarsening upward successions are overlain and underlain by upward-fining
intervals which are also capped by coal. Upward fining deposits (graded sandstone, rooted
mudstone, and coal lithofacies) are believed to be the product of crevasse-splay and overbank
sedimentation followed by accumulation of peat in the delta plain (Coleman, 1976).
Figure 6.1: Overall coarsening upward succession with high frequency, small-scale coarsening-fining upward successions in the Pottsville Formation of Cahaba synclinorium representing progradational elements.
2500 ft
3000 ft
mudstone lithofacies

63
6.2 AGGRADATIONAL ELEMENTS
Fluvial sequences typically show fining-upward successions that reflect aggradation in
energy-declining environments (Eberth and O’Connell, 1995; Hamblin, 1997; Catuneanu and
Elango, 2001). Fining-upward aggradation elements are the most common stratigraphic
elements in the fluvial-dominated upper part and locally in the marine-dominated lower part of
core SWEPI2. Fining-upward successions are typically 10-30 feet thick. Extraformational
conglomerates form the bases of these fining-upward sequences and grade upward to
sandstone lithofacies, which in turn grade upwards into rooted mudstone and siltstone. In the
lower part of core SWEPI2, such successions continue with the wavy bedded shale and
sandstone lithofacies. Typically the succession is capped by rooted mudstone and coal
lithofacies (Figure 6.2). Higher-frequency, coarsening-to-fining upward intervals occur within
these overall fining-upward successions. Fining-upward successions directly underlie coarsening-
upward successions.
Fining-upward successions indicate waning of flow conditions associated with base-level
rise and decreased gradients. Continuous base-level rises initiate back-flooding of incised valleys
and the formation of estuaries. The wavy bedded shale and sandstone lithofacies represents
tidally influenced sedimentation and records marine invasion into fluvial environments (Greb
and Martino, 2005). Widespread peat accumulation during stages of estuarine infill is recorded
by capping coal layers. The coal layers suggest that marine invasions were sufficient enough to
result in widespread coastal swamps (Shanley and McCabe, 1995).

64
Figure 6.2: Overall fining-upward succession with small-scale coarsening-fining upward successions in the Pottsville Formation of Cahaba synclinorium representing aggradational elements.
6.3 BOUNDING DISCONTINUITIES
Bounding discontinuities in the studied cores are either erosional (unconformable) or
depositional (condensed sections) (Walker, 1992). In addition to these two features, a few
marine zones that contain flooding surfaces have been identified. Minor erosional
discontinuities are common at the bases of isolated, lenticular sandstone bodies throughout
most of the study interval. In contrast, major discontinuities are found at the bases of the
widespread, conglomerate and amalgamated sandstone bodies.
3000
0
2500 ft
mudstone lithofacies
65
6.3.1 EROSIONAL SURFACES
Erosional surfaces in the studied cores are mainly unconformable surfaces. These
surfaces are commonly identified at the bases of channel-fill deposits (sandstone and
conglomerate lithofacies) (Figure 6.3) in the fluvial dominated upper part of the section but also
locally in the lower part of the section. Anomalously thick channel-fill deposits, and presence of
multiple channel-fill deposits clustered within a relatively small vertical section, justify the
identification of incised valleys in the studied cores. During the downward shift of the fluvial
equilibrium profile, the alluvial system responded by down cutting and channel incision. Several
factors, which include tectonic tilting, increased stream power due to increased discharge, and
increased alluvial gradient due to sea-level induced exposure of a relatively steep surface may
cause these downward shifts in equilibrium profile (Schumm, 1993; Posamentier and Allen,
1999). These surfaces are overlain by conglomerate lithofacies and underlain by rooted
mudstone lithofacies.
In the interfluves (Figure 6.3) where these channel fill bodies pinch out laterally, these
surfaces correspond with regionally persistent paleosols and coal layers (Aitken and Flint, 1995;
Greb and Chestnut, 1996; Catuneanu, 2003). Simple discontinuities created by the shift of
channels, including in some cases channel avulsion, create erosional surfaces on flood plains
that are not associated with regional channel incision. These surfaces typically are overlain by
graded sandstone sublithofacies or coal lithofacies and underlain by rooted mudstone
lithofacies. The lack of channel clustering on top of these discontinuities differentiates these
surfaces from incised valley bottoms.
Ravinement surfaces are another form of erosional surface that represent scour due to
marine transgression. Most of the ravinement surfaces identified are in the lower part of the

66
Figure 6.3: Hypothetical
section across incised
valley and interfluves
representing key
stratigraphic surfaces
both distal and proximal
part of the Cahaba basin
during Early
Pennsylvanian (modified
from Posamentier and
Allen, 1999).

67
studied core and those surfaces are overlain by shallow marine facies (burrowed mudstone and
wavy bedded shale and sandstone lithofacies) (Figure 6.4). Ravinement surface formation is
linked to subaerial exposure during relative sea-level fall and subsequent transgression. Such
surfaces are characterized by deeply weathered soil horizons that were preserved if coastal and
shelf energy was weak and minimal erosion took place during shoreline transgression across the
area.
Transgressive ravinement may remove significant amounts of sediment, masking
subaerial exposure surfaces that developed during earlier phases of sea-level fall. Deposits
immediately upon these surfaces are called transgressive lag deposits. They are relatively
coarse-grained deposits that typically contain wood fragments and rip-up clasts, all of which
were derived from underlying deposits (e.g., rooted mudstone and siltstone as well as burrowed
mudstone). Deeply penetrating burrows locally characterize ravinement surfaces.
2500 ft
Figure 6.4: Ravinement
surface (rvs) overlain by
shallow marine facies in
the lower part of the
core.
rvs – Ravinement surface

68
6.3.2 FLOODING SURFACES AND CONDENSED SECTIONS
Flooding surfaces lie within the shale and shelly sandstone lithofacies, locally associated
with wavy bedded shale and sandstone lithofacies and on top of rooted mudstone and extensive
coal layers (Figure 6.5). Based on similar studies (Mars, 1995; Pashin et al., 1995; Bodek, 2006)
of Lower Pennsylvanian sequences within the Appalachian basins, these zones and associated
surfaces have been grouped into two categories; major and minor flooding zones and associated
surfaces.
Major flooding surfaces are identified within the shale and shelly sandstone and locally
on top of wavy bedded shale and sandstone lithofacies. Occurrences of the shelly sandstone and
shale lithofacies are identified as condensed sections, which represent depositional bounding
discontinuities (Walker, 1992). At the time of maximum transgression, coastal depocenters are
located at their maximum landward position. Consequently, at these times relatively slow
pelagic and hemipelagic sedimentation prevails on the middle to outer shelf and beyond. The
resulting deposits are thin and represent relatively long periods of geologic time (Loutit et al.,
1988). Condensed sections are relatively easy to identify as they are composed predominantly
of fine-grained, hemipelagic deposits that accumulated during times when minimal continental
sediments are delivered to shelf and deep-water environments (Figure 6.6). Marine flooding
surfaces are typically found within the condensed sections (Figure 6.6). In the lower part of the
core SWEPI 2, five condensed sections are identified based on the occurrence of the shelly
sandstone and shale lithofacies. In the non-marine dominated upsection of the lower core,
flooding surfaces are associated mostly with rooted mud with thinly laminated silt, barren of any
marine fauna or trace fossils. Occurrences of rooted mud with thinly laminated silt signal tidal
influences in estuaries. When identified atop wavy bedded shale and sandstone, flooding

69
surface contains straight to slightly curve horizontal burrows (Planolites). These major flooding
surfaces are laterally more extensive than their minor counterparts. Out of the five condensed
sections, three major marine flooding surfaces have been identified at 2400, 2750, and 2900 ft
based on the abundance of fossils.
Minor marine zones/flooding surfaces typically occur on top of fining-upward
successions that contain either rooted mudstone or coal lithofacies. These deposits represent
clastic swamp environment in interfluves. The minor flooding zones are thinner than their major
counterparts.
Figure 6.5: Flooding surfaces (FS) within condensed sections (CS). Condensed sections are identified by abundant fossil content within shale and shelly sandstone lithofacies.

70
Figure 6.6: Typical condensed section in shelly sandstone and shale lithofacies containing minute burrows and sand lenses. Left core is from 3608 ft and middle core is from 3731 ft. The right core, from 2900 ft, depicts a fossil lag. The marine flooding surface (MFS) is at the contact between the shale and the shelly sandstone. Surfaces within the lag mark minor events associated with reworking during marine transgression and condensation.
UP UP UP
MFS

71
CHAPTER 7: SEQUENCE STRATIGRAPHIC FRAMEWORK
7.0 INTRODUCTION
Sequence stratigraphy deals with chronologically significant, genetically related,
unconformity-bound intervals of sedimentary strata (Van Wagoner et al., 1988, 1990). Individual
sequences, which are defined as relatively conformable, genetically related, and unconformity-
bound successions of strata, are the basic building blocks of sequence stratigraphy (Mitchum,
1977). Lamina, laminasets, beds and bedsets, which are smaller-scale stratal units, comprise
progressively larger-scale stratal units including parasequences (shallowing-upward successions
bound by flooding surfaces) (Van Wagoner et al., 1988) and sequences.
This internal packaging of progressively thicker stratal units representing increasingly
greater amounts of time ultimately defines a chronostratigraphic hierarchy (Van Wagoner et al.,
1990; Mitchum and Van Wagoner, 1991). Lower-order sequences are stacked within higher-
order sequences usually in a repetitive and anticipated way. Lower-order sequences, including
parasequences, will predictably differ in facies-stacking patterns, sediment-body geometry, and
position along depositional dip (Van Wagoner et al., 1988). Stacking patterns, distribution, and
sediment-body geometry of lower-order stratal units within higher-order sequences provides
some clues for identifying the controlling factors within a given depositional system.
Depositional controlling factors (e.g., eustasy, tectonism, climate, sediment supply) influence
base-level change, which ultimately dictates development of sequences.

72
Two different sequence models have been applied in this study (Figure 7.1). They are
the depositional sequence (Vail-type sequence) and the genetic stratigraphic sequence
(Galloway-type sequence) (Van Wagoner et al., 1988; Galloway, 1989). The primary difference
between the two types is in the selection of sequence-bounding surfaces.
The Vail-type sequence was developed as a basin-analysis tool to identify rock units that
were deposited under varying conditions of eustatic sea-level change, tectonic subsidence, and
sedimentation rates on Mesozoic and Cenozoic passive margins (Mitchum et al., 1977; Haq et
al., 1988; Posamentier et al., 1988; Posamentier and Vail, 1988). A Vail-type sequence is
bounded by unconformities that are interpreted as paleogeographic surfaces produced by
basin- wide eustatic sea-level falls. Bounding surfaces or the sequence boundaries of a Vail-type
sequence could be subaerial erosional surfaces, bases of incised valleys, or correlative surfaces
on interfluves, and correlative conformities downdip.
Figure 7.1: Schematic
cross section of a Vail-
type and a Galloway-type
sequence (modified from
Galloway, 1989).

73
Galloway (1989) identified and defined genetic sequences along the Cenozoic Gulf
Coastal Plain using a sequence-bounding model to determine basin paleogeography and
sediment dispersal patterns. A genetic stratigraphic sequence is defined as a rock or sediment
unit that records a sequence of basin-margin outbuilding and filling (shoaling upward) followed
by basin-wide flooding (Galloway, 1989). The boundaries between genetic stratigraphic
sequences are identified as major marine-flooding surfaces, which occur within basin-wide
condensed sections (thin, deep-water succession containing abundant marine fossils). Marine
flooding surfaces separate sediments that were deposited in more landward depositional
settings from overlying sediments that were deposited in more seaward depositional settings
(Van Wagoner et al., 1990). Such vertical changes from landward to seaward facies are referred
to as transgressive shifts in facies.
7.1 SEQUENCE STRATIGRAPHIC INTERPRETATION OF BOUNDING DISCONTINUITIES
The framework of major and minor discontinuities, including erosional (unconformable)
horizons and marine zones, in the two cores provides a basis for evaluating the lower
Pennsylvanian strata of Cahaba synclinorium in both a depositional and genetic sequence
framework. In a genetic framework (e.g., Galloway, 1989), Pashin (1994, 1998) previously
identified at least fifteen marine flooding surfaces within marine zones in the Pottsville
Formation of the Black Warrior basin. These inferred sea-level cycles were attributed to glacial-
eustacy but the apparent magnitude of flooding and condensation may have been controlled by
subsidence rates. These marine zones separate the Pottsville Formation of the greater Black
Warrior Basin into thirteen separate depositional cycles of variable thickness (Pashin, 1994,
1998).

74
Younger Pottsville strata of greater Black Warrior basin are 308.6±2.7 Ma based on
dating of a volcanic ash bed at a drill core in Mississippi (Uddin et al., 2010a). Considering this
age as near the upper boundary of the Pottsville Formation and using the timescale of Harland
et al. (1990), the formation represents a span of 7 m.y. Recognizing the uncertainty in
Pennsylvanian geochronology (Klein, 1990; Menning et al., 2000), correspondence of
depositional cycles to orbital eccentricity may be superfluous. Still, estimates of cycle duration
using the timescale of Harland et al. (1990) tend to be longer than estimates using other
timescales, and the 7-m.y. span assigned to the Pottsville Formation is a conservative estimate.
Therefore, cycles in the upper part of the Pottsville Formation were deposited almost certainly
at the high frequencies attributed to the classic Pennsylvanian cyclothems of the North
American mid-continent (Pashin, 2004). If the 13 Pottsville cycles are assumed to represent
equal amounts of time, then each cycle was deposited in 0.5 m.y. using the timescale of Harland
et al. (1990). As variations in cycle thickness would necessitate unreasonable changes of
subsidence rates for an actively loaded foreland basin like the Cahaba basin, the assumed 0.5
m.y. time span for each cycle is almost certainly incorrect. The 13 cycles identified within the
Pottsville Formation in greater Black Warrior basin represent a range of time spans (Pashin,
2004). A model generated by doubling the subsidence rates of the Black Warrior basin in
different locations indicates an increase of time in earlier cycles, decrease in later cycles and no
time variation in middle cycles (Pashin, 2004). The Pottsville cycles in the Black Warrior basin
have been identified dominantly as 3rd-order cycles by Pashin (2004), although studies show a
transition to dominant 4th-and 5th-order cycles in the northwestern part of the basin (Pashin,
1997, 2004).
Following the criteria described in previous studies (Pashin, 1994, 1997, 1998, 2004),
three major marine flooding surfaces (Figure 7.2 A) and associated condensed sections have

75
been identified in core SWEPI 2 based on the occurrence of thinly laminated marine successions
and abundance of associated marine fossils. These surfaces have been designated as 3rd-order
genetic sequence boundaries, and the successions bounded by these surfaces are designated as
3rd-order genetic sequences.
Recognition of major marine flooding zones as 3rd-order maximum flooding surfaces
leads to the interpretation of underlying major discontinuities at the bases of thick,
amalgamated channel sandstone as third-order sequence boundaries in depositional sequence
model (Figure 7.2). According to the depositional sequence stratigraphy perspective (e.g., Vail et
al., 1977), amalgamated, thick channel sands based by conglomerate lithofacies are interpreted
as incised valley fills in the fluvial dominated part and estuarine channel fill in the deltaic
deposits. Bases of these channel bodies demarcate third-order depositional sequence
boundaries. Seven 3rd-order depositional sequence boundaries have been identified throughout
core SWEPI 2. Third-order marine flooding surfaces in the deeper part of the core are found
stratigraphically above these major sequence boundaries, and differentiate the studied core into
separate third-order genetic sequences.
Minor erosional discontinuities occur at the bases of isolated fluvial channel sandstone
bodies. A recent (Bodek, 2006) sequence stratigraphic study of the Early Pennsylvanian Breathitt
Group, West Virginia, deposited in a similar setting in the central Appalachian basin identified
400-k.y. duration for the sequences bounded by aforementioned minor erosional discontinuities
at the base of isolated fluvial channel sandstones. The 400-k.y. interval for these sequences is
comparable to the duration of long-term global eccentricity cycles (Plint, 1992; Read, 1995).
These surfaces and the sequences they bound have been identified as 4th-order depositional
sequence boundaries and 4th-order sequences, respectively. Similarities between the results of
Bodek (2006) and the current study suggest that the twelve minor erosional discontinuities

76
identified throughout the core could be interpreted as 4th-order depositional sequence
boundaries and the sequences bounded by those discontinuities could be interpreted as 4th -
order depositional sequences (Figure 7.2). The isolated fluvial sandstone bodies on top of these
boundaries abruptly overlie muddy lithofacies such as rooted mudstone and wavy bedded shale
and sandstone. Grain-size contrast across these discontinuities and regional extent of these
surfaces based on previous studies (Pashin et al., 1995; Pashin, 1997, 2004; Greb at al., 2004)
indicate origin from regional base-level falls and lead to their interpretation as depositional
sequence boundaries (Aitken and Flint, 1994).
Minor flooding surfaces occur throughout the core at the tops of fining-upward
successions within fourth-order depositional sequences. Usually these flooding surfaces occur in
zones that contain successions of rooted mudstone and a regionally persistent coal that
represent floodplain and clastic swamp environments (Figure 7.2). These flooding zones are
thinner than the major flooding zones, which contain marine fossil and condensed sections.
Based on sequence stratigraphic analysis and cyclic sedimentation of Lower Pennsylvanian
rocks in southern (Mars, 1995, Pashin et al., 1995, Greb et al., 2004, Pashin, 2004) and central
(Martino, 2004; Bodek, 2006) Appalachian basins, flooding surfaces within these thin flooding
zones associated with coal and rooted mudstone lithofacies have been interpreted as 4th-order
sequence boundaries in the genetic sequence model. Eleven 4th-order genetic sequence
boundaries have been identified in the SWEPI 2 core (Figure 7.2).
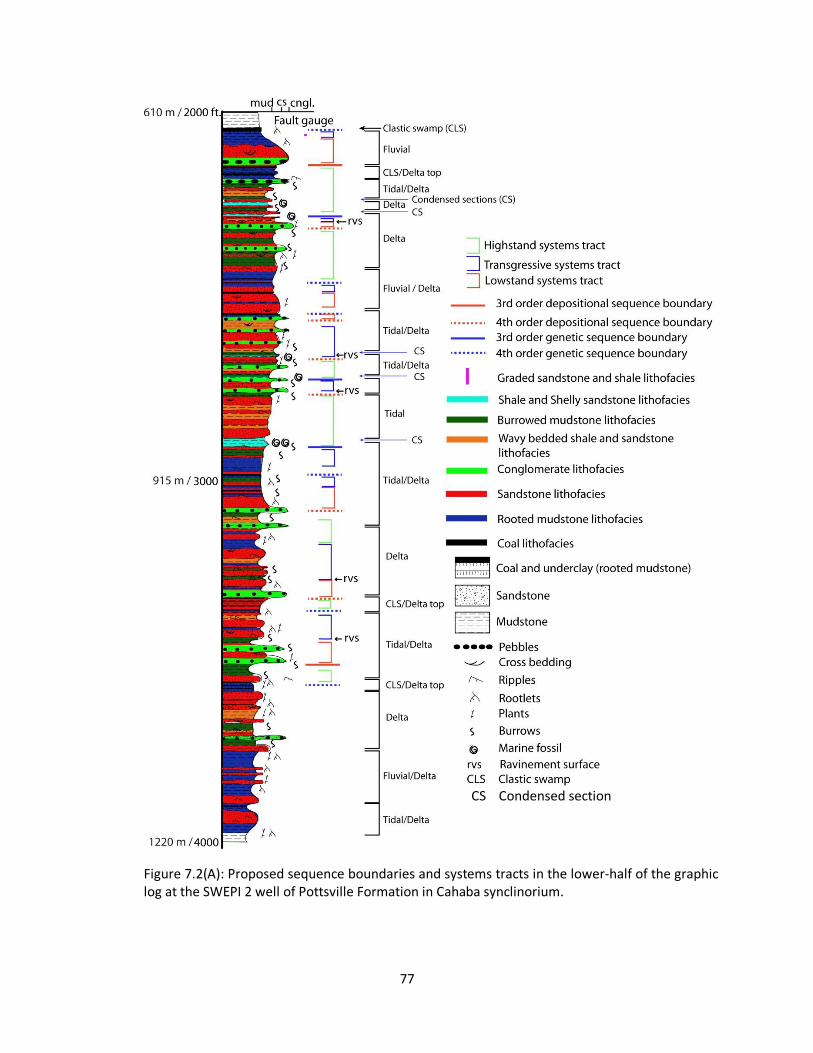
77
Figure 7.2(A): Proposed sequence boundaries and systems tracts in the lower-half of the graphic log at the SWEPI 2 well of Pottsville Formation in Cahaba synclinorium.
CS Condensed section

78
Figure 7.2(B): Proposed sequence boundaries and systems tracts in the upper-half of the graphic log at the SWEPI 2 well of Pottsville Formation in Cahaba synclinorium.

79
7.2 IDENTIFICATION OF SYSTEMS TRACTS
Fourth-order sequence and flooding surface-bounded successions comprise larger-third
order sequences. A similar sequence hierarchy was recognized in correlative strata by Pashin
(1997; 2004) in the greater Black Warrior Basin of Alabama, in the upper Mississippian of
southern West Virginia by Miller and Eriksson (2000), and in the middle Mississippian by Smith
and Read (2000). Additionally, fourth-order sequences have been recognized as comprising
lowstand, transgressive, and highstand systems tracts within composite 3rd-order composite
sequences, in the Middle Pennsylvanian of eastern Kentucky by Aitken and Flint (1994).
Sharp, erosional bases below incised valley-fill deposits of cross-bedded sandstone and
conglomerate are interpreted as sequence boundaries that formed where the rate of eustatic
fall exceeded basin subsidence at the depositional shoreline break (Vail et al., 1977; Van
Wagoner et al., 1988). Coarse-grained incised valley fill and correlative interfluve areas are
included within the lowstand systems tract (Van Wagoner et al., 1988; Aitken and Flint, 1995;
Zaitlin et al., 1994; Petersen and Andsbjerg, 1996). Lowstand wedges are not observed in the
Cahaba Synclinorium as they are probably developed along the distal shelf margin to the
southwest in the Ouachita foredeep (Pashin, 2011, personal communication).
The lowstand systems tract is terminated at the transgressive surface, which probably
occurs within the upper portions of alluvial incised valley fill (Posamentier and Jervey, 1988;
Reading and Collinson, 1996). The upper boundary of lowstand systems tract is roughly
equivalent to the transgressive surface (Posamentier and Allen, 1993; Zaitlin et al., 1994) and is
expressed as a change from coarse fluvial facies to muddier estuarine facies (part of incised
valley fills) (Greb and Martino, 2005). These fluvial to estuarine transitions are roughly
correlative to down-dip marine flooding zones (Greb and Martino, 2005). In the studied core,

80
these transitions are typically manifested as a vertical facies change from the current ripple
cross-laminated sandstone to wavy-bedded shale and sandstone lithofacies with tidal indicators
such as slack water-induced ripple bedding and tidal rhythmites. These transitions represent
parts of fining-upward aggradational elements.
Aggradational fining-upward successions of conglomerate, sandstone and rooted
mudstone lithofacies that are commonly overlain by a regionally persistent coal bed
characterize transgressive systems tracts (Figure 7.3). Coal beds typically define the top of the
transgressive systems tracts in dominantly alluvial settings. The maximum flooding surface caps
the retrogradational transgressive system tracts in marine strata in the lower part of the core.
Capping of transgressive system tracts by extensive marine flooding surfaces in the marine-
dominated part is a characteristic feature of the Pottsville formation in southern Appalachian
basins (Greb and Martino, 2005). A thick succession of burrowed mudstone overlying
widespread coal beds is indicative of estuarine conditions developed with further transgression
during maximum flooding. Similar estuarine deposits occur in the Pottsville Formation in both
southern and central Appalachian basins (Zaitlin et al., 1994; Greb and Martino, 2005).
The bases of a relatively persistent burrowed mudstone lithofacies in the lower part
(Figure 7.4) and dominantly rooted mudstone lithofacies in the upper part of the core mark the
bases of highstand systems tracts. These mudstones continue to coarsen upward. Usually one or
more coal beds also are encountered in the upper highstand systems tract especially within
deltaic deposits. These coal beds have large spatial extent and typically cap small-scale fining-
upward sequences in an overall coarsening-upward succession (Pashin, 1997; Pashin and Carroll,
1999). The highstand systems tract shows a complete coarsening-upward aggradational element
and is terminated at the overlying sequence boundary.

81
In the central and southern Appalachian basin, both erosional (sequence boundaries)
and condensed (marine flooding surfaces) bounding discontinuities have been recognized. In the
studied core, erosional discontinuities have been identified dominantly in the non-marine upper
section (conglomerate measures) of the core, whereas only a few are identified in the marine
dominated lower section (mudstone measures). In contrast, marine flooding surfaces containing
condensed sections have been identified only in the marine-dominated lower part (mudstone
measures). This finding has led to both depositional (Vail et al., 1977) and genetic (Galloway,
1989) interpretations of sequence stratigraphic for the SWEPI 2 core.

82
F
i
g
u
r
e
Figure 7.3: Vertical succession of a transgressive systems tract including depositional
environments in SWEPI 2 recognized between 2555 to 2615 feet.
Fluvial
Overbank / Clastic swamp
Fluvial
Fluvial
2555 ft
2585
2615

83
Figure 7.4: Inferred lithofacies and depositional environments within vertical succession of a
highstand systems tract in SWEPI 2 recognized between 3220 to 3400 feet.
Coal
84
CHAPTER 8: DISCUSSION
8.0 INTRODUCTION
Sequence stratigraphic principles were developed to study shallow marine strata
wherein marine flooding surfaces are readily observed and discrete genetically related,
unconformity-bound depositional packages can be delineated (e.g. Galloway, 1989). Maximum
flooding surfaces, recognized within condensed sections identified in the lower part of core
SWEPI 2 (Figure 7.2), are interpreted as sequence boundaries in genetic sequence model.
Marine flooding zones and genetic sequence boundaries are less prominent in the upper part of
the studied section wherein the effects of marine processes are less evident. However,
depositional sequence boundaries are often prominent beneath amalgamated fluvial sandstone
bodies (Miall and Arush, 2001). In dominantly terrestrial strata, it is more difficult to develop a
genetic sequence framework due to the absence of readily recognizable key flooding surfaces. In
contrast, the depositional sequence model is more easily implemented.
8.1 SIGNIFICANCE OF MAJOR SEQUENCE STRATIGRAPHIC SURFACES
The Pottsville Formation in the studied section shows overall progression from marginal-
marine to terrestrial sedimentation upsection (Figure 7.2). The upper part of the Pottsville
Formation in the cores consists of mainly conglomerate, sandstone, rooted mudstone, and coal
lithofacies representing exclusively terrestrial environments that include alluvial braidplain and
mixed-load fluvial systems. Amalgamated fluvial channels in the upper part of the core are
composed of multistory sandstone and conglomerate lithofacies. These amalgamated channel

85
deposits are typically interpreted to represent deposition during lowstand to early transgressive
conditions following a basinward shift of facies (Shanley and McCabe, 1995). Subsequent
transgression is recorded by isolated sandstone lithofacies overlain by rooted mudstone and
coal lithofacies. The succeeding highstand systems tract is marked by an up-section increase in
multistory stacking of channel sandstone bodies and fluvial sheet sandstones. The overlying
transgressive systems tract starts at the transgressive surface that is characterized by a distinct
transition to floodplain facies. In contrast, transgressive surfaces are commonly ambiguous in
terrestrial settings. Lowstand systems tracts in the study interval consist of conglomerate and
sandstone lithofacies that formed as incised valley fills.
Wavy bedded shale and sandstone, burrowed mudstone, shale and shelly sandstone
lithofacies are identified in the lower part of the core. In combination, these lithofacies along
with conglomerate, sandstone, and coal form coarsening upward cycles that can be attributed
to coastal plain environments, including fluvial systems, deltas, and estuaries. Widespread
condensed sections, which contain maximum flooding surfaces were deposited during
maximum stages of sea-level rise. Condensed beds mark times of maximum rate of
transgression and maximum flooding, and the overlying deltaic deposits indicate subsequent
shallowing. Deepening and regional flooding was a temporary source of accommodation space
that was filled completely during highstand. Transgressions are believed to be related to glacial
eustasy associated with the Milankovich orbital eccentricity cycles (Pashin, 1994; 1998). A
gradual decrease of marine strata and increase of non-marine strata upsection indicates a
transition to predominantly terrestrial sedimentation during the unroofing of the Appalachian
(Pashin et al., 1995).
Key stratal surfaces of marine regimes, such as condensed sections and associated
marine flooding surfaces, are absent in terrestrial sequences of conglomerate measures. In the

86
absence of these isochronous discontinuities, laterally extensive coal beds have been used as
proxies in non-marine sedimentary basins to identify flooding events. The formation of
transgressive coals is usually attributed to eustatic sea-level rise driven by 4th-order Milankovitch
orbital eccentricity cycles (Chestnut, 1994; Pashin and Carroll, 1999; Pashin, 2004; Bodek, 2006).
In the studied cores, coal beds occur within both fining-upward transgressive facies, and
coarsening-upward highstand facies. A number of researchers have documented coal beds in a
wide variety of sedimentary basins. These include foreland basins (e.g., Gastaldo et al., 1993;
Aitken and Flint, 1994, 1995; Chesnut, 1994; Demko and Gastaldo, 1996; Bohacs and Suter,
1997; Hampson et al., 1999; Tibert and Gibling, 1999; Michaelsen and Henderson, 2000), rift
basins (e.g., Petersen and Andsbjerg, 1996; Petersen et al., 1998; O’Mara and Turner, 1999; Van
Heeswijck, 2001), intracratonic basins (e.g., Alves and Ade, 1996; Holz, 1998) and passive
margins (e.g., Bohacs and Suter, 1997). Coal beds are found to form under conditions of both
icehouse (e.g., Gastaldo, 1993; Aitken and Flint, 1994, 1995; Chesnut, 1994; Hampson et al.,
1999; O’Mara and Turner, 1999; Tibert and Gibling, 1999) and greenhouse conditions (e.g.,
Cross, 1988; Kalkreuth and Leckie, 1989; Petersen and Andsbjerg, 1996; Bohacs and Suter, 1997;
Petersen et al., 1998) and in a wide variety of tectonic regimes. However, prevailing climatic
conditions during times of peat accumulation influences the occurrence, geometry, as well as
ash and sulfur content of coal beds (Cecil et al., 1985; Cecil, 1990; Cecil et al., 1993; Holz, 1998).
In shallow, nearshore environments, accommodation is dictated by relative sea-level change,
which is controlled by the combined effects of tectonism, eustasy, and sedimentation rate (Plint
et al., 1992). The most substantial accumulations of peat form where the rate of
accommodation increase approximately equals the rate of peat production (Bohacs and Suter,
1997).

87
8.2 HIERARCHY OF SEQUENCE STRATIGRAPHIC SURFACES
In the genetic stratigraphic framework, Pashin (2004) identified a hierarchy of bounding
discontinuities from dominant 3rd -order to 4th -and 5th-order flooding surfaces. Martino (2004)
identified nine interfluvial sequence boundaries that divide the Glenshaw Formation in the
central Appalachian basin into nine allocycles. Chesnut (1994) identified a hierarchy of marine
zones within both ‘coal-clastic’ 4th-order cycles and 3rd-order composite tectono-cycles. Other
workers (e.g., Aitken and Flint, 1994, 1995; Korus, 2002) have characterized Pennsylvanian
strata in a depositional sequence stratigraphic sense (e.g., Vail et al., 1977) by identifying
erosional disconformities at the bases of fluvial sandstone bodies interpreted as incised valley
fill deposits.
Two orders of flooding surfaces and erosional discontinuities have been identified in the
studied core. The highest order flooding surfaces correspond to 3rd-order maximum flooding
surfaces have been identified in the marine-dominated lower section as major marine horizons.
Due to the absence of marine influence in the upper part of the core, no 3rd-order maximum
flooding surfaces has been identified there. The subordinate surfaces within the sequences
bounded by 3rd-order maximum flooding surfaces have been designated as 4th-order flooding
surfaces throughout the core. Transgressive coals are closely associated with 4th-order
maximum flooding surfaces and consistently occur above fining-upward fluvial to estuarine
transitions.
Sea-level change associated with 3rd-order marine flooding surfaces has been attributed
to tectonoeustatic processes, including orogeny, changes in midoceanic ridge volume, and
intraplate stress (Pitman, 1978; Cloetingh, 1986; Cathles and Hallam, 1991). Association of the
Kaskaskia–Absaroka boundary with tectonic reorganization of the eastern Black Warrior Basin

88
supports a component of tectonic forcing, although the precise causes of 3rd–order cyclicity in
the lower part of the Pottsville Formation are a matter for speculation (Pashin, 2004).
Valley incision was a temporary response to falling sea level and overfilling of the basin
with sediment (Pashin, 2004). This filling of incised valleys initiated amalgamation of channel
deposits beneath which lie 3rd-order erosional discontinuities or depositional sequence
boundaries. During the last phase of Pottsville deposition, unroofing of the Appalachian
Mountains contributed a vast amount of terrestrial sediments, and accumulation exceeded
basin subsidence (Graham et al., 1976; Pashin and Carroll, 1999). The resultant terrestrial-
dominated deposits account for the multistory channel deposits within the incised valleys. Low
magnitude regional sea-level falls initiated deposition of isolated channel deposits within fluvial
to estuarine environments. Bases of these isolated channels represent 4th-order depositional
sequence boundaries. The average periodicity of similar 4th-order sequences in central
Appalachian basins is ~400-k.y (Bodek, 2006). This duration corresponds to the long-term
Milankovitch orbital eccentricity cycle (Plint et al., 1992; Read, 1995, Bodek, 2006).
8.3 RELATION BETWEEN SANDSTONE PETROGRAPHY AND STRATIGRAPHIC ARCHITECTURE
Sandstone petrography has been utilized to correlate compositional variation with
probable fluctuation in source area and associated sea-level and tectonic effects. The basal
Pottsville Formation of the Cahaba synclinorium is composed of mature, recycled, quartzose
sandstones, reflecting intense chemical weathering in an equatorial region (Pashin, 1997). A
large-scale, integrated drainage system was formed across the eastern North America during
the low sea-level stand during the Early Pennsylvanian (Archer and Greb, 1995). This
megachannel was somewhat analogous to the Ganges and/or Brahmaputra river systems of the
Himalaya (Uddin and Lundberg, 1998). A large drainage basin associated with this megachannel

89
may have contributed to the reworking of sediments and the quartzose composition of the basal
Pottsville Formation (Figure 8.1). Moore (2012) found similar inference from some sections of
the Pottsville Formation based on detrital geochronology. Associated with the transition from
the quartzarenite measure to the mudstone measure, sedimentary and metamorphic lithic
fragments become more common, suggesting derivation from a recycled orogen. Repetitive
appearances of tide-dominated deltaic sublitharenite in the mudstone measures are related to
the onset of Alleghenian orogenic activity (Bement, 1976; Rice, 1984; Tankard, 1986; Chestnut,
1988). The mineralogical maturity of the basal sandstones may have been enhanced by
multicycle reworking and storage in bifurcating fluvial systems similar to sands of the tropical
rivers in South America (Savage and Potter, 1991; Archer and Greb, 1995; Greb and Chestnut,
1996).
The overall sandstone composition of the Pottsville Formation in the study interval
indicates that sediments were derived from a recycled orogenic source with local change in
source terrains (Figure 8.1). The predominance of sedimentary and metamorphic lithics over
volcanic lithics is consistent with a principal origin from fold and thrust belts predominantly from
the Appalachian mountain belt (Peavy, 2008; Uddin et al., 2010b). Petrofacies and architectural
analyses nevertheless indicate that the isolated sand bodies at greater depth are quite different
from the amalgamated sandstone units at the upper part of the core. Higher quartz contents
and lack of unstable grains indicate more reworking of the sediments in marine-dominated
depositional environments. Amalgamated channel sandstones in the quartzofeldspatholithic
upper part of the core change very little in composition. These channel sands are believed to be
deposited by rivers that flowed southwest along the basin foredeep (Archer and Greb, 1995;
Pashin, 1995; Lawton, 2003). This compositional consistency has been termed congruence
(Lawton et al., 2003) with respect to composition and dispersal direction. The upper

90
quartzofeldspatholithic part of the core is compositionally and depositionally incongruent with
the lower quartzolithic section.
Figure 8.1: North American Pennsylvanian mega-drainage system influences the compositional diversity in the lower and upper part of the Cahaba synclinorium. Blue polygon represents the probable sediment source terrain for the more mature lower part of the core whereas the red polygon represents the source area for the less mature sediments in the upper part of the core (modified from Blakey et al., 1988; Archer and Greb, 1995).

91
8.4 RELATION BETWEEN SANDSTONE PETROGRAPHY AND DEPOSITIONAL ENVIRONMENTS
Higher quartz contents, low proportion of feldspar and lithic fragments in the lower part
(quartzolithic petrofacies) of the core and the increase in feldspar and lithic contents in the
upper part (quartzofeldspatholithic petrofacies) records a change in source rock type and/or
transportation process. Samples from the quartzofeldspatholithic petrofacies were mostly taken
from amalgamated fluvial channels, while samples of the quartzolithic petrofacies were from
isolated sandstone bodies deposited in mostly shallow marine to marine depositional
environments. Hence, the compositional variation in some way could be connected with change
in paleoenvironment.
This relation between paleoenvironment and composition is similar to that recognized
by Lawton at al. (2003) in their study of Late Cretaceous fluvial systems of southwestern Utah. In
their study, quartzofeldspatholithic and feldspatholithic (not identified in current research)
petrofacies were observed in two fluvial amalgamated sandstone bodies (Drip Tank Member of
Straight Cliffs Formation and capping sandstone member of Wahweap Formation) bounded at
their bases by major depositional sequence boundaries. Lawton et al. (2003) also identified
isolated sand bodies characterized by quartzose (not identified in the current research) and
quartzolithic petrofacies and representing tidal and alluvial plain deposits. Compositional
differences or incongruence was used to delineate stratigraphic architecture.
In the current study, the petrologic incongruence between the mudstone measures and
the conglomerate measures can be correlated a major shift from marine to nonmarine
depositional environments. Integration of facies analysis and sandstone petrology with
paleocurrent analysis will enhance the interpretation of the causes of facies shifts, changes in
accommodation, and resultant sequence architecture.

92
CHAPTER 9: CONCLUSIONS
The following conclusions can be drawn from this research:
1) The Lower Pennsylvanian Pottsville Formation of the Cahaba synclinorium of southern
Appalachian basin is characterized by conglomerate, sandstone, rooted mudstone, wavy bedded
shale and sandstone, graded sandstone, burrowed mudstone, shale and shelly sandstone, and
coal lithofacies.
2) High-magnitude sea-level fluctuations influenced the deposition of the Pottsville Formation.
Incision and backfilling of incised valleys with sublithic sand occurred during relative sea-level
lowstand to early transgression periods. Continued transgression formed estuaries with the
back-flooding of incised valleys. During relative sea-level fall, progradational deltaic facies
developed above estuarine and marginal marine facies.
3) Compositional incongruence between terrestrial and marine lithofacies has been identified
between the mudstone and conglomerate measures, and this incongruence has been
interpreted as major shift from marine to terrestrial depositional environment.
4) Major sea-level fluctuations have been attributed to both tectonic and eustatic mechanisms.
3rd-order composite sequences identified by marine flooding surfaces and bases of incised valley
fills are attributed to eustatic sea-level changes modulated by the lower-frequency orbital
eccentricity cycle. High-frequency 4th-order cycles represented by extensive coal layers may be
linked to higher-frequency glacio-eustascy cycles. 4th-order sequences contain fluvial to marginal
marine facies that comprise lowstand, transgressive, and highstand systems tracts. Higher-

93
frequency autocycles in the lower part of the core are associated with deltaic facies within 4th-
order highstand systems tracts.
5) Coal beds developed within late transgressive facies associated with 4th-order maximum
flooding surfaces and in association with higher-frequency deltaic autocycles of 4th-order
highstands. Hence, the formation of coal beds can be attributed to both glacio-eustatic and
autocyclic deltaic mechanisms.
6) Quartz constitutes the dominant framework grain at the lower section. The increase in total
feldspar and lithic fragment contents toward the top of the section could indicate a change in
source terrains with greater contribution of sediments from a recycled orogen.
7) The lower marine sections of the studied core may have been sourced via the Pennsylvanian
mega-drainage system from the northern Appalachian, whereas the upper terrestrial section
received sediments from the adjacent southern Appalachian Mountains.

94
REFERENCES
Aitken, J.F., and Flint, S.S., 1994, High-frequency sequences and the nature of incised-valley fills
in fluvial systems of the Breathitt Group (Pennsylvanian), Appalachian foreland basin,
eastern Kentucky, in Dalrymple, R., Boyd, R., and Zaitlin, B., eds., Incised Valley Systems:
Origin and Sedimentary Sequences: SEPM Special Publication, v. 51, p. 353-368.
Aitken, J.F., and Flint, S.S., 1995, Application of high-resolution sequence stratigraphy to fluvial
systems: a case study from the Upper Carboniferous Breathitt Group, eastern Kentucky,
USA: Sedimentology, v. 42, p. 3-30.
Alves, R.G., and Ade, M.V.B., 1996, Sequence stratigraphy and coal petrology applied to the
Candiota Coal Field, Rio Grande do Sul, Brazil: A depositional model: International
Journal of Coal Geology, v. 30, p. 231-248.
Archer, W.A., and Greb, S.F., 1995, An Amazon-Scale drainage system in the Early Pennsylvanian
of Central North America, The Journal of Geology, v.103, p. 611-628.
BeMent, W.O., 1976, Sedimentological aspects of middle Carboniferous sandstones on the
Cumberland overthrust sheet, [Ph.D. dissertation], University of Cincinnati, Cincinnati,
182 p.
Bhattacharya, J.P., and Walker, R.G., 1992, Deltas, in Walker, R.G. and James, N.P., eds., Facies
Models: Response to Sea Level Change: Geological Association of Canada, p. 157-177.

95
Bohacs, K., and Suter, J., 1997, Sequence stratigraphic distribution of coaly rocks: fundamental
controls and paralic examples: American Association of Petroleum Geologists Bulletin, v.
81, p. 1612-1639.
Bodek, R.J., 2006, Sequence stratigraphic architecture of early Pennsylvanian, coal-bearing
strata of the Cumberland block: a case study from Dickenson County, Virginia, [M.S.
thesis], Virginia Polytechnic Institute and State University, Blacksburg, 77 p.
Blakey, R.C., Peterson, F., and Kocurek, G., 1988, Late Paleozoic and Mesozoic eolian deposits of
the Western Interior of the United States: Sedimentary Geology, v. 56, p. 3-125.
Casagrande, D. J., 1987, Sulphur in peat and coal: London Geological Society Special Publication
32, p. 87-105.
Catuneanu, O., 2003, Sequence Stratigraphy of Clastic Systems: Geological Association of
Canada, Short Course Notes, v. 16, p. 18-23.
Catuneanu, O. and Elango, H.N, 2001,Tectonic control on fluvial styles: The Balfour Formation of
the Karoo Basin, South Africa, Sedimentary Geology, V.140, p. 291-313.
Cecil, C. B., 1990, Paloclimate controls on stratigraphic repetition of chemical and siliciclastic
rocks, Geology, V.18, P. 533-536.
Cecil, C.B., Stanton, R.W., Neuzil, S.G., Dulong, F.T., Ruppert, L.F., and Pierce, B.S., 1985,
Paleoclimatic controls on late Paleozoic sedimentation and peat formation in the central
Appalachian basin (USA): International Journal of Coal Geology, v. 5, p. 195-230.
Cecil, C.B., Dulong, F.T., Cobb, J.C., and Supardi, 1993, Allogenic and autogenic controls on
sedimentation in the central Sumatra basin as an analogue for Pennsylvanian coal-
bearing strata in the Appalachian basin, in Cobb, J.C., and Cecil, C.B., eds., Modern and

96
Ancient Coal-Forming Environments: Geological Society of America Special Paper, v.
286: p. 3-22.
Chesnut Jr., D.R., 1988, Stratigraphic analysis of the Carboniferous rocks of the central
Appalachian basin, [Ph.D. dissertation], University of Kentucky, Lexington, 297 p.
Chesnut, D.R., Jr., 1991, Paleontological Survey of the Pennsylvanian rocks of the eastern
Kentucky coal field: Kentucky Geological Survey, Series 11, Information Circular 36, 71 p.
Chesnut Jr., D.R., 1994, Eustatic and tectonic control of deposition of the Lower and Middle
Pennsylvanian strata of the central Appalachian basin, in Dennison, J.M., and Ettensohn,
F.R., eds., Tectonic and Eustatic Controls on Sedimentary Cycles: SEPM Concepts in
Sedimentology and Paleontology, v. 4, p. 51-64.
Coleman, J.M., 1976, Deltas: Processes of Deposition, & Models for Exploration: Continuing
Education Publication Company, Champaign, 102 p.
Dalrymple, R.W., 1992. Tidal depositional systems, in Walker, R.G., James, N.P. eds., Facies
Models: Response to Sea Level Change. Geological Association of Canada, St. John's, p.
195–218.
Demirpolat, S., 1989, Environment of deposition of selected sandstones and conglomerates in
southern part of Cahaba Basin, Alabama [Ph.D. Thesis]: Tallahassee, Florida, Florida
State University, 121 p.
Demko, T.M., and Gastaldo, R.A., 1996, Eustatic and autocyclic influences on deposition of the
Lower Pennsylvanian Mary Lee coal zone, Warrior basin, Alabama: International Journal
of Coal Geology, v. 31, p. 3-19.

97
Dickinson, W.R., and Rich, E.I., 1972, Petrologic intervals and petrofacies in the Great Valley
sequence, Sacramento Valley, California, GSA bulletin, v.83, p. 3007-3024.
Dickinson, W.R., and Suczek, C., 1979, Plate Tectonics and Sandstone compositions: American
Association of Petroleum Geologists Bulletin, v. 63, p. 2164-2182.
Diessel, C. F. K., 1998, Sequence stratigraphy applied to two coal seams: Two case histories:
SEPM Special Publication 59, p. 151-173.
Diessel, C.F.K., Boyd, R., Wadsworth, J., Leckie, D., and Chalmers, G., 2000, On balanced and
unbalanced accommodation/peat accumulation ratios in the Cretaceous coals from
Gates Formation, western Canada, and their sequence stratigraphic significance:
International Journal of Coal Geology, v. 43, p. 143-186.
Donaldson, A. C., 1979, Depositional environments of the upper Pennsylvanian series, in K. J.
Englund, H. H. Arndt, and T. W. Henry, eds., Proposed Pennsylvanian system stratotype
Virginia and West Virginia: American Geologic Institute, Selected Guidebook Series 1, p.
123–132.
Dorsey, R.J., 1988, Provenance evolution and unroofing history of a modern arc- continent
collision; Evidence from petrography of Plio-Pleistocene sandstones, eastern Taiwan,
Journal of Sedimentary Petrology, v. 58, p. 208–218.
Dżułyński, S., and Walton, E.K., 1965, Sedimentary Features of Flysch and Greywackes, Elsevier:
Amsterdam, 274 p.
Eberth, D.A. and O’Connell, S.C., 1995. Notes on changing paleoenvironments across the
Cretaceous-Tertiary boundary (Scollard Formation) in the Red Deer River valley of
southern Alberta. Bulletin of Canadian Petroleum Geology, v. 43, p. 44-53.
98
Eble, C. F., Gastaldo, R. A., Demko, T. M., and Liu, Y., 1994, Coal compositional changes along a
swamp interior to swamp margin transect in the Mary Lee Coal bed, Warrior basin,
Alabama, U.S.A: International Journal of Coal Geology, v. 26, p. 43-62.
Ėkes, C., 1993, Bedload-transported pedogenic mud aggregates in the Lower Old Red Sandstone
in southwest Wales, Journal of Geological Society, London, v. 150, p.469-472.
Fielding, C.R., 1984, A coal depositional model for the Durham Coal Measures of NE England,
Journal of Geological Society, London, v. 141, p.919-932.
Folk, R.L., 1980, Petrology of Sedimentary Rocks: Austin, Texas, Hemphill Publishing Company,
182 p.
Galloway, W.E., 1989, Genetic stratigraphic sequences in basin analysis; I, Architecture and
genesis of flooding-surface bounded depositional units: AAPG Bulletin, vol. 73, no. 2, p.
125-142.
Galloway, W.E., 1989, Genetic stratigraphic sequences in basin analysis; II, Application to
Northwest Gulf of Mexico Cenozoic basin: AAPG Bulletin, vol. 73, no. 2, p. 143-154.
Gastaldo, R.A., 1994, The genesis and sedimentation of phytoclasts with examples from coastal
environments, in A. Traverse, ed. Sedimentation of Organic Particles. Cambridge
University Press. Chapter 7, p. 103-127.
Gastaldo, R.A., Demko, T.M., and Liu, Y., 1993, The application of sequence and genetic
stratigraphic concepts to Carboniferous coal-bearing strata: An example from the Black
Warrior basin, USA: Geologische Rundschau, v. 82, p. 212-226.
Gastaldo, R.A., Gibson, M.A., and Blanton-Hooks, A., 2006, The Late Mississippian Back-Barrier
Marsh Ecosystem in the Black Warrior and Appalachian Basins, in DiMichele, W.A., and

99
Greb, S., eds., Wetlands Through Time: Geological Society of America, Special
Publication 399, p. 139-154.
Goff, J.A., 2000, Simulation of Stratigraphic Architecture from Statistical and Geometrical
Characterizations, Mathematical Geology, v. 32, p.765-784.
Graham, S.A., Ingersoll, R.V., and Dickinson, W.R., 1976, Common provenance for lithic grains in
Carboniferous sandstones from Ouachita Mountains and Black Warrior Basin: Journal of
Sedimentary Petrology, v. 46, p. 620-632.
Greb, S.F., and Chesnut Jr., D.R., 1996, Lower and lower Middle Pennsylvanian fluvial to
estuarine deposition, central Appalachian basin: effects of eustasy, tectonics, and
climate: Geological Society of America Bulletin, v. 108, p. 303-317.
Greb, S.F., and Martino, R.L., 2005, Fluvial-estuarine transitions in fluvial-dominated successions:
examples from the Lower Pennsylvanian of the central Appalachian basin, in Blum, M.,
Marriott, S.B., and LeClair, S., eds., Fluvial Sedimentology VII: International Association
of Sedimentologists, Special Publication 35, p. 425-452.
Greb, S.F., Chesnut Jr., D.R., and Eble, C.F., 2004, Temporal changes in coal-bearing depositional
sequences (Lower and Middle Pennsylvanian) of the central Appalachian basin, USA in
Pashin J.C., and Gastaldo, R.A., eds., Sequence Stratigraphy, Paleoclimate, and Tectonics
of Coal-Bearing Strata: AAPG Studies in Geology, v. 51, p. 89-120.
Greb, S.F., Pashin, J.C., Martino, R.L., and Eble, C.F., 2008, Appalachian sedimentary cycles
during the Pennsylvanian: Changing influences of sea level, climate, and tectonics, in
Fielding, C.R., Frank, T.D., and Isbell, J.L., eds., Resolving the Late Paleozoic Ice Age in
Time and Space: Geological Society of America Special Paper 441, p. 235–248.

100
Guccione, M.J., 1993, Grain size distribution of overbank sediment and its use to loclate channel
position, in Marzo, M., Puigdefábregas, C. ed., Alluvial sedimentation, IAS special
publication, v.17, p. 235-276.
Hamblin, A.P., 1997, Regional distribution and dispersal of the Dinosaur Park Formation, Belly
RiverGroup, surface and subsurface of southern Alberta; Bulletin of Canadian Petroleum
Geology, v. 45,p. 377–399.
Hampson, G., Stollhofen, H., and Flint, S., 1999, A sequence stratigraphic model for the Lower
Coal Measures (Upper Carboniferous) of the Ruhr district, north-west Germany:
Sedimentology, v. 46, p. 1199-1231.
Harland, W. B., R. L. Armstrong, A. V. Cox, L. E. Craig, A. G. Smith, and D. G. Smith, 1990, A
geologic time scale 1989: London, Cambridge University Press, 131 p.
Heckel, P.H., Gibling, M.R., and King, N.R., 1998, Stratigraphic model for glacial-eustatic
Pennsylvanian cyclothems in highstand nearshore detrital regimes: The Journal of
Geology, v. 106, p. 373-383.
Hess, J. C., and H. J. Lippolt, 1986, 40Ar/39Ar ages of tonstein and tuff sanidines: New calibration
points for the improvement of the Upper Carboniferous time scale: Isotope Geoscience,
v. 59, p. 143–154.
Holz, M., Kalkreuth, W., and Banerjee, I., 2002, Sequence Stratigraphy of paralic coal-bearing
strata: an overview: International Journal of Coal Geology, v. 48, p. 147-179.
Holz, M., 1998, The Eo-Permian coal seams of the Parana basin in southernmost Brazil: an
analysis of the depositional conditions using sequence stratigraphic concepts:
International Journal of Coal Geology, v. 36, p. 141-163.

101
Hunt, D., and Tucker, M.E., 1992, Stranded parasequences and the forced regressive wedges
systems tract: deposition during base-level fall, Sedimentary Geology, v.81, p.1-9.
Klein, G.D., 1990, Pennsylvanian time scale and cycle periods: Geology, v. 18, p. 455-457.
Kidwell, S.M., 1989. Stratigraphic condensation of marine transgressive records: origin of major
shell deposits in the Miocene of Maryland, Geology, v.97, p. 1-24.
Korus, J.T., 2002, The Lower Pennsylvanian New River Formation: A non-marine record of
glacioeustasy in a foreland basin, [M.S. thesis], Virginia Polytechnic Institute and State
University, Blacksburg, 55 p.
Kuenen, P.H., 1957, Lontgitiudinal filling of oblong sedimentary basins, Geology Mijnbouw, v.18,
p. 189-195.
Lacefield, J., 2000, Lost Worlds in Alabama Rocks: A Guide: Paleo-Alabama Project, 123 p.
Lawton, T.F., Pollock, S.L., and Robinson, R.A.J., 2003, Integrating sandstone petrology and
nonmarine sequence stratigraphy: application to the Late Cretaceous fluvial systems of
southwestern Utah, U.S.A.: Journal of Sedimentary Research, v. 73, p. 389-406.
Liu, Y., and Gastaldo, R.A., 1992, Characteristics and provenance of log-transported gravels in a
Carboniferous channel deposit: Journal of Sedimentary Petrology, v. 62, p. 1072-1083.
Loutit, T.S., Hardenbol, J., Vail, PR. and Baum, G.R., 1988, Condensed sections: the key to age
determination and correlation of continental margin sequences, In Wilgus, C.K.,
Hastings, B.S., et al. eds., Sea-Level Changes: An Integrated Approach. SEPM Special
Publication, v.42, p.183-213.

102
Mack, G.H., Thomas, W.A., and Horsey, C.A., 1983, Composition of Carboniferous sandstone and
tectonic framework of southern Appalachian-Ouachita Orogen: Journal of Sedimentary
Petrology, v. 53, p. 931-946.
Mars, J. C., 1995, Sequence stratigraphy of the Late Paleozoic Black warrior foreland basin in
northwestern Alabama and northeastern Mississippi, [PhD. dissertation], University of
Kentucky, Lexington, Kentucky, 176 p.
Martino, R. L., 2004, Sequence stratigraphy of the Glenshaw Formation (middle- late
Pennsylvanian) in the central Appalachian basin, in J. C. Pashin and R. A. Gastaldo, eds.,
Sequence stratigraphy, paleoclimate, and tectonic of coal-bearing strata, American
Association of Petroleum Geologists Studies in Geology, v. 51, p. 1-28.
McCabe, 1977, Deep distributary channel and giant bedforms in the Upper Carboniferous of the
central Pennines, northern England, Sedimentology, v.24, p. 271-290.
Menning, M., D. Weyer, G. Drodzewski, and H. W. J. van Amerom, 2000, A Carboniferous time
scale 2000: Discussion and use of geological parameters as time indicators from central
and western Europe: Geologische Ja¨hrbu¨ch Hanover A, v. 156, p. 3–44.
Miall, A.D., 1978, The Geology of Fluvial Deposits, Springer, 582 p.
Miall, A.D., and Arush, M., 2001, Cryptic sequence boundaries in braided fluvial successions:
Sedimentology, v. 48, p. 971-985.
Michaelsen, P., and Henderson, R.A., 2000, Facies relationships and cyclicity of high-latitude,
late Permian coal measures, Bowen basin, Australia: International Journal of Coal
Geology, v. 44, p. 19-48.

103
Middleton, G.V., 1978, Sedimentology – history, in Fairbridge, R.W. ed., The encyclopedia of
sedimentology: Hutchinson and Ross, Stroudsberg, p. 707-712.
Miller, D.J., and Eriksson, K.A., 2000, Sequence stratigraphy of upper Mississippian strata in the
central Appalachians: A record of glacioeustasy and tectonoeustasy in a foreland basin
setting: AAPG Bulletin, v. 84, p. 210-233.
Mitchum, R.M., 1977, Seismic stratigraphy and global changes of sea level, Part 1: Glossary of
terms used in seismic stratigraphy, in Payton, C.E. ed., Seismic stratigraphy-applications
to hydrocarbon exploration: AAPG Memoir 26: p. 53 - 62.
Mitchum, R.M., and J.C. Van Wagoner, 1991, High-frequency sequences and their stacking
patterns; sequence-stratigraphic evidence of high-frequency eustatic cycles:
Sedimentary Geology, v. 70, p. 131-160.
Moore, M.F., Hames, W.E., Uddin, A., and Pashin, J.C., 2012, Comparisons of clastic composition
and 40Ar/39Ar detrital muscovite ages for the Pottsville Formation, , Geological Society
of America, Abstracts with Programs, v. 44, no. 4, p. 80.
Moore, M.F., Hames, W.E., Uddin, A., and Pashin, J.C., 2011 a, Voices from the deep: The
sedimentology and detrital mineral chronology of the Black Warrior Basin depocenter,
Geological Society of America, Abstracts with Programs, v. 43, no. 5, p. 315.
Moore, M.F., Hames, W.E., Uddin, A., Pashin, J.C., and Priester, C., 2011 b, Petrology and
detrital mineral geochronology of the Carboniferous sedimentary Appalachians,
Southeastern USA, Geological Society of America, Abstracts with Programs, v. 43, no. 5,
p. 432.

104
Nadon, G., 1994, The genesis and recognition of anastomosed fluvial deposits: data from the St
Mary River Formation, southwestern Alberta, Journal of Sedimentary Research, v.B64,
p.451-463.
Nemec, W., and Postma, G., 1993, Quaternary alluvial fans in southwestern Crete:
sedimentation processes and geomorphic evolution, in Marzo, M., Puigdefábregas, C.
eds., Alluvial sedimentation, IAS special publication, v.17, p. 235-276.
Nichols, G., 1999, Sedimentology and Stratigraphy, 1st edition: Wiley-Blackwell, London, 432 p.
Olsen, T., steel, R., hogseth, K., skar, T., and Roe, S.L., 1995, Sequential architecture in a fluvial
succession: sequence stratigraphy in the Upper Cretaceous Mesaverde Group, Price
Canyon, Utah: Journal of Sedimentary Research, v. B65, p. 265–280.
O'Mara, P.T., and Turner, B.R., 1999, Sequence stratigraphy of coastal alluvial plain Westphalian
B coal measures in Northumberland and the southern North Sea: International Journal
of Coal Geology, v. 42, p. 33-62.
Osborne, T.E., 1991, The depositional environment and provenance of the Straven
Conglomerate Member of the Pottsville Formation, in Thomas, W.A., and Osborne,
W.E., eds., Mississippian-Pennsylvanian tectonic history of the Cahaba Synclinorium
(guidebook, Alabama Geological Society 28th annual field trip): Alabama Geological
Society, p. 73–93.
Pashin, J. C., 1993, Tectonics, paleoceanography, and paleoclimate of the Kaskaskia sequence in
the Black Warrior basin of Alabama, in Pashin, J. C., ed., New Perspectives on the

105
Mississippian System of Alabama: Alabama Geological Society 30th Annual Field Trip
Guidebook, p. 1–28.
Pashin, J.C., 1994, Cycles and stacking patterns in Carboniferous rocks of the Black Warrior
foreland basin: Gulf Coast Association of Geological Societies Transactions, v. 44, p. 555–
563.
Pashin, J.C., 1997, Stratigraphy and depositional environments of the Pottsville Formation
(Lower Pennsylvanian) in the Coosa coalfield, in Bearce, D. N., Pashin, J. C., and Osborne,
W. E., eds., Geology of the Coosa coalfield: Alabama Geological Society 34th Annual
Field Trip Guidebook, p. 19–28.
Pashin, J.C., 1998, Stratigraphy and structure of coal-bed methane reservoirs in the United
States: an overview: International Journal of Coal Geology, v. 35, p. 207–238.
Pashin, J.C., 2004, Cyclothems of the Black Warrior Basin, Alabama, USA: Eustatic snapshots of
foreland basin tectonism, in Pashin, J. C. and Gastaldo, R. A., eds., Sequence
stratigraphy, paleoclimate, and tectonics of coal-bearing strata: American Association of
Petroleum Geologists Studies in Geology 51, p. 199–218.
Pashin, J., and Carroll, R.E., 1999, Geology of the Cahaba Coalfield: Guidebook for the 36th
Annual Field Trip of the Alabama Geological Society, 98 p.
Pashin, J.C., and Gastaldo, R.A., 2009,Carboniferous of the Black Warrior Basin, in Greb, S.F., and
Chestnut, D.R., Jr., eds., Carboniferous geology and biostratigraphy of the Appalachian
and Black Warrior Basins: Kentucky Geological Survey Special Publication 1, Series 12, p.
10-21.

106
Pashin, J.C., and Raymond, D.E., 2004, Glacial-eustatic control of coal-bed methane reservoir
distribution (Pottsville Formation; Lower Pennsylvanian) in the Black Warrior Basin of
Alabama: Tuscaloosa, Alabama, University of Alabama College of Continuing Studies,
2004 International Coal-bed Methane Symposium Proceedings, Paper 0413, p.15 .
Pashin, J.C., Carroll, R.E., Barnett, R.L., and Beg, M.A., 1995, Geology and coal resources of the
Cahaba coal field: Bulletin Geological Survey of Alabama, v. 163, p. 1-49.
Pashin, J.C., Carroll, R.E., McIntyre, M.R., and Grace. R., 2010, Geology of unconventional gas
plays in the southern Appalachian thrust belt: Alabama Geological Survey Guidebook for
field trip 7, AAPG annual conference and exposition, 86 p.
Peavy, T., 2008, Provenance of lower Pennsylvanian Pottsville formation, Cahaba Synclinorium,
Alabama [M.S. thesis]: Auburn University, Auburn, 123 p.
Petersen, H. I., and Andsbjerg, J., 1996, Organic facies development within Middle Jurassic coal
seams, Danish Central graben, and evidence for relative sea-level control on peat
accumulation in a coastal plain environment: Sedimentary Geology, v. 106, p. 259-277.
Petersen, H.I., Bojesen-Koefoed, J.A., Nytoft, H.P., Surlyk, F., Therkelsen, J., and Vosgerau, H.,
1998, Relative sea-level changes recorded by paralic liptinite-enriched coal facies cycles,
Middle Jurassic Muslingebjerg Formation, Hochstetter Forland, northeast Greenland:
International Journal of Coal Geology, v. 36, p. 1-30.
Pettijohn, F.J., Potter, P.E., and Siever, R., 1973, Sand and Sandstone: New York, Springer Verlag,
553 p.

107
Phillips, T.L., and Peppers, R.A., 1984, Changing patterns of Pennsylvanian coal-swamp
vegetation and implications of climatic control: International Journal of Coal Geology, v.
3, p. 205-255.
Plint, A.G., Eyles, N., Eyles, C.H., and Walker, R.G., 1992, Control of sea level change, in Walker,
R.G., and N. P. James, eds., Facies Models - Response to Sea Level Change: Geological
Association of Canada, St. John’s, p. 15-25.
Posamentier, H.W., and M.T. Jervey, 1988, Sequence stratigraphy; implications for facies models
and reservoir occurrence: CSPG Reservoir. 15, no. 6, p. 1-2.
Posamentier, H.W., and G.P. Allen, 1993, Variability of the sequence stratigraphic model: effects
of local basin factors: Sedimentary Geology, v. 86, p. 91-109.
Posamentier, H.W. and Allen, G.P. ,1999, Siliciclastic Sequence Stratigraphy: Concepts and
Applications. Society of Economic Paleontologists and Mineralogists (SEPM), Concepts in
Sedimentology and Paleontology, v.7.
Posamentier, H.W., and Vail, P.R., 1988, Eustatic Controls on Clastic Deposition II--Sequence and
Systems Tract Models, in Wilgus, et al, eds., Sea-Level changes: an integrated approach,
SEPM Special Publication No. 42, p. 125-154.
Quinlan, G.M., and Beaumont, C., 1984, Appalachian thrusting, lithospheric flexure, and the
Paleozoic stratigraphy of the Eastern Interior of North America: Canadian Journal of
Earth Sciences, v. 21, p. 973–996.
Reading, H.G., 1996, Sedimentary Environments: Processes, Facies and Stratigraphy: Oxford,
Blackwell Science Ltd., 688 p.
108
Read, J.F., 1995, Overview of carbonate platform sequences, cycle stratigraphy and reservoirs in
greenhouse and icehouse worlds, in Read, J.F., Kerans, C., Weber, L.J., Sarg, J.F. and
Wright, F.M. eds., Milankovitch Sea-Level Changes, Cycles, and Reservoirs on Carbonate
Platforms in Greenhouse and Ice-House Worlds: SEPM Short Course v. 35, Tulsa, 81 p.
Reading, H. G., and Collinson, J.D., 1996, Clastic coasts, in Reading, H.G. ed., Sedimentary
Environments: Processes, Facies and Stratigraphy: Blackwell Science, Oxford, p. 155 –
231.
Reading, H. G., and Levell, B.K., 1996, Controls on the sedimentary rock record, in Reading, H.G.,
ed., Sedimentary environments: Processes, Facies and Stratigraphy: Blackwell Science,
Oxford, p. 5-36.
Reineck, H. –E., and Singh, I.B., 1975, Depositional sedimentary environments, 1st edition:
Springer-Verlag, Berlin, 440 p.
Reineck, H. –E., and Singh, I.B., 1986, Depositional sedimentary environments, 2nd edition:
Springer-Verlag, Berlin, 551 p.
Reineck, H.-E., and Wunderlich, R., 1968, Classification and origin of flaser and lenticular
bedding, Sedimentology, v.11, p.99-104.
Rice, C.L., 1984, Sandstone units of the Lee Formation and related strata in eastern Kentucky:
United States Geological Survey Professional Paper, v. 1151-G, p. 1-53.
Ross, C.A., and Ross, J.R.P., 1988, Late Paleozoic transgressive-regressive deposition, in Wilgus,
C.K., Hastings, B.S., Posamentier, H., Van Wagoner, J., Ross, C.A., and Kendall, C.G.St.C.,
eds., Sea-level Changes: An Integrated Approach: SEPM Special Publication, v. 42, p.
227-247.

109
Rust, B.R., 1981, Sedimentation in an arid zone anastomosing fluvial system: Cooper’s Creek
central Australia, Journal of Sedimentary Petrology, v.51, p. 745-755.
Rust, B.R., and Jones, B.G., 1987, The Hawkesbury Sandstone south of Sydney, Australia: Triassic
analogue for the deposit of a large braided river, Journal of Sedimentary Petrology, v.57,
p. 222-233.
Savage, K.M., and Potter, P.E., 1991, Petrology of modern sands of the Rios Guariare and
Indrida, southern Columbia-tropical climate and sand composition, Geology, v.101, p.
289-298.
Schlee, J., 1963, Early Pennsylvanian currents in the southern Appalachian Mountains:
Geological Society of America Bulletin, v. 74, p. 1439-1452.
Schumm, S.A., 1993, River Response to baselevel change: implications for sequence
stratigraphy: Journal of Geology, v. 101, p. 15.
Scotese, C.R., and Golonka, J. 1992. Paleogeographic Atlas, PALEOMAP Progress Report 20-0692,
Department of Geology, University of Texas at Arlington, 34 p.
Shanley, K.W., and McCabe, P.J., 1991, Predicting facies architecture through sequence
stratigraphy—an example from the Kaiparowits Plateau, Utah: Geology, v. 19, p. 742–
745.
Shanley, K.W., and McCabe, P.J., 1994, Perspectives on the sequence stratigraphy of continental
strata: American Association of Petroleum Geologists Bulletin, v. 78, p. 544-568.
Shanley, K.W., and McCabe, P.J., 1995, Sequence stratigraphy of Turonian–Santonian strata,
Kaiparowits Plateau, southern Utah, U.S.A.: implications for regional correlation and
foreland basin evolution, in Van Wagoner, J.C., and Bertran, G.T., eds., Sequence

110
stratigraphy of foreland basin deposits: American Association of Petroleum Geologists,
Memoir 64, p.103–136.
Smith, L.B., and Read, J.F., 2000, Rapid onset of late Paleozoic glaciation on Gondwana; evidence
from Upper Mississippian strata of the Midcontinent, United States: Geology, v. 28, p.
279 - 282.
Smith, D.G., and Smith, N.D., 1980, Sedimentation in anastomsed river systems: example from
alluvial valleys near Baffn, Alberta, Journal of Sedimentary Petrology, v.50, p. 157-164.
Stear, W.M., 1985, Comparison of the bed-form distribution and dynamics of modern and
ancient sandy ephemeral flood deposits in the southwestern Karoo region, South Africa,
Sedimentary Geology, v.45, p.209-230.
Tankard, A.J., 1986, Depositional response to foreland deformation in the Carboniferous of
eastern Kentucky: American Association of Petroleum Geologists Bulletin, v. 70, p. 853–
868.
Thomas, W.A., 1976, Evolution of the Appalachian-Ouachita continental margin: Journal of
Geology, v. 84, p. 323–342.
Thomas, W.A., 1995, Diachronous thrust loading and fault partitioning of the Black Warrior
foreland basin within the Alabama recess of the late Paleozoic Appalachian-Ouachita
thrust belt: Society of Economic Paleontologists and Mineralogists, Special Publication
52, p. 111–126.
Thomas, W. A., 2007, Role of the Birmingham basement fault in thin-skinned thrusting of the
Birmingham anticlinorium, Appalachian thrust belt in Alabama: American Journal of
Science, v. 307, p. 46-62.

111
Thomas, W. A., and Bayona, G., 2005, The Appalachian thrust belt in Alabama and Georgia:
thrust-belt structure, basement structure, and palinspastic reconstruction: Alabama
Geological Survey Monograph 16, 48 p.
Tibert, N.E., and Gibling, M.R., 1999, Peat accumulation on a drowned coastal braidplain: The
Mullins Coal (Upper Carboniferous), Sydney basin, Nova Scotia: Sedimentary Geology, v.
128, p. 23-38.
Uddin, A., and Lundberg, N., 1998, Cenozoic history of the Himalayan-Bengal system: Sand
composition in the Bengal basin, Bangladesh: Geological Society of America Bulletin,
v.110, p. 497-511.
Uddin,A., Hames,W.E., and Zahid, K.M., 2010 a, Laser 40Ar/39Ar age constraints on Miocene
sequences from the Bengal basin: Implications for middle Miocene denudation of the
eastern Himalayas, Journal of Geophysical Research, v. 115,p.1-9.
Uddin, A., Hames, W.E., Peavy, T., and Pashin, J.C., 2010 b, Stratigraphic and detrital source
constraints for the Pottsville Formation of Alabama and Mississippi, Geological Society
of America, Abstracts with Programs, v. 42, no. 5, p. 196.
Vail, P.R., Mitchum, R.M., Thompson III, S., 1977. Seismic stratigraphy and global changes of sea
level, part 3: relative changes of sea level from coastal onlap, in Payton, C.W. ed.,
Seismic Stratigraphy Applications to Hydrocarbon Exploration. American Association of
Petroleum Geologists Memoir 26, pp. 63–97.
Van Heeswijck, A., 2001, Sequence stratigraphy of coal-bearing, high-energy clastic units: the
Maitland-Cessnock-Greta Coalfield and Cranky Corner basin: Australian Journal of Earth
Sciences, v. 48, p. 417-426.

112
Van Wagoner, J.C., Posamentier, H.W., Mitchum, R.M., Vail, P.R., Sarg, J.F., Loutit, T.S., and
Hardenbol, J.,1988, An overview of sequence stratigraphy and key definitions, in Wilgus,
C.K., Hastings, B.S., Kendall, C.G.St.C., Posamentier, H.W., Ross C.A. and Van Wagoner,
J.C. eds., Sea Level Changes – An Integrated Approach. Society of Economic
Paleontologists and Mineralogists (SEPM), Special Publication 42, p.39-45.
Van Wagoner, J.C., Mitchum, R.M., Campion, K.M. and Rahmanian, V.D., 1990, Siliciclastic
sequence stratigraphy in well logs, core and outcrop: Concepts for high-resolution
correlation of time and facies. American Association of Petroleum Geology, Methods in
Exploration; No. 7, 55 p.
Walker, R.G.,1984, Facies Models Geological Association of Canada, 317 p.
Walker, R.G., 1992, Facies, facies models and modern stratigraphic concepts, in Walker, R.G.,
and James, N.P. eds., Facies Models - Response to Sea Level Change: Geological
Association of Canada, St. John's, Newfoundland, p. 1 – 14.
Wanless, H. R., and F. P. Shepard, 1936, Sea level and climatic changes related to late Paleozoic
cycles: Geological Society ofAmerica Bulletin, v. 47, p. 1177–1206.
Wanless, H. R., and Weller, J. M., 1932, Correlation and extent of Pennsylvanian cyclothems:
Geological Society of America Bulletin, v. 43, p. 1003–1016.
Weller, J. M., 1930, Cyclic sedimentation of the Pennsylvanian period and its significance:
Journal of Geology v. 38, p. 97–135.
Williams, E. G., and Keith, M. L., 1963, Relationship between sulfur in coals and the occurrence
of marine roof beds: Economic Geology, v. 58, p. 720-729.

113
Zahid, K. M., and Barbeau, Jr., D. L., 2011, Constructing sandstone provenance and classification
ternary diagrams using an electronic spreadsheet, Journal of Sedimentary Research, v.
81, p.702–707.
Zaitlin, B.A., Dalrymple, R., and Boyd, R., 1994, The stratigraphic organization of incised valley
systems associated with relative sea level changes, in Dalrymple, R., Boyd, R., and
Zaitlin, B.A. eds., Incised-Valley Systems: Origin and Sedimentary Sequences: SEPM
Special Publication, v. 51, p. 45 - 60.