Embed Size (px)
Citation preview

Development of a High Resolution Soil Moisture for Precision Agriculture in India
Kamal C. Das1, Jitendra Singh1, Jagabondhu Hazra2
1IBM Research, Delhi, India– India, Delhi 2 IBM Research, Bangalore, India
A paper from the Proceedings of the
14th International Conference on Precision Agriculture June 24 – 27, 2018
Le Centre Sheraton, Montreal, Cananda Abstract
Soil moisture and temperature are key inputs to several precision agricultural applications such as irrigation scheduling, identifying crop health, pest and disease prediction, yield and acreage estimation, etc. The existing remote sensing satellites based soil moisture products such as SMAP are of coarse resolution and physics based land surface model such as NLDAS, GLDAS are of coarse resolution as well as not available for real time applications. Keeping this in focus, we are developing a soil moisture and temperature map for India using high resolution land data assimilation system (HRLDAS) as a computing tool. The service is aimed to provide soil moisture and soil temperature at 1 km spatial resolution in near real-time (few hours’ latency) at four soil depths and vegetation root zones. The major highlights in the development of the service are: (1) use of Global Data Assimilation System (GDAS) dataset for dynamic forcing fields, (2) ability to ingest local information about the soil characteristics (3) high resolution USGS land-cover and other static datasets, amongst others. In this paper, we will focus on modelling set-up details and model evaluation. Model evaluation is performed against SMAP soil moisture data and local sensors observations using conventional statistics such as MAE, RMSE and correlation coefficient. The results clearly demonstrate the value of our service in comparison to exiting SMAP data. In summary, the high resolution soil moisture and soil temperature service that we have developed could be used effectively in a real-time decision support system in precision agriculture.
Keywords. Land surface model, Soil Moisture, GDAS, Precision Agriculture

Proceedings of the 14th International Conference on Precision Agriculture June 24 – June 27, 2018, Montreal, Quebec, Canada 2
Introduction Soil moisture and soil temperature are key inputs to several precision agricultural applications such as irrigation scheduling, identifying crop health, pest and disease prediction, yield and acreage estimation, etc. Even though India is not a water rich country, still it holds 2nd position world-wide in terms of farm output with average land holding less than a ha per farmer. Moreover, groundwater irrigation covers more than half of the total irrigation area (around 42 million ha) (Oza, 2017). Therefore, accurate knowledge of spatial and temporal variation in soil moisture/temperature at high resolution is critical for achieving sustainable and optimum water utilization in all agriculture applications. Soil moisture and temperature can be measured by instruments in the field (Johnson, 1962), estimated by remote sensing techniques (Schmugge, 1983) or physics based land surface model (LSM) (Ek et al., 2003). In-site ground measurements offer us direct measurements of soil moisture/temperature, but they are at point scale, expensive, and sparse in time and space. The field of remote sensing soil moisture has been widening in a huge manner during the past decades with the advancement in earth observation technologies. The remote sensors, giving the most reliable soil moisture estimates (passive microwave) includes the European Space Agency (ESA) Soil Moisture and Ocean Salinity (SMOS) mission launched in Nov 2009, and the National Aeronautics and Space Administration (NASA) Soil Moisture Active Passive (SMAP) mission scheduled for launch in Oct 2014. Such remote sensors have relatively low spatial resolution from space, being on the order of 50 km. The data of the other high spatial resolution satellite observations, viz active microwave, visible and thermal have been shown to contain information on soil moisture, is noisy and/or difficult to interpret. Beside, a soil moisture estimate for the top few centimetres is provided by most of the remote sensing techniques. However, using the noisy high resolution data and/or modeling, downscaling of the low resolution passive microwave data is expected. For instance, by merging 3km active microwave data with 36km passive microwave data along with land data assimilation, SMAP (SPL4SMGP) provide a 9km resolution soil moisture product. Recent modeling advances centered around LSM’s demonstrate the feasibility of modelling land surface water and energy balance processes at continental scales using forcing data obtained from both in-situ and remote sensing sources (Crow and Wood, 2003). Therese are several soil moisture products based on LSM with a spatial resolution typically 10-50km. Worth mentioning among them are North American Land Data Assimilation System (Mitchell et al., 2004), Global Land Data Assimilation System (Rui and Beaudoing, 2011), ECMWF. Furthermore, LSM based results are greatly dependent on forcing data quality, and there are large discrepancies among models (Seneviratne et al., 2010). Although available LSM based soil moisture products mostly has global coverage, but are in coarse resolution and also not available in real time. For Indian regions, there is a need to cross validate recent past soil moisture LSM data, remotely sensed data and in situ observations to ensure consistency and quantifying uncertainties. This is particularly true for India characterized by diverse climatic zones. There are several studies which report spatio-temporal variation of soil moisture at coarse resolution for Indian regions (Bhimala and Goswami, 2015; Chakravorty et al., 2016) and validated with in-situ observation. However, there is strong need to develop high spatial

Proceedings of the 14th International Conference on Precision Agriculture June 24 – June 27, 2018, Montreal, Quebec, Canada 3
and temporal resolution soil moisture products for agriculture applications. Keeping this in focus, we have customized high resolution land data assimilation system (HRLDAS) for India with spatial resolution of 1km´1km and hourly temporal resolution. In this paper, we report HRLDAS (Mahoney, 2014) based real time soil moisture/temperature map up to root-zone (top 1m). We present the performance of the customized model against SMAP soil moisture data and local sensors observations. The results demonstrate that the customized model performs better in comparison to SMAP data.
Model description-HRLDAS 2D In this study, we use High-Resolution Land Data Assimilation System (HRLDAS) for developing a soil moisture service (Chen et al., 2007). The goal of the service is to provide near real-time (maximum of one-day latency) soil moisture and other soil related parameters for whole of India. At the core of the HRLDAS model is an uncoupled land surface modelling system based on an advanced version of the Noah-Land Surface Model (Noah-LSM) (Ek et al., 2003), named as Noah-Multi-parameterization (Noah-MP). The foundational Noah-LSM has been developed over two decades with major efforts taken by NCAR, NCEP, Orgean State University and U.S Air Force Weather Agency. The Noah-LSM has been implemented in the fifth-generation Pennsylvania State University–NCAR Mesoscale Model (MM5) and a popular numerical weather prediction model the Weather Research and Forecast (WRF) model. The Noah LSM couples the diurnally dependent Penman potential evaporation approach, the multilayer soil model, and the primitive canopy model. It has been extended to include the modestly complex canopy resistance approach to include frozen ground physics. Recent updates to the Noah LSM include new treatment of soil thermal conductivity and ground heat flux for wet soils and snowpack, as well as improvement to the formulation of bare-soil evaporation, a simple urban land use treatment, and seasonal variability of surface emissivity. The Noah LSM has one canopy layer and the following prognostic variables: total volumetric soil moisture and volumetric liquid soil moisture, soil temperature in four soil layers, water stored on the canopy, bulk snowpack density, snow albedo, and snow stored on the ground are directly computed. The model has the flexibility to define the thickness of soil layers depending on the application-ideal to compute near-surface and root-zone soil moisture. The total soil depth is 2m, and the vegetation root depth varies as a function of land use types in the upper 1.5 m of soil. The HRLDAS runs Noah-MP LSM in an offline and uncoupled mode. It requires a set of input static and dynamic parameters, listed below: Static and initialization parameters The prominent static fields required are: terrain elevation data, land cover, soil type, monthly averaged surface albedo, green vegetation fraction, leaf area index, etc. Most of these data sets are available in public domain for the WRF model along with the pre-processing codes. In addition, initialization fields are also required. These are: soil moisture and temperature data, skin temperature, water equivalent snow depth, plant canopy surface water. These initial fields are extracted from the Global Data Assimilation System (GDAS) (Rodell et al., 2004) at model initial time.
Proceedings of the 14th International Conference on Precision Agriculture June 24 – June 27, 2018, Montreal, Quebec, Canada 4
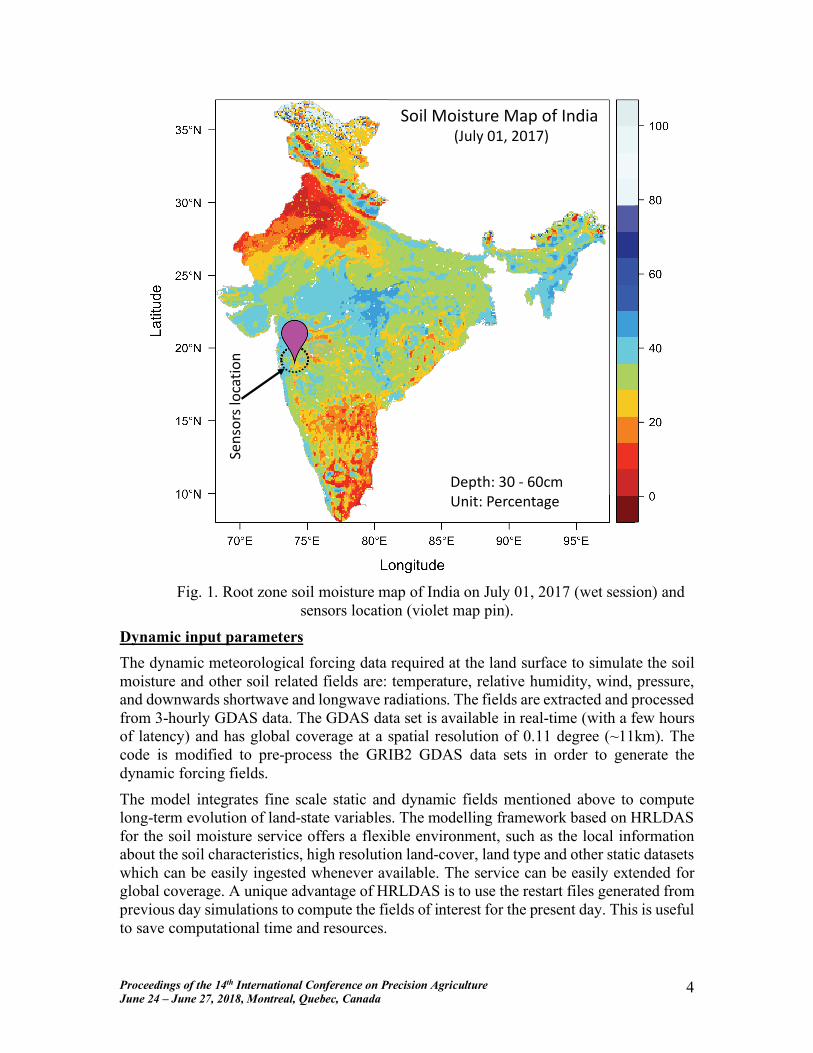
Fig. 1. Root zone soil moisture map of India on July 01, 2017 (wet session) and
sensors location (violet map pin).
Dynamic input parameters The dynamic meteorological forcing data required at the land surface to simulate the soil moisture and other soil related fields are: temperature, relative humidity, wind, pressure, and downwards shortwave and longwave radiations. The fields are extracted and processed from 3-hourly GDAS data. The GDAS data set is available in real-time (with a few hours of latency) and has global coverage at a spatial resolution of 0.11 degree (~11km). The code is modified to pre-process the GRIB2 GDAS data sets in order to generate the dynamic forcing fields. The model integrates fine scale static and dynamic fields mentioned above to compute long-term evolution of land-state variables. The modelling framework based on HRLDAS for the soil moisture service offers a flexible environment, such as the local information about the soil characteristics, high resolution land-cover, land type and other static datasets which can be easily ingested whenever available. The service can be easily extended for global coverage. A unique advantage of HRLDAS is to use the restart files generated from previous day simulations to compute the fields of interest for the present day. This is useful to save computational time and resources.
!"#$%&$'(%)*+,%#
!%,('-%,$+.&"'-*/'%0'1#2,*34.(5'678'967:;
<"/+=>'?6'@ A6)B'C#,+>'D"&)"#+*E"

Proceedings of the 14th International Conference on Precision Agriculture June 24 – June 27, 2018, Montreal, Quebec, Canada 5
Fig. 2. Root zone soil moisture map of India on April 01, 2018 (dry session).
SMAP Data The SMAP mission (launched on 31 January 2015) (Entekhabi et al., 2010) measures passive land surface microwave emission and active radar backscatter. It is designed to measure surface soil moisture and it repeatedly measures soil moisture every 2-3 days with coarse resolution (36km). The SMAP Level 4 surface (0-5 cm) and root zone (0-100 cm) soil moisture (SPL4SMGP) data is 9 km for spatial resolution and 3 hours for temporal resolution with global coverage selected for this agricultural soil moisture comparison purpose. In situ measurements Soil moisture sensors typically refer to sensors that estimate volumetric water content. In this study, capacitance based moisture sensors deployed within agricultural land in district Pune, state of Maharashtra, India (sensors location are shown in Fig. 1) for the validation of the high resolution soil moisture product. Moisture sensors works on the principle of the change in the dielectric constant. Sensors location fields are rain-fed for crop cultivation (Tomato and Potato). Sensors (soil moisture/temperature) are installed at depth of 30cm from surface and hourly data are collected through wireless technology.
SoilMoistureMapofIndia(April01,2018)
Depth:30- 60cmUnit:Percentage

Proceedings of the 14th International Conference on Precision Agriculture June 24 – June 27, 2018, Montreal, Quebec, Canada 6
Fig. 3. Soil moisture values distribution during wet and dry seasons.
Result and Discussion The HRLDAS model simulates a large number of land surface parameters. In this section, soil moisture map over India and the performance of the LSM model is evaluated against soil moisture from SMAP and in-situ observations and soil temperature from in-situ observations. The model is run for the period of February 2015 to real time (one-day latency) with a spin-up period considered till June 2017 and remaining four months are taken for evaluating the model performance. The variation of moisture content over different land regions of India is mainly controlled by seasons and to a great extent by monsoon (June-August) flow over India. The wet and dry seasons soil moisture variations at root zone depth over India are shown in Fig. 1 and 2 respectively. In the wet season, the maximum soil moisture values (20% – 45% vwc) are seen over Central zone, North East zone and some areas over West zone/coastal regions. In the dry season, the maximum soil moisture values (20% – 40% vwc) are seen in similar areas as in case of wet season (Central zone, North East Zone and some areas over west zone/coastal regions). Soil moisture data distribution plot for wet and dry seasons is shown in Fig. 3. It can be seen that, during wet season soil moisture values mostly occurs in the range of 30-35%. Whereas, during dry season, mostly occurred soil moisture values are in the range of 25-30%. These results (spatial distribution of both wet and dry seasons) of soil moisture is broadly agreed over Indian region in the earlier study (Unnikrishnan et al., 2016). In the following sections, we will discuss model validation with in-situ observations.

Proceedings of the 14th International Conference on Precision Agriculture June 24 – June 27, 2018, Montreal, Quebec, Canada 7
Fig. 4. Time series of in-situ measurements (blue circle), SMAP SM (black line) and
LSM SM (red line) at sensor location A.
Fig. 5. Time series of in-situ measurements (blue circle), SMAP SM (black line) and
LSM SM (red line) at sensor location B. Soil moisture validation with in-situ observations Fig. 4 and 5 shows time series of LSM SM along with SMAP SM and the in situ measurements for sensor location A and B respectively. It indicates that soil moisture is well simulated by the model. Time series profile of SMAP soil moisture at both the sensor locations are same as the sensors are at close proximity (sensor A and B are within 2km radius) and lie within same SMAP pixel, whereas LSM based SM shows different time series profile due to presence of different soil types. At sensor location A, soil type is silt loam and cultivated crop is Tomato whereas, at location B, soil type is black cotton and crop is Potato. In both sensor location, the soil moisture is observed to decrease faster in the model simulation and SMAP compared to sensor data. This indicates that the LSM and SMAP is losing moisture at a faster rate than that of in situ moisture. This may be due to higher evaporation rate or faster subsurface runoff or both. Table 1 shows mean absolute
15
20
25
30
35
40
45
Date − 2017
Soil
Mois
ture
(%
)
15
20
25
30
35
40
45
Date − 2017
Soil
Mois
ture
(%
)
15
20
25
30
35
40
45
Date − 2017
Soil
Mois
ture
(%
)
01−
Jul
08−
Jul
15−
Jul
22−
Jul
29−
Jul
05−
Aug
12−
Aug
19−
Aug
26−
Aug
02
−S
ep
09
−S
ep
16
−S
ep
23
−S
ep
30
−S
ep
07−
Oct
14−
Oct
21−
Oct
SensorSMAPLSM
15
20
25
30
35
40
45
Date − 2017
So
il M
ois
ture
(%
)
15
20
25
30
35
40
45
Date − 2017
So
il M
ois
ture
(%
)
15
20
25
30
35
40
45
Date − 2017
So
il M
ois
ture
(%
)
01−
Jul
08−
Jul
15−
Jul
22−
Jul
29−
Jul
05−
Aug
12−
Aug
19−
Aug
26−
Aug
02−
Sep
09−
Sep
16−
Sep
23−
Sep
30−
Sep
07−
Oct
14−
Oct
21−
Oct
SensorSMAPLSM
Proceedings of the 14th International Conference on Precision Agriculture June 24 – June 27, 2018, Montreal, Quebec, Canada 8
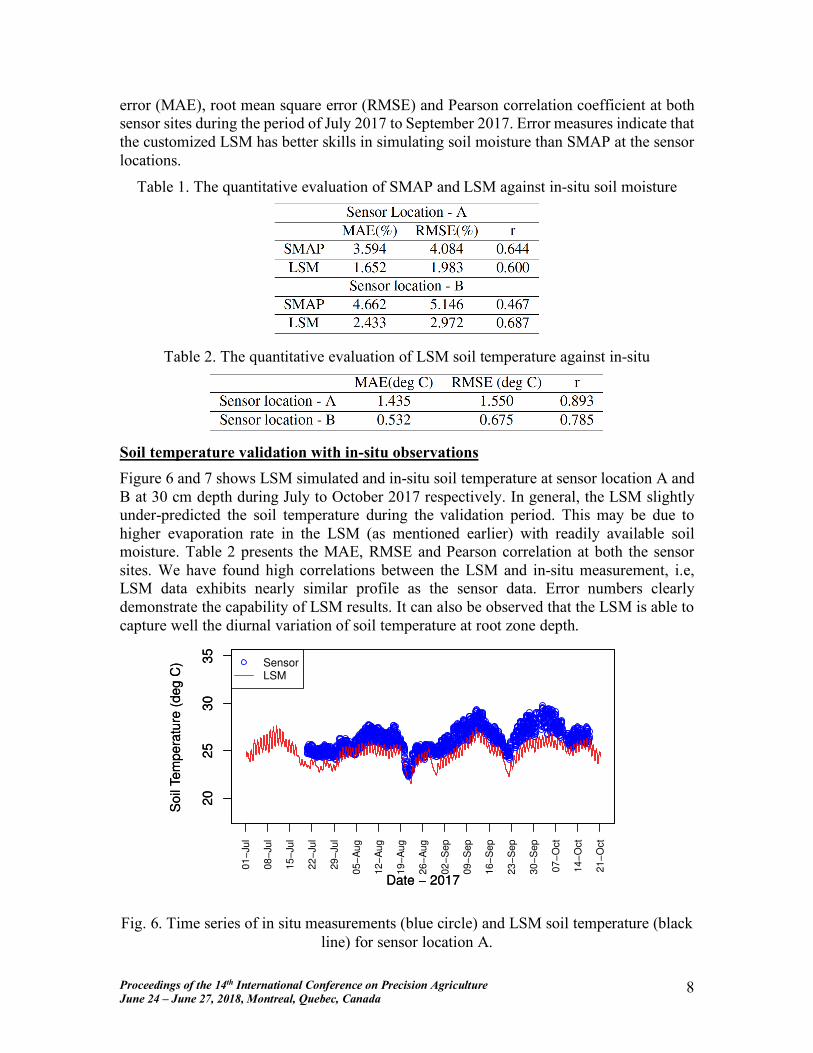
error (MAE), root mean square error (RMSE) and Pearson correlation coefficient at both sensor sites during the period of July 2017 to September 2017. Error measures indicate that the customized LSM has better skills in simulating soil moisture than SMAP at the sensor locations.
Table 1. The quantitative evaluation of SMAP and LSM against in-situ soil moisture
Table 2. The quantitative evaluation of LSM soil temperature against in-situ
Soil temperature validation with in-situ observations Figure 6 and 7 shows LSM simulated and in-situ soil temperature at sensor location A and B at 30 cm depth during July to October 2017 respectively. In general, the LSM slightly under-predicted the soil temperature during the validation period. This may be due to higher evaporation rate in the LSM (as mentioned earlier) with readily available soil moisture. Table 2 presents the MAE, RMSE and Pearson correlation at both the sensor sites. We have found high correlations between the LSM and in-situ measurement, i.e, LSM data exhibits nearly similar profile as the sensor data. Error numbers clearly demonstrate the capability of LSM results. It can also be observed that the LSM is able to capture well the diurnal variation of soil temperature at root zone depth.
Fig. 6. Time series of in situ measurements (blue circle) and LSM soil temperature (black
line) for sensor location A.
20
25
30
35
Date − 2017
Soil
Tem
pera
ture
(deg C
)
20
25
30
35
Date − 2017
Soil
Tem
pera
ture
(deg C
)
01
−Ju
l
08
−Ju
l
15
−Ju
l
22
−Ju
l
29
−Ju
l
05
−A
ug
12
−A
ug
19
−A
ug
26
−A
ug
02
−S
ep
09
−S
ep
16
−S
ep
23
−S
ep
30
−S
ep
07
−O
ct
14
−O
ct
21
−O
ct
SensorLSM

Proceedings of the 14th International Conference on Precision Agriculture June 24 – June 27, 2018, Montreal, Quebec, Canada 9
Fig. 7. Time series of in situ measurements (blue circle) and LSM soil temperature (black
line) for sensor location A.
Conclusions HRLDAS model is customized for simulating the land surface parameters for an Indian region. The model validation is carried out at two sensor locations in the state of Maharashtra. Soil moisture and temperature are well estimated by the model at these sites. It is suspected that the model has slower infiltration rate and higher evaporation rate or faster lateral run off than the actual. This aspect will be investigated further when more in-situ observation data is available in future. This is our ongoing effort and in future we will incorporate synthetic aperture radar (SAR) remote sensing data to derive LSM model which may further improve accuracy. In summary, the LSM computed high resolution soil moisture and temperature could be effectively used in a real-time decision support system in precision agriculture.
Reference Bhimala, K. R., & Goswami, P. (2015). A Comparison of ASCAT Soil Moisture Data With In Situ Observations Over the Indian Region: A Multiscale Analysis. IEEE Transactions on Geoscience and Remote Sensing, 53(10), 5425-5434. Chakravorty, A., Chahar, B. R., Sharma, O. P., & Dhanya, C. T. (2016). A regional scale performance evaluation of SMOS and ESA-CCI soil moisture products over India with simulated soil moisture from MERRA-Land. Remote Sensing of Environment, 186, 514-527. Chen, F., Manning, K. W., LeMone, M. A., Trier, S. B., Alfieri, J. G., Roberts, R., ... & Basara, J. B. (2007). Description and evaluation of the characteristics of the NCAR high-resolution land data assimilation system. Journal of applied Meteorology and Climatology, 46(6), 694-713.
20
25
30
35
Date − 2017
So
il Te
mp
era
ture
(d
eg
C)
20
25
30
35
Date − 2017
So
il Te
mp
era
ture
(d
eg
C)
01−
Jul
08−
Jul
15−
Jul
22−
Jul
29−
Jul
05−
Aug
12−
Aug
19−
Aug
26−
Aug
02−
Sep
09−
Sep
16−
Sep
23−
Sep
30−
Sep
07−
Oct
14−
Oct
21−
Oct
SensorLSM

Proceedings of the 14th International Conference on Precision Agriculture June 24 – June 27, 2018, Montreal, Quebec, Canada 10
Crow, W. T., & Wood, E. F. (2003). The assimilation of remotely sensed soil brightness temperature imagery into a land surface model using ensemble Kalman filtering: A case study based on ESTAR measurements during SGP97. Advances in Water Resources, 26(2), 137-149. Ek, M. B., Mitchell, K. E., Lin, Y., Rogers, E., Grunmann, P., Koren, V., ... & Tarpley, J. D. (2003). Implementation of Noah land surface model advances in the National Centers for Environmental Prediction operational mesoscale Eta model. Journal of Geophysical Research: Atmospheres, 108(D22). Entekhabi, D., Njoku, E. G., O'Neill, P. E., Kellogg, K. H., Crow, W. T., Edelstein, W. N., ... & Kimball, J. (2010). The soil moisture active passive (SMAP) mission. Proceedings of the IEEE, 98(5), 704-716. Johnson, A. I. (1962). Methods of measuring soil moisture in the field. US Government Printing Office. Mahoney, W., Barlage, M., Gochis, D., and Chen, F., (2014). Developing a high-resolution land data assimilation and forecast system for agricultural decision support. 10th International conference on Precision Agriculture.
Mitchell, K. E., Lohmann, D., Houser, P. R., Wood, E. F., Schaake, J. C., Robock, A., ... & Higgins, R. W. (2004). The multi-institution North American Land Data Assimilation System (NLDAS): Utilizing multiple GCIP products and partners in a continental distributed hydrological modeling system. Journal of Geophysical Research: Atmospheres, 109(D7). Oza, Apoorva. "Irrigation: Achievements and Challenges." India Infrastructure Report 2007 (2007). Rodell, M., Houser, P. R., Jambor, U. E. A., Gottschalck, J., Mitchell, K., Meng, C. J., ... & Entin*, J. K. (2004). The global land data assimilation system. Bulletin of the American Meteorological Society, 85(3), 381-394. Rui, H., & Beaudoing, H. (2011). Readme document for global land data assimilation system version 2 (GLDAS-2) products. GES DISC. Schmugge, T. J. (1983). Remote sensing of soil moisture: Recent advances. IEEE Transactions on Geoscience and Remote Sensing, (3), 336-344. Seneviratne, S. I., Corti, T., Davin, E. L., Hirschi, M., Jaeger, E. B., Lehner, I., ... & Teuling, A. J. (2010). Investigating soil moisture–climate interactions in a changing climate: A review. Earth-Science Reviews, 99(3-4), 125-161. Unnikrishnan, C. K., George, J. P., Lodh, A., Maurya, D. K., Mallick, S., Rajagopal, E. N., & Mohandas, S. (2016). Validation of two gridded soil moisture products over India with in-situ observations. Journal of Earth System Science, 125(5), 935-944.