Embed Size (px)
Citation preview
DEVELOPMENT OF A DIRECT REACTIVITY MEASUREMENT METHOD FOR VOLATILE ORGANIC COMPOUNDS
By William P. L. Carter
College of Engineering Center for Environmental
Research and Technology University of California, Riverside, CA 92521
Outline •
Background: Factors affecting O3 Reactivity of VOCs; Mechanism Evaluation Needs
•
Direct Reactivity: What it is; How to Measure; Relationship to Other Reactivity Measures
•
Experimental Approaches Examined
•
Results
•
Ongoing Work
•
Conclusions
VOC REACTIVITY
The atmospheric oxidation reactions of Volatile Organic Compounds (VOCs) result in enhanced formation of ground-level ozone from NOx.
VOCs differ in their effects on ozone formation. The term reactivity is used to refer to this.
Several aspects of a VOC’s atmospheric reactions affect its O3 reactivity:
•
Direct Effects:
•
How fast it reacts;
•
How much O3 is formed directly from its reactions and those of its products
•
Indirect Effects
•
Whether it enhances or inhibits radicals. Affects how fast O3 is formed from all VOCs
•
Whether it enhances rates of NOx removal. This affects ultimate O3 yields when NOx is limited.
The VOCs effect on O3 also depends on the nature of the environment where it reacts
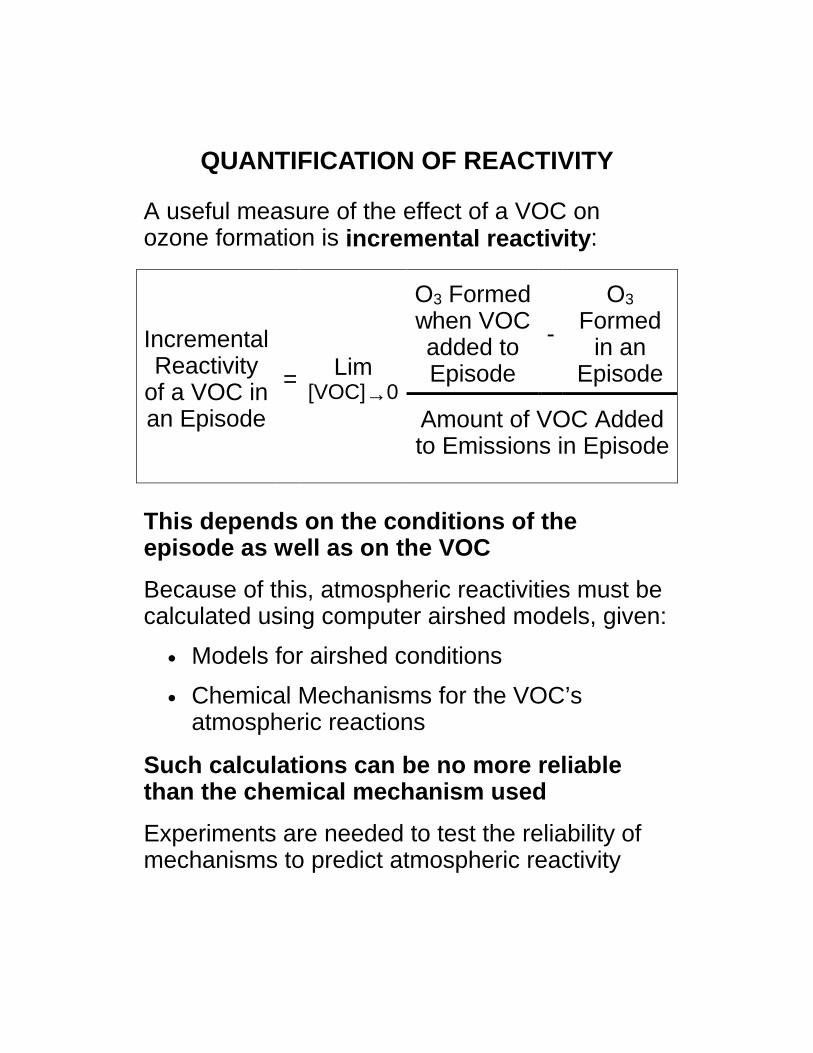
QUANTIFICATION OF REACTIVITY
A useful measure of the effect of a VOC on ozone formation is incremental reactivity:
O3 Formed when VOC added to Episode
-O3
Formed in an
Episode Incremental Reactivity
of a VOC in an Episode
= Lim [VOC]→0
Amount of VOC Added to Emissions in Episode
This depends on the conditions of the episode as well as on the VOC Because of this, atmospheric reactivities must be calculated using computer airshed models, given:
•
Models for airshed conditions
•
Chemical Mechanisms for the VOC’s atmospheric reactions
Such calculations can be no more reliable than the chemical mechanism used Experiments are needed to test the reliability of mechanisms to predict atmospheric reactivity

ENVIRONMENTAL CHAMBER EXPERIMENTS
Environmental chamber reactivity experiments have been the primary means used to evaluate mechanisms for predicting effects of VOCs on O3
These involve determining effect of adding the VOC to standard “ROG Surrogate - NOx - air irradiation experiments.
Using different kinds of ROG surrogates and ROG/NOx ratios give results that have different sensitivities to different mechanism aspects.
•
High ROG/NOx “Mini-Surrogate” experiments most sensitive to radical effects
•
Standard “Full Surrogate” experiments give best correlation to atmospheric MIR
•
Low NOx “Full Surrogate” experiments more sensitive to NOx removal effects
Such experiments have been used to derive and evaluate mechanisms of ~60 types of VOCs for the SAPRC-99 reactivity scales
LIMITATIONS OF ENVIRONMENTAL CHAMBER EXPERIMENTS FOR
MECHANISM EVALUATION
•
Very expensive to carry out (now ≥≥≥≥ $40K per VOC)
•
Requires special expertise available at only a few laboratories
•
Lower sensitivity to effects of oxidation products than predicted for the atmosphere
•
Ambiguous mechanism evaluation data when more than one aspect of the mechanism is uncertain
•
Not well suited for low volatility compounds
MEASUREMENT OF DIRECT REACTIVITY
Direct reactivity is the effect of the VOC on O3 formation directly due to its reactions or reactions of its products
One of the important factors affecting O3 reactivity in the atmosphere
Often ambiguous to evaluate in environmental chamber reactivity experiments
•
Radical initiation/inhibition effects can dominate results of High NOx experiments
•
NOx removal effects can dominate results of low NOx experiments
•
Errors in these indirect effects could mask (compensate for) errors in mechanism affecting direct reactivity in the atmosphere.
A direct reactivity measurement method could reduce the ambiguities in mechanism evaluation, especially for radical inhibiting VOCs
A direct reactivity measurement using a flow system may be more suitable to use with low volatility compounds than chamber experiments
EXPERIMENTAL APPROACHES TO MEASURE DIRECT REACTIVITY
Requirements •
Sensitive to NO → NO2 conversion processes that are responsible for O3 formation
•
Both radicals and NOx in excess to reduce sensitivity to indirect effects
HONO Photolysis System •
Large internal radical source and sink processes
•
NOx present in excess
•
Major reactions in absence of VOC result in consumption of HONO and formation of NO, NO2, and HNO3
•
Addition of reactive VOC causes NO to NO2 conversions that reduce NO levels and (if enough VOC is added) O3 formation
•
Effect of added VOC on ∆([O3]-[NO]) reflects the NO to NO2 conversions caused by the added VOC, which is its direct reactivity.
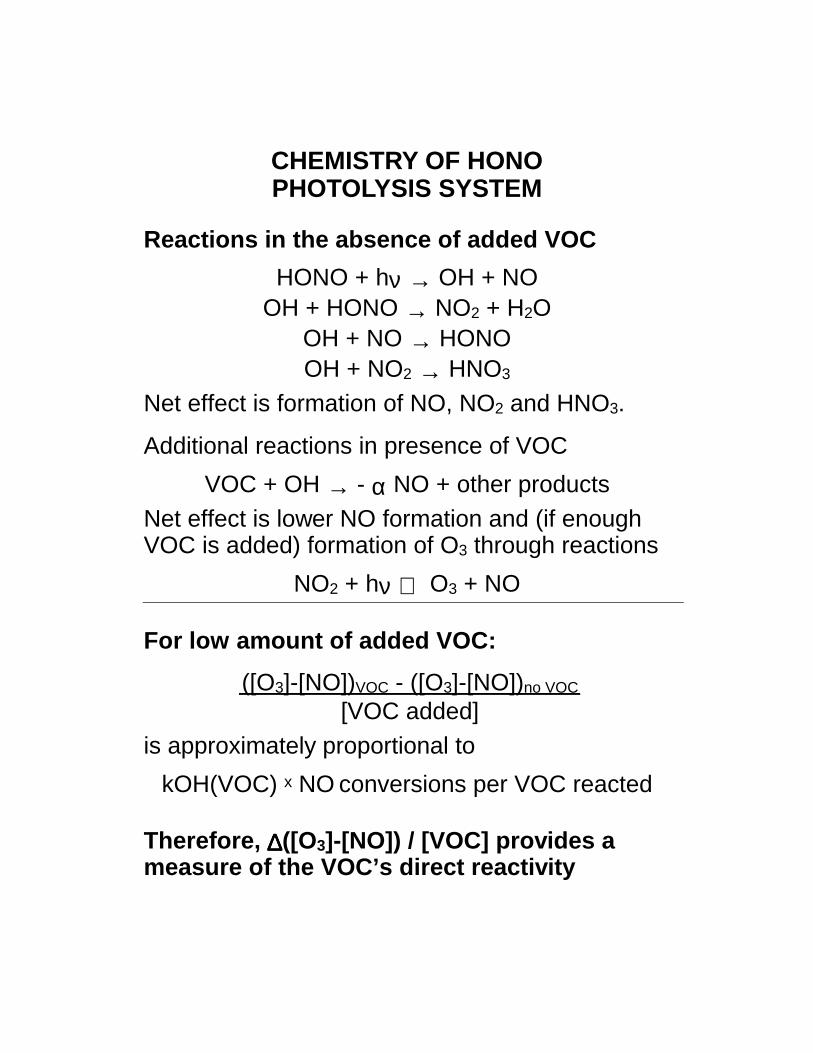
CHEMISTRY OF HONO PHOTOLYSIS SYSTEM
Reactions in the absence of added VOC HONO + hν → OH + NO OH + HONO → NO2 + H2O OH + NO → HONO OH + NO2 → HNO3 Net effect is formation of NO, NO2 and HNO3.
Additional reactions in presence of VOC VOC + OH → - α NO + other products Net effect is lower NO formation and (if enough VOC is added) formation of O3 through reactions NO2 + hν ⇔ O3 + NO
For low amount of added VOC: ([O3]-[NO])VOC - ([O3]-[NO])no VOC [VOC added]
is approximately proportional to kOH(VOC) x NO conversions per VOC reacted
Therefore, ∆∆∆∆([O3]-[NO]) / [VOC] provides a measure of the VOC’s direct reactivity
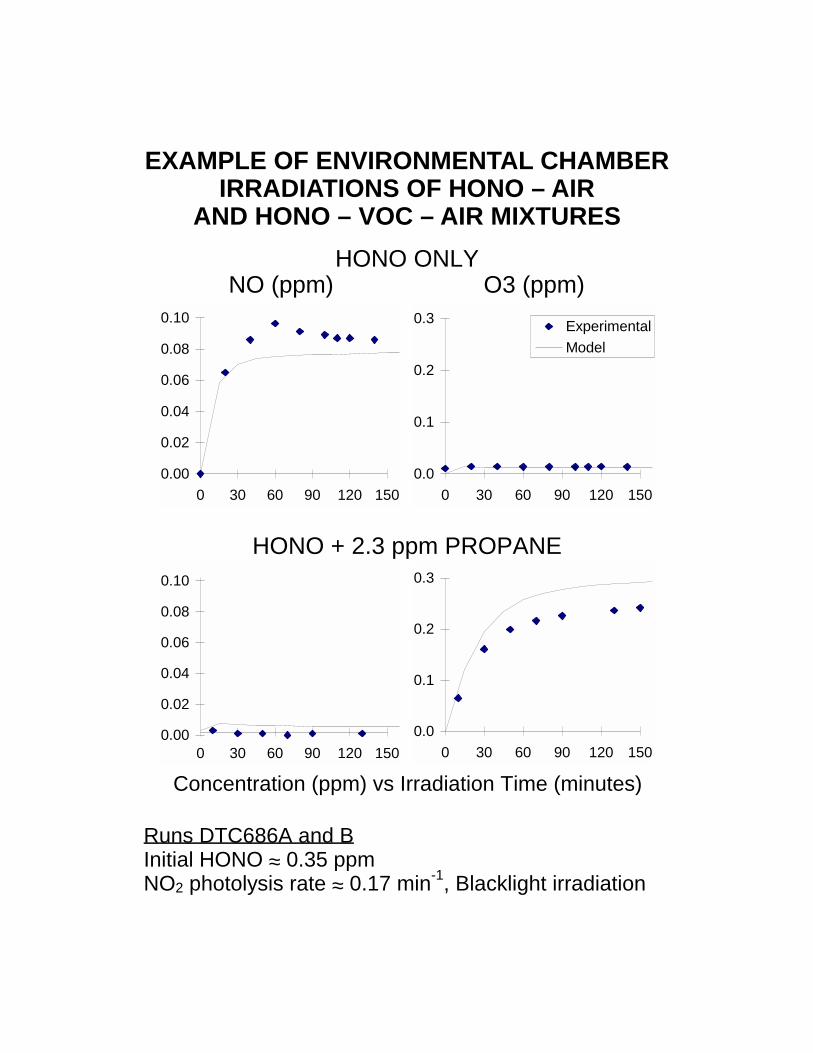
EXAMPLE OF ENVIRONMENTAL CHAMBER IRRADIATIONS OF HONO – AIR
AND HONO – VOC – AIR MIXTURES HONO ONLY
NO (ppm) O3 (ppm)
0.0
0.1
0.2
0.3
0 30 60 90 120 150
ExperimentalModel
0.00
0.02
0.04
0.06
0.08
0.10
0 30 60 90 120 150
HONO + 2.3 ppm PROPANE
Concentration (ppm) vs Irradiation Time (minutes)
0.0
0.1
0.2
0.3
0 30 60 90 120 1500.00
0.02
0.04
0.06
0.08
0.10
0 30 60 90 120 150
Runs DTC686A and B Initial HONO ≈ 0.35 ppm NO2 photolysis rate ≈ 0.17 min-1, Blacklight irradiation
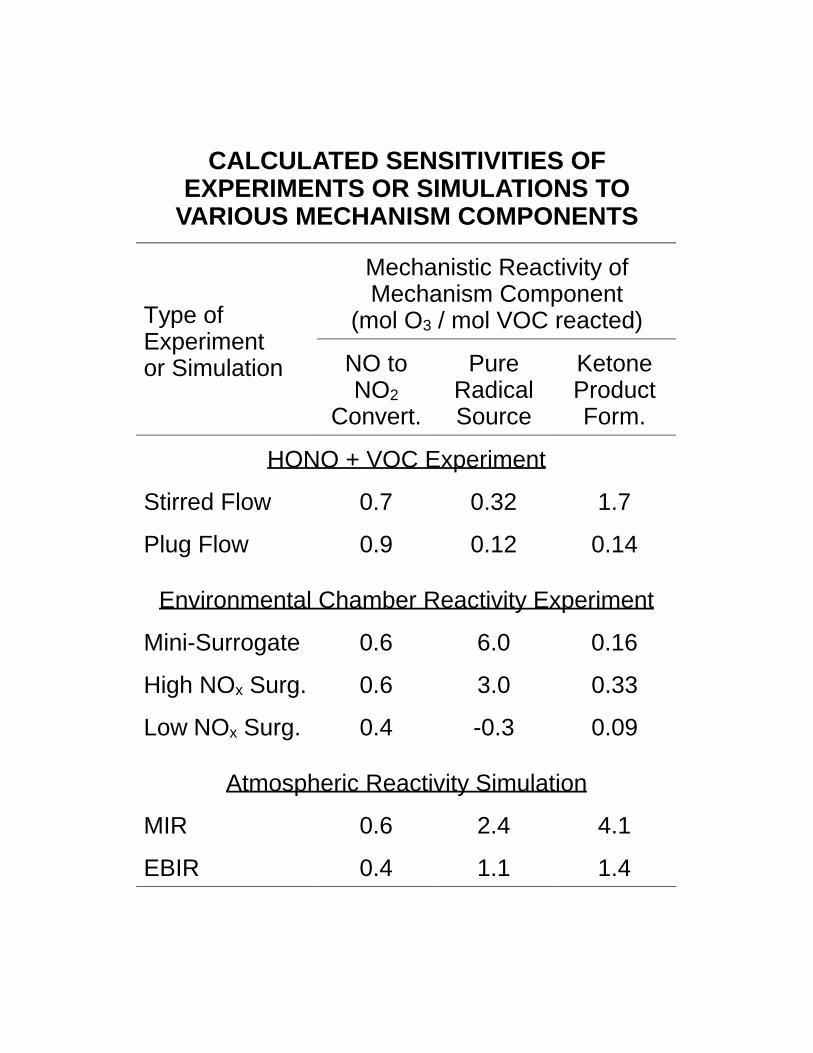
CALCULATED SENSITIVITIES OF EXPERIMENTS OR SIMULATIONS TO
VARIOUS MECHANISM COMPONENTS
Mechanistic Reactivity of Mechanism Component
(mol O3 / mol VOC reacted) Type of Experiment or Simulation NO to
NO2 Convert.
Pure Radical Source
Ketone Product Form.
HONO + VOC Experiment
Stirred Flow 0.7 0.32 1.7
Plug Flow 0.9 0.12 0.14
Environmental Chamber Reactivity Experiment
Mini-Surrogate 0.6 6.0 0.16
High NOx Surg. 0.6 3.0 0.33
Low NOx Surg. 0.4 -0.3 0.09
Atmospheric Reactivity Simulation
MIR 0.6 2.4 4.1
EBIR 0.4 1.1 1.4
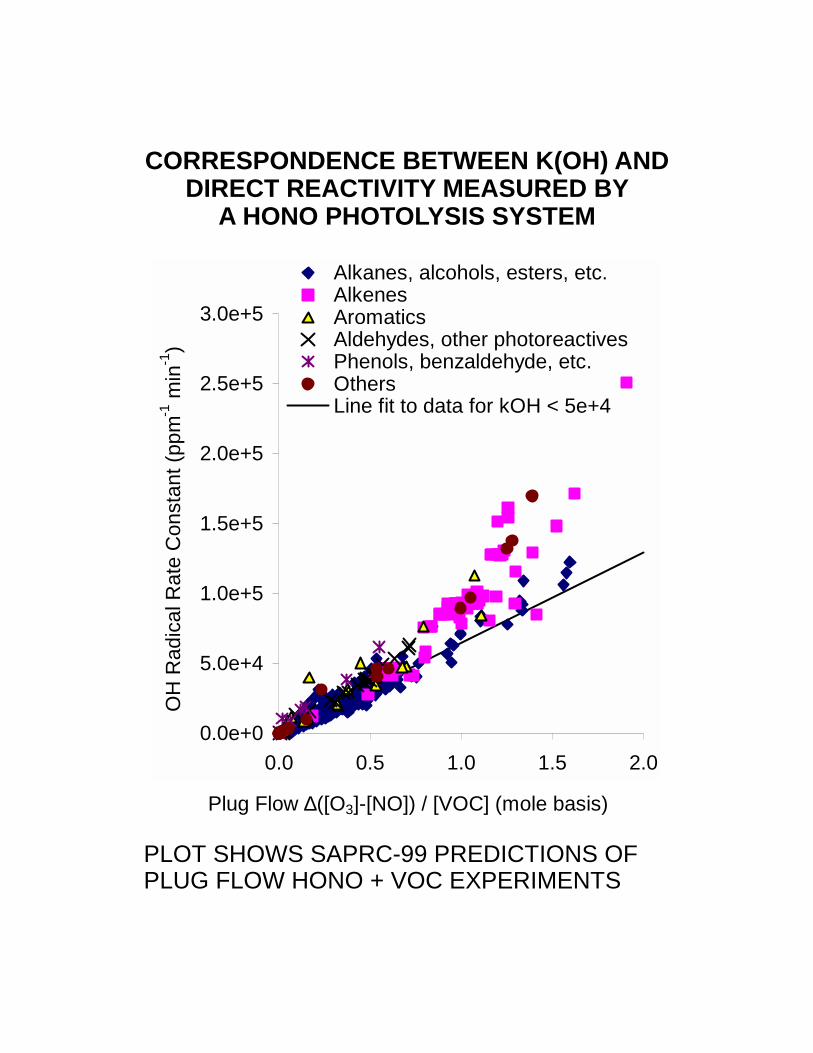
CORRESPONDENCE BETWEEN K(OH) AND DIRECT REACTIVITY MEASURED BY
A HONO PHOTOLYSIS SYSTEM
Plug Flow ∆([O3]-[NO]) / [VOC] (mole basis)
0.0e+0
5.0e+4
1.0e+5
1.5e+5
2.0e+5
2.5e+5
3.0e+5
0.0 0.5 1.0 1.5 2.0
OH
Rad
ical
Rat
e C
onst
ant (
ppm
-1 m
in-1
)
Alkanes, alcohols, esters, etc.AlkenesAromaticsAldehydes, other photoreactivesPhenols, benzaldehyde, etc.OthersLine fit to data for kOH < 5e+4
PLOT SHOWS SAPRC-99 PREDICTIONS OF PLUG FLOW HONO + VOC EXPERIMENTS
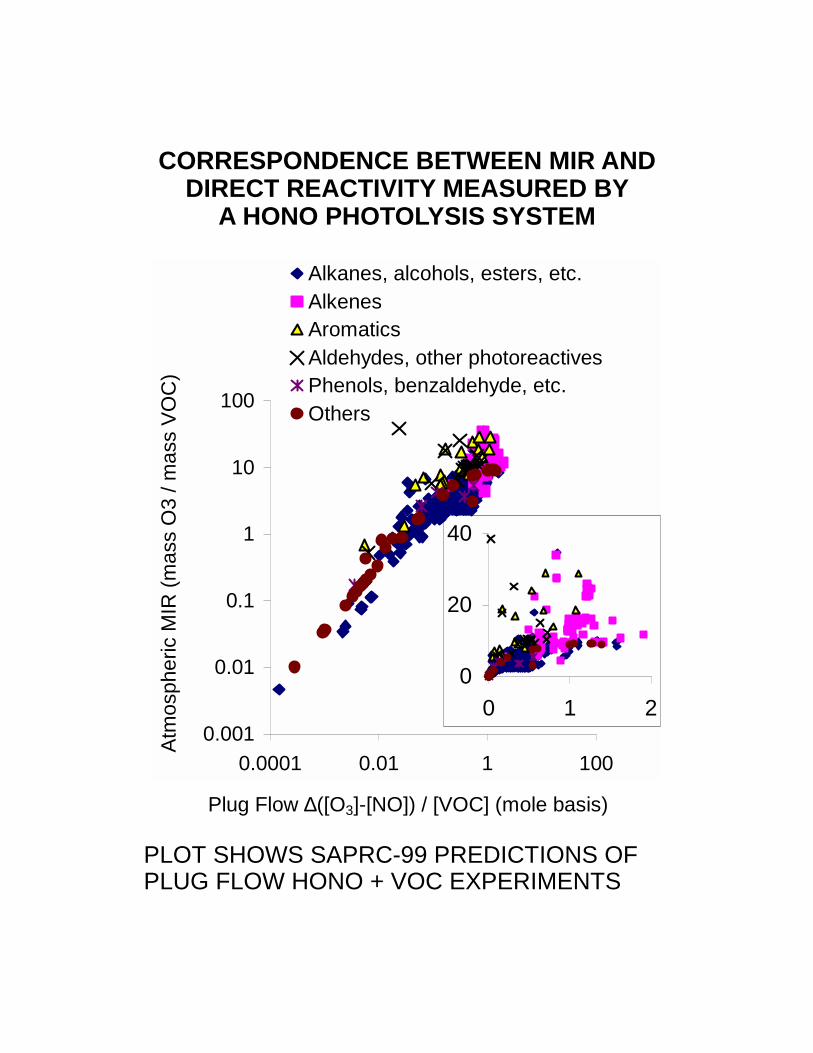
CORRESPONDENCE BETWEEN MIR AND DIRECT REACTIVITY MEASURED BY
A HONO PHOTOLYSIS SYSTEM
Plug Flow ∆([O3]-[NO]) / [VOC] (mole basis)
0.001
0.01
0.1
1
10
100
0.0001 0.01 1 100
Atm
osph
eric
MIR
(mas
s O
3 / m
ass
VOC
)
Alkanes, alcohols, esters, etc.AlkenesAromaticsAldehydes, other photoreactivesPhenols, benzaldehyde, etc.Others
0
20
40
0 1 2
PLOT SHOWS SAPRC-99 PREDICTIONS OF PLUG FLOW HONO + VOC EXPERIMENTS
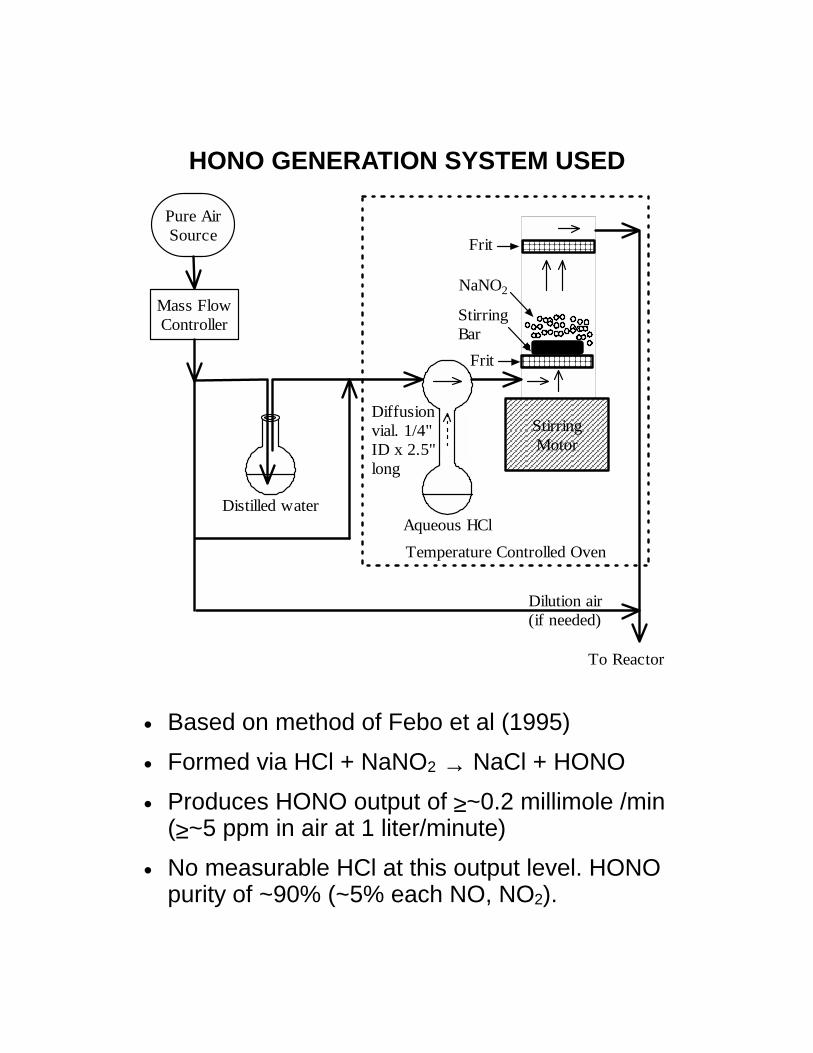
HONO GENERATION SYSTEM USED
Distilled water
Pure AirSource
Aqueous HClTemperature Controlled Oven
StirringMotor
NaNO2
StirringBar
Dilution air(if needed)
To Reactor
Frit
Frit
Mass FlowController
Diffusionvial. 1/4"ID x 2.5"long
•
Based on method of Febo et al (1995)
•
Formed via HCl + NaNO2 → NaCl + HONO
•
Produces HONO output of ≥~0.2 millimole /min (≥~5 ppm in air at 1 liter/minute)
•
No measurable HCl at this output level. HONO purity of ~90% (~5% each NO, NO2).
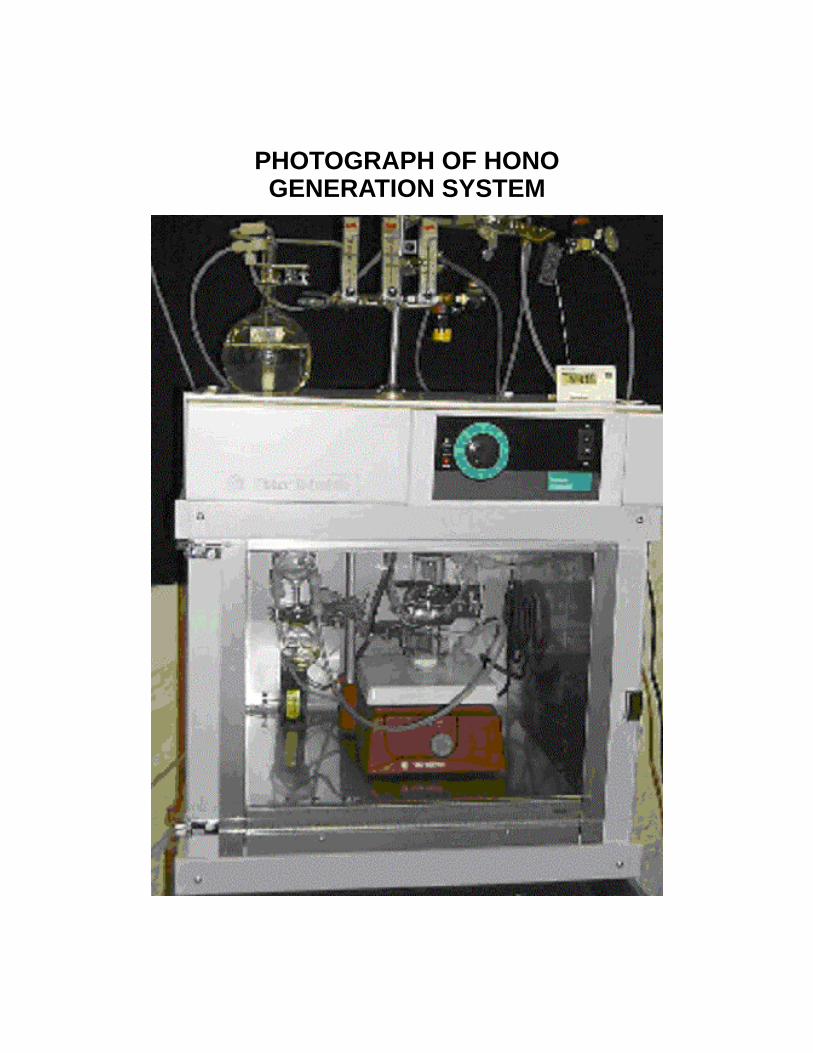
PHOTOGRAPH OF HONO GENERATION SYSTEM
ALTERNATIVE EXPERIMENTAL APPROACHES FOR HONO – VOC
REACTION SYSTEM
Static System Irradiation of HONO and HONO + VOC in a static reactor or environmental chamber
Advantages:
•
Simplest to characterize for modeling
Disadvantages:
•
Difficult to reproduce conditions from run to run
•
Time consuming to carry out
•
Not well suited for low volatility compounds
Because of its disadvantages, only a limited number of static experiments were conducted to evaluate ability to model HONO chemistry
Results of experiments were generally consistent with model predictions, but there was some run-to-run variability
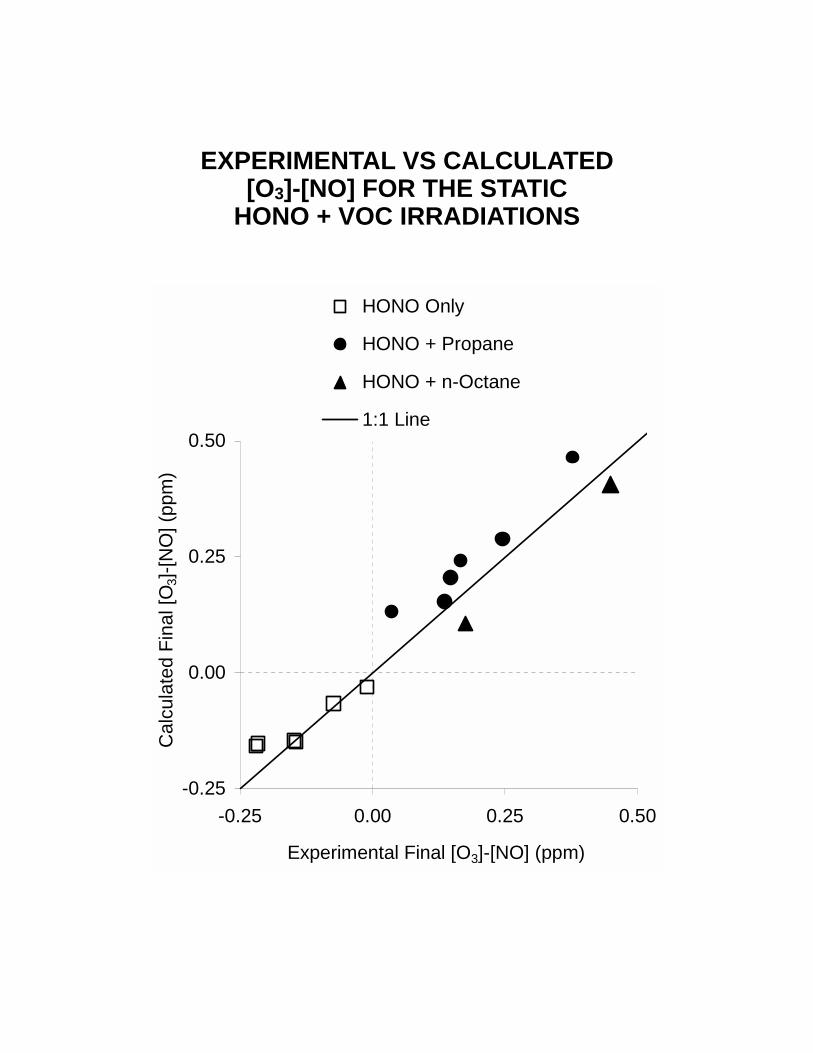
EXPERIMENTAL VS CALCULATED [O3]-[NO] FOR THE STATIC
HONO + VOC IRRADIATIONS
-0.25
0.00
0.25
0.50
-0.25 0.00 0.25 0.50
Experimental Final [O3]-[NO] (ppm)
Cal
cula
ted
Fina
l [O
3]-[N
O] (
ppm
)
HONO Only
HONO + Propane
HONO + n-Octane
1:1 Line
ALTERNATIVE EXPERIMENTAL APPROACHES (CONT’D)
Continuous Flow Systems HONO or HONO + VOC mixtures are continuously flowed through an irradiated reactor with the output sampled.
Can be carried out in stirred flow or plug flow modes
Advantages
•
Easily interfaced to HONO generation system, which produces continuous output
•
Continuous VOC injection potentially better suited to low volatility compounds
•
Potentially able to obtain more data points per unit time than static methods
•
Potential to develop self-contained system that can be used to conduct experiments at lower cost and effort
Disadvantages
•
Dynamic systems more uncertain to model
•
Uses lower volume reactors where surface absorption effects may be more important
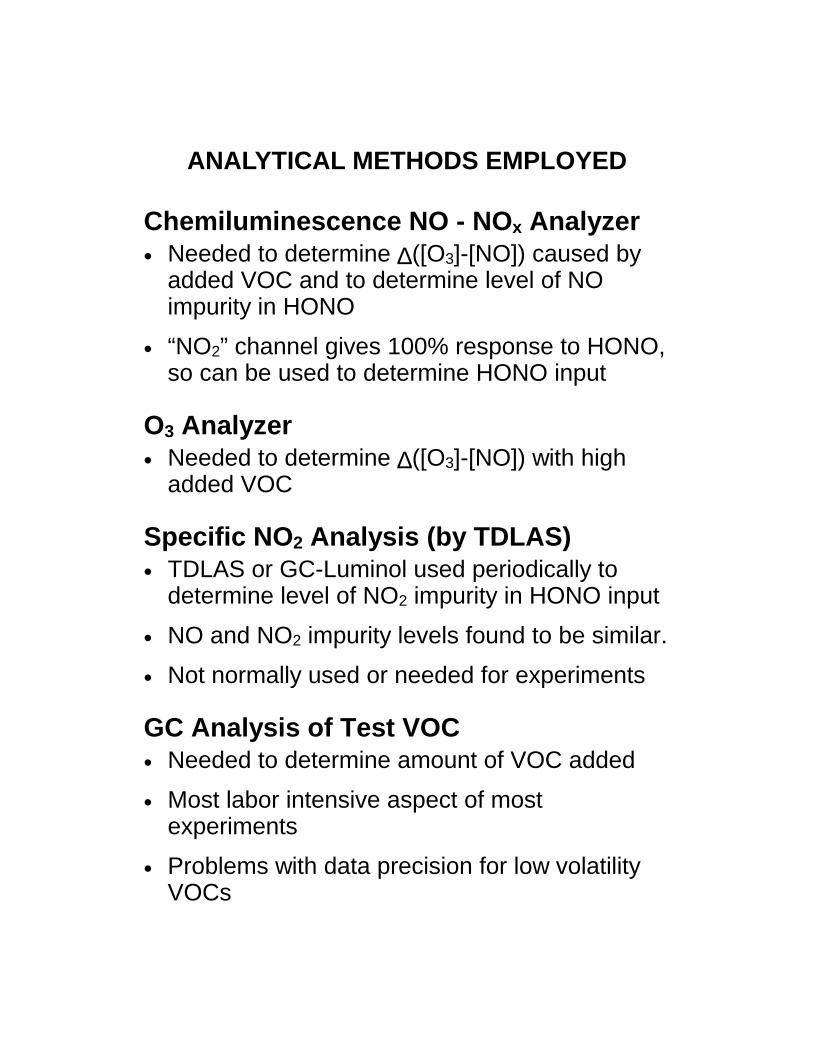
ANALYTICAL METHODS EMPLOYED
Chemiluminescence NO - NOx Analyzer •
Needed to determine ∆([O3]-[NO]) caused by added VOC and to determine level of NO impurity in HONO
•
“NO2” channel gives 100% response to HONO, so can be used to determine HONO input
O3 Analyzer •
Needed to determine ∆([O3]-[NO]) with high added VOC
Specific NO2 Analysis (by TDLAS) •
TDLAS or GC-Luminol used periodically to determine level of NO2 impurity in HONO input
•
NO and NO2 impurity levels found to be similar.
•
Not normally used or needed for experiments
GC Analysis of Test VOC •
Needed to determine amount of VOC added
•
Most labor intensive aspect of most experiments
•
Problems with data precision for low volatility VOCs
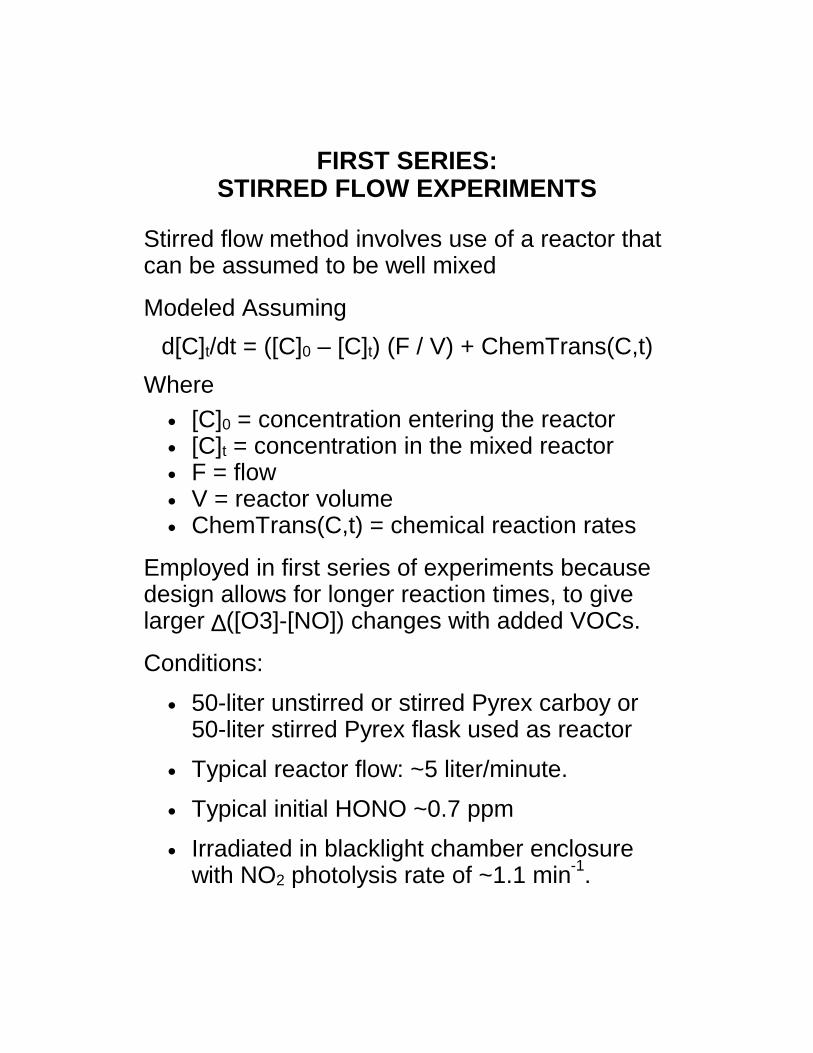
FIRST SERIES: STIRRED FLOW EXPERIMENTS
Stirred flow method involves use of a reactor that can be assumed to be well mixed
Modeled Assuming d[C]t/dt = ([C]0 – [C]t) (F / V) + ChemTrans(C,t) Where
•
[C]0 = concentration entering the reactor •
[C]t = concentration in the mixed reactor •
F = flow •
V = reactor volume •
ChemTrans(C,t) = chemical reaction rates
Employed in first series of experiments because design allows for longer reaction times, to give larger ∆([O3]-[NO]) changes with added VOCs.
Conditions:
•
50-liter unstirred or stirred Pyrex carboy or 50-liter stirred Pyrex flask used as reactor
•
Typical reactor flow: ~5 liter/minute.
•
Typical initial HONO ~0.7 ppm
•
Irradiated in blacklight chamber enclosure with NO2 photolysis rate of ~1.1 min-1.
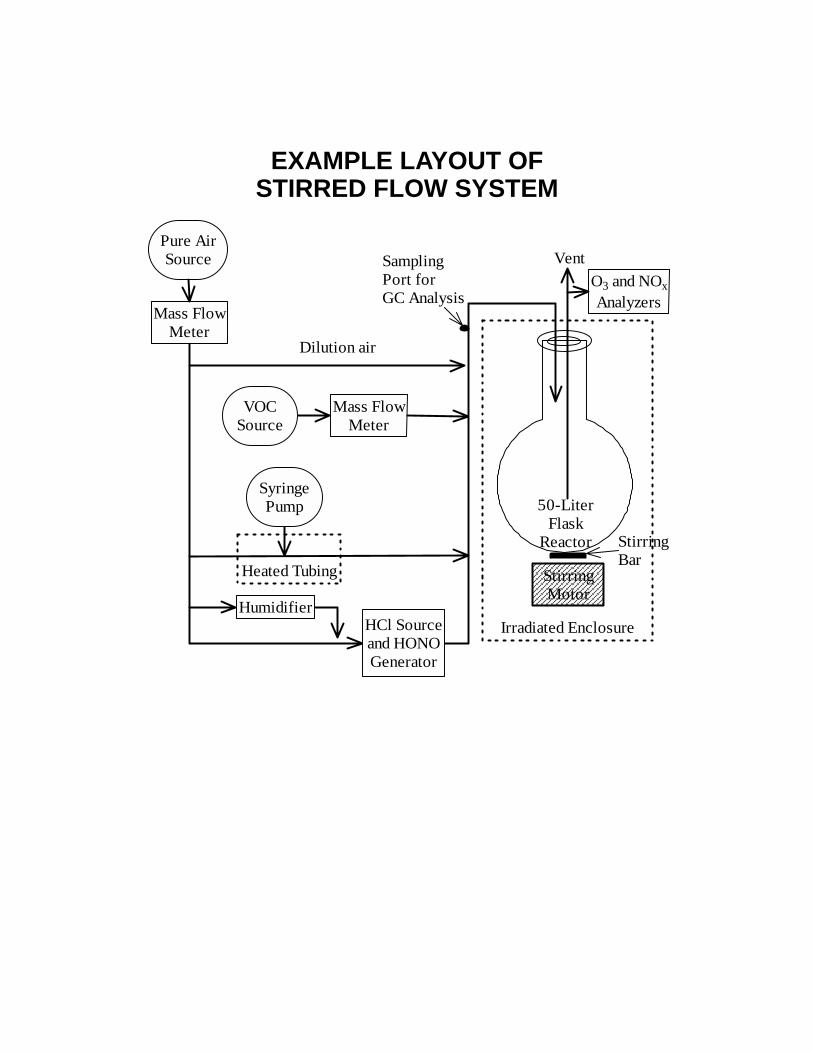
EXAMPLE LAYOUT OF STIRRED FLOW SYSTEM
Pure AirSource
Mass FlowMeter
HCl Sourceand HONOGenerator
SyringePump
Heated Tubing
SamplingPort forGC Analysis
HumidifierIrradiated Enclosure
50-LiterFlask
Reactor StirringBar
StirringMotor
VOCSource
Mass FlowMeter
Dilution air
O3 and NOxAnalyzers
Vent
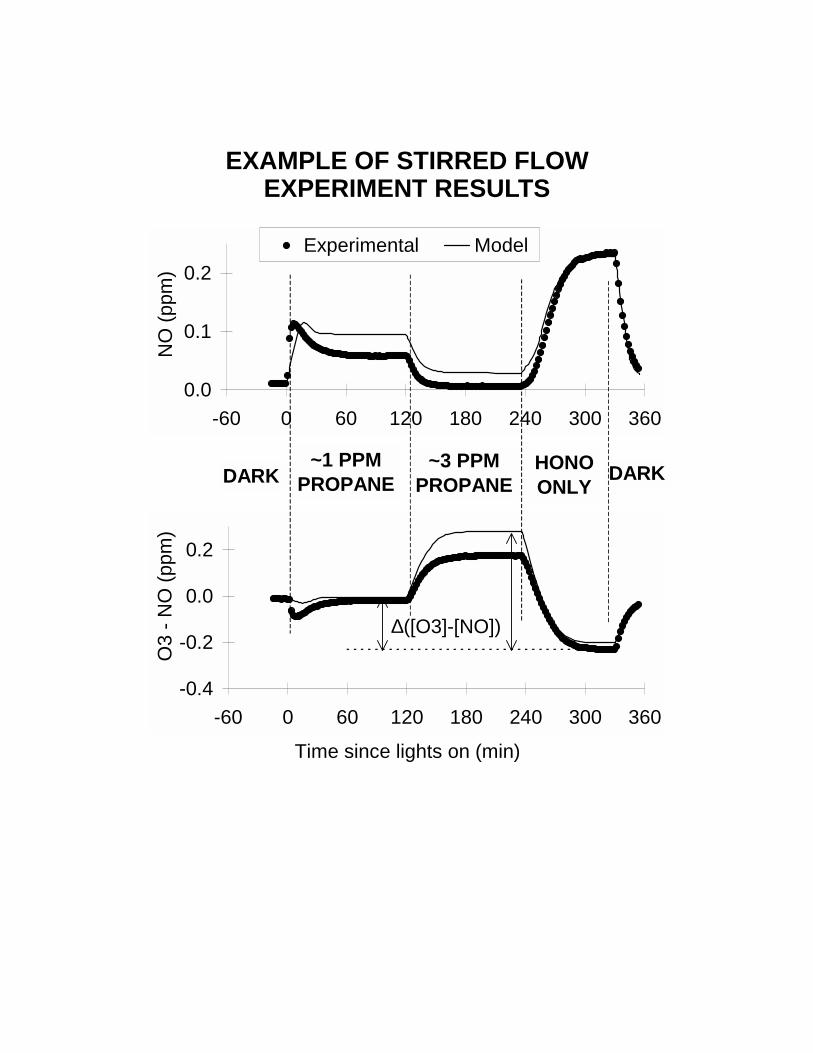
EXAMPLE OF STIRRED FLOW EXPERIMENT RESULTS
Time since lights on (min)
0.0
0.1
0.2
-60 0 60 120 180 240 300 360
NO
(ppm
)
Experimental Model
-0.4
-0.2
0.0
0.2
-60 0 60 120 180 240 300 360
O3
- NO
(ppm
)
∆([O3]-[NO])
DARK~1 PPM
PROPANE~3 PPM
PROPANEHONOONLY DARK
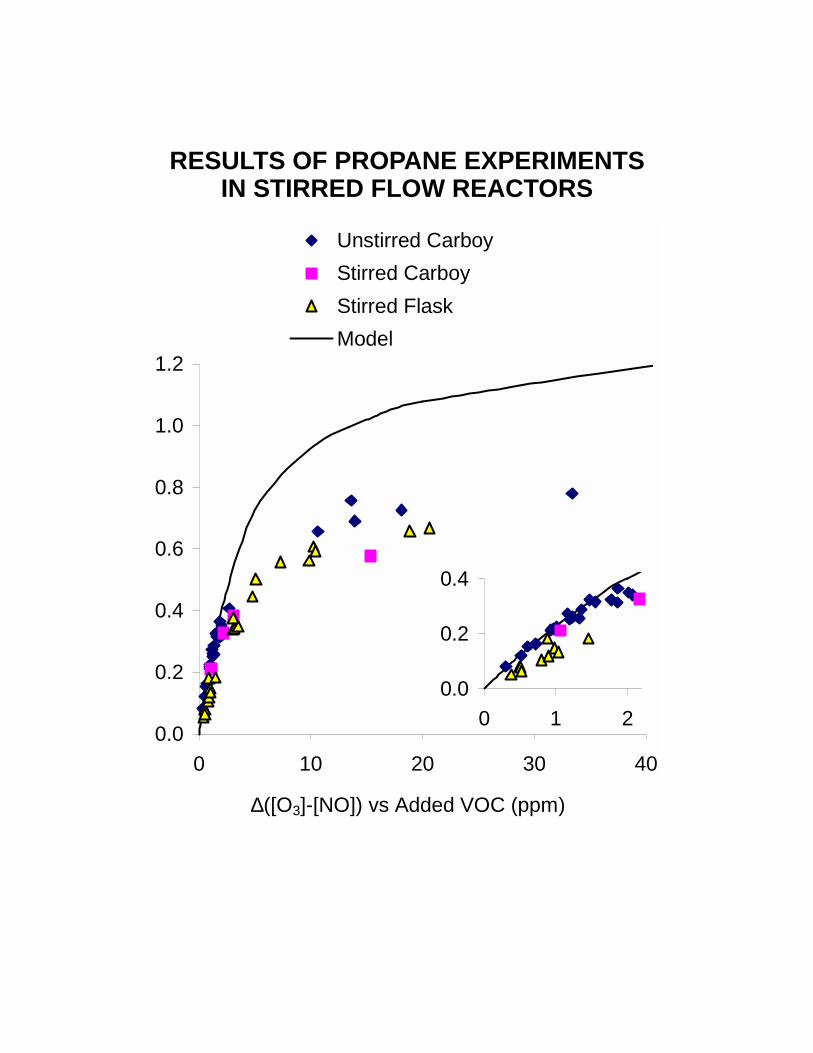
RESULTS OF PROPANE EXPERIMENTS IN STIRRED FLOW REACTORS
∆([O3]-[NO]) vs Added VOC (ppm)
0.0
0.2
0.4
0.6
0.8
1.0
1.2
0 10 20 30 40
Unstirred CarboyStirred CarboyStirred FlaskModel
0.0
0.2
0.4
0 1 2
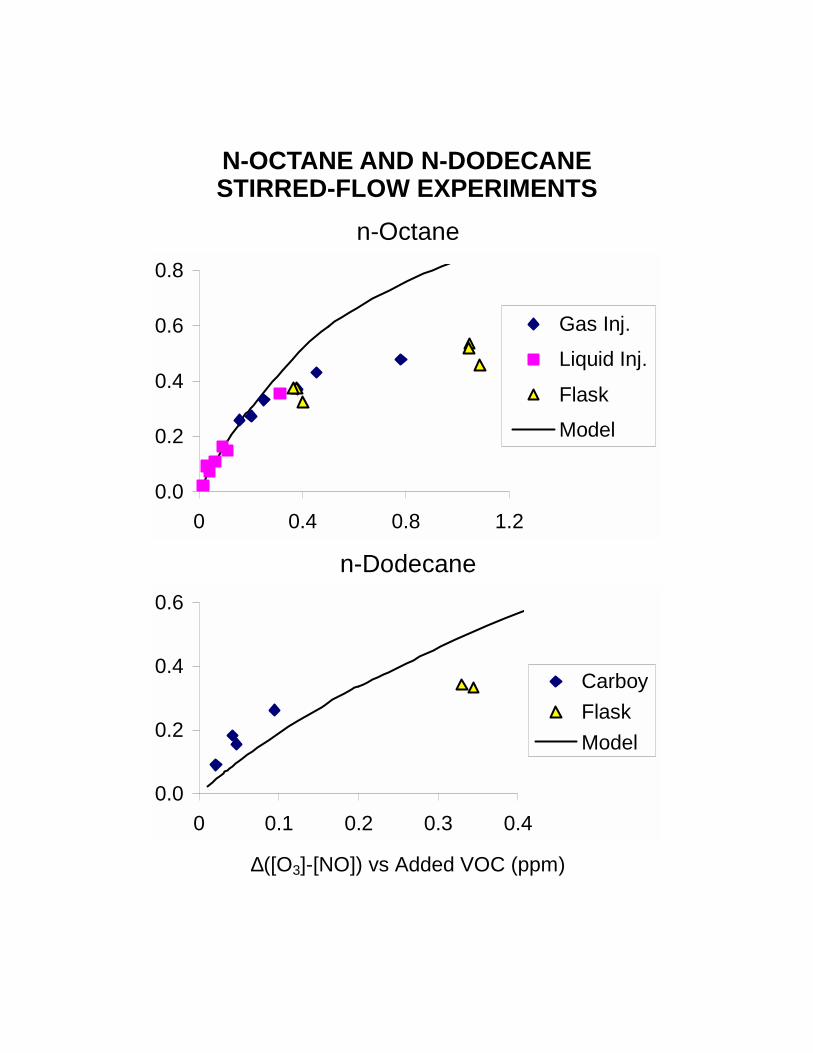
N-OCTANE AND N-DODECANE STIRRED-FLOW EXPERIMENTS
n-Octane
n-Dodecane
∆([O3]-[NO]) vs Added VOC (ppm)
0.0
0.2
0.4
0.6
0.8
0 0.4 0.8 1.2
Gas Inj.Liquid Inj.
FlaskModel
0.0
0.2
0.4
0.6
0 0.1 0.2 0.3 0.4
CarboyFlaskModel
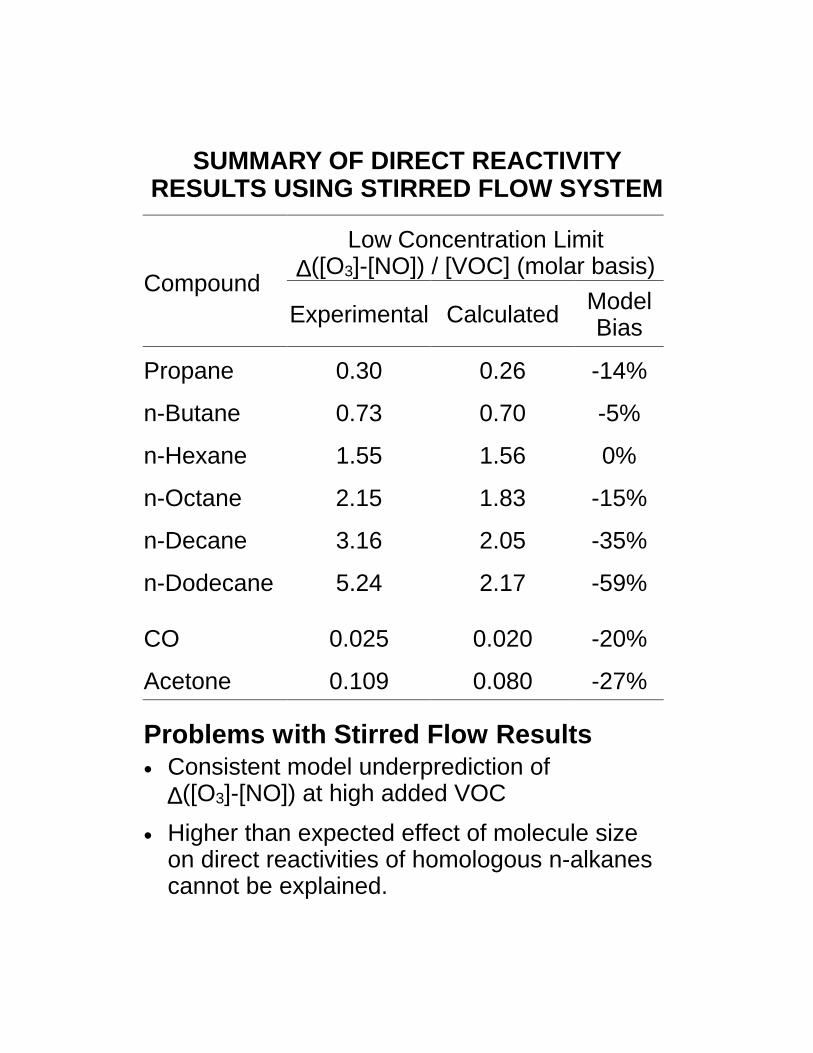
SUMMARY OF DIRECT REACTIVITY RESULTS USING STIRRED FLOW SYSTEM
Low Concentration Limit ∆([O3]-[NO]) / [VOC] (molar basis)
Compound Experimental Calculated Model
Bias
Propane 0.30 0.26 -14%
n-Butane 0.73 0.70 -5%
n-Hexane 1.55 1.56 0%
n-Octane 2.15 1.83 -15%
n-Decane 3.16 2.05 -35%
n-Dodecane 5.24 2.17 -59%
CO 0.025 0.020 -20%
Acetone 0.109 0.080 -27%
Problems with Stirred Flow Results •
Consistent model underprediction of ∆([O3]-[NO]) at high added VOC
•
Higher than expected effect of molecule size on direct reactivities of homologous n-alkanes cannot be explained.
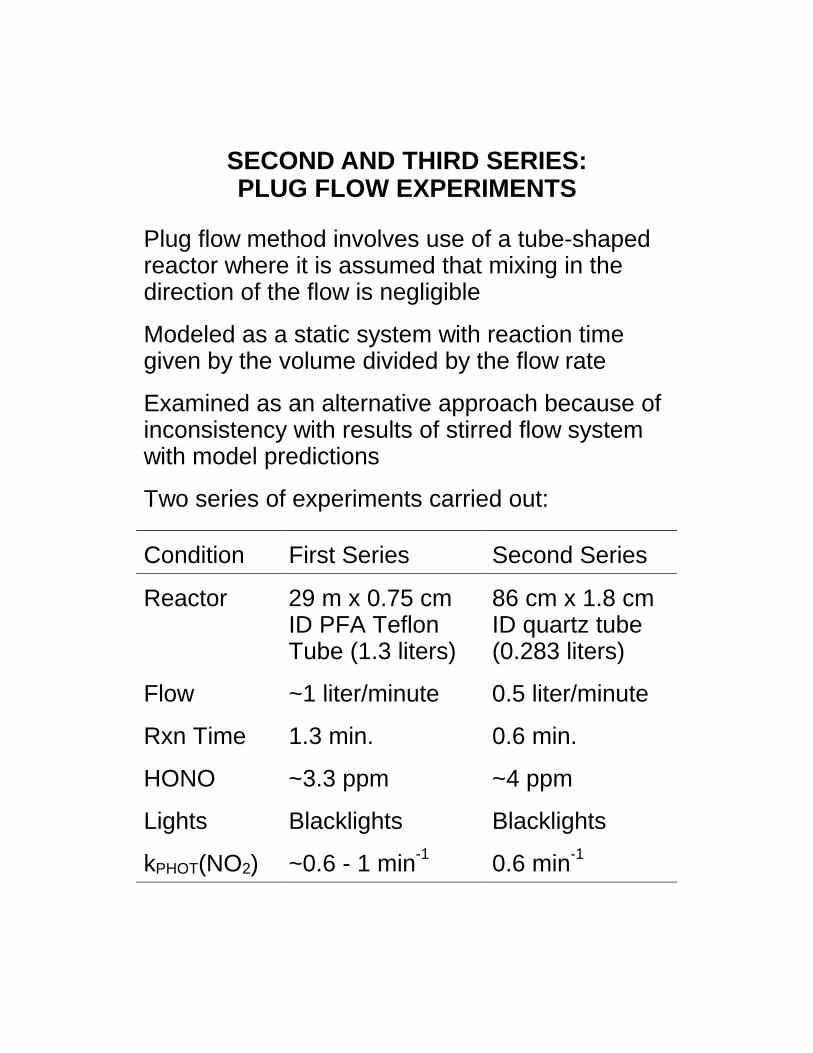
SECOND AND THIRD SERIES: PLUG FLOW EXPERIMENTS
Plug flow method involves use of a tube-shaped reactor where it is assumed that mixing in the direction of the flow is negligible
Modeled as a static system with reaction time given by the volume divided by the flow rate
Examined as an alternative approach because of inconsistency with results of stirred flow system with model predictions
Two series of experiments carried out:
Condition First Series Second Series
Reactor 29 m x 0.75 cm ID PFA Teflon Tube (1.3 liters)
86 cm x 1.8 cm ID quartz tube (0.283 liters)
Flow ~1 liter/minute 0.5 liter/minute
Rxn Time 1.3 min. 0.6 min.
HONO ~3.3 ppm ~4 ppm
Lights Blacklights Blacklights
kPHOT(NO2) ~0.6 - 1 min-1 0.6 min-1
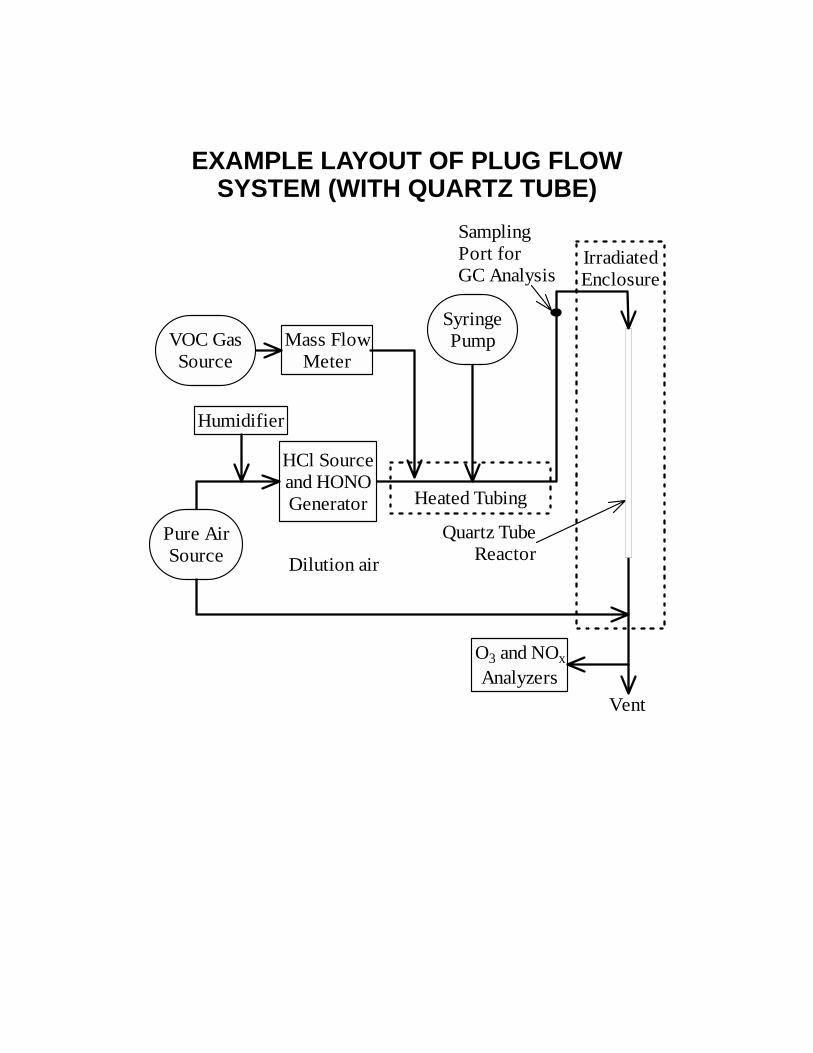
EXAMPLE LAYOUT OF PLUG FLOW SYSTEM (WITH QUARTZ TUBE)
Pure AirSource Dilution air
HCl Sourceand HONOGenerator
SyringePump
Heated Tubing
SamplingPort forGC Analysis
Humidifier
IrradiatedEnclosure
Quartz TubeReactor
VOC GasSource
Mass FlowMeter
O3 and NOxAnalyzers
Vent
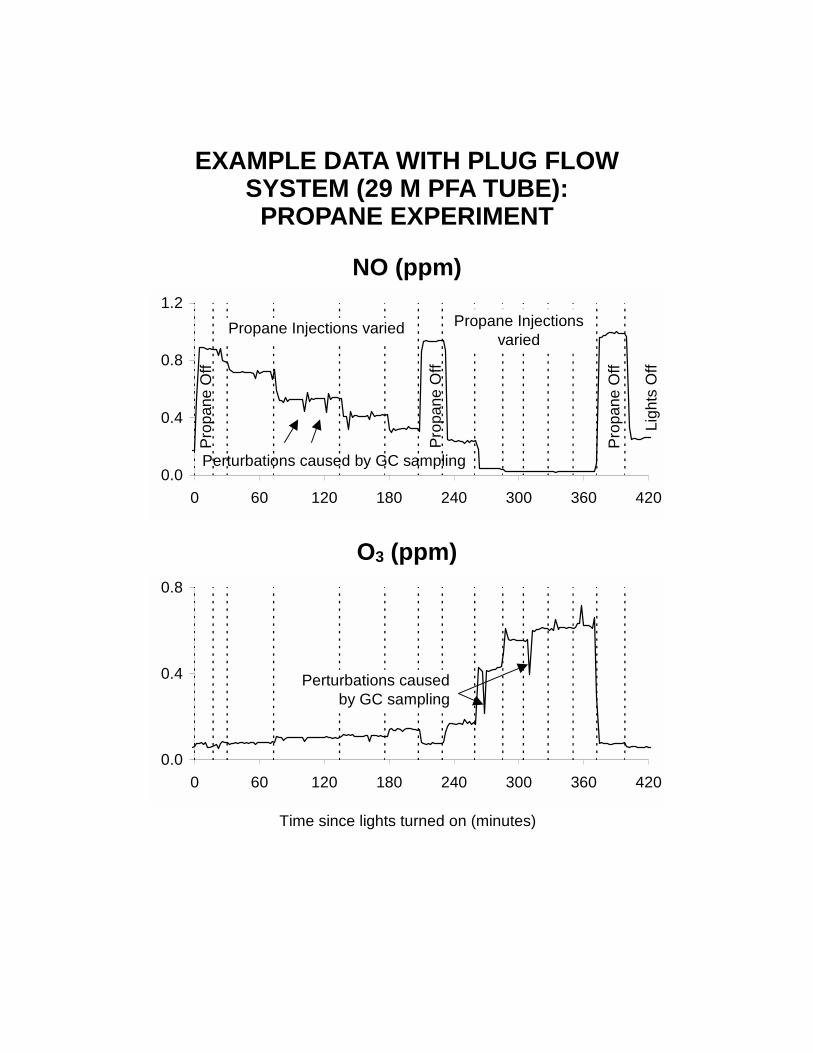
EXAMPLE DATA WITH PLUG FLOW SYSTEM (29 M PFA TUBE):
PROPANE EXPERIMENT
NO (ppm)
0.0
0.4
0.8
1.2
0 60 120 180 240 300 360 420
Prop
ane
Off
Prop
ane
Off
Ligh
ts O
f f
Perturbations caused by GC sampling
Propane Injections varied Propane Injectionsvaried
Prop
ane
Off
O3 (ppm)
Time since lights turned on (minutes)
0.0
0.4
0.8
0 60 120 180 240 300 360 420
Perturbations causedby GC sampling
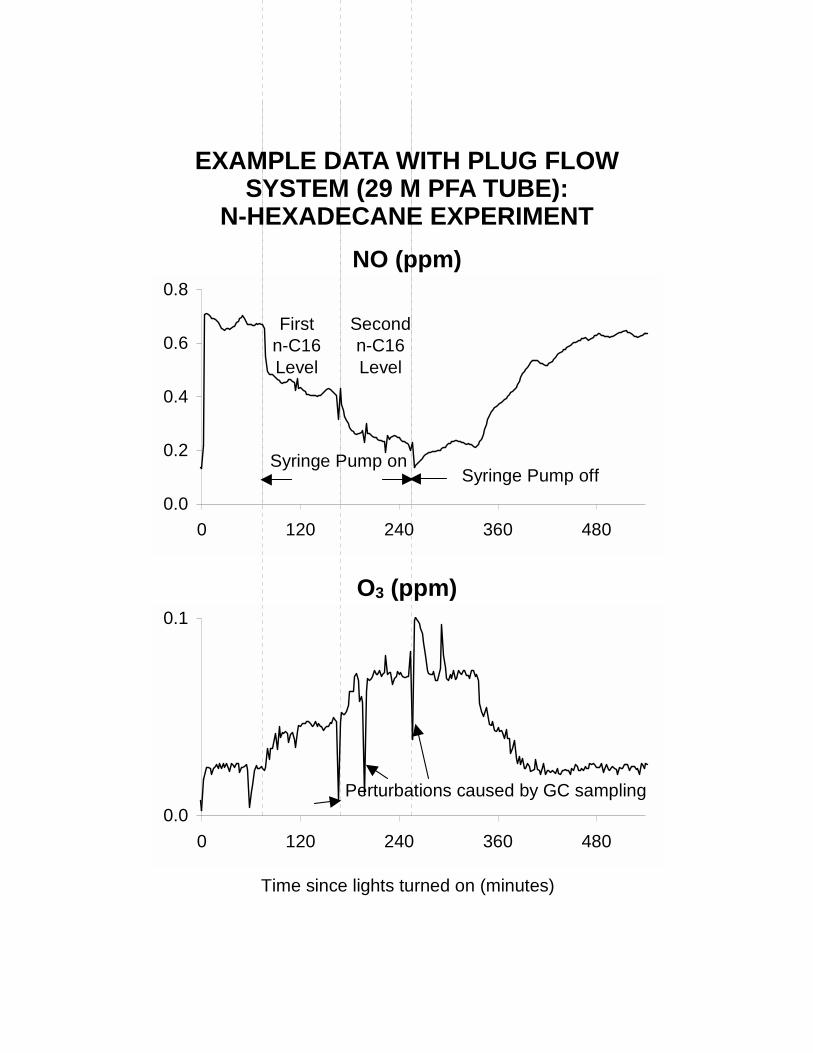
EXAMPLE DATA WITH PLUG FLOW SYSTEM (29 M PFA TUBE):
N-HEXADECANE EXPERIMENT NO (ppm)
0.0
0.2
0.4
0.6
0.8
0 120 240 360 480
Syringe Pump onSyringe Pump off
Firstn-C16Level
Secondn-C16Level
O3 (ppm)
Time since lights turned on (minutes)
0.0
0.1
0 120 240 360 480
Perturbations caused by GC sampling
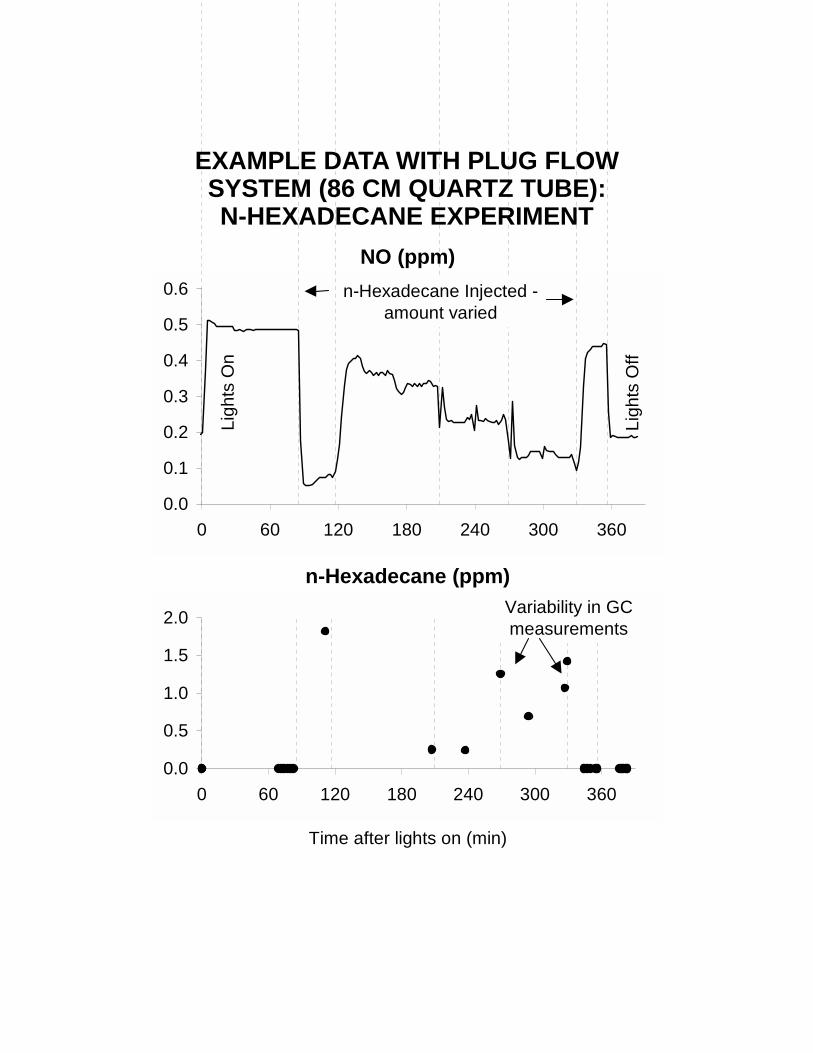
EXAMPLE DATA WITH PLUG FLOW SYSTEM (86 CM QUARTZ TUBE): N-HEXADECANE EXPERIMENT
NO (ppm)
n-Hexadecane (ppm)
Time after lights on (min)
0.0
0.1
0.2
0.3
0.4
0.5
0.6
0 60 120 180 240 300 360
n-Hexadecane Injected -amount varied
Ligh
ts O
ff
Ligh
ts O
n
0.0
0.5
1.0
1.5
2.0
0 60 120 180 240 300 360
Variability in GCmeasurements
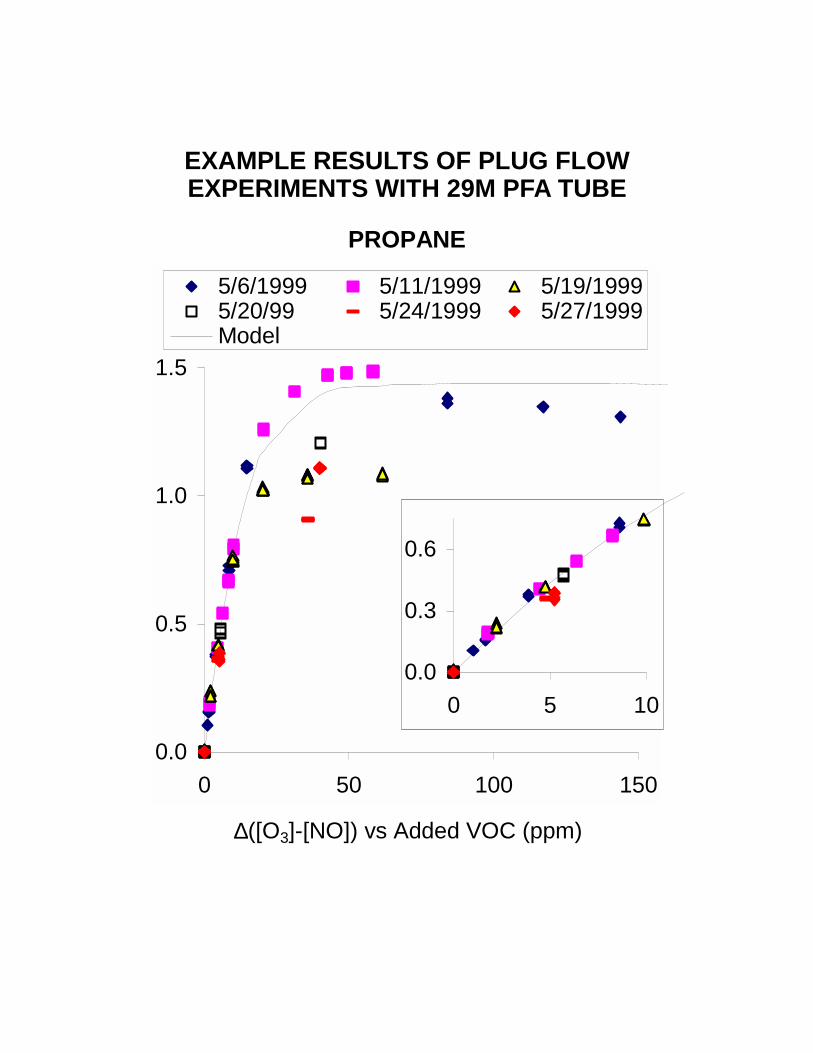
EXAMPLE RESULTS OF PLUG FLOW EXPERIMENTS WITH 29M PFA TUBE
PROPANE
∆([O3]-[NO]) vs Added VOC (ppm)
0.0
0.5
1.0
1.5
0 50 100 150
5/6/1999 5/11/1999 5/19/19995/20/99 5/24/1999 5/27/1999Model
0.0
0.3
0.6
0 5 10
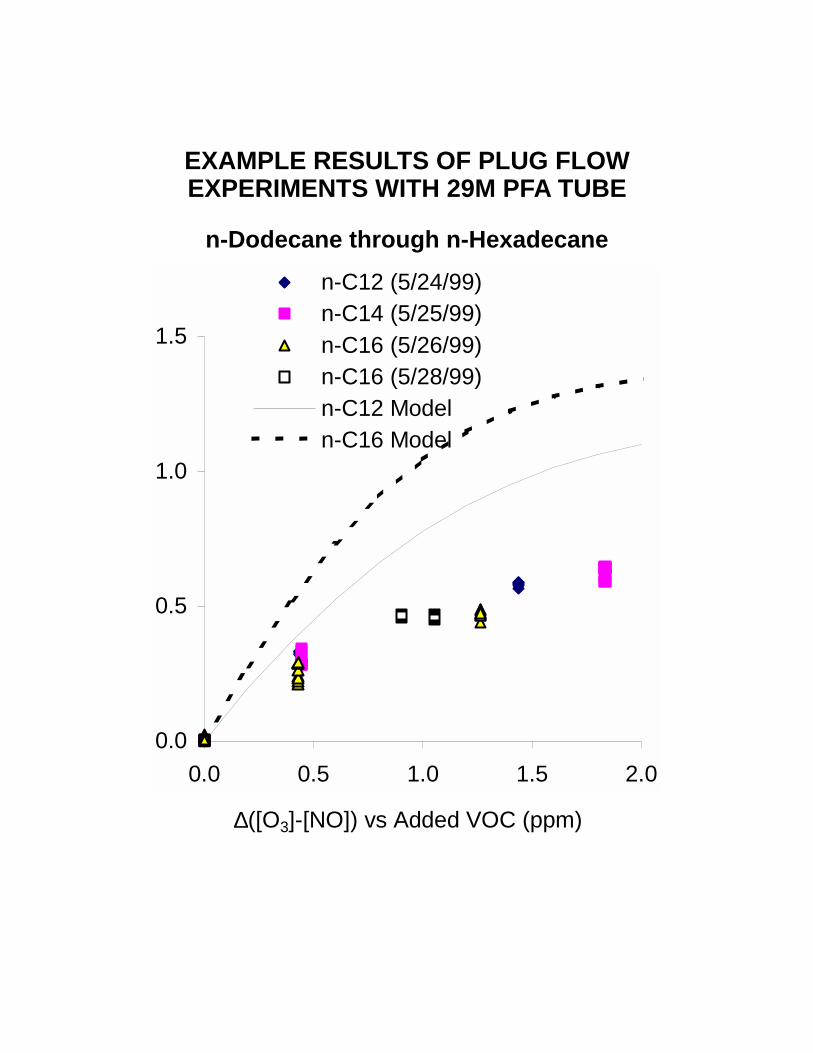
EXAMPLE RESULTS OF PLUG FLOW EXPERIMENTS WITH 29M PFA TUBE
n-Dodecane through n-Hexadecane
∆([O3]-[NO]) vs Added VOC (ppm)
0.0
0.5
1.0
1.5
0.0 0.5 1.0 1.5 2.0
n-C12 (5/24/99)n-C14 (5/25/99)n-C16 (5/26/99)n-C16 (5/28/99)n-C12 Modeln-C16 Model
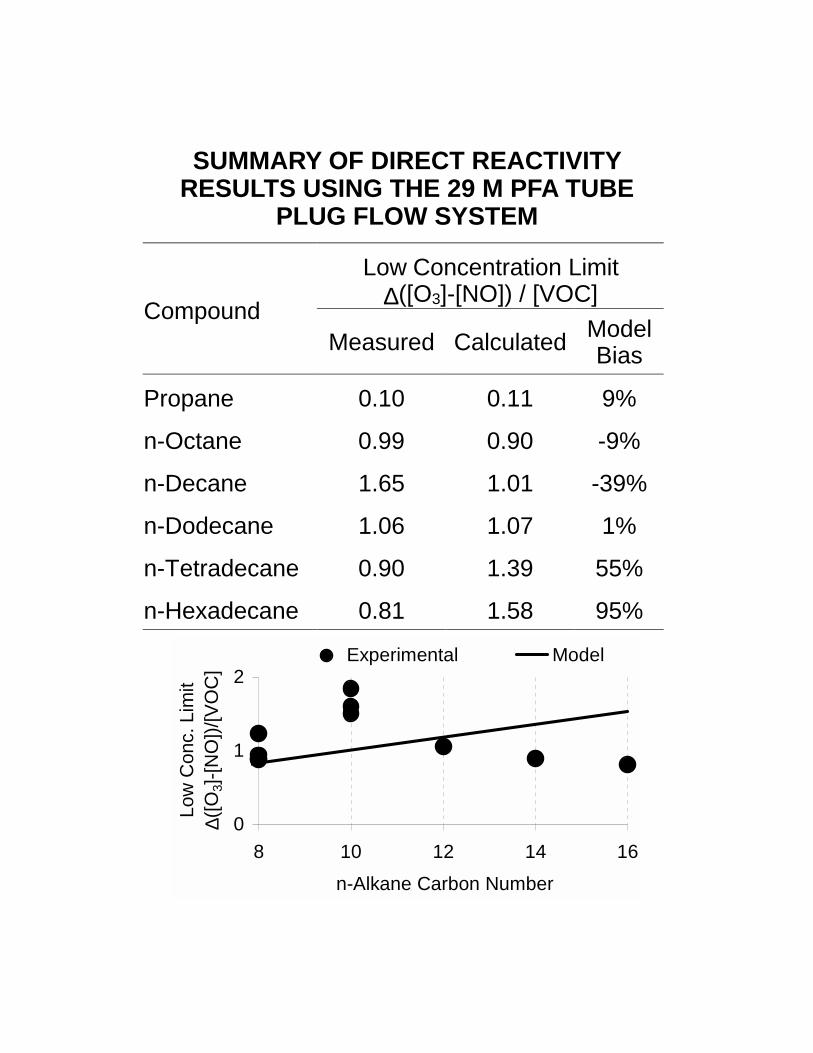
SUMMARY OF DIRECT REACTIVITY RESULTS USING THE 29 M PFA TUBE
PLUG FLOW SYSTEM
Low Concentration Limit ∆([O3]-[NO]) / [VOC]
Compound Measured Calculated Model
Bias
Propane 0.10 0.11 9%
n-Octane 0.99 0.90 -9%
n-Decane 1.65 1.01 -39%
n-Dodecane 1.06 1.07 1%
n-Tetradecane 0.90 1.39 55%
n-Hexadecane 0.81 1.58 95%
0
1
2
8 10 12 14 16n-Alkane Carbon Number
Low
Con
c. L
imit
∆([O
3]-[N
O])/
[VO
C]
Experimental Model
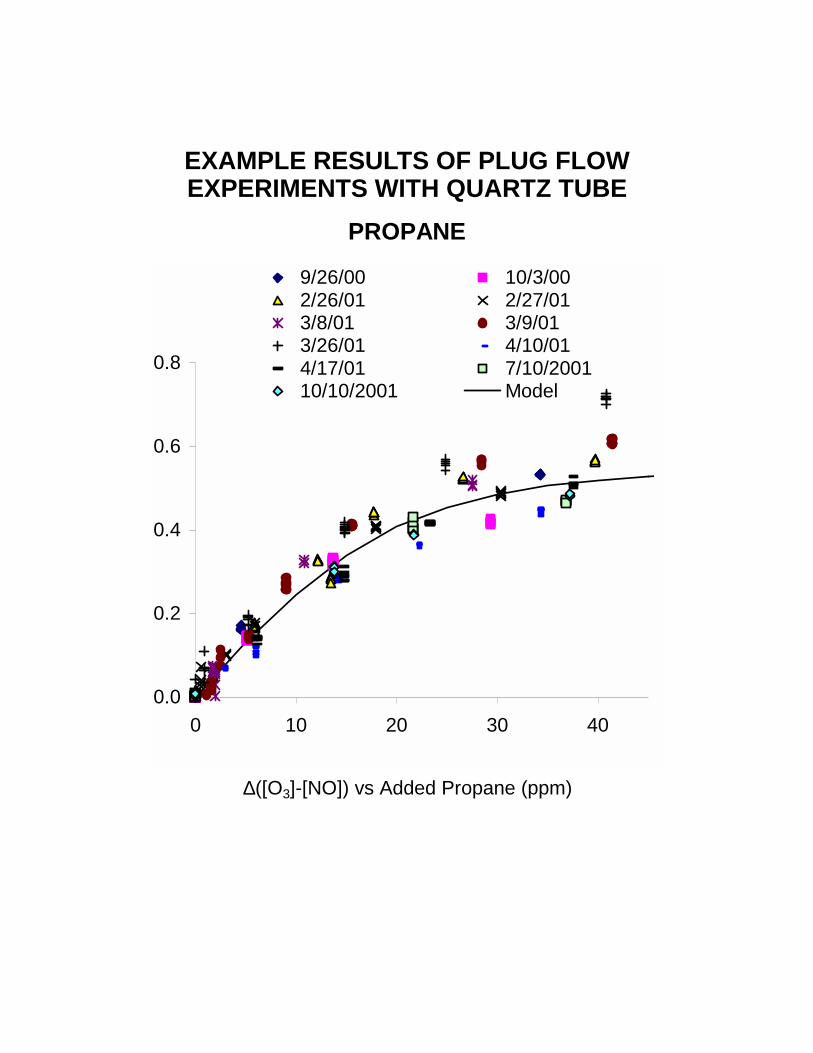
EXAMPLE RESULTS OF PLUG FLOW EXPERIMENTS WITH QUARTZ TUBE
PROPANE
∆([O3]-[NO]) vs Added Propane (ppm)
0.0
0.2
0.4
0.6
0.8
0 10 20 30 40
9/26/00 10/3/002/26/01 2/27/013/8/01 3/9/013/26/01 4/10/014/17/01 7/10/200110/10/2001 Model
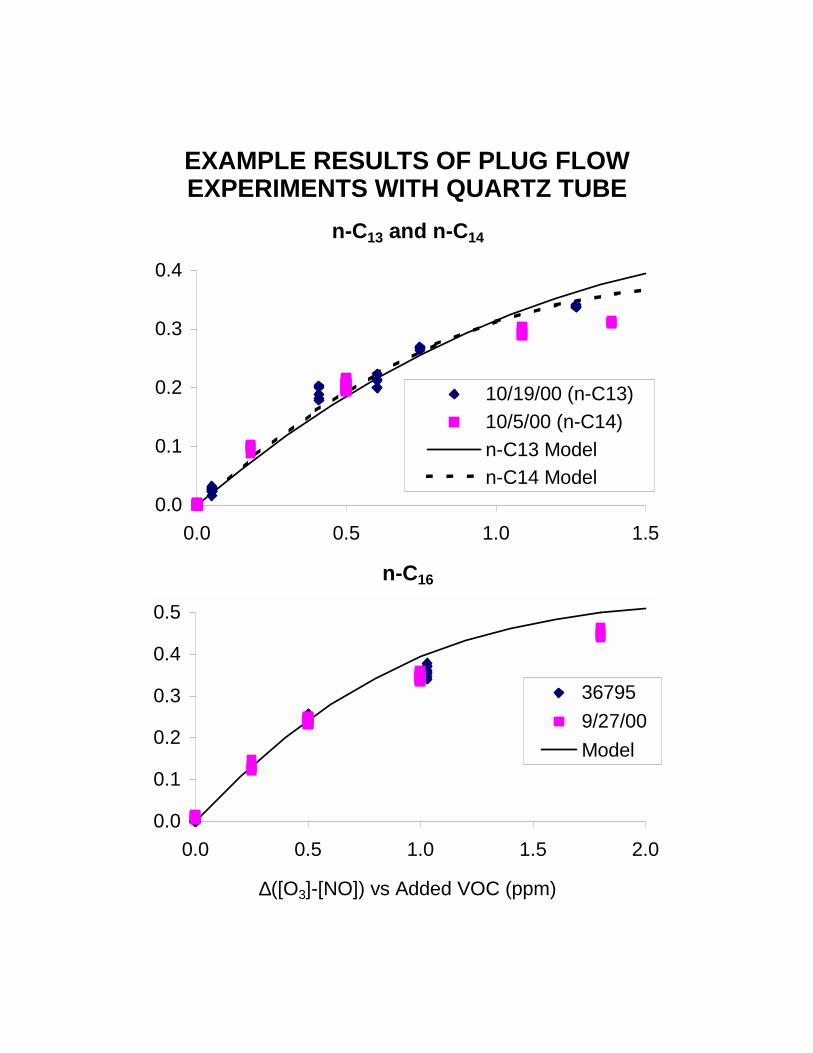
EXAMPLE RESULTS OF PLUG FLOW EXPERIMENTS WITH QUARTZ TUBE
n-C13 and n-C14
n-C16
∆([O3]-[NO]) vs Added VOC (ppm)
0.0
0.1
0.2
0.3
0.4
0.5
0.0 0.5 1.0 1.5 2.0
367959/27/00Model
0.0
0.1
0.2
0.3
0.4
0.0 0.5 1.0 1.5
10/19/00 (n-C13)10/5/00 (n-C14)n-C13 Modeln-C14 Model
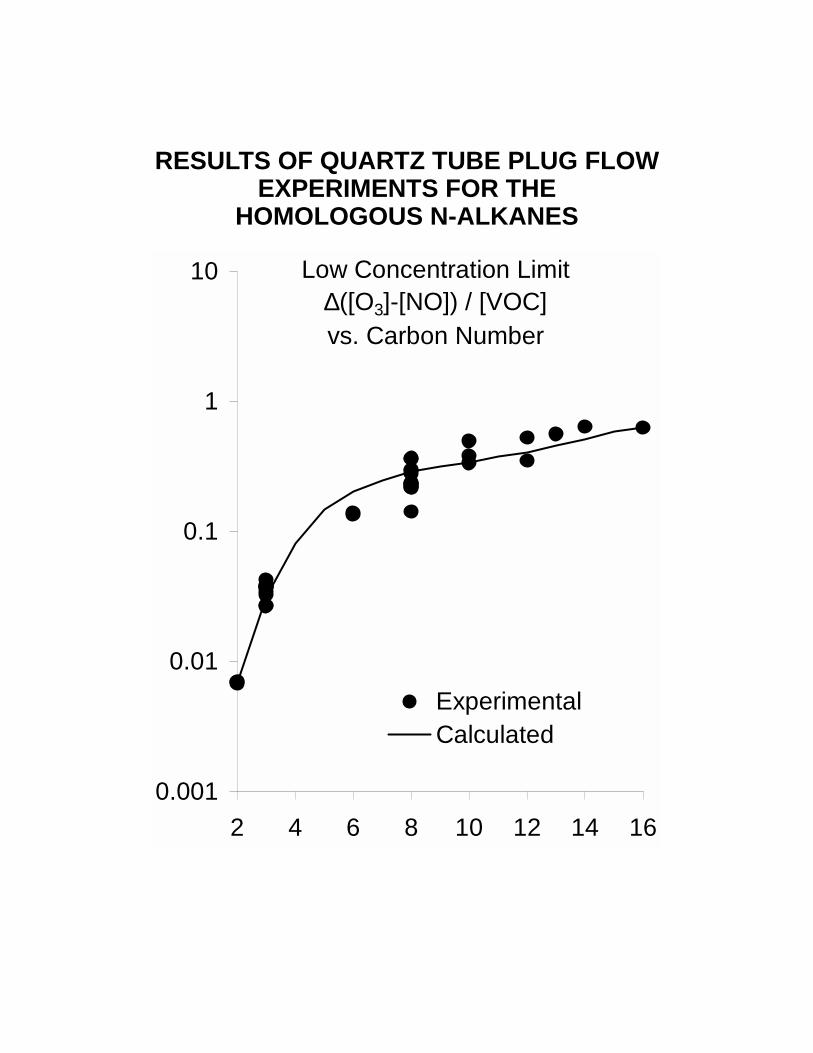
RESULTS OF QUARTZ TUBE PLUG FLOW EXPERIMENTS FOR THE
HOMOLOGOUS N-ALKANES
0.001
0.01
0.1
1
10
2 4 6 8 10 12 14 16
ExperimentalCalculated
Low Concentration Limit∆([O3]-[NO]) / [VOC]vs. Carbon Number
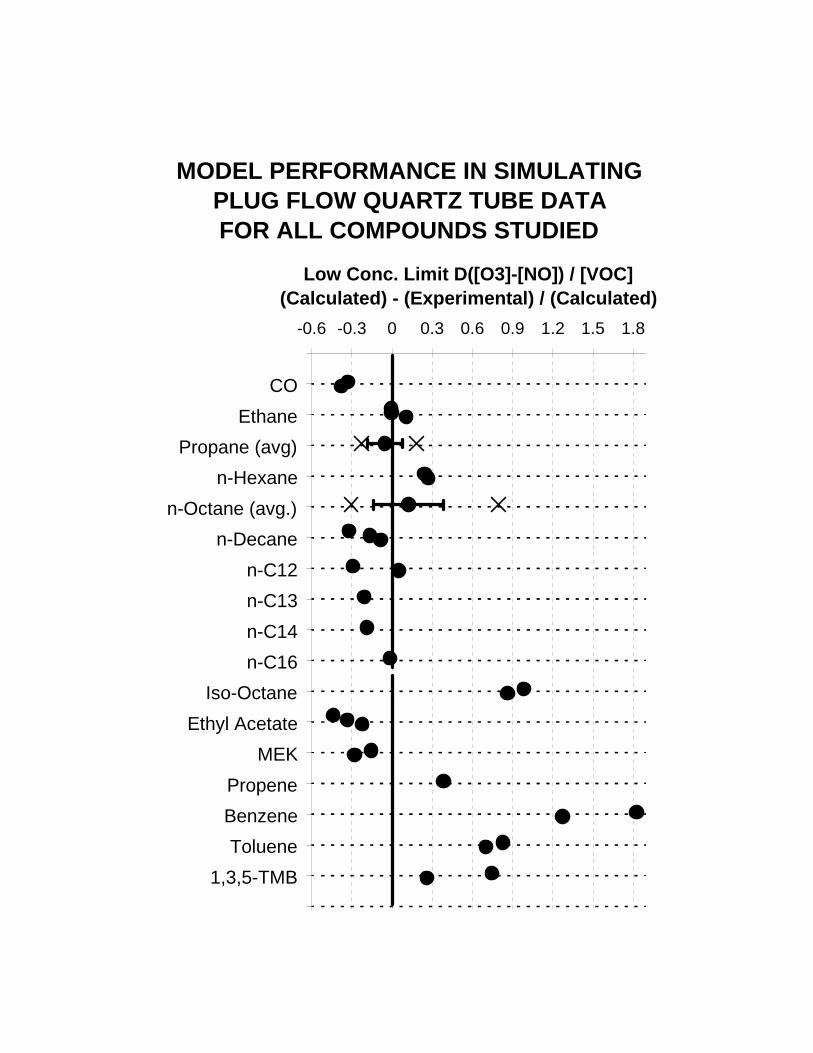
-0.6 -0.3 0 0.3 0.6 0.9 1.2 1.5 1.8
COEthane
Propane (avg)n-Hexane
n-Octane (avg.)n-Decane
n-C12n-C13n-C14n-C16
Iso-OctaneEthyl Acetate
MEKPropeneBenzeneToluene
1,3,5-TMB
MODEL PERFORMANCE IN SIMULATINGPLUG FLOW QUARTZ TUBE DATAFOR ALL COMPOUNDS STUDIED
Low Conc. Limit D([O3]-[NO]) / [VOC](Calculated) - (Experimental) / (Calculated)
PROBLEMS AND ONGOING WORK
PROBLEMS Reliability and reproducibility of the syringe pump injection system needs to be improved
GC Analysis of low volatility compounds is time-consuming and very imprecise
Apparently successful experiments with C12+ n-alkanes could not be reproduced because of injection and analysis problems
GC Methods not suitable for quantifying complex mixtures. Need either a reliable liquid injection system or a total carbon analysis system
Difficult to improve the injection system without a continuous total carbon analysis system
ONGOING WORK A total carbon analysis system being developed based on catalytic conversion of VOCs to CO2, and measuring CO2 in CO2-free air
Preliminary tests indicate that this gives good data for volatile compounds, but suggest hang-up of heavy VOCs on current converter system
CONCLUSIONS
Measuring effects of VOCs on [O3]-[NO] in HONO irradiations provides a sensitive measure of the direct effects of VOCs on O3 formation
The method of Febo et al (1995) can generate the clean and stable levels of HONO required
Stirred flow experiments gave data that are not entirely consistent with model predictions
Best results were obtained in plug flow experiments using a 86 cm x 1.6 cm ID quartz tube as the reactor with a 0.6 min. reaction time
Plug flow experiments were successfully applied to n-hexadecane, suggesting it may be suitable for other low volatility compounds
But problems with reproducibly injecting and analyzing low volatility compounds must be solved before it can be routinely used for them
The plug flow system needs to be integrated with a total carbon analysis system for this to be practical for low volatility compounds or mixtures
Work on integrating a total carbon analysis to this system is underway for another CARB contract.