Embed Size (px)
Citation preview
NASA/TM- 1998-206560
Full Flight Envelope Direct Thrust
Measurement on a Supersonic Aircraft
Timothy R. Conners and Robert L. Sims
Dryden Flight Research Center
Edwards, California
(
National Aeronautics and
Space Administration
Dryden Flight Research CenterEdwards, California 93523-0273
July 1998
https://ntrs.nasa.gov/search.jsp?R=19980228163 2018-07-14T05:08:22+00:00Z

NOTICE
Use of trade names or names of manufacturers in this document does not constitute an official endorsement
of such products or manufacturers, either expressed or implied, by the National Aeronautics and
Space Administration.
Available from the following:
NASA Center for AeroSpacelnformation(CASI)7121StandardDrive
Hanover, MD 21076-1320
(301) 621-0390
National Technical Information Service (NTIS)
5285 Port Royal Road
Springfield, VA 22161-2171(703) 487-4650

FULL FLIGHT ENVELOPE DIRECT THRUST MEASUREMENT
ON A SUPERSONIC AIRCRAFT
Timothy R. Conners* and Robert L. Sims t
NASA Dryden Flight Research CenterEdwards, California
.1%,
• i
• [ !,
• i_¸•: i'
Abstract
Direct thrust measurement using strain gages offers
advantages over analytically-based thrust calculation
methods. For flight test applications, the direct
measurement method typically uses a simpler sensor
arrangement and minimal data processing compared to
analytical techniques, which normally require costly
engine modeling and multisensor arrangements
throughout the engine. Conversely, direct thrust
measurement has historically produced less than
desirable accuracy because of difficulty in mounting and
calibrating the strain gages and the inability to account
for secondary forces that influence the thrust reading at
the engine mounts. Consequently, the strain-gage
technique has normally been used for simple engine
arrangements and primarily in the subsonic speed range.
This paper presents the results of a strain gage-based
direct thrust-measurement technique developed by the
NASA Dryden Flight Research Center and successfully
applied to the full flight envelope of an F-15 aircraft
powered by two F100-PW-229 turbofan engines.
Measurements have been obtained at quasi-steady-state
operating conditions at maximum nonaugmented andmaximum augmented power throughout the altitude
range of the vehicle and to a maximum speed ofMach 2.0, and are compared against results from two
analytically-based thrust calculation methods. The
strain-gage installation and calibration processes are alsodescribed.
Nomenclature
A
ACTIVE
cross-sectional area, in 2
Advanced Control Technology forIntegrated Vehicles
F
g
IDEEC
M
P
PT
S/MTD
T T
USAF
V
WA CC
WAT
(y
Engine Stations
0 free stream (ambient)
2 engine-inlet plane
Introduction
For flight-testing applications,
force, lbf
gravitation acceleration constant,32.2 ft/sec 2
improved digital electronic enginecontroller
Mach number
static pressure, lbf/in 2 absolute
total pressure, lbf/in 2 absolute
Short Takeoff and Landing/Maneuver
Technology Demonstrator
total temperature, °F
United States Air Force
velocity, ft/sec
station-corrected engine mass flow, lbm/sec
true engine mass flow, Ibm/sec
standard deviation
direct thrust
measurement using strain gages offers advantages overtraditional, model-based analytical thrust calculation
methods.1 Depending on the objectives of the flight test
program and resources available to the test facility, theseadvantages may permit in-flight thrust measurement thatwould not be feasible otherwise.
*Aerospace Engineer, Senior Member AIAA.tAerospace Engineer.Copyright © 1998 by the American Institute of Aeronautics and
Astronautics, Inc. No copyright is asserted in the United States underTitle 17,U.S. Code. The U.S. Govemment has a royalty-free license toexercise all fights under the copyright claimed herein for Governmen-tal purposes. All other fights are reserved by the copyright owner.
Depending upon the application, the direct
thrust-measurement method can be less complex and
costly to implement compared to model-based
techniques. The strain-gage sensor arrangement istypically less cumbersome and costly to procure, install,
and calibrate than the multisensor package required to
collect the input data for traditional analytically-based
1American Institute of Aeronautics and Astronautics

thrustmodels,particularlyif awind-tunnelcalibrationoftheanalyticalmodeltothespecifictestenginewouldotherwisebe requiredprior to test programcommencement.Thecomputermodelsareanadditionalrequirementtowhichthedirectmeasurementmethodisnotsubject.Thesemodelscanbeverycostlyfortheendusertoprocureandmaintain,if themodelsevenexist.Ifthe modelsdo not existandthereforeneedto bedevelopedfortheengineinquestion,thenthecostforprocurementcaneasilybeprohibitive.
Althoughthetypicalin-flightthrustmodelhaslimitedself-tuningcapability,if theenginehasstrayedfarfroman averagebaselinestate(for instance,becauseofsignificantdeteriorationordamage),thenthecalculationaccuracywill suffer.Becausethestraingage-basedtechniquemeasuresthrustdirectly,thetechniqueisnotsubjecttothistypeoferror.
An in-flightthrustcomputerprogramis normallycapableof modelingonly steady-stateor quasi-steady-stateengineoperation.A computerprogramtypically assumesthermal equilibrium andstoichiometricfuel-to-airratiosthatdonotaccountforengineaccelerationordecelerationschedules,andcanbefurtherlimitedby theresponsivenessof theinputparameters.2Thestrain-gagetechnique,however,isnothinderedby modelingandinputmeasurementratelimitationto thesameextent.Becauseof theinherenthigh dynamicresponseof straingages,the directmeasurementtechniqueis superiorto model-basedtechniqueswhendynamicthrustmeasurementis arequirement.Nothavingthecomputationalburdenoftheanalyticalmethods,the direct thrust-measurementtechniqueis bettersuitedfor real-timemonitoringapplicationsaswell.
Althoughthedirectthrust-measurementtechniquehasseveraladvantages,carefulattentionmustbepaidtothedesignandcalibrationof thesysteminordertoreducemeasurementerrorandcalibrationdrift.Misconceptionsandmisapplicationshavehamperedthewidespreaduseof thedirectthrust-measurementtechnique,andthemethodhashistoricallyproducedlessthandesirableaccuracy.Withoutcarefulinstallationandcalibrationofthestraingages,theaccuracyofthedirectmeasurementtechniquewill beinferiortothemodel-basedmethod.
Properdesignofadirectthrust-measurementsystemis requiredto ensurethatsecondaryloadpathsarenegligibleor canbeaccounted.Suchloadpathscanresultfromexternalengineconnectionsandinterfaces,inletseals,inletpressureforces,engine-bodypressure
forcedifferential,andnozzledrag,allofwhichcombineto increasethe measurementuncertainty.Propersecondaryload-pathbookkeepinghasbeena primaryproblemofpastattemptsatdirectthrustmeasurement.Asaresult,thestrain-gagetechniquehasnormallybeenusedfor simpleenginearrangementssuchas podinstallationsunderthewing.However,asthisreportshows,the techniquecan be properlyappliedtocomplex,buried-enginearrangements,providedcareisusedto ensurethatnonnegligiblesecondaryforcesareunderstoodandincludedintheanalysis.•
Forinstallationenvironmentssubjectto significantthermalcycling(suchaswithhigh-speedaircraftusingaugmentedengines),the strain-gagemeasurementmust be temperature-compensated,an importantconsiderationfor thecalibrationprocess.Whenatestprogramcommences,dependingon the programobjectivesandduration,in-flighttarereadingsagainstsomereference(suchasoutputfromasimpleengineperformancespecificationmodel)maybeprudenttohighlightaneedforsensorrecalibration.
Publishedreportsof successfulapplicationsof thestraingage-baseddirectthrust-measurementtechniquearenotnumerous.Tworeportedexamplesarea pod-mountedJ85(GeneralElectric,Lynn,Massachusetts)engineinstallationtestedonanF-106airplaneatspeedsfromMach0.6toMach1.3throughoutthepowerrangeof theengine,3andanF-14ATF30(Pratt& Whitney,West Palm Beach,Florida) engineapplicationdemonstratedatspeedsfromMach0.4toMach1.6attwopowersettings,includingmaximumaugmentation.4
Theanalysisdiscussedin thispaperwasperformedusingtheNASAAdvancedControlTechnologyforIntegratedVehicles(ACTIVE)F-15 aircraft.TheACTIVEtestprogram5isajointeffortbetweenNASADrydenFlightResearchCenter(Edwards,California);theUnitedStatesAirForce(USAF)MaterielCommand(Dayton,Ohio);Pratt& Whitney,adivisionof UnitedTechnologies(WestPalmBeach,Florida);andTheBoeingCompany(formerlyMcDonnellDouglasAerospace)(St.Louis,Missouri).A majorgoalof theACTIVEprogramis to demonstratethebenefitsof aproduction-likethrust-vectoringsystemappliedto thefull flightenvelopeof a supersonicvehicle.6 Thesebenefitsinclude enhancedaircraft performance,maneuverability,andcontrollability.
Engine-mountstraingageswereoriginallyinstalledandcalibratedfortheprimarypurposeofmonitoringnetstructuralloads,buttheextractionofusablethrust-and
2American Institute of Aeronautics and Astronautics

/
: :__i:_i_'_
:! ii̧;_:i
',, _:_ ;i•¸/
: • : •i:• _ / ::: " ¸¸11:•5¸ i :?: :: :: : :
vector-force data was also deemed possible. The strain
gage-based nozzle-vectoring force-measurement system
has produced reasonably precise results and has becomean element crucial to the success of the nozzle-vectoring
program.
This paper presents the results of a strain gage-baseddirect thrust-measurement technique developed by
NASA Dryden and successfully applied to the full flight
envelope of the F-15 ACTIVE aircraft, which is powered
by two F100-PW-229 (Pratt & Whitney) turbofan
engines. More than 5200 time cuts of data were
processed for quasi-steady-state operating conditions toproduce the results in this report, which represent a
Mach range from 0.0 to 2.0 and altitudes from near sea
level to higher than 45,000 ft. Measurement-based gross-thrust values were obtained at maximum nonaugmented
and maximum augmented power and are compared to
the results from two analytically-based thrust calculation
methods. The direct thrust-measurement technique and a
description of the significant secondary force termsrequired to compute gross thrust are presented. In
addition, the strain-gage installation and calibration
processes for the axial-thrust measurement are described
in detail, as are the important lessons learned. Use oftrade names or names of manufacturers in this document
does not constitute an official endorsement of such
products or manufacturers, either expressed or implied,
by the National Aeronautics and Space Administration.
Aircraft Description
The ACTIVE test aircraft (fig. 1) is a highly modified,
preproduction, two-seat F-15B airplane on loan to
NASA Dryden from the USAE The aircraft was
previously used for the USAF F-15 Short Takeoff and
Landing/Maneuver Technology Demonstrator (S/MTD)
program.
Airframe
Two large canards mounted on the upper inlet area,
forward of the wing, comprise the dominant externalfeature of the vehicle differing from a standard F-15
airplane. To accommodate the off-axis force produced
by the vectoring nozzles, certain engine-mount andsupporting structure has been strengthened. The skin
contour and structure in the aft fuselage area were also
modified to accommodate the vectoring actuation
system and to provide clearance for full nozzle-vectoring
movement. The modified engine-mount structure isdescribed in detail in the "Direct Thrust-Measurement
System Description" section.
The aircraft is controlled using a quadruply redundant,
digital fly-by-wire flight control system. All mechanical
linkages between the control stick, rudder pedals, andcontrol surfaces have been removed from the aircraft.
The throttles digitally control the engines through the
i¸.
Figure 1. The NASA F-15 ACTIVE test vehicle.
3American Institute of Aeronautics and Astronautics
EC96 43485-3

f.
flight controller, and no mechanical linkages existbetween the throttles and the engines. Ten separate
computers using 1553 multiplex data buses form the
highly integrated flight and propulsion control system.
These computers are used for digital flight, engine,nozzle, and inlet control; cockpit information
management; pilot-vehicle interface; and auxiliary
research computation capability.
The flight envelope of the F-15 ACTIVE vehicle is
reduced compared to the production F-15 airplane. The
composite material used to manufacture the canardslimits the maximum Mach number to 2.0. The flight
ceiling is an altitude of 50,000 ft because the digital
flight control system has not been cleared to higheraltitudes.
Propulsion System
The ACTIVE propulsion system consists of two
NASA-owned F100-PW-229 engines, each of which is
equipped with a new-generation axisymmetric thrust-
vectoring nozzle. An engine-mounted improved digital
electronic engine controller (IDEEC) and avionics
bay-mounted nozzle controller provide closed-loop
control of each respective component.
F100-PW-229 Engine
The F100-PW-229 engine is an augmented 29,000-1bfthrust-class motor that features a three-stage fan and
ten-stage compressor, each driven by a two-stage
turbine. An eleven-segment fuel delivery system is used
within the augmentor. The full-authority IDEEC
provides the pilot with unrestricted throttle movementthroughout the flight envelope while maintaining engine
operation within limits. A hydromechanical secondaryengine control provides "get-home" capability if the
IDEEC becomes unable to adequately control the
engine. The addition of the vectoring system does not
cause any loss of engine functionality, operational
capability, or modification of fault accommodation.
Small modifications to the main body of the engine
were required to support the addition of the vectoring
nozzle. These modifications included strengthening the
augmentor duct and front and rear fan ducts to
accommodate the off-axial loads generated during
nozzle vectoring.
Nozzle-Vectoring System
Each axisymmetric vectoring nozzle provides a
maximum of 20 ° of mechanical vector angle in any
circumferential direction. Independent control of thenozzle exit area allows the nozzle exit-to-throat area
ratio to be optimized for performance, unlike the
standard F100 divergent nozzle section, which uses amechanical linkage system that tracks throat area and
pressure loads but is not capable of independent exit areamodulation. Torsional freedom built into the divergent
seal design permits the nozzle to maintain a tight
gas-path seal even while vectored. The tight seal allows
thrust coefficient performance nearly identical to a
standard FI00 nozzle while preventing vectoring flow
instabilities. The majority of hardware forward of thethroat is common to the standard nozzle. The convergentsection maintains its mechanical and control
independence from the divergent section despite the
addition of the divergent section-vectoring system.
Instrumentation System
The aircraft has been extensively modified with a
flight test instrumentation system for recording digital
and analog sensor data. Approximately 3400
performance, flying qualities, structural loads, data bus,
and propulsion parameters are recorded onboard the
aircraft and are simultaneously downlinked to the NASA
Dryden mission control center.
A description of the strain-gage thrust sensor
arrangement, calibration, and data processing procedure
is provided in the ,Direct Thrust Measurement System
Description" section. A discussion of the input
parameters used in the analytical thrust calculation
models as well as for converting the direct engine-mount
force measurements into gross thrust can be found in the
"In-Flight Thrust Analysis" section.
Direct Thrust-Measurement System Description
Figure 2 shows the basic engine-mount reactions.
These longitudinal, vertical, and lateral reactions
transfer the combined thrust, inertia, gyroscopic, and
any nozzle airload forces into the fuselage structure. In
Inboard main-mount _ _,_ _.
thrust and vertica_ \ "_ / "_Foward-link _ _._ \ kN_/ < /
verticalA _ \ J "_\ / /
[[ _N_ _-\'\ _ Outboard\\ f_\\f \\ I _ _ main-mount
) \\ I]_ '_ thrust and" _ ]) f Side-link _ vertical load
lateral load980308
Figure 2. Left engine-mount reactions.
4
American Institute of Aeronautics and Astronautics
i i i_
i
/
the case of the ACTIVE program, pitch and yaw thrust
vectoring superimpose additional forces on the mounts.
The mount arrangement is fairly typical for fighter
aircraft designs with engines buried in the fuselage. The
layout and hardware are designed such that the reactions
are essentially statically determinate. For the front
mount, a dog-bone hanger link with monoball bearings
ensures that only vertical loads can be reacted and
simultaneously accommodates significant engine
thermal expansion in the longitudinal direction.
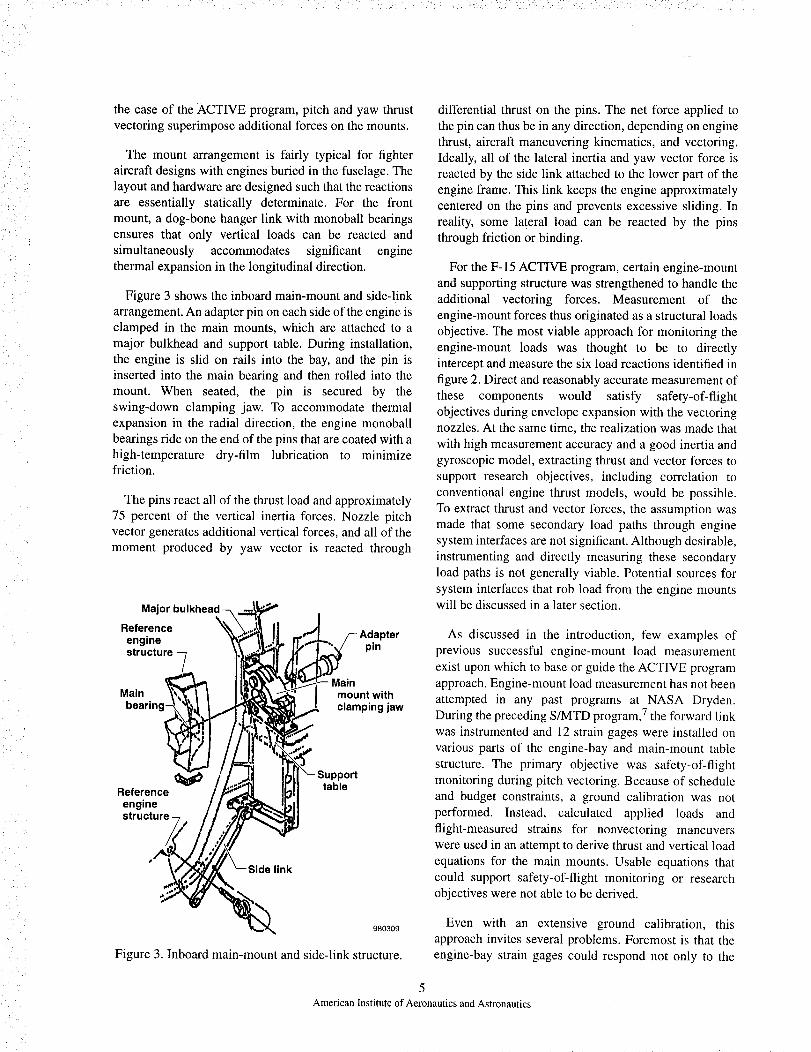
Figure 3 shows the inboard main-mount and side-link
arrangement. An adapter pin on each side of the engine is
clamped in the main mounts, which are attached to a
major bulkhead and support table. During installation,
the engine is slid on rails into the bay, and the pin is
inserted into the main bearing and then rolled into the
mount. When seated, the pin is secured by the
swing-down clamping jaw. To accommodate thermal
expansion in the radial direction, the engine monoball
bearings ride on the end of the pins that are coated with ahigh-temperature dry-film lubrication to minimizefriction.
The pins react all of the thrust load and approximately
75 percent of the vertical inertia forces. Nozzle pitchvector generates additional vertical forces, and all of the
moment produced by yaw vector is reacted through
Major bulkhead
Referenceengine Adapter
pin
structure -7
MainMain mount with
bearin( clampingjaw
Referenceenginestructure -
3orttable
link
differential thrust on the pins. The net force applied to
the pin can thus be in any direction, depending on engine
thrust, aircraft maneuvering kinematics, and vectoring.
Ideally, all of the lateral inertia and yaw vector force is
reacted by the side link attached to the lower part of the
engine frame. This link keeps the engine approximately
centered on the pins and prevents excessive sliding. In
reality, some lateral load can be reacted by the pins
through friction or binding.
For the F-15 ACTIVE program, certain engine-mount
and supporting structure was strengthened to handle the
additional vectoring forces. Measurement of the
engine-mount forces thus originated as a structural loads
objective. The most viable approach for monitoring the
engine-mount loads was thought to be to directly
intercept and measure the six load reactions identified in
figure 2. Direct and reasonably accurate measurement of
these components would satisfy safety-of-flight
objectives during envelope expansion with the vectoringnozzles. At the same time, the realization was made that
with high measurement accuracy and a good inertia and
gyroscopic model, extracting thrust and vector forces to
support research objectives, including correlation to
conventional engine thrust models, would be possible.
To extract thrust and vector forces, the assumption was
made that some secondary load paths through engine
system interfaces are not significant. Although desirable,
instrumenting and directly measuring these secondary
load paths is not generally viable. Potential sources for
system interfaces that rob load from the engine mountswill be discussed in a later section.
As discussed in the introduction, few examples of
previous successful engine-mount load measurement
exist upon which to base or guide the ACTIVE program
approach. Engine-mount load measurement has not been
attempted in any past programs at NASA Dryden.During the preceding S/MTD program, 7 the forward link
was instrumented and 12 strain gages were installed on
various parts of the engine-bay and main-mount table
structure. The primary objective was safety-of-flightmonitoring during pitch vectoring. Because of schedule
and budget constraints, a ground calibration was not
performed. Instead, calculated applied loads and
flight-measured strains for nonvectoring maneuvers
were used in an attempt to derive thrust and vertical load
equations for the main mounts. Usable equations that
could support safety-of-flight monitoring or researchobjectives were not able to be derived.
_, 980309
Figure 3. Inboard main-mount and side-link structure.
Even with an extensive ground calibration, this
approach invites several problems. Foremost is that the
engine-bay strain gages could respond not only to the
5American Institute of Aeronautics and Astronautics
main-mountloads,butalsotootherfuselagestrainsthathavenorelationshiptoengine-inducedloads(includingfuselageinertialoadsandevenhorizontalandverticalstabilizerloads).Separatingoutthesecombinedeffectssothatengineinducedloadscouldbecalculatedwouldbenearlyimpossible.Theengine-baystraingageswerealsosusceptibleto thermalcontamination.Togeneratethenecessarythermalcorrectiondata,anengine-baygroundheatingtestcouldbeconductedto simulatethethermaloperatingenvironment.Forschedule,cost,andpracticalconsiderations,thistypeoftestisgenerallynotan optionandwasnot performedfor theS/MTDprogram.
The followingsectionsdiscussthe strain-gageinstallationandcalibrationprocess,status,andlessonslearnedthathaveevolvedin supportof theACTIVEprogram.Theapproachis foundedon thedirectandseparatemeasurementof thethrustandverticalforcespassingthroughthemain-mountpins.Asthispaperisonlyconcernedwithmain-mountthrustmeasurementanditsconversiontogrossthrust,detailsrelatedtothelinkloadsorvectoringforceswillnotbeaddressed,
Strain-Gage Installation
In order to install and calibrate strain gages on the
main-mount pins, a fundamental starting requirement is
to fix the angle at which the pin is clamped in the mount.
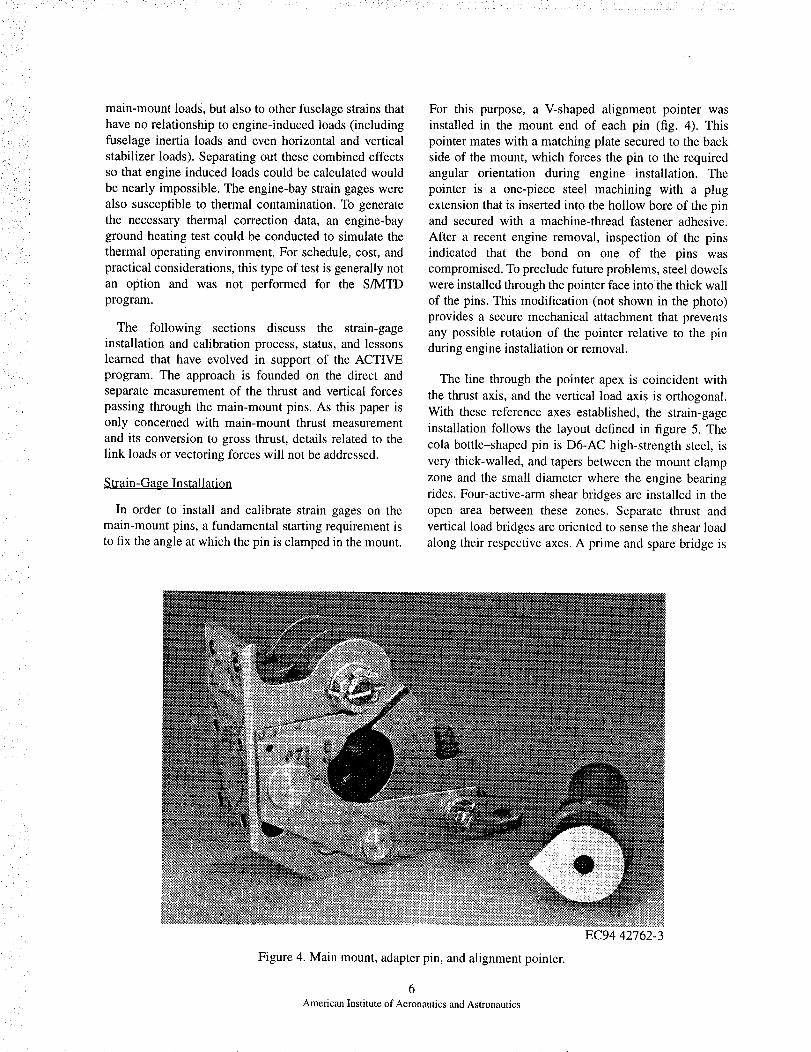
For this purpose, a V-shaped alignment pointer was
installed in the mount end of each pin (fig. 4). This
pointer mates with a matching plate secured to the back
side of the mount, which forces the pin to the required
angular orientation during engine installation. The
pointer is a one-piece steel machining with a plug
extension that is inserted into the hollow bore of the pinand secured with a machine-thread fastener adhesive.
After a recent engine removal, mspection of the pins
indicated that the bond on one of the pins was
compromised. To preclude future problems, steel dowels
were installed through the pointer face intothe thick wall
of the pins. This modification (not shown in the photo)
provides a secure mechanical attachment that prevents
any possible rotation of the pointer relative to the pinduring engine installation or removal.
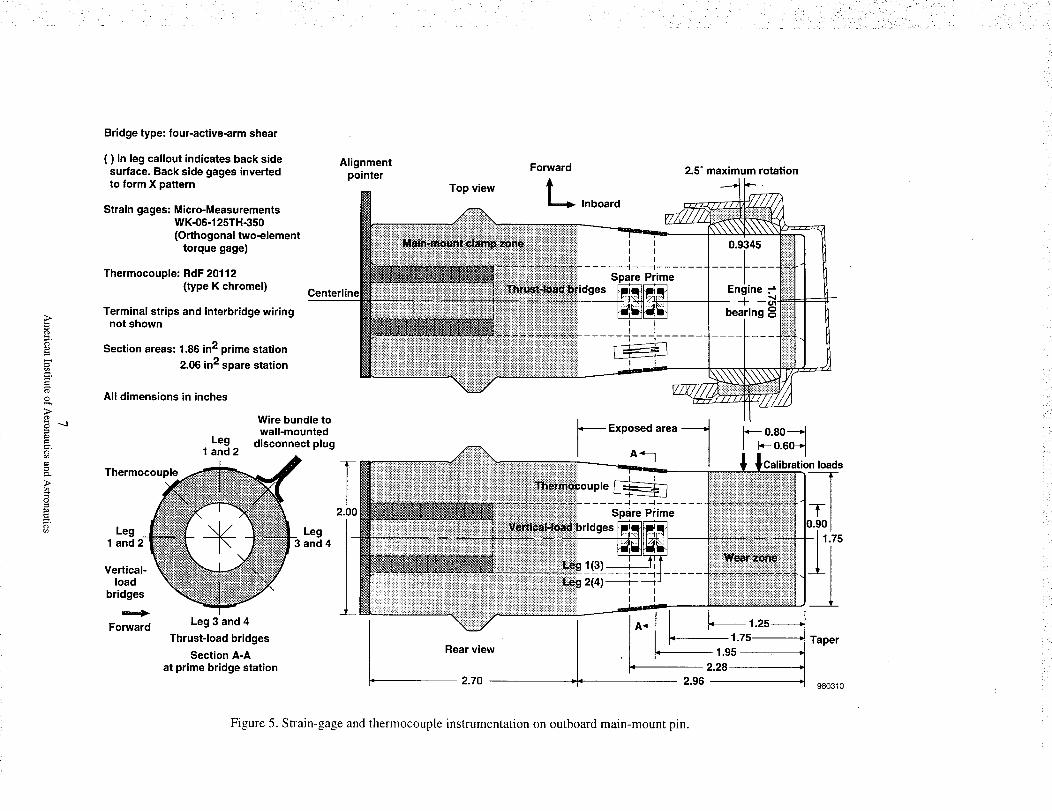
The line through the pointer apex is coincident with
the thrust axis, and the vertical load axis is orthogonal.
With these reference axes established, the strain-gage
installation follows the layout defined in figure 5. The
cola bottle-shaped pin is D6-AC high-strength steel, is
very thick-walled, and tapers between the mount clamp
zone and the small diameter where the engine bearing
rides. Four-active-arm shear bridges are installed in the
open area between these zones Separate thrust and
vertical load bridges are oriented to sense the shear load
along their respective axes. A prime and spare bridge is
i '
Figure 4. Main mount, adapter pin, and alignment pointer.
6American Institute of Aeronautics and Astronautics
EC94 42762-3
k
>
>c0
==
>
==
Bridge type: four-active-arm shear
( ) in leg callout indicates back sidesurface. Back side gages invertedto form X pattern
Strain gages: Micro-MeasurementsWK-06-125TH-350
(Orthogonal two-elementtorque gage)
Thermocouple: RdF 20112(type K chromel)
Terminal strips and interbridge wiringnot shown
Section areas: 1.86 in2 prime station
2.06 in2 spare station
Centerline
All dimensions in inches
Leg1 and 2
Wire bundle towall-mounted
disconnect plug
Thermocouple
Leg1 and
Vertical-load
bridges
,====d_Forward Leg 3 and 4
Thrust-load bridges
Section A-Aat prime bridge station
Legand 4
Alignmentpointer
2.00
Top view
Rear view
2.70
Forward
L Inboard
2.5 ° maximum rotation
I
I
I
Spare
2.28
2.96
*_0.80-_
o.6o_,Calibration loads
_--1.25-----*
1.75 " Taper1.95
980310
Figure 5. Strain-gage and thermocouple instrumentation on outboard main-mount pin.

provided for each axis, totalling four for each pin. The
gages are Micro-Measurements (Measurements Group
Inc., Raleigh, North Carolina) WK-06 series for
increased toughness and temperature capability in the
potentially harsh environment, temperature-matched for
steel. The specific TH model gage used has a grid
configuration with two orthogonal legs precision-
aligned in a V shape. The other two legs are installed on
the back side of the pin, but are rotated 180 ° to form a
superimposed X shape. This bridge configuration is
considered the optimum for measuring shear and should
be inherently insensitive to any lateral or torque loads on
the pin.
To accommodate potential corrections for thermal
errors in the bridge output, a type K thermocouple (RdF
Corporation, Hudson. New Hampshire) is installed in
the space between and close to the gages. Figure 6 shows
a closeup photograph of the completed installation prior
to application of a heavy protective coating of sealing
compound. Interbridge wiring is routed to solder tabs
located in the areas between the orthogonal axes. and
from there, a single wire bundle with built-in strain relief
is routed to a wall-mounted disconnect plug. With the
16 individual strain-gage legs, interbridge wiring, and
thermocouple, the pin circumference is congested but
manageable.
Prior to committing to this approach, potential
problems and disadvantages with both the installation
and obtaining a usable calibration were identified asdiscussed below:
• The usable space between the edge of the mount
and the engine beating is only approximately i in.
The wear zones evident on the original pins from
the previous program were surveyed to determine
the maximum range of lateral bearing movement on
the pin. The survey results dictated the safe area for
strain-gage installation (figure 5 shows the worst-
case bearing position and angle). New pins wereobtained for the ACTIVE program so that the pinsstarted with no wear.
• The close proximity of the gages to both the bearing
and mount clamping zones generated concerns
regarding localized loading and reaction effects
that could produce a strain field that was notwell-behaved. Such a strain field could lead to
erratic, nonlinear response; hysteresis; and other
undesirable effects. The strain gages are
approximately centered between these zones, and
an approximately 0.5-in. gap exists from each strain
gage to the edge of the nearest gage grid.
• The shear bridges had to be installed on a tapering
cross section for this application, which a
Figure 6. Installed strain-gage instrumentation.
8American Institute of Aeronautics and Astronautics
EC94 42893-4
sensitivityanalysisindicatedshouldnot alonepresentanyproblems.
• Tohandlethedesigntemperatureof350°Fandbefatigueresistant,thepinhasaverylargemarginrelativeto normaloperatingloads.This largemarginproducesfairlylowshearbridgeresponse,predictedto beapproximately10-12mVat loadlimit.Fortypicalmaximumthrustoperatinglevels,theoutputwouldonlybeapproximately5-6mV.Thelowresponsecouldleadtonoiseproblemsandincreasesusceptibilitytothermalcontamination.
• Shearbridgescan showsomesensitivitytobendingmoment.Thethermalexpansionandlateralslidingof theengineproducesa rangeofbearingpositionsthatvaryapproximately0.2in.andareunpredictable.Fortheprimestrain-gagestation,thisthermalexpansionandlateralslidingproducesabendingannvariationofapproximately_+10percent.
• Oneofthebiggestconcernswastheexpectationforcross-axisloadingeffects.Whenapurethrustloadis applied,theverticalaxisgagesideallyproducelittleornoresponse.Conversely,thethrust-orientedgagesideallyrespondonlytothecomponentalongthethrustaxis.In actuality,themagnitudeandbehaviorofthesecross-axiseffectswoulddependinpartontheprecisionalignmentandplacementofthestrain-gageinstallation.A gooddealofcarewastakeninmarkingtheaxesandpositioningthegagestominimizetheseeffects.
• A levelofconcernexistedregardingthepotentialfordamagetothegages,wiringbundle,andpointer
duringengineinstallation,removal,andnormaloperation.Thealignmentpointer,in particular,requiressomeextracareandeffortduringengineinstallation,as thepointermustslide,withoutrolling,duringthefinalseatingin themount.After95 flightsand severalengineremovalsandinstallations,concernsinthisareahavediminished.Theonlyproblemtodatehasbeenthatrelatedtothepointerdiscussedearlier.
Applicationofthecalibrationloadsdoesrequireacustomfixture,asdescribedin thenextsection.
Thepotentialissueslistedabovewerecumulativelyimposing;however,therealizationwasmadethatif goodpin calibrationscouldbeobtained,thennonengine-generatedforcescouldnotcontaminatethestrain-gageoutputs.Someadditionaladvantagesinherentto thisoverallapproachresultfrombeingableto removetheinstrumentedpinsfromtheaircraft.Oneadvantageisanoff-aircraftcalibrationloadingshouldbe simpler,quicker,lesscostly,and lesshazardousthan anequivalenton-aircrafttest.Anotheradvantageis thatwith their relativelysmallsize, the pins can beoven-testedtoestablishthermalcorrectionstothegageoutputs,asdiscussedin afollowingsection.Also,thepinscouldbeinstalledincomparablemountstoconductatestprogramonadifferentaircraft.Theseoptionsdonotexistif straingagesareinstalledonengine-bayormount-supportingstructure.
Calibration Process
The calibration process has evolved through four
distinct steps summarized in table 1. The philosophy is
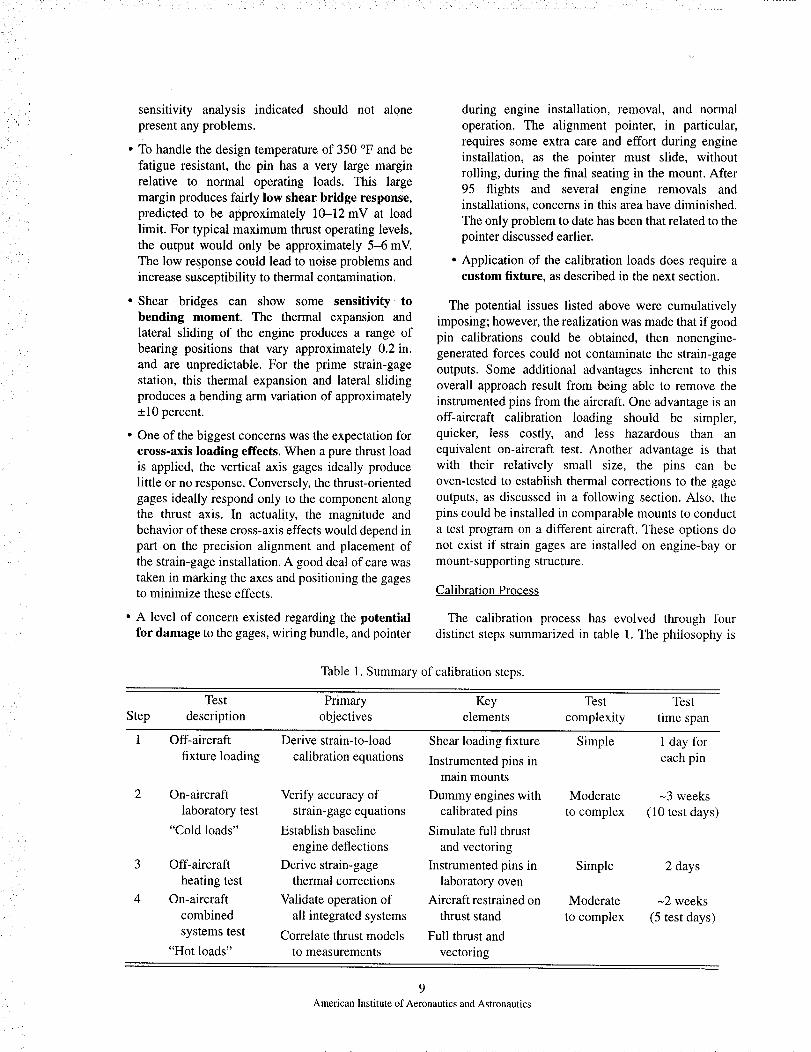
Table 1. Summary of calibration steps.
Test Primary Key Test Test
Step description objectives elements complexity time span
1 Off-aircraft Derive strain-to-load Shear loading fixture Simple 1 day tbr
fixture loading calibration equations Instrumented pins in each pinmain mounts
2 On-aircraft Verify accuracy of Dummy engines with Moderate -3 weeks
laboratory test strain-gage equations calibrated pins to complex (10 test days)
"Cold loads" Establish baseline Simulate full thrust
engine deflections and vectoring
3 Off-aircraft Derive strain-gage Instrumented pins in Simple 2 days
heating test thermal corrections laboratory oven
4 On-aircraft Validate operation of Aircraft restrained on Moderate -2 weeks
combined all integrated systems thrust stand to complex (5 test days)
systems test Correlate thrust models Full thrust and
"Hot loads" to measurements vectoring
9
American Institute of Aeronautics and Astronautics

commonto manyflight tests:startwitha relativelysimplebasicstep,and with eachnewstep,addcomplexity,understandandcontrolerrorsorproblems,andincorporatelessonslearnedfromprecedingsteps.
Off-Aircraft Fixture Loading
The first step established the basic calibration
equations to convert the measured strata-gage outputs(measured in mV) to the desired force quantities
(measured in lbf). For this purpose, a shear-loading
fixture (fig. 7) was constructed. A main mount from the
airplane was used to hold the pros, and loads were
applied through a hydraulic jack, a load cell, and
"lollypop" hardware containing a bearing obtained from
the engine manufacturer. All of this hardware was
mounted on a large I beam. The calibration process
required loading the pin at various angles to simulate the
combinations of thrust and vertical load expected in
flight. To simplify the fixture setup, the following
procedure was devised: the pointer mating plate was
removed, and instead, a custom protractor template
made from a viewgraph transparency was taped to the
back side of the mount face. So, rather than rotating the
whole jack structure to apply loads at varying angles, the
pin or pointer was s_mply rotated to the desired angle
and reclamped in the mount. The mount itself was
always loaded in the thrust direction.
EC94 42896-5
Figure 7. Pin calibration shear-loading fixture.
Each pin was loaded at six different angles that
covered the normal operating portions of the
main-mount strength envelope. These loading conditions
(fig. 8) are superimposed on the strength envelope
Down,+g
Verticalload,
Ibf
24 x 103
16
-8
: : 90of , 7.so :Main-mouht strength:envelope / ,_ _--_ A_o
........ ,_---. .... 0o
i i i
i i i i
i i ii i r i
', : : \' / "N--
- 16 24 x 103-8 0 8 16Thrust load, Ibf Forward
Figure 8. Pin calibration loading conditions.
980311
10American Institute of Aeronautics and Astronautics
defined in terms of vertical load limit as a function of
thrust load. Positive vertical load is a down load on the
mount, corresponding to a positwe aircraft load factor.
Initial loadings ranged from 27,000 lbf forward to
-20,000 lbf aft (approximately 115 percent of the flight
operating limits) using a slow ramping profile. Because
the gage outputs were fairly linear, the profile was
reduced for most runs to the range from 24,000 to
-12,000 lbf shown in the figure. The first quadrant,
representing forward thrust and positive g, is well-
covered, as this quadrant is the normal operating region
where calibration accuracy is most important. Negative g
or aft thrust conditions were given less emphasis. At
each angle, the pin was loaded at the most inboard and
outboard bearing positions to assess the bending and
localized loading effects discussed previously. Figure 5
shows these positions in the lower rear view.
The calibration data for the 8 bridges (prime and spare
for thrust and vertical for each of the two pins) were
evaluated for each of the 12 loading cases (6 angles for
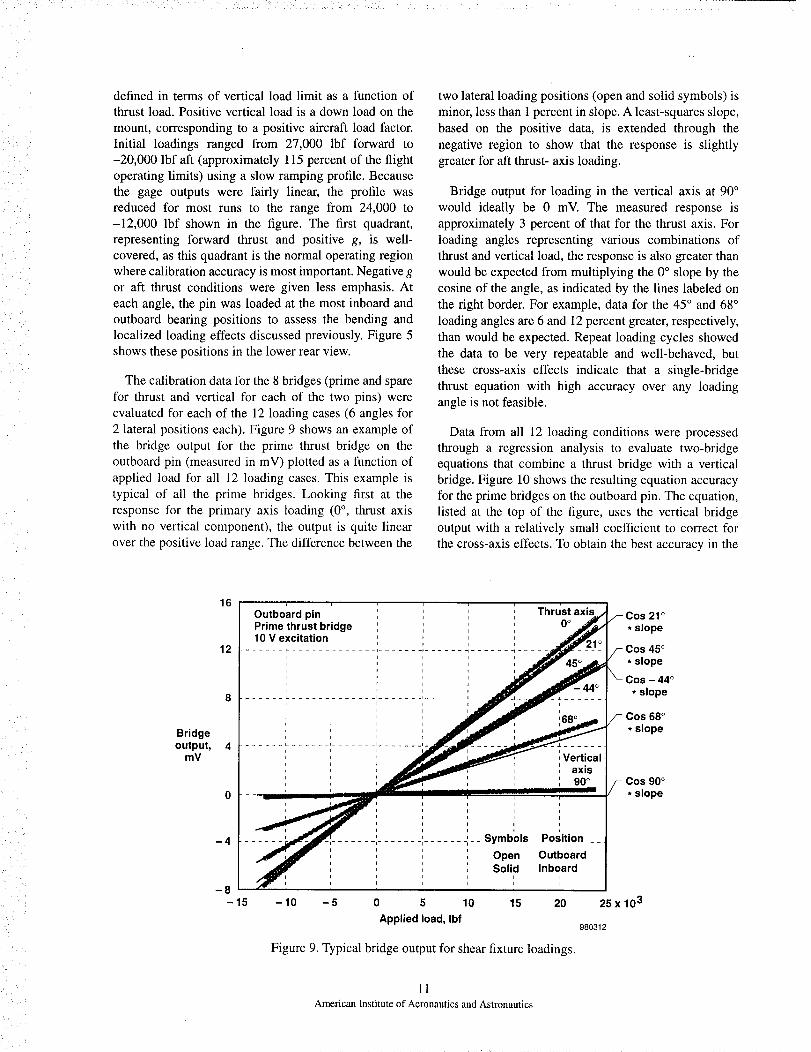
2 lateral positions each). Figure 9 shows an example of
the bridge output for the prime thrust bridge on the
outboard pin (measured in mV) plotted as a function of
applied load for all 12 loading cases. This example is
typical of all the prime bridges. Looking first at the
response for the primary axis loading (0 °, thrust axis
with no vertical component), the output is quite linear
over the positive load range. The difference between the
two lateral loading positions (open and solid symbols) is
minor, less than 1 percent in slope. A least-squares slope,
based on the positive data, is extended through the
negative region to show that the response is slightly
greater for aft thrust- axis loading.
Bridge output for loading in the vertical axis at 90 °
would ideally be 0 mV. The measured response is
approximately 3 percent of that for the thrust axis. For
loading angles representing various combinations of
thrust and vertical load, the response is also greater than
would be expected from multiplying the 0 ° slope by the
cosine of the angle, as indicated by the lines labeled on
the right border. For example, data for the 45 ° and 68 °
loading angles are 6 and 12 percent greater, respectively,
than would be expected. Repeat loading cycles showed
the data to be very repeatable and well-behaved, but
these cross-axis effects indicate that a single-bridge
thrust equation with high accuracy over any loading
angle is not feasible.
Data from all 12 loading conditions were processed
through a regression analysis to evaluate two-bridge
equations that combine a thrust bridge with a vertical
bridge. Figure 10 shows the resulting equation accuracy
for the prime bridges on the outboard pin. The equation,
listed at the top of the figure, uses the vertical bridge
output with a relatively small coefficient to correct for
the cross-axis effects. To obtain the best accuracy in the
Bridgeoutput,
mV
16Outboard pinPrime thrust bridge10 V excitation
12 ...... _ ...... ,............... ,...... _ ......i i I
i i
i i i
t t r
j = i
8 ..... _ ...... i ....... i....... i......
i i i
i i i
i i i
E i i
i i
,,,1,
-4
-8
i
i
i
I
..... i ....... i ...... -I -
I iI i
i I
i i
I i
ust axis 21 o0° * slope
Cos 45 °• slope
Cos - 44 °• slope
',:6 Cos 68 °
• slope
i •
, Verticalaxis90 °
_ Symbols Position
Open OutboardSolid Inboard
I i
i I
-15 - 10 - 5 0 5 10 15 20
Applied load, Ibf
Figure 9. Typical bridge output for shear fixture loadings.
11
American Institute of Aeronautics and Astronautics
Cos 90 °* slope
25 x 103
980312

Strain-gagemount thrust,
Ibf
25 x 103i i i i i ,
I i i I I I .j
/I .... i
, Mount thrust (Ibf) = 1625 ,I . IT--
20 ..... '..... * Thrust bridge (mV) + 65.7 ___', * Verticalbridge (mV) j_m i _ i i i
i i i i i i
i i m i i i
15 ........... I...... r ..... I...... i .......... i .....
I i m i i i
, i t i i i
i i i i i i
i i i i i ii i L i i
__]u...... ,...... r ..... ,.......... ,...... ,.....I I I I I I
I I r I I II i i i i i
m I i I I I
m I I I I0 ...... I...... F" ......... I...... I...... i.....
m I I I i II I I i i
i i i i i i
i I i i I I
£t i I I i Iu
...... I.......... i...... =...... i ...... i.....
I I I i i I
.... ___l_bf_; ...... ,.....
E i i i i i
i i i i i
i i i i i =
i i i # i i
-10 -5 0 5 10 15 20 25x103
Applied mount thrust, Ibf980313
Figure 10. Thrust equation accuracy for shear fixture loadings.
-5
-10
Outboard pinPrime two-bridge equationAll 12 loading runs6 angles * 2 positions
positive thrust direction, aft thrust data were excluded
from the regression analysis; then the increased error in
this region was accepted. The regression equation does a
remarkable job for any loading angle or lateral position.The correlation coefficient and standard error for this fit
are shown on the figure. The 3-_ error divided by the
maximum load is 1 percent.
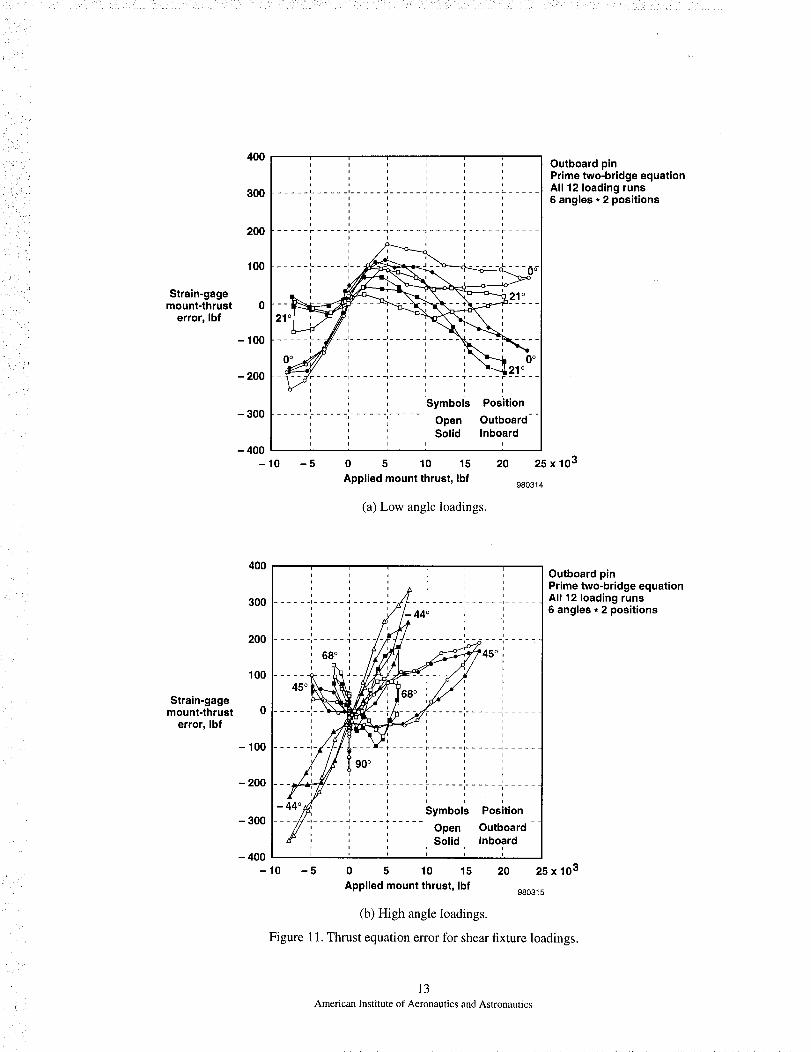
Figure 11 shows the discrete error for each data point
plotted The final equation coefficients were manually
tuned to minimize and balance the errors for the positive
thrust and positive g loading conditions. This tuning
produced a maximum error band of ___200lbf for these
conditions. For the low-angle loadings most pertinent to
this paper, figure l l(a) shows that the maximum
hysteresis spread is approximately +50 lbf, and the
largest difference between the lateral loading positions is
200 lbf. Thrust errors for the more acute angles,
representing significant g loadings (fig. 1 l(b)), are also
minimal except for the less important -44 ° condition.
Prime equation accuracy for the inboard pin thrust wascomparable to that discussed here. Accuracies for the
prime vertical equations or those using the spare bridges
were not quite as good, with 3-c3 errors varying from2 to 4 percent. The overall assessment, however, is that
the calibration equations resulted in as near optimum a
set of shear sensors as could be hoped for, especially
considering all the potential issues discussed earlier.
One negative aspect that was not anticipated, however,
was uncovered in the shear fixture loadings. The
clamping jaw exhibited what could be considered
excessive flexibility. This flexibility allowed the pin to
yaw, causing substantial gapping between the pin and
the bore face. The amount of gapping was dependent on
the magnitude and direction of the applied load. A
deflection transducer was added to the test setup to
measure the fore and aft yawing of the pin because this
addition produces an additional source for engine
movement relative to the bay. At maximum thrust, the
engine is expected to move forward 0.05 in. because of
the pin-and-mount assembly flexibility in addition to
airframe flexibility and thermal expansion effects.
This gapping also generated additional concern thatthe cross-axis effects mentioned above would not be
properly simulated because the pin was rotated instead
of the jack. The clamping flexibility, and thus the
gapping characteristics, could be different for each
mount and loading angle. Cross-axis bridge output was
2-4 percent of the primary axis output for the prime
bridges, but was 10-15 percent for the spares, which are
closer to the mount, indicating that the clamping and
gapping characteristics can affect the bridge response.
The simplification in the test setup thus produced some
compromise in the fidelity of the simulated loads that
could influence the validity of the excellent calibration
12American Institute of Aeronautics and Astronautics
Strain-gagemount-thrust
error, Ibf
400
300
200
100
0
- 100
- 200
- 300
- 400-10 -5
....... iiii]I I I I
I I i i
I i i I
1 I t I
I I
...... L ..... I.......... L .....I I o
II I I t
21°1 , y/p, , -- ¢r_"_ \ ,
...... L - - I ...... , ..... d .........I I I I
o i i i i o
_1_--_/' .... =_,21 ° L-- r- ..... i...... _ ..... "1 ..... 1- ..... r- .....
i I I I i
I I I ' " ', ,
, , , Symbols Pos0ttonP i i
........................ ', ', Open Outboard--
! i , Solid, Inboard
Outboard pinPrime two-bridge equationAll 12 loading runs6 angles * 2 positions
0 5 10 15 20 25 x 103
Applied mount thrust, Ibf980314
(a) Low angle loadings.
i
Strain-gagemount-thrust
error, Ibf
4OO
300
200
100
0
- 100
- 2OO
- 300
- 400
i i t I I
I I I t = I
I I K I I I
i t I i i I
i r i i
-Ui I i I I
i i I i I
..... i ..... 7 ....... r ..... t...... i .... -
i i o J
: 68 °i
............. i .....
-'--"-_ _i .... '--- '..... _ ..... t- ..... I...... i .....
Ii- I I I
90 ° ', , ,i I
i I i i
i ...... i r ii ..... T ..... t...... i .....
i i i
i i I
- Symbols Position
/ ........i O.enOu,',oarOSolid Inboard
i
i r I I
-10 -5 0 5 10 15 20
Applied mount thrust, Ibf
25 x 103
980315
Outboard pinPrime two-bridge equationAll 12 loading runs6 angles. 2 positions
(b) High angle loadings.
Figure 11. Thrust equation error for shear fixture loadings.
13American Institute of Aeronautics and Astronautics
equations just discussed. The ground test schedule didnot allow consideration for redesigning the fixture setup
and repeating the loadings. Instead, the on-aircraftlaboratory test, described next, would be used to check
the calibration validity.
On-Aircraft Laboratory Test ("Cold Loads")
In early planning of the overall ground test program,
the necessity and importance of conducting anon-aircraft laboratory test was debated, especially in
light of the effort and time required and that a combined
systems test with engines installed and operating (the"hot loads" test) was already planned. In reality, the
on-aircraft laboratory test without engines installed (the
"cold loads" test) supported the multiple objectiveslisted below:
i. Validate the aircraft restraint system to be used inthe "hot loads" test.
2. Satisfy proof test requirements for the strengthenedaircraft structure.
3. Establish baseline engine deflections relative to the
bay.
4. Verify side-link and main-mount frictioncharacteristics.
5. Establish the accuracy of baseline strain-gage
equations.
In lieu of "cold loads" testing, objectives 1, 2, and 3
could be accomplished during "hot loads" testing. The"hot loads" test could be used to validate the strain
gage-derived thrust equation, but could not address
elevated g maneuvering or vector-force calculations.
With the concerns expressed in the previous section
regarding the main-mount flexibility, the desirability of
conducting the "cold loads" test to support objectives 3
and 5 was considerably elevated.
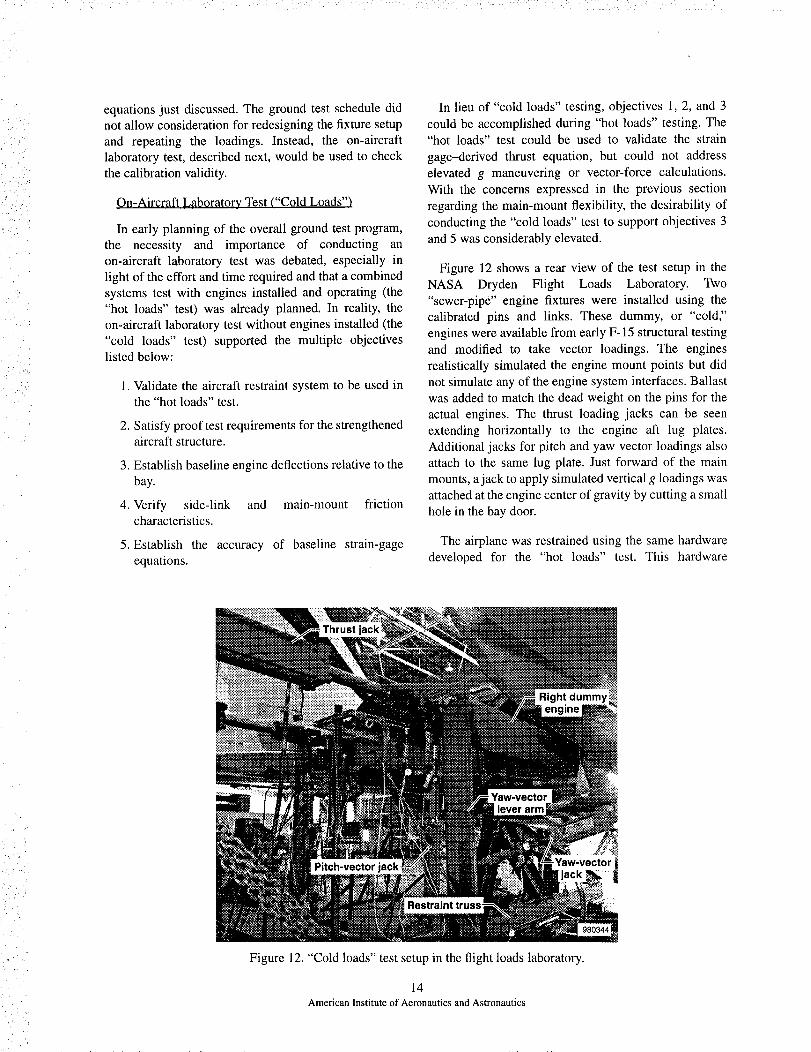
Figure 12 shows a rear view of the test setup in the
NASA Dryden Flight Loads Laboratory. Two
"sewer-pipe" engine fixtures were installed using the
calibrated pins and links. These dummy, or "cold,"
engines were available from early F-15 structural testing
and modified to take vector loadings. The engines
realistically simulated the engine mount points but did
not simulate any of the engine system interfaces. Ballast
was added to match the dead weight on the pins for the
actual engines. The thrust loading jacks can be seen
extending horizontally to the engine aft lug plates.
Additional jacks for pitch and yaw vector loadings also
attach to the same lug plate. Just forward of the main
mounts, a jack to apply simulated vertical g loadings was
attached at the engine center of gravity by cutting a small
hole in the bay door.
The airplane was restrained using the same hardware
developed for the "hot loads" test. This hardware
Figure 12. "Cold loads" test setup in the flight loads laboratory.
14American Institute of Aeronautics and Astronautics
consisted of spare main landing gear, bottomed out and
secured in massive cradles; and the attachment of a large
truss structure to the arresting hook trunnions. Test
measurements consisted of 16 mount strain gages,
7 hydraulic jack loads, and 14 displacement transducers
to establish engine and aircraft deformations. Note that,
because of the vector-force requirements, the overall test
setup was far more complex than would be required for
testing just thrust and g loadings. For a typical
nonvectoring fighter configuration with a much
simplified restraint and loading system, the test could
have been conducted within a one-week span. The "cold
loads" test required approximately three weeks
dedicated aircraft time, including setup, testing, andteardown.
The test was considered very successful and produced
valuable data in support of all five objectives. Maximum
loadings simulated were as follows:
• Mount thrust of 20,000 lbf (for each engine)
• Vertical load factor equal to 5 g
• Pitch and yaw vector force greater than 110 percent
of design limit
• Combinations of the above including simulation of
pitch-yaw vectoring at maximum thrust and
elevated g
Significant results pertinent to this paper related to
"cold loads" test objectives 3 and 5 follow below. Engine
displacements relative to the bay were measured in allthree axes at the inlet seal on the left engine, along with
lateral movement at the main-mount pins. At maximum
thrust, the longitudinal displacement was approximately
0.1 in; For the unrestrained airframe in flight, some
additional displacement combined with thermal
expansion is likely. The test matrix provided extensive
data for evaluating the baseline strain-gage equations
derived from the ]xture loadings. Because the buildup
test matrix progressed from individual jack loadings to
many realistic combination loadings, assessing the
equation errors for each loading scenario was possible.
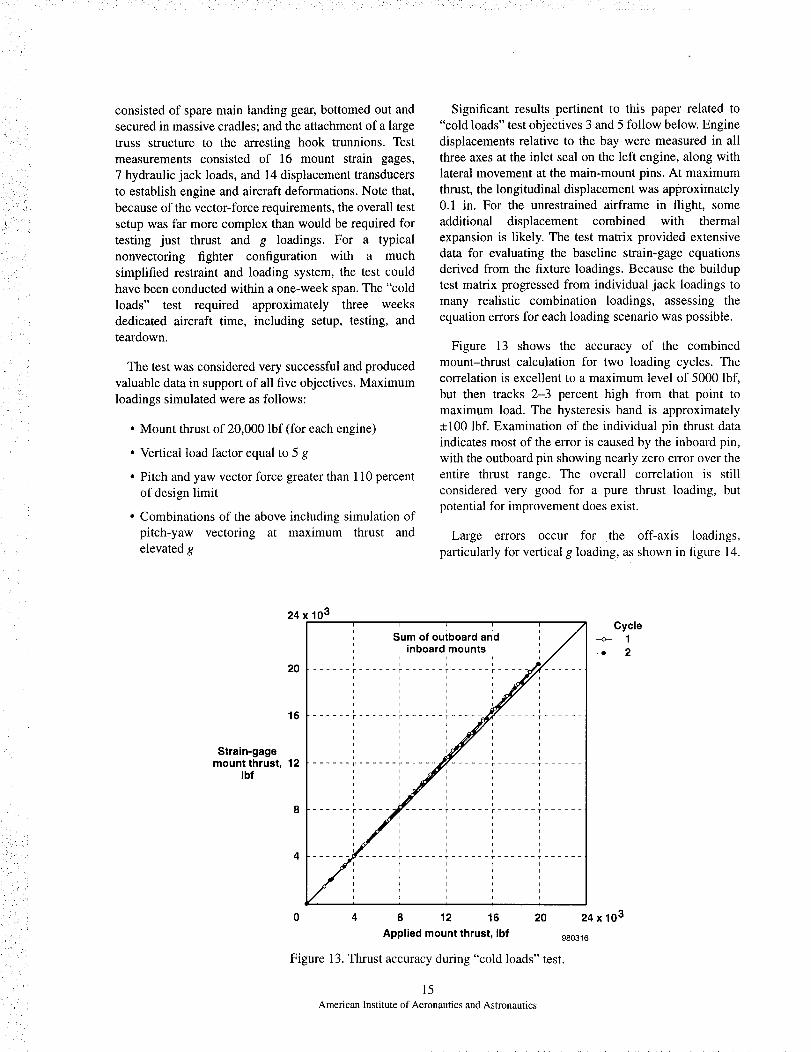
Figure 13 shows the accuracy of the combined
mount-thrust calculation for two loading cycles. Thecorrelation is excellent to a maximum level of 5000 lbf,
but then tracks 2-3 percent high from that point to
maximum load. The hysteresis band is approximately
_+100 lbf. Examination of the individual pin thrust data
indicates most of the error is caused by the inboard pin,
with the outboard pin showing nearly zero error over the
entire thrust range. The overall correlation is still
considered very good for a pure thrust loading, but
potential for improvement does exist.
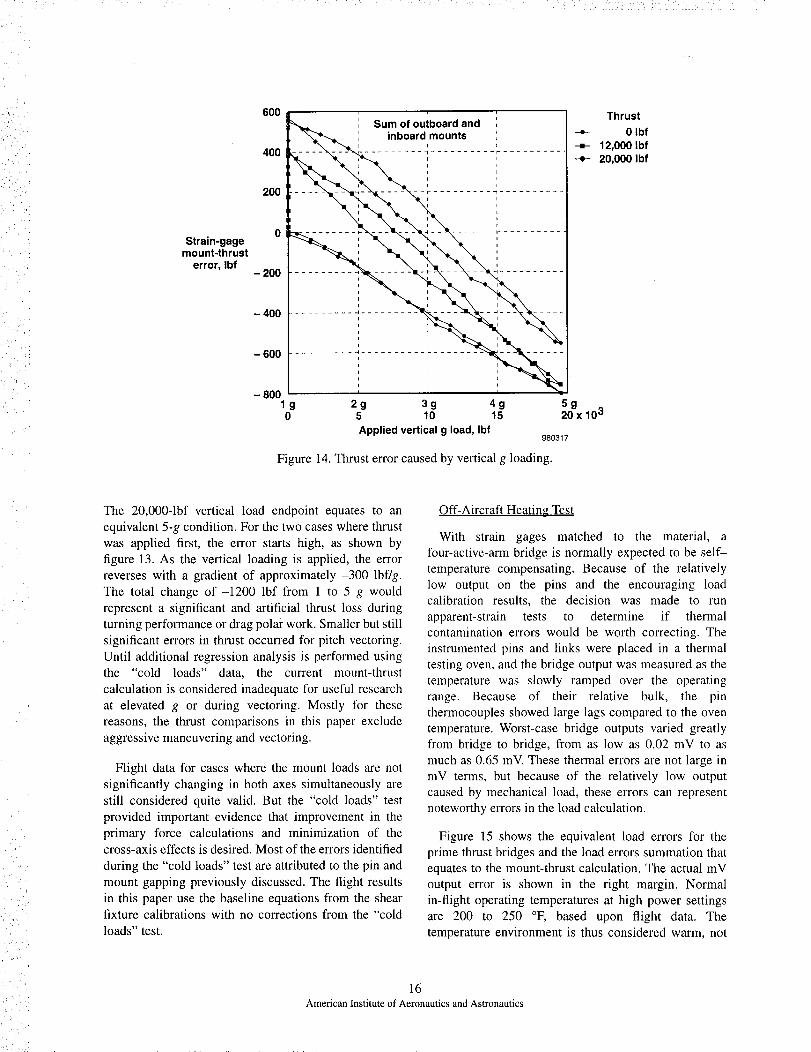
Large errors occur for the off-axis loadings,
particularly for vertical g loading, as shown in figure 14.
,)!, ;
Lii:i
/r i _ '
24 x 103I L i i
' i
Sum of outboard and ,, _ -o-
inboard mounts ' / I
-'u .............. r ...... r ...... _ .....|
i i i i
i i i
.............. F ...... r ........... T ......
I L I I
I I I I
I I I I
I I I I
I I I I
....... r ...... r ........... F ...... r ......
i i I i
i i i i i
i i i i I
i i i i I
i i i i
i i i i
....... V ........... F ...... r ...... r ......
i i i i f
i i I t
i i i f
i i I i
i i i I
i i I i
/-ll ................... r ...... r ...... T ......
i i I I
i i i i
I I I i
I I I I
I I I I
16
Strain-gage
mount thrust, 12Ibf
8
Cycle
0 4 8 12 16 20 24 x 10 3
Applied mount thrust, Ibf 980316
Figure 13. Thrust accuracy during "cold loads" test.
15
American Institute of Aeronautics and Astronautics
• i ¸ ,
• _, i_ ;
!i ¸I , ,
Strain-gagemount-thrust
error, Ibf
600
400
200
0
- 200
400
600
- 800
Sum of outboard and
inboardmounts
L--_,_ ,_-, ......... 1,,.......... ,'_.........
,,.............. ; ......... _,.............. :
t
......... ,_ ................ _ .........i I I
i I I
i i
I i
.......... _ ....... ,_...................
t i I
t I
i i t
t I
i i t
J I I
i I I
g 2g 3g 4g 5g0 5 10 15 20 x 103
Applied vertical g load, Ibf980317
Figure 14. Thrust error caused by vertical g loading.
Thrust
-_ 0 Ibf
--=- 12,000 Ibf
--*- 20,000 Ibf
i_
The 20,000-1bf vertical load endpoint equates to an
equivalent 5-g condition. For the two cases where thrust
was applied first, the error starts high, as shown by
figure 13. As the vertical loading is applied, the error
reverses with a gradient of approximately -300 lbf/g.
The total change of-1200 lbf from 1 to 5 g would
represent a significant and artificial thrust loss during
turning performance or drag polar work. Smaller but still
significant errors in thrust occurred for pitch vectoring.
Until additional regression analysis is performed using
the "cold loads" data, the current mount-thrust
calculation is considered inadequate for useful research
at elevated g or during vectoring. Mostly for these
reasons, the thrust comparisons in this paper exclude
aggressive maneuvering and vectoring.
Flight data for cases where the mount loads are not
significantly changing in both axes simultaneously are
still considered quite valid. But the "cold loads" test
provided important evidence that improvement in the
primary force calculations and minimization of thecross-axis effects is desired. Most of the errors identified
during the "cold loads" test are attributed to the pin and
mount gapping previously discussed. The flight results
in this paper use the baseline equations from the shearfixture calibrations with no corrections from the "cold
loads" test.
Off-Aircraft Heating Test
With strain gages matched to the material, a
four-active-arm bridge is normally expected to be self-
temperature compensating. Because of the relatively
low output on the pins and the encouraging load
calibration results, the decision was made to run
apparent-strain tests to determine if thermal
contamination errors would be worth correcting. The
instrumented pins and links were placed in a thermal
testing oven, and the bridge output was measured as the
temperature was slowly ramped over the operating
range. Because of their relative bulk, the pin
thermocouples showed large lags compared to the oven
temperature. Worst-case bridge outputs varied greatly
from bridge to bridge, from as low as 0.02 mV to as
much as 0.65 inV. These thermal errors are not large in
mV terms, but because of the relatively low output
caused by mechanical load, these errors can represent
noteworthy errors in the load calculation.
Figure 15 shows the equivalent load errors for the
prime thrust bridges and the load errors summation that
equates to the mount-thrust calculation. The actual mV
output error is shown in the right margin. Normal
in-flight operating temperatures at high power settings
are 200 to 250 °F, based upon flight data. The
temperature environment is thus considered warm, not
? ','
16American Institute of Aeronautics and Astronautics

Mount-thrustthermal error,
Ibf
Reference temperature = 70 °F 10 V excitation0 _ i r
/_1_ InbOsrd mOunt
,- 200 ...... ,....ii
- 400 ...... _ ...... _........ _...... _......oar mount
i
- 600 .................... "
Combined-mount thrust -/i ii i i
- 800 ................................'
Typical flig'ht \................... operating range....
at high power
ii
-1000
-120050 100 150 200 250 300 350
Temperature, °F980318
Figure 15. Thrust error from heating test.
- 0.12 mV
- 0.53 mV
i
i_/
i _
:?i i _I
hot, but the combined error in the mount-thrust equation
would be approximately 700 lbf. At typical maximum
augmented (maximum) power conditions, this value
represents a mount-thrust error of approximately
-3 percent, increasing to -6 percent at maximum
nonaugmented (military) power levels. The
apparent-strain corrections for some bridges are thus
considered important, not only for research quality data.
but also for safety-of-flight monitoring.
Many of the bridge outputs showed minor nonlinearitywith temperature, but simple linear fits were derived for
each bridge and were thought to be adequate. Outputcorrection terms (measured in mV) took the form of a
constant multiplied by the difference in temperaturefrom a reference state, which simplified the real-time
and postftight data processing. Some effort has been
made to validate the individual thermal corrections using
data from the "hot loads" test, but the results are not fullyconclusive.
Aircraft Combined Systems Test ("Hot Loads")
The combined systems ground test was the definitive
clearance check performed prior to committing the
aircraft to flight. Major objectives included operational
validation of all integrated systems, both hardware and
software. In particular, validation of the onboard thrust
model and the vector-force limiting logic was key. The
aircraft, restrained on the thrust stand facility at Edwards
Air Force Base (California), was capable of
demonstrating full vectoring with both engines at
maximum power. Relative to "cold loads." this testing
added the elements of thermal effects and engine system
interfaces, but did not have inertial g forces adding to the
measured engine-mount data. Prior to installing the
engines, a survey of the engine bay was conducted to
assess the most likely sources for secondary load paths.
The highest potential candidates were identified as thefollowing:
• Engine-face inlet seal: Under worst-case highpower conditions, combined thermal growth and
deformations could have fully compressed the
rubber seal, allowing some thrust transfer throughthe supporting structure.
• Airframe-to-nozzle fairings: The fairings arecinched down onto a nozzle rub strip. If the cinch
straps were overly tight, a potential for reactingthrust existed.
• Engine-bleed air duet: The design has built-in flex
elbows that accommodate engine pitch and yawmovements. How the design would handle forward
engine movement caused by the pin and mount
flexibility was not obvious from visual inspection.Forward engine movement could have affected theoutboard mount-thrust measurement.
17
American Institute of Aeronautics and Astronautics

None of the above Issues alone created major concern,
but their combined effect could have some potential for
robbing thrust from the main mounts. All other system
connections (hydraulic, fuel, and electrical) were not a
concern because of built-in flexibility.
Correlating the strain gage-derived thrust to the
measured readings obtained using the thrust stand and
output from two analytical thrust models (discussed in
the following section) had very encouraging results.
Figure 16 shows this comparison, which plots the
percent error, relative to the thrust stand, as a function of
throttle setting. Data are shown for the baseline
equations and a modified result using corrections from
the "cold loads" test. Both sets of data use the baseline
thermal corrections. The strain-gage data incorporated
standard tare corrections, which forced the thrust
calculation to read 0 lbf prior to engine start. Relative to
a _+2-percent error band (a targeted goal), the postflight
model is outstanding over the entire power range. The
onboard model and the modified strain-gage results skirt
the _2-percent band. except at idle power where the
thrust is extremely low. To compare well, the thermal
corrections had to be reasonable. The secondary load
paths caused by the system interfaces appeared to be
minimal, which verifies initial assumptions.
Flight Data Extraction of Mount Thrust
The mount strain gages respond to the net structural
loads, which represent a summation of the applied
forces: thrust, vector, inertia, and gyroscopic loads, and
any external airloads. If these latter forces can be
accurately computed and subtracted from the
measurements, the thrust, pitch, and yaw vector forces
can be determined from the statically determinate
reaction equations. Fortunately for the mount-thrust
calculation, the only inertia force is that caused by
longitudinal acceleration. This term can be a significant
but simple correction for large accelerations. A fair
amount of effort has gone mto careful engine
weight-and-balance checks to establish confidence in the
inertia properties. The longitudinal inertial load is the
only force term accounted for in the baseline data
processing before the mount thrust is converted to gross
thrust (described in the next section).
The baseline strain-gage flight data processing is
straightforward and consists of the following steps:
1. Correct the raw bridge outputs for variation in
excitation voltage.
2. Correct bridge outputs for thermal error.
Percent errorrelative to
thrust stand
6
5
4
3
2
1
0
-1
-2
-3
-4
MililaryTpoweri _ t i i i t
i i = i ,
t t i i
i i i i
t i t
..... I .... L .... I.....' I
t I
i..... i_ ___
i i i i t
i t i t i
i t t t.... i .... "7 -- -- r- .... i....
i i
.... t- - -i ....
i i
i t i t L t Ii t J i i i i
t i I t t , i I
I t t I t I i I.... I .... _ .... r .... _- .... i .... "r .... r- .... i ....
t i t i i t i t
t t i _ i i i i
t t I _ E i t ii i i i t i
40 50 60 70 80 90 100 110 120 130
Throttle position, deg 980319
Figure 16. Thrust accuracy from "hot loads" test.
Maximum power
-o- Posfflight model-=-- Onboard model
Baseline strain gage--*- Modified strain gage
Modified strain-gageresults use correctionsfrom "cold loads" test
18
American Institute of Aeronautics and Astronautics

3. Process corrected outputs through the load
calibration equations.
4. Subtract inertia forces from the pin thrust loads.
5. Sum the outboard and inboard pin loads.
6. Apply pre-engine start tare corrections.
The strain-gage data are measured at 100 samples/sec,
but unfortunately for the thrust calculation, the
signal conditioning is ranged to read beyond normal
flight operating limits in both the forward and aft
directions. This range, required for structural loads
monitoring, produces much less than optimum
resolution for the mount-thrust measurement. Using a
10-bit instrumentation system, current data resolution
for the prime thrust bridges is 58 lbf/count. For a system
optimized for positive thrust measurement, the dataresolution is estimated to be as low as 15 lbf/count.
Ambient system noise prior to engine start is
approximately 1 count. Combined with accelerometer
noise feeding the inertia calculation, the mount-thrust
data, even with the excessive ranging, has a relatively
low root-mean-square noise band (less than _+100 lbf).
In-Flight Thrust Analysis
The strain-gage sensors installed on the engine mounts
measure the engine force applied directly to the airframe(the mount thrust) and, therefore, measure a load that is
more similar to net thrust than to gross thrust.
Unfortunately, because of the manner in which
propulsive forces are accounted for, net thrust, as it is
defined, does not always resemble the applied force at
the engine mounts, particularly at high speeds. To derive
either net thrust or gross thrust from the direct thrust
measurement, considering and accounting for all
significant forces acting upon the engine directly and
summing these forces as required with the direct value
therefore becomes necessary. Figure 17 shows the
typical array of forces acting upon an installed engine, asin the F-15 ACTIVE vehicle.
Assumptions
With the goal of this exercise being to compute gross
thrust, several assumptions would obviously be requiredregarding the forces shown in figure 17, because manyforces are immeasurable or were not instrumented for
the ACTIVE program. For example, connector drag andaircraft interface rub are both unknown; however, steps
were taken to minimize their effect so that they could be
assumed equal to 0 lbf. In particular, connector drag was
minimized by providing freedom of movement in the
cabling and plumbing linking the airframe with the
motor. The ACTIVE F-15 aircraft has a unique cinch
strap system, used to tighten the aircraft titanium sealingflaps against the aft static structure of the nozzle. This
system is believed to provide a balanced distribution
between bay and ambient pressure which simplifies the
gross thrust calculation as discussed later in this section.
No simple steps could be taken to ensure the
elimination of inlet-seal reaction, but the seal designshould accommodate a minimum of 0.25 in. of
longitudinal deformation and thermal expansion of the
? :
Engine-facepressure drag,Ffacepressure
reaction
Engine-mount
Connector reaction,drag Fmount
Engine-bodypressure force
Nozzledrag
_._____. Grossthrust,
I1*'"- Fgross
Engine-faceram drag,Fram
Engine-bodypressure force
Aircraft .interface Engine-body \
rub pressure force, XFbody pressure -_
980320
Figure 17. Forces acting upon an installed engine.
19
American Institute of Aeronautics and Astronautics
engine. With no other recourse, inlet-seal reaction was
therefore assumed equal to 0 lbf. As will be discussed,some evidence exists that indicates very high
gross-thrust conditions may cause nonnegligible
inlet-seal reaction, but only in a small portion of the
flight envelope at maximum (full augmentation) power.
Nozzle drag is essentially an immeasurable force that
is normally computed, as in the case of the F-15 airplane,
using the airframe manufacturer's aircraft-engineinstallation effects model. The installation effects model
also computes such variables as engine-bleed air and
horsepower extraction. However, the model presents a
large computational burden itself, and its use was not
consistent with the goal of a reduced-complexity thrust
calculation method using as input only measured data ordata computed in real time onboard the aircraft.
Conveniently, nozzle drag is a negligible factor
throughout much of the flight envelope at augmented
power. However, with the smaller nozzle configurations
at military (maximum nonaugmented) power and tess,
nozzle drag rises dramatically as speed approaches
Mach 1. But gross thrust also rises rapidly as speed
increases, so the effect on thrust of neglecting nozzle
drag is minimized in percent terms. With this effect in
mind, nozzle drag is assumed equal to 0 lbf for this
analysis. The effects of this assumption will be discussedin detail in the "Results and Discussion" section.
Gross-Thrust Calculation
The remainder of the force terms are nonnegligible;
however, these terms can all be computed from theinformation available from the F-15 ACTIVE
instrumentation data stream. As a result, gross thrust can
now be calculated based upon the strain gage-based
axial-force measurement at the engine mounts.
Summarizing the force terms shown in figure 17 and
ignoring those terms assumed to equal zero in the above
section, the following equation results:
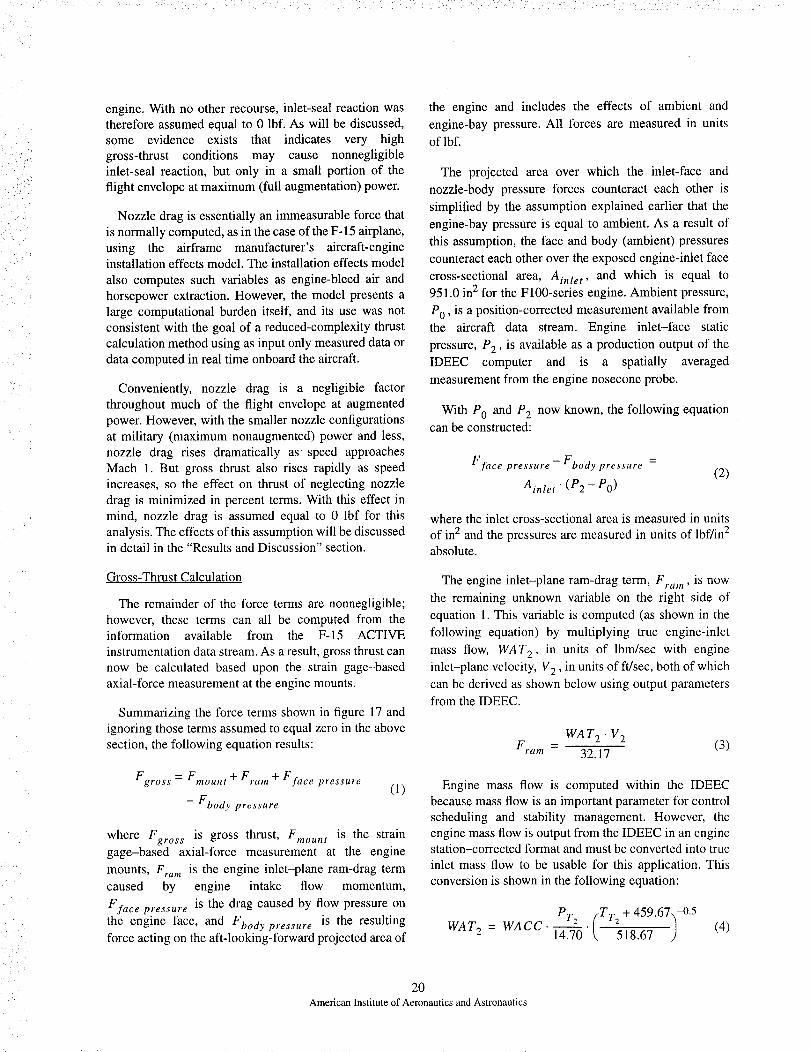
Fgross = Fmount + Fram + F face pressure
- Fbody pressure
(1)
where Fgross is gross thrust, Fmoun t is the straingage-based axial-force measurement at the engine
mounts, Fra m is the engine inlet-plane ram-drag term
caused by engine intake flow momentum,
F face pressure is the drag caused by flow pressure on
the engine face, and Fbody pressure is the resultingforce acting on the aft-looking-forward projected area of
the engine and includes the effects of ambient and
engine-bay pressure. All forces are measured in units
of lbf.
The projected area over which the inlet-face and
nozzle-body pressure forces counteract each other is
simplified by the assumption explained earlier that the
engine-bay pressure is equal to ambient. As a result of
this assumption, the face and body (ambient) pressures
counteract each other over the exposed engine-inlet face
cross-sectional area, Ainle t, and which is equal to951.0 in2 for the F100-series engine. Ambient pressure,
P0' is a position-corrected measurement available fromthe aircraft data stream. Engine inlet-face static
pressure, P2, is available as a production output of the
IDEEC computer and is a spatially averaged
measurement from the engine nosecone probe.
With P0 and P2 now known, the following equationcan be constructed:
F face pressure - Fbody pressure =
Ainlet" (P2- P0)
(2)
where the inlet cross-sectional area is measured in units
of in2 and the pressures are measured in units of lbf/in 2absolute.
The engine inlet-plane ram-drag term, Fram, is now
the remaining unknown variable on the right side of
equation 1. This variable is computed (as shown in the
following equation) by multiplying true engine-inlet
mass flow, WAT 2, in units of lbm/sec with engine
inlet-plane velocity, V 2 , in units of ft/sec, both of which
can be derived as shown below using output parametersfrom the IDEEC.
WAT 2 • V 2Fram - 32.17 (3)
Engine mass flow is computed within the IDEEC
because mass flow is an important parameter for control
scheduling and stability management. However, the
engine mass flow is output from the IDEEC in an enginestation-corrected format and must be converted into true
inlet mass flow to be usable for this application. This
conversion is shown in the following equation:
WAT 2 = WACC. PTz ( TT2 + 459.67-)-0.514.7-'-'-O'k, 5]-8_-_ J (4)
2OAmerican Institute of Aeronautics and Astronautics

where WACC is the IDEEC-estimated corrected mass
flow measured in lbm/sec, PT2 is the IDEEC estimateof engine-inlet total pressure measured in lbf/in 2
absolute, and TT2 is the measured engine-inlet totaltemperature, also available from the IDEEC, measured
in °E
Finally, V 2 is computed according to standard gas
dynamic relationships as shown in the following twoequations. First,
V 2 = Vsoni c • M 2 (5)
where Vsonic is the sonic velocity in ft/sec at the engine
inlet, and M 2 is the Mach number of the incoming flow.
By expanding these terms and using the appropriate gas
constant and specific heat rauo for air, the following
equation can be derived:
[ ((PT21-0286 IV2 = 412014"(TT2+459.67)" 1-t-_-2) ) (6)
Postflight Aerothermodynamic Thrust Model
The postflight model 8 is a high-fidelity
aerothermodynamic simulation of the F100-PW-229
engine and is designed for customer use. A combination
of engine performance modeling, engine component
ground test data, and measured engine and aircraft flight
data permit the model to accurately calculate thrust
calculation using the mass flow-temperature
method.9, 10 The use of measured engine parameters
allows the model to partially compensate for engine-to-
engine performance variations. Measured values of
free-stream altitude and Mach number, fan speed, fan
guide-vane angle, turbine discharge total pressure, core
and afterburner fuel flows. PT2 , and TT2 were used asinputs to the model for this analysis. Free-stream altitude
and Mach number were obtained from the flight
controller, and the remainder of the parameters were
obtained from the IDEEC. On some missions,
high-accuracy, flight test, volumetric fuel flow meters
were available and used in place of the IDEEC values.
where the engine-inlet plane velocity is now completelyexpressed in previously defined terms. Note that when
equauon 6 and equation 4 are used in equation 3, the
TT2 terms cancel.
All terms in equation 1 are now known, and gross
thrust based upon the direct measurement at the engine
mounts can be computed. Note that net thrust can easily
be derived from the gross-thrust value by subtractingaircraft inlet-plane ram drag from equation 1. Aircraft
inlet-plane ram drag is computed by multiplying trueengine mass flow by the velocity of the aircraft.
Computing the engine inlet-plane ram-drag and
pressure-force terms is not a complex matter provided
that the required input parameters are readily available
on the aircraft data stream, as in this case. Using the
production data stream of a digital engine controller cantherefore prevent the costly requirement to Instrument
the engine face in order to measure the temperatures and
pressures necessary to calculate these force terms.
Benchmark Analytical Model Descriptions
Two analytically-based models supplied by Pratt &
Whitney were used to compute gross thrust in order to
serve as benchmarks for the strain gage-based direct
thrust-measurement technique. These models were thepostflight aerothermodynamic thrust model and theonboard nozzle controller thrust model.
An F-15 installation effects subroutine, developed by
The Boeing Company (formerly McDonnell Douglas
Aerospace), is used to account for airframe detriments to
engine thrust performance, including horsepower and
bleed air extraction. The combined engine-thrust and
installation-effects modeling process is very
computationally intensive and can require several hours
on a dedicated computer workstauon to process a single
mission. The uncertainty band tl for calculated gross
thrust from this model is estimated to range from 2 to
4 percent, depending on flight condition and power
setting.
Onboard Nozzle Controller Thrust Model
A gross-thrust model residing within the nozzle
controller onboard the F-15 ACTIVE aircraft is used to
prevent the production of unsafe vector forces by the
nozzle. This model was derived from the postflight
model described in the above section and also uses
measured data as input. However, this model uses
simplified routines to speed the execution of the code,
permitting its use in the real-time application but also
increasing the uncertainty of the calculation.
The area-pressure thrust calculation method is used by
the onboard model, which reduces the number of inputparameters required to compute gross thrust. Nozzle
21
American Institute of Aeronautics and Astronautics

throatareaandturbine-dischargetotalpressure,bothderivedfromtheIDEEC,areusedasinput,alongwithP0 from the flight controller. The reduced number ofinput parameters further increases the gross-thrust
uncertainty relative to the postflight model because the
area-pressure thrust calculation method tends to be more
sensitive to input measurement error than the mass
flow-temperature method.
The uncertainty band for this model is greater than for
the postflight model; and the error increment grows as
the engine departs from an average health state because
the onboard model has less ability than the postflight
model to accommodate off-nominal engine operation.
Because of the critical role the onboard model plays in
limiting the magnitude of the nozzle-vectoring forces in
real time, an important objective of the ACTIVE
program has been to validate the onboard gross-thrust
model against the postflight model.
Analysis Constraints and Scope
For the purposes of this analysis, direct
thrust-measurement data were processed only for
quasi-steady-state aircraft and engine operation. The
objective in doing so was to minimize the uncertainty in
comparing the direct thrust-measurement technique
against the reference models, which were designed for
quasi-steady-state engine operation only. And although
the strain-gage signal conditioning process has been
designed to accommodate aircraft maneuvering andnozzle-vector forces, the effects of these forces on the
engine-mount axial-force readings are still being
quantified throughout the flight envelope and are not yet
fully understood, as discussed previously.
As a result, the data were filtered to eliminate any timecuts with normal aircraft acceleration greater than 2 g
and less than 0 g, lateral acceleration greater than 0.1 g,
aircraft pitch rate greater than 2.5 deg/sec, yaw rate
greater than 2 deg/sec, roll rate greater than 6 deg/sec,
pitch angle greater than 10°, roll angle greater than 20 °,
and climb rate greater than 50 ft/sec. The data were also
filtered for 6 sec following any rapid throttle position
change of more than 5° . All thrust data collected during
nozzle vectoring or off-nominal exit area scheduling
were also excluded by filtering.
This analysis focused on two throttle settings, military
and maximum power, primarily because of the large
quantity of data available at these two power settings
throughout the ACTIVE flight envelope and because thereference models are considered most accurate at
military and maximum power. Thirteen missions, spaced
over an eight-month period in 1996, were selected
because those missions most fully covered the flight
envelope and offered a wealth of stabilized engine data
from low to high Mach number. These missions were
analyzed in their entirety, and their data were filtered
according to the above constraints. The result was a data
base of 3822 time cuts at military power and 1420 time
cuts at maximum power.
Differences were computed between the direct
thrust-measurement method values and the output fromthe reference models for each time cut of data. The data
from all flights were combined for each power settingand then sorted based on Mach number and altitude into
blocks, each spanning 5000 ft and 0.1 Mach. The data
for each parameter within each block were then
averaged. At military power, 52 Mach-altitude blocks
resulted; at maximum power, 58 blocks resulted. The
large spread of the data throughout the flight envelope
can be seen on the Mach-altitude cross plots in the"Results and Discussion" section. Scale references have
been removed on absolute data to protect the proprietarynature of the information.
Results and Discussion
Figure 18 shows the percent difference between
military-power gross thrust computed using the direct
thrust-measurement technique and gross thrust
computed by the postflight model. The difference is
plotted as a function of Mach number for a
representative range of altitudes: 10,000 ft, 20,000 ft,
30,000 ft, and 45,000 ft. The percent differences range
from approximately 1 to 12 percent, depending on flight
condition. At a given altitude, the difference tends to
decrease as subsonic speed increases. This trend reverses
prior to Mach 1.0, with the difference peaking near
Mach 1.0 and then decreasing again as the speed
increases. The average percent difference for all
military-power points is 4.2 percent.
Figure 19 shows a similar arrangement of data as
shown in figure 18, except that the power setting is now
at maximum. In this case, percent differences range
between approximately 2 and 13 percent. The local peak
in the percent differences seen in the vicinity of Mach 1
at military power is less clear at maximum power;
however, a strongly decreasing trend is evident at an
altitude of 45,000 ft to a maximum speed of Mach 2.0.
At an altitude of 30,000 ft, the percent difference is
relatively stable as speed increases to a maximum of
Mach 1.7, beyond which the difference abruptly risesand continues to do so until Mach 2.0 is reached. The
average percent difference for all maximum-power
points is 3.8 percent.
22American Institute of Aeronautics and Astronautics

14 ....... AltitudeI i I _ I I i
....... --i-- 10 000 ftI I I I I i I l
I I I I I I I
12 ....... "O" 20,000 ft.......... 7..... _......_ .......... '...... :...... r ..... , ............ _ 3o,oooft
I : _ i i I i i, "-_.. 45,000 ft
, , • ' _'_\_ ' ,i I _ I . i I I
I I I I i i i i
10 ..... _ ..... _ ..... _----l--, ........ ,...... r ..... , ..... _ ......, _ , t , .,\ , , , ,
, ,\\ ' .,.. i' \ ....I I i " I I " I I L I
i I I _ I I I I I II I _ i i I I i I i
8 ..... .k ..... -i ..... _- ..4 .... _-i .... ,-i----=. -}-- ..... i- ..... 4- ..... 4 ......I I _ I * J _ i .I 1 I I, , - , , \ , , ,Difference, , , \ ' /' / .... ._I I '_ I -i : .k _l i I I
percent , , _ , :, _j.p__,_ , .. , , ,6 ..... " .......... -_" ..... _- - _R--_--x ---= ..................
.....Average , , \.u .,'_ / ;r , ', _ _ , ,......... .--__,_-'_"r'h- "f" "_- _ "="'_.m "_'- "
4 ..... r - -"l- - ; - -_- - ',-. .... ,-F-Y-, ...... ,...... _:.._._- - z .... T ......, \ , _. ,." , I\1 ' , r ._ , ,' _ ' "_ IV '. ' ' " ' '
," 7:---,,......",...... ,"2 ..... r ..... 7 ............i , " i," : _ : \,i
i i _ t i i
0 .2 .4 .6 .8 1.0 1.2 1.4 1.6 1.8 2.0
Mach number980321
Figure 18. Percent difference in gross thrust between direct thrust-measurement technique and postflight model as afunction of flight condition military power.
14 .... Altitudei I I i
i i i i
, i _ i i ---_ 10,000 ft
12 _ _. , , ..0.. 20,000 ft.......... "1- --r-.... --IV--- 30,000 ft
, , _ , ,i I i i i '_'" 45, 000 fti I '11. i i i
= i i. i i i
i i i
= _ i '. i i i i
i L iI _\ t i i i8 ...... 4- .......... -_ ........... I ...... I...... _- .......... -+ .....
i L I • I i _ i
Difference, : : : '_ : : : :percent ' ' ' _ ' ' ' '
..... ', .......... ,;,_..... ',_____',...... ',...... - .......... • .... _/5 , 'r',,, , \, , , ,
:" • ,, ._ ',i , "t , ,,"._ , , ,/Average ' \ O /' \'_ ' '
.... i-_ =L...i "_ Y",,,,----_ , ]r, , , . , pr T \ ; iv. , _.._ ,.... • , I , \,.. , ._"_7 t. --, c,,_..IL__ ,d____;_ i" , , ,,_./_v"-'_2 ...... c ..... 7 - --- .....-,,,-,-,_ ,/i ........... r- ..... r ..... _--i .........', ', :--'i ', ', ',I I i I I _ i
i i i i i i i
0 .2 .4 .6 .8 1.0 1.2 1.4 1.6 1.8 2.0
Mach number980322
Figure 19. Percent difference in gross thrust between direct thrust-measurement technique and postflight model as afunction of flight condition; maximum power.
23American Institute of Aeronautics and Astronautics
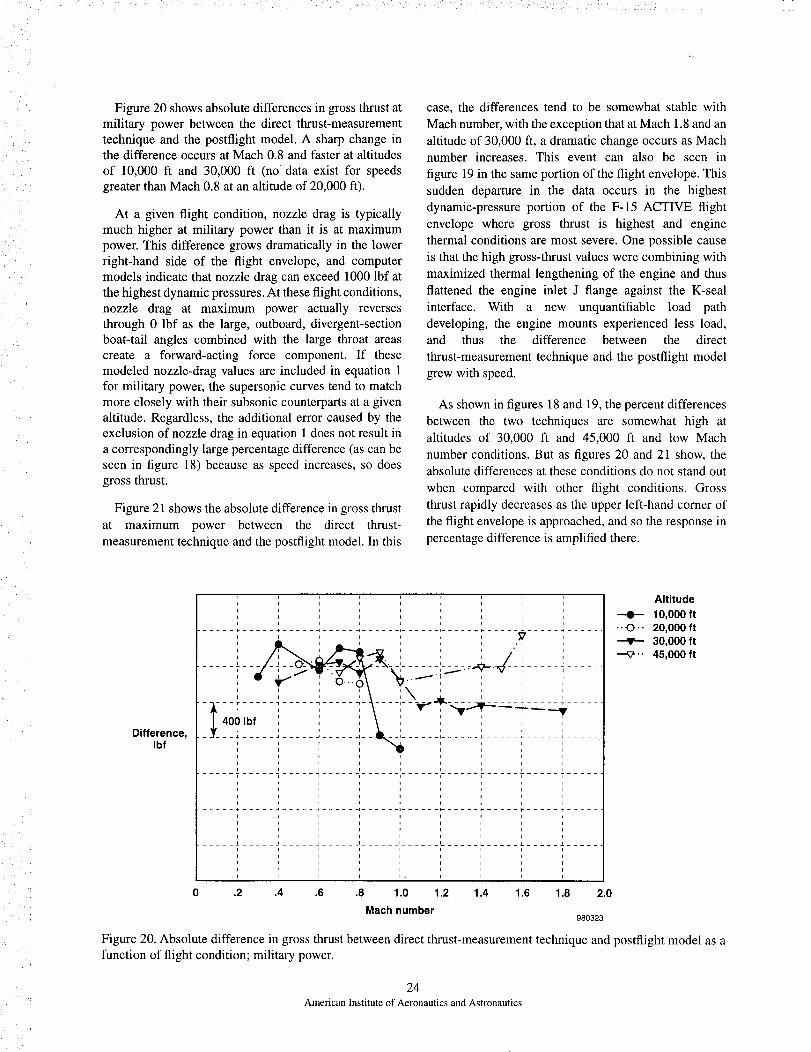
,!
Figure 20 shows absolute differences in gross thrust atmilitary power between the direct thrust-measurement
technique and the postflight model. A sharp change inthe difference occurs at Mach 0.8 and faster at altitudes
of 10,000 ft and 30,000 ft (no data exist for speeds
greater than Mach 0.8 at an altitude of 20,000 ft).
At a given flight condition, nozzle drag is typically
much higher at military power than it is at maximum
power. This difference grows dramatically in the lower
right-hand side of the flight envelope, and computer
models indicate that nozzle drag can exceed 1000 lbf atthe highest dynamic pressures. At these flight conditions,
nozzle drag at maximum power actually reverses
through 0 lbf as the large, outboard, divergent-section
boat-tail angles combined with the large throat areascreate a forward-acting force component. If these
modeled nozzle-drag values are included in equation 1
for military power, the supersonic curves tend to match
more closely with their subsonic counterparts at a given
altitude. Regardless, the additional error caused by theexclusion of nozzle drag in equation 1 does not result in
a correspondingly large percentage difference (as can be
seen in figure 18) because as speed increases, so does
gross thrust.
Figure 21 shows the absolute difference in gross thrust
at maximum power between the direct thrust-
measurement technique and the postflight model. In this
case, the differences tend to be somewhat stable with
Mach number, with the exception that at Mach 1.8 and an
altitude of 30,000 ft, a dramatic change occurs as Machnumber increases. This event can also be seen in
figure 19 in the same portion of the flight envelope. This
sudden departure in the data occurs in the highest
dynamic-pressure portion of the F-15 ACTIVE flight
envelope where gross thrust is highest and engine
thermal conditions are most severe. One possible cause
is that the high gross-thrust values were combining with
maximized thermal lengthening of the engine and thus
flattened the engine inlet J flange against the K-seal
interface. With a new unquantifiable load path
developing, the engine mounts experienced less load,and thus the difference between the direct
thrust-measurement technique and the postftight model
grew with speed.
As shown in figures 18 and 19, the percent differences
between the two techniques are somewhat high at
altitudes of 30,000 ft and 45,000 ft and low Mach
number conditions. But as figures 20 and 21 show, theabsolute differences at these conditions do not stand out
when compared with other fight conditions. Gross
thrust rapidly decreases as the upper left-hand corner of
the flight envelope is approached, and so the response in
percentage difference is amplified there.
........ Altitude, , i i , I , i
........ _ 10 000 ftI t i i i t I i _ ,
........ It•'0" 20 000', ' ', ', i i ', . ¢ ', --qP-- 30,000 ft
'-: __-_-'_ :' ': _: Z'. -': --_-- 45,000ft...... .... ...... ..... ____. - ...... ......
,¢ _.-,-----v ,i I i i i _ i i i ii ..... !..... T\.... : .... ..... :..... ......
Difference, __, ..... _ ..... _ ......... , ...... ,...... _ ..... = ..... _ ......
,b, : '---i..... i ....... : : : :i J i i i i i i
I i i ii i i i
...... T ..... _ ..... 5 ............ i ...... i...... 7 ..... 7 ..... _ ......
i , i i i i i i
I l i i , i i i
i , i i i i i ,
I I I i I I
t i I i i L
I I I i i ¢
l II i I i
...... £ ..... 2 ..... J ........................ L ..... L ..... 2 .....I I I i I I
I I I I I I
, i i i i i
I i i i I I
I i i i i I
0 .2 .4 .6 .8 1.0 1.2 1.4 1.6 1.8 2.0
Mach number980323
Figure 20. Absolute difference in gross thrust between direct thrust-measurement technique and postflight model as a
function of flight condition; military power.
24American Institute of Aeronautics and Astronautics

: : ; [ : : " 1 Altitude: : : i ', : : ---0-- 10,000 ft
............ • __O._.q_..... __ ..... i...... :___z.__'_..... " ..... _'..... ..O.. 20,000 ft', i;.-=_--_. --¢.._i_ "_---_ J _ zo,ooaff
, , T '.,l)"-I\l \ , , , v---Y'''_..._7--.V.-..-" _, , _-- ,y" _ , / ,\ , , , --_'" 45,000ft, , • '. i.'_ _, , / , "_ , , _ ,; ........... 3- - _'-p_.V-V - "_-,-- "It .... _- -- [-..... .._i- --_ .....
: "-v \:
...... ..... :..... i ....................... i ..... :.... \i .....14°: ' ,' , , ," *rDifference ............ : .........................................
Ibf ,.... i , :\i l i i
lJ i i p
...... i ..... 7 ..................................... _- _- --i , i
i ii i
_\
I
,. ; ',t
0 .2 .4 .6 .8 1.0 1.2 1.4 1.6 1.8 2.0
Mach number980324
Figure 21. Absolute difference in gross thrust between direct thrust-measurement technique and postflight model as afunction of fight condition; maximum power.
Bubble plots are displayed on a Mach-altitude cross
plot in figures 22 and 23 for the percent differences at
military and maximum power, respectively, and in
figures 24 and 25 for the absolute differences at military
and maximum power, respectively. An outline of the
flight envelope of the F-15 ACTIVE aircraft is also
shown on each figure for reference. Whereas figures 18to 21 show data trends at selected altitudes for the sake
of clarity, figures 22 to 25 show all of the Mach-altitude
averaged data and qualitatively show the trends in the
data on the full flight envelope.
The size of each bubble is directly proportional to its
value, and this proportionality is maintained from plot to
plot. Of particular note are the high percentage
differences seen in the upper left-hand corner of the
flight envelope and the large absolute differences seen
along the lower right-hand edge of the envelope, both
previously discussed. Note the very small differences,
both absolute and percent at each power setting, for the
takeoff roll near sea level; some of the data point bubbles
cannot be seen on the plots because the bubbles are
smaller than the width of the flight envelope boundary.
Figure 26 shows gross thrust as a function of Mach
number at an altitude of approximately 30,000 ft for a
maximum-power acceleration from Mach 0.75 to
Mach 1.95 and the subsequent deceleration at military
power. Gross thrust is shown for the direct
thrust-measurement technique, the postflight model, and
the onboard model. At speeds less than Mach 1.3 during
deceleration, the engine is closer to idle power than it is
to military power. This particular example illustrates the
largest absolute difference seen in the data base between
the direct measurement technique and the postflight
model, which occurred at maximum power, a speed of
Mach 1.95, and an altitude of 32,000 ft. This difference
is possibly the result of inlet-seal reaction as discussed
earlier. Despite this difference, the figure shows very
good agreement between the direct thrust-measurement
technique and the two models, especially considering the
data span an enormous range of aircraft and engine
operating conditions.
Note that the direct thrust-measurement technique
shows very close agreement with the onboard model
during the acceleration to a maximum speed of
approximately Mach 1.6. In fact, as a general rule
throughout the flight envelope, the onboard model
tended to agree more closely with the direct
thrust-measurement technique than with the postflight
model. The average percent difference between the
direct thrust-measurement technique and the onboard
model was 2.2 percent for all military-power points and
1.2 percent for all maximum-power points.
25American Institute of Aeronautics and Astronautics

50,000
45,000
40,000
35,000
30,000
Altitude,ft 25,000
20,000
15,000
10,000
5,000
t
.... O_.__o_ O .......... _ .......... : .....n u
n
..... 0 .... O----- _--o--- .................. '- ....
0 .2 .4 .6 .8 1.0 1.2 1.4 1.6 1.8 2.0
Mach number980325
Figure 22 Relative change in percent difference in gross thrust between direct thrust-measurement technique andpostflight model as a function of flight condition; military power,
50,000
®®I
45,000 ..... • ........... ,,..... o--e-.e--e .......................
40,000 ..... _-- ............-/-'- e .... O--O ,- • - _ .... ÷- ,- -_- ...........
/ ,oouuu"%"""- ' '............................... _ .........................
'____30,000 -- • ..... _ ..... _--o--o ..... e--o ........ -*- ........... •
i i i n E
Altitude, " ...... i i t i i
,, 25,000-- .' -'....... ._..... !..... +..... .t,/---;----t i t t _ i t i
20,000-- -_..... - ,; .......... v ..... 1 ..... n ...... F ..... "r .....
t t t t [
t r i _ i i c i
_ _1 ...... i...... L ........... i ...... L ..... I ....15,000 - " ..... _,.....l t t l i i t t
l t b t I * t
10,000 - - - - • - - ;
, ?5,000 - - • .............................. _ ..........................o i t _ I
I I
1 L I I I I
0 .2 .4 .6 .8 1.0 1.2 1.4 1.6 1.8 2.0
Mach number980326
Figure 23. Relative change in percent difference in gross thrust between direct thrust-measurement technique andpostflight model as a function of flight condition; maximum power.
26
American Institute of Aeronautics and Astronautics
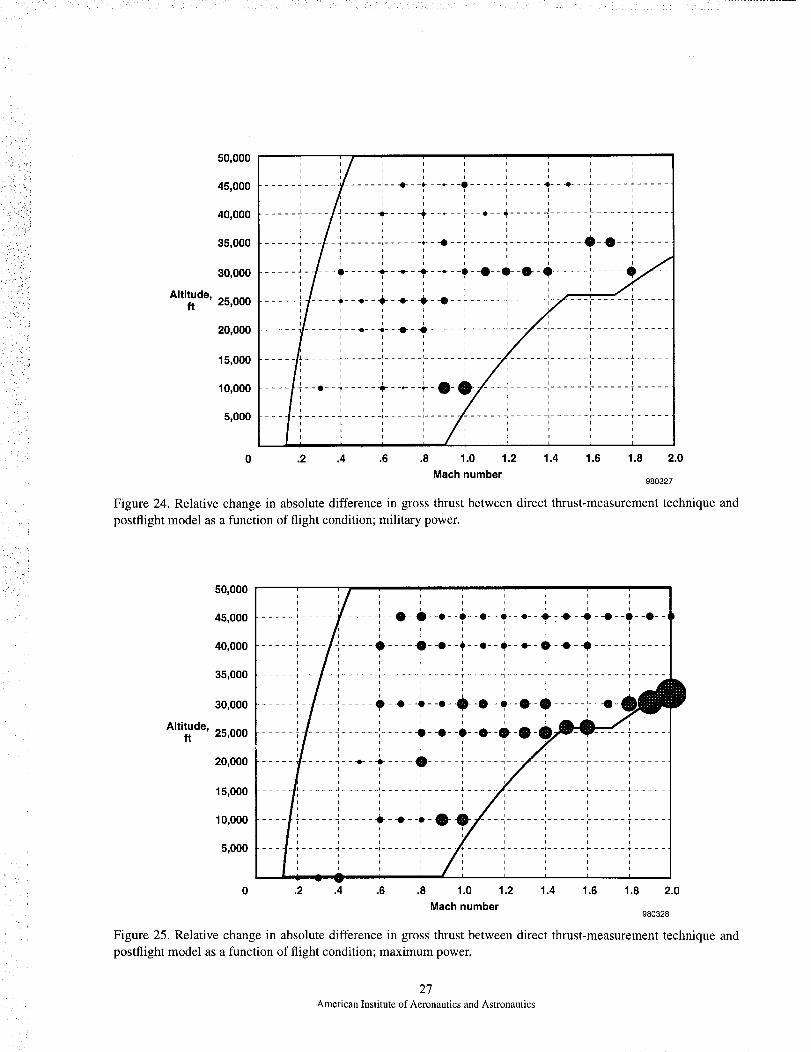
50,000
45,000
40,000
35,000
30,000
Altitude,ft 25,000
20,000
15,000
10,000
5,0OO
I I I i I I I
I I I I I I I
I I / i i i i
t I t t t
t J t i t
t t t I
I t _ t i
.... ...... .............0 ° T-- 1 ...... i ...... _ - _ - - r ..... 1 I
I i i i i i
l i i
L i
t i
i i , i
' i,- o ,+ '..... ap- -O..........I t
I t
i t-'O--r ..... -,---
i i
i i
i i
..... r- ..... "1--
i
I
I
..... L-
I
i
I
--q .....
i
i
i
I
l
I
, OI I
i I
I i
--I ...... T .....
I I
i i
i i i
-i ...... i- ..... i- .....
i I t
I i i
_t ...... t_ ..... /. .....
I i I
i t ,
I Ii
-i ...... F ..... r .....
i i i
i i i
I I l
-t ...... l- ..... ,r .....
i o i
0 .2 .4 .6 .8 1.0 1.2 1.4 1.6 1.8 2.0
Mach number980327
Figure 24, Relative change in absolute difference in gross thrust between direct thrust-measurement technique and
postflight model as a function of flight condition; military power.
50,000
45,000
40,000
35,000
30,000
Altitude,25,000
20,000
15,000
10,000
5,000
i i i i i i i i i
i t i i i i , i i
, , , , +_ + +............., O- --e--o--o--+----- , -o--. , --o .... o-
i i i I
I i i +
.............. O - -o- -O- -e -O -0n n n
n
L i i
i E i t i
t t i i i
..... j ...... ,...... i...... .L ..... i......
i i t i i
I I t i t i
' ' ,+o'®- ' '' ,_ '..... _ ...... -O-- -
t
i , i
l in
.... _ ...... I...... i- - -
l e n
n I
n l
0 .2 .4 .6 .8 1.0 1.2 1.4 1.6 1.8 2.0
Mach number980328
Figure 25 Relative change in absolute difference in gross thrust between direct thrust-measurement technique andpostflight model as a function of flight condition; maximum power.
27American Institute of Aeronautics and Astronautics
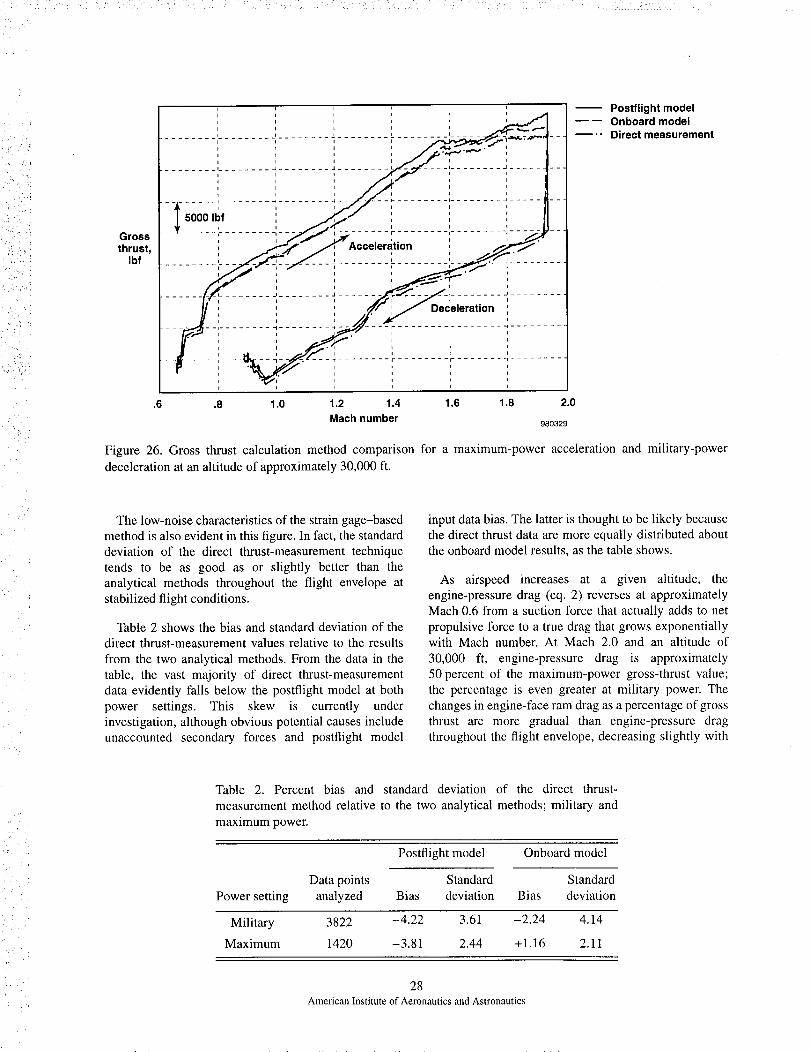
Gross
thrust,Ibf
, i
i ,___................... , ........ _ ........ F .......... = - -
I I I I i
i I t l
..................................t ooo,b, i :i................: i:..... I--
......... i ......... i ...... I ........ r ........ i ........ "l ......., , _j1- .. , , _., ....J/ 1 l l •• , ._f7
1 t I L , __......... .....t _ t , • I,.I,. "_ : ; : _"_- i
o I I • I I...... /'_: ....... _........• I I ¢ t 1 1
t t i t t i
i L • i t i t
t _ l t , ¢....... i........, _(-'._ : ,, ,,', "'_', ! I ',
.6 .8 1.0 1.2 1.4 1.6 1.8 2.0
Mach number980329
Postflight model
m-- Onboard model
Direct measurement
Figure 26. Gross thrust calculation method comparison for a maximum-power acceleration and military-power
deceleration at an altitude of approximately 30,000 ft.
The low-noise characteristics of the strain gage-based
method is also evident in this figure. In fact, the standard
deviation of the direct thrust-measurement technique
tends to be as good as or slightly better than the
analytical methods throughout the flight envelope at
stabilized flight conditions.
Table 2 shows the bias and standard deviation of the
direct thrust-measurement values relative to the results
from the two analytical methods. From the data in the
table, the vast majority of direct thrust-measurement
data evidently falls below the postflight model at both
power settings. This skew is currently underinvestigation, although obvious potential causes include
unaccounted secondary forces and postflight model
mput data bias. The latter is thought to be likely because
the direct thrust data are more equally distributed aboutthe onboard model results, as the table shows.
As airspeed increases at a given altitude, the
engine-pressure drag (eq. 2) reverses at approximately
Mach 0.6 from a suction force that actually adds to net
propulsive force to a true drag that grows exponentiallywith Mach number. At Mach 2.0 and an altitude of
30,000 ft, engine-pressure drag is approximately
50 percent of the maximum-power gross-thrust value;
the percentage is even greater at military power, The
changes in engine-face ram drag as a percentage of grossthrust are more gradual than engine-pressure drag
throughout the flight envelope, decreasing slightly with
Table 2. Percent bias and standard deviation of the direct thrust-
measurement method relative to the two analytical methods; military and
maximum power.
Postflight model Onboard model
Data points Standard Standard
Power setting analyzed Bias deviation Bias deviation
Military 3822 -4.22 3.61 -2.24 4.14
Maximum 1420 -3.81 2.44 +1.16 2.11
28
American Institute of Aeronautics and Astronautics

k _x<_:!ii :} ?/ ? 3 _ : i:} i ¸ _ : : : i
i},
Mach number, but nonetheless averaging approximately
30 percent of the gross-thrust value for military power
and 14 percent at maximum power.
These results qualitatively imply that gross-thrust
values as calculated by the direct thrust-measurement
technique in equation 1 would be sensitive to significant
error in the ram-drag and pressure terms, particularly athigh speeds. Care should be taken in accounting forthese forces.
Concluding Remarks
Gross thrust was successfully computed using a strain
gage-based direct thrust-measurement technique
applied to the NASA F-15 Advanced Control
Technology for Integrated Vehicles (ACTIVE) aircraft
powered by two F100-PW-229 engines. Results were
obtained at quasi-steady-state conditions throughout the
flight envelope of the vehicle using data collected during
13 missions spanning an eight-month period. More than
5200 time cuts of data were processed to produce the
results in this report, representing a Mach range from 0.0
to 2.0 and altitudes from near sea level to higher than
45,000 ft. Both military and maximum augmented
power settings were studied.
The strain-gage calibration process, described in this
paper, was developed in support of the ACTIVE
program. This process has established the feasibility of
measuring engine main-mount loads and extracting the
axial thrust at the mount. The methodology has evolved
and benefited from four distinct ground tests: shear
fixture loadings, on-aircraft hangar testing (engines not
installed), thermal tests, and combined systems testing
(engines installed and operating). Feeding results from
each step forward to understand and minimize each
source of error to the greatest extent possible has been
fundamental. The approach for instrumenting and
calibrating the pins presents certain challenges but offers
some distinct advantages and options: the pins areamenable to either on- or off-aircraft load calibration,
and the pins easily fit in an oven for thermal testing. In
addition, installing the pins in another aircraft or test
stand is an option unique to this approach.
Another important advantage is the direct interception
of the engine-force reactions. No concern exists for the
gages responding to strain induced by other forces.
Among the potential problems anticipated, none has
proven to be significantly detrimental to the
thrust-measurement process. However, the influence of
the engine-mount clamping flexibility and resulting
gapping was not anticipated and has aggravated certain
problems that would have otherwise been minor or
nonexistent. Revised calibration equations are warranted
to minimize the cross-axis errors and improve the
primary force calculations.
Gross thrust computed using the direct measurement
technique differed from results obtained using a
postflight aerothermodynamic engine model by an
average of 4.2 percent at military power and 3.8 percent
at maximum power, all data considered. When compared
against an onboard gross-thrust model within the nozzle
controller, the differences averaged 2.2 percent at
military power and 1.2 percent at maximum power.
Outside of a local peak occurring at military power at
approximately Mach 1.0, the percent difference tended
to decrease as speed increased. Percent differences were
highest in the upper left-hand comer of the flight
envelope where gross-thrust values are small and the
effect of absolute differences on percent is amplified.
Engine inlet-plane ram drag, engine inlet-plane
pressure drag, and ambient-pressure force on the nozzle
were the only secondary forces included in the process
of transforming the engine-mount strain-gage
measurements into gross thrust. These three forces were
computed in a straightforward manner using information
readily available on the digital aircraft and engine
controller data buses. In fact, the direct use of the engine
controller output eliminated the need for costly
additional flight test instrumentation.
The engine pressure term rises exponentially with
speed and can exceed 50 percent of the gross-thrust
value at Mach 2.0. The engine-face ram-drag term
accounted for an average of 30 percent of military-power
gross thrust and 14 percent at maximum power. These
large values for the percentages indicate their important
role in the accurate calculation of gross thrust using the
direct thrust-measurement technique, and care must be
taken in accounting for these forces.
Other secondary forces were assumed to equal 0 Ibf
because they could not be easily quantified and their
effects were believed to be minimal for this application.
These secondary forces included connector forces and
inlet-seal reactions. Nozzle drag, a nonzero secondary
force, was not included in the analysis, primarily
because of the large computational burden required to
calculate it. The use of a large analytical model was
thought to be inconsistent with the objective here of a
simplified approach to thrust calculation; and, in percent
terms, the exclusion of nozzle drag from the calculation
process had only a minor impact on the results.
29American Institute of Aeronautics and Astronautics
"1
• i
Y
i •¸¸
Sensor Installation and Calibration Process
Recommendations
• Application of the methodology developed here
should be evaluated on a case-by-case basis for a
particular aircraft configuration; not all
configurations would be amenable to the technique.
• A good portion of the calibration accuracy is
attributed to the gage selection and high-precisioninstallation relative to the load axes.
• Maintaining precise angular alignment of the pin
relative to the mount and the load axes will alwaysbe critical.
• For future applications, an assessment of the value
or necessity of conducting both a fixture loading
test and a "cold loads-type" test would be
advisable. If a high-fidelity calibration effort is
performed with either test, performing both tests is
probably not necessary. Either test requires custom
hardware and test setup. If an off-aircraft fixture
loading is more desirable, the setup and loading
should replicate the real aircraft as much as feasible.
• The single most beneficial improvement for any
future application on a similar configuration wouldbe to increase the stiffness of the main-mount
clamping structure. The benefits would be reduced
engine deflections and simplified calibration of the
mount adapter pins.
Considerations for the Analysis Process
• Simplifying assumptions regarding secondary force
terms must be given careful thought prior to
computing gross and net thrust using the direct
thrust-measurement technique. Ignoring these force
terms may be acceptable on one type of airframeinstallation but not on another. In the absence Of an
analytical thrust model with which to provide a
reference check, using carefully selected sensors to
flag unaccounted secondary load paths (should they
develop) may be prudent. For instance, a
longitudinal engine displacement transducer can be
used to ensure that high-speed inlet-seal bottoming
is not occurring on a buried-engine installation.
• The use of output data from the digital engine
controller, if one is available, should be capitalized
upon. Provided that high-rate dynamic-thrust
measurement or extreme accuracy are not
requirements, the use of this readily available
information can save costs by eliminating
unnecessary specialized flight test instrumentation.
• When the flight test program commences, and
depending on the program duration, periodic
in-flight tare readings of the direct thrust-
measurement technique against a reference model
may be prudent to flag a need for strain-gage sensor
recalibration. A simplified engine performance
specification model would serve well in this
capacity and need not be as sophisticated as the
postflight model described in this report.
Proposed Additional Analyses
Several additional analyses are proposed to further
document the utility of the direct thrust-measurement
technique:
• Collect additional data in those parts of the flight
envelope where data are scarce.
• Improve the accuracy of the strain-gage calibration
equations during all-axis maneuvering and thrust
vectoring.
• Analyze the sensitivity to errors in input parameters
and in the calculation and rejection of secondaryforces.
• Fully quantify the accuracy below military power,
particularly for cruise power settings.
• Investigate reducing bias error by using an
appropriate correlation parameter readily available
on the engine data bus.
• Increase the accuracy of the benchmark analytical
models by maximizing the accuracy of their inputparameters.
• Study the benefit of including a simple table lookup
for nozzle drag in order to reduce high-speed thrusterror.
• Determine if high-speed inlet-seal bottoming is an
issue on the F-15 airplane by analyzing longitudinal
engine displacement at the engine face.
• Study the accuracy stability of the engine-mount
strain gages over long periods of time.
• Document the capability and limitations for
high-response and dynamic-thrust calculation.
• Fully quantify the standard deviation and error
bands against the analytical methods.
3OAmerican Institute of Aeronautics and Astronautics

References
ISociety of Automotive Engineers, Incorporated,
Committee E-33, "In-Flight Thrust Determination,"
SAE-AIR-1703, Nov. 1985.
2Ray, Ronald J., Evaluating the Dynamic Response of
In-Flight Thrust Calculation Techniques During ThrottleTransients, NASA TM-4591, 1994.
3Groth, Harold W., Nick E. Samanich, and Philip Z.
Blumenthal, Inflight Thrust Measuring System for
Underwing Nacelles Installed on a Modified F-106
Aircraft, NASA TM-X-2356, 1971.
4Fogg, Alan, "Direct Measurement of In-Flight Thrust
for Aircraft Engines," Proceedings of the Thirteenth
Annual Symposium, Society of Flight Test Engineers,
Sept. 1982, pp. 33-41
5Smolka, James W.. et al, "F-15 ACTIVE Flight
Research Program." Fortieth Symposium Proceedings,
Society of Experimental Test Pilots, Sept. 1996,
pp. 112-145.
6Doane, P., R. Bursey, and G. Schkolnik, "F-15
ACTIVE: A Flexible Propulsion Integration Testbed,"
AIAA-94-3360, June 1994.
7McDonnell Aircraft Company, "STOL/Maneuver
Technology Demonstrator: Volume 4, Axisymmetric
Flight Test Report," WL-TR-91-3083, Sept. 1991
8United Technologies Pratt & Whitney,"F100-PW-229 Status Simulation With P/Y BBN
Vectoring Capability: User's Manual for CCD
1430-00.0," FR-20248-26, Dec. 1994.
9Burcham, Frank W., Jr., An Investigation of Two
Variations of the Gas Generator Method to Calculate the
Thrust of the Afierburning Turbofan Engines Installed in
an F-111A Airplane, NASA-TN-D-6297, 1971.
l°Conners, Timothy R., Measurement Effects on the
Calculation of In-Flight Thrust for an F404 TurbofanEngine, NASA TM-4140, 1989.
l lSociety of Automotive Engineers, Incorporated,
Committee E-33, "Uncertainty of In-Flight Thrust
Determination," SAE-AIR- 1678, Aug. 1985.
/_ iI
31
American Institute of Aeronautics and Astronautics

? i ¸'
i)(::(: i,, _
,_ _i _
/ii _ ,:, _.
REPORT DOCUMENTATION PAGE FormApprovedOMB NO. 0704-0188
Publicreportingburdenfor thiscollectionof informationisestimated toaverage 1hourper response,includingthe time for reviewinginstructions, searchingexistingdata sources,gatheringandmaintainingthe data needed,and completingand reviewingthe collectionof information.Sendcommentsregardingthisburdenestimateor any otheraspect of this collectionof information,includingsuggestionsforreducingthisburden,toWashingtonHeadquartersServices,Directoratefor InformationOperationsand Reports,1215JeffersonDavis Highway,Suite 1204, Arlington,VA22202-4302, and to the Officeof Managementand Budget,PaperworkReductionProject(0704-0188),Washington,DC 20503.
1. AGENCY USE ONLY (Leave blank) 2. REPORT DATE 3. REPORTTYPE AND DATES COVERED
July 1998 Technical Memorandum4.TITLE AND SUBTITLE 5. FUNDING NUMBERS
Full Flight Envelope Direct Thrust Measurement on a Supersonic Aircraft
6. AUTHOR(S)
Timothy R. Conners and Robert L. Sims
7.PERFORMINGORGANIZATIONNAME(S)ANDADDRESS(ES)
NASA Dryden Flight Research CenterP.O. Box 273
Edwards, California 93523-0273
9. SPONSORING/MONITORINGAGENCYNAME(S)ANDADDRESS(ES)
National Aeronautics and Space Administration
Washington, DC 20546-0001
WU 529-20-04-00-33-00-MGT
8. PERFORMING ORGANIZATION
REPORT NUMBER
H-2266
10. SPONSORING/MONITORING
AGENCY REPORT NUMBER
NASA/TM-1998-206560
11.SUPPLEMENTARY NOTES
Presented at the 34th AIAA/ASME/SAE/ASEE Joint Propulsion Conference, Cleveland, Ohio, July 13-15,1998.
12a. DISTRIBUTION/AVAILABILITY STATEMENT
Unclassified--Unlimited
Subject Category 05
12b. DISTRIBUTION CODE
13. ABSTRACT (Maximum 200 words)
Direct thrust measurement using strain gages offers advantages over analytically-based thrust calculation
methods. For flight test applications, the direct measurement method typically uses a simpler sensor
arrangement and minimal data processing compared to analytical techniques, which normally require costly
engine modeling and multisensor arrangements throughout the engine. Conversely, direct thrust measurement
has historically produced less than desirable accuracy because of difficulty in mounting and calibrating the
strain gages and the inability to account for secondary forces that influence the thrust reading at the engine
mounts. Consequently, the strain-gage technique has normally been used for simple engine arrangements and
primarily in the subsonic speed range. This paper presents the results of a strain gage-based direct thrust-
measurement technique developed by the NASA Dryden Flight Research Center and successfully applied to the
full flight envelope of an F-15 aircraft powered by two F100-PW-229 turbofan engines. Measurements have
been obtained at quasi-steady-state operating conditions at maximum nonangmented and maximum augmented
power throughout the altitude range of the vehicle and to a maximum speed of Mach 2.0, and are comparedagainst results from two analytically-based thrust calculation methods. The strain-gage installation and
calibration processes are also described.
14. SUBJECT TERMS
Accuracy, Analytical models, Calibration, Direct thrust measurement, F-15,
F100-PW-229 engine, Strain gage, Supersonic, Thrust calculation
17. SECURITY CLASSIFICATION 18. SECURITY CLASSIFICATION 19. SECURITY CLASSIFICATION
OF REPORT OF THIS PAGE OF ABSTRACT
Unclassified Unclassified Unclassified
NSN 7540-01-280-5500
15. NUMBER OF PAGES
37
16. PRICE CODE
A0320. LIMITATION OF ABSTRACT
Unlimited
Standard Form 298 (Rev. 2-89)Prescribed by ANSI Std Z39-18
298-102