Embed Size (px)
Citation preview

Global Monitoring Report 2015/2016
Development Goals in an Era of Demographic Change
OVERVIEW
A World Bank Group FlagshipReport
Development Goals in an Era of Demographic Change
Global Monitoring Report 2015/2016
Overview


Development Goals in an Era ofDemographic Change
Global Monitoring Report 2015/2016
A joint publication of the World Bank Group and the International Monetary Fund
Overview

This booklet contains the overview, as well as a list of contents from the forthcoming book, Global Monitoring Report 2015/2016: Development Goals in an Era of Demographic Change (DOI: 10.1596/978-1-4648-0669-4). The PDF of the final, full-length book, once published, will be available at https://openknowledge.worldbank.org/ and print copies can be ordered at http:// Amazon.com. Please use the final version of the book for citation, reproduction, and adaptation purposes.
© 2016 International Bank for Reconstruction and Development / The World Bank1818 H Street NW, Washington DC 20433Telephone: 202-473-1000; Internet: www.worldbank.orgSome rights reserved
This work is a product of the staff of The World Bank and The International Monetary Fund with external contributions. The findings, interpretations, and conclusions expressed in this work do not necessarily reflect the views of The World Bank and The International Monetary Fund, their respective Boards of Executive Directors, or the governments they represent. The World Bank and The International Monetary Fund do not guarantee the accuracy of the data included in this work. The boundaries, colors, denomina-tions, and other information shown on any map in this work do not imply any judgment on the part of The World Bank and The International Monetary Fund concerning the legal status of any territory or the endorsement or acceptance of such boundaries.
Nothing herein shall constitute or be considered to be a limitation upon or waiver of the privileges and immunities of The World Bank and The International Monetary Fund, all of which are specifically reserved.
Rights and Permissions
This work is available under the Creative Commons Attribution 3.0 IGO license (CC BY 3.0 IGO) http://creativecommons.org/licenses/by/3.0/igo. Under the Creative Commons Attribution license, you are free to copy, distribute, transmit, and adapt this work, including for commercial purposes, under the follow-ing conditions:
Attribution—Please cite the work as follows: World Bank Group. 2016. Global Monitoring Report 2015/2016: Development Goals in an Era of Demographic Change. Overview booklet. World Bank, Washington, DC. License: Creative Commons Attribution CC BY 3.0 IGO
Translations—If you create a translation of this work, please add the following disclaimer along with the attribution: This translation was not created by The World Bank and should not be considered an official World Bank translation. The World Bank shall not be liable for any content or error in this translation.
Adaptations—If you create an adaptation of this work, please add the following disclaimer along with the attribution: This is an adaptation of an original work by The World Bank. Views and opinions expressed in the adaptation are the sole responsibility of the author or authors of the adaptation and are not endorsed by The World Bank.
Third-party content—The World Bank does not necessarily own each component of the content con-tained within the work. The World Bank therefore does not warrant that the use of any third-party-owned individual component or part contained in the work will not infringe on the rights of those third parties. The risk of claims resulting from such infringement rests solely with you. If you wish to re-use a compo-nent of the work, it is your responsibility to determine whether permission is needed for that re-use and to obtain permission from the copyright owner. Examples of components can include, but are not limited to, tables, figures, or images.
All queries on rights and licenses should be addressed to the Publishing and Knowledge Division, The World Bank, 1818 H Street NW, Washington, DC 20433, USA; fax: 202-522-2625; e-mail: [email protected].
Cover image: The image on the cover is a segment of a painting by Sue Hoppe, an artist based in South Africa. Titled “Conflict Resolution,” the painting explores the idea that people who seem irreversibly divided and with little in common can unite if they focus on what they have in common instead of what divides them. Hoppe’s work examines war, conflict, and the plight of children and women in Africa, but is also inspired by nature and architecture. To learn more about Sue Hoppe and her work, visit www .southafricanartists.com/home/SueHoppe. Used with permission; further permission required for reuse.
Cover design: Original design by Debra Naylor of Naylor Design. This edition designed by Bill Pragluski of Critical Stages.
The data presented in text, charts, and tables is current as of mid-September, 2015.
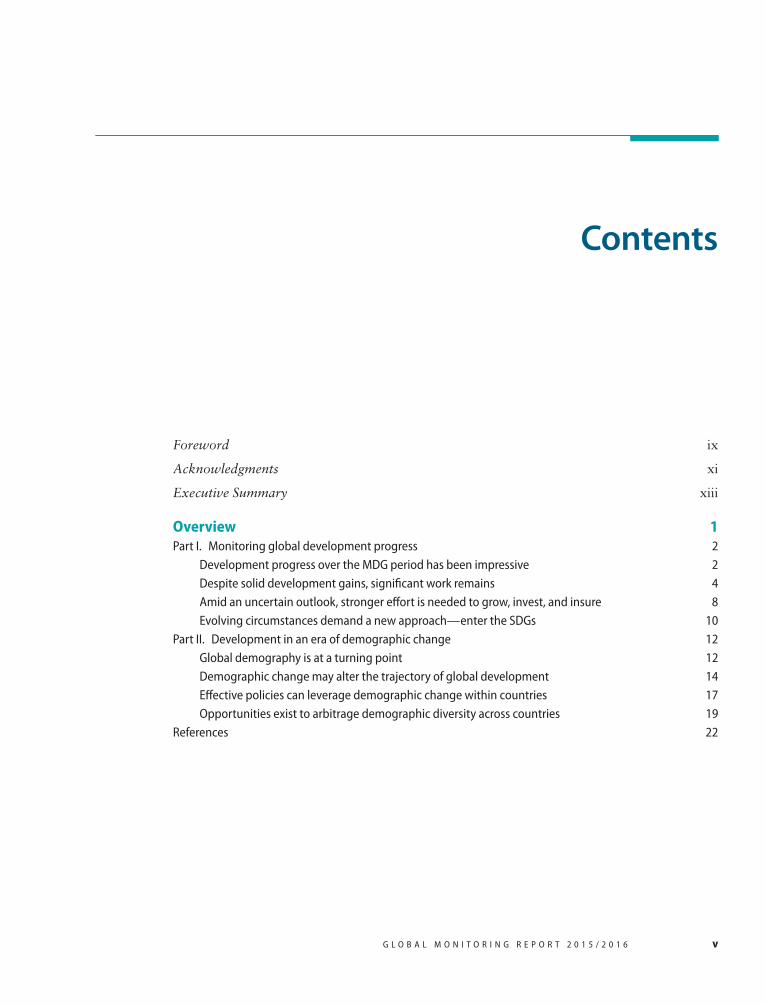
Foreword ix
Acknowledgments xi
Executive Summary xiii
Overview 1Part I. Monitoring global development progress 2
Development progress over the MDG period has been impressive 2Despite solid development gains, significant work remains 4Amid an uncertain outlook, stronger effort is needed to grow, invest, and insure 8Evolving circumstances demand a new approach—enter the SDGs 10
Part II. Development in an era of demographic change 12Global demography is at a turning point 12Demographic change may alter the trajectory of global development 14Effective policies can leverage demographic change within countries 17Opportunities exist to arbitrage demographic diversity across countries 19
References 22
G L O B A L M O N I T O R I N G R E P O R T 2 0 1 5 / 2 0 1 6 v
Contents


Part I Monitoring Global Development Progress
Chapter 1 Ending Extreme Poverty and Sharing Prosperity: Progress and PoliciesExtreme poverty: Updated numbers and remaining challengesShared prosperity: Conceptual issues and recent trends Ending extreme poverty and sharing prosperity: Policy agenda Conclusion Notes References
Chapter 2 Scaling Up Impact: Transitioning from Millennium to Sustainable Development Goals The Millennium Development Goals: Current status The Sustainable Development Goals: A new approach Conclusion Notes References
Chapter 3 Global Macroeconomic Performance and Outlook: Prospects for Growth Recent developments and short- and medium-term prospects Update on recent macroeconomic policies Quality of macroeconomic policies in low-income countries Long-term convergence and growth trends Conclusion Notes
G L O B A L M O N I T O R I N G R E P O R T 2 0 1 5 / 2 0 1 6 vii
Contents of the complete volume

viii C O N T E N T S G L O B A L M O N I T O R I N G R E P O R T 2 0 1 5 / 2 0 1 6
Part II Development in an Era of Demographic Change
Chapter 4 Demographic Change: Disparities, Divergences, and Drivers Characteristics of demographic change Drivers of demographic change Conclusion Notes References
Chapter 5 Implications of Demographic Change: Pathways to Prosperity From demography to development: A global typology Challenging starting points Pathways to future prosperity Conclusion Notes References
Chapter 6 Policy Priorities in an Era of Demographic Change Leveraging demographic change within countries Leveraging demographic differences across countries Conclusion Country Spotlights: Policy challenges at different stages of demographic transition Notes References
Appendixes A. Millennium Development Goals Report Card B. The Role of Multilateral Development Banks: From MDGs to SDGs C. Data sources D. Methodology

Foreword
deep poverty. This year’s Global Monitor-ing Report presents new and more intuitive measures of poverty that allow us to mea-sure depth and help contribute to the policy dialogue and action agenda in this urgent area.
prosperity, with a majority of countries reg-istering solid income growth in the poorest 40 percent of their income distributions. But in many countries, the incomes of the bot-tom 40 percent declined, including in half of the high-income countries. Ensuring that income is shared more equitably should be a priority for all countries.
are held back by unequal progress on the non-income dimensions of development, like access to essential services. We must urgently address the widespread inequali-ties of opportunity in education, health, and other sectors.
The thematic section of this report shows that advancing these critical challenges will take place against the background of major demographic changes. The global population is growing much slower in 2015 than at the beginning of the MDG period in 2000. It is also aging at record speed.
There is significant cross-country hetero-geneity because while some countries still
This is a pivotal year for global development. The Millennium Development Goals (MDGs) have guided countries and partners over the last 15 years in improving the living condi-tions of the poor. We are now transitioning to the Sustainable Development Goals (SDGs), a new set of global targets that embrace eco-nomic, social, and environmental priorities through 2030.
As we reflect on the hard-fought progress since the launch of the MDGs, we have an opportunity to make important changes in how we approach development. We can cel-ebrate that the MDGs mobilized the world behind an ambitious agenda, that many coun-tries have reduced poverty and illness, and that more children today are in school than ever before.
Our mission, however, is far from complete. During the last quarter-century, more than 1 billion people have lifted themselves out of extreme poverty. Yet, about one tenth of the global population still lives on less than $1.90 a day—the updated international poverty line.
Looking ahead, three critical challenges remain:
are deeply poor, with income levels far below the poverty line. Policy action and programs need to focus more directly on the men, women, and children that live in
G L O B A L M O N I T O R I N G R E P O R T 2 0 1 5 / 2 0 1 6 ix

x F O R E W O R D G L O B A L M O N I T O R I N G R E P O R T 2 0 1 5 / 2 0 1 6
maintain young and growing populations, particularly those where global poverty is concentrated, others are aging, especially the high- and middle-income countries. Projec-tions for global growth over the SDG period trend down in line with the decrease in popu-lation growth, but demographic change can also be a contributor to growth and develop-ment if the right policies are adopted.
To advance development amid demo-graphic change, we must place our policies and financing behind three strategic priorities: grow economies in ways that are sustainable and create jobs; invest in people’s social and economic potential; and insure against ever-changing risks, which tend to disproportion-ately impact the poor. These policies will be tailored to each country’s demographic profile.
Moreover, the recent European refugee cri-sis only further highlights the importance of
making the best out of demographic change. Whether people migrate for more opportu-nities in life or just a safer life, migration—together with fertility and mortality—is a critical driver of demographic change. Along with capital flows and trade, it is also a key channel through which mutual benefits can be realized in response to diverse demographic trends across countries. Challenges must be managed, but international cooperation is key.
With the right policies in place, demo-graphic change can contribute to the move-ment to end extreme poverty, boost shared prosperity, and achieve the SDGs. This year’s Global Monitoring Report will help all countries—rich and poor alike—to navi-gate the challenges and to take advantage of demographic change and advance on global development goals that will improve living standards around the world.
Jim Yong Kim Christine LagardePresident of the Managing Director of theWorld Bank Group International Monetary Fund

Acknowledgments
This report was prepared jointly by the staffs of the World Bank Group and the Interna-tional Monetary Fund (IMF), with contribu-tions from the following partner institutions: the African Development Bank (AfDB), the Asian Development Bank (ADB), the European Bank for Reconstruction and Devel-opment (EBRD), the Inter-American Develop-ment Bank (IADB), and the Organisation for Economic Co-operation and Development (OECD). Beyond these institutions, many aca-demics and consultants also helped make this report possible. The contributions of all are gratefully acknowledged.
Philip Schellekens was lead author and manager of the report, under the guidance of Kaushik Basu (Senior Vice President and World Bank Chief Economist), Indermit Gill (Director of Development Policy), and Ayhan Kose (Director of Development Economics Prospects Group). The main authors and con-tributors from the World Bank Group were: Syud Amer Ahmed, Vandana Chandra, Marcio Cruz, Allen Dennis, Christian Eigen-Zucchi, Michele Gragnolati, Hans Lofgren, Maryla Maliszewska, Bryce Quillin, and Ken-neth Simler. Key analytical and data support was provided by Pinyi Chen, Huade Huo, Jin Ho Kim, Csilla Lakatos, Fabian Mendez Ramos, Eugenia Moran-Suarez, Israel Osorio-Rodarte, and Kevin Kamto Sonke. Mark Felsenthal, Graeme Littler, Bruce Ross-Larson and Dana Vorisek provided editorial support.
Rosalie Singson Dinglasan managed the desk-top production of the report and handled administrative aspects, with additional sup-port from Maria Hazel Macadangdang.
The lead author in the IMF was Lynge Nielsen, under the guidance of Tam Bayoumi, Rupa Duttagupta, and Sean Nolan. The core contributors from the IMF were: Sibabrata Das, Davide Furceri, Carla Intal, Vimal Tha-koor, John Wakeman-Linn, and Peichu Xie.
The report benefited from the following principal external contributors. The report’s external advisors were James Foster (George Washington University), Homi Kharas (Brook-ings Institution), Ronald Lee (University of California, Berkeley), Andrew Mason (Uni-versity of Hawaii), and Warwick McKibbin (Australian National University). Key contri-butions from partner institutions were made by: Romina Boarini, Hervé Boulhol, Jean-Christophe Dumont, Lamia Kamal-Chaoui, Fabrice Murtin, Ana Llena Nozal and Shaun Reidy (OECD), who provided boxes on pen-sions reforms and migration and an update on the OECD’s multi-dimensional living standard measure; Debra Kertzman, Marie Christine Montoya, and Manju Senapaty (ADB); Erin Bautista, Tracy Betts, and Amy Marie Lewis (IADB); Mandeep Bains and Jasmine Lief (EBRD); Patricia N. Laverley, Luigi de Pierris, and Adeleke Salami (AfDB).
Additional contributions to boxes are fur-thermore acknowledged from the following
G L O B A L M O N I T O R I N G R E P O R T 2 0 1 5 / 2 0 1 6 xi

xii A C K N O W L E D G M E N T S G L O B A L M O N I T O R I N G R E P O R T 2 0 1 5 / 2 0 1 6
people (all World Bank, except where men-tioned): Lucilla Bruni, Carmen de Paz, Andrew Mason (University of Hawaii), Susan McAdams, Emmanuel Milet (University of Geneva), Marco Scuriatti, Sara Troiano, and Quentin Wodon. The Global Poverty Working Group provided data and analytical input on extreme poverty and shared prosperity, with special thanks to: Raul Andres Castaneda Aguilar, Aziz Atamanov, Shaohua Chen, Minh Cong Nguyen, Andrew Dabalen, Reno Dewina, Carolina Diaz-Bonilla, Francisco H. G. Ferreira, Roy Katayama, Nandini Krish-nan, Leonardo Ramiro Lucchetti, Jose Montes, Rose Mungai, David Locke New-house, Monica Yanez Pagans, Ana L. Revenga, Prem Sangraula, Liliana D. Sousa, Hiroki Uematsu, João Pedro Wagner De Azevedo, Christina Wieser, and Nobuo Yoshida. Data support on the Maquette for Millennium Development Goal Simulations (MAMS) for Brazil and Japan was provided by Martin Cicowiez (CEDLAS-Universidad Nacional de La Plata). Dennis Botman (IMF), Sebastien Dessus, Cornelius Fleischhaker, Edith Kikoni, Lars Moller, Antonio Nucifora, Sergei I. Shatalov, and Quentin Wodon also provided data and feedback for the MAMS work, while Saniya Ansar, Leora Klapper, David Reher (Universidad Complutense de Madrid), and Robert Schmidt (University of Richmond) contributed data and feedback on other ana-lytical aspects and simulations. The MDG report card and other related contributions were prepared by Mahyar Eshragh-Tabary, Neil Fantom, Juan Feng, Masako Hiraga, Haruna Kashiwase, Buyant Khaltarkhuu, Hiroko Maeda, Umar Serajuddin, Rubena Sukaj, Emi Suzuki and Dereje Wolde.
Guidance from the Executive Directors of the World Bank and the IMF and their staff during discussions of the draft report is grate-fully acknowledged. The report also benefited from many useful comments and suggestions from World Bank and IMF management and staff in the course of preparation and review.
Specific thanks in this respect go to: Ahmad Ahsan, Jorge A. de Thompson R. Araujo,
Elena Bardasi, Antonella Bassani, Kathleen Beegle, Benu Bidani, Moussa Blimpo, Erik A. Bloom, Zeljko Bogetic, Carter J. Brandon, Bénédicte de la Brière, Javier Bronfman Horovitz, Maurizio Bussolo, César Calderón, Shubham Chaudhuri, Luc Christiaensen, Fionna Douglas, Roberto Echandi, Sidney J. Edelmann, David Evans, Tim Evans, Cornelius Fleischhaker, Alan Fuchs, Emanuela Galasso, Franck O. Gbaguidi, Frederico Gil Sander, Caren Grown, Stephane Guimbert, Lucia Hanmer, Phillip J. Hay, Yumeka Hirano, Monika Huppi, Elena Ianchovichina, Malathi S. Jayawickrama, Dean M. Jolliffe, Andy Kotikula, Nicole Klingen, Aart C. Kraay, Megumi Kubota, Thomas Laursen, Kihoon Lee, Xue Li, Peter Kusek, Samira Lindner, Audrey Liounis, Gladys Lopez-Acevedo, Luis-Felipe Lopez-Calva, Leonardo Lucchetti, Mattia Makovec, Bill Maloney, Eliana R. Matulevich, Cristina Mejía, Steisianasari Mileiva, Rinku Murgai, Raj Nallari, Ambar Narayan, Mario Negre, Antonio Nucifora, Philip O’Keefe, Eko Pambudi, Samuel Pienk-nagura, Alberto Portugal, Sonia Plaza, Espen B. Prydz, Martin Rama, Dilip Ratha, Michele Ruta, Imam Setiawan, Sudhir Shetty, Joana Silva, Carlos Silva-Jauregui, Hoon S. Soh, Sebastian Stolorz, Lynne Sherburne-Benz, Xiaolun Sun, Marvin Taylor-Dormond, Hans Timmer, Augusto de la Torre, Matthew Wai Poi, Jan Walliser, Bagus A. Wirapati, Liang Yu, Qinghua Zhao.
The World Bank’s Publishing and Knowl-edge Unit managed editorial services, design, production, and printing of the report, with Susan Graham and Kia Penso as the produc-tion editing team. Others who assisted with the report’s publication included Denise Bergeron, Aziz Gökdemir, Patricia Katayama, Nancy Lammers, and Stephen McGroarty. Marta Gottron copy-edited the report. The report’s dissemination and outreach were coordinated by Phillip J. Hay, working with Mark Felsenthal, Vamsee K. Kanchi, and Mikael E. Reventar. Graeme Littler and Kath-erine Rollins provided web support.

Executive Summary
With 2015 marking the transition from the Millennium to the Sustainable Development Goals, the international community can cele-brate many development successes since 2000. Despite the global financial crisis, economic growth was generally strong and robust. About 1 billion people rose out of extreme poverty. Most developing countries saw solid income growth for the bottom 40 percent of their income distribution. Millions of children who were unlikely to survive their fifth birth-day passed beyond these critical years and went on to school in ever greater numbers. The incidence of preventable diseases such as AIDS, malaria, and tuberculosis is falling. The share of those with access to clean water and better sanitation has risen. Overall, the Mil-lennium Development Goals played an impor-tant role in galvanizing the global development community, and that experience will help drive progress toward achievement of the Sus-tainable Development Goals by 2030.
Despite solid development gains, progress has been uneven, and significant work remains. With an estimated 900 million people in 2012 living on less than $1.90 a day—the updated international poverty line—and a projected 700 million in 2015, extreme poverty remains unacceptably high. It has also become more concentrated in Sub-Saharan Africa and South Asia. Addressing moderate poverty and miti-gating the vulnerability of falling back into
poverty have become more pressing issues in many countries, including in those where the bottom 40 percent saw their incomes decline. Even in a world of single-digit extreme pov-erty, non-income disparities, such as limited access to quality education and health services, pose a bottleneck to sustained poverty reduc-tion and shared prosperity. Wider environ-mental sustainability concerns are a major challenge throughout the world, in regard to climate change and its impact on the natural resources upon which many of the poorest depend, such as water. In sum, while develop-ment progress was impressive, it has been uneven and a large unfinished agenda remains.
Three key challenges stand out: the depth of remaining poverty, the unevenness in shared prosperity, and the persistent disparities in non-income dimensions of development. First, the policy discourse needs to focus more directly on the poorest among the poor. While pockets of ultra-poverty exist around the world, Sub-Saharan Africa is home to most of the deeply poor. To make depth a more central element in policy formulation, easy-to- communicate measures are needed—and this report attempts a step in this direction with person-equivalent measures of poverty. Sec-ond, the eradication of poverty in all of its forms requires steady growth of the incomes of the bottom 40 percent. Yet, economic growth—a key driver of shared prosperity—
G L O B A L M O N I T O R I N G R E P O R T 2 0 1 5 / 2 0 1 6 xiii
xiv E X E C U T I V E S U M M A R Y G L O B A L M O N I T O R I N G R E P O R T 2 0 1 5 / 2 0 1 6
may not be as buoyant as it was before the global financial crisis. Third, unequal progress in non-income dimensions of development requires addressing widespread inequality of opportunity, which transmits poverty across generations and erodes the pace and sustain-ability of progress for the bottom 40 percent. To meet these challenges, three ingredients are core to the policy agenda: sustaining broad-based growth, investing in human develop-ment, and insuring the poor and vulnerable against emerging risks.
In view of these challenges, the Sustainable Development Goals aim to scale up impact in a changing world through a more integrated approach to development. Recognizing the interconnections between development objec-tives, the SDGs embrace an ambitious and holistic vision to foster inclusive and sustain-able development with scaled-up impact. Shared by all countries, they recognize that collective action is required. Global chal-lenges—resilient financial systems, common resources, climate change—require interna-tionally coordinated solutions. Meeting SDG investment needs will depend on shifting from “billions” in official development assistance to “trillions” in investments of all kinds, unlock-ing, leveraging, and catalyzing public and pri-vate resources. The SDGs will need to be pursued in a changing world, with new oppor-tunities and challenges brought by evolving megatrends, including climate change, contin-ued globalization, rapid urbanization, and, as discussed in the special theme of this report, demographic change.
Profound changes in global demography have the potential to alter the trajectory of global development over the SDG period. Global demography is at a turning point: the world’s population is growing more slowly and is aging at an unprecedented rate. These trends reflect past development successes—women’s empowerment, improved education, better child, maternal and reproductive health, and increased longevity. The working-age share of the population peaked in 2012 and is now on the decline. Aging means that popula-tion increases are reflected in larger numbers of older people. The global count of children
is stabilizing at a plateau of 2 billion. Yet, underneath these global trends lies consider-able diversity in the direction and pace of demographic change. Regional and subre-gional patterns vary across and within coun-tries. To frame the impact of diverse demographic trends on development across countries, this report lays out a new typology of demographic change, applied to the latest 2015 UN population statistics.
The diversity of demographic change at the country level presents unique opportunities and challenges to the world’s centers of global poverty and engines of global growth. More than 90 percent of poverty is concentrated in pre- and early-dividend countries with swell-ing working-age populations that lag in key human development indicators and continue to register rapid population growth. In these countries, the demographic transition to lower fertility creates a golden opportunity to raise living standards. Over 85 percent of global economic activity and 78 percent of global growth over the last 15 years can be attributed to late- and post-dividend countries, which have much-lower fertility rates and some of the highest shares of the elderly in the world. In these countries, population aging may weaken growth prospects. To be sure, demographic change is not inherently good or bad and pres-ents opportunities and challenges everywhere. In each case, policies can make a critical differ-ence in how demographic change affects prog-ress toward the development goals.
Navigating the dynamic implications of demographic change will require sound poli-cies informed by a long-run perspective and tailored to a nation’s demographic context. To eradicate persistent poverty, the centers of global poverty need to accelerate their demo-graphic transition, invest in their young and still-growing populations, and lay the founda-tions for sustained growth. Among other pol-icy initiatives, these goals require better education and health services, as well as greater empowerment of women. Facing weakening economic dynamism, the lower-fertility, richer countries that make up the current engines of global growth need to address headwinds aris-ing from shrinking labor forces. They also

G L O B A L M O N I T O R I N G R E P O R T 2 0 1 5 / 2 0 1 6 E X E C U T I V E S U M M A R Y xv
need to adapt their policies and institutions to foster healthy and productive aging. Selected policy priorities include mobilizing savings for productive investment in human and physical capital, as well as strengthening welfare sys-tems—pensions, health care, and long-term care—while ensuring fiscal sustainability and protection for the elderly and vulnerable.
Policy opportunities also exist to arbitrage demographic diversity across countries. The extent of demographic diversity across coun-tries is starker than ever, with large and inevi-table impacts on the global economy. Returns on capital and labor are affected. Comparative advantages in trade are altered. Given these implications, flows of capital, labor and goods and services will be affected and, together, they can help respond to growing demographic imbalances globally. Mutual benefits can be realized: capital can flow to rising consumer markets; older countries can benefit from legal
immigration; younger countries can produce labor-intensive products. But challenges need to be managed and international cooperation is key.
With effective policies, this era of intense demographic change may herald a period of sustained development progress. Global demography is changing and has the potential to alter the trajectory of global development profoundly. To speed up progress, countries need to step up efforts to sustain broad-based growth, invest in people, and insure the poor and vulnerable against ever-changing risks. However, they must undertake these measures by taking into account demographic change. Where possible, this requires capturing and harnessing demographic dividends. Elsewhere, it requires adaptation. Everywhere, it calls for turning demographic change into one of the most consequential development opportuni-ties of our times.

xvi F O R E W O R D G L O B A L M O N I T O R I N G R E P O R T 2 0 1 5 / 2 0 1 6
Note: Based on the $1.90 poverty line and 2011 PPP.a. Forecast.
Note: Based on the $1.90 poverty line and 2011 PPP.a. Forecast.
Note: Based on the $1.25 poverty line and 2005 PPP. Extreme poverty (< $1.25 a day), moderate poverty ($1.25–$4), vulnerability ($4–$10), middle class and rich (> $10).
Projections show that the global poverty rate may have fallen to single digits in 2015. Yet, the number of poor remains high.
While income poverty fell rapidly during the MDG-era, a large unfinished agenda remains for the SDGs with respect to non-income goals.
With extreme poverty concentrating in Sub-Saharan Africa, more focus is needed on the poorest among the poor.
Prosperity needs to be better shared with the bottom 40 percent of the income distribution, especially in high-income countries.
With less buoyant growth expected at the start of the SDG period, increased effort is needed to sustain broad-based growth.
We need to invest in people and protect them from risk with adequate human development policies and social protection.
MONITORING GLOBAL DEVELOPMENT PROGRESS: A SNAPSHOT
1,958
1,747
987 902702
37.1
29.0
14.2 12.8 9.6
0
5
10
15
20
25
30
35
40
0
500
1,000
1,500
2,000
1990 1999 2011 2012 2015a
Pove
rty
rate
(%)
Num
ber o
f poo
r (m
illio
ns)
Number of poor (left axis) Poverty rate (right axis)
Sources: PovcalNet 2015, World Bank’s Global Database for Shared Prosperity, IMF’s World Economic Outlook.
36
67
15
6
38
40
35
71
58
40
88
77
34
40
52
27
Improved sanitation facilities accessNumber of countries (out of 145)
Improved water source access
Maternal mortality ratio
Infant mortality rate
Under-5 mortality rate
Primary school completion rate
Prevalence of undernourishment
Extreme income poverty
Target met Sufficient progress (before 2015) Insufficient progress (2015–20) Moderately off target (2020–30) Seriously off target (after 2030) Insufficient data
0
10
20
30
40
50
60
1990 1999 2011 2012 2015a
East Asia and Pacific
Shar
e of
glo
bal p
over
ty (%
)
Sub-Saharan Africa South Asia Rest of the world
Num
ber o
f cou
ntrie
s
0
10
20
30
40
Low-incomecountries
Lower-middle-income
countries
Upper-middle-income
countries
High-incomecountries
Positive income growth for the bottom 40% Negative income growth for the bottom 40%
4
5
717
22 19
173
Advanced economies
Low-income developing countries
Emerging market countries
–5–4–3–2–1
012345
Projected2001 2005 2010 2015 2020
GDP
per c
apita
gro
wth
,m
edia
n co
untr
y (%
cha
nge)
Extremely poor Moderately poor Vulnerable Middle class and rich
0 20 40 60 80 100
Inco
me
stat
us a
t eac
h pe
rcen
tile,
201
1(1
23 c
ount
ries)
Bottom40 percent

G L O B A L M O N I T O R I N G R E P O R T 2 0 1 5 / 2 0 1 6 E X E C U T I V E S U M M A R Y xvii
–0.5
0.0
0.5
1.0
1.5
2.0
2.5
3.0
Pre-dividendcountries
Early-dividendcountries
Late-dividendcountries
Post-dividendcountries
1980–2015 2015–50
Wor
king
-age
pop
ulat
ion
grow
th ra
te (%
)
Underneath global trends lies stark diversity, with countries facing different opportunities to capture demographic dividends.
Sources: UN 2015, PovcalNet 2015, World Bank’s World Development Indicators 2015.
DEVELOPMENT IN AN ERA OF DEMOGRAPHIC CHANGE: A SNAPSHOT
Global demographic change is intense: the working-age share peaked, the population grows much slower and ages at record speed.
0
1
2
3
50
55
60
65
70
1950 1970 1990 2010 2030 2050
Popu
latio
n gr
owth
rate
(%)
Shar
e of
wor
king
age
(%)
Share of working age population (left axis) Population growth rate (right axis)
Pre- and early-dividend countries need to spark demographic transition, invest in human development and create jobs for the youth bulge.
Late- and post-dividend countries need to sustain productivity growth amidst demographic headwinds, and adapt institutions and policies to rapid population aging.
Life expectancy (years), 2015Pre-dividend countries Early-dividend countriesLate-dividend countries Post-dividend countries
Fert
ility
rate
(birt
hs p
er w
oman
), 20
15
45 55 65 75 850
2
4
6
8
10
Shar
e of
pop
ulat
ion
ages
65+
(%)
0
5
10
15
20
30
25
1950 1960 1970 1980 1990 2000 2010 2020 2030 2040 2050
Pre-dividend countries Late-dividend countries
Early-dividend countries Post-dividend countries
Demographic fault lines separate centers of global poverty needing further development and engines of global growth facing rapid aging.
Freer flows of capital, trade and, especially, people present an increasingly compelling global opportunity to arbitrage demographic diversity across countries.
0
10
20
30
40
50
60
Pre-dividendcountries
Early-dividendcountries
Late-dividendcountries
Post-dividendcountries
Share of global GDP growth Share of global poverty
Perc
ent
Mig
rant
stoc
k by
des
tinat
ion
in 2
013
(mill
ions
)
0
20
40
60
80
100
120
140
To pre-dividendcountries
To early-dividendcountries
To late-dividendcountries
To post-dividendcountries
From pre-dividend countries From early-dividend countries
From late-dividend countries From post-dividend countries


Overview
prosperity, and the persistent disparities in non-income dimensions of development. The MDGs were helpful in galvanizing global development progress—an experience that will help drive the achievement of the SDGs by 2030.
The world is also at a crossroads for global demographic trends. Global population growth is slowing: the share of the working-age population (15−64 years) peaked in 2012 at 66 percent and is now falling, while the total number of children (ages below 15 years) will remain at a plateau of around 2 billion into the next decades. These trends reflect past successes in development—women’s empowerment, improved education, better reproductive health services, and increased longevity. But the direction and pace of demographic change vary starkly across countries, with sizable disparities between the centers of global poverty (marked by high fertility) and the engines of global growth (marked by rapid aging). The latter comprise almost all high-income and most middle-income economies. In many cases, they have completely eliminated extreme income pov-erty, but they continue to face challenges in sharing the benefi ts of increased prosperity, particularly if aging weakens their economic dynamism. The former include lower-income
The world is at a global development cross-roads, as 2015 marks the end of the 15-year window for achieving the Millennium Development Goals (MDGs) and the begin-ning of the Sustainable Development Goals (SDGs). The world met the MDG target of halving the global poverty rate in 2010, fi ve years ahead of schedule. The latest data sug-gest that extreme poverty has continued its decades-long descent. Still, poverty remains unacceptably high, with an estimated 900 million people in 2012 living on less than $1.90 a day—the new international poverty line; the projected number for 2015 under the new line is 700 million people. Poverty also is becoming increasingly concentrated in Sub-Saharan Africa, where its depth and breadth remain an overriding challenge. The MDGs were successful in reducing income poverty, but they were less successful in ameliorating non-income deprivations, such as access to quality education or to basic health services. Few countries have combined growth with reducing the level of environmental exter-nalities and carbon emissions. Yet, increasing land degradation, overfi shing, deforestation, extreme weather events, and urban air pollu-tion endanger recent progress. Looking for-ward, three challenges stand out: the depth of remaining poverty, the unevenness in shared
1

2 O V E R V I E W G L O B A L M O N I T O R I N G R E P O R T 2 0 1 5 / 2 0 1 6
countries in earlier stages of demographic transition to lower fertility levels and longer life expectancy, making them the focus of the continuing battle against global poverty.
Demographic change brings unique oppor-tunities and challenges to further the post-2015 development goals. But countries have very different starting lines and face stark differences in demographic characteristics and projected trends. The way forward, as underpinned by the SDGs, is a more synergis-tic approach between the various dimensions of development. Three ingredients will frame the policy agenda: sustainable broad-based growth, investment in human development, and measures that insure the poor and vul-nerable against evolving risks. These strate-gies must be sensitive to demographics. The centers of global poverty need to accelerate their demographic transition, invest in their young and growing populations, and lay the foundations for sustained growth to capture demographic dividends. The engines of global growth need to address headwinds arising from shrinking labor forces and adapt their policies and institutions to foster healthy and productive aging. In addition, to eradicate poverty and invigorate economic dynamism, all countries must also grasp the opportuni-ties and manage the challenges that arise from demographic imbalances at the global level—through capital flows, migration, and trade. With the right set of policies, this era of intense demographic change can be turned into one of sustained development progress.
Global Monitoring Report 2015/2016 investigates these issues in two parts:
Part I—the global monitoring part—examines global development progress, the unfinished agenda, and the policy opportuni-ties looking ahead. Chapter 1 examines the progress made on sustainable poverty reduc-tion and shared prosperity, as well as the pol-icies that are needed to make further prog-ress. With 2015 being a watershed year for global development goals, Chapter 2 reviews the development successes during the MDG period and examines the unfinished agenda left for the SDGs. Chapter 3 assesses the
macroeconomic performance over the MDG period, provides the near- and medium-term outlook, and examines what the world might be like in 2030.
Part II—the thematic part—examines how demographic change can be tilted in favor of the development goals. Chapter 4 char-acterizes demographic change at the global, regional, and country levels. It also examines the drivers of demographic change that have shaped the diversity of demographic patterns and trends. Chapter 5 examines how demog-raphy affects development. It develops a new global typology that ties demographic change to development potential and analyzes the various pathways through which demographic change affects the prosperity of nations. Chapter 6 analyzes how policies can leverage demographic change in support of the devel-opment goals. It examines policy opportuni-ties at both the country and the global levels.
Part I: Monitoring global development progress
Development progress over the MDG period has been impressive
In many ways, development has advanced more rapidly over the 15-year MDG era than at any other time in human history. Since the launch of the MDGs, economic growth has been rapid, aided by strong commodity prices and generally improved macroeconomic poli-cies. Poverty reduction also has been rapid, particularly in East Asia and Pacific. Mil-lions of children who were unlikely to survive to their fifth birthday have passed beyond these critical years and gone on to school in ever greater numbers, including many more girls than was the case 15 years ago. The incidence of preventable diseases such as acquired immunodeficiency syndrome (AIDS), malaria, and tuberculosis is falling, and the share of people with access to clean water and better sanitation has risen mark-edly. The MDGs helped frame the broader goals of development and build a coalition of partners to work toward common goals.
G L O B A L M O N I T O R I N G R E P O R T 2 0 1 5 / 2 0 1 6 O V E R V I E W 3
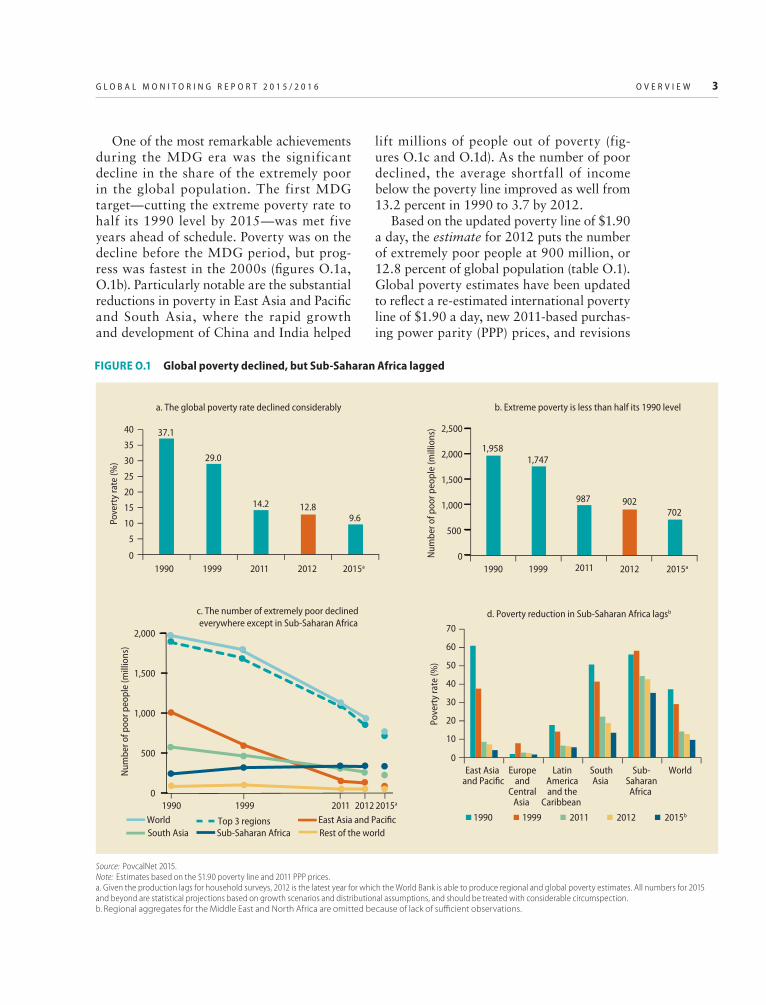
One of the most remarkable achievements during the MDG era was the significant decline in the share of the extremely poor in the global population. The first MDG target—cutting the extreme poverty rate to half its 1990 level by 2015—was met five years ahead of schedule. Poverty was on the decline before the MDG period, but prog-ress was fastest in the 2000s (figures O.1a, O.1b). Particularly notable are the substantial reductions in poverty in East Asia and Pacific and South Asia, where the rapid growth and development of China and India helped
lift millions of people out of poverty (fig-ures O.1c and O.1d). As the number of poor declined, the average shortfall of income below the poverty line improved as well from 13.2 percent in 1990 to 3.7 by 2012.
Based on the updated poverty line of $1.90 a day, the estimate for 2012 puts the number of extremely poor people at 900 million, or 12.8 percent of global population (table O.1). Global poverty estimates have been updated to reflect a re-estimated international poverty line of $1.90 a day, new 2011-based purchas-ing power parity (PPP) prices, and revisions
FIGURE O.1 Global poverty declined, but Sub-Saharan Africa lagged
Source: PovcalNet 2015. Note: Estimates based on the $1.90 poverty line and 2011 PPP prices.a. Given the production lags for household surveys, 2012 is the latest year for which the World Bank is able to produce regional and global poverty estimates. All numbers for 2015 and beyond are statistical projections based on growth scenarios and distributional assumptions, and should be treated with considerable circumspection.b. Regional aggregates for the Middle East and North Africa are omitted because of lack of sufficient observations.
1,9581,747
987 902702
0
500
1,000
1,500
2,000
2,500
1990 1999 2011 2012 2015a
Num
ber o
f poo
r peo
ple
(mill
ions
)
b. Extreme poverty is less than half its 1990 level
37.1
29.0
14.2 12.89.6
0
5
10
15
20
25
30
35
40
1990 1999 2011 2012 2015a
Pove
rty
rate
(%)
a. The global poverty rate declined considerably
0
10
20
30
40
50
60
70
Europeand
CentralAsia
LatinAmericaand the
Caribbean
SouthAsia
Sub-SaharanAfrica
World East Asia and Pacific
1990 1999 2011 2012 2015b
d. Poverty reduction in Sub-Saharan Africa lagsb
Pove
rty
rate
(%)
0
500
1,000
1,500
2,000
1990 1999 2011 2012 2015a
Rest of the world World South Asia
Top 3 regions Sub-Saharan Africa
East Asia and Pacific
c. The number of extremely poor declined everywhere except in Sub-Saharan Africa
Num
ber o
f poo
r peo
ple
(mill
ions
)

4 O V E R V I E W G L O B A L M O N I T O R I N G R E P O R T 2 0 1 5 / 2 0 1 6
to complementary data (box O.1). The 2012 estimate represents continued progress in poverty reduction as the revised headcount in 2011 was 987 million people (14.2 percent of global population). Comparison between 2011 and 2012 reveals a modest decline in the number of poor in Sub-Saharan Africa, potentially heralding an era of poverty reduc-tion not just in the share of the poor but also in their absolute number.
Although the estimate for 2012 remains the most reliable recent estimate, World Bank projections suggest that global poverty may have reached 700 million, or 9.6 percent of global population, in 2015. For the first time, the global extreme poverty rate may have reached single digits. The projected decline between 2012 and 2015 is 200 mil-lion people (some 80 million in South Asia, about 65 million in East Asia and Pacific, and close to 40 million in Sub-Saharan Africa). This projection is extrapolated from 2012 based on growth scenarios and distributional
assumptions. Given that the collection and processing of nationally representative house-hold surveys—on which actual poverty esti-mates are based—usually takes two to three years, the 2012 number remains the most reliable recent estimate.
Turning to broader segments of the pop-ulation, the bottom 40 percent (B40) of the income distribution in many countries has seen rising incomes over the past decade, yet progress was unequal. Considering five-year periods starting around 2007 and end-ing around 2012, B40 incomes grew in 65 of the 94 countries with adequate and com-parable household data. Among them, 47 countries registered a “shared prosper-ity premium,” meaning that B40 incomes grew faster than the incomes of the aver-age population (figure O.2). This premium ranged from less than 1 percentage point to well above 3 points, suggesting that growth in many countries has been considerably pro-poor. Progress on shared prosperity
TABLE O.1 Global poverty is assessed with the re-estimated poverty line
Historical Headline Projection
Region 1990 1999 2011 2012 2015a
Share of population below $1.90 a day (2011 PPP) (%)
East Asia and Pacific 60.8 37.5 8.5 7.2 4.1Europe and Central Asia 1.9 7.8 2.7 2.5 1.7Latin America and the Caribbean 17.7 14.1 6.5 6.2 5.6Middle East and North Africab — — — — —South Asia 50.6 41.2 22.3 18.8 13.5Sub-Saharan Africa 56.0 58.1 44.3 42.6 35.2Developing world 44.3 34.2 16.6 15.0 11.9World 37.1 29.0 14.2 12.8 9.6
Millions of people below $1.90 a day (2011 PPP)
East Asia and Pacific 999.3 689.7 173.1 147.2 82.6Europe and Central Asia 9.0 36.6 12.7 12.0 4.4Latin America and the Caribbean 78.0 72.2 37.7 37.1 29.7Middle East and North Africab — — — — —South Asia 574.5 560.1 362.3 309.2 231.3Sub-Saharan Africa 284.0 375.4 393.5 388.5 347.1World 1,958.5 1,746.6 987.4 902.0 702.1
Source: PovcalNet 2015.Note: Poverty estimates based on the $1.90 poverty line and 2011 purchasing power parity (PPP) prices. Box O.1 explains how the global poverty estimates were calculated. Regional aggregates for the Middle East and North Africa are omitted because of lack of sufficient observations.a. Given the production lags for household surveys, 2012 is the latest year for which the World Bank is able to produce regional and global
poverty estimates. All numbers for 2015 and beyond are statistical projections based on growth scenarios and distributional assumptions, and should be treated with considerable circumspection.
b. Even though five countries in the Middle East and North Africa region are omitted from the database of country-level poverty estimates, poverty estimates for these countries are calculated for the purposes of global poverty estimation (see box O.1). The 2011 and 2012 poverty estimates for this region implied by these global estimates are 2.4 and 2.3 percent, respectively.

G L O B A L M O N I T O R I N G R E P O R T 2 0 1 5 / 2 0 1 6 O V E R V I E W 5
BOX O.1 Drawing global poverty lines
Global Monitoring Report 2015/2016 unveils poverty data based on a new $1.90 international poverty line, using 2011 purchasing power parity (PPP). To be com-parable, the global poverty estimates are based on a common poverty line across all countries. As with the previous line of $1.25 a day, in 2005 prices, the new line is calculated by averaging the national poverty lines of the 15 poorest developing countries. It repre-sents a very low threshold standard of living which is believed to correspond to the minimum costs of basic needs. Changes in this value over time thus reflect the increasing cost of obtaining these basic needs.
A key driver behind the raising of the international poverty line to $1.90 is the release of the 2011 PPP index. Cross-country comparisons of poverty rates require PPP indexes, produced by the International Comparison Program. New rounds of PPP indexes estimate the cost of living across countries and pro-vide price data for countries not covered by previous
rounds. Introducing new PPPs typically require the re-estimation of the international poverty line and can involve, in some cases, significant changes in our understanding of poverty levels in some countries or the relative ranking of poverty across countries.
Including this year’s revision, there have been four major changes to the World Bank Group’s estimate of the international poverty line, reflecting different methodologies and PPP indexes. The revisions to PPP indexes in 1985, 1993, and 2005 corresponded to poverty lines of $1.01, $1.08, and $1.25, respectively. Different methods have been followed to estimate these lines. Beginning with the $1.25 line, the pov-erty line was calculated by taking the average of the 15 poorest countries (Chad, Ethiopia, The Gambia, Ghana, Guinea-Bissau, Malawi, Mali, Mozambique, Nepal, Niger, Rwanda, Sierra Leone, Tajikistan, Tan-zania, and Uganda). This same practice was followed for the $1.90 revision.
was especially significant in middle-income countries, where some 85 percent of coun-tries in the sample registered an increase in B40 incomes. Among developing regions, Latin America and the Caribbean performed remarkably well.
The evidence suggests that most of the vari-ation in B40 income growth can be explained by growth in average incomes for the entire population. Over long periods of time (several decades), B40 income growth closely tracks average income growth. Historical data for 151 high-income and developing countries shows that average income growth was the primary explanation for cross-country and over-time variations in B40 income growth. Yet, average income growth does not provide the only explanation. Changes in the income share of the B40 played an increased role especially during the 2000s, a period of par-ticularly fast income growth for the B40. It also appears that for lower-income countries, as well as for the lower deciles of the income distribution in any country, average income growth offers diminished explanatory power.
Despite solid development gains, significant work remains
A first key challenge is the depth of poverty, especially in Sub-Saharan Africa. The decline in poverty rates has been impressive. Yet, pov-erty still remains unacceptably high—around 900 million extremely poor people in 2012 and a projected 700 million people in 2015. It is also becoming increasingly concentrated in Sub-Saharan Africa. Over the last decades, the vast majority (about 95 percent) of global poverty has been concentrated in three regions: East Asia and Pacific, South Asia, and Sub-Saharan Africa (figure O.1c). Over time, the composition of global poverty across these three regions has shifted dramatically. East Asia and Pacific registered a spectacular decline. South Asia saw an initial increase and a later decline, with rates remaining high. Sub-Saharan Africa saw a steady increase in its share and is now home to 43.0 percent of the global poor. The growing global share of Sub-Saharan Africa reflects slower poverty reduc-tion there amid rapid population growth: in

6 O V E R V I E W G L O B A L M O N I T O R I N G R E P O R T 2 0 1 5 / 2 0 1 6
2012 the region’s poverty rate stood at 42.6 percent, which is only 13 points lower than in 1990 (figure O.1d).
The policy discourse needs to focus more fully on the poorest among the poor. Poverty
headcount statistics present distorted views of the spatial distribution of poverty and the pace of progress over time. Two countries could record the same poverty headcount rate, where in one country poverty is shallow
FIGURE O.2 Experiences on shared prosperity differ: While the majority of countries have seen solid growth in B40 incomes, many countries have not Annualized B40 income growth (bars with no black outline) and average population income growth (shown with a black outline) for a five-year period, percent (circa 2007–12)
Source: World Bank’s Global Database for Shared Prosperity.Note: Data availability varies across countries. Shared prosperity estimates are provided only for comparable survey years. In Sub-Saharan Africa, only 16 of the 48 countries have shared prosperity numbers even though more survey years exist. Starting points are about 2007 and end points are about 2012. B40 = bottom 40 percent.
Bottom 40%
East Asia and Pacific Europe and Central Asia High-income countries
Latin America and the Caribbean Middle East and North Africa South Asia Sub−Saharan Africa
Total Population
All available countries
Phili
ppin
es
Lao
PDR
Indo
nesi
aTh
aila
ndVi
etna
mCh
ina
Cam
bodi
aM
onte
negr
oLa
tvia
Esto
niaHungary
Lithuania
Serbia
Armenia
Albania
Slovenia
Kyrgyz Republic
Czech Republic
Romania
Bulgaria
Croatia
Poland
Georgia
Ukraine
TurkeyMoldova
Slovak RepublicRussian FederationKazakhstanBelarusGreeceIrelandIcelandItalyCyprusLuxem
bourg
Portugal
United Kingdom
Spain
Denmark
United States
Netherlands
France
Austria
Belgium
Germ
any
FinlandIsra
el
Swed
en
Cana
da
Switz
erla
nd
Nor
way
Aust
ralia
Hond
uras
Guate
mal
a
El Sa
lvadorM
exico
Costa Rica
Dominican RepublicChilePanamaEcuadorColombiaArgentinaBrazil
ParaguayUruguay
PeruBolivia
Iraq
Jordan
Iran, Islamic Rep.
Tunisia
Bangladesh
Sri Lanka
India
Pakistan
Bhutan
Nepal
Madagascar
Togo
Malawi
EthiopiaSenegal
NigeriaM
auritiusM
aliM
auritaniaTanzania
Uganda
South AfricaRw
andaCongo, Rep.
Congo, Dem
. Rep.
–5%
0%
5%
10%

G L O B A L M O N I T O R I N G R E P O R T 2 0 1 5 / 2 0 1 6 O V E R V I E W 7
and in the other it is very deep. Similarly, a country may be successful in lifting its poor-est citizens—the poorest of the poor—from abject poverty to a level just below the pov-erty line. Such improvement would not show up in a poverty headcount measure. Measures that account for depth, such as the “poverty gap” (shortfall from the poverty line), are not as simple to grasp as headcount measures. To make “depth” a more central element of pol-icy formulation, easy-to-communicate mea-sures are needed—and this report attempts a step in this direction with the new “person-equivalent” approach. It finds that, in person-equivalent terms (a benchmark poor person with a typical income shortfall), the pov-erty headcount ratio in Sub-Saharan Africa for 2012 rises from 42.6 to 46.3 percent, whereas that for South Asia falls from 18.8 to 10.5 percent.
With extreme poverty on the decline glob-ally, a second key challenge is the unevenness
in shared prosperity for the B40. The B40 may include many possible populations. Among developing regions, the income of the richest person among the B40 makes that person either extremely or moderately poor, particularly in Sub-Saharan Africa and parts of East Asia, or vulnerable, primarily in Latin America and the Caribbean and parts of Europe and Central Asia (Map O.1). In coun-tries where reducing poverty and vulnerability is key, the shared prosperity focus on the B40 thus enhances that focus. Among richer coun-tries, the B40 may encompass the relatively poor. Promoting healthy B40 income growth represents an ongoing challenge, as well as an opportunity to make the development process more inclusive and socially sustainable.
In many countries, stepped-up effort is needed to sustainably build shared prosper-ity. The latest comparable household data points to a decline in the growth of B40 incomes over the period circa 2007−12. Half
MAP O.1 The income of the richest person in the bottom 40 percent differs greatly across countries
Source: PovcalNet 2015.Note: Based on the $1.25 poverty line and 2005 purchasing power parity (PPP) prices, as full distributional data using 2011 PPP pricees was not yet available.
IBRD 41778
AUGUST 2015
Extreme poor (< $1.25 a day)
Moderate poor ($1.25–$4 a day)
Vulnerable ($4–$10 a day)
Middle class and rich (> $10 a day)
No dataThis map was produced by the Map Design Unit of The World Bank.The boundaries, colors, denominations and any other informationshown on this map do not imply, on the part of The World BankGroup, any judgment on the legal status of any territory, or anyendorsement or acceptance of such boundaries.
GSDPMMap Design Unit
Income distribution, 2011

8 O V E R V I E W G L O B A L M O N I T O R I N G R E P O R T 2 0 1 5 / 2 0 1 6
of the high-income countries and more than a third of low-income countries saw an actual outright decline in B40 incomes. The United States saw a decline in B40 incomes during the 2000s, perpetuating a trend of rising inequality between B40 and the rest of the population—a trend observed in several other high-income countries and exacerbated by the global financial crisis. Indeed, compared with the earlier period circa 2006−11—as reported in Global Monitoring Report 2014/2015—the latest shared prosperity data suggest a significant deterioration. For countries with consistent time series, average B40 income growth slowed from 4.6 to 2.9 percent, whereas average income growth for the entire population declined from 3.0 to 1.7 percent.
A third key challenge relates to the per-sistent disparities in the non-income dimen-sions of development. Compared with the MDG goal on income poverty, non-income goals saw more mixed success. Progress fell particularly short for targets related to health (maternal and infant mortality), nutrition (undernourishment and hunger), and sani-tation (Kenny and Dykstra 2013). Close to one-fifth of all children under five remain undernourished, and some 860 million people continue to live in slums. Access to primary school education and literacy rates have improved, yet the quality of education remains a concern. Moreover, while the tide has turned on the incidence of major deadly diseases, a high number of preventable deaths persist. With the development of new medi-cines, human immunodeficiency virus (HIV) patients receiving treatment have nearly the same life expectancy as those without HIV. However, three-fifths of those people living with HIV, mostly in developing countries, lack access to antiretroviral drugs. Tubercu-losis killed 1.5 million people in 2013, many in the prime of their productive lives. An esti-mated 198 million cases of malaria were reg-istered in 2013, claiming the lives of about 453,000 children.
In addition, little progress has been made in improving the long-term environmen-tal sustainability of development. Although some countries have successfully “delinked”
trends in environmental degradation from growth, most have not. The cost of environ-mental degradation—externalities associated with outdoor and indoor air pollution, water pollution, deforestation, carbon emissions, and other environmental hazards—rose 50 percent during 1990−2010. Furthermore, in 2013, over 5 billion people in developing countries were breathing polluted air with concentrations of particulate matter (PM) 2.5 in excess of the guideline levels recommended by the World Health Organization, up 42 percent since 1990 (Brauer et al. 2015). In 2010, between 11 and 21 percent of all deaths in developing countries were the result of pollution and other environmental risk factors. Only about 25 percent of the coun-tries in the world, primarily high-income countries, have managed to grow economi-cally while simultaneously decreasing their environmental externalities. Even fewer have managed to delink carbon emissions from growth, challenging the world’s ability to contain the impacts of future climate change to agreed-upon levels of acceptability.
To sustainably end extreme poverty and promote shared prosperity, more attention is needed to the non-income dimensions of development. First, to “end poverty in all of its forms everywhere,” it must be recognized that poverty is multidimensional. Income poverty is typically accompanied by inadequate access to education, health, housing, employment, and personal security—areas where improve-ments would increase the chances for escaping poverty. Second, the B40 consistently under-perform in non-income dimensions. Children from B40 households are more likely to die before age five than children in the top 60 percent (T60) households and are also more likely to be underweight. Access to improved water sources (piped water) and technol-ogy (the Internet) is uneven, too. Despite rising enrollment rates in poorer countries, access to primary education remains inequi-tably low. Third, greater efforts are needed to monitor the sustainability of development progress in its economic, environmental, and social aspects. Environmental sustainabil-ity concerns, particularly regarding natural

G L O B A L M O N I T O R I N G R E P O R T 2 0 1 5 / 2 0 1 6 O V E R V I E W 9
resources, environmental health, and ecosys-tem sustainability, need to enter more fully into economic decision making.
Amid an uncertain outlook, stronger effort is needed to grow, invest, and insure
Sustained economic growth has been the key building block of poverty reduction and shared prosperity during the MDG era. After the launch of the MDGs in 2000 until the global financial crisis in 2009, developing economies grew on average by 6.6 percent a year, compared with just over 2 percent a year in advanced economies. Even during the depth of the financial crisis and its immedi-ate aftermath, developing economies grew by 5.5 percent, while advanced economies stalled. Moreover, this strong economic expansion was accompanied by greater income convergence. The global Gini coef-ficient—a measure of inequality in income distribution—declined. The global per cap-ita distribution of income exhibited greater global income convergence during 2000−15, in part thanks to rapid income growth in major economies like China and India.
Economic growth is expected to be less buoyant in the period ahead. Global growth is expected to trend down somewhat in 2016–30 relative to the MDG period. This slowing may reflect weaker levels of invest-ment and the gradually diminishing growth dividends from information and communi-cation technology. Moreover, demographic trends in major advanced and emerging markets could be a drag on economy-wide growth—even if they also present significant opportunities to raise living standards. Lower growth prospects threaten the income conver-gence of developing and high-income econo-mies. Developing economies require strong growth to support the hard-won gains of the MDG era. Looking ahead, a number of risks remain as geopolitical tensions, the tightening of financial conditions, and lower commodity prices present sources of uncertainty.
Economic growth may not transmit into poverty reduction as easily as in the past.
First, with global poverty at 37.1 percent in 1990, many poor people were just below the poverty line, leading to a large percent-age point reduction in poverty for a given (distribution-neutral) increase in household income growth. Now that the headline rate is 12.8 percent (latest most reliable estimate for 2012), the same distribution-neutral increase in GDP is unlikely to produce as much poverty reduction since comparatively more people will be situated in the lower end of the income distribution. Second, the deepest pockets of poverty may be less readily reached through growth as many of the remaining poor live in narrowly diversified natural-resource-based economies and fragile and conflict-affected states. Poverty is less responsive to growth in such economies because the availability of jobs—the main channel through which growth uplifts the poor—is more limited. Capital-intensive, natural-resource sectors may generate growth but are likely to have weaker linkages to job creation.
Given the unfinished agenda and the uncertain outlook, additional efforts are needed to promote broad-based growth, investment in people, and insurance against risks. These three priorities require a strategy that promotes competitive economies and stable business environments, thus ensur-ing broad-based growth and income-earning opportunities to benefit the poor and the B40. Investment in human development is needed to tackle non-income deprivations and inequalities of opportunity so that these same groups can gain the capacity to benefit from and contribute to economic growth and pros-perity (Fryer and Levitt 2004; Paxson and Schady 2007). And robust insurance mecha-nisms are required so that people—although not necessarily jobs, firms, or industries—are protected against evolving risks for individu-als, nations, and the world, all in the spirit of nurturing a competitive economy and foster-ing an inclusive society.
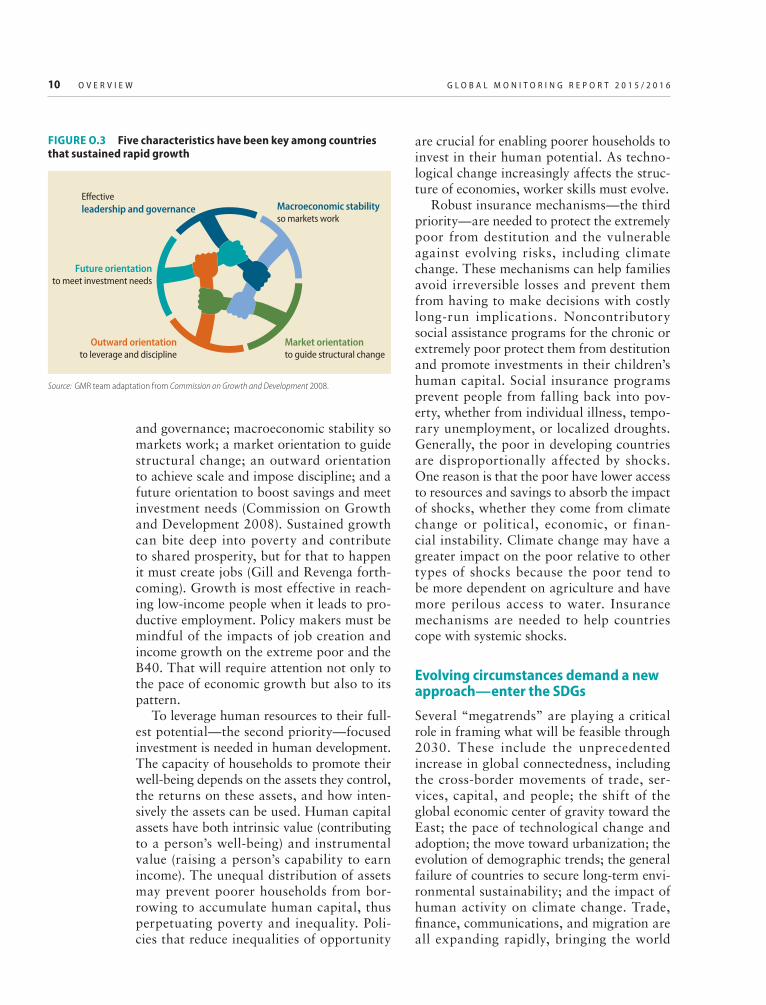
An environment that fosters sustain-able growth—the first big priority—is com-plex. Among economies that have sustained growth for extended periods, five character-istics are key (figure O.3): effective leadership
10 O V E R V I E W G L O B A L M O N I T O R I N G R E P O R T 2 0 1 5 / 2 0 1 6
and governance; macroeconomic stability so markets work; a market orientation to guide structural change; an outward orientation to achieve scale and impose discipline; and a future orientation to boost savings and meet investment needs (Commission on Growth and Development 2008). Sustained growth can bite deep into poverty and contribute to shared prosperity, but for that to happen it must create jobs (Gill and Revenga forth-coming). Growth is most effective in reach-ing low-income people when it leads to pro-ductive employment. Policy makers must be mindful of the impacts of job creation and income growth on the extreme poor and the B40. That will require attention not only to the pace of economic growth but also to its pattern.
To leverage human resources to their full-est potential—the second priority—focused investment is needed in human development. The capacity of households to promote their well-being depends on the assets they control, the returns on these assets, and how inten-sively the assets can be used. Human capital assets have both intrinsic value (contributing to a person’s well-being) and instrumental value (raising a person’s capability to earn income). The unequal distribution of assets may prevent poorer households from bor-rowing to accumulate human capital, thus perpetuating poverty and inequality. Poli-cies that reduce inequalities of opportunity
are crucial for enabling poorer households to invest in their human potential. As techno-logical change increasingly affects the struc-ture of economies, worker skills must evolve.
Robust insurance mechanisms—the third priority—are needed to protect the extremely poor from destitution and the vulnerable against evolving risks, including climate change. These mechanisms can help families avoid irreversible losses and prevent them from having to make decisions with costly long-run implications. Noncontributory social assistance programs for the chronic or extremely poor protect them from destitution and promote investments in their children’s human capital. Social insurance programs prevent people from falling back into pov-erty, whether from individual illness, tempo-rary unemployment, or localized droughts. Generally, the poor in developing countries are disproportionally affected by shocks. One reason is that the poor have lower access to resources and savings to absorb the impact of shocks, whether they come from climate change or political, economic, or finan-cial instability. Climate change may have a greater impact on the poor relative to other types of shocks because the poor tend to be more dependent on agriculture and have more perilous access to water. Insurance mechanisms are needed to help countries cope with systemic shocks.
Evolving circumstances demand a new approach—enter the SDGs
Several “megatrends” are playing a critical role in framing what will be feasible through 2030. These include the unprecedented increase in global connectedness, including the cross-border movements of trade, ser-vices, capital, and people; the shift of the global economic center of gravity toward the East; the pace of technological change and adoption; the move toward urbanization; the evolution of demographic trends; the general failure of countries to secure long-term envi-ronmental sustainability; and the impact of human activity on climate change. Trade, finance, communications, and migration are all expanding rapidly, bringing the world
FIGURE O.3 Five characteristics have been key among countries that sustained rapid growth
Source: GMR team adaptation from Commission on Growth and Development 2008.
Effectiveleadership and governance
Future orientationto meet investment needs
Outward orientationto leverage and discipline
Market orientationto guide structural change
Macroeconomic stabilityso markets work

G L O B A L M O N I T O R I N G R E P O R T 2 0 1 5 / 2 0 1 6 O V E R V I E W 11
closer together and increasing economic inte-gration (figure O.4).
These megatrends may help or hinder efforts to reach the development goals. On the positive side, the shift in the global eco-nomic center of gravity to developing coun-tries creates opportunities. The deepening of global trade and investment connections could help reverse slipping potential growth in some countries, and technological change is also proving to be a driver of productivity growth. On the other hand, increased con-nectedness permits the rapid spreading of economic crises in one country to the rest of the world. Urbanization is associated with economic growth, but it can also give rise to urban slums and environmental damage. Lower fertility rates reflect improved health and labor market opportunities for women, yet falling shares of the working-age popula-tion can produce headwinds to growth and put the fiscal sustainability of many public services at risk.
Cognizant of these trends, the SDGs rep-resent a greater level of ambition and a more holistic vision of sustainable development. By shifting focus to quality, the SDGs seek to address the unfinished agenda and scale
up impact. The SDGs recognize that collec-tive action is needed to address global chal-lenges such as the need for more resilient international financial systems, the sharing of transboundary resources, and, most urgently, slowing and coping with climate change. Meeting the SDG investment needs requires a shift from “billions” in official develop-ment assistance to “trillions” in investments to unlock, leverage, and catalyze domestic public resources and private capital flows. The SDGs need to be pursued in a changing world, with new opportunities and challenges brought by evolving global megatrends that shape development prospects. A central chal-lenge in this respect is demographic change.
The SDGs recognize the interconnections between development objectives. There are important interactions between development goals, and they cannot be effectively pursued separately from each other. For example, progress on health goals depends on invest-ments in infrastructure that provides access to safe water and improved sanitation. Simi-larly, limiting carbon monoxide (CO2) emis-sions to slow global warming requires the modernization of energy supplies. Hence, the SDGs explicitly articulate goals that are
FIGURE O.4 Communication and trade are increasing global economic integration
Source: Kose and Ozturk 2014.Note: Trade integration reflects ratio of total imports and exports to global GDP. Financial integration is the ratio of total fi nancial in-flows and out-flows (including bank loans, direct investment, bonds, and equities) to global GDP.
Source: World Bank’s World Development Indicators.
0
20
40
60
80
100
1980 1984 1988 1992 1996 2000 2004 2008 2012
InternetMobile phone
a. Global trade and finance are now more integrated b. Internet and mobile phone use is skyrocketing
1965–74
1975–84
1985–94
1995–2004
2005–14
Shar
e of
use
rs in
glo
bal p
opul
atio
n (%
)
0
20
40
60
80
120
Shar
e of
GD
P (%
)
Trade integration Financial integration
100

12 O V E R V I E W G L O B A L M O N I T O R I N G R E P O R T 2 0 1 5 / 2 0 1 6
“integrated and indivisible and balance the three dimensions of sustainable development: the economic, social, and environmental.” (UN 2015f, 3.) The breadth of the SDGs has raised questions about whether the scale of the agenda will dilute focus, especially when some development exigencies are likely to be more pressing than others at the country level. Still, the SDGs are not simply a menu of development objectives, and policy mak-ers and other stakeholders are called upon to pursue the goals as an integrated whole.
The World Bank Group (WBG) supports the 2030 agenda for sustainable development. In 2013, the WBG established clear goals to guide its own work: to end extreme poverty globally by 2030, promote shared prosperity in every country, and to do so in ways that sustainably secure the future of the planet and its resources, promote social inclusion, and limit the economic burdens that future generations inherit. These goals, conceptu-ally and in practice, are fully aligned with the SDGs: end poverty, promote prosperity, and improve people’s well-being while protecting the environment. The WBG is committed to partnering closely with its client governments and its development partners to further the 2030 agenda. Building on and learning from the experience of the MDGs, the WBG will help to secure financing; help to deliver devel-opment solutions at the country, regional, and global levels; and work with partners to help convene, connect, and coordinate.
The International Monetary Fund (IMF) actively participated in the debate on the new global development agenda and it is strongly committed, within the scope of its mandate, to support the SDGs. The IMF will help member countries achieve the SDGs by providing advice on strengthening macro-economic policies, technical assistance on building capacity, and resources to boost eco-nomic resilience against adverse shocks. New IMF initiatives in support of member coun-tries’ development efforts include enhanc-ing support for countries building domestic capacity in tax policy and administration; expanding assistance, through a package of tools, for countries seeking to address large
infrastructure gaps without imperiling public debt sustainability; increasing access to IMF concessional resources to provide countries with a wider safety net should they encounter balance of payments pressures; and strength-ening the effectiveness of the Fund’s engage-ment with countries in post-conflict and fragile situations. The IMF is also deepening its focus on aspects of economic, social, and gender inclusion and environmental protec-tion, which are core SDG objectives.
Part II: Development in an era of demographic change
Global demography is at a turning point
The world population is growing more slowly and aging at unprecedented speed. While the global population has tripled since the post-war “baby boom” era (figure O.5a), popula-tion growth is now slowing markedly (figure O.5b). After increasing for five decades, the proportion of people ages 15 to 64—the typi-cal working-age population—reached a peak in 2012 and is now starting to fall (figure O.5c). The rise in the share of dependents is driven mainly by an increase in the share of elderly (figure O.5d). These global trends—slower population growth and population aging—have been shaped by a steady decline in fertility rates and a rapid improvement in life expectancy. In the 1950s total fertility rates were more than 5 births per woman, but since then they have steadily declined to 2.45 births per woman in 2015. A further decline is projected through 2050. In paral-lel, average life expectancy at birth has risen from 47 years in 1950 to 72 years in 2015, while infant mortality has declined. The coming decades are expected to see further improvements in life expectancy, although at a slower pace than in the past.
Global population dynamics are driven mainly by the demographic transition in developing countries. Falling mortality rates and still-high fertility led to a “child bulge” in developing countries in the 1960s and 1970s, while population growth slowed in high-income countries. In most developing

G L O B A L M O N I T O R I N G R E P O R T 2 0 1 5 / 2 0 1 6 O V E R V I E W 13
FIGURE O.5 Global demography is at a turning point: Slower growth, unprecedented aging
Source: World Bank calculations, based on data from UN 2015.
Glob
al p
opul
atio
n (b
illio
ns)
0
1
2
3
4
5
6
7
8
9
10
1950 1970 1990 2010 2030 20500
0.5
1.0
1.5
2.0
2.5
1950 1960 1970 1980 1990 2000 2010 2020 2030 2040 2050
b. An unprecedented period of globalpopulation growth has ended
Annu
al g
loba
l pop
ulat
ion
grow
th ra
te (%
)
a. The global population has tripled since the 1950sand is expected to reach over 9 billion by 2050
1950 1970 1990 2010 2030 2050 1950 1970 1990 2010 2030 205050
55
60
65
70
c. The working-age share of the global population is estimated to have peaked in 2012
Shar
e of
glo
bal p
opul
atio
n, a
ges 1
5–64
(%)
d. The aged share of the global populationis rising, while the child share is falling
0
5
10
15
20
25
30
35
40
Children ages 0–14 Adults ages 65+
Shar
e of
glo
bal p
opul
atio
n (%
)
e. Total fertility rates have declined, though less so in Sub-Saharan Africa
f. Half of global population growth between 2015 and2050 will be in Sub-Saharan Africa
0
1
2
3
4
5
6
7
Num
ber o
f birt
hs p
er w
oman
1950 20502015
High-income
countries
East Asiaand
Pacific
Europeand
CentralAsia
LatinAmericaand the
Caribbean
MiddleEast and
NorthAfrica
Sub-Saharan
Africa
SouthAsia
60
50
40
30
20
10
0Shar
e of
glo
bal p
opul
atio
n gr
owth
(%)
1950–2015 2015–50
High-income
countries
East Asia and
Pacific
Europeand
CentralAsia
LatinAmericaand the
Caribbean
MiddleEast and
North Africa
Sub-Saharan
Africa
SouthAsia
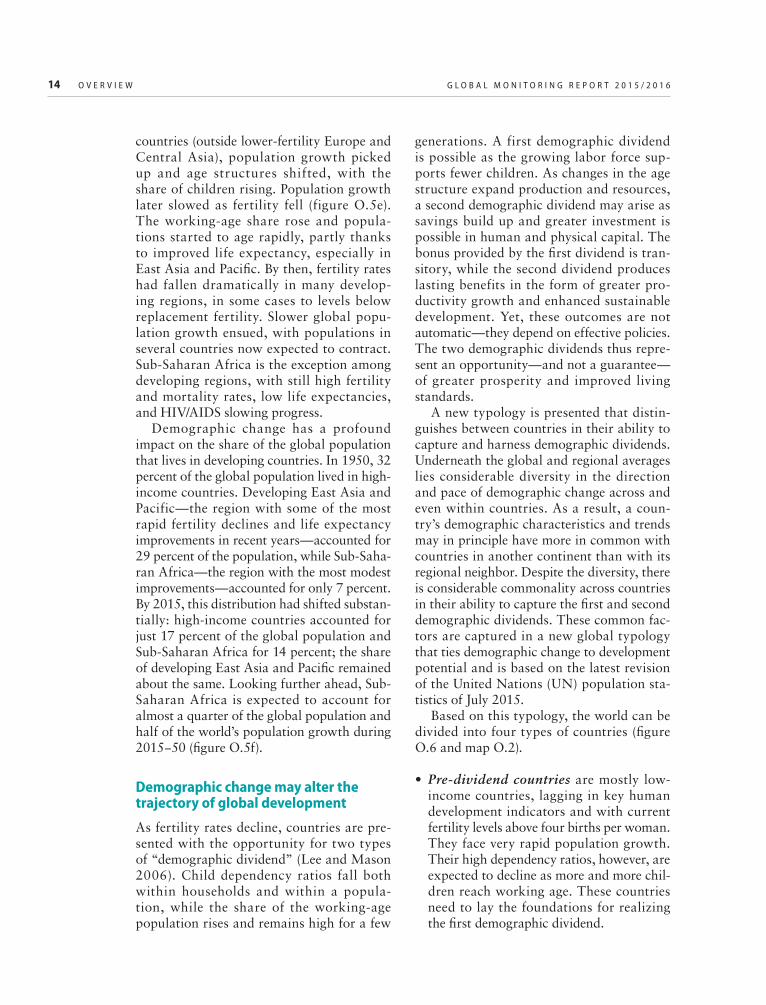
14 O V E R V I E W G L O B A L M O N I T O R I N G R E P O R T 2 0 1 5 / 2 0 1 6
countries (outside lower-fertility Europe and Central Asia), population growth picked up and age structures shifted, with the share of children rising. Population growth later slowed as fertility fell (figure O.5e). The working-age share rose and popula-tions started to age rapidly, partly thanks to improved life expectancy, especially in East Asia and Pacific. By then, fertility rates had fallen dramatically in many develop-ing regions, in some cases to levels below replacement fertility. Slower global popu-lation growth ensued, with populations in several countries now expected to contract. Sub-Saharan Africa is the exception among developing regions, with still high fertility and mortality rates, low life expectancies, and HIV/AIDS slowing progress.
Demographic change has a profound impact on the share of the global population that lives in developing countries. In 1950, 32 percent of the global population lived in high-income countries. Developing East Asia and Pacific—the region with some of the most rapid fertility declines and life expectancy improvements in recent years—accounted for 29 percent of the population, while Sub-Saha-ran Africa—the region with the most modest improvements—accounted for only 7 percent. By 2015, this distribution had shifted substan-tially: high-income countries accounted for just 17 percent of the global population and Sub-Saharan Africa for 14 percent; the share of developing East Asia and Pacific remained about the same. Looking further ahead, Sub-Saharan Africa is expected to account for almost a quarter of the global population and half of the world’s population growth during 2015−50 (figure O.5f).
Demographic change may alter the trajectory of global development
As fertility rates decline, countries are pre-sented with the opportunity for two types of “demographic dividend” (Lee and Mason 2006). Child dependency ratios fall both within households and within a popula-tion, while the share of the working-age population rises and remains high for a few
generations. A first demographic dividend is possible as the growing labor force sup-ports fewer children. As changes in the age structure expand production and resources, a second demographic dividend may arise as savings build up and greater investment is possible in human and physical capital. The bonus provided by the first dividend is tran-sitory, while the second dividend produces lasting benefits in the form of greater pro-ductivity growth and enhanced sustainable development. Yet, these outcomes are not automatic—they depend on effective policies. The two demographic dividends thus repre-sent an opportunity—and not a guarantee—of greater prosperity and improved living standards.
A new typology is presented that distin-guishes between countries in their ability to capture and harness demographic dividends. Underneath the global and regional averages lies considerable diversity in the direction and pace of demographic change across and even within countries. As a result, a coun-try’s demographic characteristics and trends may in principle have more in common with countries in another continent than with its regional neighbor. Despite the diversity, there is considerable commonality across countries in their ability to capture the first and second demographic dividends. These common fac-tors are captured in a new global typology that ties demographic change to development potential and is based on the latest revision of the United Nations (UN) population sta-tistics of July 2015.
Based on this typology, the world can be divided into four types of countries (figure O.6 and map O.2).
Pre-dividend countries are mostly low-income countries, lagging in key human development indicators and with current fertility levels above four births per woman. They face very rapid population growth. Their high dependency ratios, however, are expected to decline as more and more chil-dren reach working age. These countries need to lay the foundations for realizing the first demographic dividend.

G L O B A L M O N I T O R I N G R E P O R T 2 0 1 5 / 2 0 1 6 O V E R V I E W 15
au: [Not a sentence]
MAP O.2 The world through the lens of demography
Source: World Bank calculations, based on data from UN 2015.
IBRD 41666
AUGUST 2015
Pre-dividend
Early-dividend
Late-dividend
Post-dividend
No dataThis map was produced by the Map Design Unit of The World Bank.The boundaries, colors, denominations and any other informationshown on this map do not imply, on the part of The World BankGroup, any judgment on the legal status of any territory, or anyendorsement or acceptance of such boundaries.
GSDPMMap Design Unit
Demographic characteristics
FIGURE O.6 Most of the global population lives in early- and late-dividend countries
Source: World Bank calculations, based on data from UN 2015.Note: Classifications are based on World Bank Group classifications.
Low-income countries
Upper-middle-income countriesLower-middle-income countries
High-income countries
0
5
10
15
20
25
30
35
40
45
Pre-dividendcountries
Early-dividendcountries
Late-dividendcountries
Post-dividendcountries
Shar
e of
glo
bal p
opul
atio
n, 2
015
(%)
Early-dividend countries are mostly lower-middle-income countries further along the fertility transition. Fertility rates have fallen below four births per woman and the working-age share of the popula-tion is likely rising considerably. These countries need to focus on capturing the first demographic dividend and laying the foundations for realizing the second demo-graphic dividend.
Late-dividend countries are mostly upper-middle-income countries where fertility rates are typically above replacement levels of 2.1 births per woman, but fertility con-tinues to decline. Even though they have shrinking working-age shares, their overall age structures are still favorable for the first demographic dividend. However, they are experiencing very rapid aging, so reaping the second demographic dividend is crucial.
Post-dividend countries are mostly high-income countries where fertility has

16 O V E R V I E W G L O B A L M O N I T O R I N G R E P O R T 2 0 1 5 / 2 0 1 6
transitioned below replacement levels. These countries continue to see shrinking working-age shares and have some of the highest shares of elderly in the world. While they are past the point of additional ben-efits from the first demographic dividend, they can still reap the second dividend from rising savings and investments.
The development characteristics among these demographic types vary consider-ably, particularly among the pre- and early- dividend countries. Development successes are found mostly in countries with falling population growth, rising life expectancy, and declining infant mortality and fertility rates (figure O.7). Unfortunately, fewer than one-fifth of pre-dividend countries and only a quarter of early-dividend countries were able to reduce under-five child mortality rates by three-fourths in 1990–2011. Urbanization, which can play a role in reducing poverty, has been slow in pre-dividend countries and has not necessarily provided improved access to services. In these countries, less than one-fourth of the population lives in urban areas, more than two-thirds of which live in slums. In contrast, early-dividend countries urban-ized rapidly, almost doubling the urban share
to half over the period, with roughly one-third living in urban slums. Education is another factor. Whereas lower secondary education completion rates are 72 percent for early- dividend countries, they are just half of that in pre-dividend countries. This disparity poses a challenge in the face of continued rapid population growth.
Pre- and early-dividend countries cur-rently account for about 90 percent of global poverty (figure O.8). In pre-dividend coun-tries, almost half the population lives below the poverty line. Although early-dividend countries have a much lower poverty rate, they still account for half of the global poor, largely because this group includes Bangla-desh and India. Many pre-dividend countries have managed to reduce poverty headcount rates, but rapid population growth has lim-ited the reduction in the number of the poor. While poverty is dominated by pre- and early-dividend countries, it should not be ignored in late-dividend countries like China, which accounts for a tenth of global poverty.
Late-dividend countries are experiencing demographic change at a much faster pace
FIGURE O.7 Countries are at different stages in the demographic transition
Source: World Bank calculations based on data from UN 2015.Note: The total fertility rate is the average number of births a woman in a given country has, assuming she lives to the end of her reproductive life.
Life expectancy (years)
Pre-dividend countries Early-dividend countriesLate-dividend countries Post-dividend countries
Tota
l fer
tility
rate
(num
ber o
f chi
ldre
n)
0
1
2
3
4
5
6
8
7
9
45 55 65 75 85
FIGURE O.8 Pre-dividend and early-dividend countries account for most of global poverty
Source: World Bank calculations.Note: Data are for 2012 and are based on a poverty line of $1.90 a day and 2011 purchasing power prices. The average poverty headcount rate is the unweighted average across countries in a given group.
0
10
20
30
40
50
60
Pre-dividendcountries
Early-dividendcountries
Late-dividendcountries
Average poverty headcount rate Share of global poverty
Perc
ent

G L O B A L M O N I T O R I N G R E P O R T 2 0 1 5 / 2 0 1 6 O V E R V I E W 17
than many post-dividend countries, poten-tially resulting in headwinds to economic growth. In the 1950s, late-dividend countries had double the fertility rates of post-dividend countries, and life expectancies were shorter by nine years. Since then, late-dividend countries have made substantial improve-ments in these metrics, with extremely rapid improvements in life expectancy. As a result, late-dividend countries will have the same age structure as post-dividend countries by 2050. These trends are likely to present chal-lenges to growth. The ongoing demographic changes are likely to further dampen the growth engine in these economies, particu-larly in the absence of policy adjustments.
Post-dividend countries’ contributions to global growth have also been slowing, with potential spillovers for other countries. These countries accounted for 42 percent of global GDP growth between 2000 and 2014, and 60 percent of global economic activity in 2014 (figure O.9). Post-dividend economies are also the major export destina-tions for early- and pre-dividend countries and account for two-thirds of global import demand. If growth in post-dividend coun-tries slows, early- and pre-dividend countries will need to find alternative export markets. Also, as post-dividend economies age, their national savings rate is expected to fall, lead-ing to a possible slowdown in capital flows to the rest of the world.
Effective policies can leverage demographic change within countries
Demographic dynamics can support develop-ment if governments implement demography-informed policies (table O.2). Countries mov-ing from high to low fertility can benefit from a growing working-age population share. These countries have the potential to realize the first and second demographic dividends, which are beneficial to poverty reduction and shared prosperity as well as to overall growth and development. Half of the world’s popula-tion—and most of the world’s poor—live in countries where the working-age population share is rising. Whether a rising working-age
share is beneficial depends on the extent to which governments ensure that policies and institutions take advantage of these trends. The other half of the world’s population lives in countries where populations are aging and working-age shares are dwindling. In these countries, policies will need to be adapted to demographic change. Demographically informed policies can cover a wide range of areas, including human, private sector, and financial development, as well as improved governance. To be sure, demographic change is neither universally good nor bad, and presents opportunities as well as challenges everywhere. Policies can make a critical dif-ference in tilting the impact of demographic change in favor of the development goals.
Navigating these dynamics requires sound policies that are tailored to a country’s demo-graphic context. In pre-dividend countries, policies need to spark demographic transi-tion by addressing human development chal-lenges and speeding up the decline in fertility needed to raise the working-age population share and boost economic growth. In early-dividend countries, the priority is to acceler-ate job creation by investing in human capi-tal and ensuring an enabling environment for private sector development to help realize
FIGURE O.9 Aging countries accounted for most of global growth during 2000−14
Sources: World Bank calculations, based on data from UN 2015 and World Bank’s World Development Indicators.
0
10
20
30
40
50
60
Pre-dividend countries
Early-dividend countries
Late-dividend countries
Low-income countries Lower-middle-income countries
Upper-middle-income countries High-income countries
Post-dividend countries
Cont
ribut
ions
to g
loba
l GD
P gr
owth
(%)
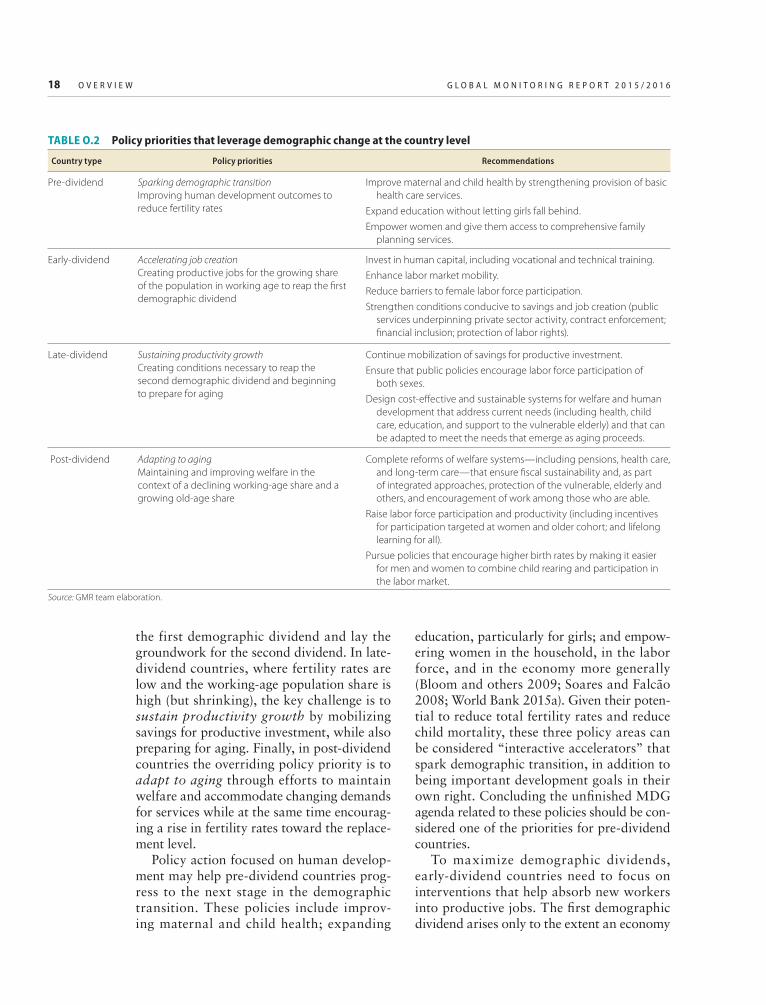
18 O V E R V I E W G L O B A L M O N I T O R I N G R E P O R T 2 0 1 5 / 2 0 1 6
the first demographic dividend and lay the groundwork for the second dividend. In late-dividend countries, where fertility rates are low and the working-age population share is high (but shrinking), the key challenge is to sustain productivity growth by mobilizing savings for productive investment, while also preparing for aging. Finally, in post-dividend countries the overriding policy priority is to adapt to aging through efforts to maintain welfare and accommodate changing demands for services while at the same time encourag-ing a rise in fertility rates toward the replace-ment level.
Policy action focused on human develop-ment may help pre-dividend countries prog-ress to the next stage in the demographic transition. These policies include improv-ing maternal and child health; expanding
education, particularly for girls; and empow-ering women in the household, in the labor force, and in the economy more generally (Bloom and others 2009; Soares and Falcão 2008; World Bank 2015a). Given their poten-tial to reduce total fertility rates and reduce child mortality, these three policy areas can be considered “interactive accelerators” that spark demographic transition, in addition to being important development goals in their own right. Concluding the unfinished MDG agenda related to these policies should be con-sidered one of the priorities for pre-dividend countries.
To maximize demographic dividends, early-dividend countries need to focus on interventions that help absorb new workers into productive jobs. The first demographic dividend arises only to the extent an economy
TABLE O.2 Policy priorities that leverage demographic change at the country level
Country type Policy priorities Recommendations
Pre-dividend Sparking demographic transition Improving human development outcomes to reduce fertility rates
Improve maternal and child health by strengthening provision of basic health care services.
Expand education without letting girls fall behind.
Empower women and give them access to comprehensive family planning services.
Early-dividend Accelerating job creationCreating productive jobs for the growing share of the population in working age to reap the first demographic dividend
Invest in human capital, including vocational and technical training.
Enhance labor market mobility.
Reduce barriers to female labor force participation.
Strengthen conditions conducive to savings and job creation (public services underpinning private sector activity, contract enforcement; financial inclusion; protection of labor rights).
Late-dividend Sustaining productivity growth Creating conditions necessary to reap the second demographic dividend and beginning to prepare for aging
Continue mobilization of savings for productive investment.
Ensure that public policies encourage labor force participation of both sexes.
Design cost-effective and sustainable systems for welfare and human development that address current needs (including health, child care, education, and support to the vulnerable elderly) and that can be adapted to meet the needs that emerge as aging proceeds.
Post-dividend Adapting to aging Maintaining and improving welfare in the context of a declining working-age share and a growing old-age share
Complete reforms of welfare systems—including pensions, health care, and long-term care—that ensure fiscal sustainability and, as part of integrated approaches, protection of the vulnerable, elderly and others, and encouragement of work among those who are able.
Raise labor force participation and productivity (including incentives for participation targeted at women and older cohort; and lifelong learning for all).
Pursue policies that encourage higher birth rates by making it easier for men and women to combine child rearing and participation in the labor market.
Source: GMR team elaboration.

G L O B A L M O N I T O R I N G R E P O R T 2 0 1 5 / 2 0 1 6 O V E R V I E W 19
is able to create productive jobs for the grow-ing working-age population. In addition, early-dividend countries need to lay the foundation for the second demographic divi-dend. There is a need to accelerate job cre-ation, by ensuring that both the supply side (particularly human capital development) and the demand side (job-intensive eco-nomic growth) of job creation are sufficient to absorb the labor force across income lev-els (Fox and Sohnesen 2012; Lee and Mason 2006; Troiano 2015; World Bank 2013b). These policies would also include the removal of barriers to female labor force participa-tion, given persistent gender gaps in the labor market.
Late-dividend countries face the challenge of sustaining the first demographic dividend into the more durable second demographic dividend. How much of the second dividend these countries can realize will depend on the accumulation of physical and human capital. Capital accumulation is, in turn, affected by policies. For example, late-dividend countries need to implement sound financial sector pol-icies to help mobilize private savings in sup-port of investments. Given projected declines in the share of the population that is of work-ing age, a more capital-intensive development path is often needed to support growth. Poli-cies that encourage the geographic expansion of the financial sector and broaden access to banks and other intermediating institutions may help channel savings to investments in small and medium enterprises, as well as underserved regions.
In post-dividend countries, the challenge is to maintain and improve living standards in the face of shrinking labor supply and ris-ing proportions of the elderly. The decline in the working-age population share could be partly offset by family-friendly measures that facilitate a rebound in fertility rates to near replacement levels. Raising the labor force participation and employment prospects of older people will become increasingly press-ing as population aging progresses. A more inclusive labor market requires adequate incentives to sustain human capital invest-ment through the life cycle, more flexible
work arrangements, lifelong learning pro-grams, and improved incentives in the social protection systems to continue working in old age (Bussolo, Koettl, and Sinnott 2015).
In addition, adjustments to fiscal and social protection systems will generally be necessary to address the challenges posed by demographic changes in aging countries (par-ticularly those in the late- and post-dividend stages). Given the growing need for spending on the aged, tax increases may not be a viable option, in view of likely price distortions and disincentives. Governments should strive to enhance the efficiency and cost-effectiveness of overall and aging-related spending. Pen-sion reforms need to ensure a minimum level of protection for the vulnerable elderly. Low-ering coverage and adequacy of pension sys-tems may raise vulnerability among current and future elderly generations, whose private savings are limited. Pension systems, health care, and long-term care will have to be put on fiscally sustainable paths without neglect-ing the social safety nets that all those ser-vices represent (Bussolo, Koettl, and Sinnott 2015; World Bank 2015b). In particular, pop-ulation aging will naturally bring about an increase in pension and health expenditure.
Opportunities exist to arbitrage demographic diversity across countries
In pursuing their domestic agendas, countries can also arbitrage and in the process lever-age demographic change at the global level through cross-border capital flows, interna-tional migration, and global trade. Differences in the demographic dynamics at the coun-try level are producing important spillovers across countries, contributing to changes in comparative advantages underpinning trade, and in the returns earned by labor and capi-tal. These changes require the implementation of policies to support enhanced trade in goods and services as well as greater factor mobility. This would encourage labor-intensive produc-tion to shift from aging countries to younger societies or migration from countries with growing working-age populations to coun-tries where the number of workers is falling,

20 O V E R V I E W G L O B A L M O N I T O R I N G R E P O R T 2 0 1 5 / 2 0 1 6
thereby delivering non-tradable services such as elderly care (table O.3). International cooperation—in addition to domestic mea-sures—is needed on trade facilitation, legal
TABLE O.3 Policy priorities that leverage the differences in demographic change across countries
Area of focus Policy priorities Recommendations
International trade
Promoting foreign provision of education services to boost educational opportunities in countries with a high share of youths, or to facilitate lifelong learning for aging countries
Using foreign providers to meet demand for health services in aging countries
Supporting comparative advantage in producing labor-intensive products in labor-abundant countries
Ease visa requirements for the free flow of international students and academics; address qualification recognition issues; reduce limits on foreign ownership; and increase transparency of government education regulations
Address restrictions affecting the physical presence of foreign suppliers, foreign equity ceilings, or barriers on the movement of health care professionals across borders
Streamline customs, border and transit procedures; improve logistics and transport services and extend physical infrastructure; tackle remaining tariff and nontariff barriers on goods trade
Migration Promoting legal migration flows to counteract the decline in working-age populations in aging countries and to mitigate labor market pressures in labor-abundant countries
Reducing the burden of brain drain in sending countries
Formulate clear migration policies; enforce minimum wage laws; provide adequate information to migrants about their rights and obligations; facilitate their contribution to and benefits from social protection schemes and public services; sanction potential abuses by firms.
Develop comprehensive and targeted policies to retain, attract talent; encourage return migration.
International finance
Attracting international capital flows to young, labor-abundant countries
Addressing challenges posed by large and volatile capital flows to developing countries
Supporting opportunities for capital-abundant countries to increase returns and diversify investment portfolios
Create favorable investment climate; strengthen macroeconomic stability, the financial sector, and governance.
Undertake measures to relax investment barriers at the domestic, regional, and global level.
Introduce macroeconomic policies to address risks from volatile capital inflows, supervision, regulation, strong institutions.
Provide investment guarantees or technical assistance.
FIGURE O.10 Early-dividend countries are more specialized in labor-intensive exports
Source: World Bank calculations.
AgricultureNatural resources
Low-skilledmanufacturing
High-skilledmanufacturing
Low-skilled servicesHigh-skilled services
Shar
e of
exp
orts
by
sect
or, 2
015
(%)
0
20
40
60
80
100
Pre-dividendcountries
Early-dividendcountries
Late-dividendcountries
Post-dividendcountries
migration, and capital flows to ensure smooth adjustment to demographic change.
In coming decades, global trade flows are projected to continue shifting toward coun-tries earlier in their demographic transition, possibly yielding substantial benefits for poorer countries. Differences in demographic change may lead to comparative advantages that influence trade patterns. Countries with slower population growth tend to become more capital-abundant over time, while coun-tries with faster population growth become more labor-abundant (figure O.10). Trade can reduce poverty through faster growth, more economic diversification, and greater macroeconomic stability. It can also facilitate the technology transfers through knowledge embodied in goods and services production, boosting productivity and growth. Knowl-edge transfers from trade in health and edu-cation products and services, for instance, have contributed significantly to develop-ment, while medical imports are associated with lower mortality rates.
Source: GMR team elaboration.

G L O B A L M O N I T O R I N G R E P O R T 2 0 1 5 / 2 0 1 6 O V E R V I E W 21
Trade policy measures can be powerful tools in enabling countries to adapt to the opportunities and challenges in demographic change. Agricultural trade is still distorted by high tariffs, export subsidies, and domestic support. Although average tariffs on manu-factured goods have been declining over the years, substantial tariff and nontariff barri-ers still affect the free flow of goods between countries (UNCTAD 2013; WTO 2012). Reductions in those barriers, coupled with improving trade facilitation, could encour-age firms to relocate production to relatively more labor-abundant countries and allow developing countries to take full advantage of their growing labor forces. In pre- and early-dividend countries, additional trade facilita-tion measures may add to their comparative advantage in labor-intensive products and help create jobs. Trade can also help meet the demand for health services in aging countries and the demand for education services in young countries. Both health care and edu-cation are traded only lightly across borders due to high barriers, so liberalizing trade in those areas could potentially yield substantial benefits.
Migration can help countries’ adjust-ment to uneven demographic change. Given the generally high level of restrictions on the movement of people across borders, the potential gains from expanding legal and safe migration are large (Borgy and others 2010; Tyers and Shi 2007; Walmsley, Winters, and Ahmed 2011; World Bank 2006). Demo-graphic disparities can amplify those gains. While South–South migration flows have grown rapidly, substantial migration also takes place from younger developing countries to aging high-income countries (figure O.11). International migration flows can mitigate the decline in working-age population shares in aging countries. Younger immigrants can help ease the pressures of aging populations in late- and post-dividend countries, improve the growth prospects, and ensure the sustain-ability of public finances in destination coun-tries. But the impact of migration on both ori-gin and destination countries depends on the skills of migrants, and socio-political chal-lenges must be managed.
A wide range of policies could potentially foster legal migration, with benefits to both sending and receiving countries. In the past 10 years, many countries revised their migra-tion laws in response to changes in demog-raphy, labor market conditions, and political contexts (OECD 2013). Pre-departure orien-tation and training, protecting the rights and preventing the abuse of migrants, lowering remittance costs, and removing regulatory and bureaucratic barriers to return migration are all actions that can enhance the net devel-opment benefits. Migration not only benefits sending countries through remittances but also presents challenges (such as brain drains or “Dutch disease” effects), but these can be actively managed. Tackling the underlying push and pull factors of migration and tar-geting interventions to retain, attract, or reat-tract talent are essential.
Different trajectories of demographic change have important implications for capital flows. Countries early in their demo-graphic transition need to boost invest-ment, and those later in their transition must seek higher returns than may be available domestically. So demography can augment
FIGURE O.11 Post-dividend countries tend to receive the most migrants
Source: World Bank calculations, based on data from UN 2013.
Mig
rant
stoc
k by
des
tinat
ion,
201
3 (m
illio
ns)
0
20
40
60
80
100
120
140
To pre-dividendcountries
To early-dividendcountries
To late-dividendcountries
To post-dividendcountries
From pre-dividend countries From early-dividend countries From late-dividend countries From post-dividend countries

22 O V E R V I E W G L O B A L M O N I T O R I N G R E P O R T 2 0 1 5 / 2 0 1 6
the impetus for international capital flows. Facilitation of such flows would allow young, labor-abundant countries to attract much-needed capital. In the initial stages of the demographic transition, investment demand exceeds savings, stimulating current account deficits. The opposite tends to be true for countries in later stages of demographic transition. Capital flows could generate an increase in labor productivity and wages, contributing to faster growth in young, labor-abundant countries. For sending countries, increasing investment in young economies can provide opportunities to raise capital returns and diversify investment portfolios, especially if labor-abundant countries create favorable investment climates, ensure macroeconomic stability, deepen their financial sectors, and strengthen governance (World Bank 2013a).
Improving institutional quality and devel-oping the financial sector will attract capital flows to pre- and early-dividend countries. Countries early in their demographic transi-tion can promote foreign direct investment by reducing the economic, political, and legal risks facing investors. Host countries can relax investment barriers, such as caps on foreign ownership and requirements for joint ventures. Home countries can facili-tate outflows through investment guarantees and technical assistance. At the global level, reforms are needed to allow countries to take full advantage of international investment agreements, including by reforming invest-ment dispute settlements. Macroeconomic policies need to address risks from volatile capital inflows in tandem with sound finan-cial supervision and regulation. Minimum levels of financial and institutional develop-ment are needed to reduce the riskiness of financial liberalization (Sahay and others 2015). International regulatory coordination can bring bilateral and multilateral benefits, including by strengthening and institution-alizing swap lines that provide liquidity for non-key currencies.
* * *Strategies to sustainably end poverty and build shared prosperity need to keep
demography in mind as countries pursue broad-based growth, invest in human devel-opment, and insure against evolving risks. Each country’s demographic context mat-ters greatly in setting priorities in these three areas, defining the opportunities and chal-lenges for ending poverty and sharing pros-perity. The centers of global poverty need to spark the transition to lower fertility and accelerate development by taking advantage of demographic shifts and absorbing youth bulges in the labor market. The engines of global growth need to address headwinds to growth and adapt institutions and poli-cies to aging populations. Because the cen-ters of global poverty continue to face sig-nificant poverty reduction challenges and the engines of global growth are weakening, all countries must grasp the opportunities stem-ming from cross-border capital flows, inter-national migration, and global trade. With such strategies in place, the world stands a better chance of successfully ending extreme poverty by 2030 and lifting the well-being of lower-income people throughout the world.
References Borgy, V., X. Chojnicki, G. Le Garrec, and C.
Schwellnus. 2010. “Macroeconomic Conse-quences of Global Endogenous Migration: A General Equilibrium Analysis.” Annals of Economics and Statistics 97/98: 13–39.
Bloom, D. E., D. Canning, G. Fink, and J. E. Fin-lay. 2009. “Fertility, Female Labor Force Par-ticipation, and the Demographic Dividend.” Journal of Economic Growth 14 (2): 79–101.
Brauer M., G. Freedman, J. Frostad, A. van Donkelaar, R. V. Martin, F. Dentener, R. van Dingenen et al. 2015. “Ambient Air Pollution Exposure Estimation for the Global Burden of Disease 2013.” Paper submitted for publica-tion, Institute for Health Metrics and Evalua-tion, University of Washington, Seattle.
Bussolo, M., J. Koettl, and E. Sinnott. 2015. Golden Aging: Prospects for Healthy, Active, and Prosperous Aging in Europe and Central Asia. Washington, DC: World Bank.
Commission on Growth and Development. 2008. The Growth Report. Strategies for Sustained

G L O B A L M O N I T O R I N G R E P O R T 2 0 1 5 / 2 0 1 6 O V E R V I E W 23
Growth and Inclusive Development. Wash-ington, DC: World Bank.
Fox, L., and T. P. Sohnesen. 2012. “Household Enterprises in Sub-Saharan Africa: Why They Matter for Growth, Jobs, and Livelihoods.” Policy Research Working Paper 6184. World Bank, Washington, DC.
Fryer R. G., and S. D. Levitt. 2004. “Understand-ing the Black-White Test Score Gap in the First Two Years of School.” Review of Economics and Statistics 86 (2): 447–64.
Gill, I., and A. Revenga. Forthcoming. Grow, Invest, Insure—A Plan to End Poverty. Wash-ington, DC: World Bank.
Kenny, C., and S. Dykstra. 2013. “The Global Partnership for Development: A Review of MDG 8 and Proposals for the Post-2015 Devel-opment Agenda.” Policy Paper 026, Center for Global Development, Washington (July).
Kose, A. M., and E. O. Ozturk. 2014. “A World of Change: Taking Stock of the Past Half Cen-tury.” Finance and Development 51(3):6–11.
Lee, R., and A. Mason. 2006. “What Is the Demographic Dividend?” Finance and Devel-opment 43 (3).
OECD (Organisation for Economic Co-operation and Development). 2013. International Migra-tion Outlook 2013. Paris: OECD Publishing.
Paxson C., and N. Schady. 2007. “Cognitive Development among Young Children in Ecua-dor: The Roles of Wealth, Health, and Par-enting.” Journal of Human Resources 42 (1): 49–84.
Sahay, R., M. Cihák, P. N’Diaye, A. Barajas, S. Mitra, A. Kyobe, Y. N. Mooi, and S. Reza Yousefi. 2015. “Financial Inclusion: Can It Meet Multiple Macroeconomic Goals?” IMF Staff Discussion Note, International Monetary Fund, Washington, DC.
Soares, Rodrigo R., and B. L. S. Falcão. 2008. “The Demographic Transition and the Sexual Division of Labor.” Journal of Political Econ-omy 116 (6): 1058–104.
Troiano, S. 2015. “Population Dynamics and the Implications for Economic Growth, Poverty
and Inequality—What Is Relevant for South-ern Africa.” World Bank, Washington, DC.
Tyers R., and Q. Shi. 2007. “Demographic Change and Policy Responses: Implications for the Global Economy.” World Economy 30 (4): 537–66.
UN (United Nations). 2013. “Trends in Interna-tional Migrant Stock: Migrants by Destina-tion and Origin.” United Nations database, POP/DB/MIG/Stock/Rev.2013, Department of Economic and Social Affairs.
———. 2015. “Transforming our World: The 2030 Agenda for Sustainable Development.” United Nations, New York.
UNCTAD (United Nations Conference on Trade and Development). 2015. World Investment Report 2015: Reforming International Invest-ment Governance. Geneva: United Nations.
Walmsley, T. L., A. Winters, and S. A. Ahmed. 2011. “The Impact of the Movement of Labour: Results from a Model of Bilateral Migration Flows.” Global Economy Journal 11 (4).
World Bank. 2006. Global Economic Prospects 2006: Economic Implications of Remittances and Migration. Washington, DC: World Bank.
———. 2013a. Capital for the Future: Saving and Investment in an Interdependent World. Global Development Horizons. Washington, DC: World Bank.
———. 2013b. World Development Report: Jobs. Washington, DC: World Bank.
———. 2015a. From Potential to Reality: What Will It Take to Harness a Demographic Divi-dend in Africa? Washington, DC: World Bank.
———. 2015b. Live Long and Prosper: Aging in East Asia and the Pacific. Washington, DC: World Bank.
WTO (World Trade Organization). 2012. World Trade Report 2012: Trade and Public Poli-cies: A Closer Look at Non-Tariff Measures in the 21st Century. Geneva: World Trade Organization.
The Global Monitoring Report 2015/2016: Development Goals in an Era of Demographic Change details the progress toward
the global development goals and examines the impact of demographic change on achieving these goals.
Part I examines global development progress, the unfinished development agenda, and the policy opportunities ahead. The report assesses progress toward ending extreme poverty by 2030 and in promoting shared prosperity, and it outlines the measures necessary to scale up impact over the horizon of the Sustainable Development Goals.
The report unveils the new poverty line of $1.90 a day and provides updated estimates for the number of people living in extreme poverty, which shows further declines. In 2015 the global poverty rate is forecast to decline to 9.6 percent of the world’s population, the fi rst time it has reached single digits. At the same time, the report makes the case that the depth of remaining poverty, the unevenness in shared prosperity, and the persistent disparities in non-income dimensions of development call for urgent action.
Part II analyzes how profound demographic shifts could alter the course of global development. Global demography is at a turning
point: the world’s population is growing m ore slowly, while it is aging at an unprecedented rate. Within these broader global trends considerable diversity can be found across regions and countries. While the higher-income countries that drive global growth are rapidly aging, the lower-income countries comprising the centers of global poverty are much earlier in their demographic transition and continue to grapple with high fertility rates and rapid population growth.
Demographic changes bring both opportunity and risk; the report argues for demography-informed policy approaches to tilt demographic change in favor of achieving the development goals. With the right policies, demographic change can become one of the most consequential development opportunities of our time.
The Global Monitoring Report 2015/2016 is written jointly by the World Bank Group and the International Monetary Fund, with substantive inputs from the African Development Bank, the Asian Development Bank, the European Bank for Reconstruction and Development, the Inter-American Development Bank, and the Organisation for Economic Co-operation and Development.
SKU 32965