Embed Size (px)
Citation preview
Development, current state and future of the SmartBuoy programme
Centre for Environment, Fisheries and Aquaculture Science (Cefas)
Lowestoft
Weymouth
RV Cefas Endeavour
History of UK eutrophication monitoring (1990-2000)
• Report to OSPAR• Ship based observations• Good spatial coverage• Poor temporal resolution
Annual winter nutrient survey Occasional summer survey
• Limited biological data Chlorophyll, oxygen
• Labour intensive (expensive)
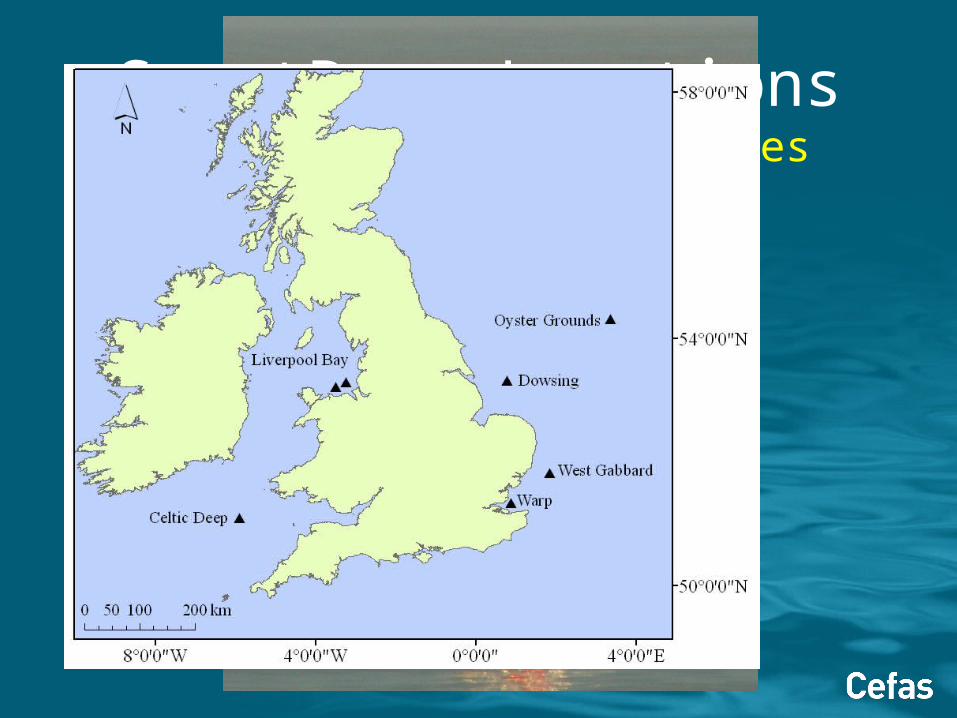
SmartBuoy Locations6 routine monitoring sites
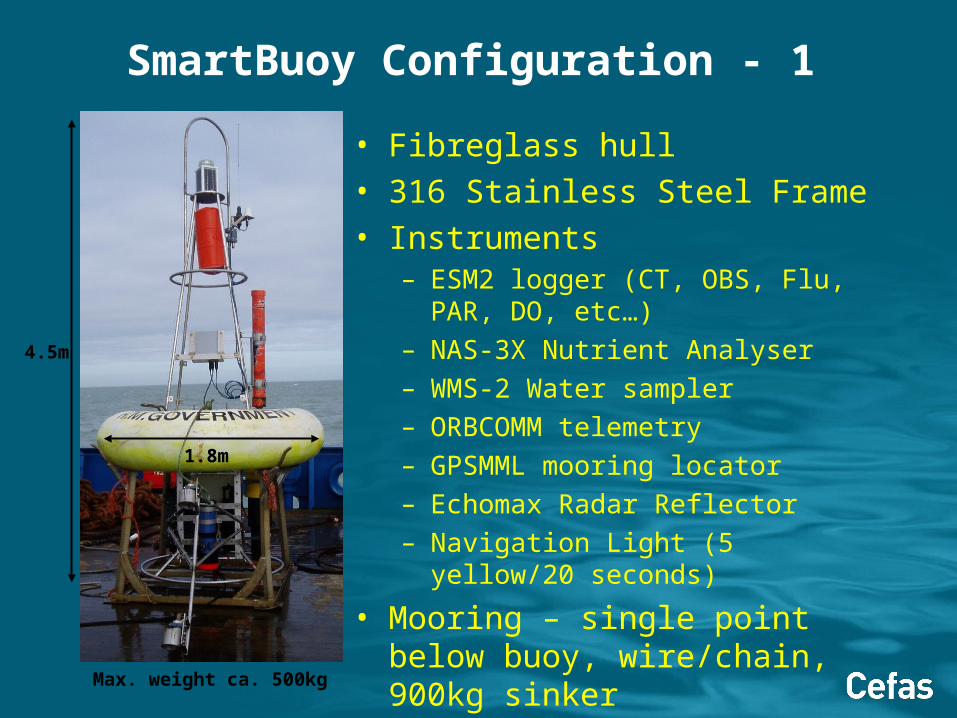
• Fibreglass hull• 316 Stainless Steel Frame• Instruments
– ESM2 logger (CT, OBS, Flu, PAR, DO, etc…)
– NAS-3X Nutrient Analyser– WMS-2 Water sampler– ORBCOMM telemetry– GPSMML mooring locator– Echomax Radar Reflector– Navigation Light (5 yellow/20 seconds)
• Mooring – single point below buoy, wire/chain, 900kg sinker
1.8m
4.5m
Max. weight ca. 500kg
SmartBuoy Configuration - 1
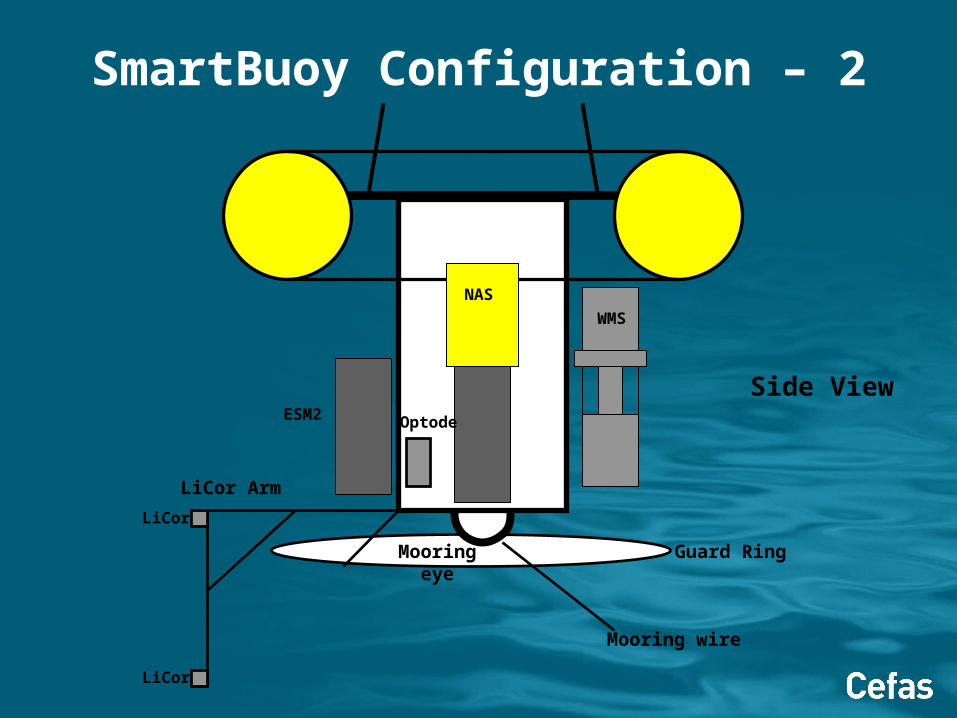
SmartBuoy Configuration – 2
LiCor Arm
Guard Ring
Mooring wire
Mooringeye
LiCor
LiCor
WMS
NAS
ESM2 Optode
Side View
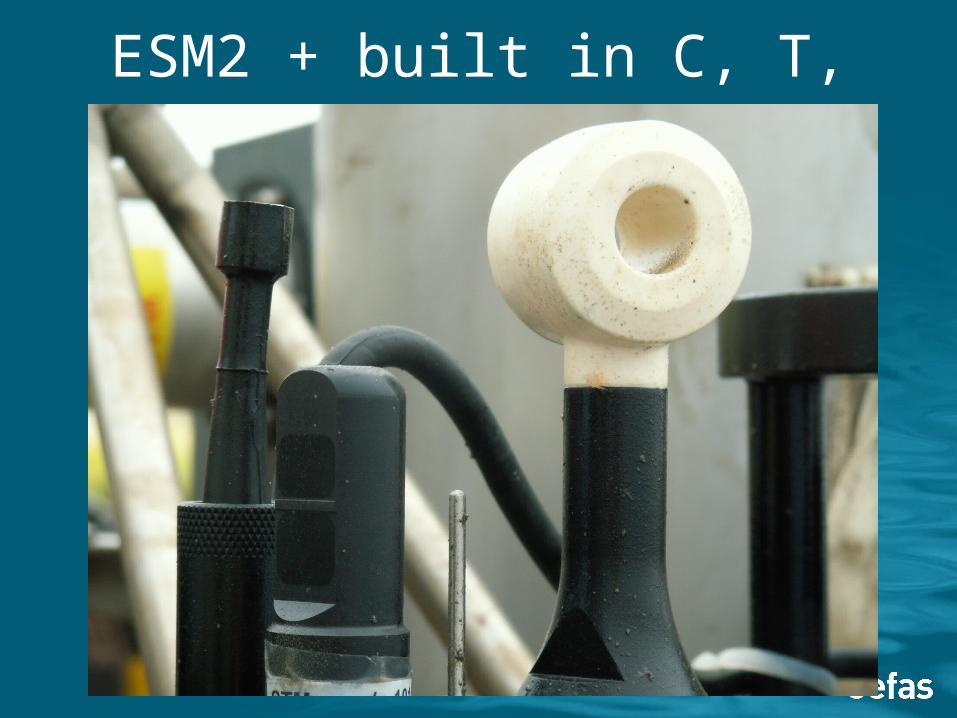
ESM2 + built in C, T, OBS, pressure
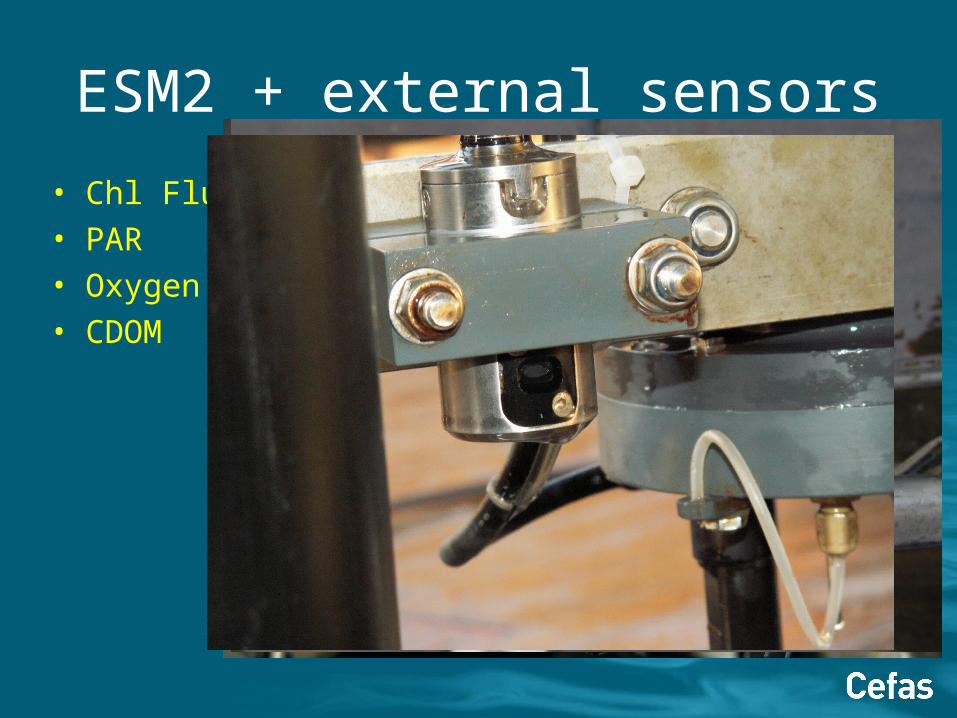
ESM2 + external sensors
• Chl Flu• PAR• Oxygen• CDOM
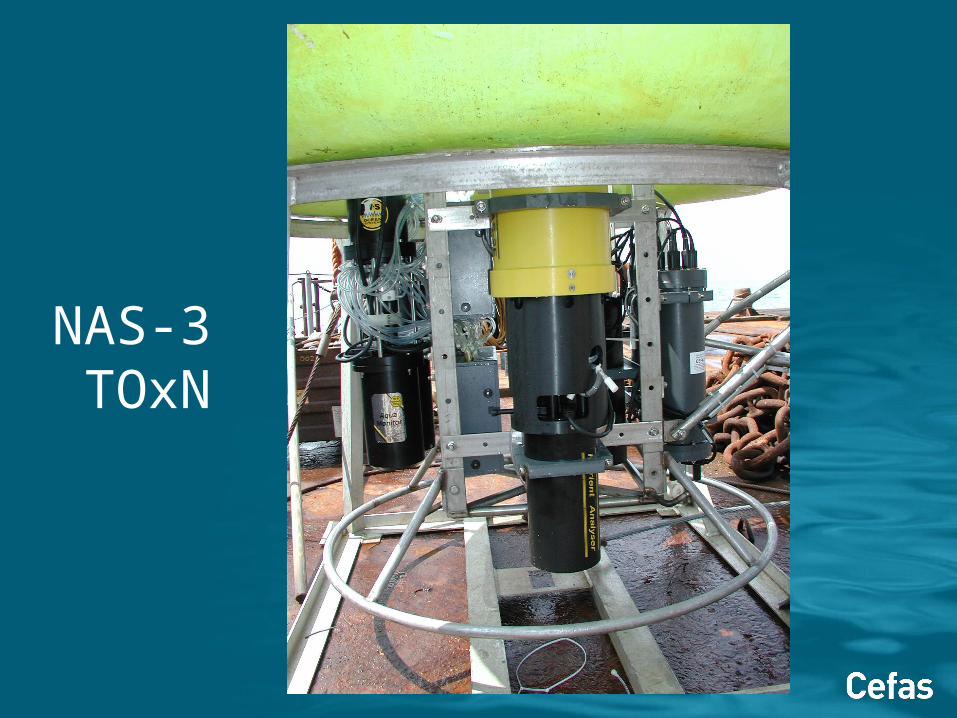
NAS-3 TOxN
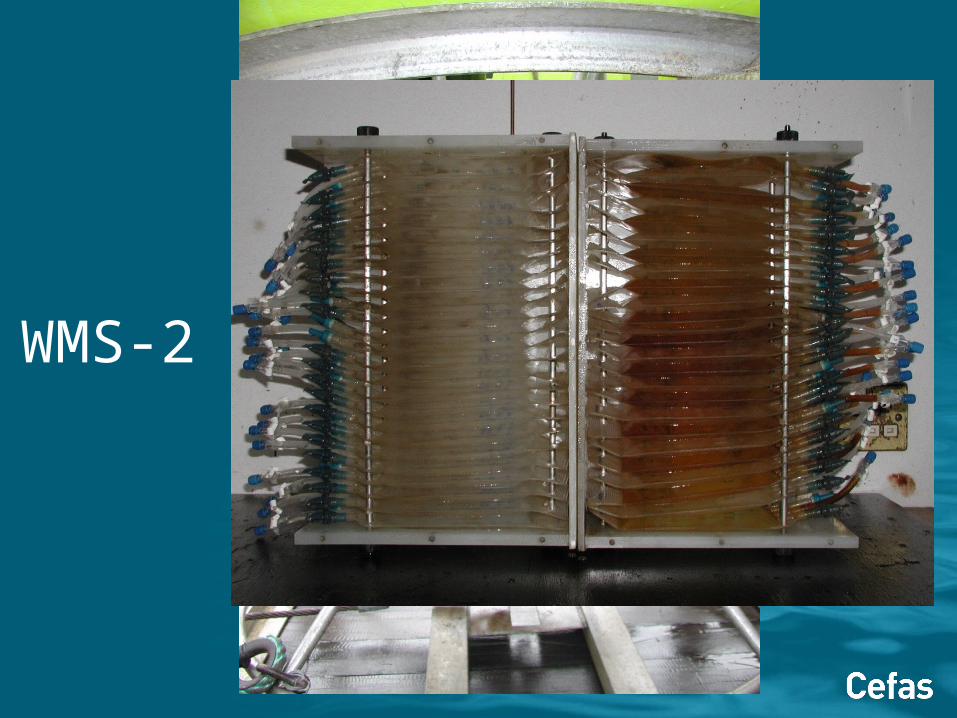
WMS-2
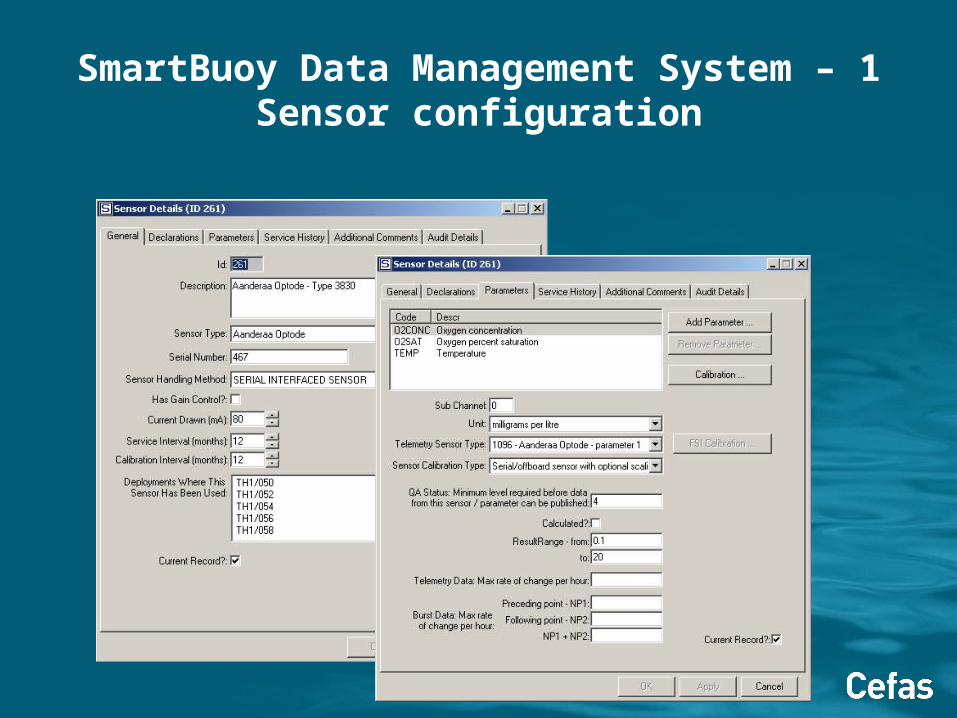
SmartBuoy Data Management System – 1 Sensor configuration
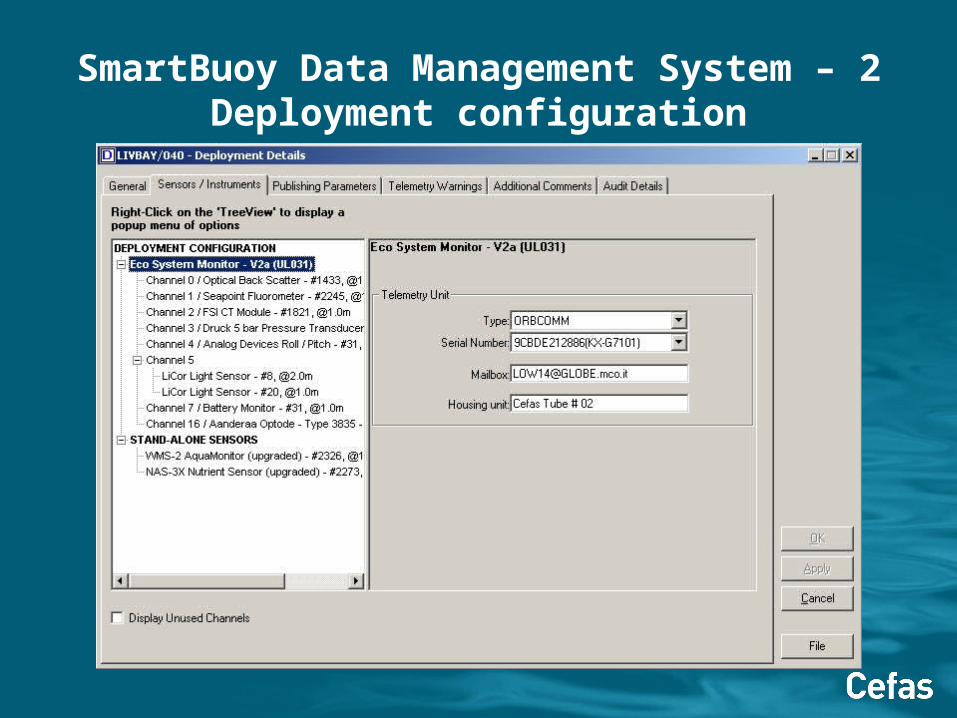
SmartBuoy Data Management System – 2 Deployment configuration

SmartBuoy Data Management System – 3QA Level 2 (manual QA by expert user)
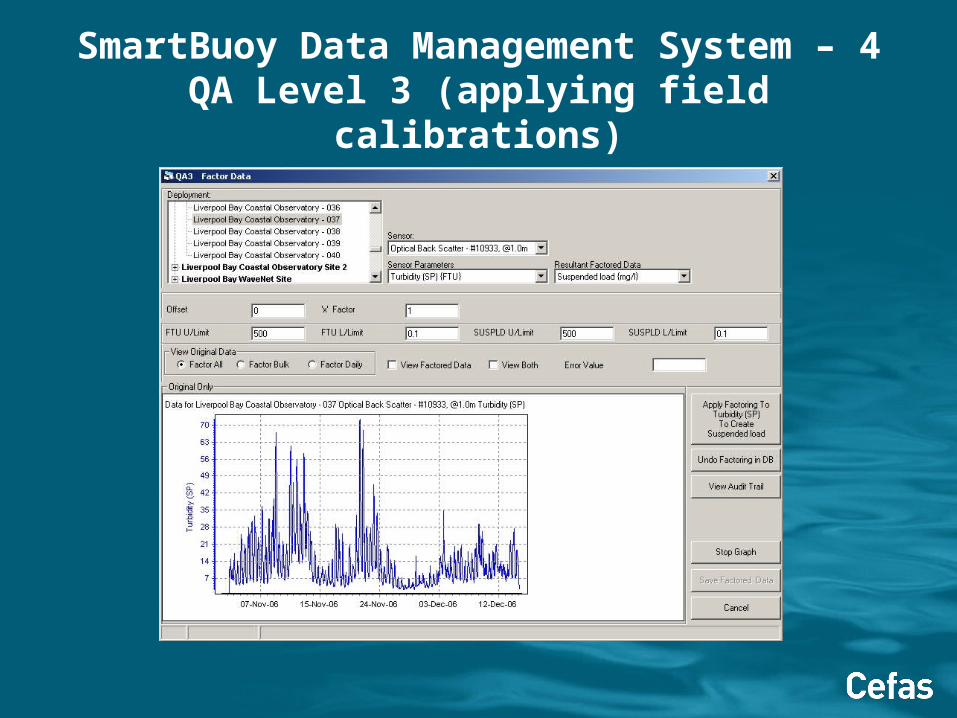
SmartBuoy Data Management System – 4QA Level 3 (applying field calibrations)
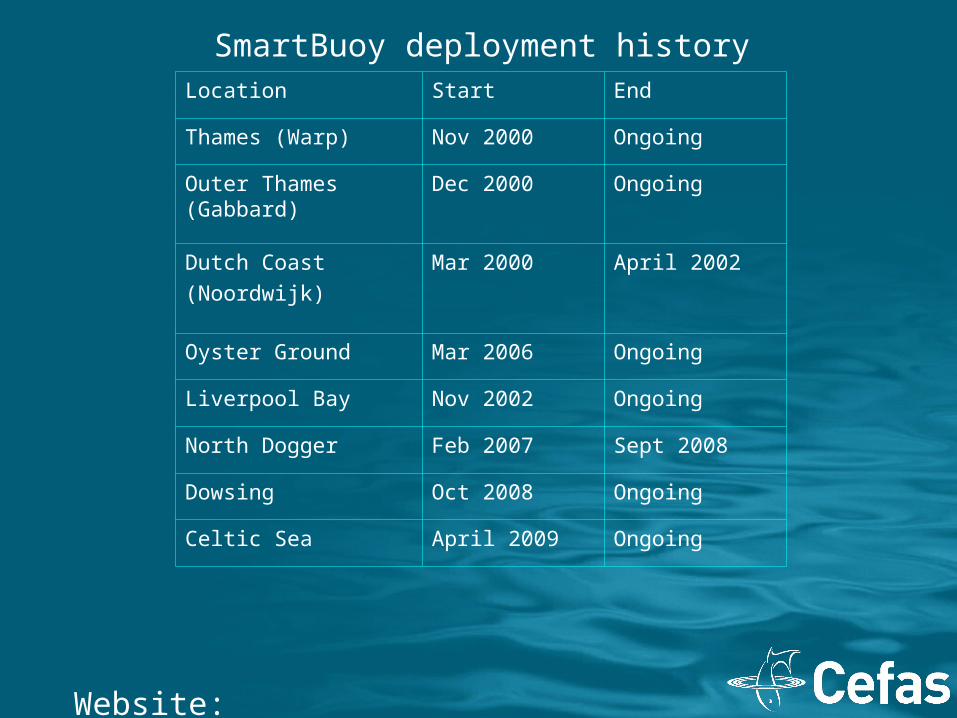
Location Start End
Thames (Warp) Nov 2000 Ongoing
Outer Thames (Gabbard)
Dec 2000 Ongoing
Dutch Coast
(Noordwijk)
Mar 2000 April 2002
Oyster Ground Mar 2006 Ongoing
Liverpool Bay Nov 2002 Ongoing
North Dogger Feb 2007 Sept 2008
Dowsing Oct 2008 Ongoing
Celtic Sea April 2009 Ongoing
Website: www.cefas.co.uk/monitoring
SmartBuoy deployment history
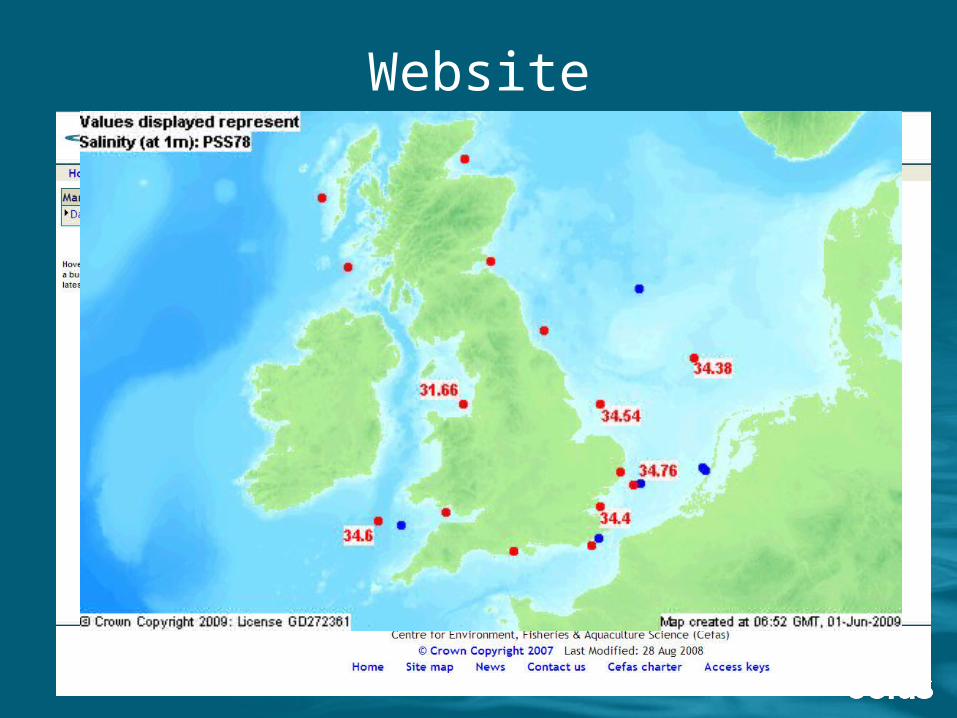
Website
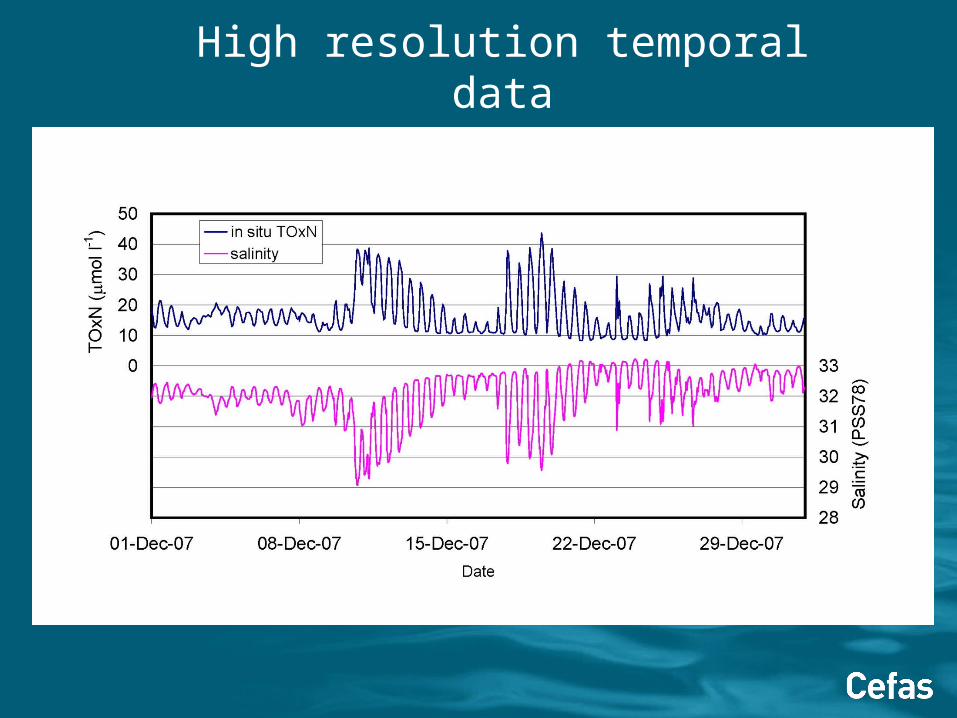
High resolution temporal data
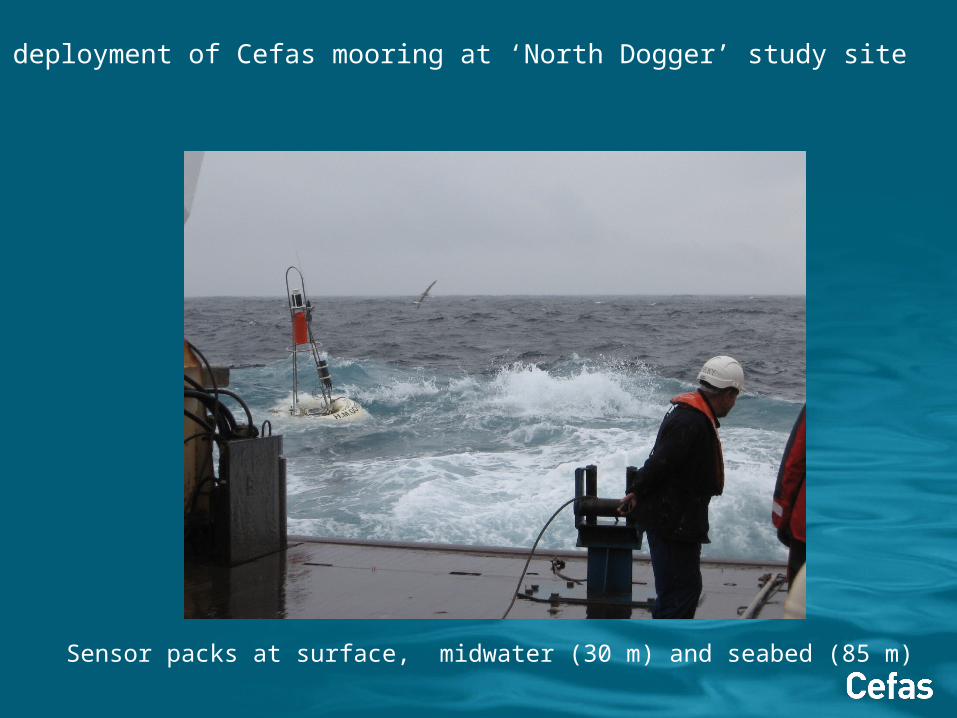
First deployment of Cefas mooring at ‘North Dogger’ study site
Sensor packs at surface, midwater (30 m) and seabed (85 m)
6
8
10
12
14
16
18
50 100 150 200 250 300 350
6
8
10
12
14
16
18
0
2
4
6
8
10
50 100 150 200 250 300 350
0
2
4
6
8
10
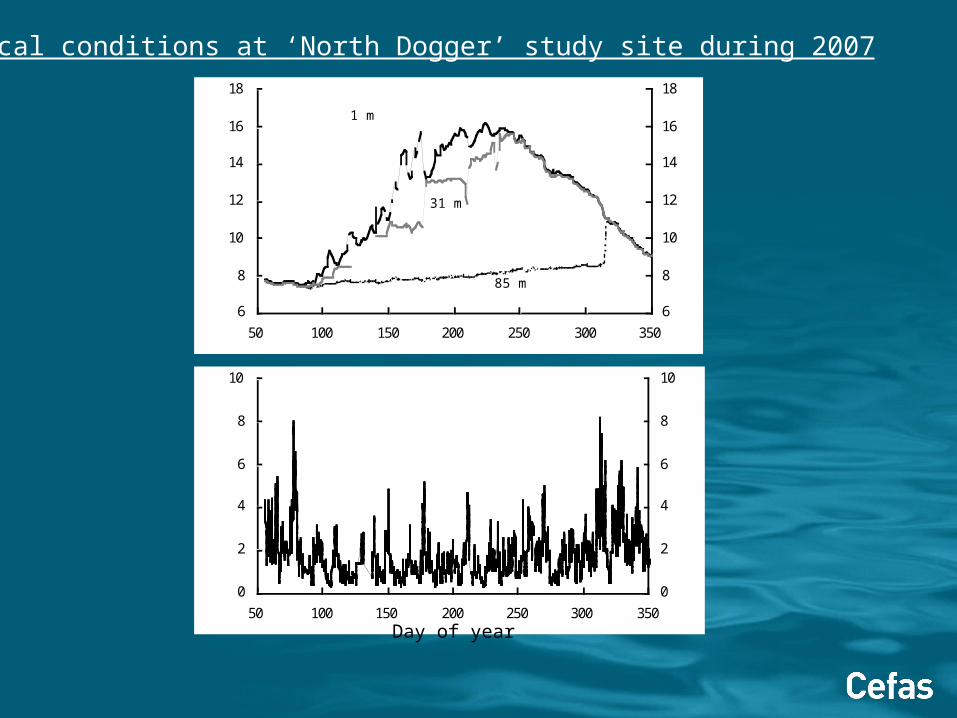
Physical conditions at ‘North Dogger’ study site during 2007
1 m
31 m
85 m
Day of year
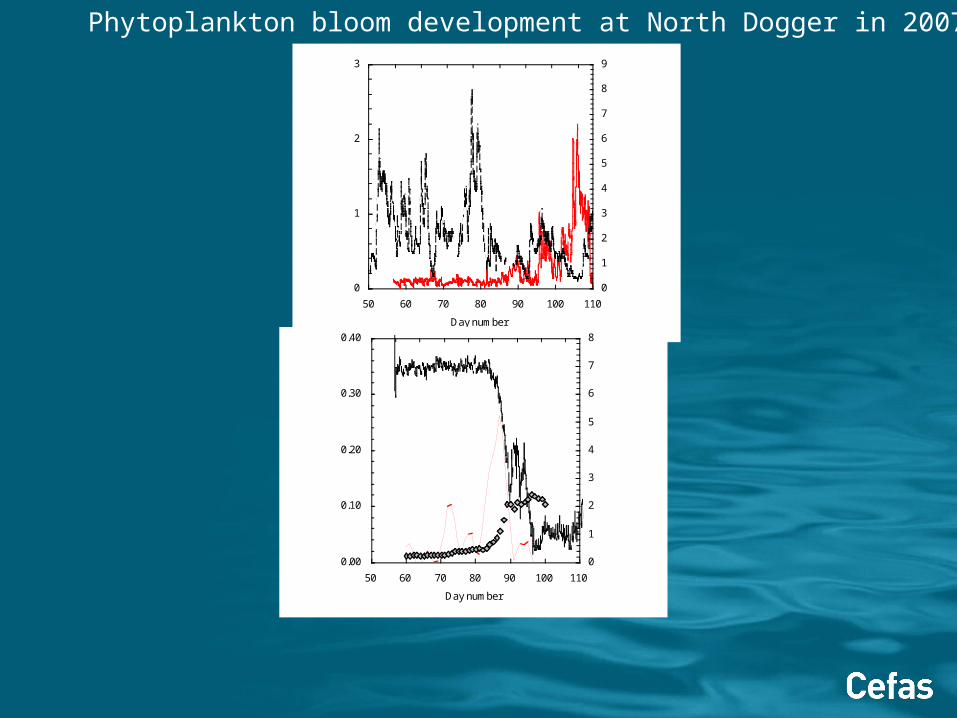
Phytoplankton bloom development at North Dogger in 2007
0
1
2
3
50 60 70 80 90 100 110
Day number
0
1
2
3
4
5
6
7
8
9
0.00
0.10
0.20
0.30
0.40
50 60 70 80 90 100 110
Day number
0
1
2
3
4
5
6
7
8
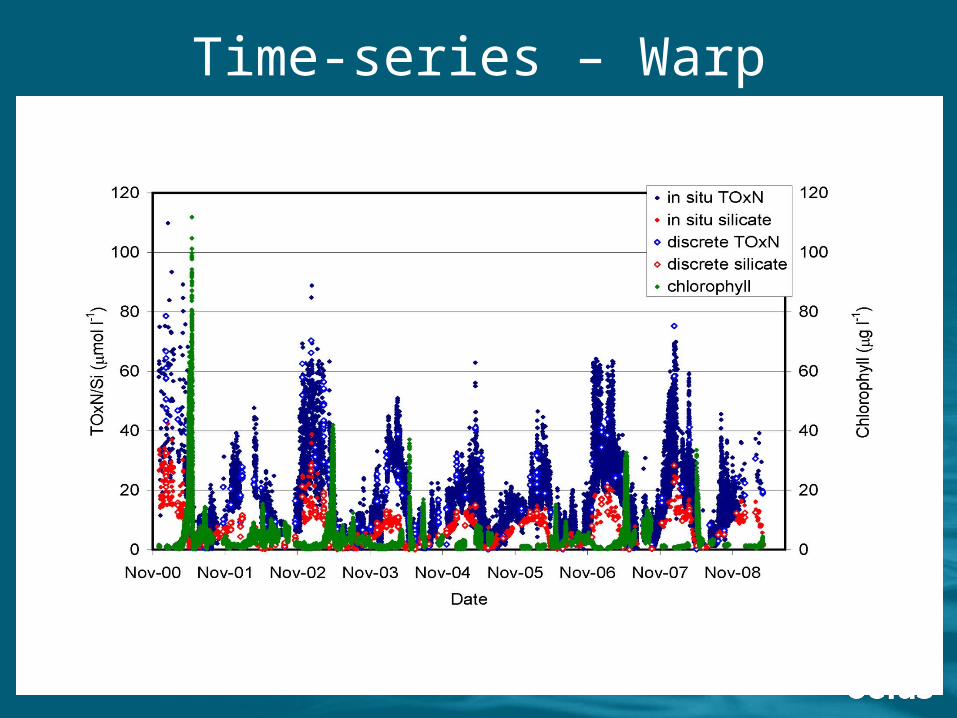
Time-series – Warp
0
1
2
3
4
5
6
7
8
9
10
01/01/2006 01/01/2007 01/01/2008 31/12/2008
Chlorophyll (mg m-3) or fluorescence
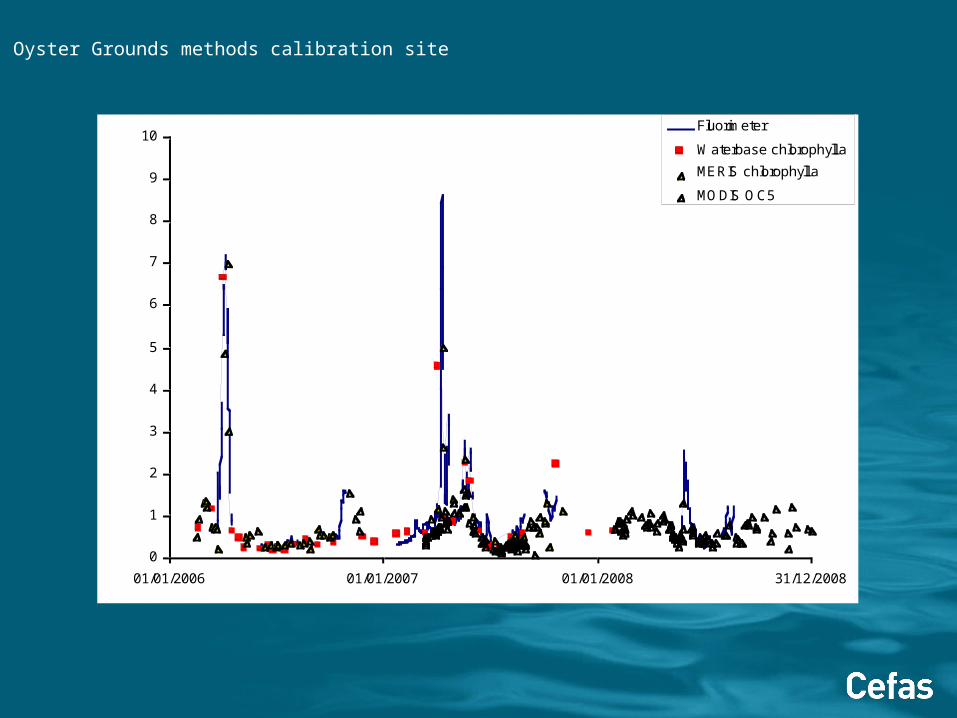
Fluorimeter
Waterbase chlorophyll a
MERIS chlorophyll a
MODIS OC5
Oyster Grounds methods calibration site
0
1
2
3
4
5
6
7
8
9
10
0 2 4 6 8 10
Chlorophyll (mg m-3
) SmartBuoy
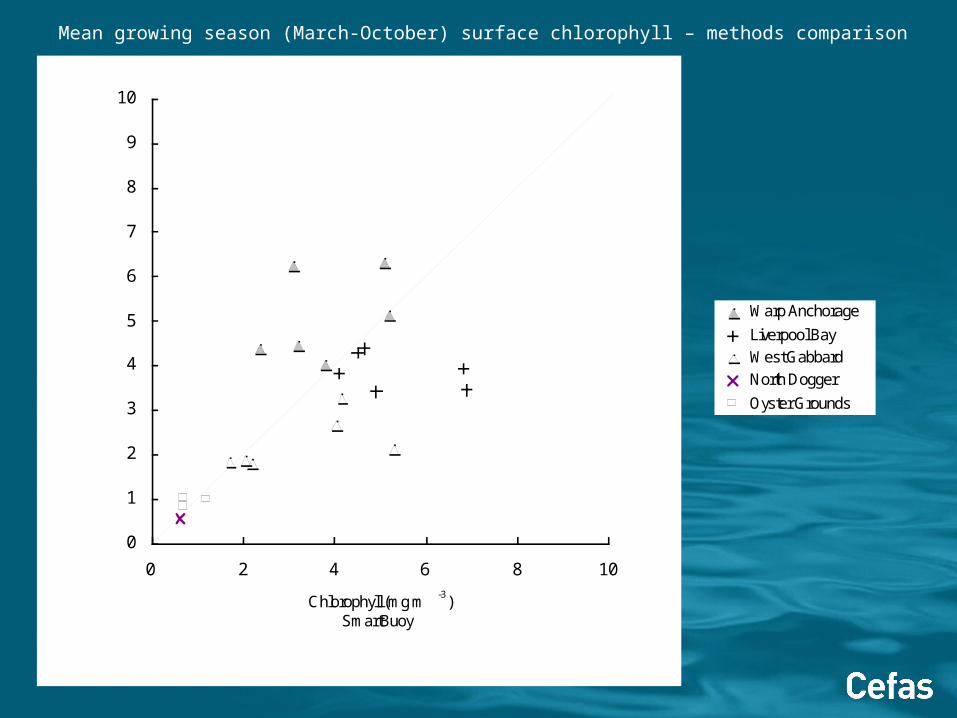
Mean growing season (March-October) surface chlorophyll – methods comparison
0
1
2
3
4
5
6
7
8
9
10
0 2 4 6 8 10
Chlorophyll (mg m-3
) SmartBuoy
Warp Anchorage
Liverpool Bay
West Gabbard
North Dogger
Oyster Grounds
1:1
Series6
Data uptake – papers
• Foden, J., Devlin, M. J., Mills, D. K., and Malcolm, S. J. (accepted). Searching for undesirable disturbance: The OSPAR eutrophication assessment method applied to marine waters of England and Wales, Biogeochemistry.
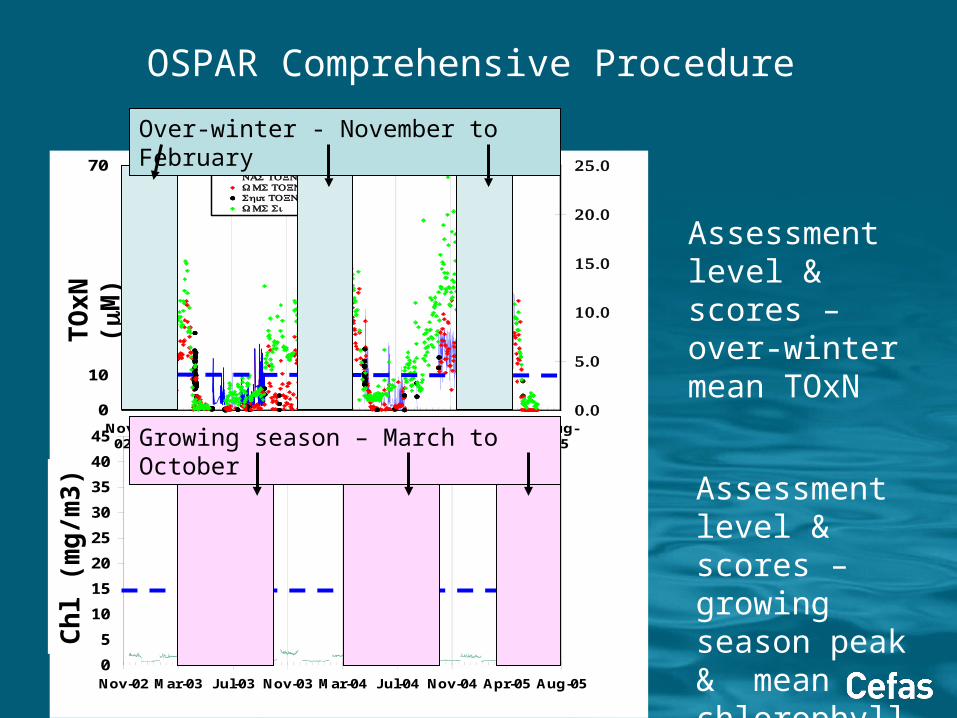
OSPAR Comprehensive Procedure
0
10
20
30
40
50
60
70
Nov-02
Mar-03 Jul-03 Nov-03
Mar-04 Jul-04 Nov-04
Apr-05 Aug-05
TOXN (
μ / )mol l
0.0
5.0
10.0
15.0
20.0
25.0
(Si
μ / )mol l
NAS TOXNWMS TOXNShip TOXNWMS Si
0
5
10
15
20
25
30
35
40
45
Nov-02 Mar-03 Jul-03 Nov-03 Mar-04 Jul-04 Nov-04 Apr-05 Aug-05
chlorophyll (
μ / )g l
TO
xN
(μM
)C
hl (
mg
/m3
)
Over-winter - November to February
Growing season – March to October
Assessment level & scores – over-winter mean TOxN
Assessment level & scores – growing season peak & mean chlorophyll
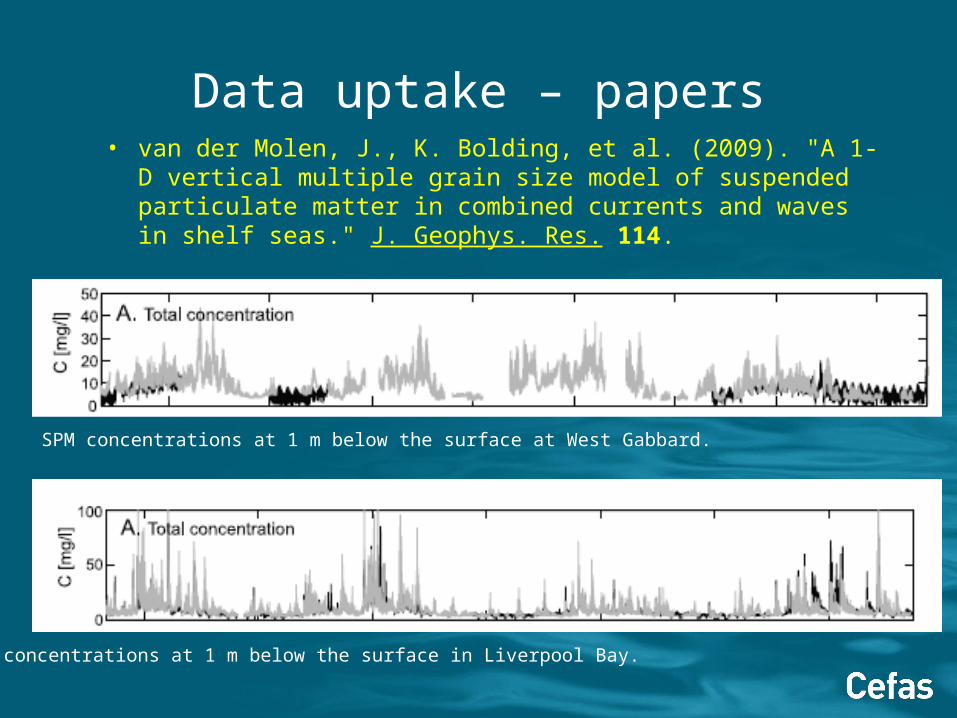
Data uptake – papers• van der Molen, J., K. Bolding, et al. (2009). "A 1-D vertical
multiple grain size model of suspended particulate matter in combined currents and waves in shelf seas." J. Geophys. Res. 114.
SPM concentrations at 1 m below the surface in Liverpool Bay.
SPM concentrations at 1 m below the surface at West Gabbard.
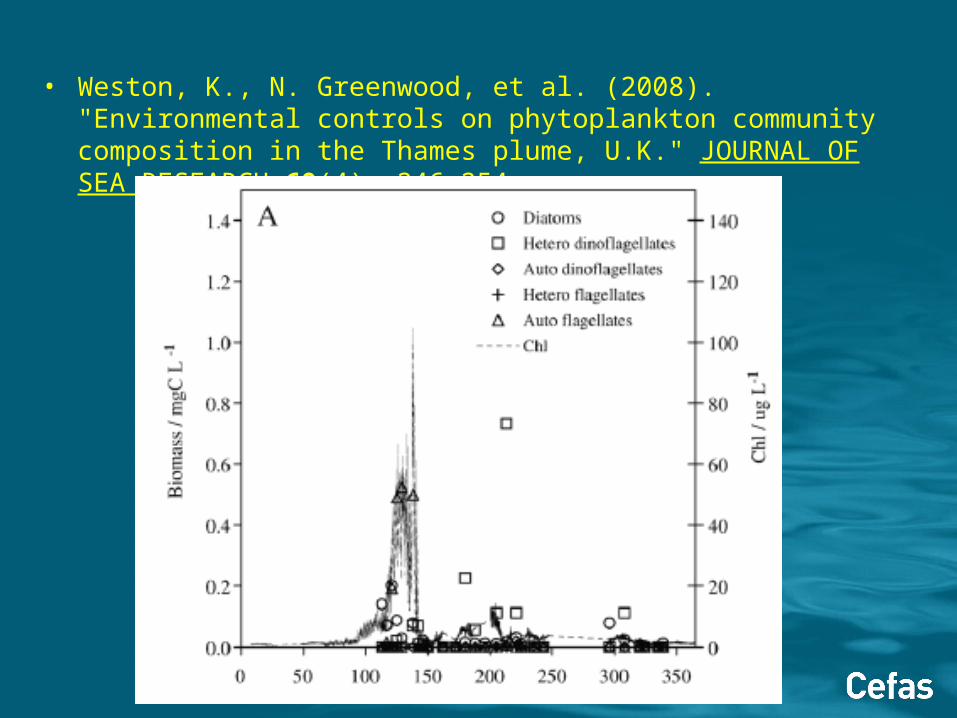
• Weston, K., N. Greenwood, et al. (2008). "Environmental controls on phytoplankton community composition in the Thames plume, U.K." JOURNAL OF SEA RESEARCH 60(4): 246-254.
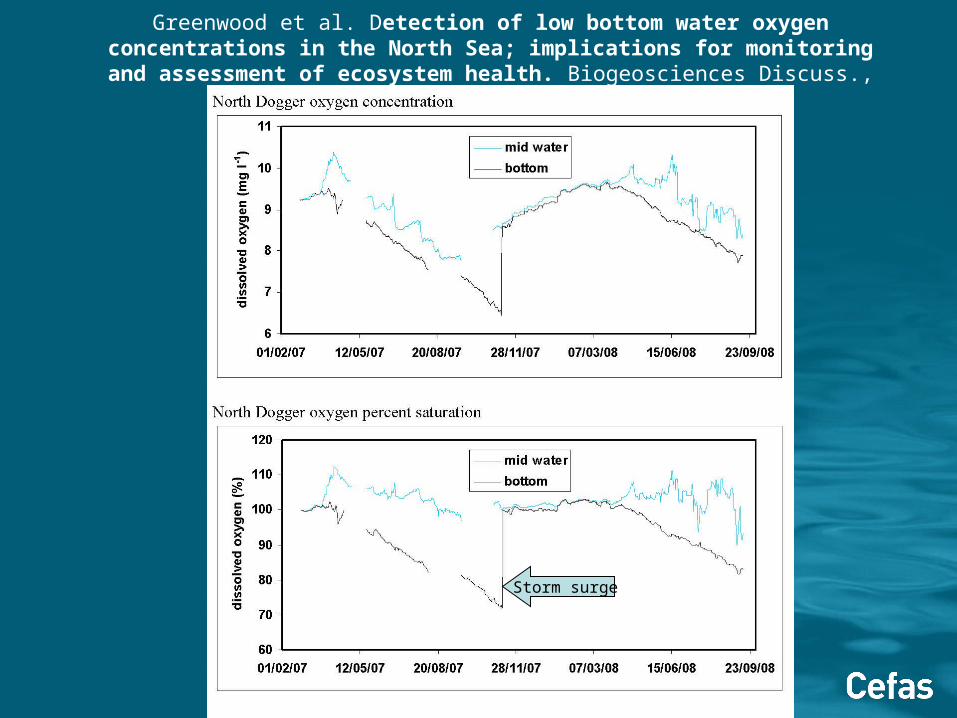
Greenwood et al. Detection of low bottom water oxygen concentrations in the North Sea; implications for monitoring and assessment of ecosystem
health. Biogeosciences Discuss., 6, 8411-8453, 2009
Oyster GroundsStorm surge
EMECO-NOOS Planning Meeting June 2-3 2009
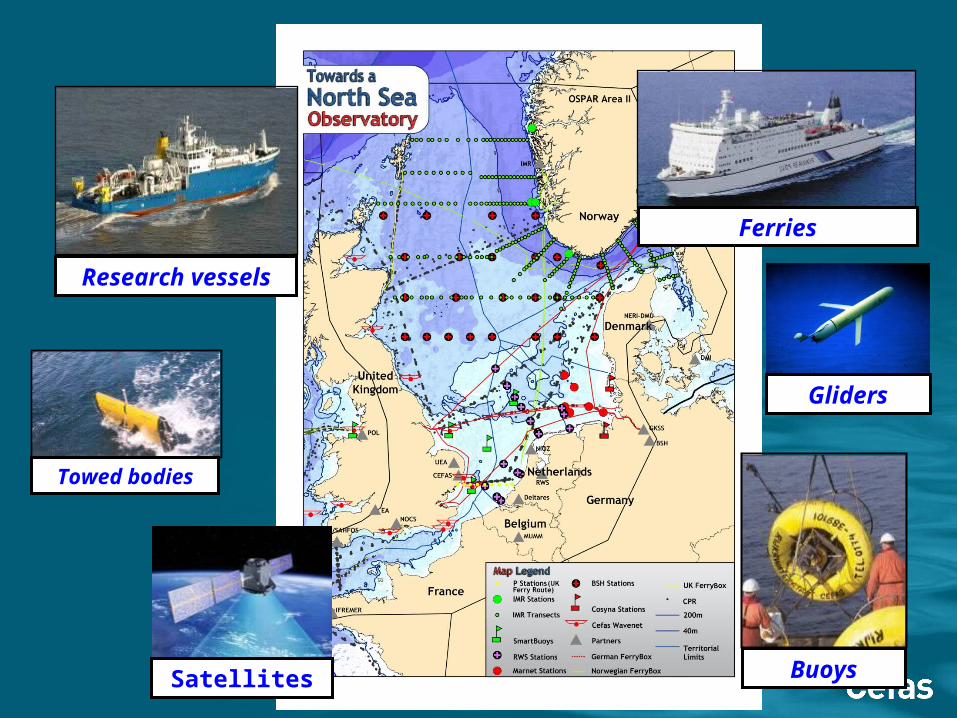
Towed bodies
Ferries
Satellites
Research vessels
Gliders
Buoys
Summary
• SmartBuoy observations are a key element of an effective future UK eutrophication monitoring programme
• Observation strategies across different scales are required for a robust assessment of eutrophication