Embed Size (px)
Citation preview

DEVELOPMENT AND TRIAL USE OF ACCEPTANCE SAMPLING PLANS FOR COMPACTED EMBANKMENTS James L. Jorgenson, North Dakota State University
The purpose of this research was to develop and put in trial use statistically based acceptance sampling plans for compacted embankments based on the existing variability in acceptable construction. The first phase of this research indicated that the trial specifications should have the following characteristics: (a) Decisions should be based on the average of a number of in-place density tests; (b) sample locations should be determined for random numbers; (c) specifications should provide an incentive for the contractor to produce uniform compaction; and (d) specifications should call for the same average degree of compaction as is accepted under the current specifications. Specifications incorporating these characteristics were developed and used along with current highway department specifications on 3 construction projects. The lot acceptance plan used a sample size of 3 to 5 tests. A nuclear moisture-density instrument was used and resulted in a testing and calculation time of from 40 to 90 min per lot. A comparison of the current specifications that are based on representative sampling with a specified minimum density indicated that (a) the average lot test results for the representative sampling deviated from the random test results depending on the judgment of the inspector, (b) of the 60 lots accepted under the current specifications, 2 lots would have been rejected under the trial specifications, and (c) 9 of the 67 lots accepted by the trial specifications had one or more tests below the current specification limits indicating that they could have been rejected by the current specifications.
•AN EVOLUTION is in progress. The evolution is in the updating of construction specifications to account for the variability in the constructed product. Although varia -bility has always been present in highway construction, it has been dealt with primarily by judgment of inspectors or engineers. Although this process has produced many miles of adequate highways, it has recently been complicated by many problems such as lack of adequately trained inspectors; the need to explain specification results to federal agencies, auditors, politicians, and the public; the variations in judgment among engineers and inspectors; and the increased rate of construction. All of these factors have put additional emphasis on the need for specifications that will clearly account for the variability.
This problem is of national concern; approximately 40 states have recently conducted research in this area. In 1967, the North Dakota State Highway Department sponsored research to measure the variability present in acceptable compacted embankments (1 ). This research is a continuation of that work. The purpose of this research was to develop and put into trial use acceptance sampling plans for compacted embankments based on the previously measured variability.
This report starts with an examination of the results of the variability study to note the implications for improving the specifications. This is followed by the trial specifi-
Sponsored by Committee on Quality Assurance and Acceptance and presented at the 50th Annual Meeting.
24
25
cations. Next, the collection of data and their application to the trial specifications are discussed. A brief section indicates some statistically based construction specifications in use by other states, and the last section examines the question of quality assurance, i.e., a way of measuring the effectiveness of the different sampling plans.
VARIABILITY RESULTS AND IMPLICATIONS OF TRIAL SPECIFICATIONS
The research on variability of compacted embankment in North Dakota brought to light many characteristics of currently acceptable construction. They are as follows: (a) One of every 3 adjacentin-placedensitytests will deviate from the average by at least 3 to 5 percent compaction depending on the construction project; {b) the nuclear moisture-density gage when used in the direct transmission mode is a much more reliable indicator of field density than when used in the backscatter mode and slightly more reliable than the conventional water-balloon method; and (c) there was a significant difference in field density as measured by representative and random sampling. The following paragraphs in this section expand on these observations and discuss their implications on developing trial specifications.
The reason for measuring the density of the compacted embankment is to obtain information from which a decision will be made on the acceptability of the compaction. For each decision made, there is a probability that the decisi on is incorrect (i.e ., ac ceptable material may have been r ejected or poor material may have been accepted). The probability of the decision being incorrect increases with the variability of the information on which the decision is based. The variability of this information can be reduced by basing the decision on the results of more than one in-place density test. Therefore, the probability of making a correct decision on the acceptability of the compaction in the trial specifications is increased by basing this decision on the average of a number of in-place density tests.
Those experienced in compaction checking know that the test results are very much dependent on the judgment of the inspector in his selection of the representative sample. In most cases (and this depends on the degree of experience of the inspector), the inspector can select locations where moisture or density is high or low. All inspectors are not able to exercise this judgment uniformly, nor is a single inspector always consistent. For example, the average percentage compaction on the 3 projects in the variability research was from 2.8 to 4.4 pcf greater for the representative sampling than for the random sampling. It is, therefore, necessary to select sample locations by some means that eliminates (or reduces to a high degree) the bias of the inspector. Herein lies the advantage of random sampling, for unbiased numbers are used to select the sample locations. In the trial specifications, sample locations should be determined by random numbers.
Currently, the variability in construction not only increases the chance of making a wrong decision on its acceptability but also is a source of future maintenance problems with the roadway. There is often disagreement among engineers as to the amount of compaction desirable in a given roadway, but all will agree that the compaction should be uniform throughout the roadway. The road surface is like a continuous beam; if all the supports under the road surface settle the same amount, there is no distortion to the road surface. However, if the subgrade settlement is not uniform, the roadway surface will tend to break up. The variability is due partly to the use of heterogeneous soils and partly to the way the soil is processed. The processing part of the variability can be reduced by the contractor. The trial specifications should provide an incentive for the contractor to produce uniform compaction. This is accomplished by having the required average compaction for a series of tests increase as the range in the test results increase.
The final characteristic of the trial specification is that it should call for the same degree of compaction as was measured in the variability study. For example, when the highway department specifications called for 90 percent of T-180, through random sampling a density greater than 90 percent was actually obtained in about one-half the samples. The average of the test results was near 90 percent, while 80 percent of the samples had a density greater than 85 percent of T-180. Similarly, from the research

26
data when 95 percent of T-99 compaction was called for, that obtained was 80 percent of the samples with greater than 95 percent compaction. The trail specifications should be written so as to obtain the same degree of compaction under new specifications as is now being accepted.
TRIAL SPECIFICATIONS
The trial specifications were tailored to satisfy the requirements stated in the previous section. The portion pertaining to density and acceptance is as follows:
Density Requirements:
The target value for controlled density of the material shall be 85% of AASHO T-180 (or 95% of AASHO T-99). The Quality Index, Q, of each lot for the density requirement based on 5 random samples and the methods of ACP-1 (see below) shall be 0.36. Any AASHO standard test method or an approved equivalent method may be used in determining inplace density.
The lot size shall normally be a day's run. However, a lot of any size may be selected by the Engineer when the factors affecting compaction exhibit variation, when an area is obviously defective, when approval is needed prior to placing another lift, or when the rate of construction is greater than 10,000 cubic yards per day.
Acceptance Testing, Density:
Acceptance testing will be performed as soon as practicable after the contractor has informed the engineer that the lot or sections within the lot are ready for test. Lots failing to meet the Quality Index requirement shall be reworked by the contractor at his expense and be resubmitted for acceptance testing. Retesting of reworked lots will be at the expense of the contractor at the stated unit cost per test.
ACCEPTANCE PLAN NO. 1 (ACP-1)
1. Locate five sampling positions on the lot by use of a table or random numbers. 2. Make an inplace density and moisture test measurement at each location, and using the
proper maximum dry density, calculate the percent compaction at each location. 3. Add the measurements and divide by five to obtain X. 4. Find the range in measurements, R, by substracting the smallest value from the largest value
in the group of measurements. 5. The lot is acceptable if: X 2: L + R Q where L is the target-value percent compaction and Q
is the Quality Index given in the specification. i.e. accept if X 2: 85 + 0.36 R for T-180 compaction and X 2: 95 + 0.36 R for T-99 compaction.
OTHER TRIAL SPECIFICATIONS
The 2 types of acceptance sampling plans are inspection by variables and inspection by attributes. Inspection by variables applies when the characteristic measured is given a numerical value. Inspection by attributes applies when the characteristic is just given a suitable or defective classification. There are situations where inspection by attributes must be used; however, more information about the material in question can be derived through inspection by variables than by inspection by attributes. Hence, the further discussion will be on inspection by variables.
Acceptance sampling plans by variables can be divided into 3 cases (2). The case to use for a particular material or construction depends on the informationknown about that material or construction. Case 1 is a plan to estimate the percentage of the material within tolerance. It can be used when both the mean and standard deviation of the measured property are unknown or are known to vary widely. Case 2 is a plan to provide fixed protection against accepting poor material. To use this plan, one must know the average value of the measured property for unacceptable construction. Case 3 is a plan to provide fixed protection against accepting poor material or rejecting good material. However, this plan can be used only when acceptable or unacceptable material or construction can be defined in terms of its average value and the standard deviation is known.
Which of these 3 cases is applicable to subgrade compaction? Case 3 calls for the standard deviation to be known, meaning that the standard deviations of the lots in a construction project should be about equal. The range in lot standard deviations for the 3

27
projects were project 1, 2.0 to 13.5; project 2, 2.0 to 7.0; and project 3, 0.5 to 9.9 The large ranges in standard deviation values suggest that case 3 is not applicable. In order to use case 2, one must know the average value of unacceptable construction. In reference to subgrade compaction, this value is unknown. Research on current construction has indicated the average value of that being accepted but not the average value of that being rejected. This value could possibly be developed on the basis of a laboratory investigation of subgrade stability. In the absence of an average value for unacceptable subgrade compaction, the case 2 acceptance plan cannot be used. The remaining acceptance sampling plan is case 1, which is the type of plan used in the trial specifications.
DATA COLLECTION
One man using a direct transmission nuclear instrument carried out the trial specifications. Through discussion with the state inspector, he determined the largest size lot that could be tested. The lot size was usually limited by the contractor's desire to place material on the lot. Ten random numbers were selected that, when multiplied by the lot size, determined the 5 sample locations.
The sample locations were stepped off and 1-min moisture and density count readings were taken at each location. The readings, along with the calibration charts for the instrument, were used to obtain the in-place moisture and densUy of the soil. The maximum dry density for the soil in question was determined on advice of the state inspector. The percentage compaction for each sample along with the average and range in values was calculated. The required average percentage compaction for the 5 tests was calculated according to the specification requirements. If the average of the 5 samples was greater than the required average, the lot was accepted.
The time to carry ont the testing for a sample size of 5 was as follows: 10 min to determine sample locations, 30 to 60 min to do the testing (depending on the ease with which the sample locations can be leveled by hand shovel), and 15 min to do the calcnlations necessary to determine whether the area is accepted. The testing was carried out while the contractor was working on the lot. For a few of the smaller lots, there was insufficient time to perform all 5 tests. For the 70 lots, 9 had 4 tests, 1 had 3 tests, and the remainder had 5 tests.
RESULTS AND DISCUSSION
The nnmerical results for the 3 projects in which the trial specifications were simnlated are given in Tables 1, 2, and 3.
The lots varied in size from as small as 15 by 400 ft in project 1 to 60 by 3,000 ft in project 3. Lot sizes in project 1 were limited to a 15 ft width because the testing was done during the construction of the second stage of a 2-stage grading project. The compaction of all the lots was accepted by the current specifications.
For an individual lot, a considerable range in compaction values is observed, especially those for the trial specifications. This range brings a number of individual compaction values below the limits of the current department specification. For project 1, 8 of the 14 lots have one or more compaction values below 90 percent. Yet, only one of those lots was rejected according to the trial specifications. This comparison is made to point out that individual compaction values are not significant, and only information derived from a number of test results has meaning.
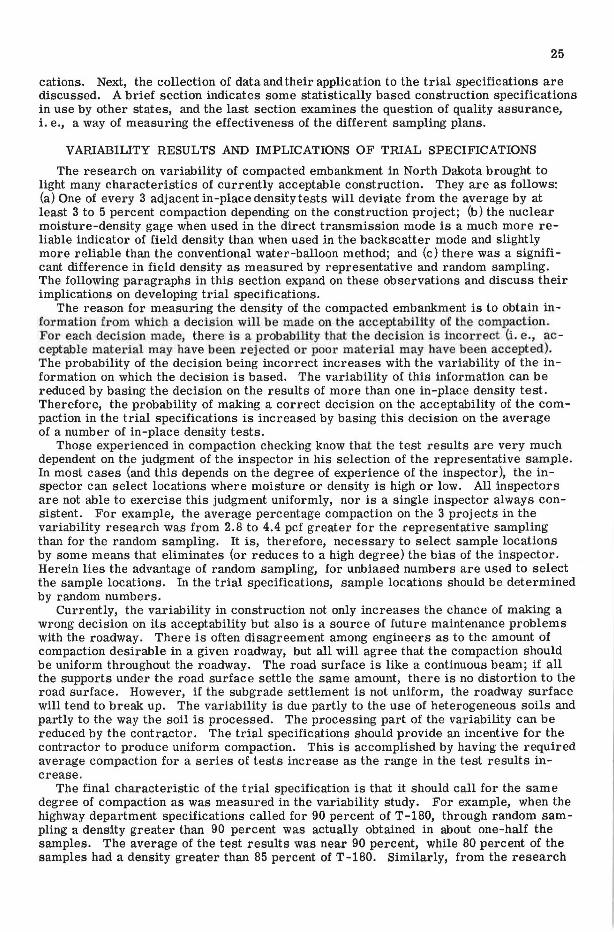
A better understanding of the degree of compliance with the trial specifications can be obtained if a plot is made of the measured average compaction and the required average compaction for each lot. This plot for project 3, shown in Figure 1, illustrates an interesting point. The compaction was more than adequate until lot 14 and the next 3 lots where the compaction was near or below the required value. At this point, the contractor overreacted and produced much more than the required compaction for the next 5 lots.
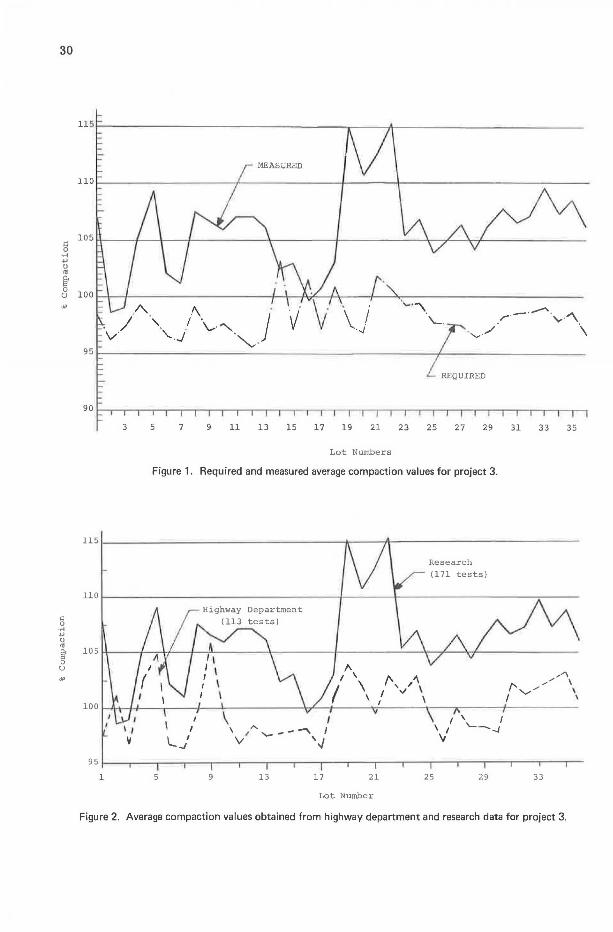
A comparison of the average percentage compaction for each lot as obtained from highway department and trial specifications is shown in Figure 2 for project 3. The research data are from random sample locations, and the department data are what the inspector considered to be representative samples. The comparison can be considered a measure of the inspector's ability to select a sample, or samples, representing the

28
average compaction of the lot. It can be observed that the major changes in density were detected by the inspector. However, as the lot numbers increase, there is 11
widening gap between the research and inspector's data. This indicates the inspector's inability to consistently select average compaction values.
STATISTICALLY BASED SPECIFICATIONS IN USE BY OTHERS
In a 1968 repod, the California Division of Highways summarized its research on statistical quality control for a 4-year period (3): "The report proposed quality control by moving averages using control charts. It is anticipated that this procedure will provide control without increasing cost while at the same time supplying management information in the form of charts and graphs."
TABLE 1
RESULTS OF PROJECT 1 IN LEEDS
Current Specifications Trial Specifications
Lot Individual Compac- Average Num- Width Length Individual Compaction Results Average Average Accept tion Compac- Compac -
Obtained Required or tion ber (ft) (ft) (percent) (percent) (percent) Reject Required tioll Results (percent) (percent)
(percent)
L0l 15 1,000 102.2 97,3 93.4 95.7 93.7 96.6 88.2 A 90 95 .6 94.7 96 .6 L02 15 400 96 .8 97.5 100 .5 96.0 96 .8 97.5 86 .4 A 90 97 .9 97.9 L03 15 500 95 .0 69.0 97.5 90.0 95 .0 89.3 95.2 R 90 94.0 94.0 L04 15 3 ,000 93.4 92.2 90.8 90,8 89.4 91.3 86 .4 A 90 90.6 90.4 90.8 L05 15 500 91.6 94.2 87.5 91.1 88,3 A 90 91.5 91.5 L06 15 1,000 101.0 96.6 90.3 88.5 94.1 90,0 A 90 90.5 90.7 90.4 LO? 15 500 87.4 92.0 90 ,0 86.7 93.2 89.9 87.3 A 90 90.4 90,4 LOB 15 500 92.0 88.4 93.0 86.7 90.0 87.5 A 90 91.8 91.8 L09 15 500 95.5 92.0 88.4 85.0 91.4 90.5 88.8 A 90 96 .3 95.4 97 .3 Ll0 15 500 94 .7 93.7 98.0 84.0 87.0 91.5 90 .0 A 90 91. 7 91. 7 Lll 15 500 91.6 92.3 96.5 91.6 97.0 93,8 87 .0 A 90 90.4 90.4 L12 15 500 92.4 104,0 104.0 96.5 99 .0 99.2 89.2 A 90 99.6 99 .6 L13 15 500 98.7 103.0 100 .5 97.5 101.5 100.2 86.9 A 90 92.7 92.7 Ll4 15 500 98.3 92.4 98.8 96.4 94.3 96.0 87.3 A 90 96.8 96.8
TABLE 2
RESULTS OF PROJECT 2 IN WILLISTON
Trial Specifications Current Specifications Lot
Compac-Num- Width Length Individual Compaction Results
Average Average Accept tion Individual Compaction ber (ft) (ft) (percent) Obtained Required or Requl1·cd Results (percent) (percent) (percent) Reject
( pei-ecnt)
W0l 48 1,000 100.0 111.0 107 .5 108.5 106.0 106.0 99,0 A 95 104.4 109 .2 102.0 102.0 W02 48 900 105.0 99.6 100.0 96.1 107.2 101.6 99,0 A 95 97.0 95 .6 98,4 W03 48 2 ,500 105.0 117.0 101.5 116.0 110.5 110.0 100.6 A 95 98.2 100.8 95.6 W04 48 2,800 101.5 104.5 100,9 99 .4 100,0 105 .3 99 .1 A 95 99,4 100.0 98 8 W05 48 600 105.0 105 .5 106.0 101.5 110.8 105. 7 98.3 A 95 101.0 101.0 W06 48 600 106.0 110.0 108 .0 100.0 100 .6 104.9 98 .6 A 95 WO? 48 600 98.2 99.6 99.0 102.0 112.0 102.2 99,9 A 95 99.8 100.0 99.6 98 .2 wo0 48 1,300 111.0 93.5 98.5 108.0 103.0 102.8 101.3 A 95 101,3 98.7 104.0 W09 48 750 105.5 104.2 105 .3 104.2 109.2 105. 7 96.8 A 95 Wl0 48 2,800 104.2 106.4 94,3 104.2 113.0 104.4 101.6 A 95 99.5 96.1 102.9 Wll 48 2,000 108 .0 103.8 108 .3 99.5 104.3 104.8 98.2 A 95 W12 48 600 104.5 99 .8 100,0 108.0 104.3 103.3 97.9 A 95 100,0 100.0 W13 48 910 104,0 105.0 99.3 104.0 100.9 102.6 97.1 A 95 W14 48 3,200 93.7 106.2 99 .3 105.5 106.8 102.3 99.7 A 95 W15 78 600 108.0 104.0 100,0 103 .0 98.2 102 .6 98.5 A 95 103 .0 99.7 106.4 W16 66 600 103.0 105.0 106.0 98.0 99.3 102 .2 97,9 A 95 101.0 97 .0 105 .0 Wl7 60 700 107 ,0 103 .0 100 .0 100.7 98,0 101. 7 98.2 A 95 104.5 104.5 W18 60 1,000 109.0 107.4 110.2 105 .8 105. 7 107.6 96.6 A 95 101.2 100.3 100.0 103 .3 W19 60 1,000 110.1 103.4 108.5 109.4 107.6 97.7 A 95 100 .6 98 .0 99.8 104.0 W20 48 1,500 99.5 103.0 104.8 97.2 100.3 100,9 97.8 A 95

TA
BL
E 3
RE
SU
LT
S O
F P
RO
JEC
T 3
IN
GA
RD
NE
R
Tri
al S
pec
ific
atio
ns
Cu
rren
t S
pec
ific
atio
ns
Lo
t A
A
t
Co
mp
ac-
Av
erag
e N
um-
Wid
th
Len
gth
Indi
vidu
al C
ompa
ctio
n R
esu
lts
Av
erag
e v
erag
e cc
ep
tio
n
Co
mp
ac-
Indi
vidu
al C
om
pac
tio
n R
esu
lts
ber
(ft)
(f
t)
(per
cen
t)
Obt
aine
d R
equ
ired
o_
r R
equ
ired
ti
on
(p
erce
nt)
(p
erce
nt)
(p
erce
nt)
R
eJec
t (p
erce
nt)
(p
erce
nt)
GO
l 40
1,
000
113.
2 10
5.2
104.
9 10
4.4
109.
2 10
7.4
98.2
A
95
98
.1
101.
2 95
.0
G02
44
2
,000
99
.8
99.0
10
0.0
96.5
97
.7
98.6
96
.3
A
95
101.
3 10
3.3
101.
3 99
.3
G03
44
2,
500
100.
0 96
.0
97.6
10
2.0
99
.6
99.4
97
.4
A
95
96.7
97
.1
95.7
89
.0
106
.9
94.5
G
04
48
1,50
0 10
7.0
111.
1 10
0.0
98.8
10
9.3
105.
4 99
.4
A
95
102.
7 10
5.9
96.6
10
5.7
G05
48
1,
500
108.
0 11
4.0
111.
5 10
6.0
106.
0 10
9.2
97.9
A
95
10
5.0
104.
5 10
5.4
G06
15
15
0 99
.8
10
4.l
10
3 .4
10
0.5
102.
9 10
2.1
96.5
A
95
96
.7
96.9
97
.7
96.1
96
.2
G07
15
66
10
2.3
101.
2 98
.8
102
.1
101.
1 96
.0
A
95
96.3
94
.9
97.6
G
08
15
66
103.
2 11
4.0
109.
5 10
3.7
10
7.6
99
.3
A
95
99.5
10
2.9
96
.1
G09
48
2,
500
108.
7 10
7.0
10
7.1
104
.0
106.
7 96
.9
A
95
105.
9 10
3.3
11
0.1
10
4.2
GlO
15
17
4 10
2.5
104.
0 10
7.8
109
.2
105.
9 97
.7
A
95
99.1
99
.0
100.
0 98
.3
Gll
52
1,
000
108.
0 10
5.4
105.
9 10
9.0
107.
1 96
.4
A
95
96.8
94
.9
97.9
95
.9
98.8
G
l2
15
178
106.
8 10
7.3
107.
7 10
6.8
107.
1 95
.5
A
95
98.5
10
0.0
97.2
98
.4
Gl3
36
1,
000
104.
5 10
7.3
107,
9 10
4.9
10
6.l
96
.4
A
95
97.5
97
.3
95.9
99
.4
G14
48
1,
000
113
.1
90.5
10
2.3
10
8.0
98
.1
102.
4 10
3.1
R
95
G
15
30
48
100.
0 10
3.2
105.
7 10
3.5
1
03
.l
97.3
A
95
G
16
48
1,40
0 99
.0
107
.0
101.
5 10
3.0
87
.6
99.6
10
1.8
R
95
98.1
10
1.9
97.1
95
.4
Gl7
48
2,
000
96.0
10
0.0
99
.5
103.
1 10
5.2
100.
8 97
.1
A
95
96.3
94
.9
97.7
95
.3
97.4
G
18
60
3,00
0 11
5.0
103
.7
99.7
99
.4
98.0
10
3.2
101.
1 A
95
10
1.0
99.5
98
.7
95.5
10
3.5
100.
8 10
8.3
G
19
48
3,00
0 11
0.5
116
.5
112
.9
116
.1
119.
0 11
5.0
98.1
A
95
10
3.9
100.
2 10
3.6
10
5.5
103.
3 10
3.3
104.
9 G
20
48
3,0
00
113.
1 11
1.4
108.
5 10
9.0
111.
5 11
0.7
96
.7
A
95
102
.2
101.
4 10
1.6
105
.7
99.2
10
2.9
G
21
15
54
122.
4 11
0.9
12
0.7
103.
4 10
6.2
112.
7 10
1.9
A
95
99.3
98
.3
99.5
10
0.2
G22
12
54
12
3.0
114.
2 10
6.8
116.
6 11
6.1
115.
3 10
0.8
A
95
102.
8 10
1.2
107.
7 99
.4
G23
15
54
10
0.0
112
.0
105.
6 10
3.2
106.
3 10
5.4
99.3
A
95
10
1.3
100.
4 10
4.1
99.5
G
24
15
54
113.
0 10
7.5
106.
0 10
8.1
100.
5 10
7.0
99.5
A
95
10
2.9
101.
2 10
7.3
100.
1 G
25
66
1,00
0 10
1.5
102
.0
107
.5
108
.0
100.
1 10
3.8
97
.8
A
95
99.2
98
.3
100
.0
G26
48
1,
700
107.
1 10
4.2
10
7.4
106
.0
100.
4 10
5.0
97
.5
A
95
96.9
97
.7
97.3
96
.3
95.6
97
.3
G27
48
1,
000
111.
0 10
5.3
105.
1 10
4.0
107.
1 10
6.5
97.5
A
95
99
.9
101.
5 98
.4
G28
48
2,
000
103.
0 1
07
.l
103.
8 10
3.1
105.
1 10
4.4
96.5
A
95
98
.3
99.5
97
.7
97.6
G
29
48
2,00
0 10
9.2
104.
1 10
4.3
108.
1 10
6.4
97.0
A
95
98
.3
100.
7 95
.8
98.3
G
30
48
2,0
00
102.
6 10
9.0
11
1.4
109
.1
107.
6 10
7.9
98.2
A
95
97
.7
100.
2 95
.8
93.4
95
.4
97.3
98
.7
97.0
99
.3
101.
3 97
.1
97.8
98
.0
G31
15
21
0 11
1.5
101.
3 10
3.2
107
.1
109.
0 10
6.6
98.7
A
95
10
2.1
10
1.3
102.
9 G
32
15
208
111.
1 10
9.0
101.
0 11
0.8
103.
1 10
7.2
98.6
A
95
10
1.1
101.
1 10
1.1
G33
15
20
8 11
4.5
102
.9
108.
2 11
3.6
109.
5 10
9.7
99.2
A
95
G
34
15
210
109.
0 10
8.1
10
8.8
109.
3 10
1.2
107.
3 97
.9
A
95
G35
48
3
,000
11
0.5
104.
6 10
5.2
108.
1 11
5.0
108
.7
98.8
A
95
10
3.3
105.
8 10
4.2
10
4.3
98
.3
G36
60
2,
000
104.
0 10
5.0
104.
3 10
8.5
106.
2 10
5.9
96.6
A
95
10
0.3
98.3
10
2.1
100.
4
t,:,
co
30
.. .A-. ·" .
/ '- I . J . . . \.-·" - V '-.J ·'-.._,.
\ / ·..J
95r----------------------------+------------
3 5 7 9 11 13 15 17 19 21 23 25 27 29 31 33 35
Lot Numbers
Figure 1. Required and measured average compaction values for project 3.
110
C: 0
,,< .µ 0
"' 105 ~ 0 u
""
100
/\ .I''\ / /'\
/' v,,. / ' / v ' \ \ I ' I \ I I ' I
I \ A ..._---\ I \ I '--...J ✓
L_/ \I '..J " 951--~-----,--....---r---.----,--.----r----.---,--.,......-"T""--r----.--.,......--r--
1 5 9 13 17 21 25 29 33
Lot Number
Figure 2. Average compaction values obtained from highway department and research data for project 3.

31
Briefly, the moving average method works as follows: (a) Sample locations are determined through the use of nonbiased sample cards (a form of random numbers); (b) individual density tests are performed; (c) tbe moving average is calculated where the moving average is the average of the 4 most recent test results representing acceptable material plus the test result from the material being considered for acceptance; and (d) the moving average is plotted on a control chart that provides visual evidence of the quality of construction. Generally, specifications will require both individual test and moving average test results to be within specified limits; if these limits are exceeded, the material does not meet the specifications. By noting trends on the control chart, the contractor is able to correct his process prior to test points exceeding the limits.
The report (~) lists the following advantages of using the moving average approach:
1. More information is available to the engineer than is available when only a single test result is considered;
2. Randomly occurring "extreme" values are identified; 3. When plotted on a control chart, trends in material quality or uniformity can be
readily observed; 4. When compared to a full statistical specification, fewer tests are required for
control; and 5. The precision of the test result can be controlled depending on the number of
tests included in the running average, thereby increasing the reliability of the decisionmaking process.
The 1967 construction specifications for the Mississippi State Highway Department employ a compaction specification based on the moving average (4). The roadway area is divided into lots of sizes specified in the contract or in the department's standard operating procedures. Tests are taken at predetermined random sample locations. However, the engineer on visual inspection may take other samples as he deems necessary. The program is set up to have a number of tests at the start of the project and, if the compaction is satisfactory, to be followed by minimum testing.
The test area concept has been used in V:lrginia and California for density control of subgrade and base course work. In California (5) the procedure is as follows: An area to be tested is divided into 3 subareas; in each subarea, 2 nuclear density tests are taken at random locations determined by the engineer; the percentage compaction is determined for each test based on a single maximum dry density value for the area; and for the compaction of each subarea to be accepted, the average of the 2 percent compaction values must be more than the required compaction value, and no more than one of the individual tests may be less than the required compaction. Therefore, one or both of the subareas may fail.
The area concept is limited to locations where the soil is uniform. However, if it is modified to the extent that for each variation in soil a new maximum dry density test was performed, then it can be applied to locations of nonuniform soil.
QUALITY ASSURANCE: COMPARISON OF CURRENT AND TRIAL SPECIFICATIONS
The reason for securing samples of compacted soils is to gain information on the adequacy of the compaction. It has been established that there is considerable variation in the degree of compaction in any lot. This variability will cause the data to take the form of any one of the bell-shaped frequency distribution curves shown in Figure 3, which is included to show possible levels of compaction in the lot. A specification limit is indicated. The percentage of the lot with compaction less than the specification limit is the percentage defective and is shown in the figure.
When samples are drawn from lot a, the probability of accepting the lot would be 100 percent because all the values are above the specification limit. Likewise, the probability of accepting lot e would be O percent because none of the samples is above the specification limit. For lots b, c, and d, the probability of accepting the lots lies between O and 100 percent. This depends on the percentage of the lot that is defective and the number of samples taken from the lot for the purpose of determining the acceptability.

Perc
en
t D
efe
cti
ve,
Bel
ow
S
pec.
Lim
it
0'11
2. _g_
(e)
Lo
wer
S
pecif
icati
on
L
:.!Q
it
(d)
(a)
Ty
pic
al
Fre
qu
en
cy
D
istr
ibu
tio
n o
f all
S
am
ple
s in
'----
Fig
ure
3.
Exa
mpl
es o
f le
vels
of
com
pa
ctio
n.
.... s QJ
.<: .... t,,
i:: .... .... '2o
QJ u u ..: "' 0 >, .... .... ... .... .Q
111
.Q
0 ... Q.,
10
0
90
80
70
60
50
40
30
L
20
10
-~ \
Tri
al
Sp
ecif
icati
on
s
n =
3
n =
nu
mb
er o
f te
sts
in
sa
mp
le
n =
1
wit
h
ch
eck
te
st
0 --
0 1
0
20
30
4
0
50
6
0
70
8
0
90
Perc
en
t D
efe
cti
ve in
L
ot
Fig
ure
4.
Com
pari
son
of
sam
plin
g pl
ans.
10
0
C,)
i:
-,

33
The relationship between the probability of accepting a lot and the percentage defective in the lot can be developed for different sampling plans. This has been done for the trial specifications and other sampling plans and is shown in Figure 4. The 3 lower lines are for the trial specifications of sample sizes 3, 4, and 5. They are based on Military Standard 414 with 20 percent defective material (6). The straight diagonal line is for a sampling plan based on a single test. The upper line is for a sampling plan that states that, if the first test is below specifications, take another test; if that is also below specifications, reject the lot.
When sampling plans are compared, it should first be noted that all sampling plans give the same results if the lot is either less than 0 percent or more than 100 percent defective. The trial specifications will accept 50 of 100 lots that are 20 percent defective, while n = 1 and n = 1 with check test will accept 80 and 96 of 100 lots respectively. There is less than a 5 percent chance of accepting lots with 70 percent defective when the trial specifications are used; however, the other sampling plans give probabilities of 30 and 50 percent. In conclusion, the trial specifications provide less chance of accepting defective material.
SUMMARY AND RECOMMENDATIONS
The investigation has brought out the following advantages in using a statistically based construction specification for embankment compaction as compared to the current method based on representative samples and a specified minimum compaction.
1. Random sampling produces an unbiased estimate of average compaction, while representative sampling produces results above or below the true average depending on the judgment of the inspector (Fig. 2).
2. The statistically based specifications produce gr eater uniformity of contract enforcement, and this results in better contractor relations.
3. There is a much greater chance of accepting poor quality construction from a sampling plan based on a single test result or a single test with check test than from a statistically based acceptance sampling plan (Fig. 4).
4. The proposed statistically based specification provides an incentive for the contractor to reduce the variability in the construction in that the required level of com -paction is dependent on the range in test results.
5. The compaction level under the statistically based construction specifications is at the same level as that currently produced in acceptable construction in North Dakota.
6. The trial application of the statistically based specifications indicated that, of 60 lots accepted by the state, 2 lots would be rejected under the trial specifications. This does not mean there will be more rejections under the trial specifications, because 9 of the 67 lots accepted by the trial specifications could have been rejected by the state in that they contain compaction values below the specification limit (Tables 1, 2, and 3).
Certain problems will be encountered in a change in specifications. These include the following:
1. There will be a change in the frequency of sampling. This will depend on the acceptance plan employed, size of project, rate of construction, and testing equipment available to the inspector. For example, if a statistically based specification employing a sample size of three were used, this would have doubled the highway department's sampling frequency on project 1 and reduced the sampling frequency by 10 percent on project 3.
2. Equipment needs will increase if nuclear moisture-density instruments are employed. However, manpower needs will decrease in that 1 man with a nuclear instru -ment can carry out more tests than 2 men with water-balloon in-place density equipment.
3. An educational effort is necessary for inspectors as well as for administrative engineers not on the mechanics of employing the specification, for this is relatively simple, but rather on the concepts that a number of random samples are of far more value than representative samples and that variability is a normal characteristic of acceptable construction.
34
ACKNOWLEDGMENTS
This research project was carried out at the Engineering Experiment Station of the North Dakota State University and was sponsored by the North Dakota State Highway Department in cooperation with the Federal Highway Administration. Without the cooperation of personnel in the central and district offices of the highway department, this work could not have been completed. Their contribution is gratefully acknowledged.
REFERENCES
1. Jorgenson, J. L. The Statistical Approach to Quality Control in Highway Construction, Phase I, Measuring the Variability, Part A, Compacted Embankments. Eng. Exp. Station, North Dakota State Univ., Fargo, No. 15, Nov. 1968.
2. Development of Guidelines for Practical and Realistic Construction Specifications. NCHRP Rept. 17, 1965, p. 27.
3. Sherman, G. B., and Watkins, R. 0. Statistical Quality Control of Construction Materials. California Division of Highways, Sacramento, Research Rept. M and R 631133-9, May 1968.
4. Standard Specifications for Road Construction. Mississippi State Highway Department, Jackson, 1967.
5. Weber, W. G., Jr., and Smith, T. Practical Application of the Area Concept to Compaction Control Using Nuclear Gages. Highway Research Record 177, 1967, pp. 144-156.
6. Bowker, A. H., and Lieberman, G. J. Engineering Statistics. Prentice-Hall, Englewood Cliffs, N.J., 1959, p. 471.


![Acceptance Sampling[1]](https://img.pdfslide.us/doc/110x75/54cd28584a7959f64d8b459c/acceptance-sampling1.jpg)