Embed Size (px)
Citation preview

Development and Reliability of Standard Land Development
Models
Robert Pitt1, Celina Bochis2, and Geosyntec Project Team Members
1Cudworth Professor of Urban Water Systems, University of Alabama, Tuscaloosa 2Former Postdoctoral Researcher, University of Alabama, Tuscaloosa
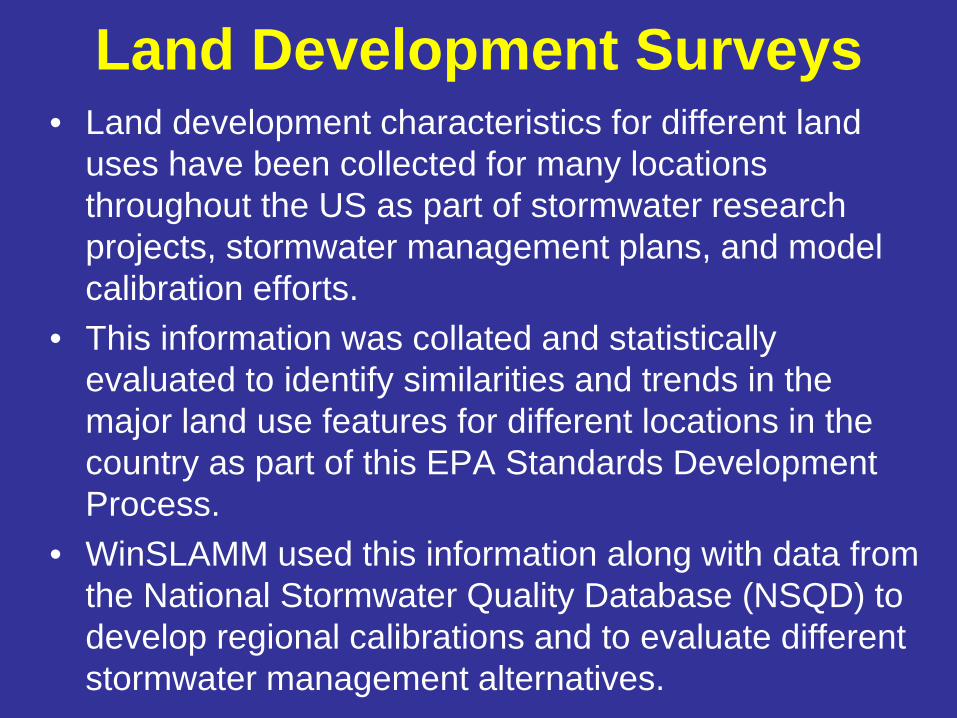
Land Development Surveys • Land development characteristics for different land
uses have been collected for many locations throughout the US as part of stormwater research projects, stormwater management plans, and model calibration efforts.
• This information was collated and statistically evaluated to identify similarities and trends in the major land use features for different locations in the country as part of this EPA Standards Development Process.
• WinSLAMM used this information along with data from the National Stormwater Quality Database (NSQD) to develop regional calibrations and to evaluate different stormwater management alternatives.
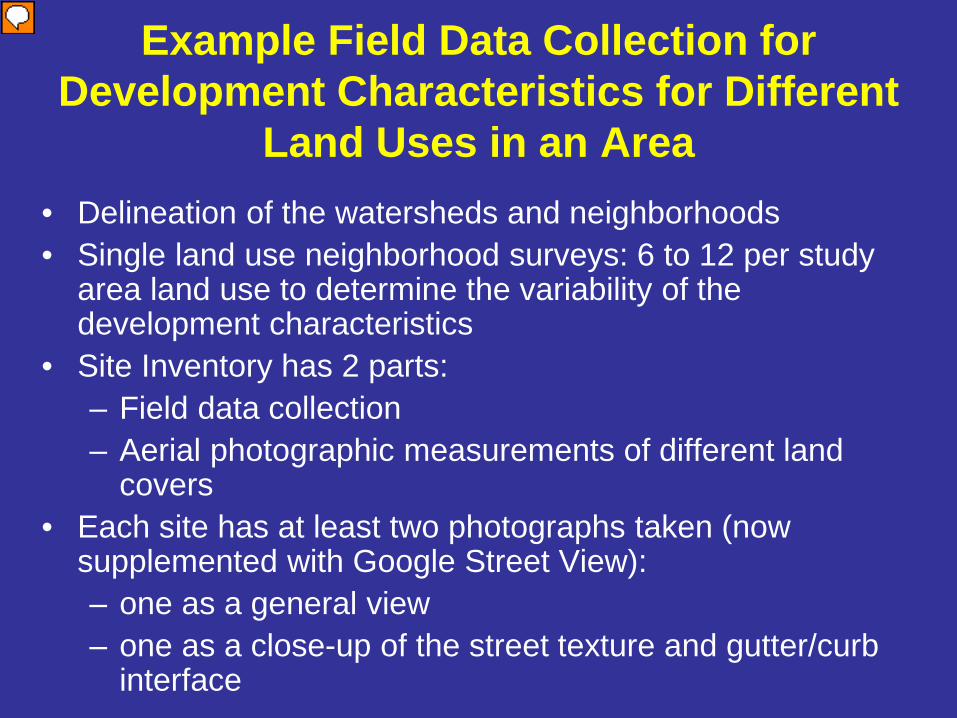
Example Field Data Collection for Development Characteristics for Different
Land Uses in an Area • Delineation of the watersheds and neighborhoods • Single land use neighborhood surveys: 6 to 12 per study
area land use to determine the variability of the development characteristics
• Site Inventory has 2 parts: – Field data collection – Aerial photographic measurements of different land
covers • Each site has at least two photographs taken (now
supplemented with Google Street View): – one as a general view – one as a close-up of the street texture and gutter/curb
interface
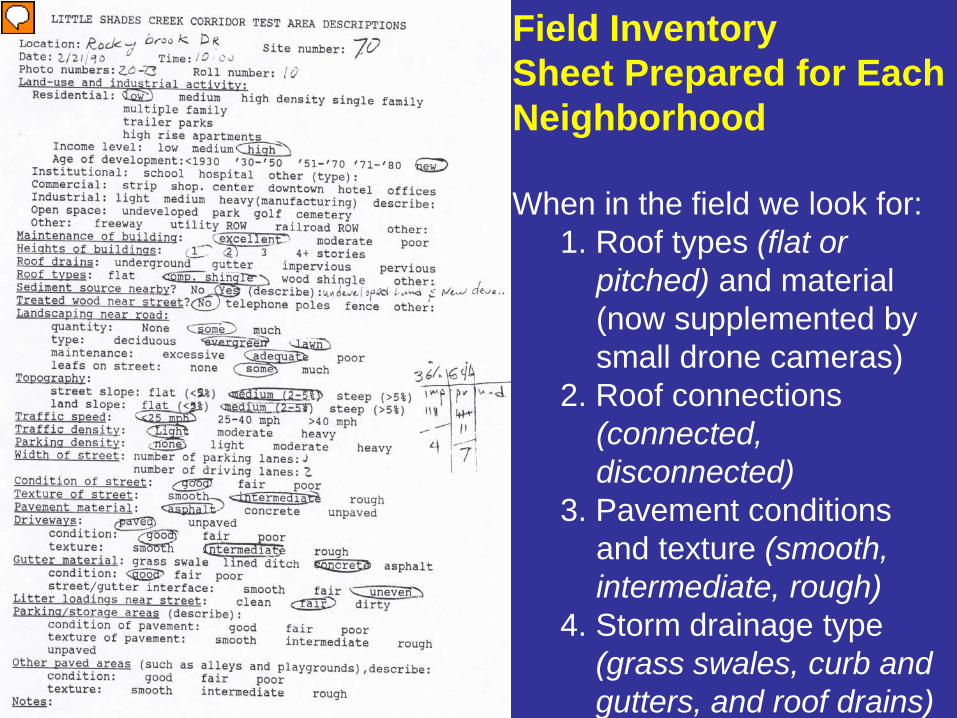
Field Inventory Sheet Prepared for Each Neighborhood When in the field we look for:
1. Roof types (flat or pitched) and material (now supplemented by small drone cameras)
2. Roof connections (connected, disconnected)
3. Pavement conditions and texture (smooth, intermediate, rough)
4. Storm drainage type (grass swales, curb and gutters, and roof drains)
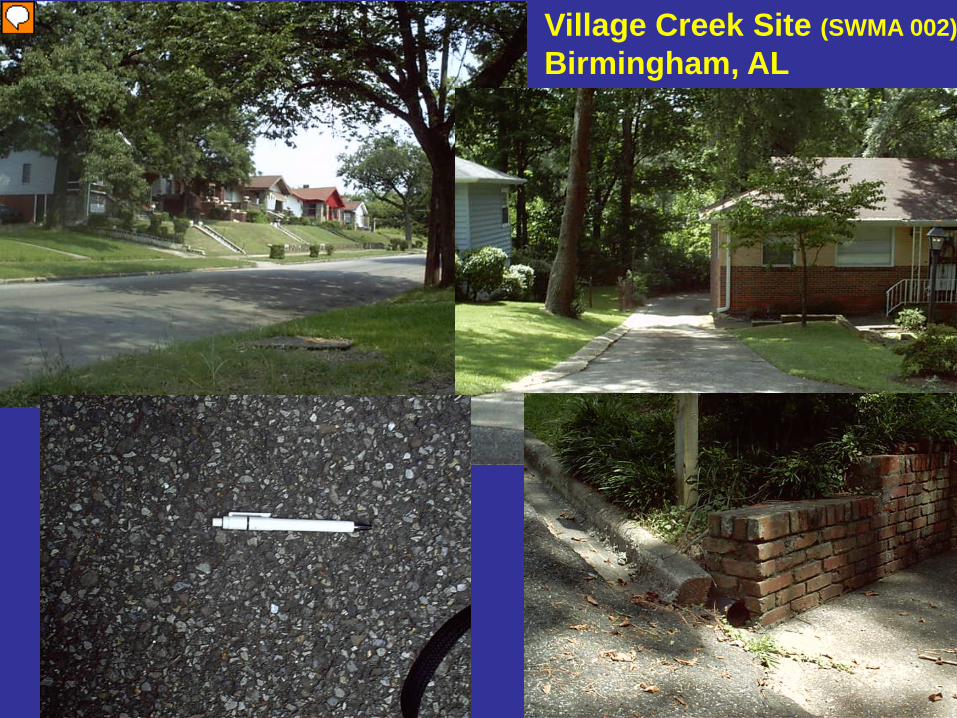
Village Creek Site (SWMA 002) Birmingham, AL
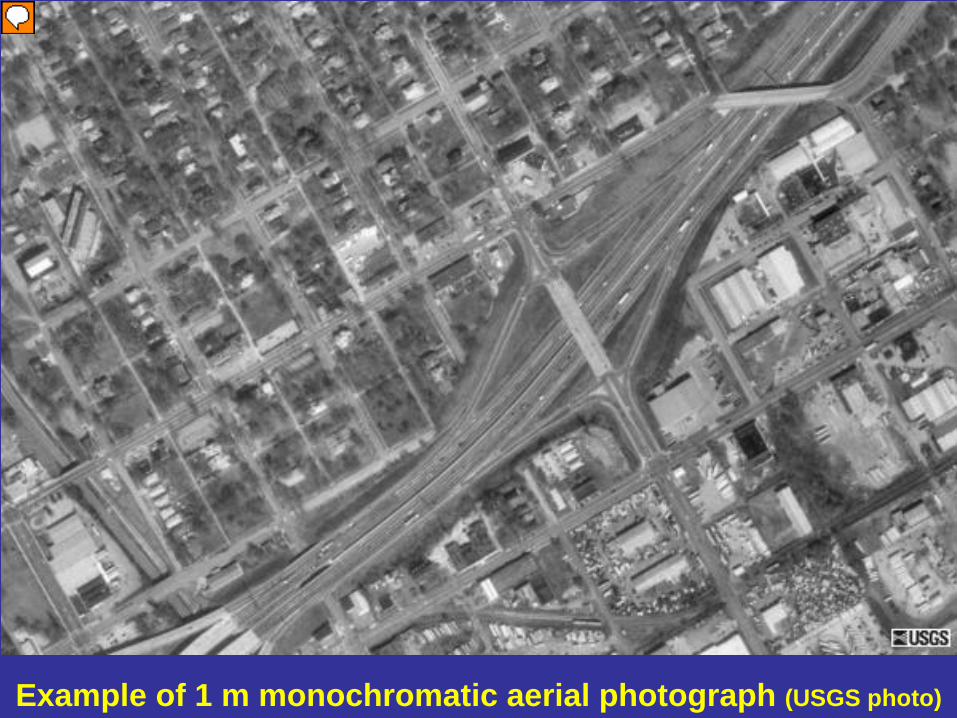
Example of 1 m monochromatic aerial photograph (USGS photo)
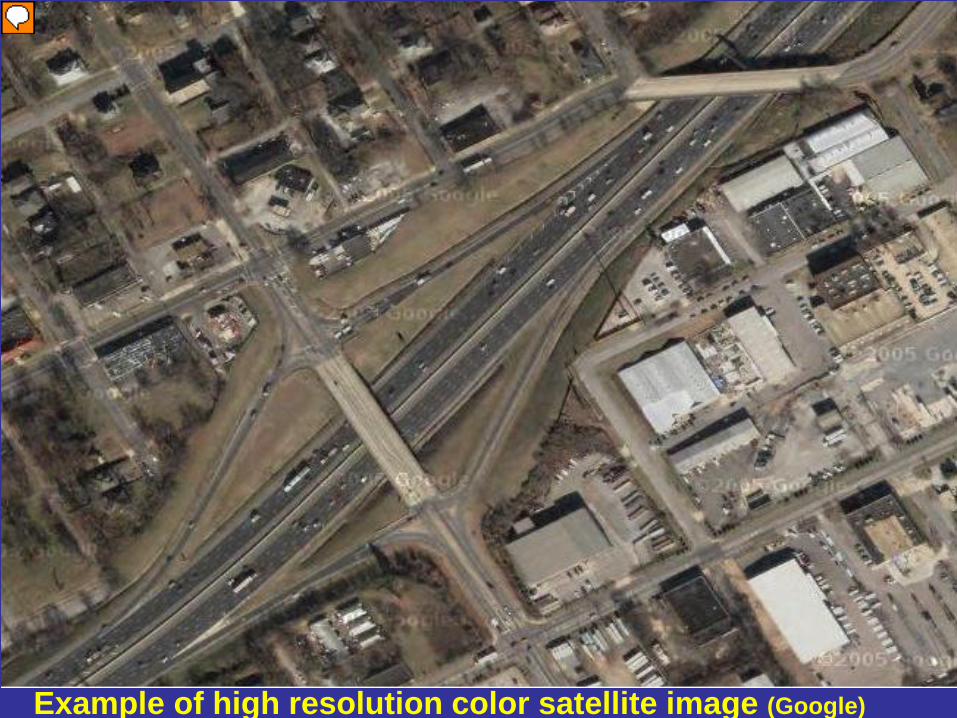
Example of high resolution color satellite image (Google)
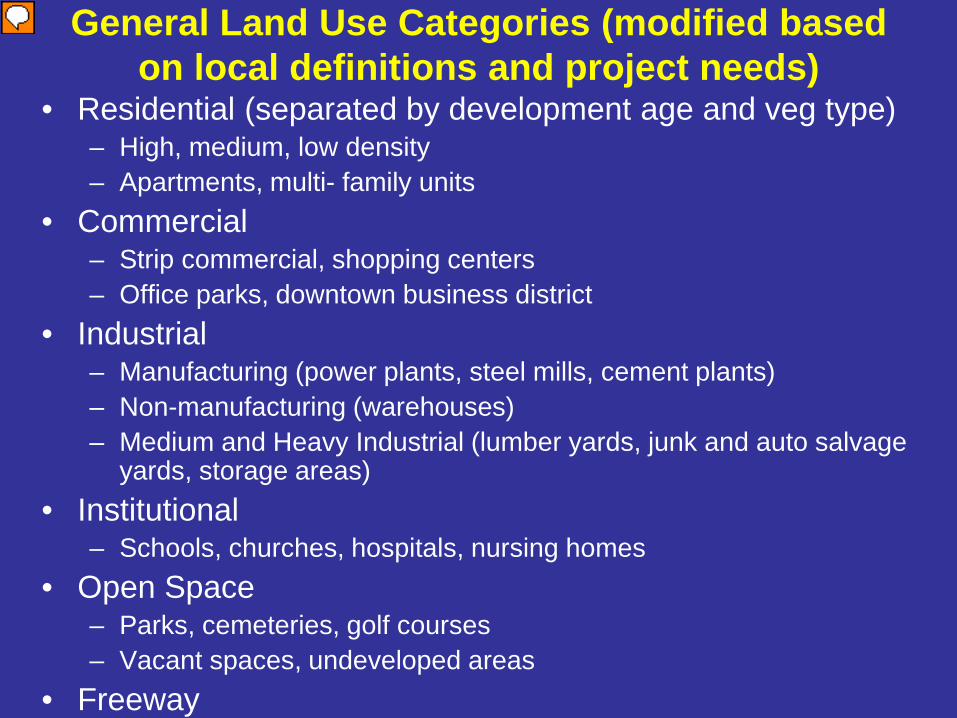
General Land Use Categories (modified based on local definitions and project needs)
• Residential (separated by development age and veg type) – High, medium, low density – Apartments, multi- family units
• Commercial – Strip commercial, shopping centers – Office parks, downtown business district
• Industrial – Manufacturing (power plants, steel mills, cement plants) – Non-manufacturing (warehouses) – Medium and Heavy Industrial (lumber yards, junk and auto salvage
yards, storage areas) • Institutional
– Schools, churches, hospitals, nursing homes • Open Space
– Parks, cemeteries, golf courses – Vacant spaces, undeveloped areas
• Freeway
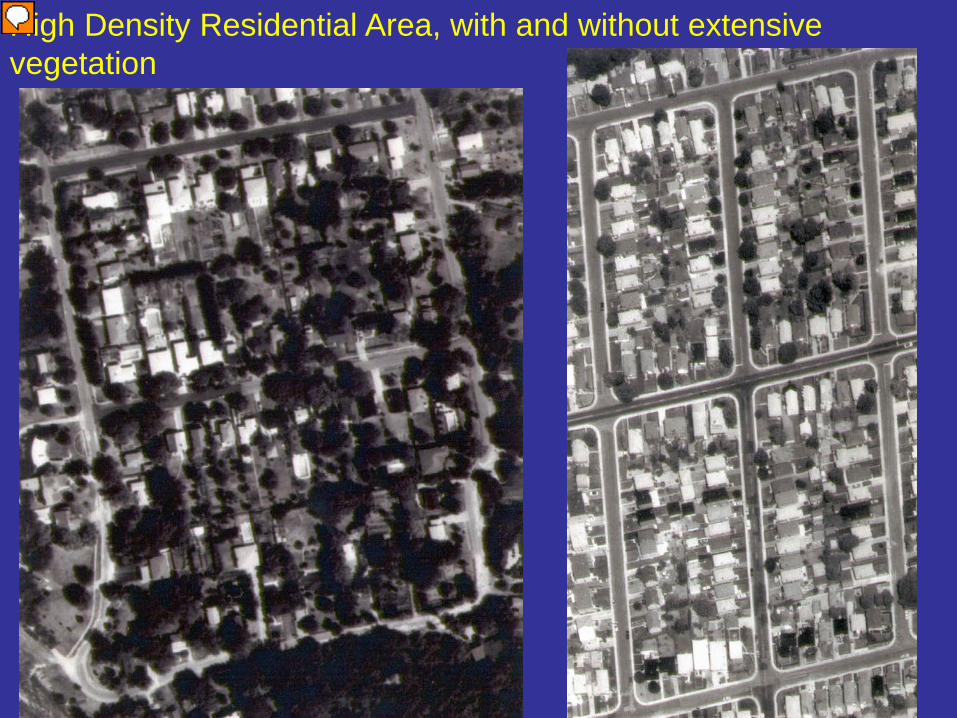
High Density Residential Area, with and without extensive vegetation
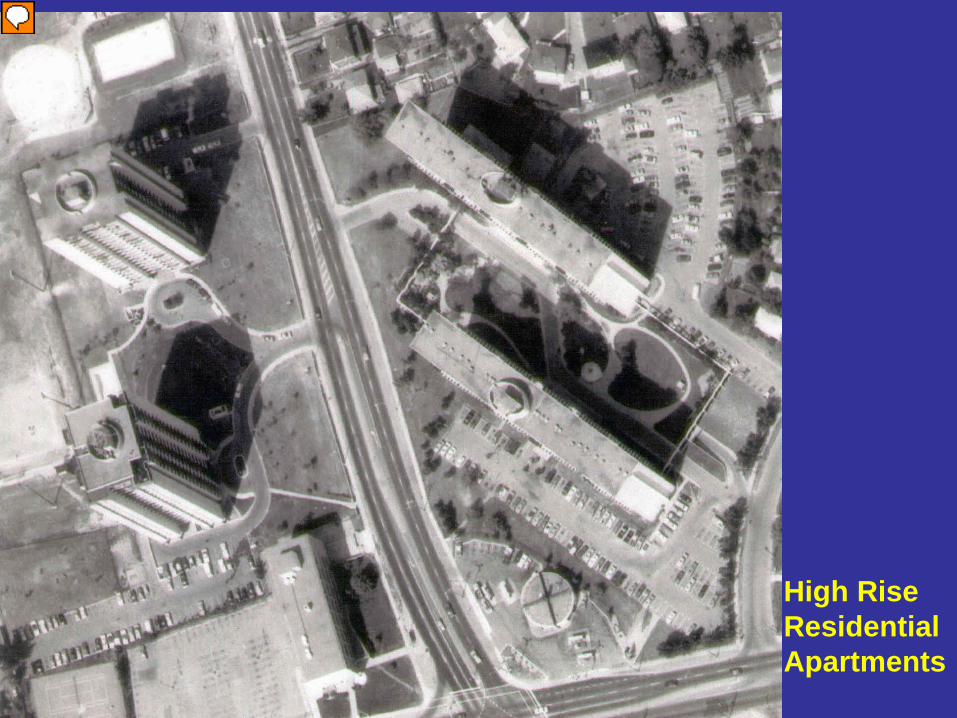
High Rise Residential Apartments
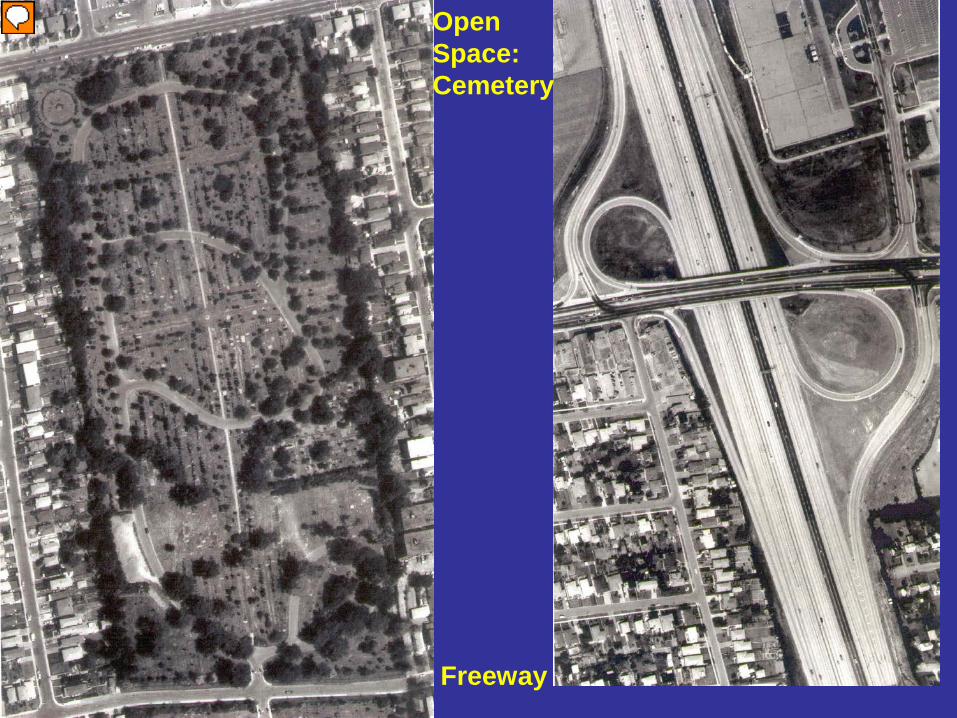
Open Space: Cemetery
Freeway
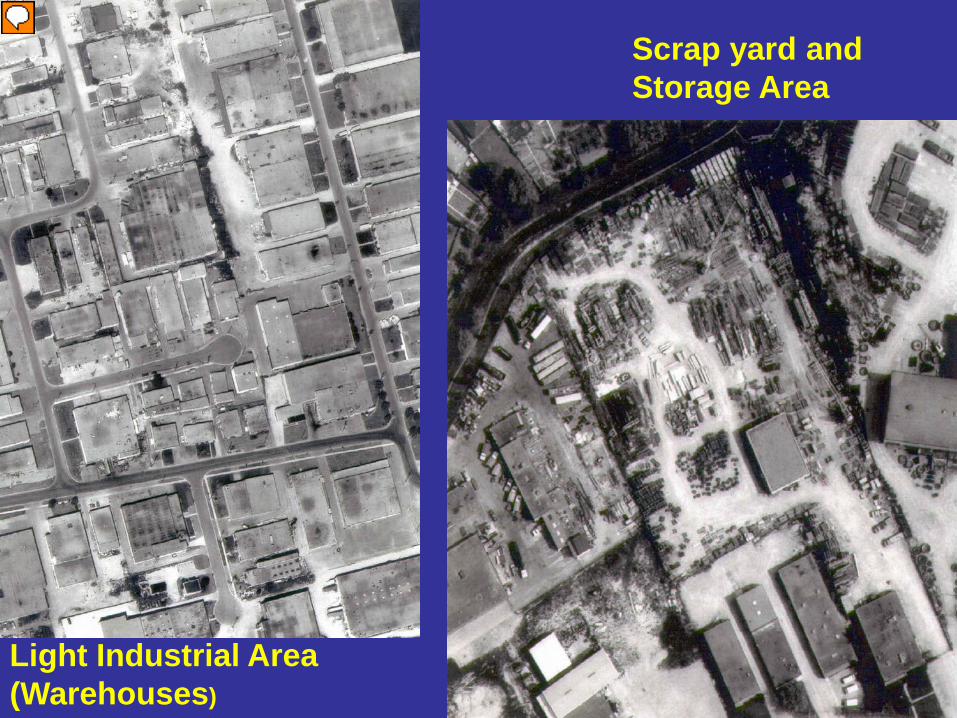
Light Industrial Area (Warehouses)
Scrap yard and Storage Area
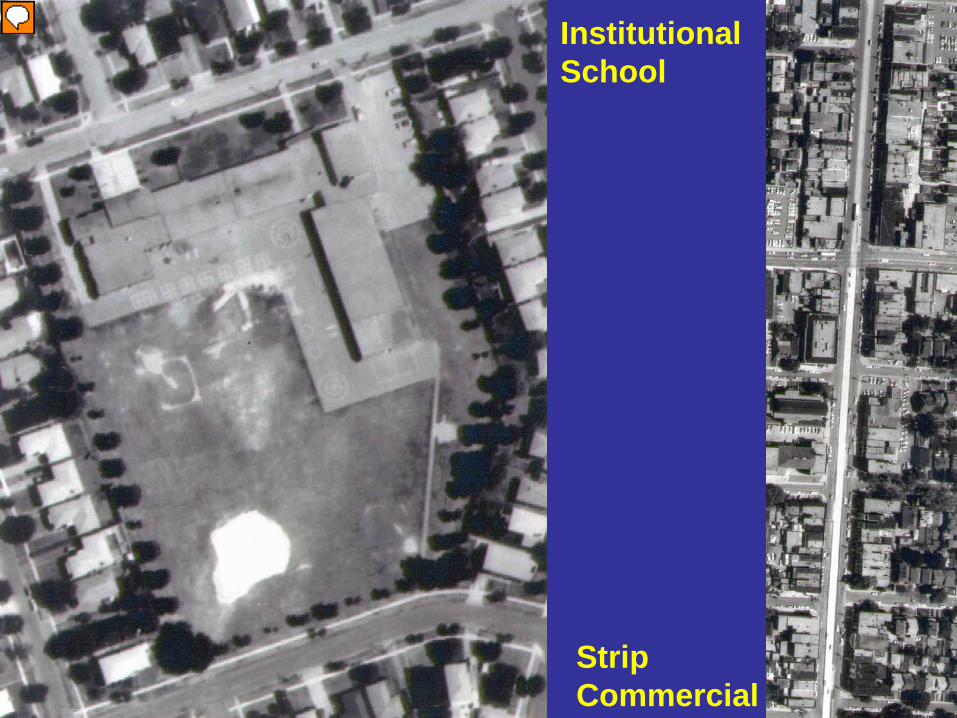
Institutional School
Strip Commercial
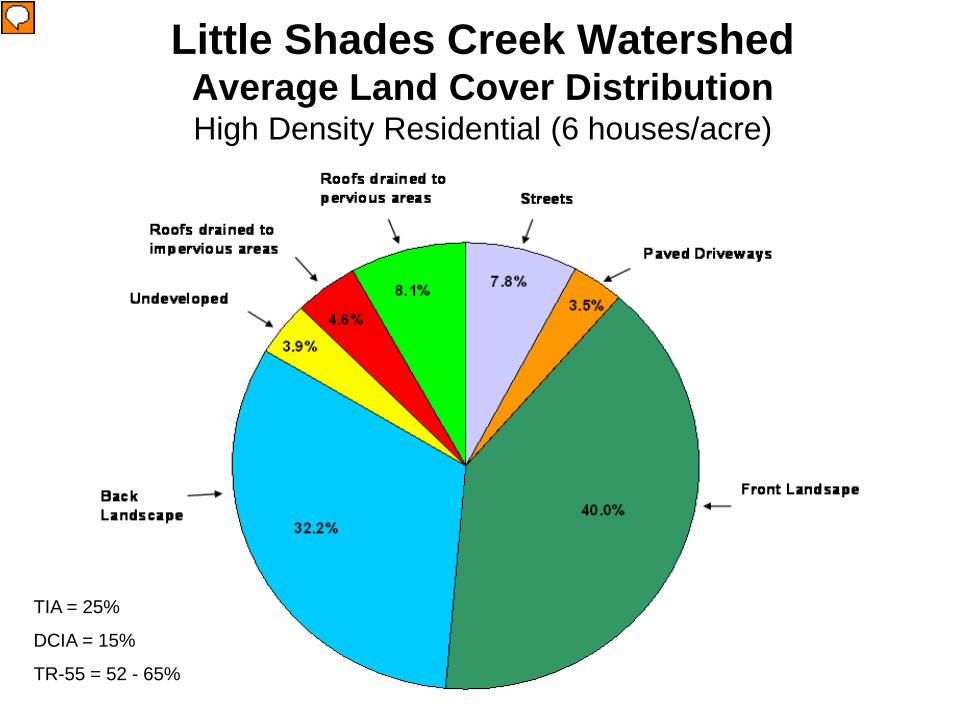
Little Shades Creek Watershed Average Land Cover Distribution High Density Residential (6 houses/acre)
TIA = 25%
DCIA = 15%
TR-55 = 52 - 65%
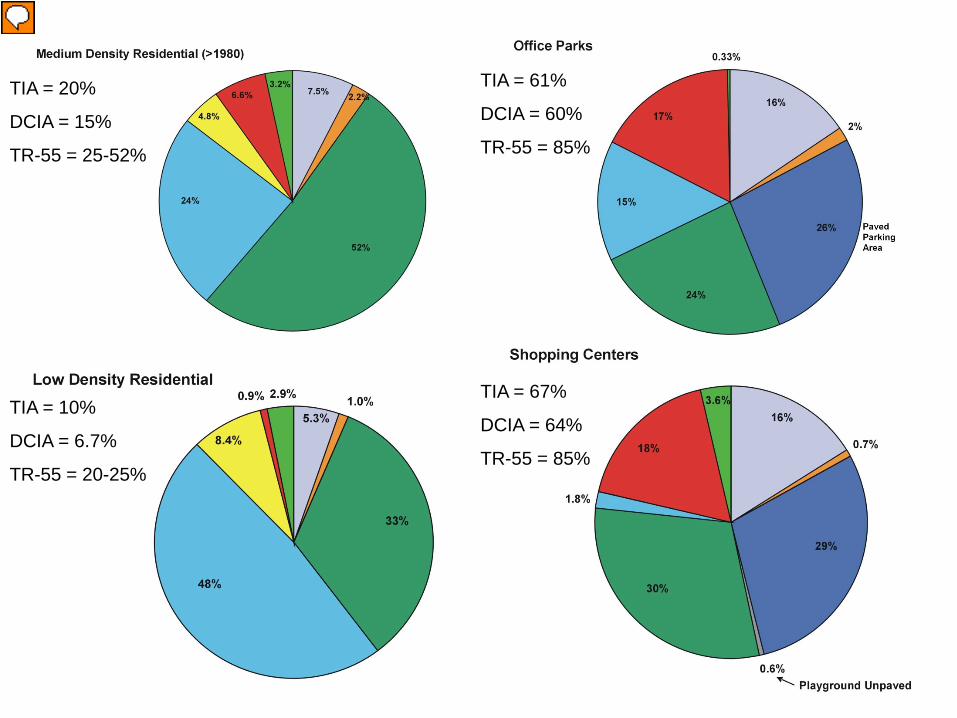
TIA = 20%
DCIA = 15%
TR-55 = 25-52%
TIA = 10%
DCIA = 6.7%
TR-55 = 20-25%
TIA = 61%
DCIA = 60%
TR-55 = 85%
TIA = 67%
DCIA = 64%
TR-55 = 85%
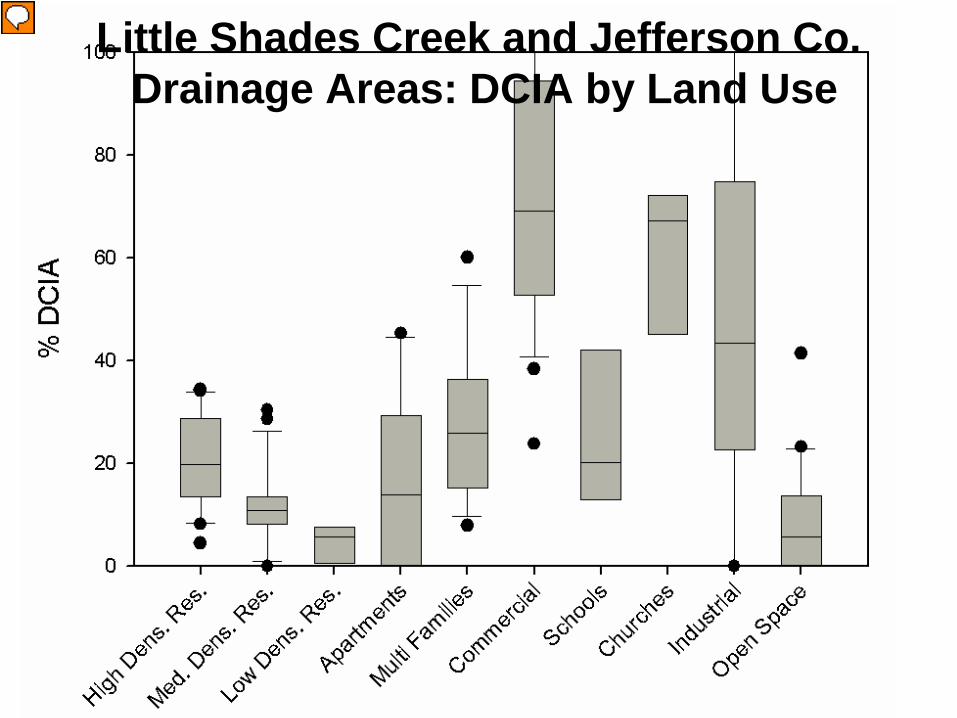
Little Shades Creek and Jefferson Co. Drainage Areas: DCIA by Land Use
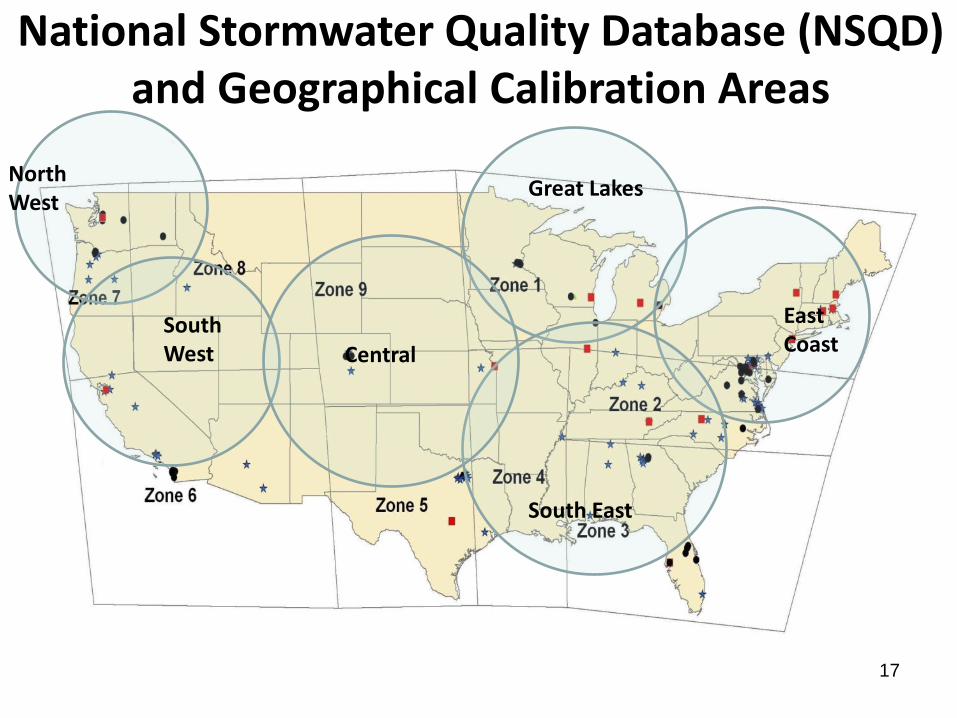
Great Lakes
East Coast
South East
Central
North West
South West
National Stormwater Quality Database (NSQD) and Geographical Calibration Areas
17
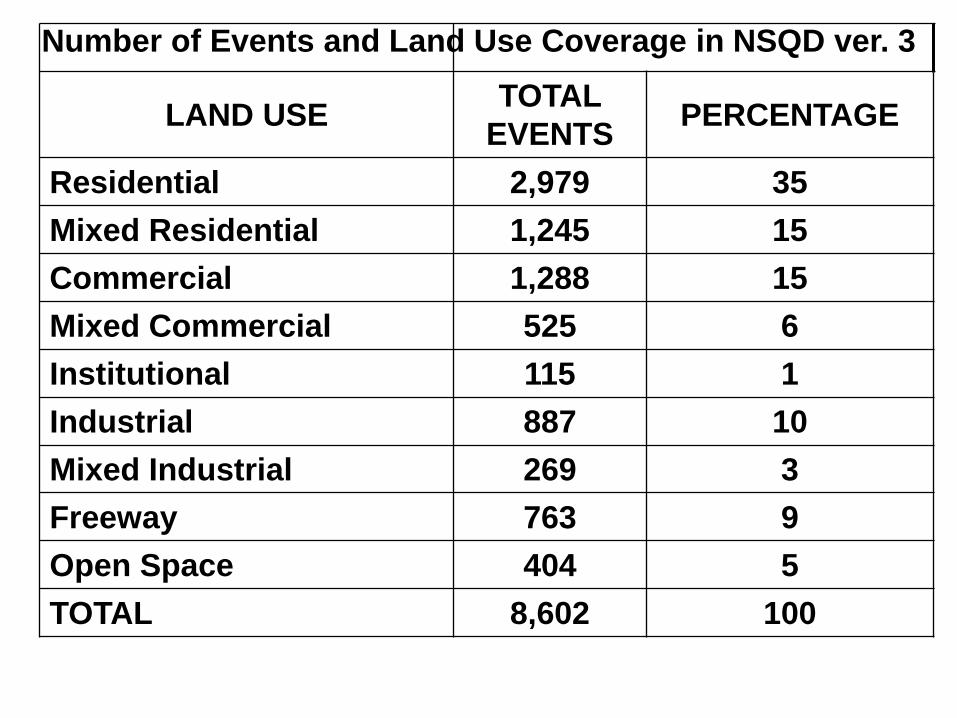
LAND USE TOTAL EVENTS PERCENTAGE
Residential 2,979 35 Mixed Residential 1,245 15 Commercial 1,288 15 Mixed Commercial 525 6 Institutional 115 1 Industrial 887 10 Mixed Industrial 269 3 Freeway 763 9 Open Space 404 5 TOTAL 8,602 100
Number of Events and Land Use Coverage in NSQD ver. 3
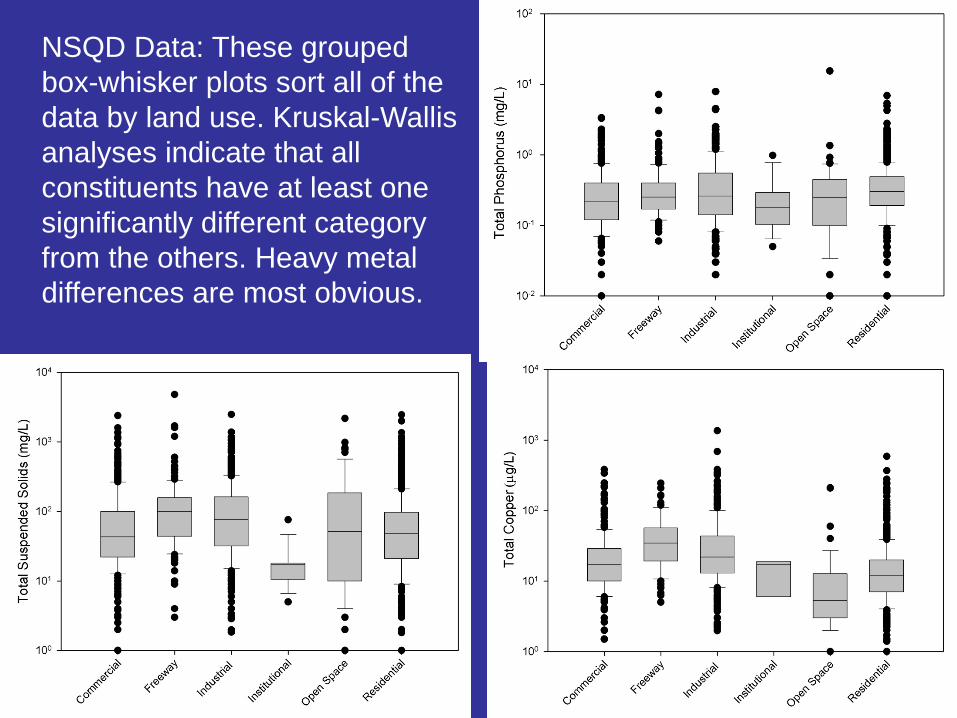
NSQD Data: These grouped box-whisker plots sort all of the data by land use. Kruskal-Wallis analyses indicate that all constituents have at least one significantly different category from the others. Heavy metal differences are most obvious.
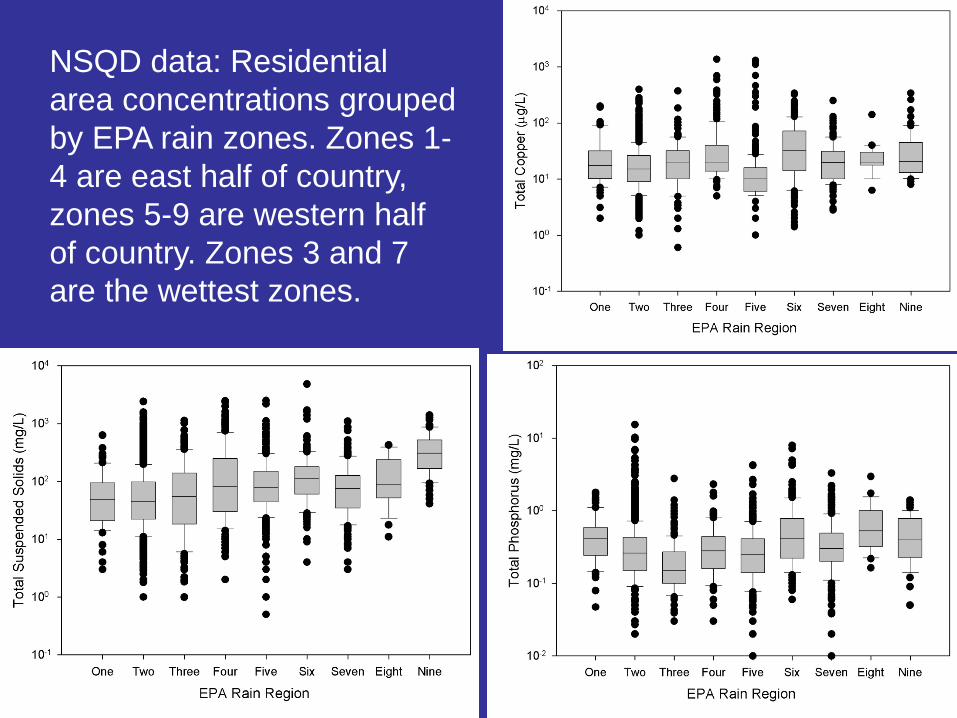
NSQD data: Residential area concentrations grouped by EPA rain zones. Zones 1-4 are east half of country, zones 5-9 are western half of country. Zones 3 and 7 are the wettest zones.
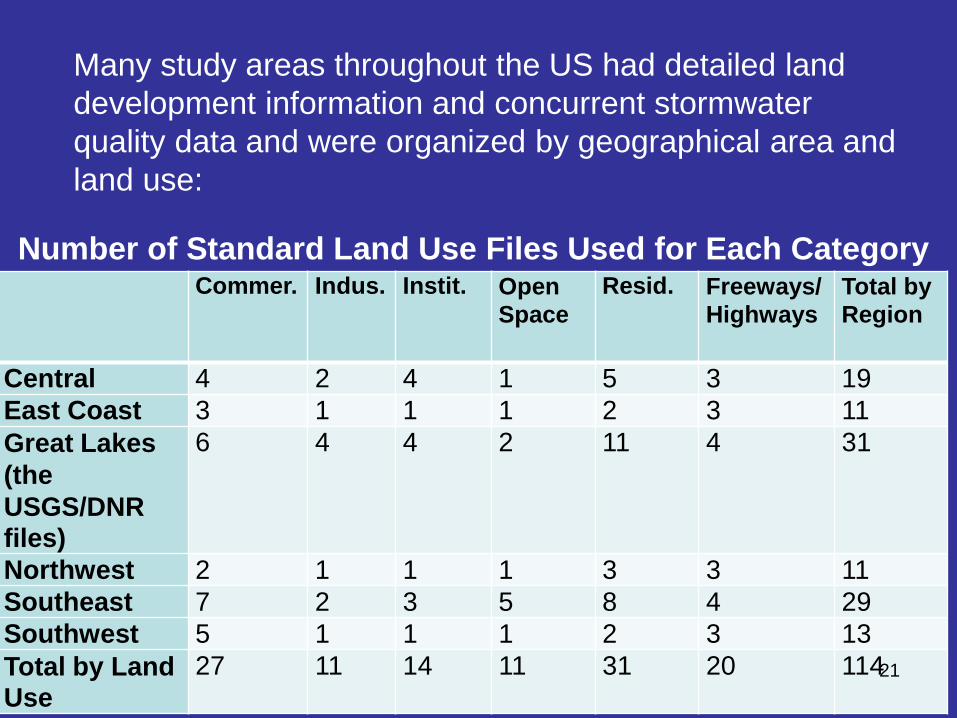
Commer. Indus. Instit. Open Space
Resid. Freeways/Highways
Total by Region
Central 4 2 4 1 5 3 19 East Coast 3 1 1 1 2 3 11 Great Lakes (the USGS/DNR files)
6 4 4 2 11 4 31
Northwest 2 1 1 1 3 3 11 Southeast 7 2 3 5 8 4 29 Southwest 5 1 1 1 2 3 13 Total by Land Use
27 11 14 11 31 20 114
Number of Standard Land Use Files Used for Each Category
21
Many study areas throughout the US had detailed land development information and concurrent stormwater quality data and were organized by geographical area and land use:
22
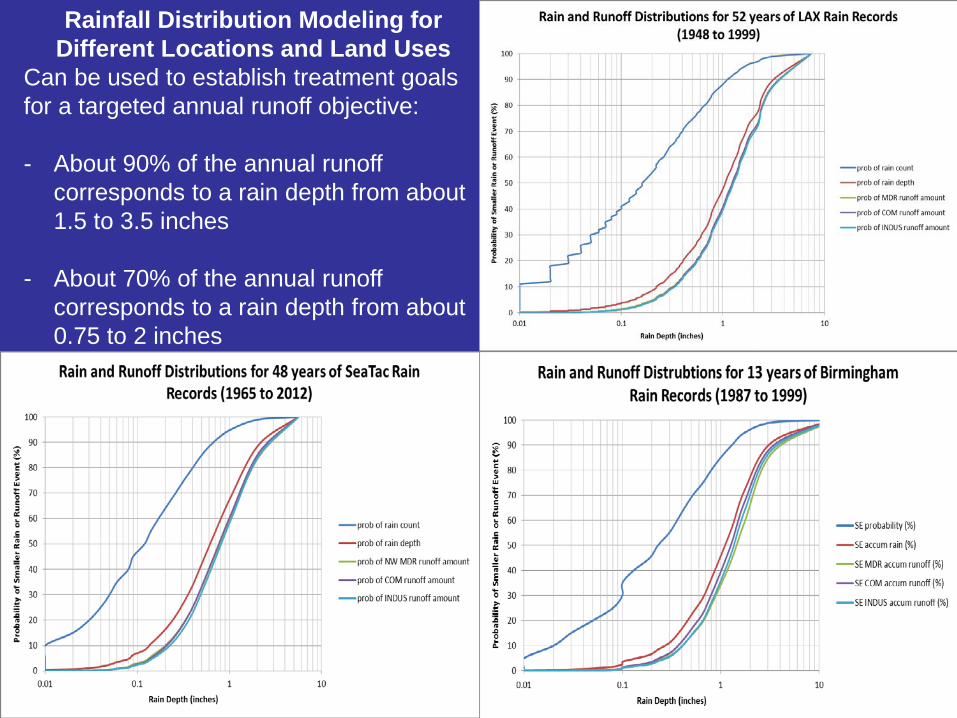
Rainfall Distribution Modeling for Different Locations and Land Uses
Can be used to establish treatment goals for a targeted annual runoff objective: - About 90% of the annual runoff
corresponds to a rain depth from about 1.5 to 3.5 inches
- About 70% of the annual runoff corresponds to a rain depth from about 0.75 to 2 inches
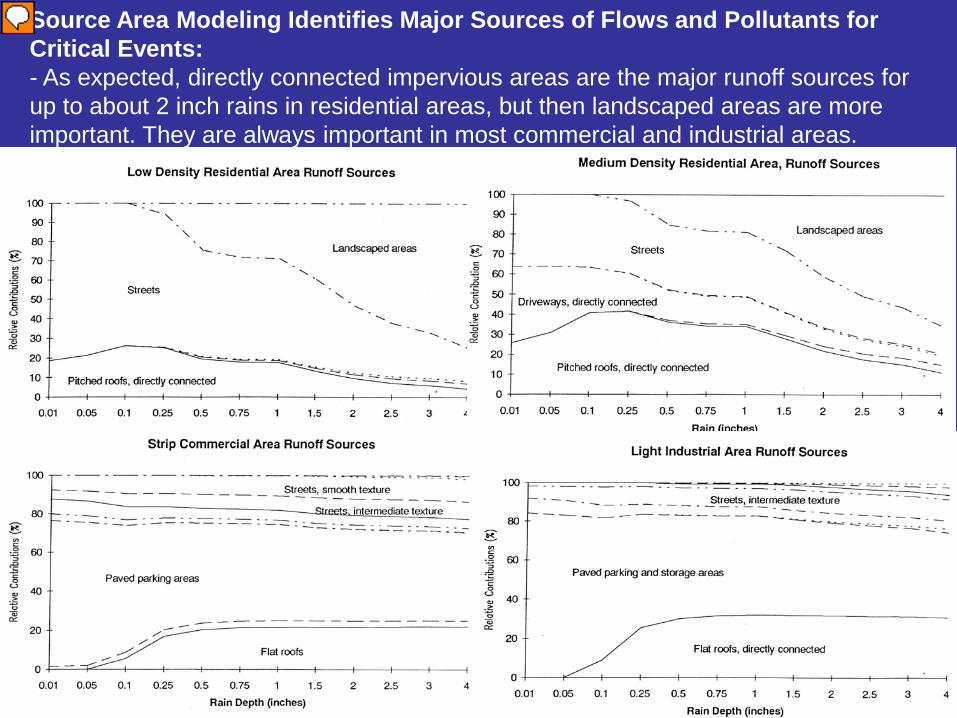
Source Area Modeling Identifies Major Sources of Flows and Pollutants for Critical Events: - As expected, directly connected impervious areas are the major runoff sources for up to about 2 inch rains in residential areas, but then landscaped areas are more important. They are always important in most commercial and industrial areas.
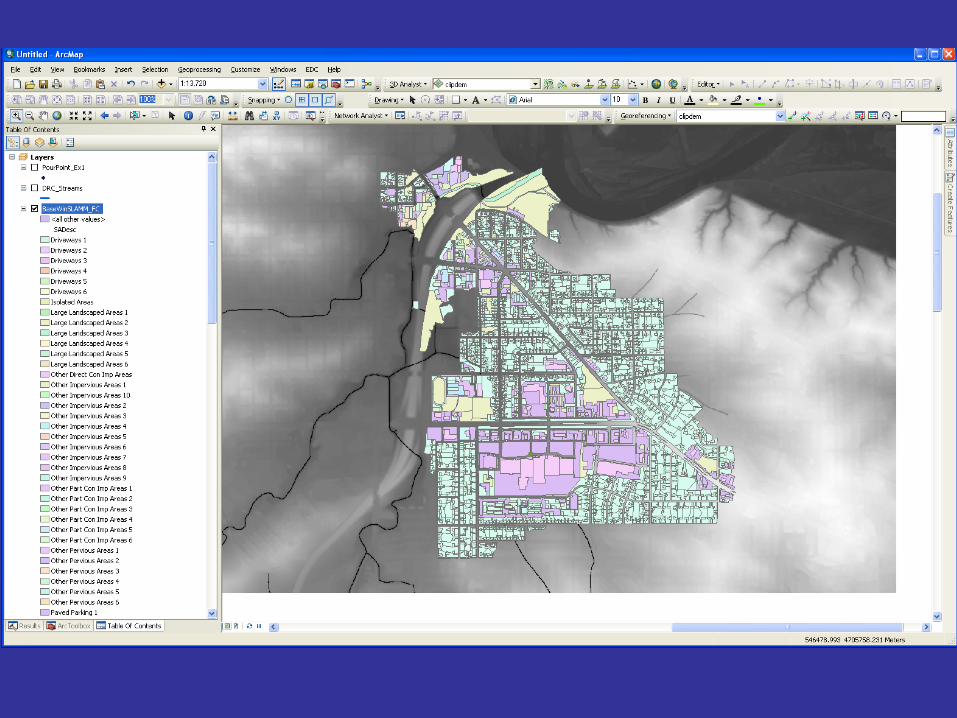
ArcGIS and WinSLAMM • Typically user might use GIS to develop source
areas and then manually enter values into the WinSLAMM interface
• Developing databases and tools to automate that process
• ArcSLAMM tool will produce WinSLAMM compliant databases per drainage or catchment area which can then be run in batch mode through WinSLAMM
Conclusions • Standard land use information and associated
development characteristics affect stormwater quality and quantity.
• Surface coverage of different elements in each land use do not vary as much throughout the country as does random variations in directly connected imperviousness.
• Obtaining regional standard land use information is a good investment, but it requires field work and evaluation of aerial imaging.
Conclusions (cont.)
• Historical tools used to automate the collection of this information was found to result in significant errors.
• Newer high resolution tools (such as 6 inch LiDAR, light detection and ranging) has been shown to be quite effective in the collection of most of this data, but field surveys are still needed for supplemental information.