Embed Size (px)
Citation preview

Development and Implementation of a Mechanistic and E mpirical
Pavement Design Guide (MEPDG) for Rigid Pavements
ANNUAL REPORT FOR FY 2009 ODOT SPR ITEM NUMBER 2208
Submitted to: Ginger McGovern, P.E.
Planning and Research Division Engineer Oklahoma Department of Transportation
200 N.E. 21st Street Oklahoma City, Oklahoma 73105
Submitted by:
Tyler Ley, Shardul Kadam, Robert Frazier and Bret Robertson Oklahoma State University
Civil and Environmental Engineering 207 Engineering South
Stillwater, Oklahoma 74078
Kyle Riding Kansas State University
Civil Engineering 2118 Fiedler Hall
Manhattan, Kansas 66506
September 30, 2009
1

The contents of this report reflect the views of the authors responsible for the facts and the accuracy of the data presented herein. The contents do not necessarily reflect the views of the Oklahoma Department of Transportation or the Federal Highway Administration. This report does not constitute a standard, specification, or regulation. While trade names may be used in this report, it is not intended as an endorsement of any machine, contractor, process or product.
2

1.0 Overview
This document is an update of the progress of the research on ODOT project 2208
“Development and Implementation of a Mechanistic and Empirical Pavement Design Guide
(MEPDG) for Rigid Pavements”. This report summarizes the work that was completed at
Oklahoma State University between October 1st
, 2008 and September 30th
, 2009. The focus of
this project is on assisting ODOT in implementing the MEPDG into their rigid pavement design
practices. It was decided to best accomplish this goal by completing the following tasks:
A. Review of the inputs to the MEPDG and determine the sensitivity on the final design
values.
B. Investigate base material practices for concrete pavements through a literature review
and survey of experiences from others.
C. Increase the quantity of weather sites in Oklahoma that provide environmental inputs
for the MEPDG.
D. Examine different curing methods for rigid pavement construction and their impact on
the early age curling and warping of continuous reinforced concrete pavements
E. Provide regional material input parameters that can be used in the MEPDG for the
design of rigid pavements
During this period tasks A and C were completed and therefore the bulk of the report is devoted
to these subjects. However, progress on tasks B, D and E are also provided.
1.1 Background of the MEPDG
The MEPDG is design software that was developed by Applied Research Associates (ARA)
through several funding projects from the National Cooperative Highway Research Program
3

(NCHRP). The goal of the software is to provide a new design methodology for concrete and
asphalt pavements based on the latest failure mechanisms in combination with empirical data
from the performance of pavements in the field. Before the release of the MEPDG it was
common for designers to use a version of the AASHTO design guide. This design method has
seen several different iterations that vary from hand methods that use nomo-graphs to simple
software interfaces. The AASHTO design guide is based on empirical performance of several
miles of test track in Ottawa, Illinois from 1958 to 1960. This testing is commonly called the
AASHO road test. For this testing pavements were continuously loaded with trucks over a
period of little more than 2 years.
While the AASHTO design guide has served designers well the following criticisms were made by
the MEPDG documentation of the AASHO road test (ARA 2004):
1) Modern traffic levels have increased by 10 to 20 times the levels since the time of the AASHO
road test. Because only a limited amount of data could be obtained from the original test,
extrapolation of the damage observed in the AASHO road test was needed to determine the
long-term performance of the pavements. While some extrapolation was deemed reasonable
to determine the performance of pavements in the 1950s; however, this extrapolation would
need to be taken to the extreme to meet modern traffic levels.
2) Environmental loading is thought to be an important component in the design of concrete
pavements. Since the AASHO road test was only limited to pavements in Ottawa, Illinois and to
a short period of little more than 2 years this key component cannot be modeled.
3) A limited number of construction materials were used in the construction of the test track.
For example only one type of hot mix asphalt subgrade and only one concrete mixture was used.
4

4) The vehicle weights used for the test are now out dated.
5) The drainage system for the pavement has not been considered in the test.
6) Pavement rehabilitation procedures were not considered by AASHTO design guide.
The MEPDG has done its best to try and take as many of these variables as possible into
account. The creators of the MEPDG feel that these short comings can be overcome if one is
able to fundamentally define the performance of a pavement through the use of the latest
mathematical models in combination with the measurement of the actual performance of
pavements with a significant number of differences in climate, loading, and construction
materials. These empirical observations are imperative to help the mathematical expressions to
become meaningful and useful.
5

2.0 Review of the inputs to the MEPDG and determine the sensitivity on the final design
values
2.1 Variables in the MEPDG
The MEPDG software allows the user to change over 150 variables that impact the performance
of the pavement. These variables have been grouped by category including: climate, traffic,
pavement layers and their material properties.
2.1.1 Significance of Variables
While it is helpful to provide designers with a large number of variables that they are able to
control in order to tailor their pavement design, this can also be a challenge for a designer as the
number of variables can be overwhelming to try and control. Instead it would be more useful
for designers to understand which variables have the largest impact on their designs or are the
most significant. Other researchers have realized this and attempted to determine which
variables have the biggest impact on the results of the MEPDG (Zaghloul et. al 2006, Kannekanti
2006, Harvey 2006, Mallela et. al 2005, Harrigan and Nov 2002).
While the previous work is useful some common difficulties were found including:
• no information about the MEPDG software version that was used for the analysis
• little information is given about the metrics used to determine if an input was significant
• no constant metric was used across investigations to compare results
• lack of detail of the range of values used in the analysis
Because of these inconsistencies, and the desires for ODOT to implement the MEPDG software
it was decided to perform a new sensitivity analysis on the MEPDG. After reviewing the list of
possible variables that can be modified and through discussions with ODOT a list of variables
6

was chosen to be investigated that were deemed reasonable to be able to control in the field. A
summary of these variables is shown in Table 2. These variables were investigated to quantify if
the results of the MEPDG were sensitive to these parameters.
2.2 Sensitivity Analysis
This sensitivity analysis was completed between March and August of 2009 with version 1.0 of
the software that was obtained from the MEPDG website, www.trb.org/mepdg/software. Along
with this software hourly climatic data files from version 0.910 were also downloaded. It should
be noted that the results from the MEPDG may not be the same if a different version of the
software or if a different set of climatic data was used in the analysis.
It was decided that all of the comparisons of these previously mentioned variables should be
done on a common metric that was easily accessible to a pavement design engineer. One easily
recognizable variable to design engineers is the required pavement thickness. Unfortunately
the current version of the MEPDG does not provide the user with a satisfactory pavement
thickness for the variables presented. Instead it analyzes the pavement design with the
variables used and will report if the pavement is adequate.
Therefore, to investigate the sensitivity of these different variables on the required pavement
thickness it was decided to start with a pavement design that was representative of an ODOT
pavement and find the AADTT that made it just adequate. A variable was then modified and the
pavement was analyzed to see if the section was adequate. If the pavement adequacy was
decreased then to compensate for this an increase in the overall pavement thickness was made.
If the pavement adequacy was increased by the change in the variable then the pavement
thickness was decreased to find the thickness that just allowed it to be adequate. By using this
7

technique then it was possible to find how a single variable impacted the thickness design for a
pavement.
Both continuously reinforced concrete pavement (CRCP) and jointed plain concrete pavement
(JPCP) were considered for analysis. For these pavements the edge support was assumed to be a
tied PCC shoulder and PCC-base interface was kept as full friction contact. The material
properties of the asphalt, used as a bond breaker, was chosen to meet ODOT standards and not
varied. The default parameters from the MEPDG were used unless noted in Table 1.
8

Table 1 – A summary of the baseline values for Oklahoma pavements.
design life 20 years* cement 600 lbs of type I concrete flexural strength 690 psi* curing curing compound shoulder tied JCP dowel diameter 1.5" CRCP reinf. ratio 0.70% location Stillwater pavement openning Fall base layers 4" asphalt
8" chemically stabilized base subgrade 8000 psi resilent modulus * default values of the MEPDG
In order to find the AADTT for the various thickness of JPCP and CRCP that caused failure of the
pavement section a pavement section was created with the previously mentioned baseline
parameters and the AADTT values were increased until the pavement was found to just be
unsatisfactory. This allowed the limiting AADTT to be determined for the chosen design
variables and thickness. A summary of the results is shown in Figure 1.
9

10
10.5
11
11.5
12
12.5 Th
ickn
ess(
in)
joint spacing 18 FT (JPCP)
joint spacing 15 FT (JPCP) CRCP
0 5000 10000 15000 20000 25000
AADTT (axles)
Figure 1 – A plot of the required design thickness for JPCP and CRCP with different AADTTs.
After a baseline AADTT was found for a pavement then the sensitivity analysis could begin. Next
a variable from Table 1 was modified in the design and the pavement thickness was also
adjusted until the pavement was found to just be acceptable. This allowed the impact on the
thickness to be determined for a single variable for a given set of parameters. The range that
each variable was varied over is summarized in Table 2.
10

Table 2 - A summary of the variables and their ranges used in the sensitivity analysis.
CRCP and JPCP parameters are: parameter range
pavement opening fall, spring, or summer
CTE 3.5-8 x 10⁻⁶ /oF cement type type I or II
curing compound or wet
compressive stress 3000-6000 psi
cementitious material content 400-800 lbs/cy
asphalt layer thickness 0 - 6"
cement fly ash layer thickness 0 - 8"
reinforcement ratio (CRCP) 0.5 – 1%
dowel diameter (in) (JPCP) 1-1.75"
unbound resilient moduls 3000 - 13000 psi
climate Stillwater, Clinton, Lawton, McAlsester,
Oklahoma City, Tulsa, Frederick
2.3 Results
The impact of a change in each variable is reported in terms of the change in the required
pavement thickness in the MEPDG to make the section adequate. A summary table is reported
in table 4.
For each case the change in the pavement thickness in inches is given. A “+” was used for an
increase in thickness and a “-“ was used for a decrease in thickness. In some cases there was no
impact on the thickness and a “0” is reported. A letter is also reported next to each thickness
change that designates the failure mode that governed for that analysis. All default values are
indicated by an asterisk, and values that were not expected were shown in bold. The default
failure criteria established by the MEPDG was used in each analysis. These are summarized in
Table 3.
11

Table 3 – A summary of the failure criteria used in the sensitivity analysis.
CRCP failure criteria limit reliability
terminal IRI (in/mi) 172 90
CRCP Punchouts (per mi) 10 90
maximum CRCP crack width (in) 0.02
minimum crack load transfer efficiency (LTE %) 75
JPCP failure criteria
terminal IRI (in/mi) 172 90
transverse cracking (% slabs cracked) 15 90
mean joint faulting (in) 0.12 90
The following example is used to illustrate the use of the table. If we have a 12” CRCP pavement
that is adequate and we change the CTE value of the aggregate from 5.5x10⁻⁶
to 6.5x10⁻⁶
then
the design thickness will have to be increased by 1.5” to 13.5” to make the pavement adequate
for the same AADTT. The controlling failure mechanism will be cracking and inefficient load
transfer. This technique is able to quantify the impact of a change in a given variable on the
design thickness of the pavement, for different pavement thicknesses.
12

Table 4 - Results from MEPDG sensitivity analysis.
material parameters
parameters 12.5" 12" cement type
I* 0"L 0"P,L
CRCP 11"
0"P,L
10"
0"P,L
12.5"
0"T
JPCP (spacing 18 FT) 12" 11"
0"T 0"T
10"
0"T
12.5"
0"J
JPCP (spacing 15 FT) 12" 11"
0"J 0"J
10"
0"T,J II -0.5"L -0.5"P,L
curing curing compound* 0"L 0"P,L
- 0.5"P,L
0"P,L
0"L
0"P,L
0"T
0"T
0"T 0"T
0"T 0"T
0"T 0"J
0"T 0"J
0"J -0.5"J
0"J 0"J
0"T,J
0"T,J wet cure -1” P,L -0.5" L
cement content (lbs/cy) 500 -1"L -0.5"L
-0.5"L
-0.5"L
-0.5"P,L
-0.5"P,L
0"T
0"T
0"T 0"T
0"T 0"T
0"T 0"J
0"T 0"J
0"J -0.5”J
0"J -0.5"J
0"T,J
0"T,J 600* 0"L 0"C,L 0"P,L 0"P,L 0"T 0"T 0"T 0"T 0"J 0"J 0"J 0"J 700 >+3"C,L >+3"P,C,L >+3"P,C,L
compressive strength (psi) 3000 0"P,L 0"P,C,L 0"I,P,L
>+3"P,C,L
+0.5"P,L
+0.5"T 0"T 0"T
+3.5"I,T +3"I,T +3"T
0"T +1"J
+3.5"T +1.5"T
+1"J +0.5"J
+1.5"T +2"T
+0.5"J
+1.5"I,T 4200 +0.5"L +1"P,C,L +0.5"P,C,L +0.5"P,C,L +1.5"I,T' +1.5T +1"T +1.5"T +0.5"J 0"J 0"T,J +1"I,T 5000 0"C,P,L +0.5"L +0.5"C,L +0.5"C,L +0.5"T +0.5"T 0"T 0"T 0"J 0"J 0"J +0.5"T 6000 0"L +0.5"L 0"P,L
CTE (1x10⁻⁶/oF) 4.5 -0.5"L 0"L 0"L
+0.5"L
0"L
-0.5"T,J -0.5"T -1"T
-3"T -2"T -2.5"T
-1"T 0"J
-2"T >+3.5"J
0"J 0"J
-1.5"J -3"J
0"J
-1"I,T 5.5* 0"L 0"C,L 0"P,L 0"P,L 0"T 0"T 0"T 0"T 0" 0"J 0"J 0"J 6.5 +2"C,L +1.5"C,L +1.5"C,L
resilient modulus (psi) +1"C,L +3.5"T +2.5"I,T,J +2"T +2.5"T +3"I,J,T +1.5"I,T,J +2"J +2.5"I,T,J
3000 -0.5"L 0"L 0"L 0"L 0"J -1.5T -1.5T -0.5T +2J +2J +1"J +1"J 5500 0"L 0"L 0"L 0"P,L 0"T -0.5"T -0.5"T 0"T +0.5"J +0.5"J +0.5"J +0.5"J 8000* 0"L 0"P,L 0"P,L 0"P,L 0"T 0"T 0"T 0"T 0"J 0"J 0"J 0"J 10500 0"L +0.5"L 0" P,L +0.5"L +0.5"T +0.5"T 0"T 0"T 0"J 0"J -0.5"J 0"J 13000 0"L +0.5"L +0.5"L +0.5"L +1T +0.5"T +0.5"T 0"T 0"J 0"J -0.5"J +0.5"T
The required change in pavement thickness to insure comparable performance for the change in the variable. Positive values suggest an increase in thickness negative a decrease. * - values used to represent typical ODOT pavements, therefore they have no impact on the pavement thickness
Bold values correspond to a result that was unexpected. The controlling failure mode is given by the letters.
L - load transfer efficiency P - punchouts J - joint faulting T - transverse cracking
I - IRI C- cracking
13

design parameters
CRCP JPCP (spacing 18 FT) JPCP (spacing 15 FT) parameters 12.5" 12" 11" 10" 12.5" 12" 11" 10" 12.5" 12" 11" 10"
pavement opening Summer -0.5" L 0" L 0" L 0" L +0.5" T 0"T 0"T 0"T 0"J 0"J -0.5"J 0"I,T,J Spring -2"L -2"P,L -1.5"PL -1"P,L +0.5"T 0"T 0"T 0"T -0.5”J -0.5"J -1"J 0"I,T,J Fall* 0" L 0" P,L 0" P,L 0" P,L 0"T 0"T 0"T 0"T 0"J 0"J 0"J 0"I,T,J
reinforcement steel (%) 0.6 >+3.5"P,C,L +2P,C,L >+3.5"P,C,L >+3.5"P,C,L - - - - - - - -0.7 0" L 0" P,L 0" P,L 0" P,L - - - - - - - -0.8 -1.5"L -1"L -0.5"L -0.5"L - - - - - - - -
dowel diameter (in) 1 - - - - >+3.5"I,J +3.5"I,J +3"I,J +2.5"I,J >+3.5"I,J >+3.5"I,J >+3.5"I,J >+3.5"I,J
1.25 - - - - >+3.5"I,J +3.5"I,J +2.5J 0"T >+3.5"I,J >+3.5"I,J >+3.5"I,J >+3.5"I,J 1.5* - - - - 0"T 0"T 0"T 0"T 0"J 0"J 0"J 0"T,J 1.75 - - - - 0"T 0"T 0"T 0"T -0.5"J -0.5"J -1"J 0"J
asphalt layer thickness(in) 0 0"L +0.5"L +0.5"L 0"L >-3.5"T -2.5"T >-3.5"T >-3.5"T -1"J -2"J -3"T -1.5"T 2 0"L 0"L 0"P,L 0"P,L +1"T +0.5"T +0.5"T +0.5"T +1"J +0.5J 0"J +1"T 4* 0"L 0"P,L 0"P,L 0"P,L 0"T 0"T 0"T 0"T 0"J 0"J 0"J 0"I,T,J
lime cement fly ash stabilized layer (in) 0 0"J +0.5"P,L 0"P,L +0.5"L 0"J -0.5"T -0.5"T -0.5"T +1.5J +1"J +0.5"J +0.5"J 3 0"T 0"L 0"L 0"P,L 0"T -0.5"T -0.5"T -0.5"T +0.5"J +0.5"J -0.5"J 0"T 5 0"T 0"P,L 0"P,L 0"P,L 0"T -0.5"T -0.5"T 0"T +1"J +0.5"J 0"J 0"T,J 8* 0"T 0"P,L 0"P,L 0"P,L 0"T 0"T 0"T 0"T 0"J 0"J 0"J 0"T,J
Climate Clinton >+3.5"C,L >+3.5"C,L +3"C,L +1.5C,L 0"T -0.5"T 0"T -0.5"T -0.5"J -0.5"J -1.5"T 0"T Fedrick +0.5"L +0.5"L +0.5"L +0.5"L +0.5"T +0.5"T +0.5"T +0.5"T -0.5"J -1"J -1"T +0.5"T Lawton 0"L +0.5"L +0.5"L +0.5"L +1"T 0"T 0"T 0"T -1"J -1"J -1"T +0.5"T Tulsa -0.5"L 0"L 0"L 0"L -0.5"T 0"T -0.5"T 0"T -0.5"J 0"J 0"J 0"T,J
Stillwater* 0"L 0"L 0"L 0"L 0"T 0"T 0"T 0"T 0"T 0"T 0"T 0"T McAlester -0.5"L 0"L 0"L 0"L -0.5"T 0"T -0.5"T 0"T 0"J -1"J -1"T 0"T
The required change in pavement thickness to insure comparable performance for the change in the variable. Positive values suggest an increase in thickness negative a decrease. * - values used to represent typical ODOT pavements, therefore they have no impact on the pavement thickness Bold values correspond to a result that was unexpected. The controlling failure mode is given by the letters. L - load transfer efficiency P - punchouts J - joint faulting T - transverse cracking I - IRI C- cracking
14

2.4 Discussion
From the results it is clear that some variables had a more significant impact than others. Furthermore,
these variables often had different impacts on the different pavement types and thicknesses
investigated. A discussion for each one of the variables is provided along with a summary in Table 5.
The season that the pavement was opened to traffic had little impact on the JPCP. However the CRCP
pavements that were opened to traffic in the Spring were able to be reduced in design thickness
between 1” and 2”. More work is needed to determine why this is and if it is rational.
The curing type had little impact on JPCP design thickness. However, it consistently impacted the design
of CRCP by allowing for a decrease in design thickness of up to 1”. This size of impact makes this
parameter significant for thicker CRCP.
The CTE was a variable that consistently had the biggest impact on the design thickness of both CRCP
and JPCP. When CTE values of 6.5 was used instead of 5.5 there was a significant increase in pavement
design thickness. The lower CTE value of 4.5 has very little impact on the design thickness of CRCP.
However, this same change had a significant impact on JPCP. This lead to changes of over 3” in some
cases and was the most significant variable investigated. At this time it is unclear if this result is
reasonable. What can be said is that the change in CTE value investigated is believed to be reasonable
for concrete pavements constructed in Oklahoma. More work should be done to investigate the long
term performance of Oklahoma pavements and their corresponding CTE and see if these results match
the suggested results of the MEPDG.
The cement type used allowed a 0.5” reduction of the design thickness with CRCP but has no impact on
JPCP.
15

Compressive stress has more impact on JPCP compared to CRCP. Lower compressive stress of 3000 psi
caused significantly higher pavement thicknesses to be required for JPCP. Higher compressive strengths
allowed for a reduction in thickness. A small impact was made on the design thickness for CRCP
whether the compressive strength was higher or low. There appears to be some error in the analysis of
CRCP with 3000 psi compressive strength. These pavements actually showed less of an impact then the
same sections with 4200 psi. This is unexpected.
When the cementitious material content was increased this resulted in higher shrinkage strains in the
pavement. Typical values for these parameters will be determined for the state of Oklahoma in this
research project and compared to those predicted by the MEPDG. However, until then the MEPDG
suggests that this variable has a higher impact on CRCP pavements than JPCP. Higher cementitious
content caused substantial increases in the design thickness for CRCP. This increase was much more
substantial than in JPCP. For the CRCP pavements investigated a lower cementitious content allowed a
reduction in thickness.
As the thickness of the asphalt layer was reduced for the JPCP from the 4” default value the required
thickness for the pavement increased. However, when this layer was removed from the analysis results
show that a decrease in the required pavement thickness is allowed. This behavior is not expected. The
asphalt layer thickness showed very little impact on the CRCP design thickness. This suggests that the
base material has little impact on the required design thickness for CRCP.
As the lime cement fly ash layer thickness was decreased in the design it showed a reduction in the
pavement thickness for JPCP with 18’ spacing but for JPCP with 15’ spacing it shows an increase in the
thickness required. Again the reason for this behavior is not intuitive. There was not a significant impact
of the lime cement fly ash layer thickness on the CRCP design thickness. This again suggests that the
base material has little impact on the required design thickness for CRCP.
16

Changes in the stiffness of the unbound resilient modulus for JPCP with 18’ spacing and 15’ joint spacing
showed an exact opposite response. The pavements with 18’ joints suggested that as the stiffness of
the unbound resilient modulus decreased that the pavement thickness could also decrease.
Furthermore, when the unbound resilient modulus was increased the pavement thickness was required
to be increased. While it is reasonable to assume that the stiffness of the base should have an impact
on the design thickness of a pavement, the research team expected that the performance of the JPCP
with a 18’ joint spacing would behave similarly to one with a 15’ joint spacing. More work is needed to
investigate this work. In the CRCP investigations the resilient modulus had almost no impact on the
required design thickness of the pavement.
Increase in the dowel diameter from 1.5” to 1.75” showed no effect on the thickness design for either
JPCP sections investigated. However, a change in the dowel diameter from 1.5” to 1.25” lead to
pavement thickness designs of over 3.5”. It is unclear to the research team why such a small change in a
variable can lead to such a significant change in thickness.
The reinforcement ratio for CRCP was another variable that showed significant changes in the required
design thickness for small changes in the value. For example a change from 0.7% to 0.6% required a
thickness change in several cases of over 3.5”. This is a drastic change in the design thickness for a very
small reduction in the amount of reinforcement. In turn an increase in the amount of reinforcement led
to a small decrease in the required design thickness.
Several different cities within Oklahoma were chosen to evaluate how the different environments in the
state impact the pavement design thickness. The majority of these cities had very little impact on the
design thickness of the pavements investigated. However, for some reason the city of Clinton has a
significant impact on the design thickness for thicker CRCP. It is not clear why this is happening and
17

more work is needed to verify these results. This behavior was only for CRCP as the JCPC were not
significantly impacted by the environment in Clinton.
Table 5 – A summary of the impact on the thickness design requirement for each of the investigated
variables.
intensity of impact
parameter CRCP JPCP 18' joints JPCP 15' joints
cement type
curing compound
cement content
compressive strength
CTE
resilient modulus
pavement opening
reinforcment percentage
dowel diameter
asphalt thickness
thickness of stabilized layer
climate
low
high
high
high
high
low
high
high
-
low
low
high
none
none
low
high
high
high
low
-
high
high
low
high
low
low
high
high
high
high
high
-
high
high
high
high
none = no impact
low = 0.5" or less
high = greater than 0.5"
2.5 Conclusion
In this study a sensitivity analysis was completed that allows the user to quantitatively compare the
impact of different variables on the design thickness in the MEPDG for CRCP and JPCP. The ability to
quantify the impact of these different variables in this manner was not found in any previous publication
or journal paper. While completing this sensitivity analysis several variables were found to make a much
more significant impact then was expected. Also, several variables behaved in ways that were
unexpected by the research team. More work will be completed to better understand why this is
occurring. It should be said that no combinations of variables were investigated beyond what is
presented here and so care should be taken in extrapolating the data to other combinations.
18

3.0 Investigate base material practices for concrete pavements through a literature review and survey
of experiences from others
3.1 Introduction
The use of sub-grade drainage systems, in the form of permeable bases and/or the incorporation of
edge drains, has over the last few decades been considered an option for improving the long term
performance of concrete pavements. The effectiveness of these features as a means of draining
seepage water and consequently extending the life of a roadway is still unclear. A major problem with
this subject is that past investigations have not been able to monitor the performance of these drainage
systems from their installation throughout the lifetime of the pavement to monitor their performance.
Also, most projects have focused on only the effectiveness of subsurface drainage systems without
monitoring the structural effect of these systems over the life of the pavement surface. These studies
will be initially covered in this document. The most comprehensive research over this topic was
performed in the National Cooperative Highway Research Program’s (NCHRP) Project 1-34,
“Performance of Pavement Subsurface Drainage”. Project 1-34 represents the cumulative effort of four
research projects, each following up on the shortcomings of the previous. Because of the thorough
investigations completed by this report it will be thoroughly reviewed in this literature review.
Furthermore, through conversations with the FHWA it was realized that a new document has been
issued over sub surface drainage. This document was not received in time to thoroughly cover in this
document. Future work on this task will focus on adding this reports information to the literature
review.
3.2 Past Research on Subsurface Drainage
3.2.1 “An Evaluation of IDOT’s Current Underdrain Systems”; Illinois Department of Transportation,
1995
19

Illinois as a state has been using underdrain systems since the 1970’s. In 1995 IDOT evaluated the
effectiveness of pipe and mat underdrains. Both have been heavily used in the state and it was unclear if
one performed better than the other. The experiment consisted of unearthing a section of shoulder at
52 locations which had underdrain systems. The removed sections were then examined for damage and
later tested in a lab for flow rates. The results of which provide valuable recommendations for agencies
considering either. The recommendations include:
• Discontinuing the use of polypropylene products because they tend to collect fines and lose
functionality
• Discontinuing the use of two manufacturers drainage mats as they are prone to structural
damage and loss of functionality; drainage mats are typically plastic with circular openings that
are placed below the pavement surface and act as a highly permeable layer
• Revised maintenance procedures to ensure screens are in place at all drain outlets and that
mowing occurs as close to the outlets as possible
3.2.2 “Evaluation and Analysis of Highway Pavement Drainage”; Kentucky Transportation Center,
2003
The Kentucky Transportations Center conducted an analysis of drainage system performance by utilizing
finite element models to investigate various pavement designs incorporating subsurface drainage
components. The models assumed a steady state saturated flow. In these models the drainage system
components and pavement materials and conditions were varied. The project was interested in not only
determining the effectiveness of drainage systems but what factors affect the inflow of water into the
pavement layers. The results of this modeling led to the following conclusions:
• Pavement geometry affects surface drainage but not subsurface drainage
20

• Cracks in the pavement increase the inflow of water into subsurface layers and thus the need
for subsurface drainage features
• For widening projects, longitudinal drains should be placed at the interface of new and old
layers to shorten the drainage path
• A surface drainage layer with low permeability should have underlying layers with increasing
permeability to ease the movement of subsurface water while still maintaining structural
integrity
3.2.3 “Comparison of Pavement Drainage Systems”; MnROAD, 1995
This project detailed the effectiveness of drainage in four test sections. These sections were designed
with varying subsurface drainage features including one control section without subsurface drainage
designs. The remaining three sections utilized longitudinal drains and/or permeable asphalt treated
layers. Reflectometers were placed in the constructed layers of the sections so that saturation and flow
could be measured at the time of construction and after rain events. The conclusions for this experiment
include:
• Although all sections demonstrated the ability to drain subsurface water, sections with a
permeable asphalt treated layer drained the most volume of water, typically within two hours
• About 40% of all rainfall penetrates the pavement surface
• Sealing longitudinal and transverse joints provided protection from inflow for roughly two
weeks before typical inflow resumed
• The project recommended that measurements continue to be made and that structural
performance of the surface pavement be monitored.
3.2.4 NCHRP Project 1-34
21

In this section a summary of the methodology, results, and recommendations of all four phases is
provided. Project 1-34, phase A was the first attempt for the NCHRP at characterizing the performance
of subsurface drainage systems. This project was completed in 1998. Once complete, the NCHRP
financed phase B to critically review the original project as well as establish a blue print for long-term
evaluation. This plan was enacted upon in phase C of the project through the Special Pavement Study-2
(SPS-2). Phase C ran from 1998 until 2002. The final installment, phase D, continued analyses of the SPS-
2 sections in addition to focusing on testing the long term functionality of the drainage systems. This
phase included data through 2005.
3.2.4.1 Project 1-34 A and B
NCHRP Project 1-34A and B provided an initial look at the performance of subgrade drainage systems in
use at that time. The bulk of observations made were from databases provided by the Federal Highway
Administration (FHWA) and from visual distress surveys performed on rigid pavements found
throughout the country. Data collected through these methods was then used to create mechanistic-
empirical models. Visual surveys were completed for each section in which a verbal description was
provided on the condition of the roadway. Rutting, fatigue cracking, and the condition of the drain
outlets were the predominant comments for the surveys. Additionally, information was collected on the
age, repair history, and traffic volume seen at each location. Table 6 provides a summary of the test
sections surveyed. States represented in this phase include: Kansas, Minnesota, North Carolina,
Pennsylvania, Wisconsin, Illinois, Oklahoma and Ontario. For JPCP sections, three of the nine locations
investigated had drained and undrained sections at the same location; for JRCP and CRCP sections each
had one location with both a drained and undrained sections.
22

Table 6 – Summary of pavement sections investigated in NCHRP 1-34A and B.
Pavement Type JPCP JRCP CRCP
sections with permeable base 11 4 10
sections with edge drains 19 5 12
Number of Locations 9 3 4
The findings for this project were reported by identifying the pavement type and then summarizing
visual distress surveys. Ideally, direct comparisons between undrained sections and drained sections
were made and the performance could be evaluated. However this was rarely possible. Most
observations revealed that small, if any, statistical differences existed between drained and undrained
sections if the undrained sections “were properly designed”. Of the observations where statistical
evidence existed, conclusions made by the research team include:
The number of deteriorated cracks in JRCP was lower for permeable bases
• Cement-treated permeable bases (CTB) should not be used in conjunction with CRCP due to
excessive bonding
• Concrete sections with permeable bases averaged less than half the amount of deteriorated
joints than that of sections with dense-graded bases
• Permeable bases are easily penetrated by fines
• Edge drain outlets must be well maintained to function properly due to vegetation overgrowth
and other means of clogging such as rodent nests
23

Upon completion of this phase, the research team added note that any conclusions presented were with
the limited amount of data available and should be investigated with a larger sample group along with
more numerical methods as opposed to subjective visual reports. It was with this knowledge that
Project 1-34B was able to create a plan that would eliminate many of the shortcomings of Project 1-34A.
Among their suggestions for future research were longer analysis of sections, direct comparisons
between drained and undrained sections at the same location to eliminate doubt about climactic and
geological variables, and more advanced analytical techniques (coring, deflection data, roughness
measurements, video inspection of edge drains).
3.2.4.2 Project 1-34 C
With the recommendations of Project 1-34B and the inclusion of SPS-2 sections, Project 1-34C
undertook a long term evaluation of rigid pavements with subsurface drainage features. The SPS-2
experiment was designed to assess the influence of concrete width and thickness, flexural strength, base
type, sub drainage, climate and traffic level.
Some specifics of the investigation is given below:
• Fourteen locations were investigated to represent varied climactic variables (rain and
temperature)
• Each location has 12 sections of varying width, flexural strength and thickness – 4 drained and 8
undrained
• Every drained section (asphalt treated permeable base) has two control sections – 1 dense
graded aggregate and 1 lean concrete base
The focus of this project was on the structural performance of the trial sections, thus parameters
reflecting the structural integrity were measured throughout the project. Parameters of interest include
transverse and longitudinal cracking, faulting, rutting and the International Roughness Index (IRI). IRI
24

calculations were made by averaging the IRI value of each wheel path at the time of construction and
periodically throughout the phase. The conclusions for this project were framed around the statistical
differences in these parameters by comparing numerical values of undrained sections versus drained
sections.
The team found that for transverse and longitudinal cracking as well as faulting, the control sections
tended to deteriorate first, although in most cases the differences were statistically insignificant. In the
case of IRI, they determined that the quality of drainage was not a factor.
Recommendations from the 1-34C team include:
• Adding deflection data to the list of structural integrity parameters used above (cracking,
faulting, rutting and IRI)
• Testing the capabilities of the drainage systems in place by measuring flow rates
• Determining the effect of filter fabrics on flow rates
• Adding the data from the SPS-2 to the most recently completed database
The team found that the largest shortcoming of their findings was differentiating what effects were due
to base type and which were due to drainage capabilities.
3.2.4.3 Project 1-34 D
With the recommendations of Project 1-34C, the methodology of Project 1-34D would continue to
collect structural data such as cracking, faulting, rutting and IRI values in addition to the collection of
deflection data, the measurement of flow rates through the drainage systems and the use of video
equipment to survey the condition of drainage pipes below the ground surface. Flow rates through the
sections were tested by coring and removing a hole in the pavement surface, then running water
25

through the hole. The outlets were then monitored to measure flow through them. The sections
analyzed in this project include not only the SPS-2 sites but also related data from the Minnesota Road
Research Project and the Wisconsin Department of Transportation. At the time of this project’s
conclusion. This allowed for analysis to be done for the sections of 10 years or more.
Highlights from the findings of this project are found below:
• Edge drains may never function fully or at all due to the nature of some subgrade soils. Water
may be more conducive to flowing downwards through the soil as opposed to laterally through
the edge drains
• Deflection data suggests that deformation in a section is related to the stiffness of the base
material rather than the quality of drainage.
• Load transfer values for undrained sections are no worse than drained, permeable base sections
• IRI values, initial and final, are predominantly due to base stiffness
• In terms of faulting, sections with undrained lean concrete bases or permeable asphalt-treated
base are slightly better than sections with dense graded aggregate bases
• In terms of cracking, lean concrete bases (LCB) performed the worst, followed by dense
aggregate bases and then permeable asphalt treated bases; more than 60% of the LCB sections
had some cracking while only 30% of the aggregate-base and PATB sections had only nominal
cracking
• Edge drain pipes were sometimes crushed during construction
• Outlets that received little maintenance would become overgrown and lose functionality
Overall, the research team concluded that performance of the test sections was related more with the
stiffness of the base material rather than the drainage capabilities of the base. This however should not
26

deter agencies from considering subgrade drainages systems. Project 1-34D makes these final
recommendations to agencies:
• Consider climate and soil taxonomy as to identify sites that are at risk for excessive moisture and
poor natural drainage
• Review visual distress surveys from local roads for signs of poor drainage (pumping, potholes,
etc.)
Due to the conclusion that stiffness of the base layers contribute more to structural performance than
drainage, it is recommended that designers consider a stiffer base layer, although a base layer that is too
stiff such as LCB showed increased cracking in a significant number of sections investigated.
3.3 Conclusions
The majority of the reports reviewed suggested that roadways with subgrade drainage systems tend to
perform closely with that of their undrained counterparts in terms of structural integrity. Furthermore,
with subgrade drainage systems proper construction procedures and periodic maintenance of drainage
outlets must be taken into consideration to ensure the effectiveness of these systems. Areas with high
annual precipitation or soils with low permeability appear to be good candidates for these drainage
features.
The accumulation of the research performed in Project 1-34 was incorporated into the Pavement
Subsurface Drainage Design Reference Manual published by FHWA in 2008 and has only recently been
obtained by the OSU research team. This manual is designed to provide a complete guide to drainage
design. The highlights of which include:
27

• A proposed system which includes a permeable base layer day lighted or with longitudinal
drains, a dense graded aggregate separator layer, and ditches to transport water which are to
have a grade greater than 0.5%
• Drainage considerations including factors that affect infiltration, such as climate, water table
levels, roadway geometry and freeze/thaw levels; and factors that increase moisture damage
such as traffic levels and subgrade properties
• Guidelines for assessing drainage needs which are quantified by the Moisture Accelerated
Damage Index
• Drainage type selection guidelines which describe how to decide which drainage components
are needed
• Hydraulic design criteria for designing for certain volumes and drainage times
• Sections on designing individual subsurface drainage components including permeable bases,
separator layers, and edge drains
• Maintenance recommendations
This guide appears to be the authority on subsurface drainage design as it is the accumulation of
numerous research findings. During phase II of the project further investigation will be made by the
research team.
3.4 Future Work
One future step on this task is to contact engineers in other states to determine if they have similar or
different experiences then the NCHRP I-34 report. During these conversations best practices for
construction details, specifications, and maintenance will be requested. This information would be very
helpful to assist ODOT if they were to attempt to construct new pavements with drainable bases. Based
on previous publications and talks with Jeff Dean of ODOT contact will be made with Iowa DOT and
other states that have reported research results.
28

Further steps will also be taken to evaluate the FHWA Pavement Subsurface Drainage Design Reference
Manual. This guide was not acquired until late in the task and questions about the research which
supports the recommendations have yet to be addressed. Although research from Project 1-34 is
included, there exist numerous other references. These have not been included as these were viewed
to be the seminal papers.
This task is on budget and on schedule and should be completed as outlined in the original proposal by
March 2010.
29

4.0 Increase the quantity of weather sites in Oklahoma that provide environmental inputs for the
MEPDG
4.1 Introduction
Reliable climatic inputs are critical to produce high quality results with the AASHTO MEPDG. The
temperature and moisture gradients in the pavement and subsurface and consequently the pavement
stresses are directly dependent on the weather inputs. In the current version of the MEPDG, the user
may select several weather stations that can be interpolated based on the project location to produce a
virtual weather station (ARA 2004). At least 2 years of data is required for a station to be used in the
MEPDG, however more data is recommended. Having more weather stations over a longer period of
time will greatly improve the reliability of the designs made using the MEPDG.
This project involved the updating or creation of 39 weather files in Oklahoma, along with 14 in
neighboring states. This is an increase from only 15 weather files previously available for Oklahoma. A
map and data file compatible with Google Earth of depths to groundwater in Oklahoma have been made
for guidance in selecting the average annual depth of water table for input in the MEPDG.
4.2 Weather Files Creation and Validation
The weather data used for the MEPDG climate file upgrading and creation was supplied by the National
Climatic Data Center (NCDC), which is part of the National Oceanic and Atmospheric Administration of
the U.S. Department of Commerce. The Global Integrated Hourly Surface dataset is available via free
online access for unrestricted use inside the U.S.. This data can be accessed using the NCDC Climatic
Data Online system at http://cdo.ncdc.noaa.gov/. After obtaining this data it was imported into a
spreadsheet for filtering and editing. The data was first filtered to ensure that only one data point per
hour was included, as some weather stations collected data at more frequent intervals. Next, the hourly
relative humidity was calculated from the dry and wet bulb temperatures contained in the weather files.
The sky cover was converted to a numeric value according to the following scale: clear skies was
30

assigned to be 100, scattered clouds was assigned to be 67, broken sky cover was assigned to be 33, and
overcast was assigned to be 0. Missing weather values, which are inevitable for any weather station
because of maintenance, malfunction, or extreme weather, were corrected to supply the software with
a continuous set of data. Missing values of less than 3 hours in a row were filled in from the average of
the weather data from the hours immediately before and after the missing data points. This method
was chosen for continuity of data, and barring an unusually short and extreme event is believed to be
the most probable values for the missing data. When less than two days in a row of data was missing,
the missing data was calculated as the average of the value from the same hour on the days before and
after the missing data points. When more than two days of data in a row was missing, the missing data
was calculated from the average of the weather values from the same date and time from the data from
other available years of that weather station. When these longer periods of data were missing, it was
considered necessary to use the average of the values from the remaining year’s data so as to not bias
the weather data towards any particular year’s data. It was also considered unlikely that the data from
surrounding days would be representative for these missing days.
Fifteen weather files that were created by ARA, Inc. and included as part of the original data available
with the MEPDG were updated to include available data from 2006 to the present. Weather files were
created from weather station data available from 24 additional cities in Oklahoma. The weather files
are comma separated text files with the extension .hcd. Each line of data contains one hour of weather
information for the city of interest in the following format: “YYYYMMDDHH,Temperature,Wind
Speed,%Clouds,Precipitation,RelativeHumidity”. The file number needs to match that found in the
station.dat file used by the MEPDG, and is the Weather-Bureau-Army-Navy (WBAN) ID number assigned
to the weather station. The station.dat file contains the file number, the city name, the weather station
description, the Latitude and Longitude, the elevation, the first date found in the climatic data file, and if
the data file is clean “C” or has a missing month “M1”. It is the station.dat file that is used during the
31

weather station selection process in the MEPDG, so it is important that the information in the
station.dat file match that found in the climatic data file. The existing data files were updated by simply
appending the new weather information in the correct format to the end of the existing files. Fourteen
additional weather files were created from weather stations available in neighboring states that are
close to the Oklahoma border. These climatic data files will be useful when using the MEPDG to create a
virtual weather station by interpolation. Table 6 shows the cities now available, the dates previously
available in the climatic data files, and the date ranges now available.
Table 6 – Dates contained in previous and new climatic data files
Previous File New File
Weather Station
Location Weather Station Description
Date
Started
Dated
Ended
Date
Started Date Ended
ADA, OK ADA MUNICIPAL AIRPORT - - 4/1/2004 3/31/2009
ARDMORE, OK
ARDMORE DOWNTOWN
AIRPORT - - 6/1/2005 4/30/2009
BARTLESVILLE,
OK BARTLESVILLE FP FIELD - - 6/1/2003 5/31/2009
CHANDLER, OK
CHANDLER MUNICIPAL
AIRPORT - - 7/13/2004 4/30/2008
CHICKASHA, OK
CHICKASHA MUNICIPAL
AIRPORT - - 12/29/2004 3/31/2009
CLAREMORE, OK
CLAREMORE REGIONAL
AIRPORT - - 8/1/2004 3/31/2009
CLINTON, OK CLINTON-SHERMAN AIRPORT 11/1/1996 2/28/2006 11/1/1996 3/31/2009
CUSHING, OK
CUSHING MUNICIPAL
AIRPORT - - 7/1/2005 3/31/2009
DUNCAN, OK
HALLIBURTON FIELD
AIRPORT - - 7/14/2004 3/31/2009
DURANT, OK
DURANT EAKER FIELD
AIRPORT - - 5/1/2004 3/31/2009
EL RENO, OK
EL RENO MUNICIPAL
AIRPORT - - 9/1/2005 3/31/2009
ENID
WOODRING, OK
ENID WOODRING
MUNICIPAL AIRPORT - - 4/1/2005 4/30/2009
ENID VANCE, OK ENID VANCE AFB - - 11/2/2006 4/30/2009
FREDERICK, OK FREDERICK MUNICIPAL AIRPT 2/1/1998 2/28/2006 2/1/1998 3/31/2009
GAGE, OK GAGE AIRPORT 11/1/1996 2/28/2006 11/1/1996 3/31/2009
GROVE, OK GROVE MUNICIPAL AIRPORT - - 8/1/2004 3/31/2009
32

GUTHRIE, OK
GUTHRIE MUNICIPAL
AIRPORT 4/1/1998 2/28/2006 4/1/1998 3/31/2009
GUYMON, OK
GUYMON MUNICIPAL
AIRPORT 12/1/1998 2/28/2006 12/1/1998 3/31/2007
HOBART, OK
HOBART MUNICIPAL
AIRPORT 8/1/1996 2/28/2006 8/1/1996 3/31/2009
IDABEL, OK IDABEL RGNL AIRPORT - - 8/1/2005 3/31/2009
LAWTON, OK
LAWTON-FORT SILL RGNL
ARPT 10/1/1996 2/28/2006 10/1/1996 3/31/2009
MC ALESTER, OK MC ALESTER REGIONAL ARPT 8/1/1996 2/28/2006 8/1/1996 3/31/2009
MUSKOGEE, OK DAVIS FIELD AIRPORT 8/1/1996 2/28/2006 8/1/1996 3/31/2009
NORMAN, OK
NORMAN WESTHEIMER
AIRPORT - - 2/1/2005 3/31/2009
OKLAHOMA CITY,
OK WILEY POST AIRPORT 8/1/1996 2/28/2006 8/1/1996 3/31/2009
OKLAHOMA CITY,
OK
WILL ROGERS WORLD
AIRPORT 7/1/1996 2/28/2006 7/1/1996 7/31/2008
OKMULGEE, OK
OKMULGEE MUNICPAL
AIRPORT - - 5/26/2004 3/31/2009
PAULS VALLEY
PAULS VALLEY MUNICIPAL
AIRPORT - - 11/1/2004 3/31/2009
PONCA CITY, OK PONCA CITY REGIONAL ARPT 11/1/2000 2/28/2006 11/1/2000 3/31/2009
POTEAU, OK
POTEAU ROBERT KERR
AIRPORT - - 6/1/2004 3/31/2009
SALLISAW, OK
SALLISAW MUNICIPAL
AIRPORT - - 6/1/2004 3/31/2009
SEMINOLE, OK
SEMINOLE MUNICIPAL
AIRPORT - - 2/1/2006 4/30/2009
SHAWNEE, OK SHAWNEE NAS - - 6/1/2004 3/31/2009
STILLWATER, OK STILLWATER REGIONAL ARPT 12/1/1996 2/28/2006 12/1/1996 3/31/2009
TAHLEQUAH, OK
TAHLEQUAH MUNICIPAL
AIRPORT - - 6/1/2004 3/31/2009
TULSA, OK TULSA INTERNATIONAL ARPT 7/1/1996 2/28/2006 7/1/1996 9/30/2008
TULSA, OK
RICHARD LLOYD JONES JR
APT 8/1/1998 2/28/2006 1/1/1998 3/31/2009
WATONGA, OK WATONGA AIRPORT - - 12/1/2004 1/31/2009
WEST
WOODWARD, OK WEST WOODWARD AIRPORT - - 6/1/2004 3/31/2009
Coffeyville, KS Coffeyville Municipal Airport 7/1/1996 2/28/2006 7/1/1996 7/31/2009
Elkhart, KS Elkhart, KS - - 11/1/2003 7/31/2009
Liberal, KS Liberal Municipal Airport - - 5/1/2004 7/31/2009
Parsons, KS Tri-City Airport 7/1/1996 2/28/2006 7/1/1996 7/31/2009
Winfield, KS Strotner Field Airport 7/1/1996 2/28/2006 7/1/1996 7/31/2009
Canadian-
Hemphill, TX Canadian, TX - - 8/1/2003 7/31/2009
33

Clarksville, TX Clarksville Red River Airport - - 6/1/2004 05/31/2009
Gainesville, TX Gainesville, TX - - 6/1/2004 05/31/2009
Mt. Pleasant, TX Mount Pleasant Airport 7/1/1996 2/28/2006 7/1/1996 5/31/2009
Perryton, TX Perrytown Ochiltree Airport - - 6/1/2004 5/31/2009
Randolph, TX Randolph Air Force Base - - 1/1/2004 5/31/2009
Sherman, TX Grayson Co Airport - - 6/1/2004 5/31/2009
Vernon, TX Vernon Wilbarger Co Airport - - 6/1/2004 5/31/2009
Wichita Falls, TX Shephard AFB 7/1/1996 2/28/2006 7/1/1996 5/31/2009
The MEPDG currently does not consider any data in the climatic files after February of 2006, which is the
most relevant data and also the majority of the new data included from this project. After
conversations with Mike Darter, one of the lead researchers on the development of the MEPDG, it was
determined that the best course of action for the weather files would be to backdate the years of the
weather data created in this project from anywhere between one and three years. Any data from
February 29 was then moved to the nearest leap year to prevent any program errors. This would allow
for the maximum amount of weather data to be used in the MEPDG calculations, and would not affect
the values calculated since the years of the climatic data are not used in the calculations. A copy of the
original weather files before backdating is also included with this report for archival purposes and for
when this problem with the MEPDG is corrected. Figure 2 shows a map of the location of the MEPDG
climate files upgraded or created as part of this project.
34

Figure 2 - Location of weather stations used to update and create new MEPDG climate files.
A program has been created to install the MEPDG climate files in the proper folders on the user’s
computer. The file installer begins by double clicking on the setup.exe file, and is installed by following
the on-screen directions. The program when launched will ask for the root folder containing the MEPDG
and all of its subfolders and files, which is usually “C:\DG2002”. Once the folder is selected and the user
clicks the OK button, the program will automatically install the new climate files and station master list
file to the correct locations for use by the MEPDG. To install the climate files manually, simply copy the
climate files and paste them in the “HCD” subfolder of the MEPDG program folder. Then, the station.dat
file must be copied to the “HCD” subfolder and the “Defaults” subfolder.
4.3 Depth of Water Table Map and Data File Creation
Average values for the depth to groundwater for 84 locations throughout the state of Oklahoma were
compiled from data available from the U.S. Geological Survey National Water Information Survey at
35

http://nwis.waterdata.usgs.gov/ok/nwis/gwlevels. The well locations were selected from those that
contained at least 100 observations. The data was first averaged for each month, and then averaged
from the average monthly well depth values. This averaging method was used to prevent bias in the
average value resulting from a large number of observations being recorded in a particular month.
Figure 3 shows the average yearly depth below the ground surface to water in feet for the well locations
used in Oklahoma. The depth below the surface to the groundwater was also entered into a .kml file
that is compatible with the Google Earth program, which can be used to better view the depth to
groundwater for places where there are several average values available. In order to use this file one
must first download the free Google Earth software from www.earth.google.com and then use it to
open the provided .kml file. Caution should be exercise in using the values presented in Figure 3 and the
.kml file, as the local geological conditions may vary significantly over short distances.
36

37
Figure 3 - Ma p o f water table depths for Oklahoma. Values given are in feet.

4.4 Conclusion
Climatic data files have been updated and created for use in designing rigid and flexible pavements in
the state of Oklahoma. Average yearly depth to groundwater values have also been compiled for a wide
range of geographical locations in Oklahoma. This is expected to result in better pavement designs
which should translate into an overall reduced life-cycle cost.
38

5.0 Examine different curing methods for rigid pavement construction and their impact on the early
age curling and warping of continuous reinforced concrete pavements
Currently, the MEPDG requires that the user input the curing methodology to be used in the
construction of a pavement. From analysis completed in this report it can be shown that this input
variable is significant in determining the design thickness of CRCP. The MEPDG only allows the user two
choices between curing type. They are either wet mat or spray on cure. Although the wet mat cure has
been indicated to be the most effective curing technique, it is the least economical to be implemented
in the field. The goal of this task is to find if the properties of a concrete pavement receiving a wet mat
cure can be provided by a method that is more economical.
After further investigation of the MEPDG it has been determined that for design purposes of CRCP that
the assumed difference between a wet mat and spray cure is the amount of initial curling and warping
of the pavement due to differentials in shrinkage, moisture, and zero stress temperature. This initial
deformation of the pavement is detrimental as it causes the pavement to lose its initial support from the
sub base and therefore increase the stresses in the pavement from subsequent external loads.
5.1 Progress on this Task
Through conversations with several Oklahoma paving contractors it has been determined that there
would be significant interest in either reducing the design thickness of a pavement or extending the
pavements life through the use of a curing method that is more efficient than a spray on cure. During
these conversations several different possibilities were mentioned including using burlap, watering the
pavement at regular intervals, or the use of a more robust or multiple application of a curing compound.
In this project the research team’s aim is to determine a baseline for the curling and warping of these
different curing methods and then determine their effectiveness with small laboratory paste specimens
39

stored at 73o
F and 40% relative humidity. Next these curing techniques will be investigated in
specimens that are 1’ x 1’ x 8’ with reinforcing. This size is chosen to examine the performance of a strip
of concrete pavement. Again these specimens will be stored at 73o
and 40% RH to compare the early
age warping of the different curing methods. It is then planned to take this research to a much larger
scale on either the OSU campus or at an actual job site to construct a full scale pavement and monitor
the early age curling and warping of the pavement.
At this point the tests are being designed by the research team and the paste laboratory mixtures are
about to begin.
40

6.0 Provide regional material input parameters that can be used in the MEPDG for the design of rigid
pavements
The MEPDG user manuals have suggested that more accurate pavement designs can be determined if
accurate material input values can be obtained for local materials. Through the sensitivity analysis
contained in this report and through discussions with ODOT it has been determined that the following
parameters should be further investigated for Oklahoma paving concrete mixtures:
1. Concrete Shrinkage
2. Coefficient of thermal expansion (CTE)
3. Strength testing
6.1 Progress on this Task
6.1.1 Concrete Shrinkage
There are a significant number of concrete mixture shrinkage parameters that must be characterized for
the MEPDG. These include: maximum shrinkage, reversible shrinkage, and time to develop 50% of the
maximum shrinkage. These parameters will be investigated with the AASHTO T160 “Standard Method
of Test for Length Change of Hardened Hydraulic Cement Mortar and Concrete” with the only
modification being that a relative humidity of 40% is used instead of 50% as suggested in the MEPDG
design manual (ARA 2004).
It is well documented that the shrinkage of a concrete mixture depends largely on the percentage of the
mixture that is paste, the water content of the mixture, and the types of cementitious materials in the
mixture. A standard paving mixture for the state of Oklahoma has been determined through discussions
with ODOT and review of typical Oklahoma concrete paving mixtures. These mixtures consist of 0.42
41

water to cementitious ratio (w/cm) with total cementitious content of 564 lbs and a 20% replacement
with fly ash. The aggregate is proportioned to have approximately 60% coarse aggregate and 40% fine
aggregate. Approximately five percent air is entrained in each mixture. This mixture produces a paste
content of 25% in the mixture. This mixture will be systematically altered by substituting different
mixture components including four different cements, four different fly ashes, and three different paste
contents to examine their impact on the shrinkage parameters measured by the MEPDG.
This testing is underway.
6.1.2 CTE Testing
In the sensitivity analysis completed for this research project it was determined that the design of CRCP
is very sensitive to the CTE value of the concrete. In order to get a better understanding of these values
for typical Oklahoma concrete paving mixtures the research team plans on evaluating how different
components of a mixture impact the CTE. This will be done by measuring the CTE of a standard concrete
mixture to find a baseline for the mixture for the raw materials. Next different parameters of the
mixture are proposed to be varied and the resulting impact on the CTE to be measured. By combining
the influence from the different aggregate sources and the impact of the paste on the CTE then one
should be able to create a tool that is able to estimate the CTE for a mixture based on the mixture
ingredients and proportions for typical ODOT mixtures. It is anticipated that the following variables will
be investigated: cement content, cement replacement with supplementary cementitious materials
(SCMs), water to cement ratio, and aggregate gradation.
From discussions with ODOT the following seven coarse aggregate and 3 fine aggregate pits will be
investigated in this project. These pits were chosen as they cover a significant geographic area and
mineralogy of the state. A summary of the pits is provided in Table 7.
42
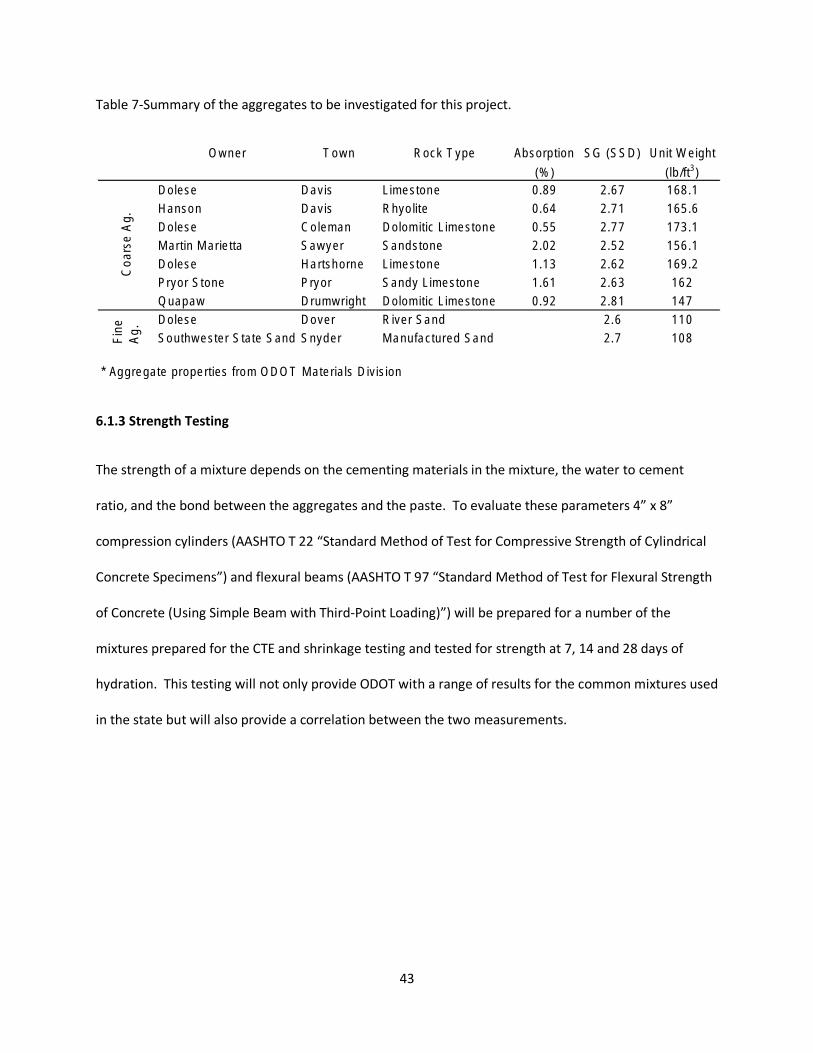
Table 7-Summary of the aggregates to be investigated for this project.
Owner Town Rock Type Absorption SG (SSD) Unit Weight
(%) (lb/ft3) Dolese Davis Limestone 0.89 2.67 168.1
Hanson Davis Rhyolite 0.64 2.71 165.6
g.
e A Dolese Coleman Dolomitic Limestone 0.55 2.77 173.1
Coa
rs Martin Marietta Sawyer Sandstone 2.02 2.52 156.1
Dolese Hartshorne Limestone 1.13 2.62 169.2
Pryor Stone Pryor Sandy Limestone 1.61 2.63 162
Quapaw Drumwright Dolomitic Limestone 0.92 2.81 147
ne
. Dolese Dover River Sand 2.6 110
Fi
Ag Southwester State Sand Snyder Manufactured Sand 2.7 108
* Aggregate properties from ODOT Materials Division
6.1.3 Strength Testing
The strength of a mixture depends on the cementing materials in the mixture, the water to cement
ratio, and the bond between the aggregates and the paste. To evaluate these parameters 4” x 8”
compression cylinders (AASHTO T 22 “Standard Method of Test for Compressive Strength of Cylindrical
Concrete Specimens”) and flexural beams (AASHTO T 97 “Standard Method of Test for Flexural Strength
of Concrete (Using Simple Beam with Third-Point Loading)”) will be prepared for a number of the
mixtures prepared for the CTE and shrinkage testing and tested for strength at 7, 14 and 28 days of
hydration. This testing will not only provide ODOT with a range of results for the common mixtures used
in the state but will also provide a correlation between the two measurements.
43

7.0 Conclusion
This report has provided a summary of the work completed to date on ODOT project 2208
“Development and Implementation of a Mechanistic and Empirical Pavement Design Guide (MEPDG) for
Rigid Pavements”. This document contains completed work for Task A and C and provides updates on
the others. This project is currently on time, within budget, and has met the promised milestones for
the first year. Work will commence on phase 2 of the project once funding is received from ODOT.
44

8.0 References
ARA Inc., “Guide for Mechanistic-Empirical Design of New and Rehabilitated Pavement Structures”,
NCHRP Project 1-37A, Mar. 2004.
ERES Consultants, “Performance of Pavement Subsurface Drainage”; NCHRP Results Research Digest –
268, November 2002.
Duboe, J.B., “An Evaluation of IDOT’s Current Underdrain Systems”, Illinois Dept. of Transportation –
Physical Research Report No. 120, December 1995.
FHWA, Pavement Subsurface Drainage Design Reference Manual, FHWA/USDOT – FHWA-NHI-08-030,
February 2008.
Hagen, M.G., Cochran, G.R., “Comparison of Pavement Drainage Systems”, Minnesota Department of
Transportation- Report Number 95-28, 1997.
Hall, K.T., Correa, C.E., “Effect of Subsurface Drainage on Performance of Asphalt and Concrete
Pavements”, NCHRP Report 499, 2003.
Hall, K.T., Crovetti, J.A., “Effect of Subsurface Drainage on Performance of Asphalt and Concrete
Pavements – Analysis of the SPS-1 and SSPS-2 Field Sections”, NCHRP Report 583, 2007.
Harvey, “Analysis of 2002 Design Guide Distress Prediction Models for Jointed Plain Concrete
Pavement”, Transportation research record , Volume issue-1947, 2006. Harrigan and Nov, “Performance
of Subsurface Drainage”, NCHRP, Research Result Digest, 2002.
Kannekanti, Venkata, “Sensitivity analysis of 2002 Design guide distresses prediction models for jointed
plain concrete pavement”, Transportation Research Record , Volume issue-1947, 2006.
Mahboub, K.C., Liu, D.L., Allen, D.L., “Evaluation and Analysis of Highway Pavement Drainage”, Kentucky
Transportation Center – Research Report KTC-03-32/SPR-207-00-1F, October, 2003.
Mallela, Jagannath, “Measurement and Significance of Co-efficient of Thermal expansion in Concrete
Rigid pavement”, Transportation Research Record , Volume issue-1919, 2005.
Zaghloul, Sameh, “Investigation of Environmental and Traffic inputs on Mechanistic- Empirical pavement
design guide prediction”, Transportation Research Record , Volume issue-1967, 2006.
45