Embed Size (px)
Citation preview
.. A STUDY OF
CONSTRUCTION EQUIPMENT AND INITIAL PAVEMENT ROUGHNESS
AS MEASURED WITH A PROFILOGRAPH
Research Report 49-2
Development of a Construction Control Profilograph Research Project 1-8-63-49
Conducted by Highway Design Division, Research Section
The Texas Highway Department
In Cooperation with The U. S. Department of Transportation
Federal Highway Administration Bureau of Public Roads
August 1968
•
A C K NOW LED G MEN T
The research reported in this paper was conducted
under the supervision of Mr. Robert L. Lewis, Research
Engineer and under the general supervision of Mr. T. S.
Huff, Chief Engineer of Highway Design.
Mr. J. C. Roberts, District Engineer of District 8
(Abilene) conceived the idea for this study and acknow
ledgment is given to Mr. G. J. Smith and Mr. W. o.
crawford of District 8 for the supervision and consulta
tion rendered.
Acknowledgment is also given to the personnel of the
Allen Construction Company for the help received in per
forming the various tests.
This study was conducted by personnel from District 8
and the Research Section of the Highway Design Division.
•
•
"
"
VIII.
TABLE OF CONTENTS, Continued
The Paver and the Haul Truck . The Paver Speed Paver Pauses . • • . Three Months Later . Observations • • • Review of Manufacturer's Recommendations.
CONCLUSIONS . . . • • • •
Page
• • 28 . • • • 30 . . . . 31
31 • 32 • 36
39
BIBLIOGRAPHY . . • • • • • • . . • . . • . . . . . • • • 41
ii
.. Figure No.
1
2
3
4
5
6
7
8
9
10
11
12
13
14
15
16
LIST OF FIGURES
Page
Oblique View of Blaw-Knox Paver 6
Rear View of Blaw-Knox Paver 6
Sensor On the Automatic Screed Leveling Device. 7
Breakdown Roller 7
Tandem Roller • . . . 9
Pneumatic Roller 9
Haul Truck Equipped with Special Dumping Gate . 10
construction Control profilograph . . . . . . . 10
Paver contact Rollers and Spring Assembly
profilograph Recording Wheel Near an Event Symbol ................. .
Roughness Reflected from Below
Profiles at Various Paver Speeds
Profiles Indicating Locations of Paver and Roller Pauses . . . . . . . . . . . .
• 15
15
18
20
. 21
Profiles Indicating Variation in Gate Opening . 23
Profile Indicating Before and After Cleaning Paver Contact Rollers •. ••. • . . . . . 25
Variation in profile After 80 Days (160,000 Vehicles) .•....••....•. 33
iii
A B S T R ACT
This is an interim report concerned with the development of a profilograph for measuring construction roughness. The profilograph presently under study was designed and fabricated by the Rainhart Company of Austin, Texas. Particular attention was given to the cost, ruggedness, simplicity of operation and maintenance during its design in order that similar instruments could be made available for use by the various Districts in Texas.
This report is a study dealing with the reasons for roughness in asphaltic concrete paving. The primary test site had the advantages of the following features:
(1) The surface of the flexible base had been planed with an CMI Autograde using electronically controlled grade apparatus and was very smooth and true to cross-section.
(2) TWo asphaltic concrete mats were placed using bituminous pavers with electronically controlled screeds.
The roughness was determined with the Rainhart profilograph and consisted of obtaining a profile over the areas in which the rollers parked, the paver paused, and various paver speeds were used.
This study could find no significant roughness in the area where rollers paused; however, surface variation was present near the area in which the paver paused for a change of trucks. Increased roughness was experienced as the paver speed increased.
The pavement materials and temperature of the mix were not considered in this study. The type of rollers and roller operation could be considered as constants since the same equipment and operators were used throughout.
iv
I. INTRODUCTION
There are many theories which have been advanced
denoting reasons for initial roughness in pavement sur
faces. Several causes for roughness can actually be seen
during construction and traced to construction practices.
Other theories have only been postulated in the past be
cause equipment to accurately measure roughness has not
been available.
The undesirable effects of initial or construction
roughness in the pavement surface are not fully defined,
since long term studies have not been directed to this end.
However, it is thought that initial roughness can be com
pounded in certain cases by the impact loads occurring in
repeated applications of traffic. In the test sections of
this study, roughness caused by construction procedures
results in small movement in the wheels of a vehicle. In
general, this movement is absorbed by the vehicle spring
and shock absorber system and is not noticed by the passen
ger. But this roughness can be noted through the steering
wheel by the driver. Also, there are cases in which initial
roughness is objectionable to passengers--particularly at
bridge approaches.
1
•
It is interesting to note that a wide range of initial
roughness is present in Texas. Research personnel attempt
ing to relate AASHO Road Test results to Texas conditions
experienced difficulty because the initial serviceability
index, as measured with the CHLOE profilometer, did not
duplicate initial serviceability as found at the AASHO Road
Test. (1) Indeed, a wide range of initial serviceability
indices were found. The Texas study found that certain newly
constructed pavement surfaces have a high initial service
ability index number and several years of traffic could be
expected from these surfaces before the serviceability index
number approached the initial serviceability index of those
roadways found with the lower initial values.
Objective
The objective of this study is to note causes of initial
roughness in asphaltic concrete construction procedures.
Hypotheses were formed as to which construction equipment
and procedures result in roughness. The locations of these
procedures were marked on roadway test sections, and the
roughness of those locations was measured with a profilograph
and noted on the output chart .
2
II. DESCRIPTION OF TEST SITES
Two test sections were established in District 8
(Abilene). These two locations were different in that one
was an urban section and the other rural. These sections
were both overlaid with approximately 1-1/4 to 1-1/2 inch
layer of asphaltic concrete; however, the overlay placed on
the urban section was over an old well established street
and the surfacing of the rural section was over a newly
constructed portion of interstate highway. The Same con
tractor (Allen Construction Company, San Antonio, Texas)
used the same equipment on both jobs.
The first test site was located on Treadaway Street
(loop 243, 33-8-7) in the City of Abilene, Texas. Several
city streets intersect Treadaway Street in a transverse
manner. These transverse streets were originally construc
ted with a dip at each curb line for drainage.
No intermediate leveling or "blade-on" mix was used on
this street during the overlay process. A machine laid
course of approximately 1-1/2 inches of Texas Specification
Type C hot mix asphaltic concrete was placed during the
testing period.
3
The second test site was located on IH 20(I 20-2(71)225)
(6-2-35) approximately eight miles West of Roscoe, Texas.
This newly constructed section of interstate highway was
composed of a base material of limestone origin and two
surface layers of Texas Specification Type B and Type D
asphaltic concrete. During the finishing of the base, ap
proximately 1/4 inch of the surface of the base was planed
with an electronically controlled planer (a eMI Autograde) .
The resulting surface was very smooth with a constant trans
verse slope. The Type B hot mix was used over the base
material and the final surface was the Type D asphaltic
concrete (1-1/4 inches). Both asphaltic concrete types were
placed with the same electronically controlled laydown
machine. The test section was in rural surroundings and was
relatively straight and level. The only unusual vertical
alignment was the approaches to an overpass near the final
portion of the test section.
The asphaltic concrete was mixed at temperatures
ranging from 2900 F to 315 0 F. The breakdown rolling
temperature was around 1700 F to 2100 F.
4
III. CONSTRUCTION EQUIPMENT
The contractor's equipment was relatively new and in
good working order. Even though duplicate equipment was
present on the job, (i.e. two of the same type rollers, pavers,
etc.) the same equipment was used on both test sections.
Bituminous Paver
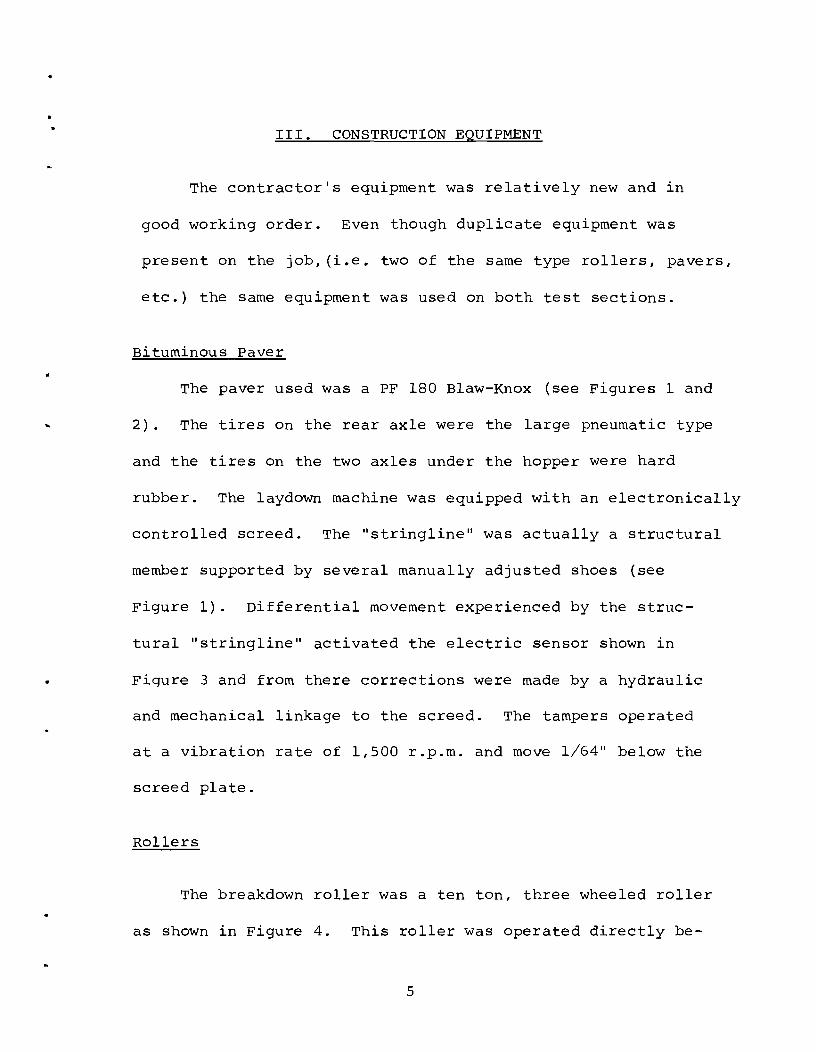
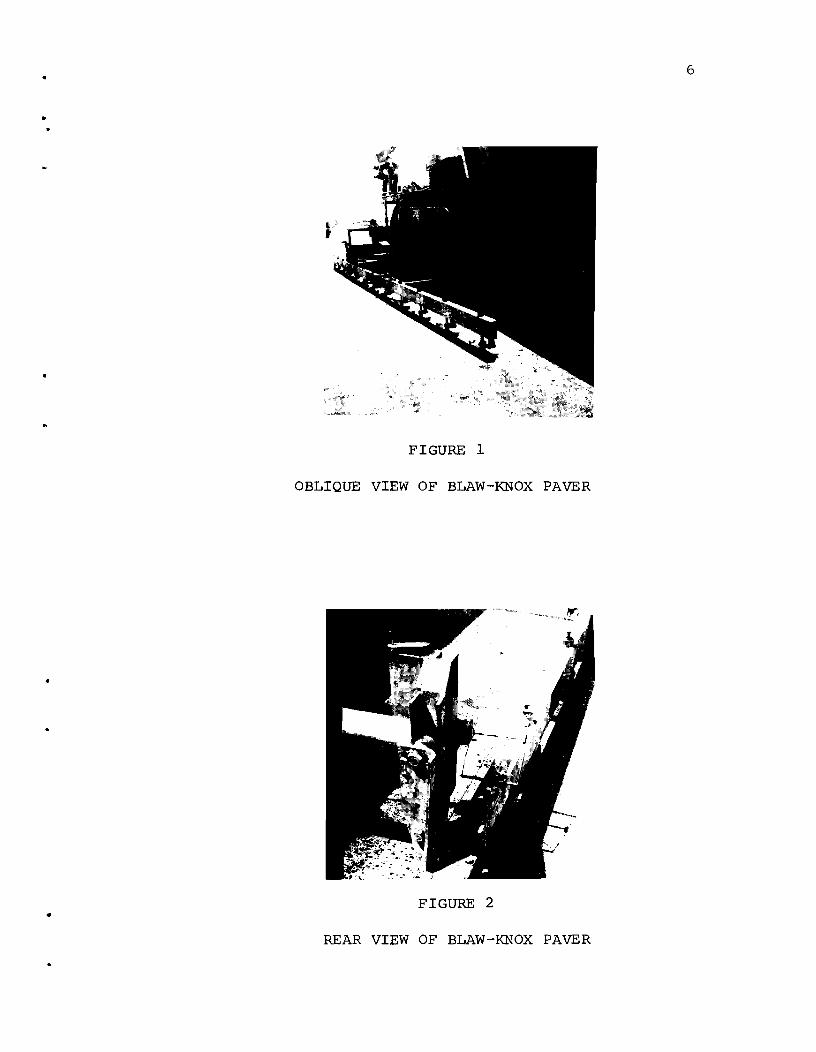
The paver used was a PF 180 Blaw-Knox (see Figures 1 and
2). The tires on the rear axle were the large pneumatic type
and the tires on the two axles under the hopper were hard
rubber. The laydown machine was equipped with an electronically
controlled screed. The "stringline" was actually a structural
member supported by several manually adjusted shoes (see
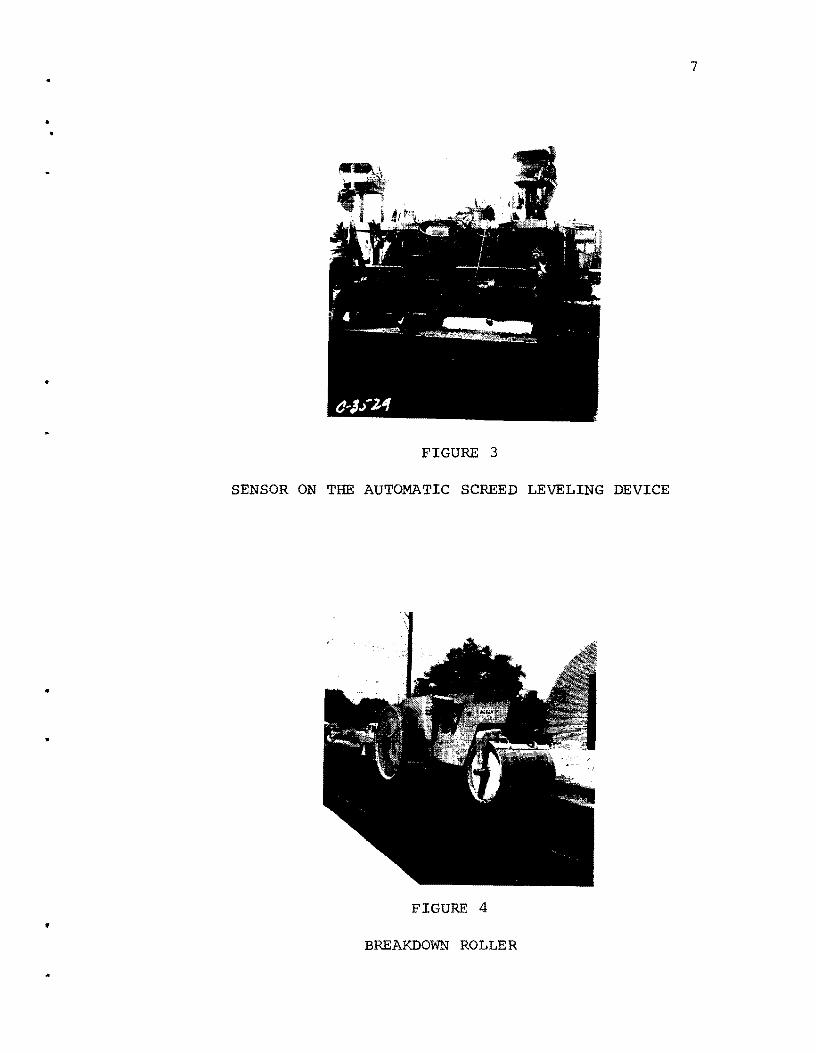
Figure 1). Differential movement experienced by the struc
tural "stringline" activated the electric sensor shown in
Fiqure 3 and from there corrections were made by a hydraulic
and mechanical linkage to the screed. The tampers operated
at a vibration rate of 1,500 r.p.m. and move 1/64" below the
screed plate.
Rollers
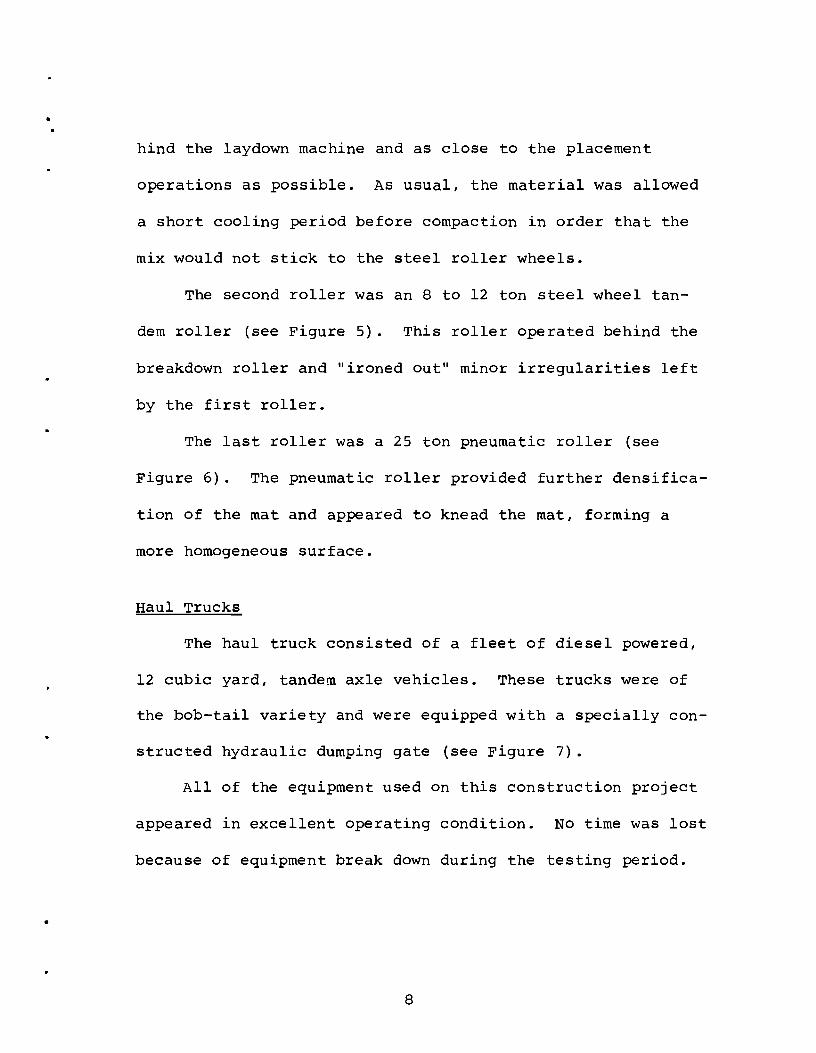
The breakdown roller was a ten ton, three wheeled roller
as shown in Figure 4. This roller was operated directly be-
5
6
FIGURE 1
OBLIQUE VIEW OF BLAW-KNOX PAVER
FIGURE 2 •
REAR VIEW OF BLAW-KNOX PAVER
7
•
•
FIGURE 3
SENSOR ON THE AUTOMATIC SCREED LEVELING DEVICE
•
FIGURE 4
BREAKDOWN ROLLER
•
. ,
hind the laydown machine and as close to the placement
operations as possible. As usual, the material was allowed
a short cooling period before compaction in order that the
mix would not stick to the steel roller wheels.
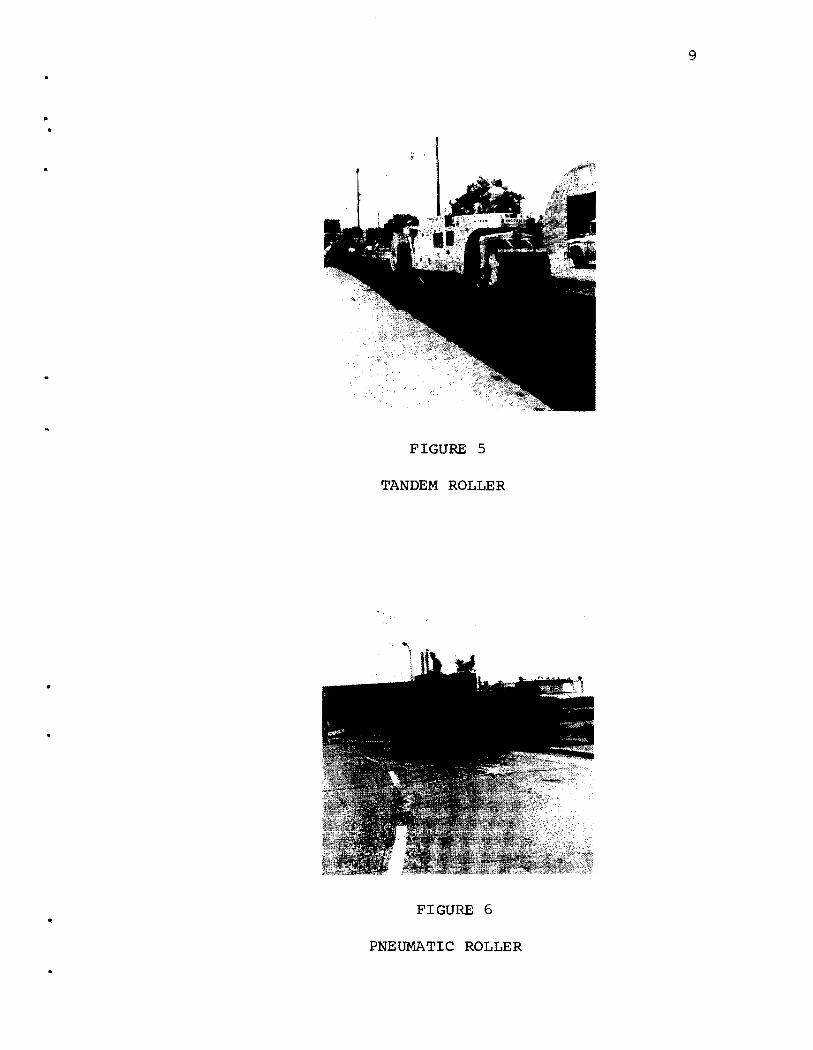
The second roller was an 8 to 12 ton steel wheel tan
dem roller (see Figure 5). This roller operated behind the
breakdown roller and lIironed out ll minor irregularities left
by the first roller.
The last roller was a 25 ton pneumatic roller (see
Figure 6). The pneumatic roller provided further densifica
tion of the mat and appeared to knead the mat, forming a
more homogeneous surface.
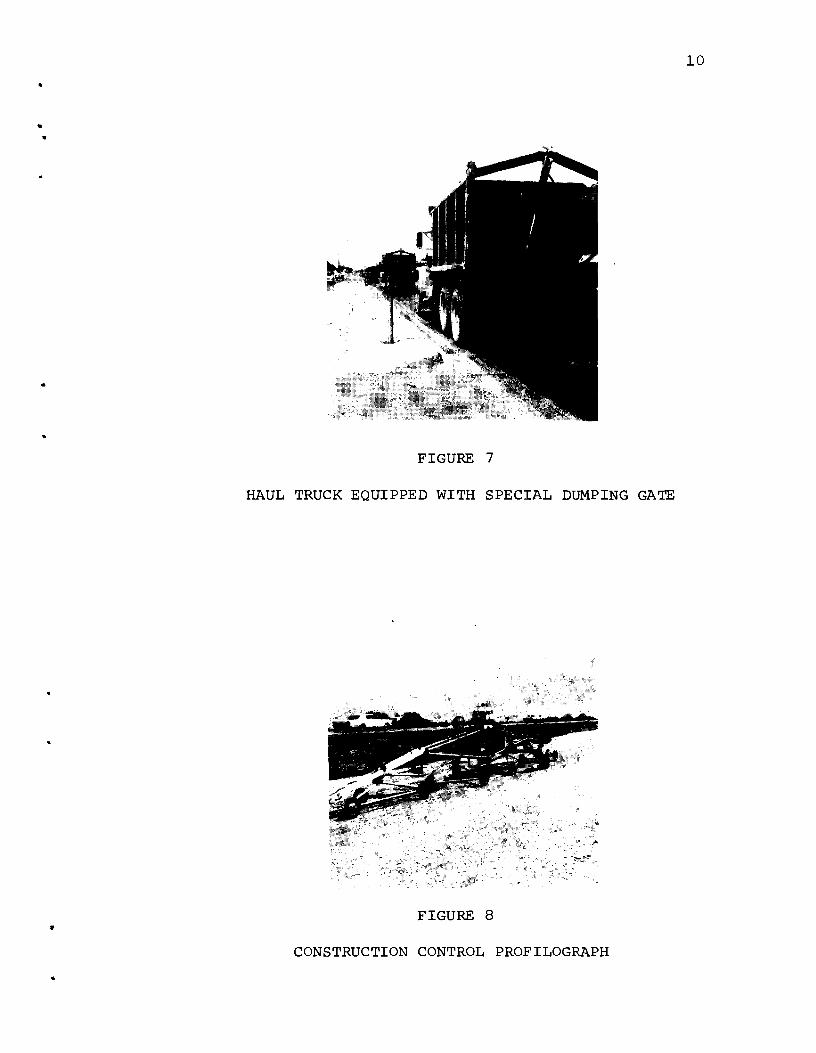
Haul Trucks
The haul truck consisted of a fleet of diesel powered,
12 cubic yard, tandem axle vehicles. These trucks were of
the bob-tail variety and were equipped with a specially con
structed hydraulic dumping gate (see Figure 7).
All of the equipment used on this construction project
appeared in excellent operating condition. NO time was lost
because of equipment break down during the testing period .
8
•
•
•
FIGURE 5
TANDEM ROLLER
FIGURE 6
PNEUMATIC ROLLER
9
• -
•
FIGURE 7
HAUL TRUCK EQUIPPED WITH SPECIAL DUMPING GATE
FIGURE 8
CONSTRUCTION CONTROL PROFILOGRAPH
10
•
•
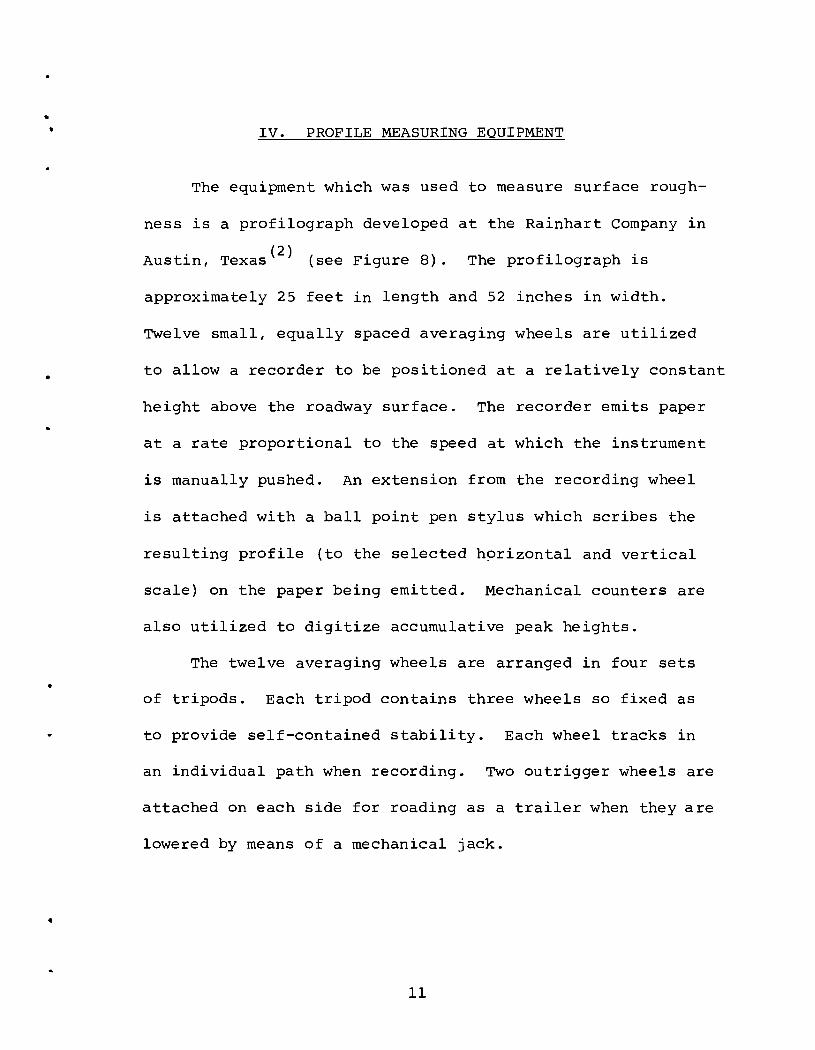
IV. PROFILE MEASURING EQUIPMENT
The equipment which was used to measure surface rough
ness is a profilograph developed at the Rainhart Company in
Austin, Texas (2) (see Figure 8). The profilograph is
approximately 25 feet in length and 52 inches in width.
Twelve small, equally spaced averaging wheels are utilized
to allow a recorder to be positioned at a relatively constant
height above the roadway surface. The recorder emits paper
at a rate proportional to the speed at which the instrument
is manually pushed. An extension from the recording wheel
is attached with a ball point pen stylus which scribes the
resulting profile (to the selected h9rizontal and vertical
scale) on the paper being emitted. Mechanical counters are
also utilized to digitize accumulative peak heights.
The twelve averaging wheels are arranged in four sets
of tripods. Each tripod contains three wheels so fixed as
to provide self-contained stability. Each wheel tracks in
an individual path when recording. Two outrigger wheels are
attached on each side for roading as a trailer when they are
lowered by means of a mechanical jack .
11
•
•
v. METHOD OF STUDY
Hypotheses were formed as to which equipment and
construction procedure contributes to initial surface
roughness. It was postulated that the following procedures
causes roughness:
(1) Laydown machine pauses for the discharge of
material into the machine hopper from haul trucks .
(2) Rollers parked on the freshly placed asphaltic
concrete mat.
(3) Areas which are hand raked.
(4) Fast paver machine speeds.
(5) Unusual or unnecessary movement of the haul truck
while the truck is in contact with the laydown
machine during the unloading process.
One additional postulation was made - roughness is
reflected through the new mat from the overlaid surface.
Method of Marking Construction Roughness
It was desired to physically mark locations on the pave
ment surface at areas where roughness was expected. To
accomplish this location marking, small symbols were cut
from thin cardboard. These cardboard symbols were nailed
12
into the fresh asphaltic concrete mat at the selected
locations.
Reasoning suggested that thin cardboard would not cause
roughness and could be pulled from the surface at the comple
tion of the study. The cardboard was cut into various sym
bols in order that certain symbols would denote different
causes of roughness.
Laydown Machine Pauses. A square cardboard symbol was
nailed to the new surface near the screed at the rear of the
paver at each location which the laydown machine halted. In
almost every case the laydown machine did not pause unless
the haul truck had finish unloading. Triangular symbols
were used where the laydown machine pause exceeded one
minute.
Parked Rollers. The rollers were numbered in consecu
tive order with the smallest number being near the laydown
machine. The three wheel breakdown roller was labeled
Roller #1, the tandem was labeled Roller #2 and the pneu
matic was labeled Roller #3. A small rectangular card
board symbol was nailed to the surface near the roller wheel
at each location on the pavement at which a roller parked.
A 1, 2 or 3 was written on the cardboard to denote each
roller as described above.
13
Raked Areas. It was planned to mark extensively hand
raked areas with a circular symbol 7 however, almost no raking
was done. Areas at the beginning and end of the job were
raked, but it was thought that these areas would not consti
tute a reliable test.
Variation in Paver Speed. At the suggestion of Mr. J. C.
Roberts, District Engineer of District 8, and with the help
of Allen Construction Company personnel, the speed of the
laydown machine was varied as the material was placed.
Speeds of 22.3, 39, 50 and 70 feet per minute were selected
for study and material was placed for approximately 800 feet
at each speed. Locations of each speed study section were
noted by station number and by distance from the beginning
of the job.
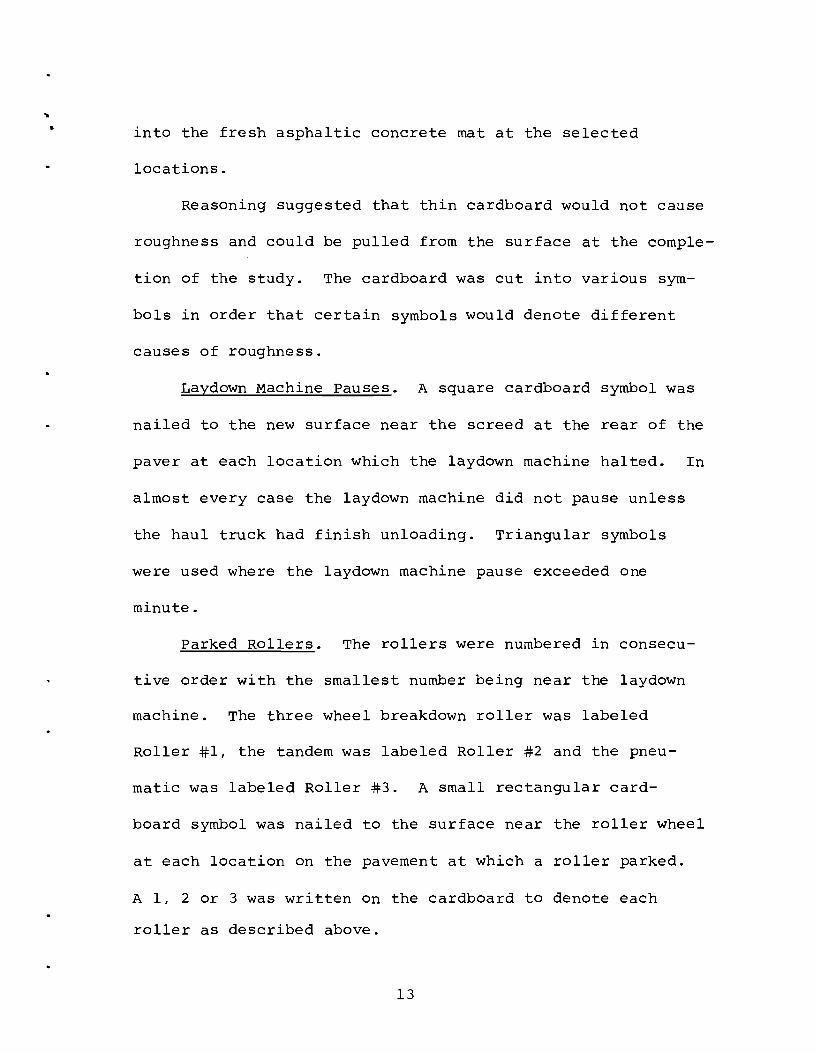
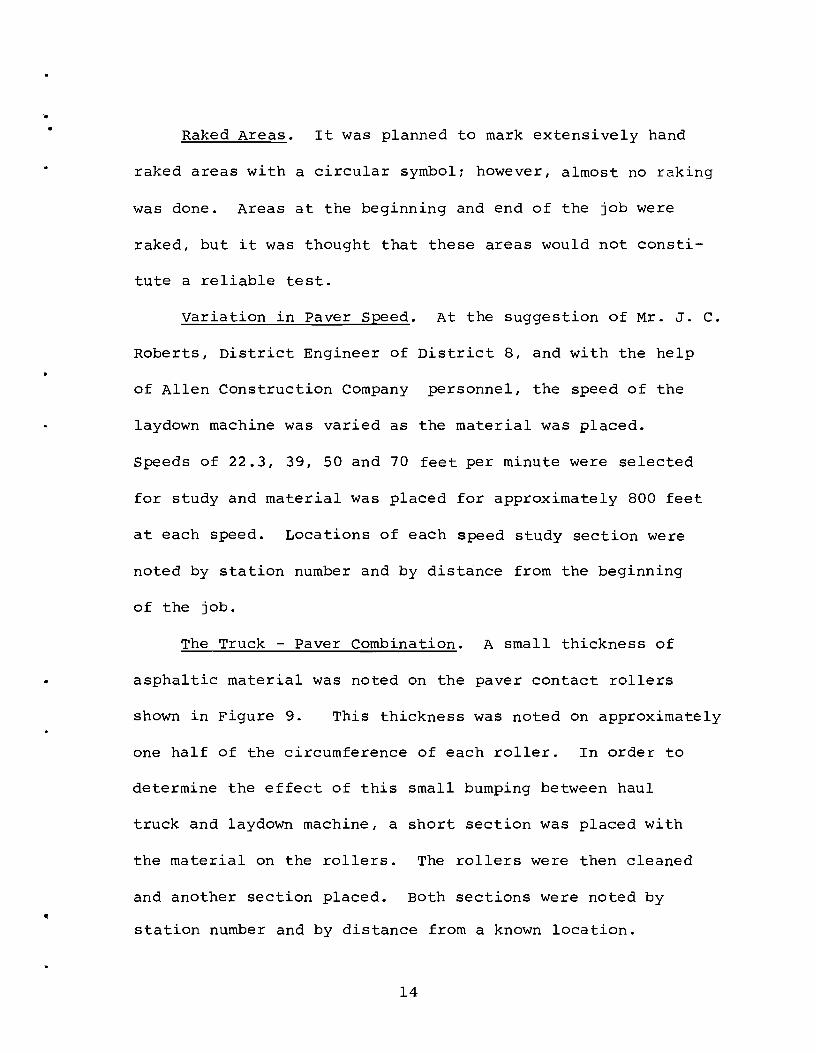
The Truck - Paver Combination. A small thickness of
asphaltic material was noted on the paver contact rollers
shown in Figure 9. This thickness was noted on approximately
one half of the circumference of each roller. In order to
determine the effect of this small bumping between haul
truck and laydown machine, a short section was placed with
the material on the rollers. The rollers were then cleaned
and another section placed. Both sections were noted by
station number and by distance from a known location.
14
•
FIGURE 9
PAVER CONTACT ROLLERS
AND SPRING ASSEMBLY
FIGURE 10
15
PROFILOGRAPH RECORDING WHEEL NEAR AN EVENT SYMBOL
•
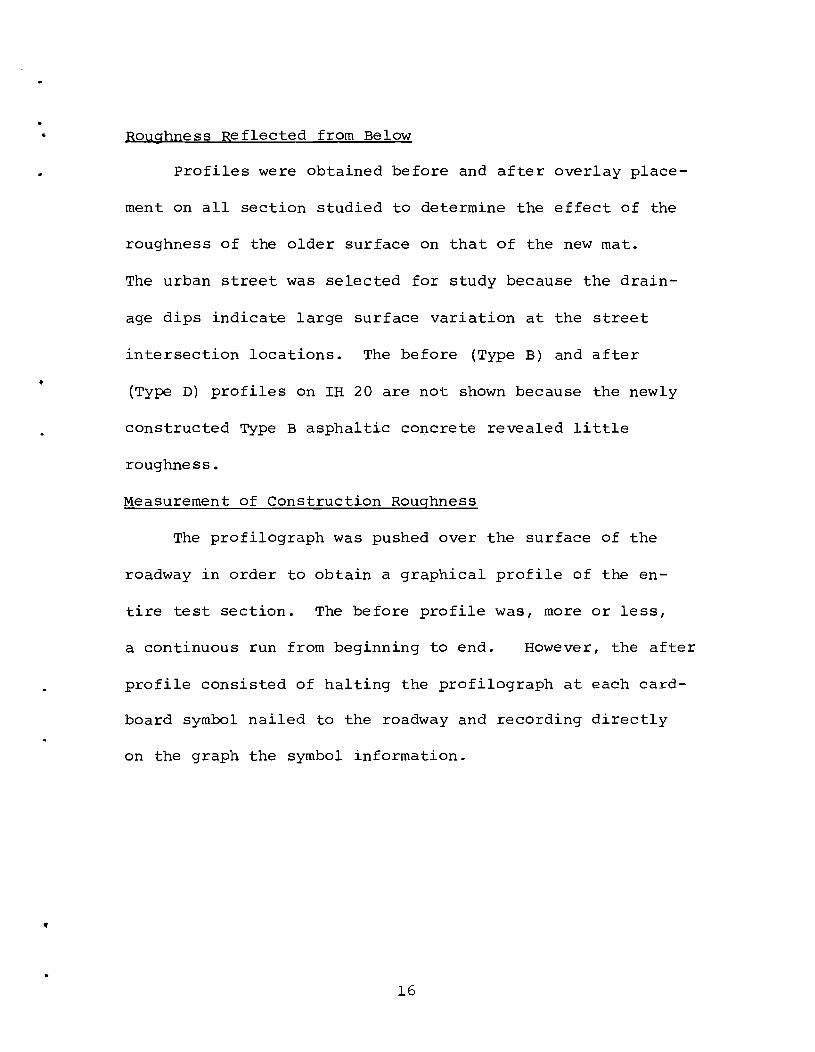
Roughness Reflected from Below
Profiles were obtained before and after overlay place
ment on all section studied to determine the effect of the
roughness of the older surface on that of the new mat.
The urban street was selected for study because the drain
age dips indicate large surface variation at the street
intersection locations. The before (Type B) and after
(Type D) profiles on IH 20 are not shown because the newly
constructed Type B asphaltic concrete revealed little
roughness.
Measurement of Construction Roughness
The profilograph was pushed over the surface of the
roadway in order to obtain a graphical profile of the en
tire test section. The before profile was, more or less,
a continuous run from beginning to end. However, the after
profile consisted of halting the profilograph at each card
board symbol nailed to the roadway and recording directly
on the graph the symbol information.
16
VI. PRESENTATION OF RESULTS
The results of each test have been reported in this
study in terms of a scaled profile of the vertical irregular
ities and horizontal lengths found by the profilograph. The
horizontal scale is one inch equals ten feet and the verti
cal scale is true, or one inch equals one inch, for all pro-
files shown herein. On each profile, the construction
operations proceeded from right to left.
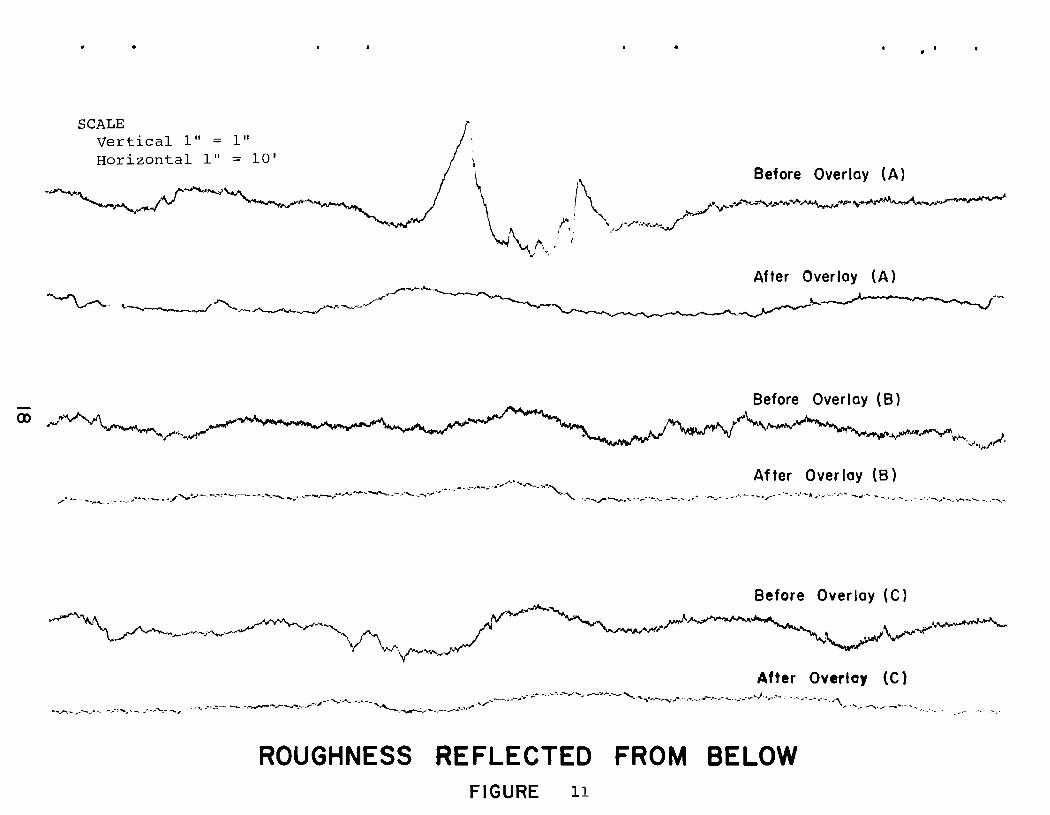
Roughness Reflected from Below
The first test section selected was the city street
or urban section. The street was originally constructed with
small dips transverse to the section length. These dips
occurred at the gutter line of the intersecting streets and
are used for drainage. Figure 10 indicates before and after
profiles of three sections of this street which show that
roughness is reflected through the new mat from the original
surface. All three sections indicated in Figure 10 were at
intersecting streets. The thickness of the new surface was
approximately 1-1/2 inches and was placed with the electronic
screed control in operation.
17
SCALE vertical 1" = 1" Horizontal 1" = 10'
----'V'-~~~.~.'~~,.,....~ "-..~. ~ ~.!\ . ...,.~::::::~~
~ I" ' .. /'''-':,.<,-,,,,,,,/ \ . . ! .. ,
After Overlay (A) ,/",-.-~
~ . . <.-_....../~--.""---... ~.-...~~~./..,r ~ ~~~.
ex> A...,.~ .... r' .... Before Overlay (B)
~~""""-.,I"~"~"';""',,/'i;J'~' After Overlay (8)
/"" -.~, .. " . _ ,""-' ./~'.",- -.-,.-,- -- ...... ,,-... --,-..-.... ---..• ->-.... ,-............ -... ; .. ,.-, .•. " ................. ~ •. """"" .. -,.r-~ ..... ,.-.... --.. .. ' ." ..... - . -,/' .... '.' -•. -....... -,,- - .... , "-, ,' ..... ~,.-.~-"'~ ... -,.
Before Over lay (C) ~~'"
~'\."N\. ~VY""""-r-""'............. /~ ~!/,,r"A./'~ \ , ...r""-,,,"~ ~"", ........... --~",,~ \ A ,,-~~ ... 'JJII v"'"
( \'" V-""'-...... o.r
After Overlay (C) _..-.._,_.' .... _ ....... - .... __ .- ... ,. .,.--._ ' . .,.......-_--.,. ~_ ...... --, .•. -.... ,.""---,~_'~. ___ ... ~ ..... /.'--.. -•. -.--.-.. -· .. --'----'""'"'·-·--··'·~.r.-..... -.-.. ,..--..... - .. ~_·~-)··r··- . '.-,'."." '\ ..... , ___ ., _"-',
ROUGHNESS REFLECTED FROM BELOW FIGURE 11
..
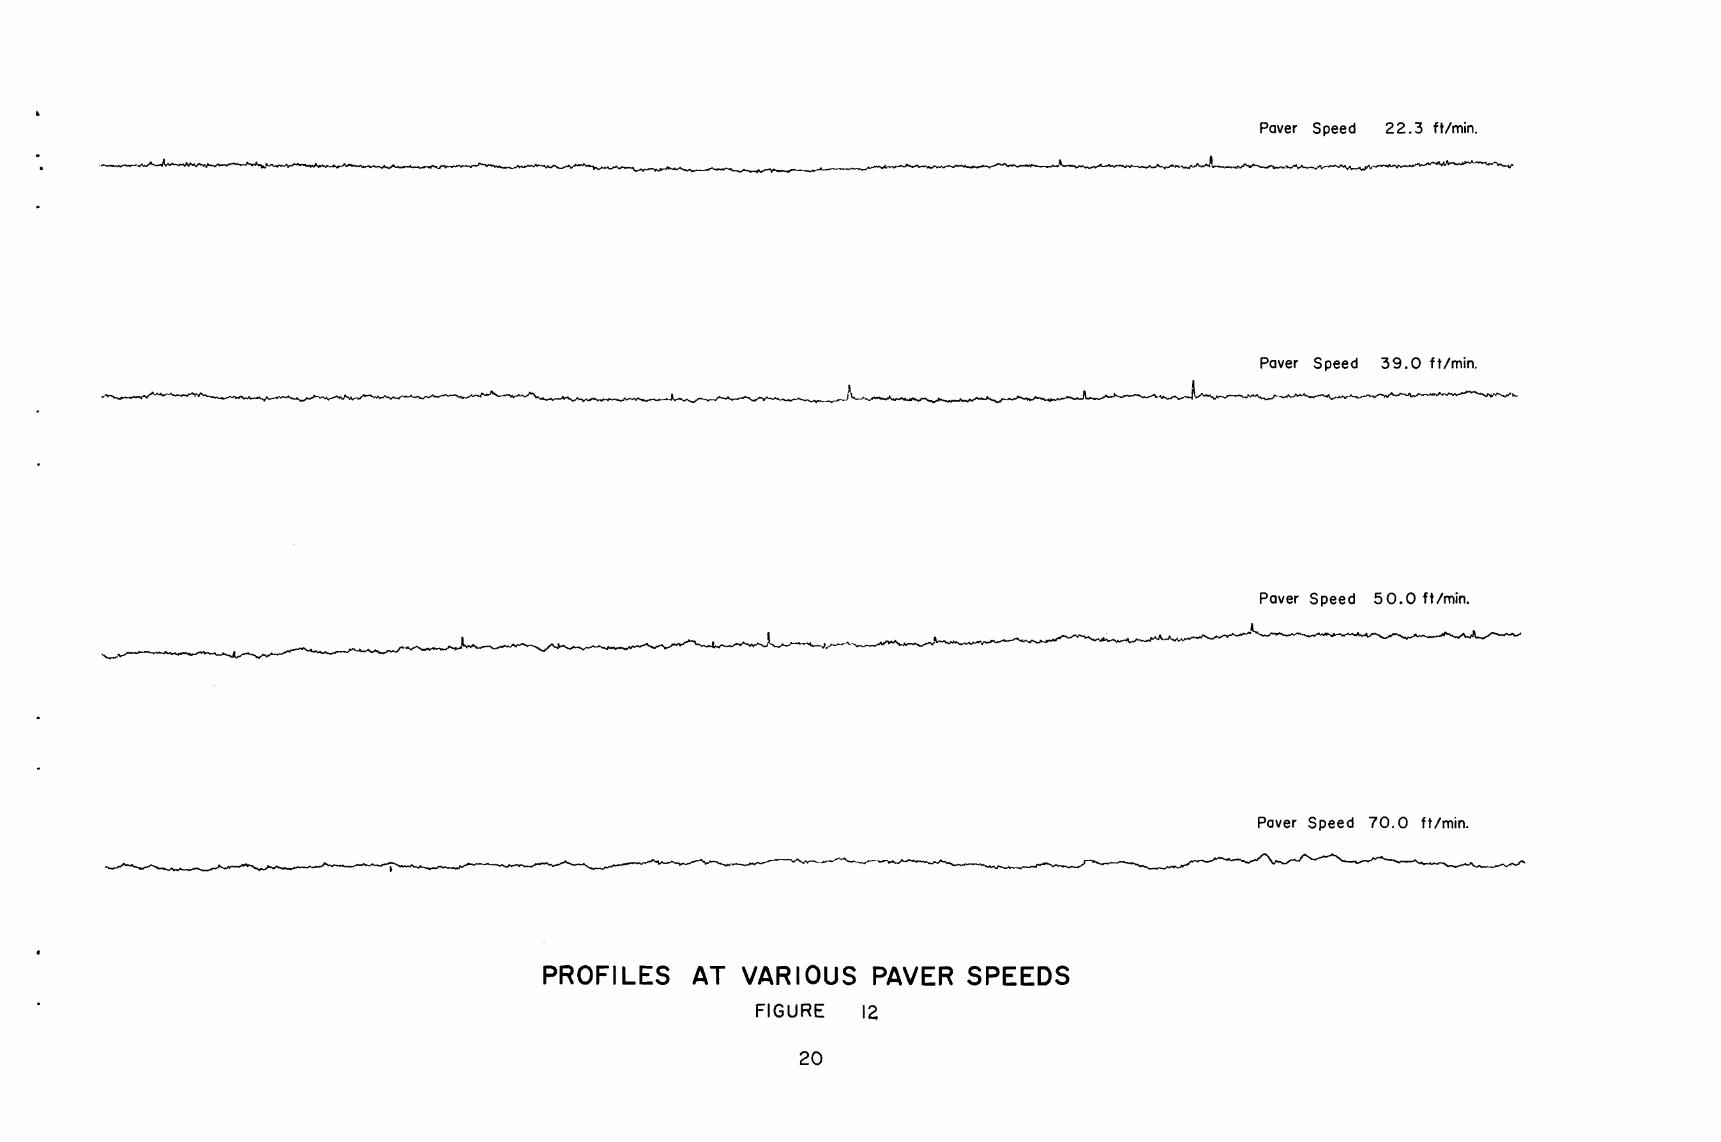
The Paver Speed
Figure 11 reveals four roadway profiles. Each profile
was obtained on a section over which asphaltic material had
been placed with the laydown machine operating at different
speeds. The speeds were 22.3, 39, 50 and 70 feet per minute
and the related profiles are indicated in consecutive order
from top to bottom.
Due to limitations of the size of the paper in this
report, only short lengths can be indicated herein; however,
the profiles shown in Figure 11 are indicative of the total
length tested. The second or rural section of IH 20 was used
in this study.
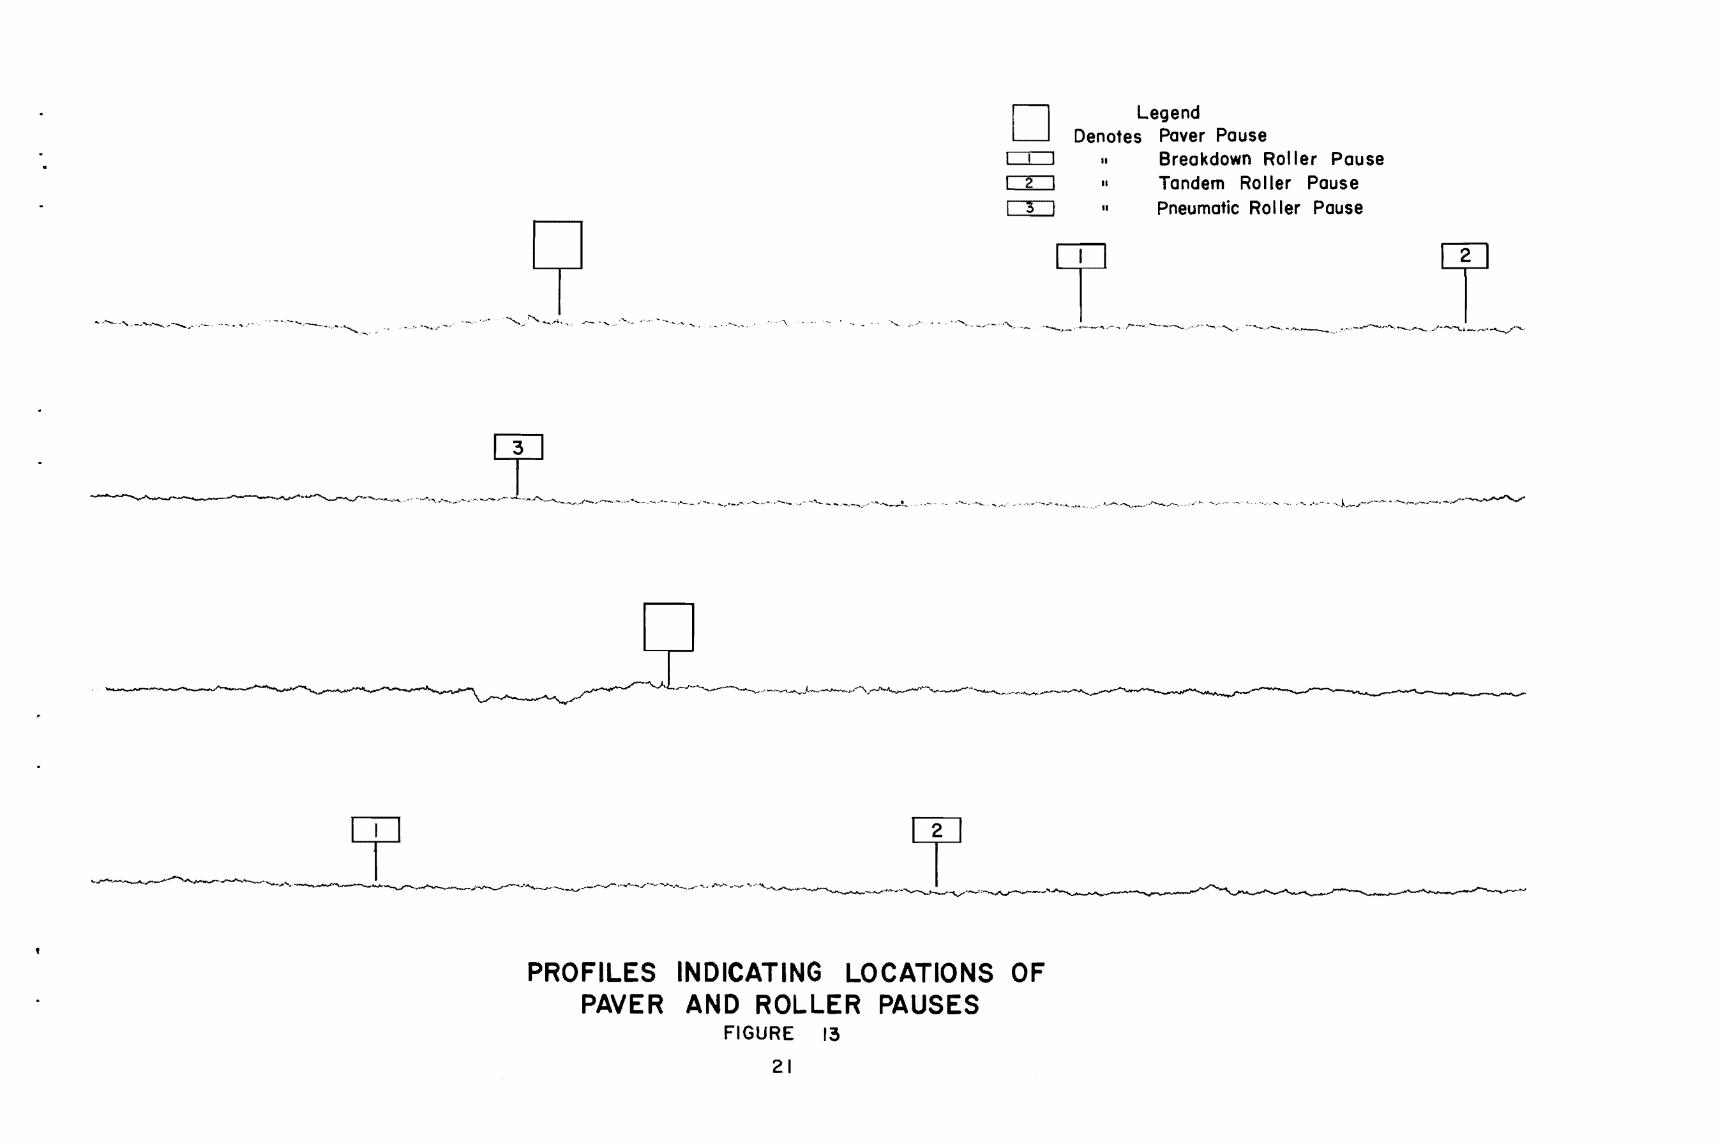
The Parked Roller and Paver Pauses
Figure 12 contains profiles obtained on IH 20 at a
paving machine speed of 50 feet per minute. The square
symbols indicate locations at which the laydown machine
paused. The rectangular symbols indicate points at which a
roller was parked. The numbers within the rectangular
symbols indicate the roller type, the "2" being the tandem
roller and the "3" the pneumatic roller. Care was taken to
obtain a profile over the area in which the roller was
actually parked. Attention is called to the small irregu-
19
, Paver S pee d 22.3 ftlmin.
,~~~ ~,~~~ __ ~~~~~~~~~~~-v
Paver Speed 39.0 ft/min.
~~~~--~~~~~~~~------~~~------~~~--~~~--~ ~~~~~
Paver Speed 50.0 ft/min.
~ ~~~ __ ~~~~~~~~~~~ __ rA~--~~~~~~~~--~~~~'-~w-~~~-/
~~~--~~--~~--~~~~~~-- '-----
PROFILES AT VARIOUS PAVER SPEEDS FIGURE 12
20
Paver Speed 70.0 ft Imin.
-0
:::tJ o
."..,
.. ~r=
1"1'
11"'
1 :::
tJC
/) -l>
Z
z~
"T
lCn
~ :::t
J ~
N:O
O_
I"1
rZ
rG
')
0011
"'1
:::t
J5
~o
c:~
C/)
-1"
'10
C/)~
o ..,..
{ ( 1 { > !--a
I ~ ( / \ } " f ~ f \ " t I < i-fJ
l
f 1 "
-; I , I " , J ? , " I i I ~ , I 1 ! J. ; ( I· } I t 1 ) " r I ': I , ; ~
I ) I, ~ , ( I i " \
~ r i ~ } I "
, I f * ~ I .I
, ! , !, I ) (, I i f ) " , l / , I I , J
BBBD
o CD
=
:l
= =
a CD
en
r CD
"-i O
l d'~
:l
0 CD
<
:l
CD
:lO
CD
a.
c a.
:IIII:
""'"
3 CD 3
a.
" 9.
0
0 _
. =E
c
n :::t
J ::J
en
:0
0
CD
0=
:0
-C
DO
a
;-""
,=
"'"
CD
,,"'"
"0
o
c -0
c
en
0 en
CD
C
CD
en
CD
•
t
larities noted in the profile (approximately two inches)
to the left of the square symbols. This could be consid
ered the area just after the machine starts operating after
pausing for another load from the haul truck. In general,
the profile indicates a small depression or sag within this
length. The paver length is approximately 19 feet or 1.9
inches on the output chart .
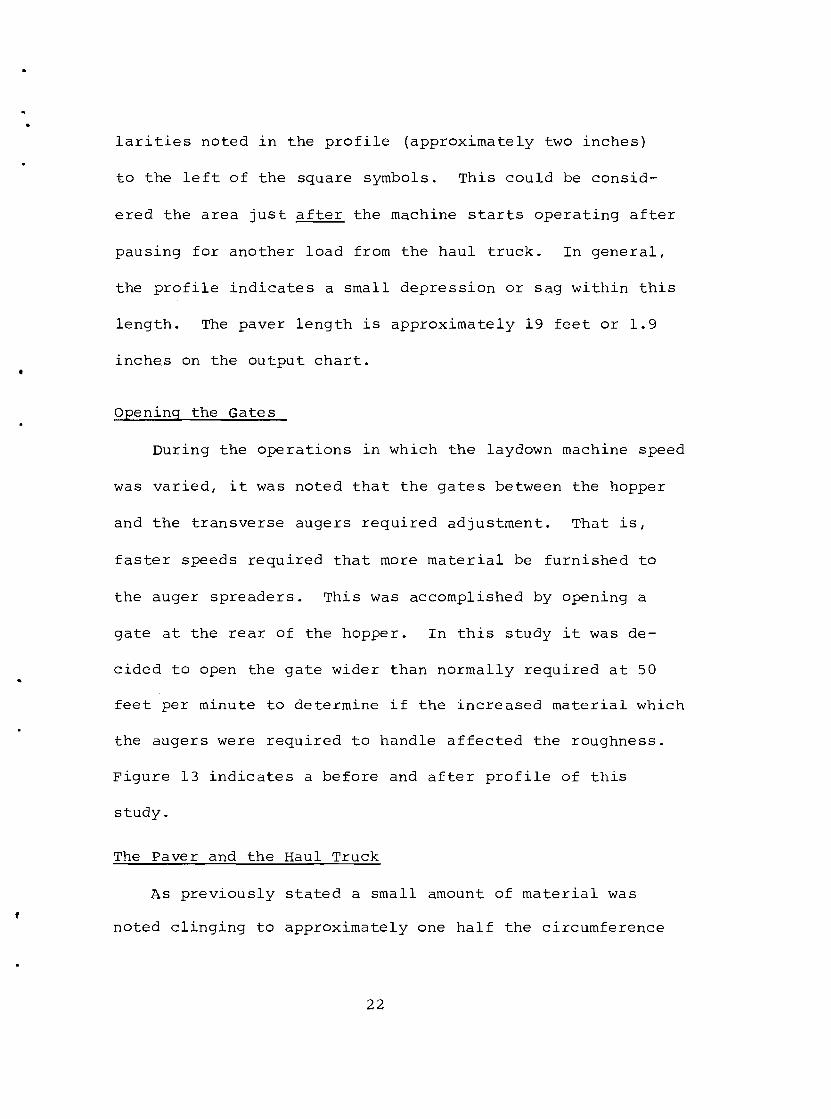
Opening the Gates
During the operations in which the laydown machine speed
was varied, it was noted that the gates between the hopper
and the transverse augers required adjustment. That is,
faster speeds required that more material be furnished to
the auger spreaders. This was accomplished by opening a
gate at the rear of the hopper. In this study it was de
cided to open the gate wider than normally required at 50
feet per minute to determine if the increased material which
the augers were required to handle affected the roughness.
Figure 13 indicates a before and after profile of this
study.
The Paver and the Haul Truck
As previously stated a small amount of material was
noted clinging to approximately one half the circumference
22
SCALE VERTICAL 1" = 1" HORIZONTAL 1" = 1 0 I
Normal Gate Opening
Excessive Gate Opening
PROFILES INDICATING VARIATION IN GATE OPENING
FIGURE 14
Before
After
•
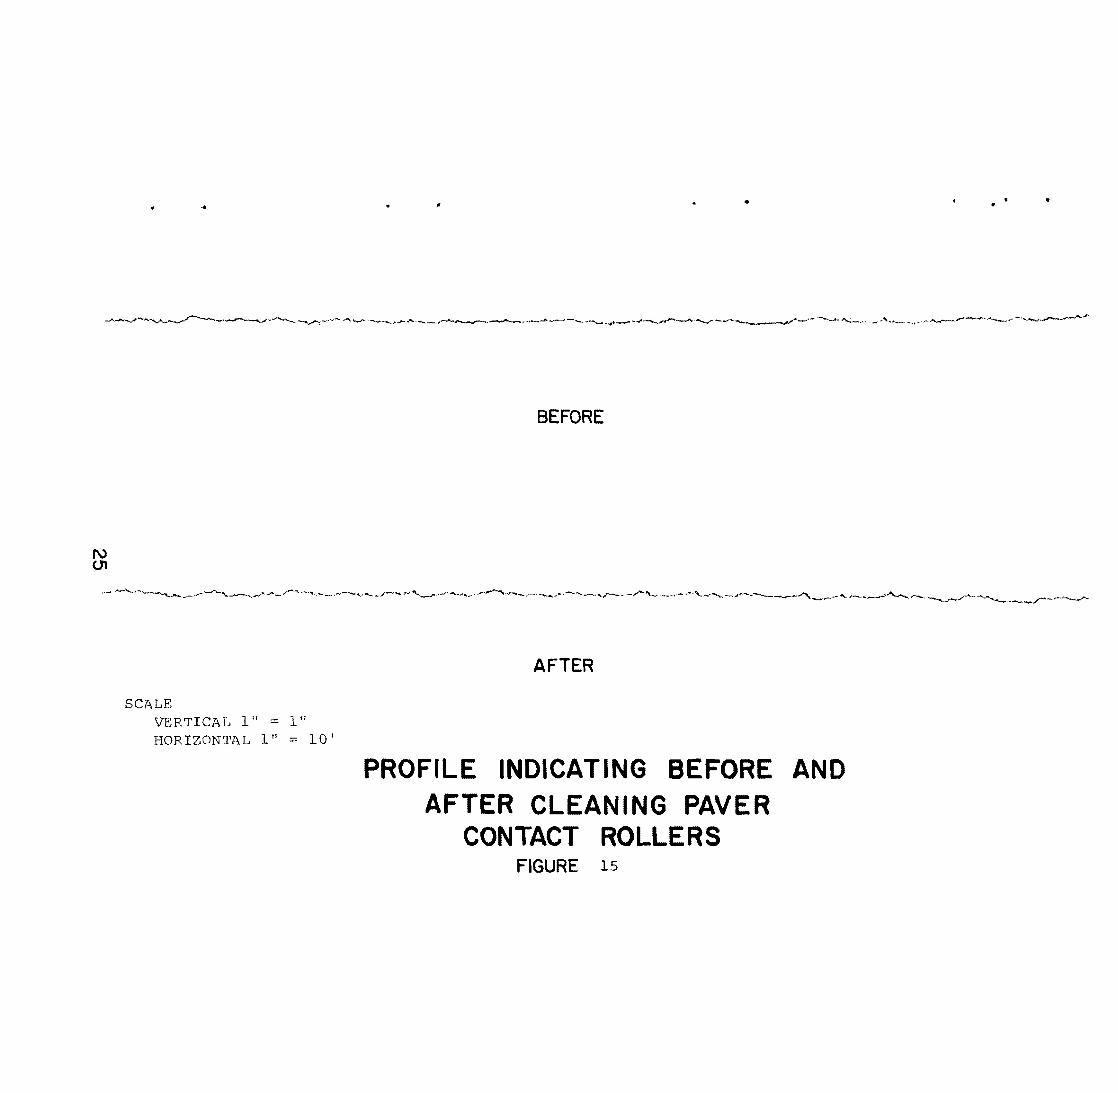
of the small contact rollers between the truck and the lay
down machine. The thickness of this "cake" was about one-
half inch and was found on the rollers of both sides. The
upper profile in Figure 14 shows the profile obtained be
fore cleaning the small contact rollers and the lower pro
file indicates a profile obtained after these rollers were
cleaned .
24
f\) U1
SCALE VERTICAL 1" 1 H
HORIZONTAL 1" == 10'
•
BEFORE
AFTER
PROFILE INDICATING BEFORE AND AFTER CLEANING PAVER
CONTACT ROLLERS FIGURE 15
..
VII. DISCUSSION OF RESULTS
Of the initial roughness studied, it is obvious that
the greatest contributor is that which is reflected from
below. In many cases, this type of roughness cannot be
due to construction procedures or equipment since sufficient
thickness of asphaltic material is necessary or "blade on"
applications must have been applied previously. Figure 10
indicates the extent that the 1-1/2 inch overlay reduces
the original profile fluctuations.
The Parked Roller
The parked roller has been the cause of great concern
for many years. Speculation as to where to park or even if
a roller should stand idle on a fresh mat has been given
considerable thought throughout many years of highway con
struction. This study indicates no appreciable difference
in the roughness area of the parked roller as compared to
the roughness of the surrounding area. In other words, the
parked rollers which were studied, do not cause initial
roughness of any significance. Small indentations were
visually observed in the surface at each of the locations
where the flat wheel rollers paused, but these depressions
26

appear to be "ironed out" after all rolling was completed.
Construction methods used to control roughness should
not be confused with those used to control strength. A
good example of this statement is the requirement that a
roller be so aligned that the drive roll is operated to
ward the laydown machine. This is done in order that the
uncompacted material is "tucked" under the drive wheel on
the initial roller pass forming a more homogeneous mat. If
this were not done, the steering roll would be in the lead
and the fresh mix would be shoved slightly. In some cases
when the steering roller is in the lead, small vertical
cracks occur at close longitudinal intervals. Of course,
loss of strength is experienced in this case.
variation in Gate Opening
It was postulated that some roughness occurs if the
augers and screed are required to handle excessive material;
i.e. the asphaltic concrete would be forced into the area
where the augers operate and due to excessive head and the
force of the augers, a larger amount of material would be
forced to the screed. This larger amount of material was
obtained by opening the gate wider and allowing extra
material into the auger area. Visual observations of this
27
appear to be "ironed out" after all rolling was completed.
Construction methods used to control roughness should
not be confused with those used to control strength. A
good example of this statement is the requirement that a
roller be so aligned that the drive roll is operated to
ward the laydown machine. This is done in order that the
uncompacted material is "tucked" under the drive wheel on
the initial roller pass forming a more homogeneous mat. If
this were not done, the steering roll would be in the lead
and the fresh mix would be shoved slightly. In some cases
when the steering roller is in the lead, small vertical
cracks occur at close longitudinal intervals. Of course,
loss of strength is experienced in this case.
Variation in Gate Opening
It was postulated that some roughness occurs if the
augers and screed are required to handle excessive material;
i.e. the asphaltic concrete would be forced into the area
where the augers operate and due to excessive head and the
force of the augers, a larger amount of material would be
forced to the screed. This larger amount of material was
obtained by opening the gate wider and allowing extra
material into the auger area. Visual observations of this
27
operation indicated that large amounts of material were not
present with the wider gate openings used in this study and
the augers appeared to handle the material in an adequate
manner. A check of Figure 13 indicates no excessive rough
ness between the "before" and "after" profiles of this study.
Small roughness does occur on both profiles but variation
in roughness was not detected.
The Paver and the Haul Truck
Engineers, inspectors and contractors have given much
thought to roughness caused by the haul truck jolting the
laydown machine. There are many reasons for these considera
tions:
(1) Small ridges are formed at the rear of the laydown
machine as the truck backs into the machine to unload.
(2) The front wheels of the truck are often turned at
an angle, as the paving machine pushes the truck, which
causes the paving machine operator to take corrective
measures.
(3) Material sluffs in large quantities from the truck
into the laydown machine hopper. (It was noted on this job
that a small ridge is also formed at the rear of the paving
machine when the sluffed material empties into the hopper.)
28
(4) Mud flaps hang at the rear of the haul truck and
these flaps are between the paver and the rear wheels of
the truck. When the paver begins to push the haul truck,
the mud flaps are forced vertically. It has been postulated
that the truck bumps the laydown machine as mud flaps roll
free and the small void caused by the thickness of the mud
flaps allows the truck to bump the machine. Various cor
rective measures have been initiated to cure these problems.
The mud flaps have been pinned up before unloading. Manu
facturers have incorporated an additional machine which
operates immediately prior to the laydown machine acting as
a buffer between the truck and the laydown machine. This
equipment, sometimes termed a "reloader", is in use in this
state.
The study conducted as shown in Figure 14 indicates
no significant roughness due to the build up on the contact
rollers. In fact, the profile after cleaning the rollers
seems to be rougher than the profile before cleaning. It
should be noted that these rollers operate on a spring-type
arrangement. This spring consists of a short length of pipe
which has been sawed longitudinally at the diameter as
shown in Figure 9. Visual observations of this attachment
29
reveal that it was working properly. The spring was
apparently absorbing the small variations or bumps which
occurred. The device appeared adequate for the equipment
which was used on this job.
The Paver Speed
The variation in laydown machine speed did reveal that
roughness can be associated with the paving machine speed
(see Figure 11). When the laydown machine was operated at
22.3 feet per minute the chart indicated only small variations
in profile. The roughness seems to increase as the speed
of a laydown machine increases. The profile at 70 feet per
minute indicates much more roughness than that at 22.3 feet
per minute. It is possible that a different roughness effect
would have been noted in this study if another mix design or
a different mix temperature had been used. However, the effect
of machine speed is present.
Visual observations of the surface reveal that the higher
speeds resulted in an open texture. It is believed that the
screed slightly pulled the hot asphaltic concrete as the
mat was placed. In comparison, the mat placed at 22.3 feet
per minute revealed a small close-textured surface in which
no pulling was apparent. It should be noted that the rough
ness in all four cases is minor and hardly noticeable when
driving over the freshly laid mat. The difference in rough-
30
ness is observed by the driver of the vehicle if he is
aware of the test section as he drives over it. Large move
ment of the vehicle body is not present and the roughness
appears only through vibration in the steering wheel and by
listening to the tire impact on the pavement surface.
Paver Pauses
Figure 12 does indicate significant roughness in the
area where the paver pauses for a change of haul trucks.
The empty truck has just completed unloading and moves away
to allow the next full truck to unload. After finding the
variation in the profile at this point, the unloading opera
tion was observed closely. It is postulated that the truck
initially unloaded a large amount of material into the paving
machine hopper and that the front of the paver settled under
this load. It is theorized further that the paver began
corrections for this variation when forward movement was
again initiated. In any event, the major profile variation
on the rural IH 20 job is present in this area.
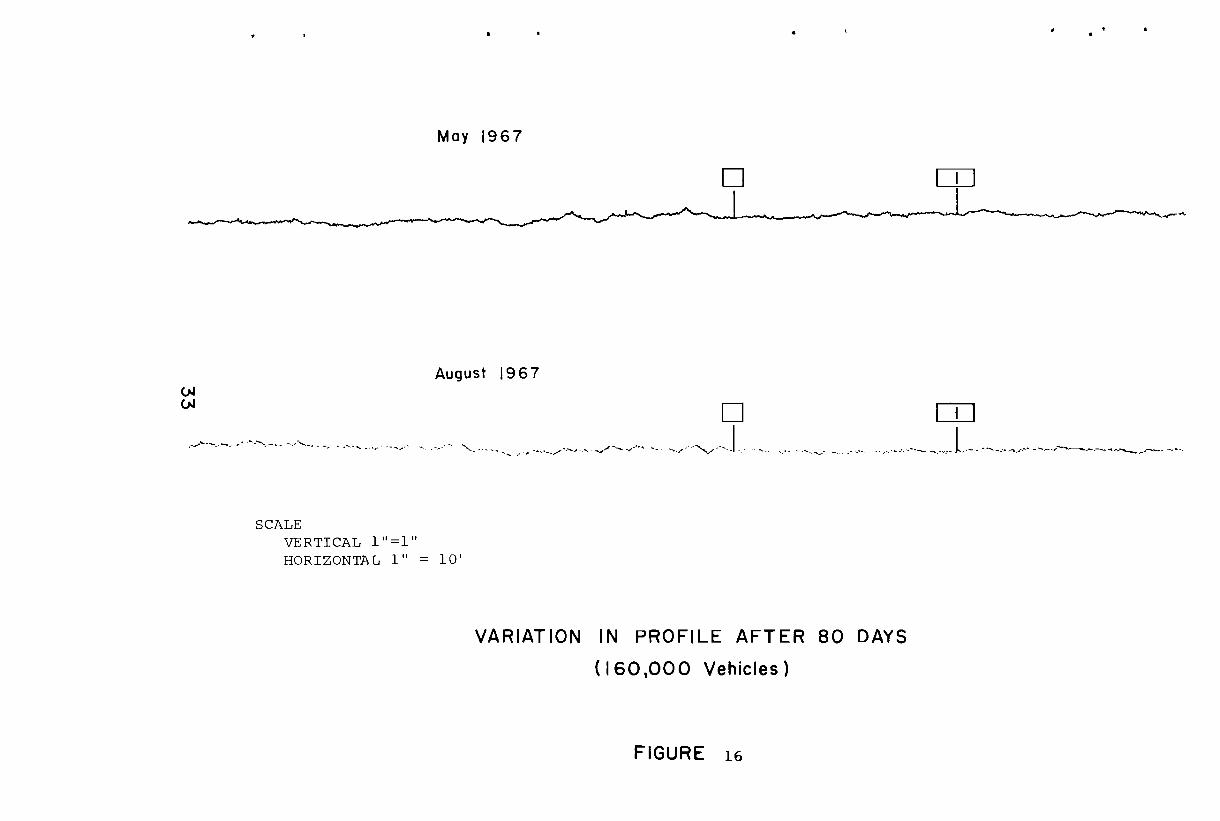
Three Months Later
In an effort to study the change in surface profile
with age, the entire section on IH 20 (I 20-2(71)225) was
31
•
rerun after a period of 80 days. Since traffic was allowed
on the completed pavement soon after the asphaltic material
was placed, it is estimated that 160,000 vehicle passages
accrued over this lane in this time span.
Comparisons of both profiles indicated that almost no
change had occurred during this period. Each test site was
easily located. The site at which paver speed tests were
conducted was noted on the chart without the aid of station
numbers as the profile was obtained. It did appear that certain
sharply defined small peaks were beginning to be flattened
by the traffic as indicated in Figure 15, but it must be
assumed that the profilograph was not pushed over exactly the
same path during the later testing.
This test does point out that periodic testing is
possible with the Rainhart profilograph. It would be
interesting to find the exact locations in which roughness
does occur as the pavement ages and also to determine which
areas occur first. The graphic chart would in itself con
stitute a permanent record.
Observations
Opportunity was present for study personnel to observe
the pavement surface as it was placed. One interesting
32
V' V'
May 1967
August 1967
D IT]
~-L __ ~ ____ ~~~J-~~--~~r-~----~~~~~--~~
o CD .. "" ... -.-- .,' ........... -... -""-- - .. ~- ... ,., --~... "'-. ". '. _, ~"'-"" ___ ~"~"'~ ./'- .~ ... , .,./ ........... / ... ..1 -.' .. ~. . "'., __ " ....... ".' ._~ .". __ .--,.L.- .. -.. -.~ ...... ' -----~-.~.-.~.~,. _____ ,--.. _0".
SCALE VERTICAL 1" =1" HORIZONTAL 1" = 10 '
VARIATION IN PROFILE AFTER 80 DAYS
(160,000 Vehicles)
FIGURE 16
fact occurred when riding the roller with the operator.
The roughness present in the roadway can be "felt" while
riding on the roller. Only the larger bumps or roughness
can be noted on the three wheel breakdown roller and the
major portion of the roughness noted while riding this
roller occurred at the areas in which the laydown machine
paused. These areas were easily discernable because of the
small square cardboard symbols nailed to the surface. Much
more roughness was noted while riding the pneumatic roller.
This roller appears to pick up almost every minor variation
in the pavement surface. The pavement surface was observed
while riding this roller in that variations in texture were
observed by light reflectance from the sun. This reflectance
revealed two interesting facts: (1) variations ~n texture are
easily seen and (2) these variations appear to be erratic.
Areas are found in which the surface appeared to be closed
textured and between these closed areas are sporadic areas
of open or pulled texture. An area was found in which
approximately two thirds of the width contained no fluctu
ations in texture. The remaining third of the pavement
revealed sporadic fluctuations in texture. The pneumatic
roller appeared to ride smoothly over the area in which
34
no fluctuations in texture were found, and rode much rougher
over the outer third in which texture variance was found.
There are two observations which can be developed from
these facts: (1) the contractor and inspector have
available one of the best construction control roughness
meters available and (2) these minor fluctuations in tex
ture must result from the laydown machine pulling the sur
face as it is placed. These pulled areas when compacted
by the pneumatic roller are lower in elevation than the
areas which are not pulled. This means that minor roughness
can be associated with fluctuations in texture due to
pulling from the screed. This is apparent from the vari
ation in laydown machine operating speed as previously
described. It must be noted that this roughness type is
minor and variations between upper and lower peaks found
by the profilograph are around 1/8 to 1/16 inch in depth.
It can be stated that the rural test section on IH 20
is one of the smoothest roadways which has been tested
since this research project began. This section was
selected because the eMI Autograde was used on the surface
of the base and it was felt the roughness reflected from
below would be at a minimum allowing confidence in the
35
• other studies reported herein. This postulation proved
to be true. The profile of the lower Type B surface was
very smooth. Electronic gadetry is helping the highway
industry but there is still room for improvement as pointed
out with the roughness associated with increased paver
machine speeds.
Review of Manufacturers Recommendations
In reviewing the Operation and Maintenance Manual of
paving machines, it was realized that many highway construc
tion personnel are not aware of the valuable information
contained in these publications. Therefore, it was decided
to review several items dealing with initial roughness and
suggested procedures to correct undesirable surface roughness:
(1) Some machines are equipped with cables to lift the
screed for roading purposes. During the paving operation
these cables must be detached or slack to insure that the
cables are not partially stressed in order that the screed
rests upon the mat being placed. Failure to do so could
result in a wavy mat.
(2) Pavers contain burners for heating the screed.
Care must be exercised in the use of this apparatus. Over
heating of the screed will warp the screed base plate and
36
• continued use results in an uneven surface. If the heated
screed is allowed to rest on the mat for prolonged periods
when the machine is not in motion, the screed tends to
settle causing a low area in the surface. If the screed
cools between truck changes, tearing of the surface may
result upon resumption of paving.
(3) Manufacturers suggest the material level be main
tained about the center of the augers. This is done in
order that the augers operate continuously. Sporadic opera
tion of the augers and fluctuation in material height (head)
result in an uneven mat. (Observations in this report indi-
cate the height may be above the center of the augers, but
constant elevation should be maintained.)
(4) The tamper near the screed is generally arranged
in two halves. The tamping cycle is arranged so that when
one is up the other is down. If these tampers are "out of
phase, the excessive vibration causes a loose wavy mat.
Manufacturers indicate that the tamper bar should have a
clean sharp beveled face of uniform dimension. If the bar
section has been worn out of shape, dragging of the mix
results.
37
•
•
(5) When tamper and screed extensions are used, mis
alignment of either will result in an open or rough mat
within the extension area.
(6) Braking of the tracks or wheels is sometimes used
for steering. Improper use of the brakes could affect the
surface finish.
(7) The paver should be moved forward to make contact
with the truck. If untimely truck movement occurs, ripples
will be ironed into the mat.
(8) Suggested air pressures for the tires of a paver
are generally given in the operations manual. If the paver
appears to bounce the pressure may be varied for correction.
Also, tire pressure should be equal on both sides of the
paver .
38
VIII. CONCLUSIONS
The following has been concluded from this study:
(1) Significant initial roughness was caused from excessive
laydown machine speeds (with the mix design, types of
rollers, rolling practice, asphalt temperature, and
paver used on this study).
(2) Significant initial roughness was caused by fluctua
tions in amounts of material present in the laydown
machine hoppe r •
(3) It can be postulated that initial roughness can be
caused by variations in surface texture because of
pulling of material by the screed.
(4) Significant roughness was not found on this job because
of parked rollers. It should be noted that the mat
depth was 1-1/4 inches. The parked roller effect at
greater mat thicknesses, different mix designs, and
asphalt temperatures is still unknown.
(5) Significant roughness was not found on this job be
cause of accumulated cakes on the contact rollers of
the laydown machine.
(6) significant roughness was not found on this job due to
excessive material being handled by the augers.
(7) Significant amounts of initial roughness are due to
roughness being reflected from below.
39

•
•
(8) The rollers themselves can be used to advantage to
detect roughness. An experienced inspector should
be able to detect excessive roughness by periodically
riding on the pneumatic roller •
40
BIBLIOGRAPHY
(l) Scrivner, F. H. and Moore, W. M., "A Tentative Flexible Pavement Design Formula and Its Research Background", Research Report 32-7, Research Study 2-8-62-32, Texas Transportation Institute, February 1966.
(2) Hankins, K. D., "Construction Control profilograph Principles ", Research Report 49-1, Research Study 1-8-63-49, Texas Highway Department, January 1967.
41