Embed Size (px)
Citation preview
Midwest States Regional Pooled Fund Research ProgramFiscal Year 2002-2003 (Year 13)
Research Project Number SPR-3(017)NDOR Sponsoring Agency Code RPFP-03-06
DEVELOPMENT AND EVALUATION OF
A TIE-DOWN SYSTEM FOR THE REDESIGNED
F-SHAPE CONCRETE TEMPORARY BARRIER
Submitted by
Karla A. Polivka, M.S.M.E., E.I.T.Research Associate Engineer
Ronald K. Faller, Ph.D., P.E.Research Assistant Professor
John R. Rohde, Ph.D., P.E.Associate Professor
James C. Holloway, M.S.C.E., E.I.T.Research Associate Engineer
Bob W. Bielenberg, M.S.M.E., E.I.T.Research Associate Engineer
Dean L. Sicking, Ph.D., P.E.Professor and MwRSF Director
MIDWEST ROADSIDE SAFETY FACILITYUniversity of Nebraska-Lincoln
527 Nebraska HallLincoln, Nebraska 68588-0529
(402) 472-6864
Submitted to
MIDWEST STATES REGIONAL POOLED FUND PROGRAMNebraska Department of Roads
1500 Nebraska Highway 2Lincoln, Nebraska 68502
MwRSF Research Report No. TRP-03-134-03
August 22, 2003

Technical Report Documentation Page1. Report No. 2. 3. Recipient’s Accession No.
RPFP-03-064. Title and Subtitle 5. Report Date
Development and Evaluation of a Tie-Down System forthe Redesigned F-Shape Concrete Temporary Barrier
August 22, 20036.
7. Author(s) 8. Performing Organization Report No.
Polivka, K.A., Faller, R.K., Rohde, J.R., Holloway, J.C.,Bielenberg, B.W., and Sicking, D.L.
TRP-03-134-03
9. Performing Organization Name and Address 10. Project/Task/Work Unit No.
Midwest Roadside Safety Facility (MwRSF)University of Nebraska-Lincoln527 Nebraska HallLincoln, NE 68588-0529
11. Contract © or Grant (G) No.
SPR-3(017)12. Sponsoring Organization Name and Address 13. Type of Report and Period Covered
Midwest States Regional Pooled Fund ProgramNebraska Department of Roads1500 Nebraska Highway 2Lincoln, Nebraska 68502
Final Report 2002-200314. Sponsoring Agency Code
RPFP-03-0615. Supplementary Notes
Prepared in cooperation with U.S. Department of Transportation, Federal Highway Administration16. Abstract (Limit: 200 words)
Often, temporary barriers are used in applications where it is desired that their deflection during vehicular impact belimited. One such application is in the installation of temporary barriers placed adjacent to the edge of a concrete bridge deck inorder to maximize lane width. Acceptable tie-down systems for temporary barriers have previously been developed, but there areconcerns when the barriers and tie-down systems are used on bridges that are reconstructed in stages and where very little tolerancein barrier deflection is allowable. Therefore, a rigid tie-down system was developed that minimizes barrier deflections. For thissystem, the original Kansas temporary barrier was redesigned in order to strengthen the barrier around the tie-down holes and tostandardize the barriers for use in adjacent states and in various temporary and tied-down configurations. The tie-down anchorsystem fastened the traffic-side of the barriers to the concrete bridge deck with three 29-mm (1.125-in.) diameter ASTM A307anchor bolts with heavy hex nuts and 76-mm (3-in.) x 76-mm (3-in.) x 13-mm (0.5-in.) thick washers.
The research study included one full-scale vehicle crash test, using a ¾-ton pickup truck. The full-scale test, with an impactspeed of 99.8 km/hr (62.0 mph) and an impact angle of 25.3 degrees, was conducted and reported in accordance with therequirements specified in the National Cooperative Highway Research Program (NCHRP) Report No. 350, RecommendedProcedures for the Safety Performance Evaluation of Highway Features. The safety performance of the tie-down anchor systemfor use with concrete bridge decks and the redesigned F-shape temporary concrete barrier was determined to be acceptableaccording to the Test Level 3 (TL-3) evaluation criteria specified in NCHRP Report No. 350.
17. Document Analysis/Descriptors 18. Availability Statement
Highway Safety, Temporary Barriers, Work Zones,Longitudinal Barriers, Concrete Barriers, Concrete BridgeDecks, Roadside Appurtenances, Crash Test, Compliance Test
No restrictions. Document available from:National Technical Information Services,Springfield, Virginia 22161
19. Security Class (this report) 20. Security Class (this page) 21. No. of Pages 22. Price
Unclassified Unclassified 97

ii
DISCLAIMER STATEMENT
The contents of this report reflect the views of the authors who are responsible for the facts
and the accuracy of the data presented herein. The contents do not necessarily reflect the official
views nor policies of the State Highway Departments participating in the Midwest States Regional
Pooled Fund Research Program nor the Federal Highway Administration. This report does not
constitute a standard, specification, or regulation.

iii
ACKNOWLEDGMENTS
The authors wish to acknowledge several sources that made a contribution to this project:
(1) the Midwest States Regional Pooled Fund Program funded by the Connecticut Department of
Transportation, Iowa Department of Transportation, Kansas Department of Transportation,
Minnesota Department of Transportation, Missouri Department of Transportation, Montana
Department of Transportation, Nebraska Department of Roads, Ohio Department of Transportation,
South Dakota Department of Transportation, Texas Department of Transportation, and Wisconsin
Department of Transportation for sponsoring this project; (2) the Kansas Department of
Transportation for supplying the barriers; and (3) MwRSF personnel for constructing the barrier and
conducting the crash test.
A special thanks is also given to the following individuals who made a contribution to the
completion of this research project.
Midwest Roadside Safety Facility
J.D. Reid, Ph.D., Associate ProfessorA.T. Russell, Laboratory Mechanic IIM.L. Hanau, Laboratory Mechanic IG.L. Schmutte, Laboratory Mechanic IUndergraduate and Graduate Assistants
Connecticut Department of Transportation
Dionysia Oliveira, Transportation Engineer 3
Iowa Department of Transportation
David Little, P.E., Assistant District EngineerWill Stein, P.E., Design Methods Engineer

iv
Kansas Department of Transportation
Ron Seitz, P.E., Assistant Bureau ChiefRod Lacy, P.E., Road Design Leader
Minnesota Department of Transportation
Jim Klessig, Implementation LiaisonMohammad Dehdashti, P.E., Design Standards EngineerRon Cassellius, Former Research Program CoordinatorAndrew Halverson, P.E., Former Assistant Design Standards Engineer
Missouri Department of Transportation
Daniel Smith, P.E., Research and Development Engineer
Montana Department of Transportation
Susan Sillick, Research Bureau Chief
Nebraska Department of Roads
Amy Starr, Research EngineerPhil Tenhulzen, P.E., Design Standards EngineerLeona Kolbet, former Research Coordinator
Ohio Department of Transportation
Monique Evans, P.E., AdministratorDean Focke, Standards Engineer
South Dakota Department of Transportation
David Huft, Research EngineerBernie Clocksin, Lead Project Engineer
Texas Department of Transportation
Mark Bloschock, P.E., Supervising Design EngineerMark Marek, P.E., Design Engineer

v
Wisconsin Department of Transportation
Peter Amakobe, Standards Development EngineerBeth Cannestra, P.E., Chief in Roadway Development
Federal Highway Administration
John Perry, P.E., Nebraska Division OfficeDanny Briggs, Nebraska Division Office
Dunlap Photography
James Dunlap, President and Owner
vi
TABLE OF CONTENTSPage
TECHNICAL REPORT DOCUMENTATION PAGE . . . . . . . . . . . . . . . . . . . . . . . . . . . . . . . . . i
DISCLAIMER STATEMENT . . . . . . . . . . . . . . . . . . . . . . . . . . . . . . . . . . . . . . . . . . . . . . . . . . ii
ACKNOWLEDGMENTS . . . . . . . . . . . . . . . . . . . . . . . . . . . . . . . . . . . . . . . . . . . . . . . . . . . . . . iii
TABLE OF CONTENTS . . . . . . . . . . . . . . . . . . . . . . . . . . . . . . . . . . . . . . . . . . . . . . . . . . . . . . . viList of Figures . . . . . . . . . . . . . . . . . . . . . . . . . . . . . . . . . . . . . . . . . . . . . . . . . . . . . . . . viiiList of Tables . . . . . . . . . . . . . . . . . . . . . . . . . . . . . . . . . . . . . . . . . . . . . . . . . . . . . . . . . . . x
1 INTRODUCTION . . . . . . . . . . . . . . . . . . . . . . . . . . . . . . . . . . . . . . . . . . . . . . . . . . . . . . . . . . . 11.1 Problem Statement . . . . . . . . . . . . . . . . . . . . . . . . . . . . . . . . . . . . . . . . . . . . . . . . . . . . 11.2 Objective . . . . . . . . . . . . . . . . . . . . . . . . . . . . . . . . . . . . . . . . . . . . . . . . . . . . . . . . . . . 11.3 Scope . . . . . . . . . . . . . . . . . . . . . . . . . . . . . . . . . . . . . . . . . . . . . . . . . . . . . . . . . . . . . . 2
2 LITERATURE REVIEW . . . . . . . . . . . . . . . . . . . . . . . . . . . . . . . . . . . . . . . . . . . . . . . . . . . . . . 32.1 Temporary Concrete Barriers . . . . . . . . . . . . . . . . . . . . . . . . . . . . . . . . . . . . . . . . . . . 32.2 Tie-Down Systems . . . . . . . . . . . . . . . . . . . . . . . . . . . . . . . . . . . . . . . . . . . . . . . . . . . . 3
3 TEST REQUIREMENTS AND EVALUATION CRITERIA . . . . . . . . . . . . . . . . . . . . . . . . . . 63.1 Test Requirements . . . . . . . . . . . . . . . . . . . . . . . . . . . . . . . . . . . . . . . . . . . . . . . . . . . . 63.2 Evaluation Criteria . . . . . . . . . . . . . . . . . . . . . . . . . . . . . . . . . . . . . . . . . . . . . . . . . . . . 7
4 DESIGN DETAILS . . . . . . . . . . . . . . . . . . . . . . . . . . . . . . . . . . . . . . . . . . . . . . . . . . . . . . . . . . 94.1 Desired Design Changes . . . . . . . . . . . . . . . . . . . . . . . . . . . . . . . . . . . . . . . . . . . . . . . 94.2 Design Details . . . . . . . . . . . . . . . . . . . . . . . . . . . . . . . . . . . . . . . . . . . . . . . . . . . . . . 10
5 TEST CONDITIONS . . . . . . . . . . . . . . . . . . . . . . . . . . . . . . . . . . . . . . . . . . . . . . . . . . . . . . . . 245.1 Test Facility . . . . . . . . . . . . . . . . . . . . . . . . . . . . . . . . . . . . . . . . . . . . . . . . . . . . . . . . 245.2 Vehicle Tow and Guidance System . . . . . . . . . . . . . . . . . . . . . . . . . . . . . . . . . . . . . . 245.3 Test Vehicles . . . . . . . . . . . . . . . . . . . . . . . . . . . . . . . . . . . . . . . . . . . . . . . . . . . . . . . 245.4 Data Acquisition Systems . . . . . . . . . . . . . . . . . . . . . . . . . . . . . . . . . . . . . . . . . . . . . 27
5.4.1 Accelerometers . . . . . . . . . . . . . . . . . . . . . . . . . . . . . . . . . . . . . . . . . . . . . . 275.4.2 Rate Transducers . . . . . . . . . . . . . . . . . . . . . . . . . . . . . . . . . . . . . . . . . . . . . 295.4.3 High-Speed Photography . . . . . . . . . . . . . . . . . . . . . . . . . . . . . . . . . . . . . . 295.4.4 Pressure Tape Switches . . . . . . . . . . . . . . . . . . . . . . . . . . . . . . . . . . . . . . . 30
6 CRASH TEST NO. 1 . . . . . . . . . . . . . . . . . . . . . . . . . . . . . . . . . . . . . . . . . . . . . . . . . . . . . . . . 326.1 Test KTB-1 . . . . . . . . . . . . . . . . . . . . . . . . . . . . . . . . . . . . . . . . . . . . . . . . . . . . . . . . 326.2 Test Description . . . . . . . . . . . . . . . . . . . . . . . . . . . . . . . . . . . . . . . . . . . . . . . . . . . . . 326.3 Barrier Damage . . . . . . . . . . . . . . . . . . . . . . . . . . . . . . . . . . . . . . . . . . . . . . . . . . . . . 33

vii
6.4 Vehicle Damage . . . . . . . . . . . . . . . . . . . . . . . . . . . . . . . . . . . . . . . . . . . . . . . . . . . . . 346.5 Occupant Risk Values . . . . . . . . . . . . . . . . . . . . . . . . . . . . . . . . . . . . . . . . . . . . . . . . 366.6 Discussion . . . . . . . . . . . . . . . . . . . . . . . . . . . . . . . . . . . . . . . . . . . . . . . . . . . . . . . . . 36
7 SUMMARY AND CONCLUSIONS . . . . . . . . . . . . . . . . . . . . . . . . . . . . . . . . . . . . . . . . . . . . 57
8 RECOMMENDATIONS . . . . . . . . . . . . . . . . . . . . . . . . . . . . . . . . . . . . . . . . . . . . . . . . . . . . . 59
9 REFERENCES . . . . . . . . . . . . . . . . . . . . . . . . . . . . . . . . . . . . . . . . . . . . . . . . . . . . . . . . . . . . . 63
10 APPENDICES . . . . . . . . . . . . . . . . . . . . . . . . . . . . . . . . . . . . . . . . . . . . . . . . . . . . . . . . . . . . 65APPENDIX A - System Drawings in English Units . . . . . . . . . . . . . . . . . . . . . . . . . . . . 66APPENDIX B - State Plans of the Redesigned Temporary Barrier Details . . . . . . . . . . 73APPENDIX C - Epoxy Specifications used with the Tie-Down Anchors . . . . . . . . . . . 76APPENDIX D - Test Summary Sheet in English Units, Test KTB-1 . . . . . . . . . . . . . . . 79APPENDIX E - Concrete Damage Sketches, Test KTB-1 . . . . . . . . . . . . . . . . . . . . . . . 81APPENDIX F - Occupant Compartment Deformation Data, Test KTB-1 . . . . . . . . . . . 86APPENDIX G - Accelerometer Data Analysis, Test KTB-1 . . . . . . . . . . . . . . . . . . . . . 88APPENDIX H - Roll and Yaw Data Analysis, Test KTB-1 . . . . . . . . . . . . . . . . . . . . . . 95

viii
List of FiguresPage
1. Temporary Barrier Details . . . . . . . . . . . . . . . . . . . . . . . . . . . . . . . . . . . . . . . . . . . . . . . . . . . . 132. Temporary Barrier Profile and Tie-Down Details . . . . . . . . . . . . . . . . . . . . . . . . . . . . . . . . . . 143. Temporary Barrier Connection and Lifting Slot Details . . . . . . . . . . . . . . . . . . . . . . . . . . . . . 154. Temporary Barrier Bill of Bars . . . . . . . . . . . . . . . . . . . . . . . . . . . . . . . . . . . . . . . . . . . . . . . . 165. Connection to Iowa Temporary Barrier Details . . . . . . . . . . . . . . . . . . . . . . . . . . . . . . . . . . . 176. Distances Between Temporary Barriers . . . . . . . . . . . . . . . . . . . . . . . . . . . . . . . . . . . . . . . . . 187. Barrier System . . . . . . . . . . . . . . . . . . . . . . . . . . . . . . . . . . . . . . . . . . . . . . . . . . . . . . . . . . . . . 198. Barrier System . . . . . . . . . . . . . . . . . . . . . . . . . . . . . . . . . . . . . . . . . . . . . . . . . . . . . . . . . . . . . 209. Barrier Connection Joints . . . . . . . . . . . . . . . . . . . . . . . . . . . . . . . . . . . . . . . . . . . . . . . . . . . . 2110. Barrier Tie-Down System . . . . . . . . . . . . . . . . . . . . . . . . . . . . . . . . . . . . . . . . . . . . . . . . . . . 2211. Barrier Tie-Down Installation . . . . . . . . . . . . . . . . . . . . . . . . . . . . . . . . . . . . . . . . . . . . . . . . 2312. Test Vehicle, Test KTB-1 . . . . . . . . . . . . . . . . . . . . . . . . . . . . . . . . . . . . . . . . . . . . . . . . . . . 2513. Vehicle Dimensions, Test KTB-1 . . . . . . . . . . . . . . . . . . . . . . . . . . . . . . . . . . . . . . . . . . . . . 2614. Vehicle Target Locations, Test KTB-1 . . . . . . . . . . . . . . . . . . . . . . . . . . . . . . . . . . . . . . . . . 2815. Location of High-Speed Cameras, Test KTB-1 . . . . . . . . . . . . . . . . . . . . . . . . . . . . . . . . . . . 3116. Summary of Test Results and Sequential Photographs, Test KTB-1 . . . . . . . . . . . . . . . . . . 3817. Additional Sequential Photographs, Test KTB-1 . . . . . . . . . . . . . . . . . . . . . . . . . . . . . . . . . 3918. Additional Sequential Photographs, Test KTB-1 . . . . . . . . . . . . . . . . . . . . . . . . . . . . . . . . . 4019. Additional Sequential Photographs, Test KTB-1 . . . . . . . . . . . . . . . . . . . . . . . . . . . . . . . . . 4120. Documentary Photographs, Test KTB-1 . . . . . . . . . . . . . . . . . . . . . . . . . . . . . . . . . . . . . . . . 4221. Documentary Photographs, Test KTB-1 . . . . . . . . . . . . . . . . . . . . . . . . . . . . . . . . . . . . . . . . 4322. Impact Location, Test KTB-1 . . . . . . . . . . . . . . . . . . . . . . . . . . . . . . . . . . . . . . . . . . . . . . . . 4423. Vehicle Final Position and Trajectory Marks, Test KTB-1 . . . . . . . . . . . . . . . . . . . . . . . . . . 4524. System Damage, Test KTB-1 . . . . . . . . . . . . . . . . . . . . . . . . . . . . . . . . . . . . . . . . . . . . . . . . 4625. System Damage, Test KTB-1 . . . . . . . . . . . . . . . . . . . . . . . . . . . . . . . . . . . . . . . . . . . . . . . . 4726. Barrier Nos. 8 and 9 Damage, Test KTB-1 . . . . . . . . . . . . . . . . . . . . . . . . . . . . . . . . . . . . . . 4827. Barrier Nos. 8 and 9 Concrete Damage , Test KTB-1 . . . . . . . . . . . . . . . . . . . . . . . . . . . . . . 4928. Barrier No. 8 Tie-Down Anchor Damage, Test KTB-1 . . . . . . . . . . . . . . . . . . . . . . . . . . . . 5029. Barrier No. 9 Tie-Down Anchor Damage, Test KTB-1 . . . . . . . . . . . . . . . . . . . . . . . . . . . . 5130. Vehicle Damage, Test KTB-1 . . . . . . . . . . . . . . . . . . . . . . . . . . . . . . . . . . . . . . . . . . . . . . . . 5231. Vehicle Damage, Test KTB-1 . . . . . . . . . . . . . . . . . . . . . . . . . . . . . . . . . . . . . . . . . . . . . . . . 5332. Right-Side Tire Damage, Test KTB-1 . . . . . . . . . . . . . . . . . . . . . . . . . . . . . . . . . . . . . . . . . . 5433. Vehicle Undercarriage Damage, Test KTB-1 . . . . . . . . . . . . . . . . . . . . . . . . . . . . . . . . . . . . 5534. Occupant Compartment Damage, Test KTB-1 . . . . . . . . . . . . . . . . . . . . . . . . . . . . . . . . . . . 5635. Treatment at Bridge Deck Thermal Expansion Joints . . . . . . . . . . . . . . . . . . . . . . . . . . . . . . 6136. Staked Down Installation into an Asphalt Road Surface (Transitioning to
Free-Standing Sections at the End of a Bridge) . . . . . . . . . . . . . . . . . . . . . . . . . . . . . . . . 62A-1. Temporary Barrier Details (English) . . . . . . . . . . . . . . . . . . . . . . . . . . . . . . . . . . . . . . . . . . 67A-2. Temporary Barrier Profile and Tie-Down Details (English) . . . . . . . . . . . . . . . . . . . . . . . . 68A-3. Temporary Barrier Connection and Lifting Slot Details (English) . . . . . . . . . . . . . . . . . . . 69A-4. Temporary Barrier Bill of Bars (English) . . . . . . . . . . . . . . . . . . . . . . . . . . . . . . . . . . . . . . 70

ix
A-5. Connection to Iowa Temporary Barrier Details (English) . . . . . . . . . . . . . . . . . . . . . . . . . 71A-6. Distances Between Temporary Barriers (English) . . . . . . . . . . . . . . . . . . . . . . . . . . . . . . . 72B-1. Kansas State Plans (Metric) . . . . . . . . . . . . . . . . . . . . . . . . . . . . . . . . . . . . . . . . . . . . . . . . . 74B-2. Kansas State Plans (English) . . . . . . . . . . . . . . . . . . . . . . . . . . . . . . . . . . . . . . . . . . . . . . . . 75C-1. Type of Epoxy . . . . . . . . . . . . . . . . . . . . . . . . . . . . . . . . . . . . . . . . . . . . . . . . . . . . . . . . . . . 77C-2. Epoxy Specifications . . . . . . . . . . . . . . . . . . . . . . . . . . . . . . . . . . . . . . . . . . . . . . . . . . . . . . 78D-1. Summary of Test Results and Sequential Photographs (English), Test KTB-1 . . . . . . . . . 80E-1. Concrete Damage – Front Face Barrier No. 8, Test KTB-1 . . . . . . . . . . . . . . . . . . . . . . . . 82E-2. Concrete Damage – Back Face Barrier No. 8, Test KTB-1 . . . . . . . . . . . . . . . . . . . . . . . . . 83E-3. Concrete Damage – Front Face Barrier No. 9, Test KTB-1 . . . . . . . . . . . . . . . . . . . . . . . . 84E-4. Concrete Damage – Back Face Barrier No. 9, Test KTB-1 . . . . . . . . . . . . . . . . . . . . . . . . . 85F-1. Occupant Compartment Deformation Data, Test KTB-1 . . . . . . . . . . . . . . . . . . . . . . . . . . 87G-1. Graph of Longitudinal Deceleration Test KTB-1 . . . . . . . . . . . . . . . . . . . . . . . . . . . . . . . . 89G-2. Graph of Longitudinal Occupant Impact Velocity, Test KTB-1 . . . . . . . . . . . . . . . . . . . . . 90G-3. Graph of Longitudinal Occupant Displacement, Test KTB-1 . . . . . . . . . . . . . . . . . . . . . . . 91G-4. Graph of Lateral Deceleration, Test KTB-1 . . . . . . . . . . . . . . . . . . . . . . . . . . . . . . . . . . . . 92G-5. Graph of Lateral Occupant Impact Velocity, Test KTB-1 . . . . . . . . . . . . . . . . . . . . . . . . . 93G-6. Graph of Lateral Occupant Displacement, Test KTB-1 . . . . . . . . . . . . . . . . . . . . . . . . . . . 94H-1. Graph of Roll Angular Displacements, Test KTB-1 . . . . . . . . . . . . . . . . . . . . . . . . . . . . . . 96H-2. Graph of Yaw Angular Displacements, Test KTB-1 . . . . . . . . . . . . . . . . . . . . . . . . . . . . . . 97

x
List of TablesPage
1. NCHRP Report No. 350 Test Level 3 Crash Test Conditions . . . . . . . . . . . . . . . . . . . . . . . . . . 72. NCHRP Report No. 350 Evaluation Criteria for Crash Tests . . . . . . . . . . . . . . . . . . . . . . . . . . 83. Summary of Safety Performance Evaluation Results . . . . . . . . . . . . . . . . . . . . . . . . . . . . . . . 58
1
1 INTRODUCTION
1.1 Problem Statement
Roadway construction or work zones are found along almost all Federal, State, and local
highways in the United States. In most cases, these roadways often require the redirection of
vehicular traffic around or through the construction zone. Typically, some form of temporary barrier
is used to separate the flow of traffic within the construction area. In general, temporary barriers are
segmented units which are attached end-to-end by a load bearing connection. The segmentation of
the barriers allows them to be easily installed, repositioned, and removed from the work-zone area.
The barrier system is designed to protect equipment and workers in the work zone, to prevent errant
vehicles from leaving the traveled way, and to safely redirect those vehicles impacting the barrier.
Often, temporary barriers are used in applications where it is desired that their deflection
during vehicular impact be limited. One such application is the installation of temporary barriers
placed adjacent to the edge of a bridge deck in order to provide adequate lane width. However,
freestanding barrier installations placed close to the deck edge pose a major safety hazard to errant
vehicles as there is a significant risk for the barrier segments to be propelled off of the bridge. Thus,
large dynamic deflections, in conjunction with narrow gaps behind the barriers, may prove sufficient
to push the barriers off of the deck along with the impacting vehicle.
1.2 Objective
The objective of the research project was to redesign and standardize the F-shape concrete
barrier previously developed for the Midwest States Regional Pooled Fund Program and develop
and evaluate a tie-down system for use with these barriers on concrete bridge decks where
deflections are restricted. The tie-down temporary barrier was to be evaluated according to the Test
2
Level 3 (TL-3) safety performance criteria set forth in the National Cooperative Highway Research
Program (NCHRP) Report No. 350, Recommended Procedures for the Safety Performance
Evaluation of Highway Features (1).
1.3 Scope
The research objective was achieved by performing several tasks. First, a literature review
was performed on previously crash tested tie-down systems. Next, a design phase was conducted
to redesign and standardize the existing F-shape barrier and to develop a rigid tie-down system for
use on concrete bridge decks that minimizes barrier deflections. After the final design and
fabrication of the system, a full-scale vehicle crash test was performed, using a ¾-ton pickup truck
weighing approximately 2,000 kg (4,409 lbs), with a target impact speed and angle of 100.0 km/hr
(62.1 mph) and 25 degrees, respectively. Finally, the test results were analyzed, evaluated, and
documented. Conclusions and recommendations were then made that pertain to the safety
performance of the tie-down system for temporary barriers on concrete bridge decks.
3
2 LITERATURE REVIEW
2.1 Temporary Concrete Barriers
Temporary concrete barriers are a common safety device used in work zone and construction
areas throughout the country. Currently, there are many temporary concrete barrier designs in use,
but these designs vary widely in terms of steel reinforcement, joint connection, and segment length.
The most common barriers in use are the New Jersey safety shape and the more recently developed
F-shape and single-slope barriers. Currently, most of the Midwest states employ the NCHRP Report
No. 350 compliant F-shape temporary concrete barrier developed by the Midwest Roadside Safety
Facility (MwRSF) (2-3).
2.2 Tie-Down Systems
In 1993, the Texas Transportation Institute (TTI) developed and tested a tie-down system
for portable concrete barriers that was compliant with the NCHRP Report No. 350 safety criteria for
longitudinal barriers (4). The TTI system consisted of 9.1-m (30-ft) long barrier segments that were
constrained by a set of four 31.8-mm (1.25-in.) diameter by 521-mm (20.5-in.) long steel pins that
passed through 35-mm (1.375-in.) diameter holes drilled into the front of the barrier and into the
concrete slab to a depth of 127 mm (5 in.). The holes were drilled at an angle of 40.1 degrees in
order to maximize the constraint on the barrier while keeping the depth of the pins to a minimum.
The maximum permanent set and dynamic deflections measured during the test of the system were
found to be 200 mm(7.875 in.) and 400 mm (15.75 in.), respectively.
In 1999, the California Department of Transportation (CALTRANS) successfully developed
and tested a K-rail system according to the NCHRP Report No. 350 evaluation criteria (5). The
K-rail system consisted of 6.1-m (20-ft) long segments of New Jersey safety shape barrier connected
4
by a pin and loop connection. Each barrier was constrained by a set of four 25-mm (1-in.) diameter
by 610-mm (24-in.) long steel stakes that were driven into the asphalt road surface to a depth of 420
mm (16.5 in.) through cast holes near the corners of the barrier. The system limited the permanent
set and dynamic deflections to 70 mm (2.75 in.) and 254 mm (10 in.), respectively.
In 2001, MwRSF developed a double tie-down system for use with temporary barriers and
successfully tested the system according to the NCHRP Report No. 350 evaluation criteria (6-7).
The tie-down system consisted of 3.81-m (12.5-ft) long segments of Iowa F-shape barriers
connected by a pin and loop connection and double steel straps to constrain the motion of the barrier
joints. The steel strap consisted of a 76-mm (3-in.) wide x 6.4-mm (0.25-in.) thick x 914-mm (36-in.)
long piece of ASTM A36 steel that was bent at four points along the strap to form a trapezoidal
shape. A 22-mm (0.875-in.) diameter hole, punched 51 mm (2 in.) from each end of the plate, was
used to accommodate the two Red Head 19-mm (0.75-in.) diameter drop-in anchors and the 19-mm
(0.75-in.) diameter x 57-mm (2.25-in.) long ISO Class 8.8 bolts which constrained the strap. In
addition, 76-mm (3-in.) wide x 6.4-mm (0.25-in.) thick x 83-mm (3.25-in.) long steel plates with
identically sized holes were welded to the strap at the hole locations in order to reinforce the strap.
A third 35-mm (1.375-in.) diameter hole was also punched in the center of the strap to accommodate
the vertical pin used to connect the barrier segments. The center hole in the plate was reinforced by
a 76-mm (3-in.) wide x 12.7-mm (0.5-in.) thick x 83-mm (3.25-in.) long ASTM A36 steel plate. The
maximum permanent set and dynamic deflections measured during the test of the double tie-down
system were found to be 850 mm (33.5 in.) and 960 mm (37.75 in.), respectively.
In 2002, MwRSF developed a tie-down system for rigidly attaching steel H-section
temporary barriers to a concrete bridge deck. The system was successfully tested according to the
5
NCHRP Report No. 350 evaluation criteria (6-7). The tie-down system consisted of 6.1-m (20-ft)
long segments of Iowa H-section temporary barriers connected by two drop pins and two steel shear
plates to allow 4.0 and 2.4 degrees of rotation about the transverse and vertical axes, respectively
(6). The original Iowa H-section barrier rails were also retrofitted with a series of steel angle
brackets that were used as tie-downs to constrain the barrier motion. Four 102-mm x 152-mm x
12.7-mm (4-in. x 6-in. x 0.5-in.) thick by 152-mm (6-in.) long ASTM A36 steel angle brackets were
welded to the base of each side of the steel barrier and placed at 381 mm (15 in.) and 762 mm (30
in.) from each end. The base of each angle bracket was drilled with a 32-mm (1.25-in.) diameter
hole. The brackets were fastened to the concrete bridge deck using 19-mm (0.75-in.) Red Head drop-
in anchors with 19-mm (0.75-in.) diameter by 57-mm (2.25-in.) long ASTM A307 bolts and using
64-mm (2.5-in.) wide x 64-mm (2.5-in.) long x 4.8-mm (0.1875-in.) thick steel plate washers. The
maximum permanent set and dynamic deflections measured during the test of the H-section barrier
tie-down system were found to be 241 mm (9.5 in.) and 314 mm (12.4 in.), respectively.
6
3 TEST REQUIREMENTS AND EVALUATION CRITERIA
3.1 Test Requirements
Longitudinal barriers, such as temporary concrete barriers, must satisfy the requirements
provided in NCHRP Report No. 350 to be accepted for use on National Highway System (NHS)
construction projects or as a replacement for existing systems not meeting current safety standards.
According to TL-3 of NCHRP Report No. 350, the longitudinal barriers must be subjected to two
full-scale vehicle crash tests. The two crash tests are as follows:
1. Test Designation 3-10. An 820-kg (1,808-lb) small car impacting the bridgerail system at a nominal speed and angle of 100.0 km/hr (62.1 mph) and 20degrees, respectively.
2. Test Designation 3-11. A 2,000-kg (4,409-lb) pickup truck impacting thebridge rail system at a nominal speed and angle of 100.0 km/hr (62.1 mph)and 25 degrees, respectively.
However, vertical shaped barriers are safer than safety shaped barriers which have also
shown acceptable safety performance. For example, a rigid, F-shape bridge rail impacted by a small
car was successfully tested to current safety performance standards (8). In the same manner, rigid
New Jersey safety shape barriers struck by small cars have also been shown to meet safety
performance standards (9-10). Furthermore, temporary New Jersey safety shape concrete median
barriers have encountered only slight barrier deflections when impacted by small cars (11). Thus,
since impacts with vertical barriers are less severe than those with safety shapes which typically
result in an increased propensity for vehicle climbing, the 820-kg (1,808-lb) small car test was
deemed unnecessary for this project. The test conditions for TL-3 longitudinal barriers are
summarized in Table 1.

7
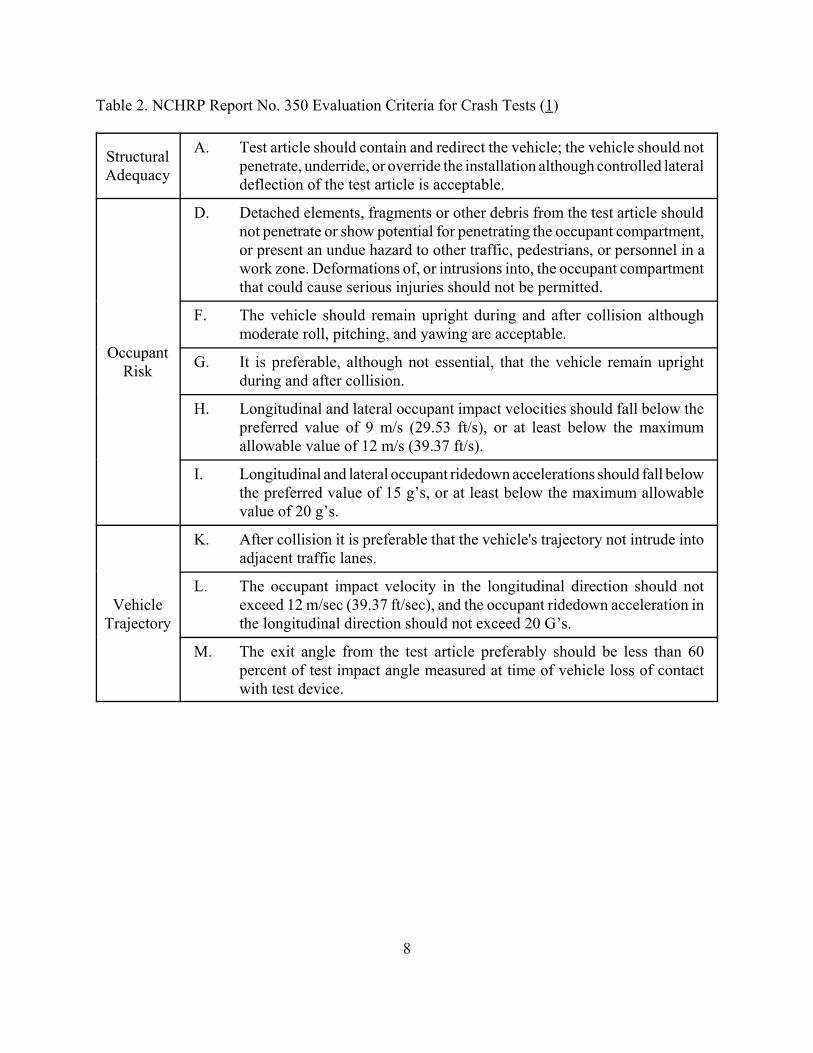
3.2 Evaluation Criteria
Evaluation criteria for full-scale vehicle crash testing are based on three appraisal areas: (1)
structural adequacy; (2) occupant risk; and (3) vehicle trajectory after collision. Criteria for
structural adequacy are intended to evaluate the ability of the barrier to contain, redirect, or allow
controlled vehicle penetration in a predictable manner. Occupant risk evaluates the degree of hazard
to occupants in the impacting vehicle. Vehicle trajectory after collision is a measure of the potential
for the post-impact trajectory of the vehicle to cause subsequent multi-vehicle accidents. This
criterion also indicates the potential safety hazard for the occupants of other vehicles or the
occupants of the impacting vehicle when subjected to secondary collisions with other fixed objects.
These three evaluation criteria are defined in Table 2. The full-scale vehicle crash test was
conducted and reported in accordance with the procedures provided in NCHRP Report No. 350.
Table 1. NCHRP Report No. 350 Test Level 3 Crash Test Conditions
TestArticle
TestDesignation
TestVehicle
Impact ConditionsEvaluationCriteria 1Speed Angle
(degrees)(km/hr) (mph)
LongitudinalBarrier
3-10 820C 100 62.1 20 A,D,F,H,I,K,M
3-11 2000P 100 62.1 25 A,D,F,K,L,M
1 Evaluation criteria explained in Table 2.
8
Table 2. NCHRP Report No. 350 Evaluation Criteria for Crash Tests (1)
StructuralAdequacy
A. Test article should contain and redirect the vehicle; the vehicle should notpenetrate, underride, or override the installation although controlled lateraldeflection of the test article is acceptable.
OccupantRisk
D. Detached elements, fragments or other debris from the test article shouldnot penetrate or show potential for penetrating the occupant compartment,or present an undue hazard to other traffic, pedestrians, or personnel in awork zone. Deformations of, or intrusions into, the occupant compartmentthat could cause serious injuries should not be permitted.
F. The vehicle should remain upright during and after collision althoughmoderate roll, pitching, and yawing are acceptable.
G. It is preferable, although not essential, that the vehicle remain uprightduring and after collision.
H. Longitudinal and lateral occupant impact velocities should fall below thepreferred value of 9 m/s (29.53 ft/s), or at least below the maximumallowable value of 12 m/s (39.37 ft/s).
I. Longitudinal and lateral occupant ridedown accelerations should fall belowthe preferred value of 15 g’s, or at least below the maximum allowablevalue of 20 g’s.
VehicleTrajectory
K. After collision it is preferable that the vehicle's trajectory not intrude intoadjacent traffic lanes.
L. The occupant impact velocity in the longitudinal direction should notexceed 12 m/sec (39.37 ft/sec), and the occupant ridedown acceleration inthe longitudinal direction should not exceed 20 G’s.
M. The exit angle from the test article preferably should be less than 60percent of test impact angle measured at time of vehicle loss of contactwith test device.
9
4 DESIGN DETAILS
4.1 Desired Design Changes
The bridge division of the Kansas Department of Transportation (KsDOT) desired to develop
a more positive connection on concrete bridge decks as compared to the strap design previously
developed for the Iowa Barrier as part of the Pooled Fund efforts (6). This need existed primarily
for bridges that were reconstructed in stages and where very little tolerance in barrier deflection was
allowable. In addition, it was desired to develop one barrier that could be used in adjacent states and
in the various temporary and tied-down configurations (i.e., deformable tie-down strap at the joints
and the bolt-through detail). Consequently, the redesign of the original temporary barrier developed
by MwRSF was to include important features from the Kansas, Iowa, Nebraska, and Missouri DOT
standard plans and the previously-approved Oregon temporary barrier, as well as incorporate a bolt-
through tie-down option.
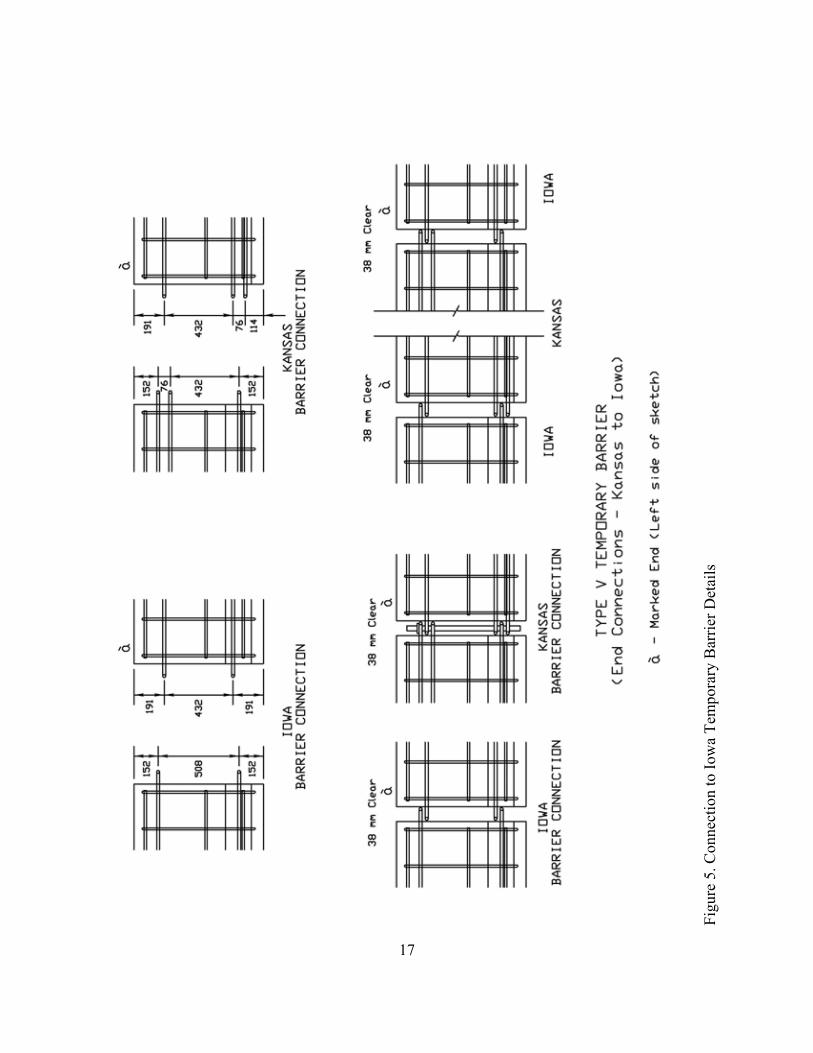
One modification to the temporary barrier was the redesign of the barrier-to-barrier
connection. Modifying this connection to resemble the three loop connection detail found in the
Oregon design provides double shear at two locations on each pin and consequently allows for the
elimination of the retainer bolt at the bottom of the vertical pin. This modification required
adjustment of the loop spacing to allow for the connection of the new barrier with the original
temporary barriers constructed with either the single loop bars or those with three bars per loop. The
modified barrier that resulted is compatible with both ends of the Iowa barrier constructed with
single bar loops and one end of these barriers constructed with triple bars per loop.
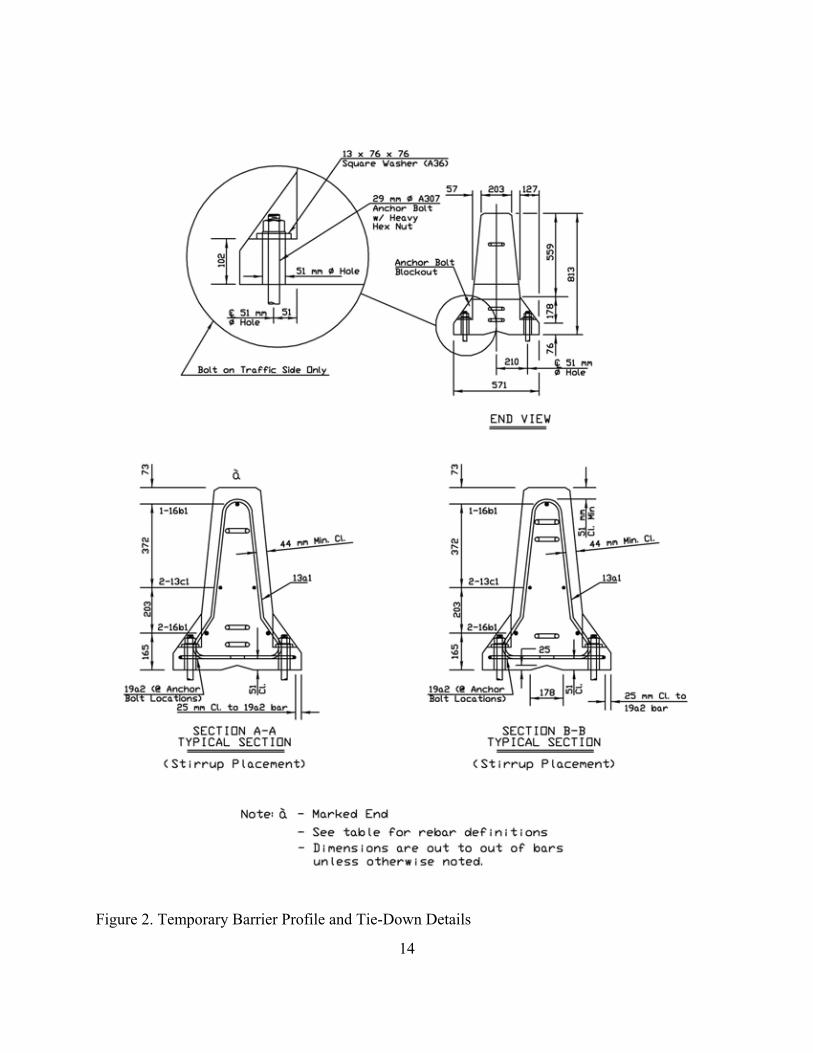
In order to develop a tie-down system that utilizes a bolt-through detail, vertical holes would
need to be positioned on both sides of the barrier in order to allow bolts to penetrate the barrier and

10
allow its attachment to the rigid concrete pavement. Three vertical holes were added on each side
of the KsDOT barrier detail. Steel reinforcement was required to provide sufficient reaction to the
retainer bolts. In addition, it was necessary to shift the lower longitudinal bars inward to
accommodate for the addition of the vertical holes. This inward shift will slightly reduced the
barrier’s moment capacity about the vertical axis, but not significantly to compromise the barrier’s
performance.
Finally, it was recommended that the through bolts be placed on only the traffic-side face
of the barrier. This would allow the barrier to be placed closer to the deck edge. In addition, bolts
placed on the back side of the barrier could potentially degrade performance, causing the barrier to
rotate about this connection and increase barrier rotation. This action could increase the propensity
for impacting vehicles to climb the barrier face and vault over the top. If bolts were used on only the
front face and exhibited a tendency to shear, the barriers would likely only translate backward with
reduced barrier roll.
4.2 Design Details
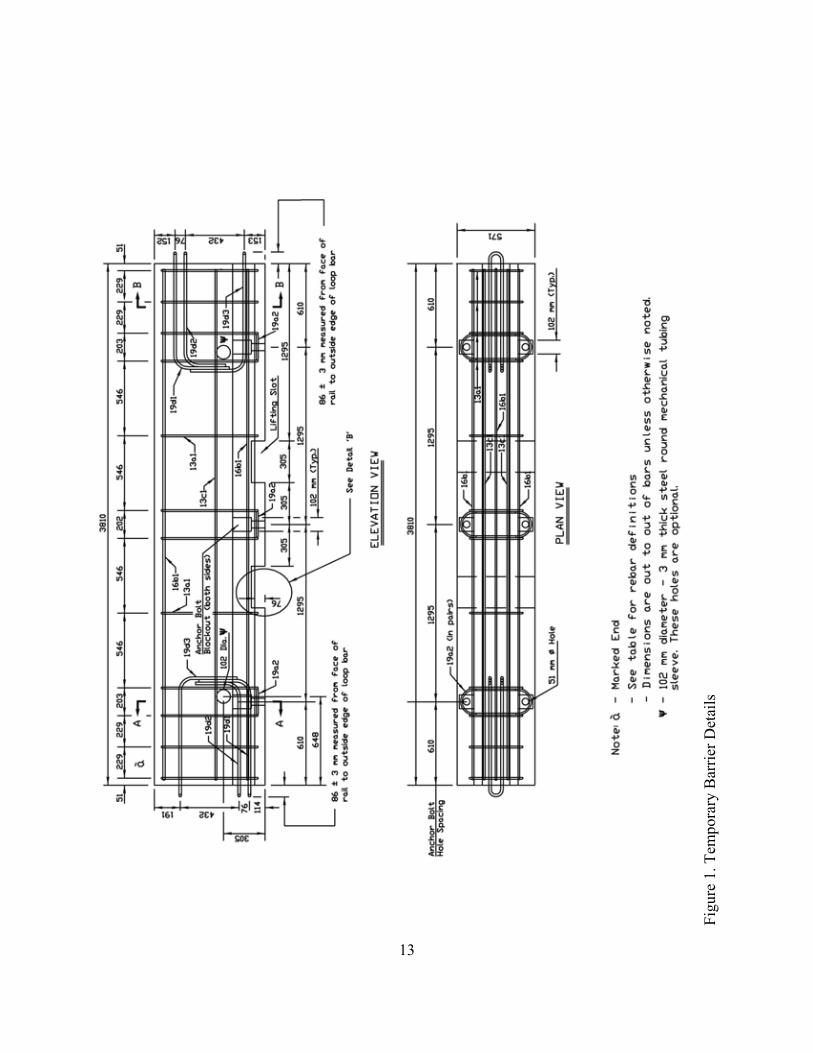
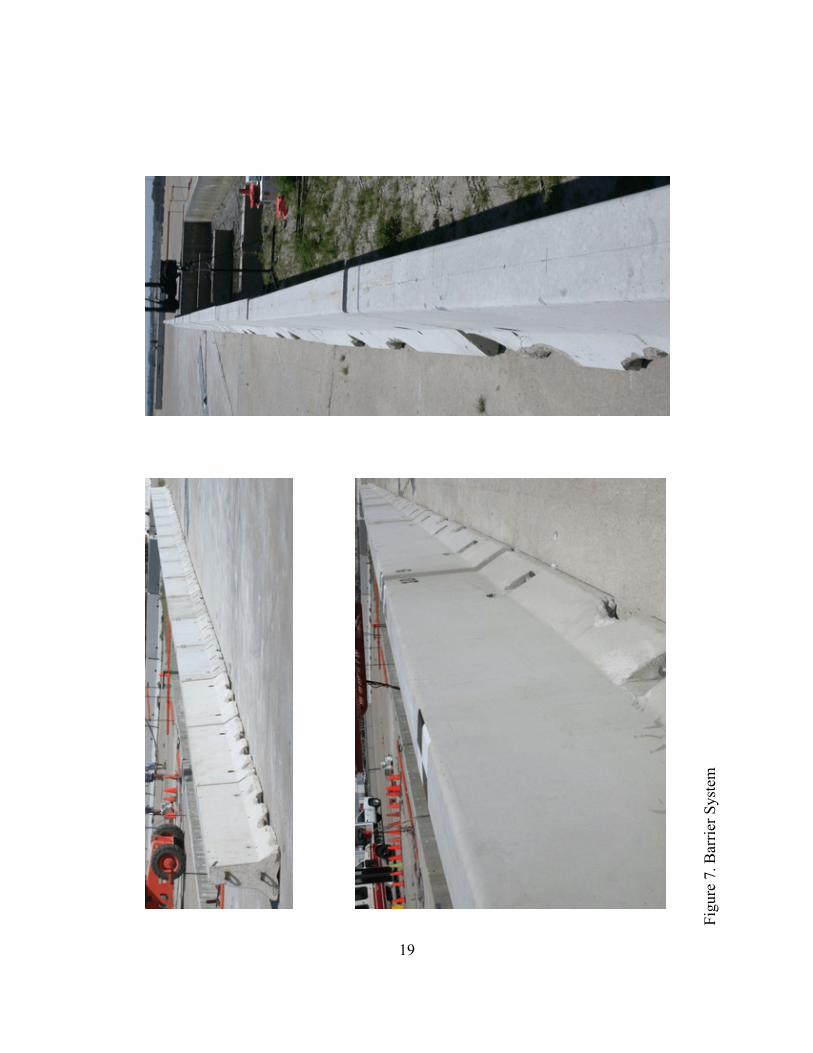
The test installation consisted of 62.23 m (204 ft) of temporary concrete barriers attached
to a concrete bridge deck, as shown in Figures 1 through 6. The corresponding drawings in English
units are shown in Appendix A. The KDOT’s state plans are shown in Appendix B. Photographs of
the test installation are shown in Figures 7 through 11.
The concrete used for the barriers consisted of Iowa’s Barrier Mix, with a minimum 28-day
concrete compressive strength of 34.5 MPa (5,000 psi). The actual 28-day concrete compressive
strength for the barriers, as determined from concrete cylinder testing, was found to be
approximately 31.2 MPa (4,521 psi). A minimum concrete cover varied at different positions of
11
rebar in the barrier. A minimum concrete cover of 51 mm (2 in.) was used along the top of the
vertical stirrup rebar and the bottom longitudinal rebar. Minimum concrete covers of 44 mm (1.75
in.) and 25 mm (1 in.) were used along the sides of the vertical stirrup rebar and at the rebar around
the anchor bolt block, respectively. All of the steel reinforcement in the barrier was ASTM A615
Grade 60 rebar, except for the loop bars which were ASTM A706 Grade 60 rebar. The barrier
reinforcement details are shown in Figures 1 through 4.
Barrier reinforcement consisted of three No. 5 and two No. 4 longitudinal bars, twelve No.
4 bars for the vertical stirrups, and six No. 6 bars for the anchor bolt block reinforcement loops. Each
of the five longitudinal rebar was 3.71-m (12-ft 2-in.) long. The vertical spacings of the lower,
middle, and upper longitudinal bars were 165 mm (6.5 in.), 368 mm (14.5 in.), and 780 mm (29.125
in.) from the ground to their centers, respectively. The vertical stirrups were 1,829-mm (72-in.) long
and were bent into the shape of the barrier. Their spacings varied longitudinally, as shown in Figure
1. The anchor bolt block loops were 889-mm (35-in.) long and were bent into a U-shape and were
used to reinforce the anchor bolt area, as shown in Figures 1 and 4.
The barriers used a pin and loop type connection comprised of two sets of rebar loops on
each barrier interconnection. Each loop assembly was configured with three ASTM A706 Grade 60
No. 6 bars that were bent into a loop shape, as shown in Figure 4. The vertical pin used in the
connection consisted of a 32-mm (1.25-in.) diameter x 711-mm (28-in.) long round bar composed
of ASTM A36 steel, as shown in Figure 3. The pin was held in place using one 64-mm (2.5-in.) wide
x 102-mm (4-in.) long x 13-mm (0.5-in.) thick ASTM A36 steel plate with a 35-mm (1.375-in.)
diameter hole center on it. The plate was welded 64 mm (2.5 in.) below the top of the pin.
The barriers were fastened to the concrete bridge deck with a 29-mm (1.125-in.) diameter

12
ASTM A307 anchor bolt with heavy hex nut and a 76-mm (3-in.) x 76-mm (3-in.) x 13-mm (0.5-in.)
thick washer at each of the anchor bolt blockout positions, as shown in Figures 2 and 10. Each
anchor bolt was epoxied into the concrete to an embedment depth of approximately 305 mm (12 in.),
as shown in Figure 11. The epoxy’s specifications are shown in Appendix C. Note that the bolt-
through tie-down system was only used on the traffic side of the barrier in order to reduce the
propensity for barrier tipping and subsequent vehicle climbing and vaulting.
13
Figu
re 1
. Tem
pora
ry B
arrie
r Det
ails
14
Figure 2. Temporary Barrier Profile and Tie-Down Details

15
Figu
re 3
. Tem
pora
ry B
arrie
r Con
nect
ion
and
Lifti
ng S
lot D
etai
ls

16
Figure 4. Temporary Barrier Bill of Bars
17
Figu
re 5
. Con
nect
ion
to Io
wa
Tem
pora
ry B
arrie
r Det
ails

18
Figu
re 6
. Dis
tanc
es B
etw
een
Tem
pora
ry B
arrie
rs
19
Figu
re 7
. Bar
rier S
yste
m
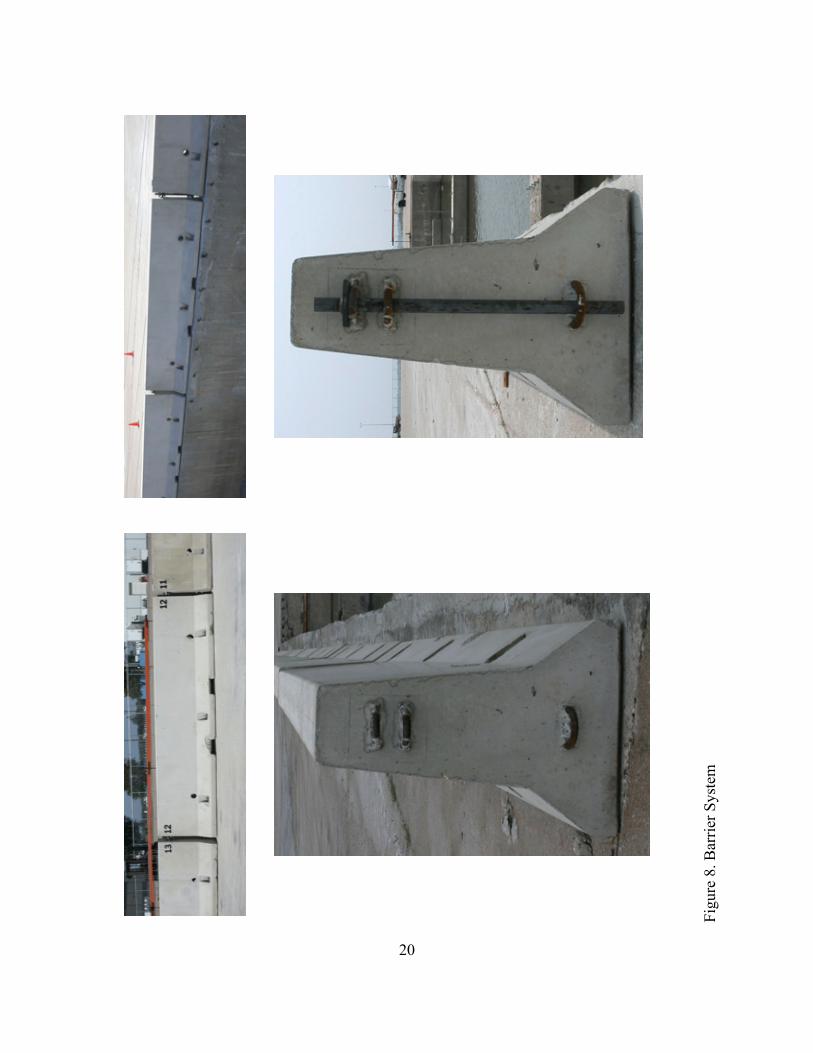
20
Figu
re 8
. Bar
rier S
yste
m

21
Figure 9. Barrier Connection Joints

22
Figure 10. Barrier Tie-Down System

23
Figu
re 1
1. B
arrie
r Tie
-Dow
n In
stal
latio
n
24
5 TEST CONDITIONS
5.1 Test Facility
The testing facility is located at the Lincoln Air-Park on the northwest (NW) side of the
Lincoln Municipal Airport and is approximately 8.0 km (5 mi.) NW of the University of Nebraska-
Lincoln.
5.2 Vehicle Tow and Guidance System
A reverse cable tow system with a 1:2 mechanical advantage was used to propel the test
vehicle. The distance traveled and the speed of the tow vehicle were one-half that of the test vehicle.
The test vehicle was released from the tow cable before impact with the guardrail system. A digital
speedometer was located on the tow vehicle to increase the accuracy of the test vehicle impact
speed.
A vehicle guidance system developed by Hinch (13) was used to steer the test vehicle. A
guide-flag, attached to the front-right wheel and the guide cable, was sheared off before impact with
the guardrail system. The 9.5-mm (0.375-in.) diameter guide cable was tensioned to approximately
15.6 kN (3,500 lbf), and supported laterally and vertically every 30.48 m (100 ft) by hinged
stanchions. The hinged stanchions stood upright while holding up the guide cable, but as the vehicle
was towed down the line, the guide-flag struck and knocked each stanchion to the ground. For test
KTB-1, the vehicle guidance system was approximately 305-m (1000-ft) long.
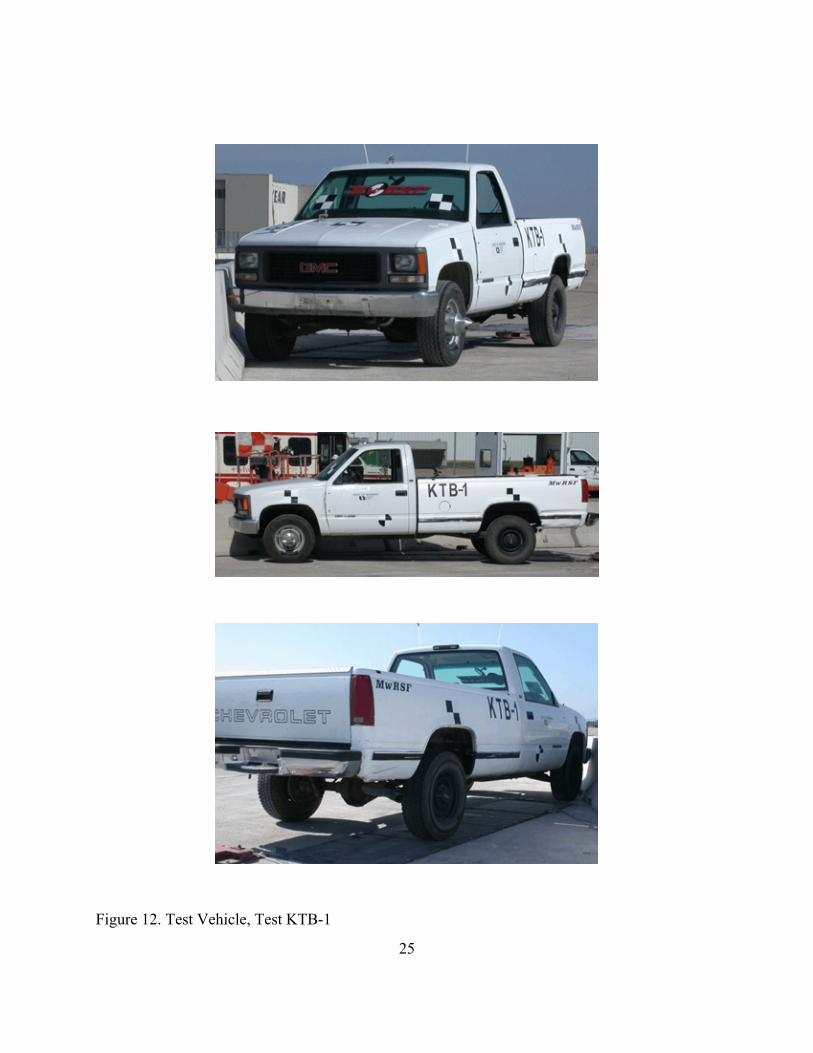
5.3 Test Vehicles
For test KTB-1, a 1997 Chevrolet 2500 ¾-ton pickup truck was used as the test vehicle. The
test inertial and gross static weights were 2,018 kg (4,448 lbs). The test vehicle is shown in Figure
12, and vehicle dimensions are shown in Figure 13.
25
Figure 12. Test Vehicle, Test KTB-1

26
Figure 13. Vehicle Dimensions, Test KTB-1
27
The longitudinal component of the center of gravity was determined using the measured axle
weights. The location of the final centers of gravity are shown in Figures 12 and 13.
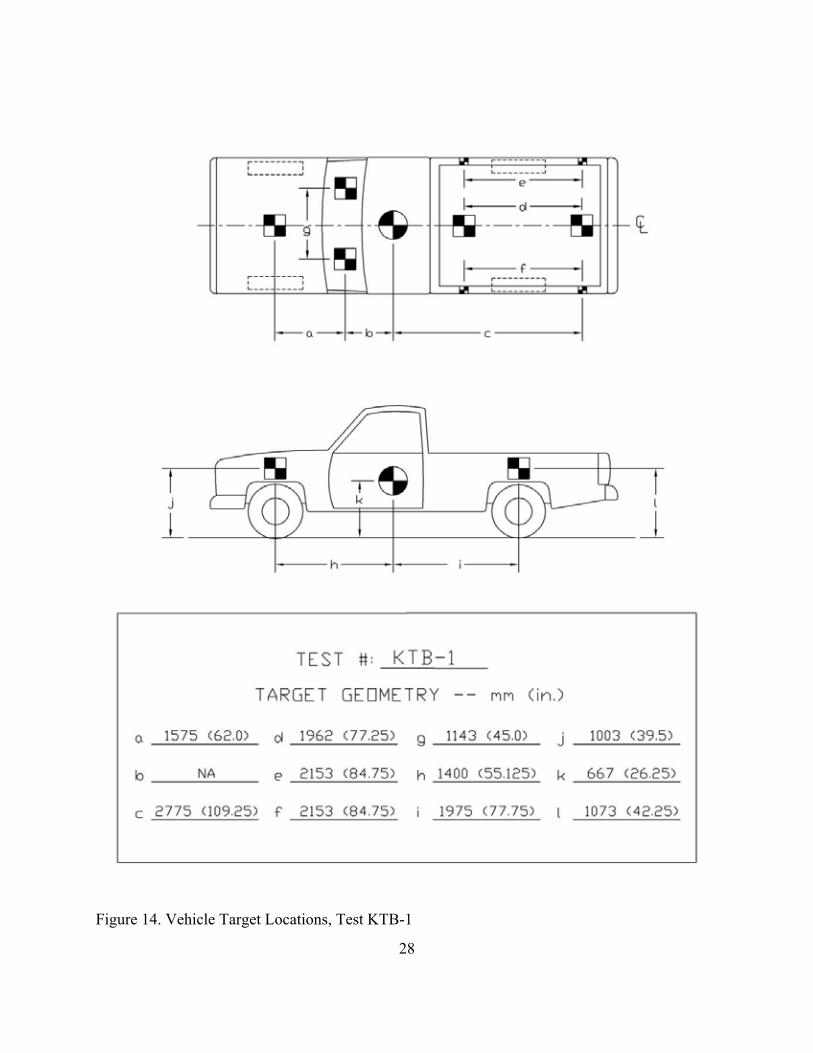
Square black and white-checkered targets were placed on the vehicle to aid in the analysis
of the high-speed film and E/cam video, as shown in Figure 14. Round, checkered targets were
placed on the center of gravity, on the driver’s side door, on the passenger’s side door, and on the
roof of the vehicle. The remaining targets were located for reference so that they could be viewed
from the high-speed cameras for film analysis.
The front wheels of the test vehicle were aligned for camber, caster, and toe-in values of zero
so that the vehicle would track properly along the guide cable. Two 5B flash bulbs were mounted
on both the hood and roof of the vehicle to pinpoint the time of impact with the bridge rail on the
high-speed film and E/cam video. The flash bulbs were fired by a pressure tape switch mounted on
the front face of the bumper. A remote-controlled brake system was installed in the test vehicle so
the vehicle could be brought safely to a stop after the test.
5.4 Data Acquisition Systems
5.4.1 Accelerometers
One triaxial piezoresistive accelerometer system with a range of ±200 G’s was used to
measure the acceleration in the longitudinal, lateral, and vertical directions at a sample rate of 10,000
Hz. The environmental shock and vibration sensor/recorder system, Model EDR-4M6, was
developed by Instrumented Sensor Technology (IST) of Okemos, Michigan and includes three
differential channels as well as three single-ended channels. The EDR-4 was configured with 6 Mb
of RAM memory and a 1,500 Hz lowpass filter. Computer software, “DynaMax 1 (DM-1)” and
“DADiSP”, was used to analyze and plot the accelerometer data.
28
Figure 14. Vehicle Target Locations, Test KTB-1

29
A backup triaxial piezoresistive accelerometer system with a range of ±200 G’s was also
used to measure the acceleration in the longitudinal, lateral, and vertical directions at a sample rate
of 3,200 Hz. The environmental shock and vibration sensor/recorder system, Model EDR-3, was
developed by Instrumental Sensor Technology (IST) of Okemos, Michigan. The EDR-3 was
configured with 256 Kb of RAM memory and a 1,120 Hz lowpass filter. Computer software,
“DynaMax 1 (DM-1)” and “DADiSP”, was used to analyze and plot the accelerometer data.
5.4.2 Rate Transducers
A Humphrey 3-axis rate transducer with a range of 360 deg/sec in each of the three
directions (pitch, roll, and yaw) was used to measure the rates of motion of the test vehicle. The rate
transducer was rigidly attached to the vehicle near the center of gravity of the test vehicle. Rate
transducer signals, excited by a 28-volt DC power source, were received through the three single-
ended channels located externally on the EDR-4M6 and stored in the internal memory. The raw data
measurements were then downloaded for analysis and plotted. Computer software, “DynaMax 1
(DM-1)” and “DADiSP”, was used to analyze and plot the rate transducer data.
5.4.3 High-Speed Photography
For test KTB-1, two high-speed 16-mm Red Lake Locam cameras, with operating speeds
of approximately 500 frames/sec, were used to film the crash test. Five high-speed Red Lake E/cam
video cameras, with operating speeds of 500 frames/sec, were also used to film the crash test. Six
Canon digital video cameras, with a standard operating speed of 29.97 frames/sec, were also used
to film the crash test. A Locam, with a wide-angle 12.5-mm lens, and two high-speed E/cam video
cameras were placed above the test installation to provide a field of view perpendicular to the
ground. A Locam and a Canon digital video camera were placed downstream from the impact point

30
and had a field of view parallel to the barrier. A high-speed E/cam video camera and a Canon digital
video camera were placed downstream from the impact point and behind the barrier. Two Canon
digital video cameras were placed downstream from the impact point and above the barrier. A high-
speed E/cam video camera and a Canon digital video camera were placed upstream from the impact
point and had a field of view parallel to the barrier. A high-speed E/cam video camera was placed
upstream from the point of impact and behind the barrier. A Canon digital video camera, with a
panning view, was placed on the traffic side of the barrier and had a field of view perpendicular to
the barrier. A schematic of all thirteen camera locations for test KTB-1 is shown in Figure 15.
The Locam films and E/cam videos were analyzed using the Vanguard Motion Analyzer and
the Redlake Motion Scope software, respectively. Actual camera speed and camera divergence
factors were considered in the analysis of the high-speed film.
5.4.4 Pressure Tape Switches
For test KTB-1, five pressure-activated tape switches, spaced at 2-m (6.56-ft) intervals, were
used to determine the speed of the vehicle before impact. Each tape switch fired a strobe light which
sent an electronic timing signal to the data acquisition system as the right-front tire of the test
vehicle passed over it. Test vehicle speed was determined from electronic timing mark data recorded
using the "Test Point" software. Strobe lights and high-speed film analysis are used only as a backup
in the event that vehicle speed cannot be determined from the electronic data.

31
Figu
re 1
5. L
ocat
ion
of H
igh-
Spee
d C
amer
as, T
est K
TB-1

32
6 CRASH TEST NO. 1
6.1 Test KTB-1
The 2,018-kg (4,448-lb) pickup truck impacted the temporary barrier tie-down system at a
speed of 99.8 km/hr (62.0 mph) and at an angle of 25.3 degrees. A summary of the test results and
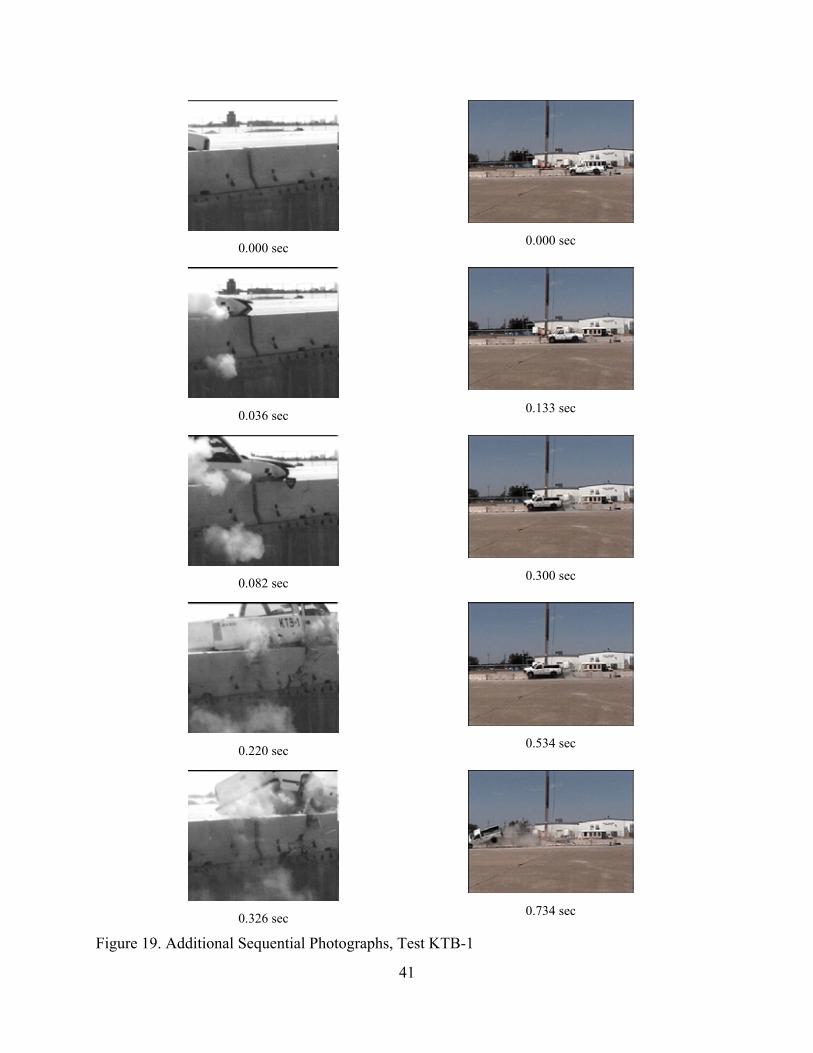
the sequential photographs are shown in Figure 16. The summary of the test results and sequential
photographs in English units is shown in Appendix D. Additional sequential photographs are shown
in Figures 17 through 19. Documentary photographs of the crash test are shown in Figures 20 and
21.
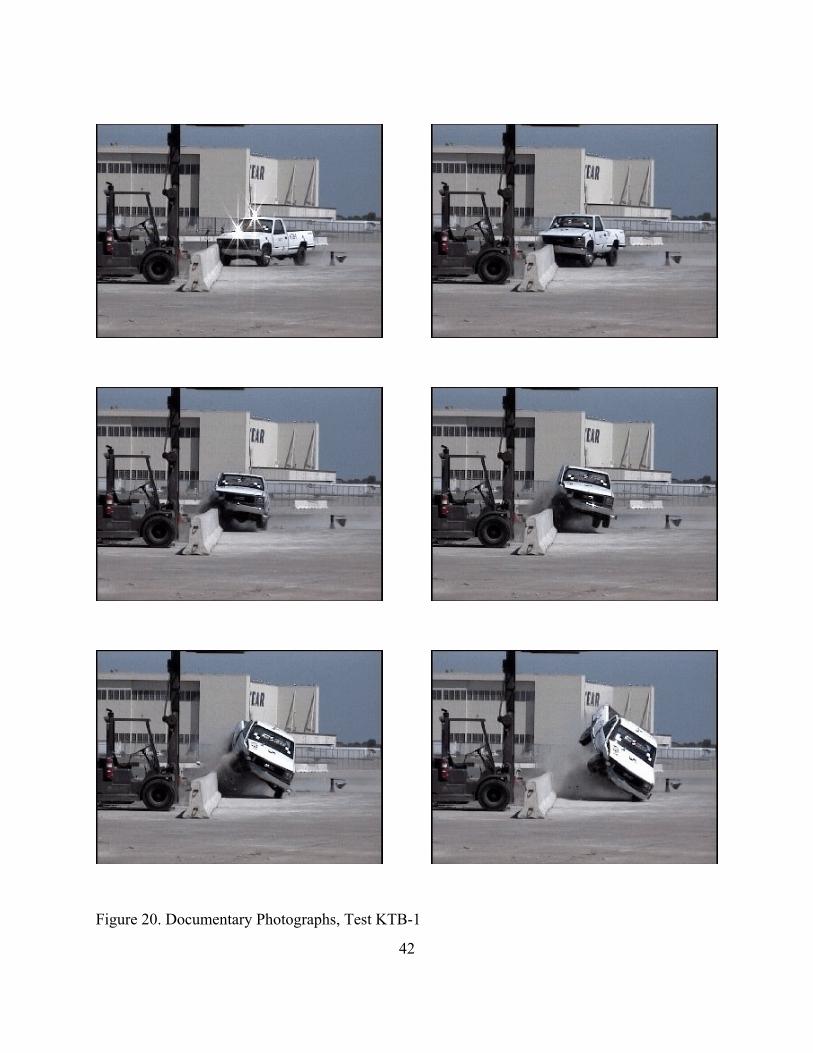
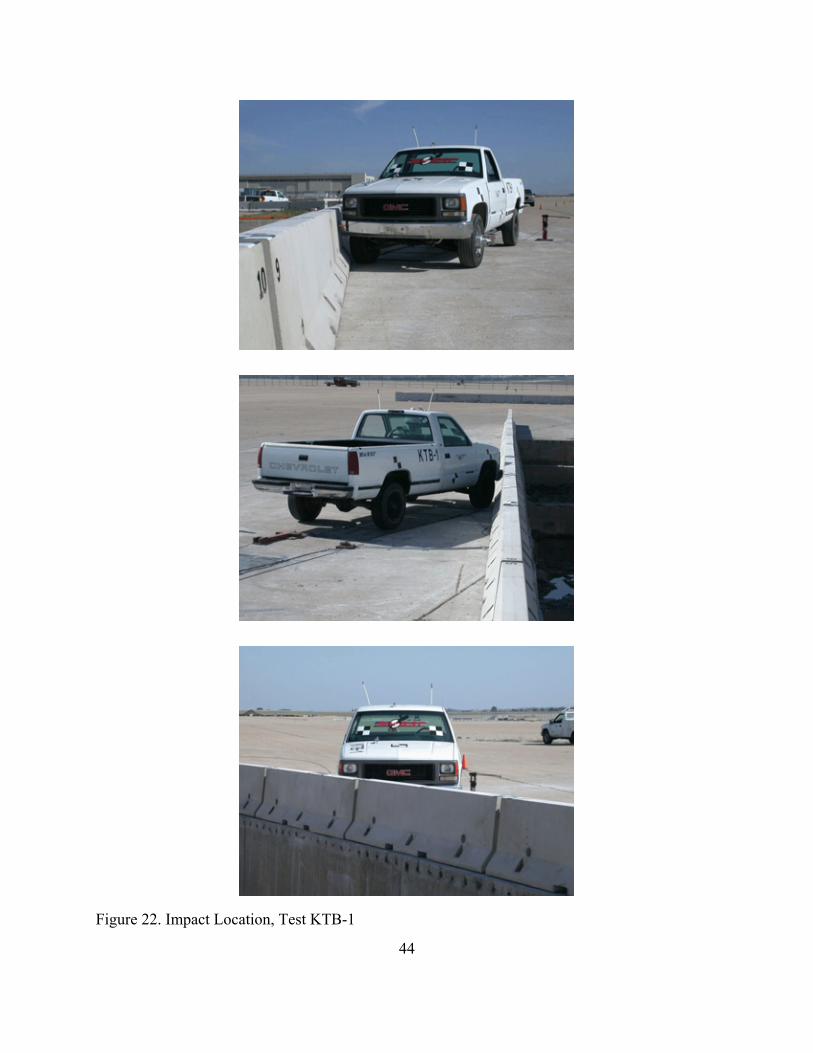
6.2 Test Description
Initial impact was to occur 1,295-mm (51-in.) upstream from the center of the gap between
barrier nos. 8 and 9, as shown in Figure 22. Actual vehicle impact occurred 1,651-mm (65-in.)
upstream from the center of the gap between barrier nos. 8 and 9. At 0.026 sec after impact, the
right-front corner of the vehicle was positioned over the top of the barrier. At 0.044 sec, the right-
front corner of the vehicle protruded over the barrier as the top of the right-side door became ajar.
At this same time, barrier no. 8 began to deflect backward. At 0.050 sec, the right-front corner was
crushed inward toward the engine compartment and the right-front corner of the hood was
positioned at the joint between barrier nos. 8 and 9. At 0.058 sec, barrier no. 9 began to deflect as
the top tipped backward. At 0.066 sec, the right-front corner continued to crush inward as the
vehicle began to redirect. At 0.084 sec, the hood’s right-front corner remained over the top of the
barrier. At this same time, a crack formed at the midspan of barrier no. 9 on the top and back sides.
At 0.101 sec, the right-front corner of the vehicle reached its maximum intrusion of 534 mm (21 in.)
beyond the front face of the barrier which had deflected and tipped 203 mm (8 in.) by this time. At

33
0.126 sec, the left-front tire became airborne as the front of the vehicle began to pitch upward. At
0.136 sec, barrier no. 9 continued to deflect. At 0.162 sec, the vehicle began to roll counter-
clockwise (CCW) away from the barrier as the front of the vehicle became airborne. At 0.199 sec,
the right-front corner of the vehicle was positioned at the joint between barrier nos. 9 and 10. At this
same time, barrier nos. 8 and 9 ceased movement. At 0.215 sec, the rear of the vehicle began to pitch
upward as the right-front corner of the vehicle was positioned above the barrier. At 0.254 sec, the
left-rear tire became airborne. At 0.257 sec, the vehicle became parallel to the barrier with a
resultant velocity of 79.9 km/hr (49.6 mph). At 0.300 sec, the right-rear tire of the vehicle contacted
the midspan of barrier no. 9 near the top of the barrier. At this same time, the vehicle continued to
redirect off of the barrier. At 0.354 sec, the vehicle exited the barrier at a trajectory angle of 14.4
degrees and at a resultant velocity of 81.5 km/hr (50.6 mph). At 0.435 sec, the left-front tire
contacted the ground as the vehicle continued to roll CCW. At 0.469 sec, the rear of the vehicle
remained airborne as the vehicle encountered significant CCW roll away from the barrier. At 0.606
sec, the vehicle reached its maximum roll angle of 34.0 degrees away from barrier. At 0.671 sec, the
front of the vehicle pitched downward to an extent where the left-front corner of the bumper almost
contacted the ground. At 0.765 sec, the vehicle ceased its CCW rolling motion as the rear of the
vehicle began to descend toward the ground. At 1.178 sec, the rear tires contacted the ground. At
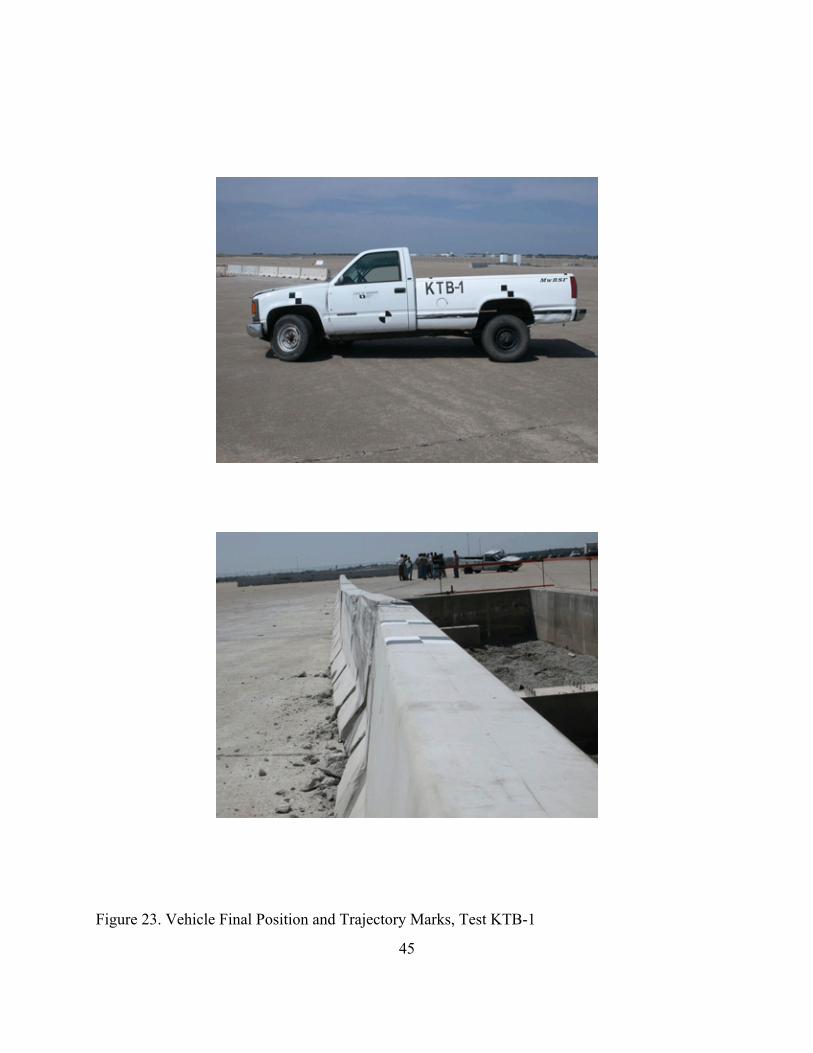
1.317 sec, the vehicle yawed back toward the barrier. The vehicle came to rest 56.25-m (184.5-ft)
downstream from impact and 12.80-m (42-ft) laterally behind a line projected parallel to the traffic-
side face of the barrier, as shown in Figures 16 and 23.
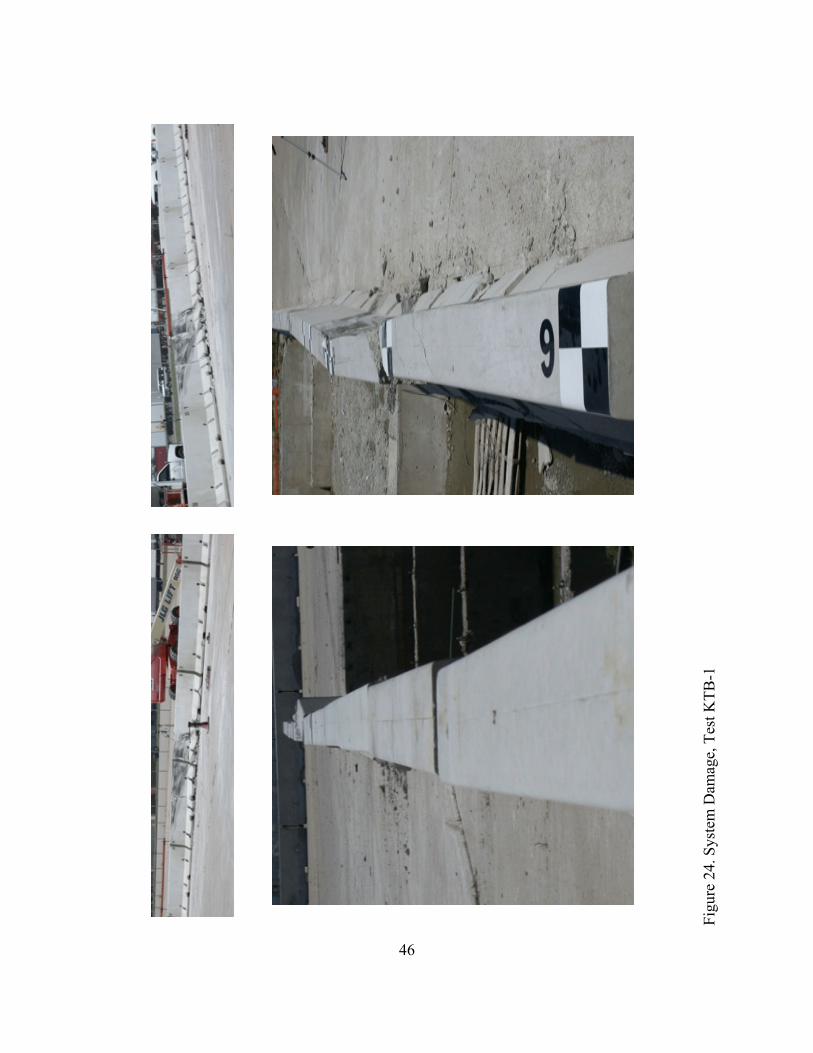
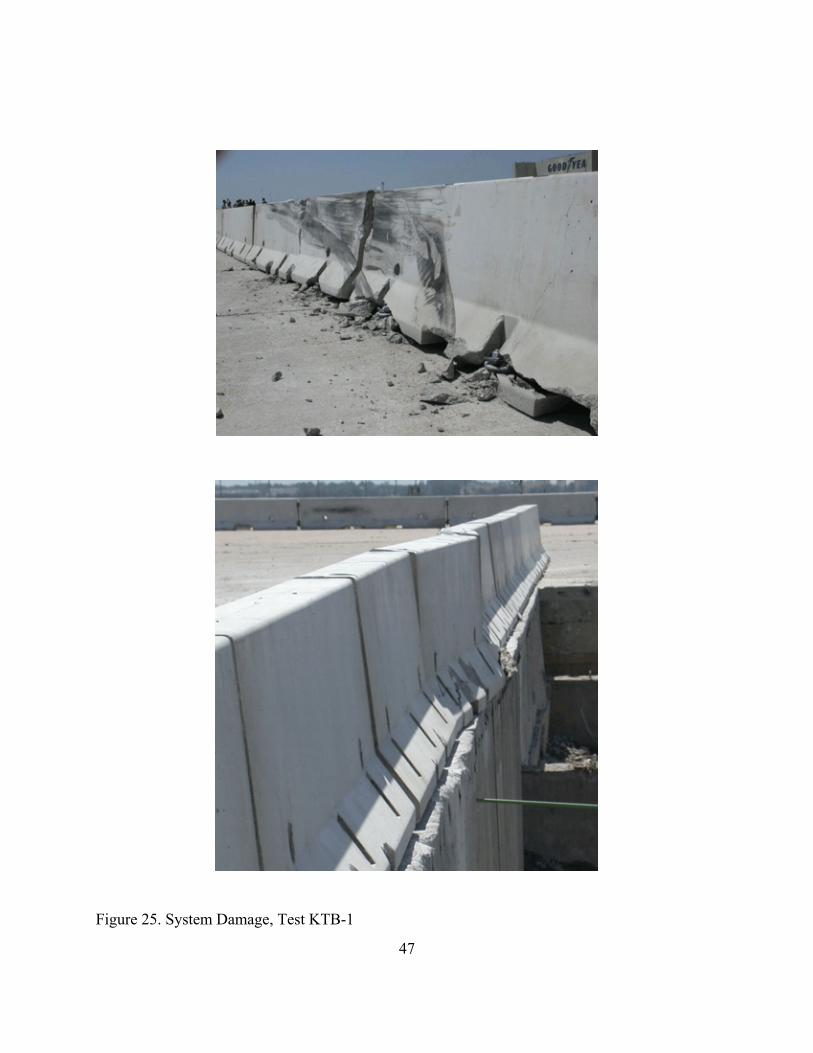
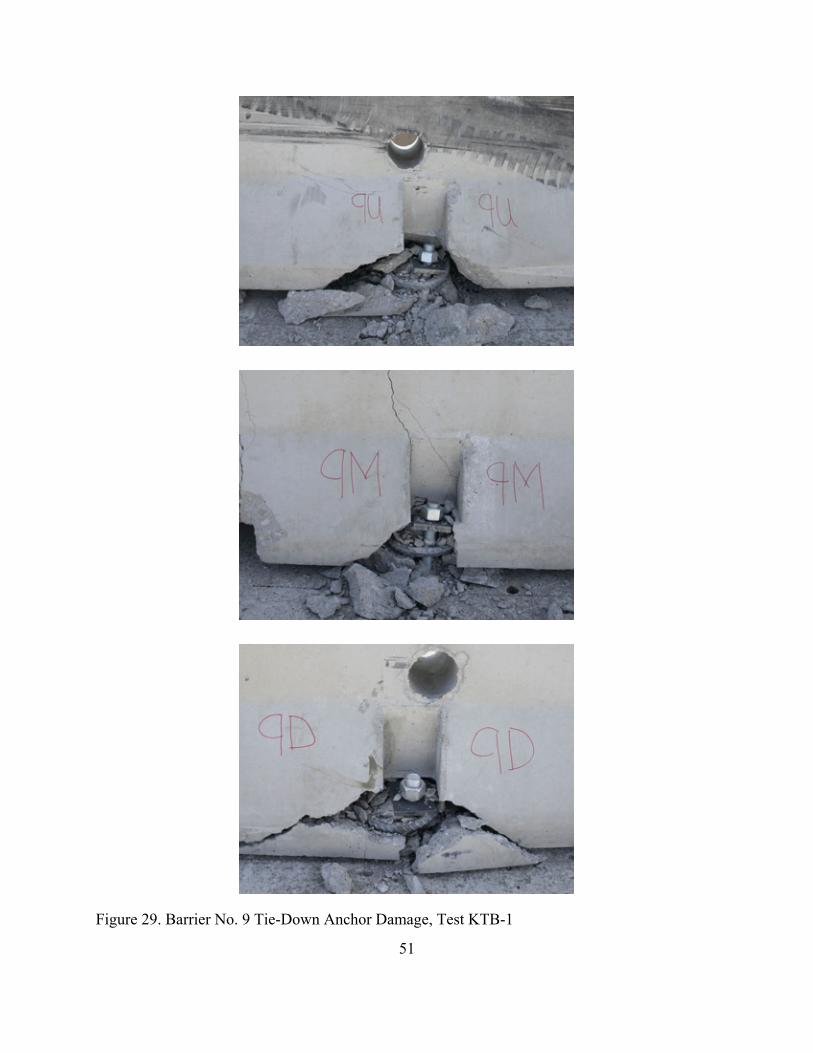
6.3 Barrier Damage
Damage to the barrier was moderate, as shown in Figures 24 through 29. Barrier damage
34
consisted of contact marks on the front concrete face, spalling of the concrete, and concrete cracking
and failure. The length of vehicle contact along the barrier was approximately 5.6 m (18.4 ft) which
spanned from 1,651 mm (65 in.) upstream from the center of the joint between barrier nos. 8 and 9
to the upstream end of barrier no. 10.
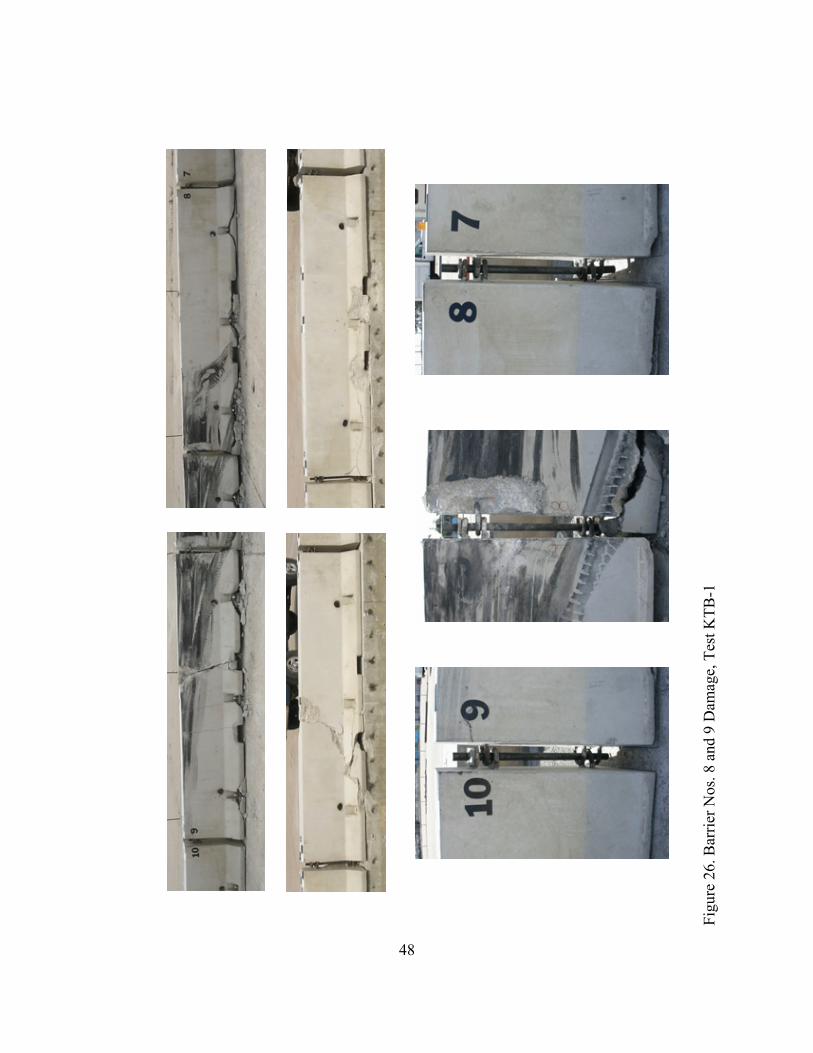
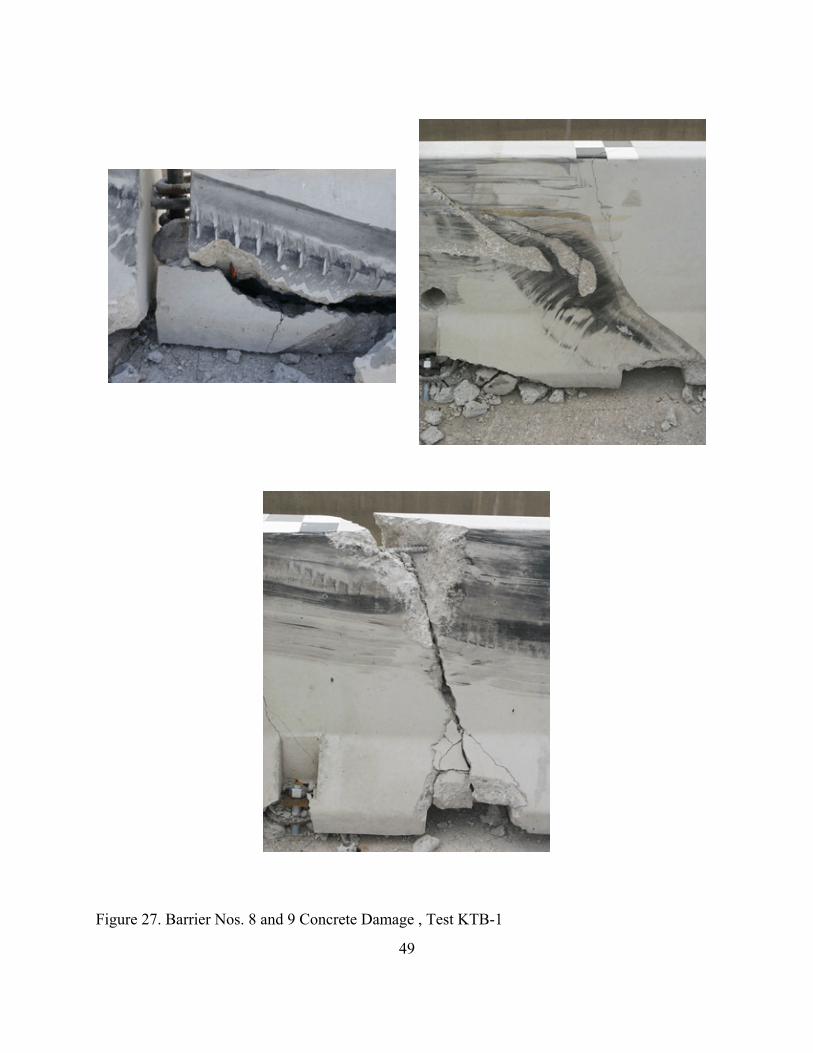
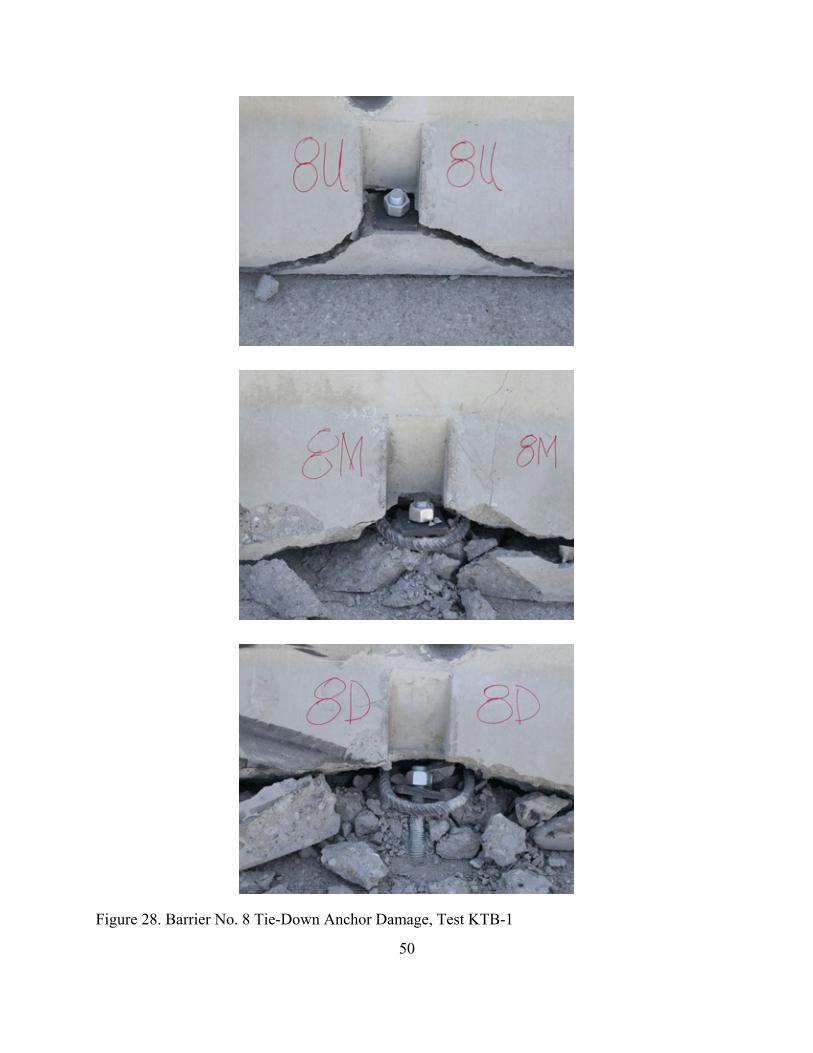
Tire marks were visible on the front face of barrier nos. 8 and 9 and the upstream edge of
barrier no. 10. Concrete failure was found at all of the tie-down anchors of barrier nos. 8 and 9, as
shown in Figures 28 and 29. A 152-mm (6-in.) wide x 152-mm (6-in.) long x 89-mm (3.5-in.) deep
piece of concrete was removed from the downstream end of barrier no. 8. Major concrete failure was
found 457-mm (18-in.) upstream from the center of barrier no. 9 due to torsional loading. In
addition, two larger cracks were found downstream from the center of barrier no. 9. Detailed
sketches of the concrete failure and cracking of barrier nos. 8 and 9 are shown in Appendix E. The
anchor dowels at the middle and downstream end of barrier no. 8 and the upstream end of barrier
no. 9 were deformed. No major concrete spalling was found on the front face of barrier no. 9.
Concrete deck failure did not occur at any of the anchor locations. No noticeable deformations were
found on the connection pins nor the loops.
The permanent set of the barrier system is shown in Figures 24 and 25. The maximum lateral
permanent set barrier deflection was 89 mm (3.5 in.) at the downstream end of barrier no. 8 and the
upstream end of barrier no. 9, as measured in the field. The maximum lateral dynamic barrier
deflection, including barrier tipping of the top surface, was 287 mm (11.3 in.) at the upstream end
of barrier no. 9, as determined from high-speed film analysis.
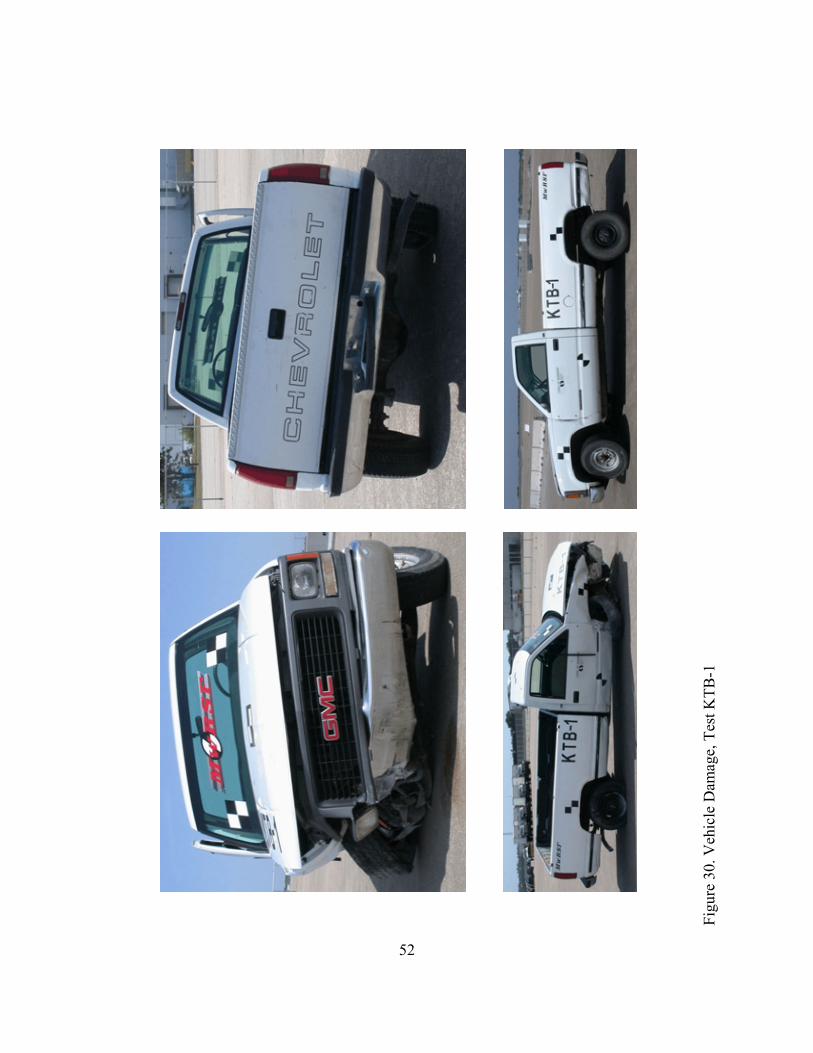
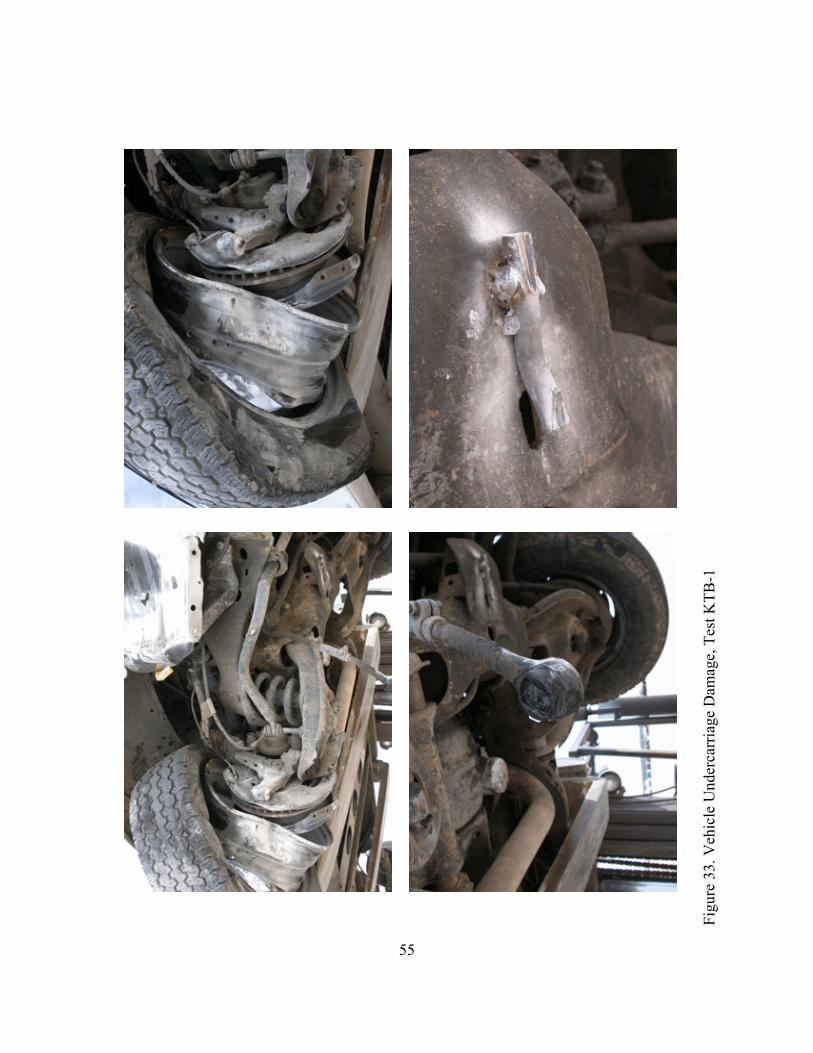
6.4 Vehicle Damage
Exterior vehicle damage was moderate, as shown in Figures 30 through 34. Damage was
35
concentrated on the right-front corner and right side of the vehicle where the impact occurred. The
right-front corner of the vehicle was crushed inward and back, including the fender, bumper, and
frame rail. A buckling point was found at the center of the front bumper with a minor tear near the
right-front frame horn. Major frame damage was observed, including deformation to the right-side
frame horn. The outer right-front tie-rod disengaged completely. The right-front tire disengaged
from the rim, and the inner wall was torn. In addition, the right-front outer rim disengaged from the
remainder of the hub and was severely deformed. Scuff marks were found on the right-rear wheel
well, and the side wall of the right-rear tire encountered a 76-mm (3-in.) wide tear. The right-rear
steel rim also received significant deformations and scrape marks. Minor scrapes and dents were also
observed on the right-side door and the right side of the truck bed from the contact with the barriers.
The top of the right-side door was jarred open with a 127 mm (5 in.) gap. Moreover, the door was
jammed shut and could not be opened. The grill was broken and deformed around the right-side
headlight assembly. The truck’s box twisted and produced an inconsistent gap between the box and
cab portions. The roof, the hood, the left side and rear of the vehicle, and all the window glass
remained undamaged.
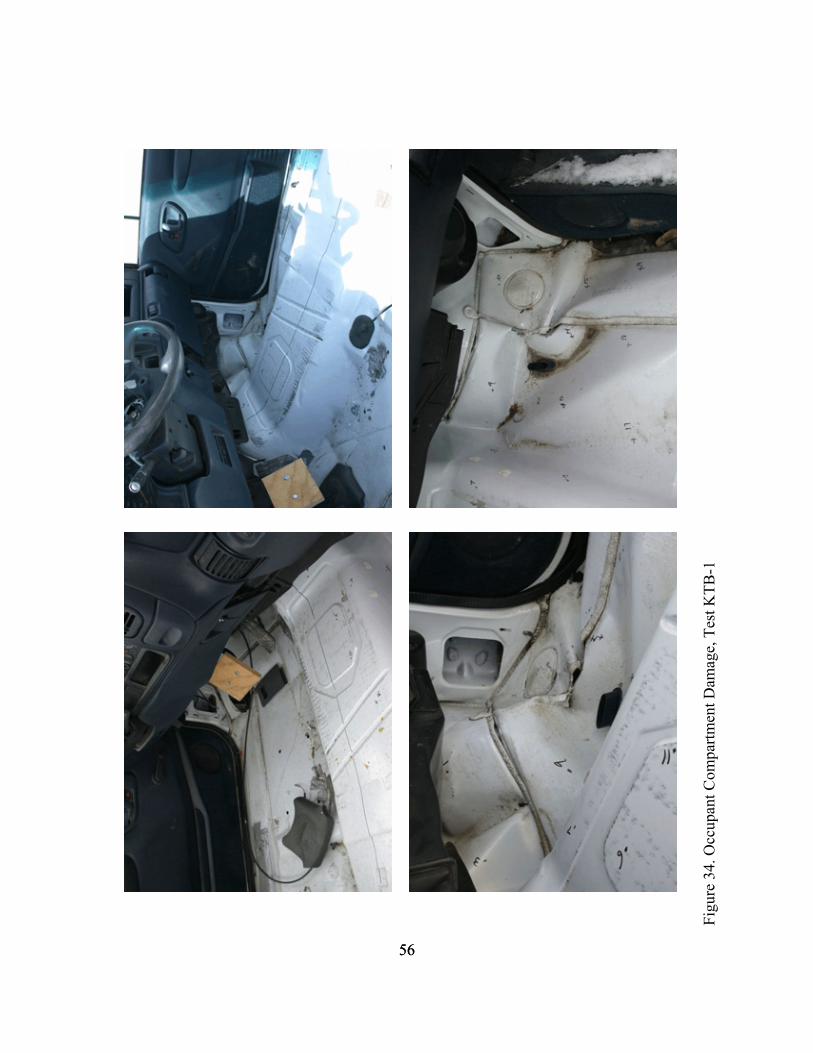
Moderate occupant compartment deformations occurred with deformations to the right-side
floor pan and firewall, as shown in Figure 34. Occupant compartment deformations and the
corresponding locations are provided in Appendix F. A maximum vertical deflection of 121 mm
(4.75 in.) was found near the firewall at the center of the right side. Another significant vertical
deflection of 76 mm (3 in.) was found near the center of the floor on the right side. Maximum
longitudinal and lateral deflections of the floor pan were measured as 121 mm (4.75 in.) and 83 mm
(3.25 in.), respectively. Maximum dash deflection was found to be approximately 25 mm (1 in.).

36
6.5 Occupant Risk Values
The longitudinal and lateral occupant impact velocities were determined to be 5.68 m/sec
(18.63 ft/sec) and 7.01 m/sec (22.99 ft/sec), respectively. The maximum 0.010-sec average occupant
ridedown decelerations in the longitudinal and lateral directions were 10.98 g’s and 10.60 g’s,
respectively. It is noted that the occupant impact velocities (OIV’s) and occupant ridedown
decelerations (ORD’s) were within the suggested limits provided in NCHRP Report No. 350. The
results of the occupant risk, determined from the accelerometer data, are summarized in Figure 16.
Results are shown graphically in Appendix G. Roll and yaw data were collected from film analysis
and are shown graphically in Appendix H.
6.6 Discussion
The analysis of the test results for test KTB-1 showed that the tie-down system for use on
concrete bridge decks and with the redesigned F-shape temporary barrier adequately contained and
redirected the vehicle with controlled lateral displacements of the barrier system. There were no
detached elements nor fragments which showed potential for penetrating the occupant compartment
nor presented undue hazard to other traffic. Deformations of, or intrusion into, the occupant
compartment that could have caused serious injury did not occur. The test vehicle did not penetrate
nor ride over the concrete barrier and remained upright during and after the collision. Vehicle roll,
pitch, and yaw angular displacements were noted, but they were deemed acceptable because they
did not adversely influence occupant risk safety criteria nor cause rollover. After collision, the
vehicle’s trajectory revealed minimum intrusion into adjacent traffic lanes. In addition, the vehicle’s
exit angle was less than 60 percent of the impact angle. Therefore, test KTB-1 conducted on the tie-

37
down system for use on concrete bridge decks and with the redesigned F-shape temporary barrier
was determined to be acceptable according to the TL-3 safety performance criteria found in NCHRP
Report No. 350.

38
0.04
4 se
c0.
084
sec
0.23
1 se
c0.
469
sec
0.00
0 se
c
!Te
st N
umbe
r...
....
....
....
....
..K
TB-1
!D
ate
....
....
....
....
....
....
...7
/31/
02!
App
urte
nanc
e..
....
....
....
....
..K
ansa
s Tem
pora
ry B
arrie
rTi
e D
own
Syst
em!
Tota
l Len
gth
....
....
....
....
....
.62.
23 m
!Pl
acem
ent
....
....
....
....
....
..25
mm
from
con
cret
e br
idge
dec
k ed
ge!
Key
Ele
men
ts..
....
....
....
....
..N
ine
3,81
0-m
m lo
ng K
ansa
s Te
mpo
rary
Bar
riers
Seve
n 3,
810-
mm
lon
g Io
wa
F-Sh
ape
Tem
pora
ry B
arrie
rs!
Bar
rier J
oint
Pin
Con
nect
ions
....
...3
2-m
m d
iam
eter
by
712-
mm
long
A36
stee
l rod
with
64x
102x
132-
mm
pla
te!
Tie-
Dow
n Anc
hors
....
....
....
....
28.5
75 m
m A
STM
A30
7 Thr
eade
d D
owel
sN
umbe
r per
Bar
rier
....
....
....
3Em
bedm
ent i
nto
Con
cret
e..
....
.305
mm
Plac
emen
t..
....
....
....
....
.Tra
ffic
side
onl
y!
Veh
icle
Mod
el..
....
....
....
....
.199
7 C
hevr
olet
250
0 ¾
-ton
pick
upC
urb
....
....
....
....
....
...1
,991
kg
Test
Iner
tial.
....
....
....
....
.2,0
18 k
gG
ross
Sta
tic..
....
....
....
....
2,01
8 kg
!V
ehic
le S
peed
Impa
ct..
....
....
....
....
..99
.8 k
m/h
rEx
it (r
esul
tant
)...
....
....
...8
1.5
km/h
r
!V
ehic
le A
ngle
Impa
ct (o
rient
atio
n)..
....
....
....
.25.
3 de
gEx
it (tr
ajec
tory
)..
....
....
....
....
14.4
deg
!V
ehic
le S
nagg
ing
....
....
....
....
....
.Non
e !
Veh
icle
Poc
ketin
g..
....
....
....
....
...N
one
!V
ehic
le S
tabi
lity
....
....
....
....
....
..Sa
tisfa
ctor
y!
Occ
upan
t Rid
edow
n D
ecel
erat
ion
(10
mse
c av
g.)
Long
itudi
nal.
....
....
....
....
....
10.9
8 G
’s<
20 G
’sLa
tera
l (no
t req
uire
d)..
....
....
....
10.6
0 G
’s!
Occ
upan
t Im
pact
Vel
ocity
Long
itudi
nal.
....
....
....
....
....
5.68
m/s
< 1
2 m
/sLa
tera
l (no
t req
uire
d)..
....
....
....
7.01
m/s
!V
ehic
le D
amag
e..
....
....
....
....
....
Mod
erat
eTA
D14
....
....
....
....
....
....
..1-
RFQ
-3SA
E15..
....
....
....
....
....
....
1-R
FAW
3!
Veh
icle
Sto
ppin
g D
ista
nce
....
....
....
..56
.25
m d
owns
tream
12.8
0 m
late
rally
beh
ind
!B
arrie
r Dam
age
....
....
....
....
....
...M
oder
ate
!M
axim
um R
ail D
efle
ctio
nsPe
rman
ent S
et..
....
....
....
....
.89
mm
Dyn
amic
....
....
....
....
....
....
287
mm
!W
orki
ng W
idth
....
....
....
....
....
...5
34 m
m
Figu
re 1
6. S
umm
ary
of T
est R
esul
ts a
nd S
eque
ntia
l Pho
togr
aphs
, Tes
t KTB
-1

39
0.000 sec
0.304 sec
0.064 sec
0.000 sec
0.164 sec
0.050 sec
0.230 sec
0.096 sec
0.262 sec
0.140 sec
Figure 17. Additional Sequential Photographs, Test KTB-1

40
0.100 sec
0.000 sec
0.200 sec
0.100 sec
0.367 sec
0.234 sec
0.534 sec
0.400 sec
0.000 sec
0.701 sec
1.702 sec
Figure 18. Additional Sequential Photographs, Test KTB-1
41
0.000 sec
0.734 sec
0.036 sec
0.000 sec
0.082 sec
0.133 sec
0.220 sec
0.300 sec
0.326 sec
0.534 sec
Figure 19. Additional Sequential Photographs, Test KTB-1
42
Figure 20. Documentary Photographs, Test KTB-1

43
Figure 21. Documentary Photographs, Test KTB-1
44
Figure 22. Impact Location, Test KTB-1
45
Figure 23. Vehicle Final Position and Trajectory Marks, Test KTB-1
46
Figu
re 2
4. S
yste
m D
amag
e, T
est K
TB-1
47
Figure 25. System Damage, Test KTB-1
48
Figu
re 2
6. B
arrie
r Nos
. 8 a
nd 9
Dam
age,
Tes
t KTB
-1
49
Figure 27. Barrier Nos. 8 and 9 Concrete Damage , Test KTB-1
50
Figure 28. Barrier No. 8 Tie-Down Anchor Damage, Test KTB-1
51
Figure 29. Barrier No. 9 Tie-Down Anchor Damage, Test KTB-1
52
Figu
re 3
0. V
ehic
le D
amag
e, T
est K
TB-1

53
Figu
re 3
1. V
ehic
le D
amag
e, T
est K
TB-1

54
Front Tire
Rear Tire
Figure 32. Right-Side Tire Damage, Test KTB-1
55
Figu
re 3
3. V
ehic
le U
nder
carr
iage
Dam
age,
Tes
t KTB
-1
5656
Figu
re 3
4. O
ccup
ant C
ompa
rtmen
t Dam
age,
Tes
t KTB
-1

57
7 SUMMARY AND CONCLUSIONS
A tie-down system for use on concrete bridge decks and with the redesigned F-shape
temporary concrete barriers was developed and full-scale vehicle crash tested. The tie-down system
consisted of three 28.575-mm (1.125-in.) diameter Grade 2 threaded dowel connections embedded
approximately 305 mm (12 in.) into the concrete on the traffic side of each of the redesigned F-shape
temporary concrete barriers. The barriers were placed 25.4 mm (1 in.) away from the edge of the
concrete bridge deck. A full-scale vehicle crash test was performed with a ¾-ton pickup truck on
the barrier system and was determined to be acceptable according to the TL-3 safety performance
criteria presented in NCHRP Report No. 350. The barrier safely redirected the pickup truck with
minimal barrier deflections. A summary of the safety performance evaluation is provided in Table
3.
58
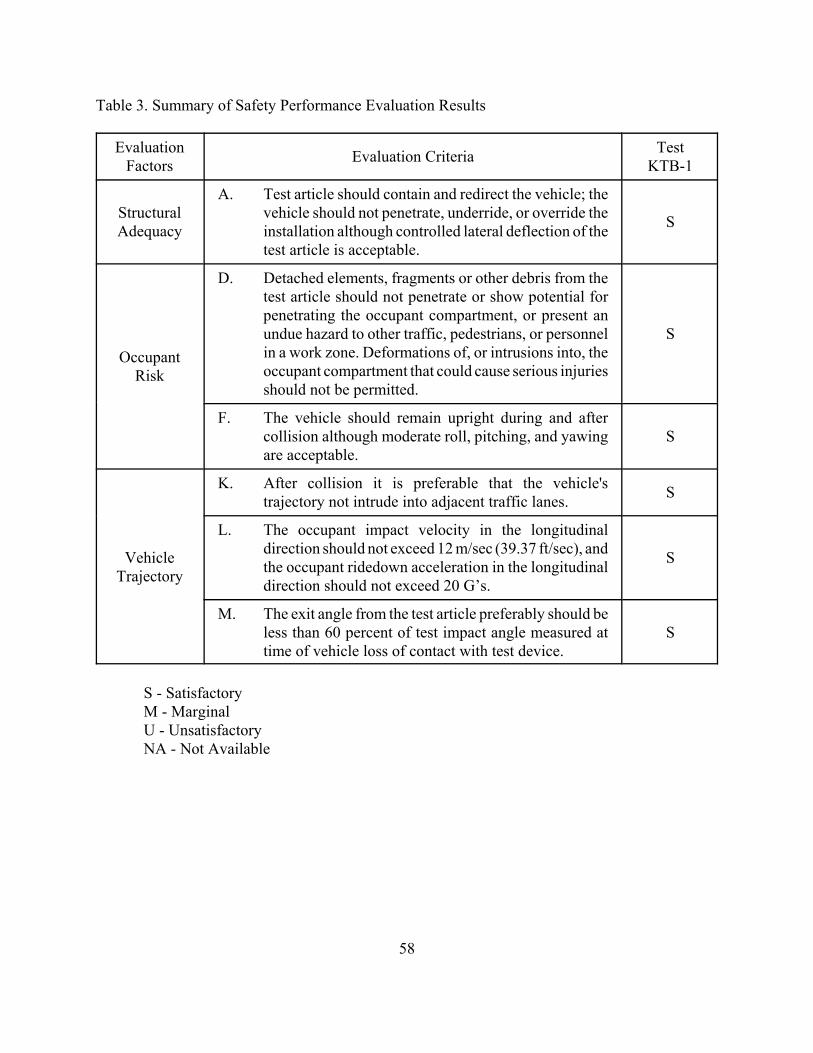
Table 3. Summary of Safety Performance Evaluation Results
EvaluationFactors Evaluation Criteria Test
KTB-1
StructuralAdequacy
A. Test article should contain and redirect the vehicle; thevehicle should not penetrate, underride, or override theinstallation although controlled lateral deflection of thetest article is acceptable.
S
OccupantRisk
D. Detached elements, fragments or other debris from thetest article should not penetrate or show potential forpenetrating the occupant compartment, or present anundue hazard to other traffic, pedestrians, or personnelin a work zone. Deformations of, or intrusions into, theoccupant compartment that could cause serious injuriesshould not be permitted.
S
F. The vehicle should remain upright during and aftercollision although moderate roll, pitching, and yawingare acceptable.
S
VehicleTrajectory
K. After collision it is preferable that the vehicle'strajectory not intrude into adjacent traffic lanes. S
L. The occupant impact velocity in the longitudinaldirection should not exceed 12 m/sec (39.37 ft/sec), andthe occupant ridedown acceleration in the longitudinaldirection should not exceed 20 G’s.
S
M. The exit angle from the test article preferably should beless than 60 percent of test impact angle measured attime of vehicle loss of contact with test device.
S
S - SatisfactoryM - MarginalU - UnsatisfactoryNA - Not Available

59
8 RECOMMENDATIONS
A tie-down system for use on concrete bridge decks and with the redesigned F-shape
temporary barriers, as described in this report, was developed and successfully crash tested
according to the criteria found in NCHRP Report No. 350. The test results indicate that this design
is suitable for use on Federal-aid highways. However, any significant modifications made to the tie-
down design would require additional analysis and can only be verified through the use of full-scale
crash testing.
It should be noted that the tie-down system developed within the scope of this project may
be used as either a bolt-through system or as an adhesive-bonded system as long as the bolt capacity
is developed. In addition, this tie-down system is not recommended for use on a bridge deck with
an asphalt overlay. By placing the bolts through the overlay, high bending moments will be induced
in the anchor bolts at the top of the concrete surface, causing them to bend at lower loads.
In some real-world applications, an expansion joint may fall between two anchor bolts within
a single barrier unit. In this situation, omitting one anchor bolt is not believed to compromise the
barrier performance. It is recommended that the one anchor bolt adjacent to the joint, as shown in
Figure 35, should be left out of the barrier spanning the thermal expansion joint. It should be noted
that the adjacent barrier units must each be installed with the standard three anchor bolts.
Since the anchored F-shape rail has substantially lower deflections than the free-standing
section, it is recommended that a transition between bolted and free-standing barriers be made to
reduce the propensity for vehicle pocketing. Therefore, it is suggested that the transition region
always be placed in a tangent section of the barrier (that lies parallel to the roadway). In some
situations, this transition section will occur on a structural slab or on a relatively thick concrete
60
section. In these cases, it is recommended that the first barrier adjacent to the bolted down section
have two anchor bolts similar to the bolted down section and that the next barrier have one bolt
placed in the end hole closest to the bolted down section.
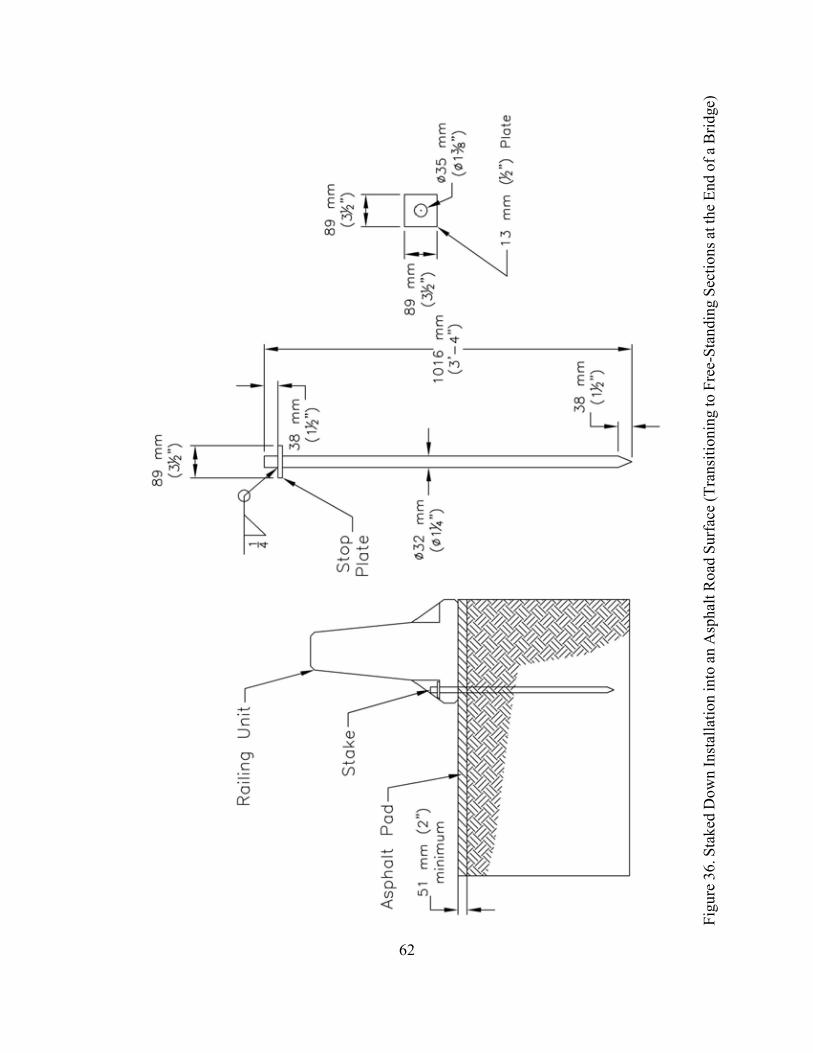
In many situations, the bolted rail section will end adjacent to the end of the bridge, and the
stiffness transitioning of the rail section will be accomplished over an asphalt paving surface. In this
case, until further evaluation under a current study is completed, it is recommended to utilize the
driven steel pin system of reinforcement similar to the one developed for the K-Rail by CALTRANS
(5). It is recommended that the 32-mm (1.25-in.) diameter by 1,016-mm (40-in.) long steel stakes
with stop plates, as detailed in Figure 36, driven into the asphalt road surface be utilized to stiffen
the barriers upstream of the bolted down barrier sections. It is recommended that three stakes be
utilized in the first barrier upstream of the bolted section, two stakes in the outer two locations in
the second barrier upstream, and one stake in the downstream end in the third barrier upstream. Until
a time when the currently funded study of this transition is completed, this recommended practice
will serve as the best engineering assessment available.

61
Figu
re 3
5. T
reat
men
t at B
ridge
Dec
k Th
erm
al E
xpan
sion
Join
ts
62
Figu
re 3
6. S
take
d D
own
Inst
alla
tion
into
an
Asp
halt
Roa
d Su
rfac
e (T
rans
ition
ing
to F
ree-
Stan
ding
Sec
tions
at t
he E
nd o
f a B
ridge
)
63
9 REFERENCES
1. Ross, H.E., Sicking, D.L., Zimmer, R.A., and Michie, J.D., Recommended Procedures forthe Safety Performance Evaluation of Highway Features, National Cooperative ResearchProgram (NCHRP) Report No. 350, Transportation Research Board, Washington, D.C.,1993.
2. Faller, R.K., Rohde, J.R., Rosson, B.T., Smith, R.P., and Addink, K.H., Development of aTL-3 F-Shape Temporary Concrete Median Barrier, Final Report to the Midwest StatesRegional Pooled Fund Program, Transportation Report No. TRP-03-64-96, Project No. SPR-3(017) - Fiscal Year 1995, Midwest Roadside Safety Facility, University of Nebraska-Lincoln, Lincoln, NE, December 1996.
3. Faller, R.K., Rohde, J.R., Rosson, B.T., Smith, R.P., and Addink, K.H., Development of aTL-3 F-Shape Temporary Concrete Median Barrier, Transportation Research Board PaperNo. 97-1207, December 9, 1996.
4. Beason, W.L. and Bullard, D.L., Development of a Limited-Slip Portable Concrete BarrierConnection, Report No. TX-94/1959-1, Texas Transportation Institute, Texas A&MUniversity, College Station, TX, November 1993.
5. Jewel, J., Weldon, G., and Peter, R., Compliance Crash Testing of K-Rail Used in Semi-Permanent Installations, Report No. 59-680838, Division of Materials Engineering andTesting Services, CALTRANS, Sacramento, CA, October 1999.
6. Bielenberg, B.W., Faller, R.K., Reid, J.D., Holloway, J.C., Rohde, J.R., and Sicking, D.L.,Development of a Tie-Down System for Temporary Concrete Barriers, Final Report to theMidwest States’ Regional Pooled Fund Program, Transportation Report No. TRP-03-115-02,Project No. SPR-03(017)-Year 9, Sponsoring Agency Code RPFP-01-06, Midwest RoadsideSafety Facility, University of Nebraska-Lincoln, Lincoln, NE, August 16, 2002.
7. Bielenberg, B.W., Faller, R.K., Reid, J.D., Rohde, J.R., Sicking, D.L., Design and Testingof Tie-Down Systems for Temporary Barriers, Paper accepted for presentation at the 82nd
Annual Meeting of the Transportation Research Board, Washington, D.C., Paper No. 03-3146, January 13-17, 2003.
8. Buth, C.E., Hirsch, T.J., and McDevitt, C.F., Performance Level 2 Bridge Railings,Transportation Research Record No. 1258, Transportation Research Board, NationalResearch Council, Washington, D.C., 1990.
9. Bronstad, M.E., Calcote, L.R., and Kimball, C.E., Jr., Concrete Median Barrier Research-Vol.2 Research Report, Report No. FHWA-RD-77-4, Submitted to the Office of Researchand Development, Federal Highway Administration, Performed by Southwest ResearchInstitute, San Antonio, TX, March 1976.
64
10. Buth, C.E., Campise, W.L., Griffin III, L.I., Love, M.L., and Sicking, D.L., PerformanceLimits of Longitudinal Barrier Systems-Volume I: Summary Report, FHWA/RD-86/153,Final Report to the Federal Highway Administration, Office of Safety and Traffic OperationsR&D, Performed by Texas Transportation Institute, Texas A&M University, CollegeStation, TX, May 1986.
11. Fortuniewicz, J.S., Bryden, J.E., and Phillips, R.G., Crash Tests of Portable ConcreteMedian Barrier for Maintenance Zones, Report No. FHWA/NY/RR-82/102, Final Reportto the Office of Research, Development, and Technology, Federal Highway Administration,Performed by the Engineering Research and Development Bureau, New York StateDepartment of Transportation, December 1982.
12. Mak, K.K., and Sicking, D.L., Rollover Caused by Concrete Safety Shape Barriers - VolumeI: Technical Report and Volume II: Appendices, Report Nos. FHWA-RD-88-219/220, FinalReport to the Federal Highway Administration, Office of Safety and Traffic OperationsR&D, Performed by Texas Transportation Institute, Texas A&M University, CollegeStation, TX, January 1989.
13. Hinch, J., Yang, T.L., and Owings, R., Guidance Systems for Vehicle Testing, ENSCO, Inc.,Springfield, VA, 1986.
14. Vehicle Damage Scale for Traffic Investigators, Second Edition, Technical Bulletin No. 1,Traffic Accident Data (TAD) Project, National Safety Council, Chicago, Illinois, 1971.
15. Collision Deformation Classification - Recommended Practice J224 March 1980, HandbookVolume 4, Society of Automotive Engineers (SAE), Warrendale, Pennsylvania, 1985.

65
10 APPENDICES
66
APPENDIX A
System Drawings in English Units
Figure A-1. Temporary Barrier Details (English)
Figure A-2. Temporary Barrier Profile and Tie-Down Details (English)
Figure A-3. Temporary Barrier Connection and Lifting Slot Details (English)
Figure A-4. Temporary Barrier Bill of Bars (English)
Figure A-5. Connection to Iowa Temporary Barrier Details (English)
Figure A-6. Distances Between Temporary Barriers (English)
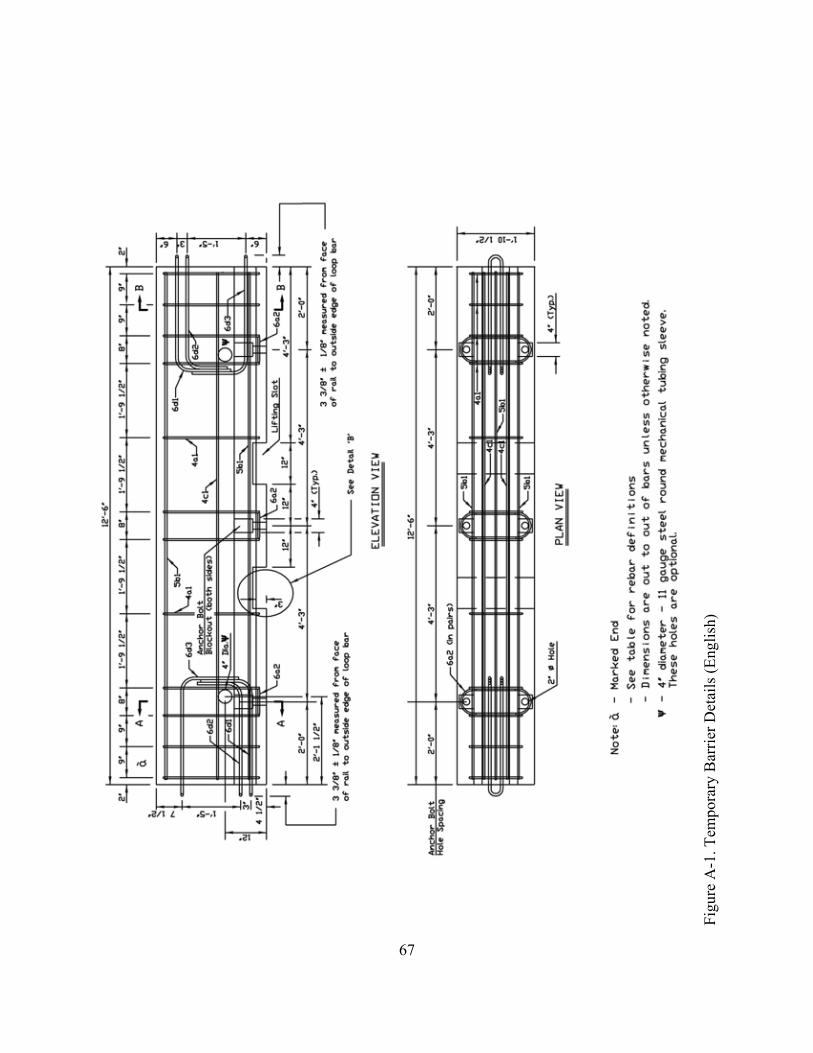
67
Figu
re A
-1. T
empo
rary
Bar
rier D
etai
ls (E
nglis
h)

68
Figure A-2. Temporary Barrier Profile and Tie-Down Details (English)
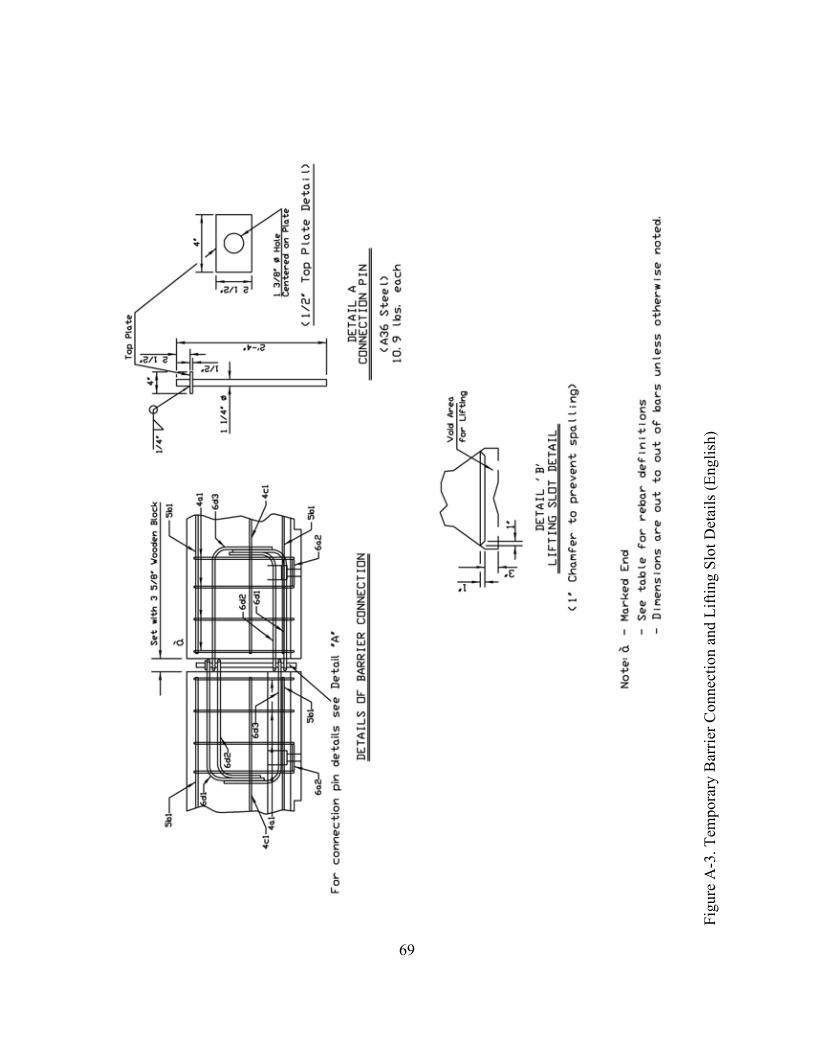
69
Figu
re A
-3. T
empo
rary
Bar
rier C
onne
ctio
n an
d Li
fting
Slo
t Det
ails
(Eng
lish)
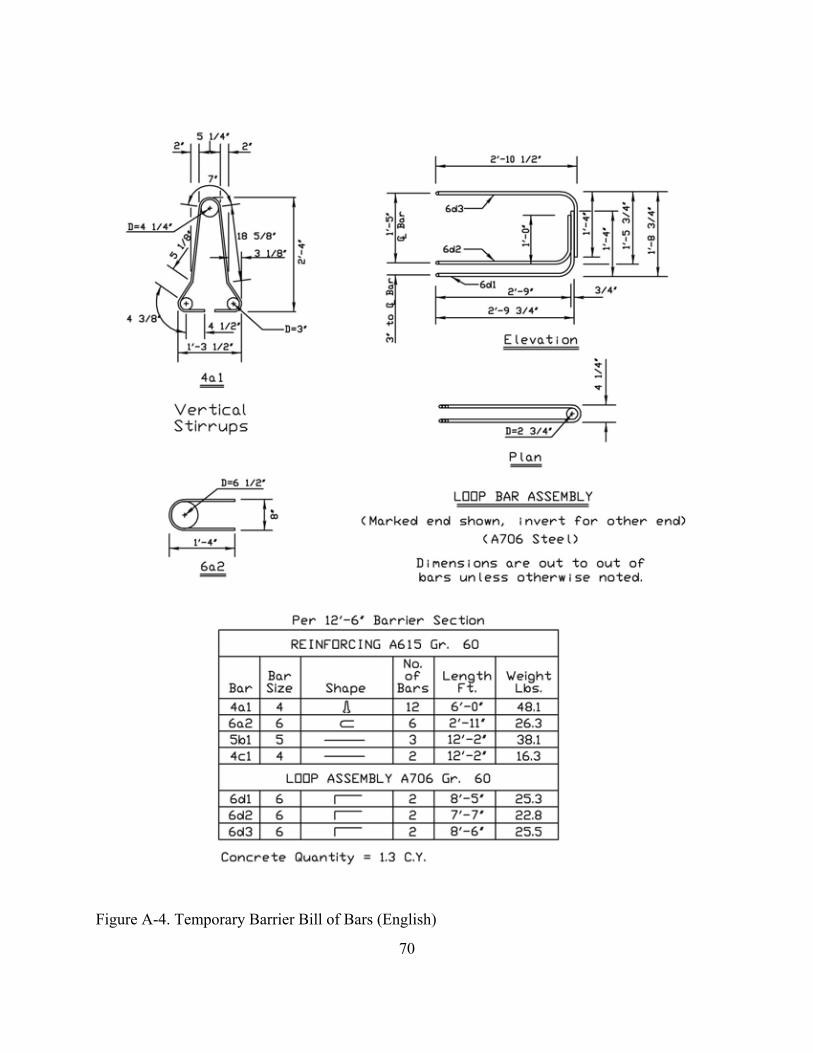
70
Figure A-4. Temporary Barrier Bill of Bars (English)

71
Figu
re A
-5. C
onne
ctio
n to
Iow
a Te
mpo
rary
Bar
rier D
etai
ls (E
nglis
h)

72
Figu
re A
-6. D
ista
nces
Bet
wee
n Te
mpo
rary
Bar
riers
(Eng
lish)

73
APPENDIX B
State Plans of the Redesigned Temporary Barrier Details
Figure B-1. Kansas State Plans (Metric)
Figure B-2. Kansas State Plans (English)
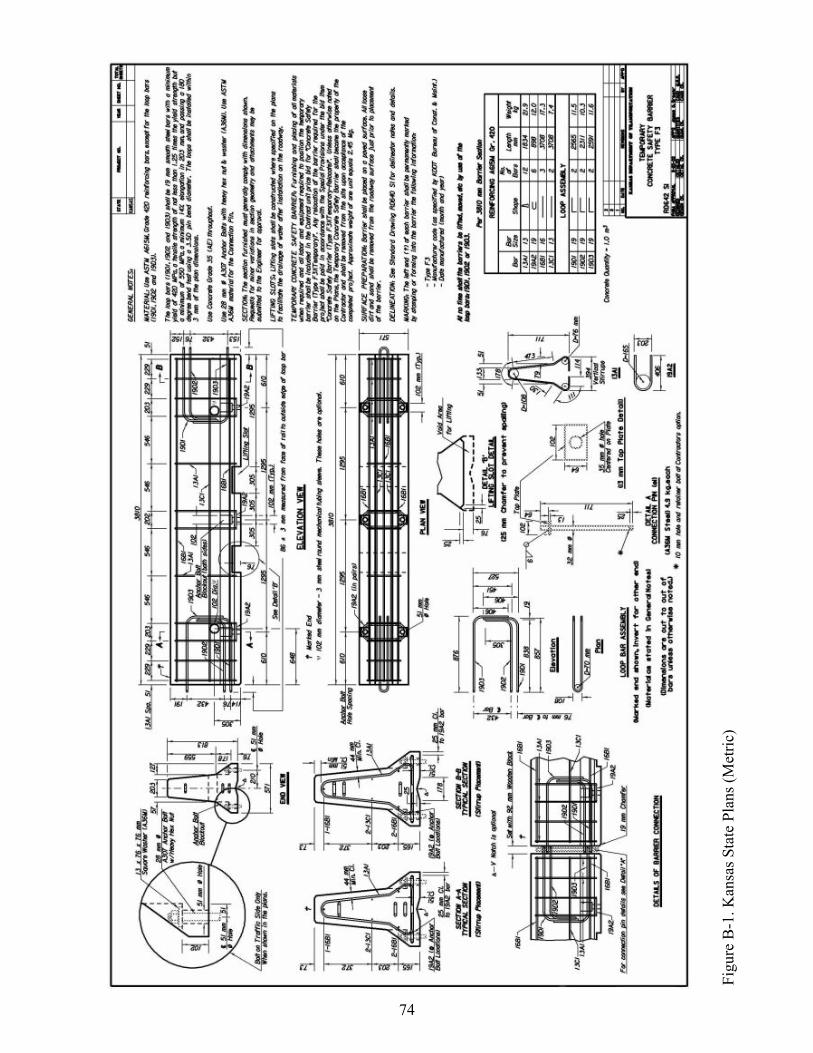
74
Figu
re B
-1. K
ansa
s Sta
te P
lans
(Met
ric)
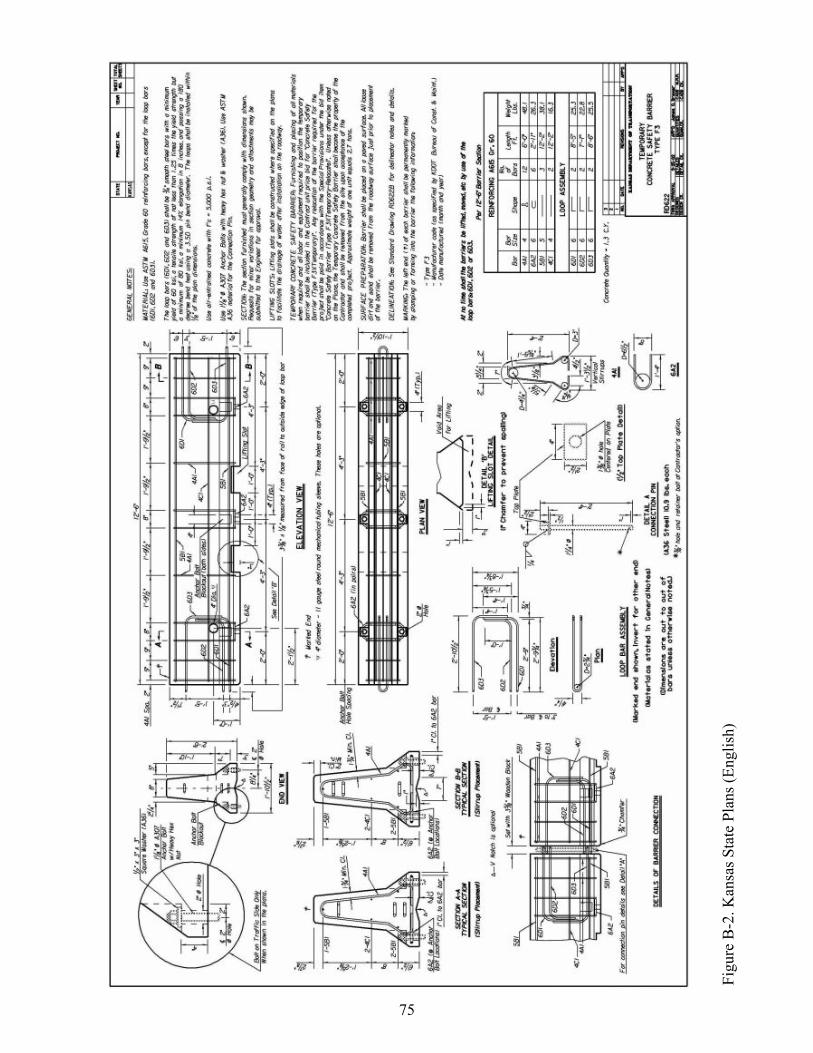
75
Figu
re B
-2. K
ansa
s Sta
te P
lans
(Eng
lish)

76
APPENDIX C
Epoxy Specifications used with the Tie-Down Anchors
Figure C-1. Type of Epoxy
Figure C-2. Epoxy Specifications

77
Figu
re C
-1. T
ype
of E
poxy
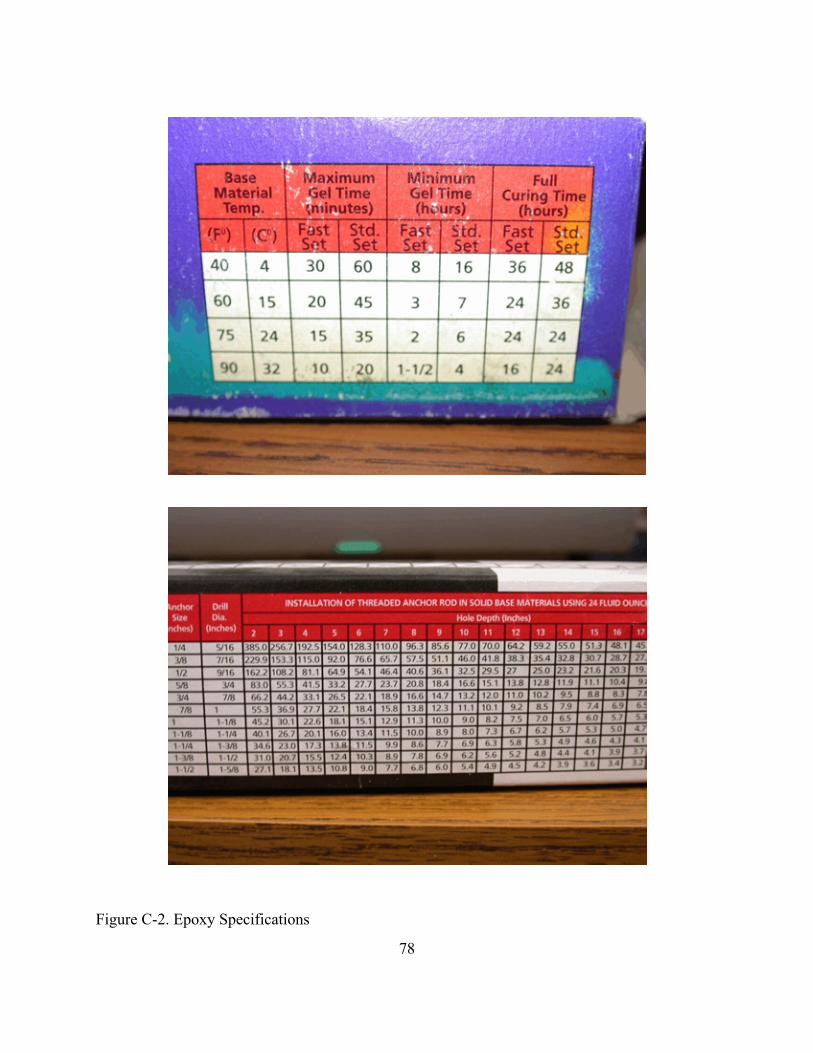
78
Figure C-2. Epoxy Specifications

79
APPENDIX D
Test Summary Sheet in English Units, Test KTB-1
Figure D-1. Summary of Test Results and Sequential Photographs (English), Test KTB-1
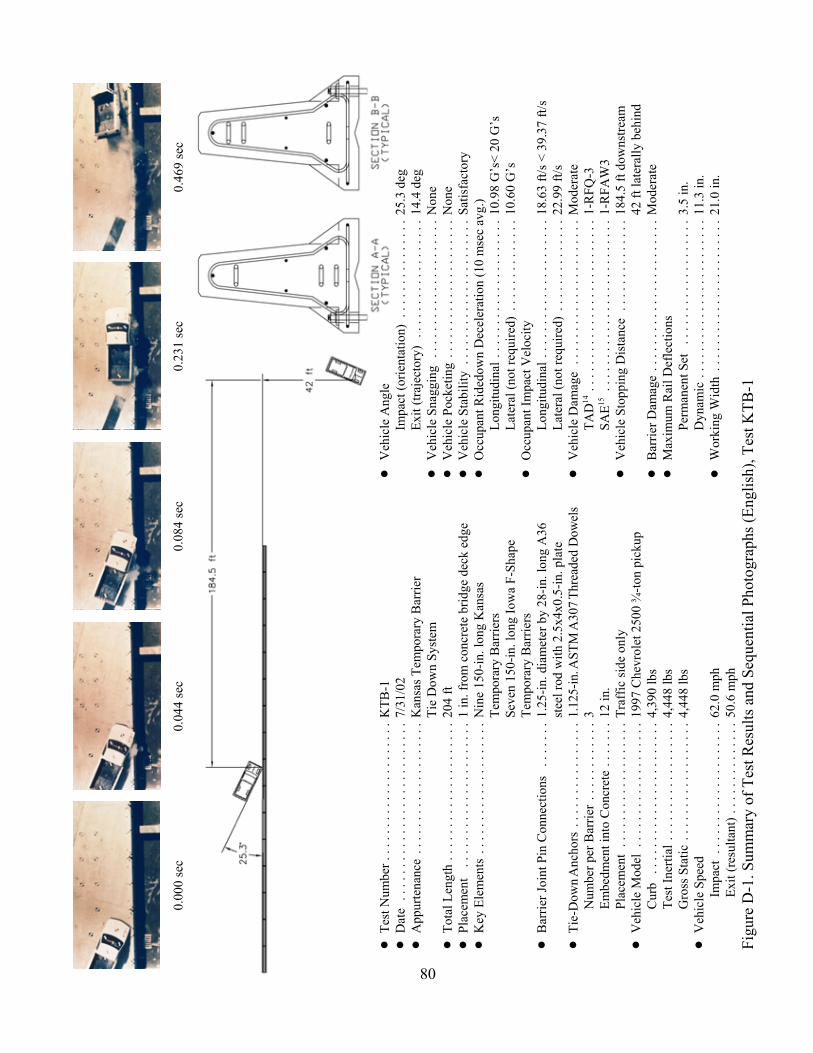
80
0.04
4 se
c0.
084
sec
0.23
1 se
c0.
469
sec
0.00
0 se
c
!Te
st N
umbe
r...
....
....
....
....
..K
TB-1
!D
ate
....
....
....
....
....
....
...7
/31/
02!
App
urte
nanc
e..
....
....
....
....
..K
ansa
s Tem
pora
ry B
arrie
rTi
e D
own
Syst
em!
Tota
l Len
gth
....
....
....
....
....
.204
ft!
Plac
emen
t ..
....
....
....
....
....
1 in
. fro
m c
oncr
ete
brid
ge d
eck
edge
!K
ey E
lem
ents
....
....
....
....
....
Nin
e 15
0-in
. lon
g K
ansa
s Te
mpo
rary
Bar
riers
Seve
n 15
0-in
. lon
g Io
wa
F-Sh
ape
Tem
pora
ry B
arrie
rs!
Bar
rier J
oint
Pin
Con
nect
ions
....
...1
.25-
in. d
iam
eter
by
28-in
. lon
g A
36st
eel r
od w
ith 2
.5x4
x0.5
-in. p
late
!Ti
e-D
own A
ncho
rs..
....
....
....
..1.
125-
in. A
STM
A30
7 Thr
eade
d D
owel
sN
umbe
r per
Bar
rier
....
....
....
3Em
bedm
ent i
nto
Con
cret
e..
....
.12
in.
Plac
emen
t..
....
....
....
....
.Tra
ffic
side
onl
y!
Veh
icle
Mod
el..
....
....
....
....
.199
7 C
hevr
olet
250
0 ¾
-ton
pick
upC
urb
....
....
....
....
....
...4
,390
lbs
Test
Iner
tial.
....
....
....
....
.4,4
48 lb
sG
ross
Sta
tic..
....
....
....
....
4,44
8 lb
s!
Veh
icle
Spe
edIm
pact
....
....
....
....
....
62.0
mph
Exit
(res
ulta
nt).
....
....
....
.50.
6 m
ph
!V
ehic
le A
ngle
Impa
ct (o
rient
atio
n)..
....
....
....
.25.
3 de
gEx
it (tr
ajec
tory
)..
....
....
....
....
14.4
deg
!V
ehic
le S
nagg
ing
....
....
....
....
....
.Non
e !
Veh
icle
Poc
ketin
g..
....
....
....
....
...N
one
!V
ehic
le S
tabi
lity
....
....
....
....
....
..Sa
tisfa
ctor
y!
Occ
upan
t Rid
edow
n D
ecel
erat
ion
(10
mse
c av
g.)
Long
itudi
nal.
....
....
....
....
....
10.9
8 G
’s<
20 G
’sLa
tera
l (no
t req
uire
d)..
....
....
....
10.6
0 G
’s!
Occ
upan
t Im
pact
Vel
ocity
Long
itudi
nal.
....
....
....
....
....
18.6
3 ft/
s < 3
9.37
ft/s
Late
ral (
not r
equi
red)
....
....
....
..22
.99
ft/s
!V
ehic
le D
amag
e..
....
....
....
....
....
Mod
erat
eTA
D14
....
....
....
....
....
....
..1-
RFQ
-3SA
E15..
....
....
....
....
....
....
1-R
FAW
3!
Veh
icle
Sto
ppin
g D
ista
nce
....
....
....
..18
4.5
ft do
wns
tream
42 ft
late
rally
beh
ind
!B
arrie
r Dam
age
....
....
....
....
....
...M
oder
ate
!M
axim
um R
ail D
efle
ctio
nsPe
rman
ent S
et..
....
....
....
....
.3.5
in.
Dyn
amic
....
....
....
....
....
....
11.3
in.
!W
orki
ng W
idth
....
....
....
....
....
...2
1.0
in.
Figu
re D
-1. S
umm
ary
of T
est R
esul
ts a
nd S
eque
ntia
l Pho
togr
aphs
(Eng
lish)
, Tes
t KTB
-1
81
APPENDIX E
Concrete Damage Sketches, Test KTB-1
Figure E-1. Concrete Damage – Front Face Barrier No. 8, Test KTB-1
Figure E-2. Concrete Damage – Back Face Barrier No. 8, Test KTB-1
Figure E-3. Concrete Damage – Front Face Barrier No. 9, Test KTB-1
Figure E-4. Concrete Damage – Back Face Barrier No. 9, Test KTB-1
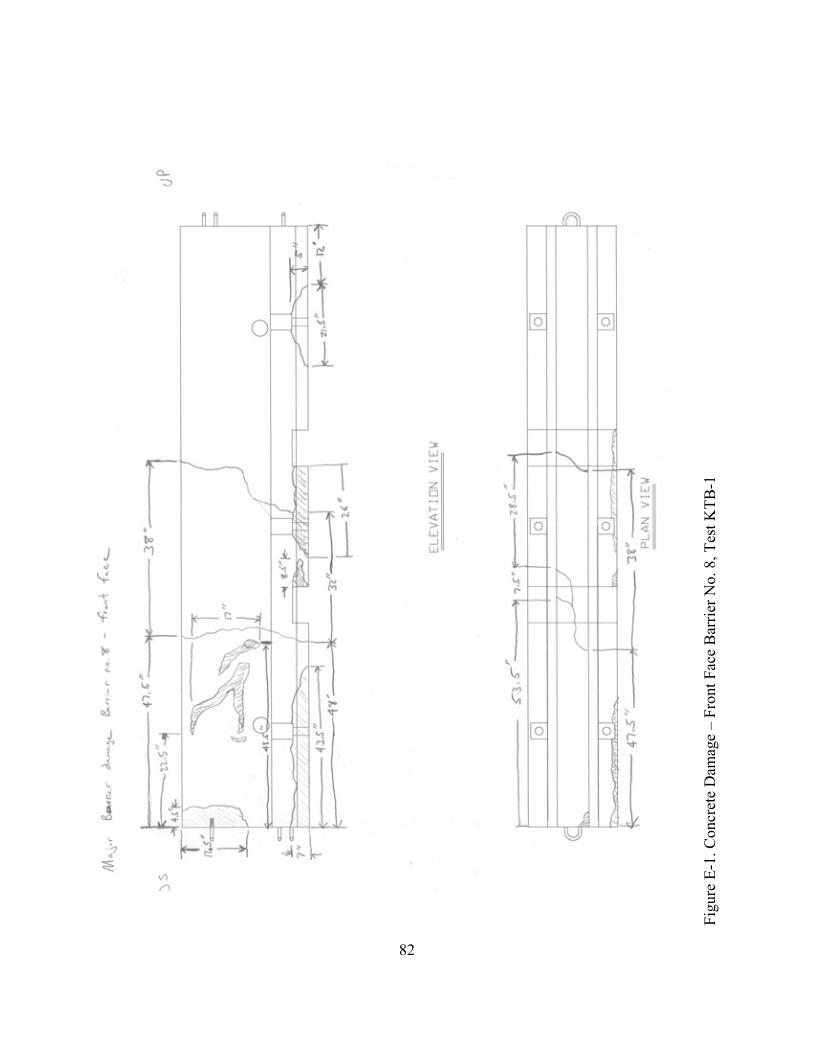
82
Figu
re E
-1. C
oncr
ete
Dam
age
– Fr
ont F
ace
Bar
rier N
o. 8
, Tes
t KTB
-1
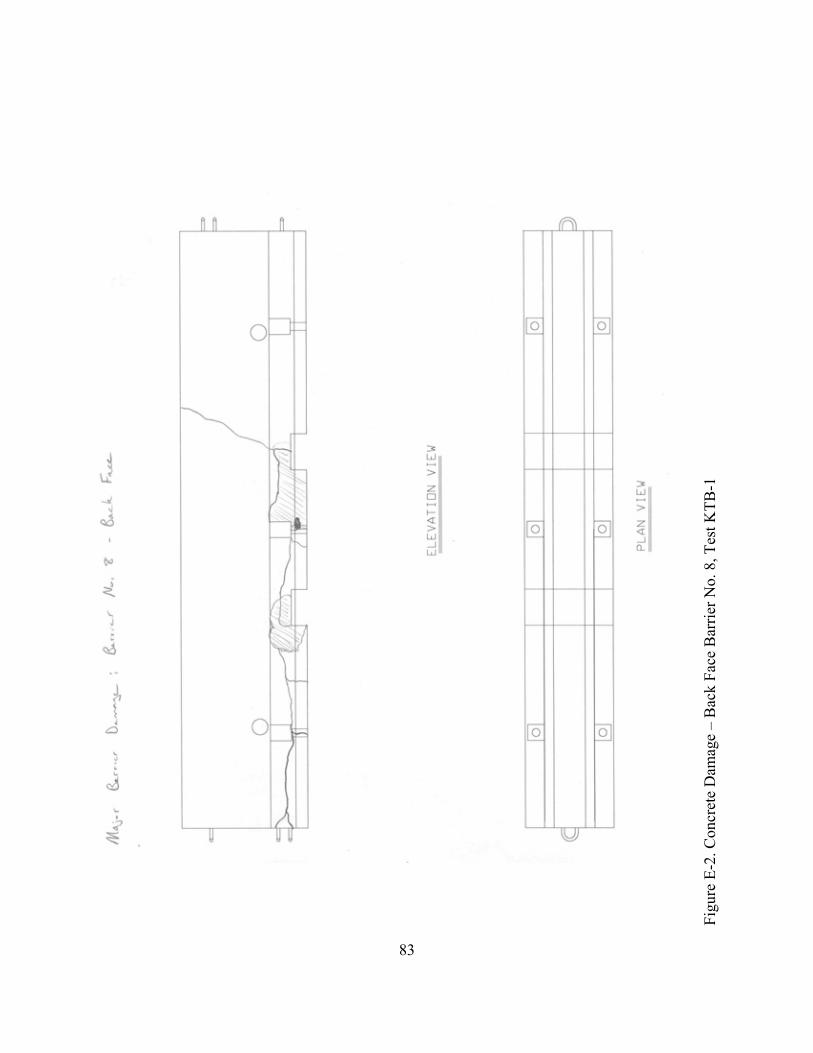
83
Figu
re E
-2. C
oncr
ete
Dam
age
– B
ack
Face
Bar
rier N
o. 8
, Tes
t KTB
-1
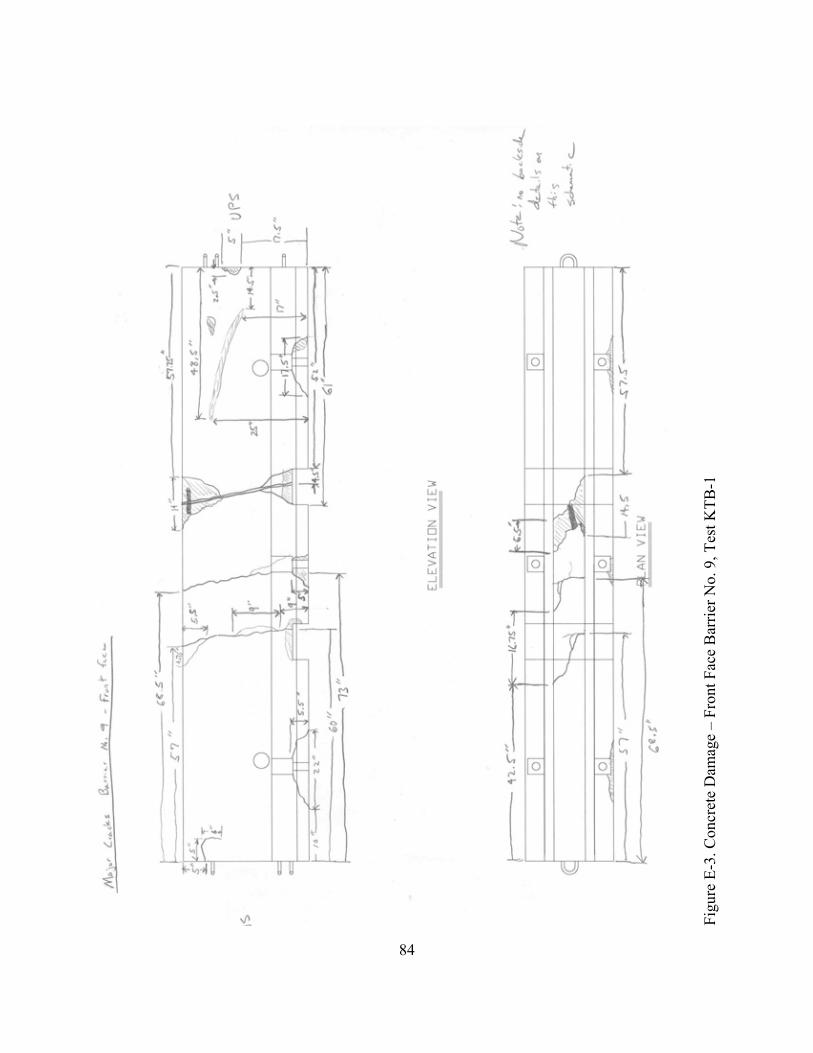
84
Figu
re E
-3. C
oncr
ete
Dam
age
– Fr
ont F
ace
Bar
rier N
o. 9
, Tes
t KTB
-1
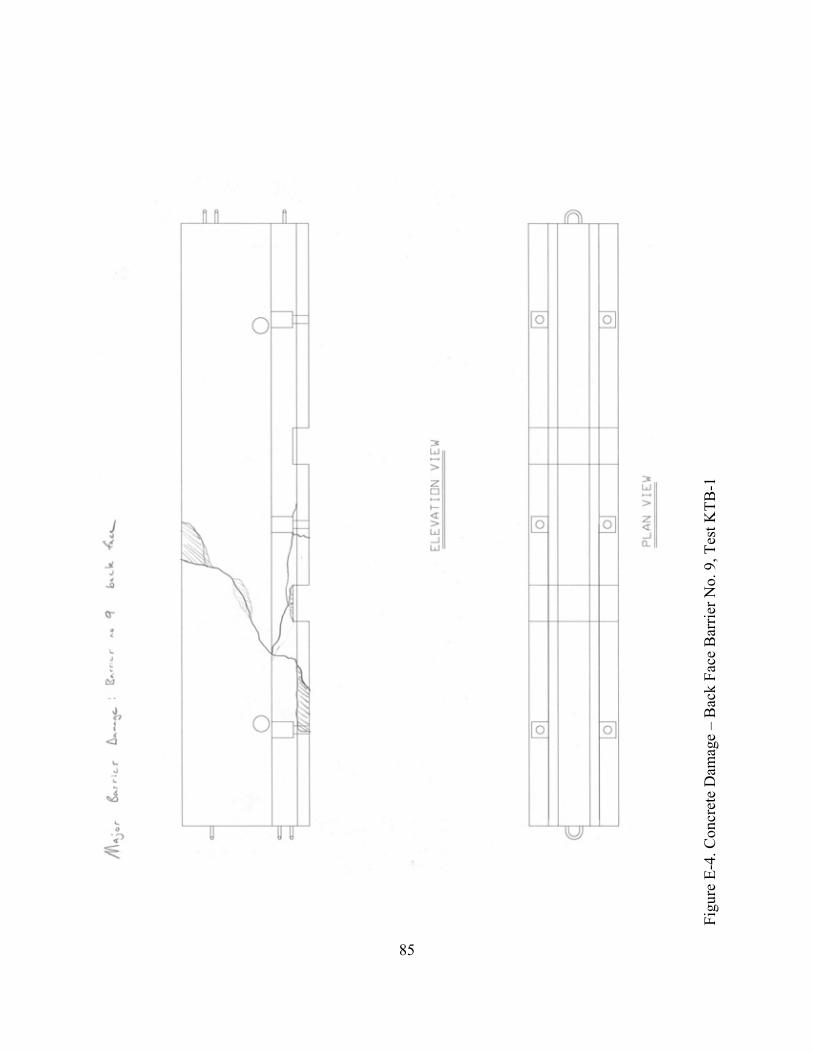
85
Figu
re E
-4. C
oncr
ete
Dam
age
– B
ack
Face
Bar
rier N
o. 9
, Tes
t KTB
-1

86
APPENDIX F
Occupant Compartment Deformation Data, Test KTB-1
Figure F-1. Occupant Compartment Deformation Data, Test KTB-1

87
Figure F-1. Occupant Compartment Deformation Data, Test KTB-1
88
APPENDIX G
Accelerometer Data Analysis, Test KTB-1
Figure G-1. Graph of Longitudinal Deceleration, Test KTB-1
Figure G-2. Graph of Longitudinal Occupant Impact Velocity, Test KTB-1
Figure G-3. Graph of Longitudinal Occupant Displacement, Test KTB-1
Figure G-4. Graph of Lateral Deceleration, Test KTB-1
Figure G-5. Graph of Lateral Occupant Impact Velocity, Test KTB-1
Figure G-6. Graph of Lateral Occupant Displacement, Test KTB-1
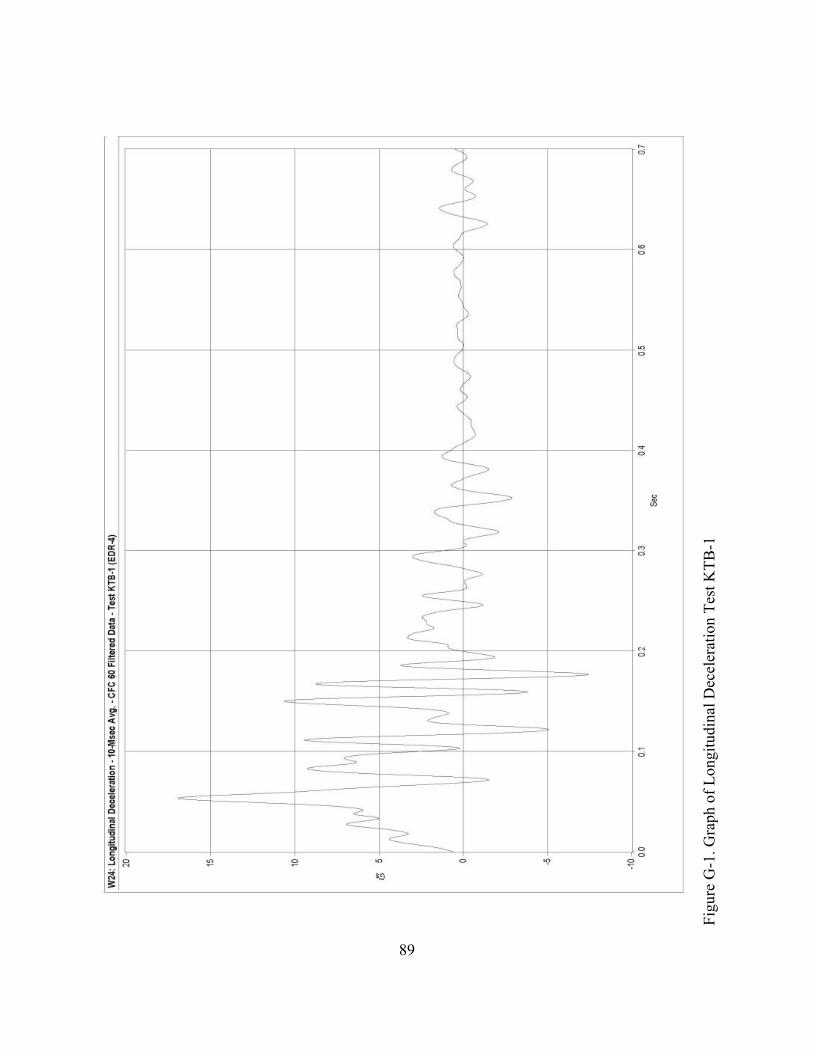
89
Figu
re G
-1. G
raph
of L
ongi
tudi
nal D
ecel
erat
ion
Test
KTB
-1
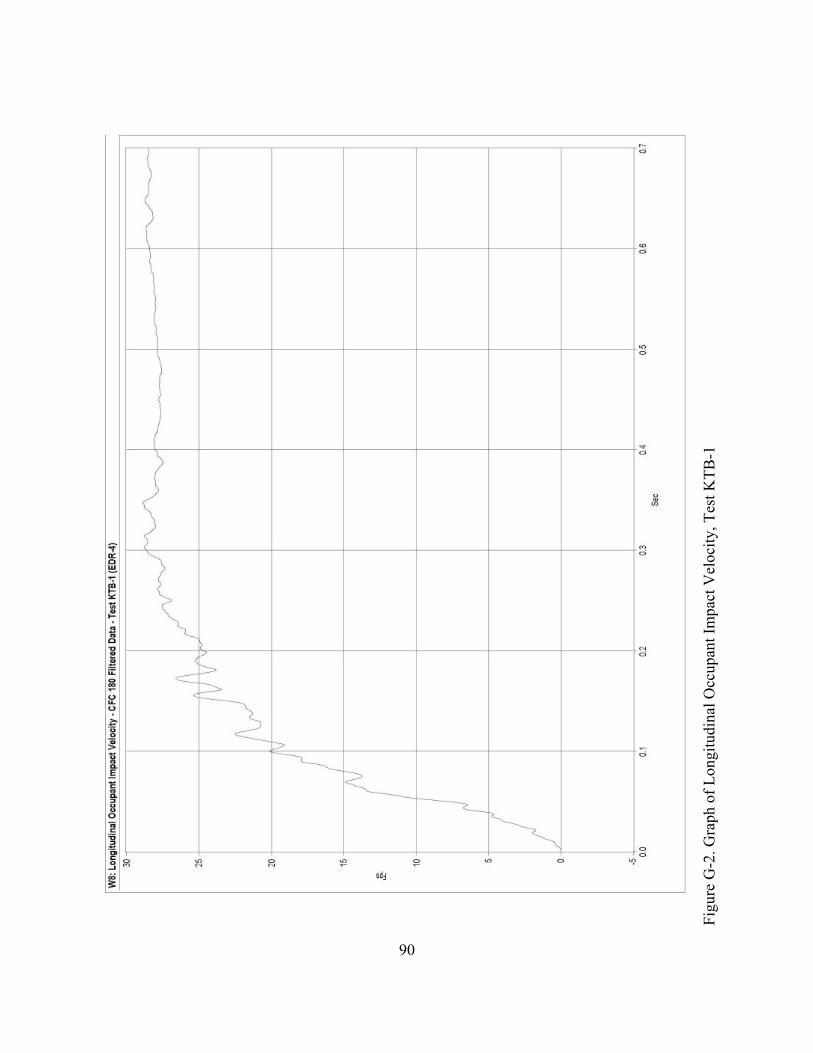
90
Figu
re G
-2. G
raph
of L
ongi
tudi
nal O
ccup
ant I
mpa
ct V
eloc
ity, T
est K
TB-1

91
Figu
re G
-3. G
raph
of L
ongi
tudi
nal O
ccup
ant D
ispl
acem
ent,
Test
KTB
-1

92
Figu
re G
-4. G
raph
of L
ater
al D
ecel
erat
ion,
Tes
t KTB
-1
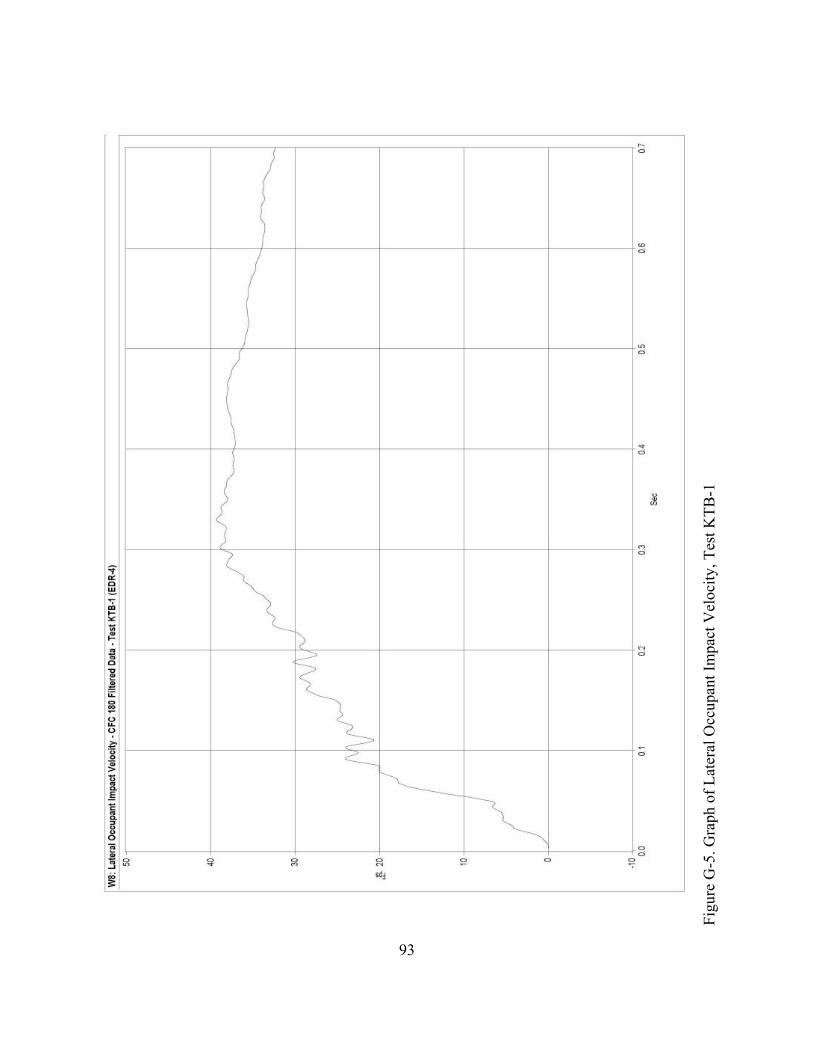
93
Figu
re G
-5. G
raph
of L
ater
al O
ccup
ant I
mpa
ct V
eloc
ity, T
est K
TB-1
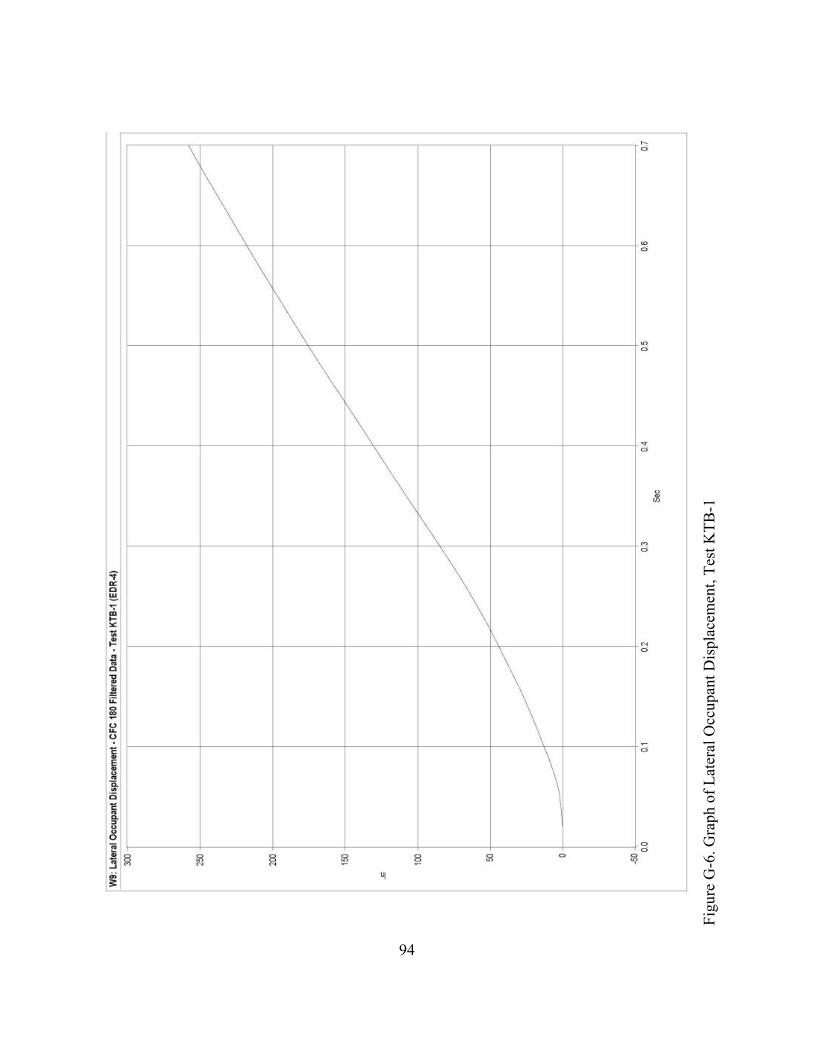
94
Figu
re G
-6. G
raph
of L
ater
al O
ccup
ant D
ispl
acem
ent,
Test
KTB
-1

95
APPENDIX H
Roll and Yaw Data Analysis, Test KTB-1
Figure H-1. Graph of Roll Angular Displacements, Test KTB-1
Figure H-2. Graph of Yaw Angular Displacements, Test KTB-1
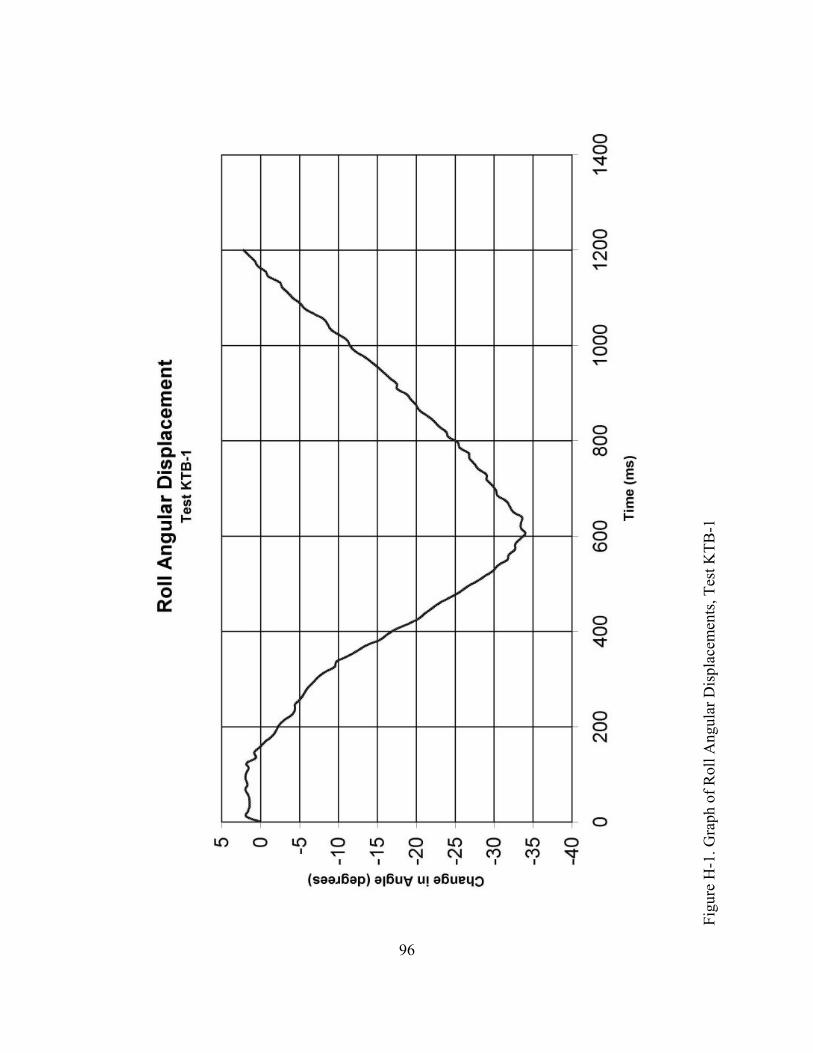
96
Figu
re H
-1. G
raph
of R
oll A
ngul
ar D
ispl
acem
ents
, Tes
t KTB
-1

97
Figu
re H
-2. G
raph
of Y
aw A
ngul
ar D
ispl
acem
ents
, Tes
t KTB
-1