Embed Size (px)
Citation preview
Development and Demonstration of the Truck Activity Monitoring System (TAMS)
ARB Research Seminar July 13, 2016, 1:30 PM PDT
Presented by:
Stephen G. Ritchie, Ph.D. Andre Y.C. Tok, Ph.D. Director Asst. Project Scientist
Institute of Transportation Studies University of California, Irvine
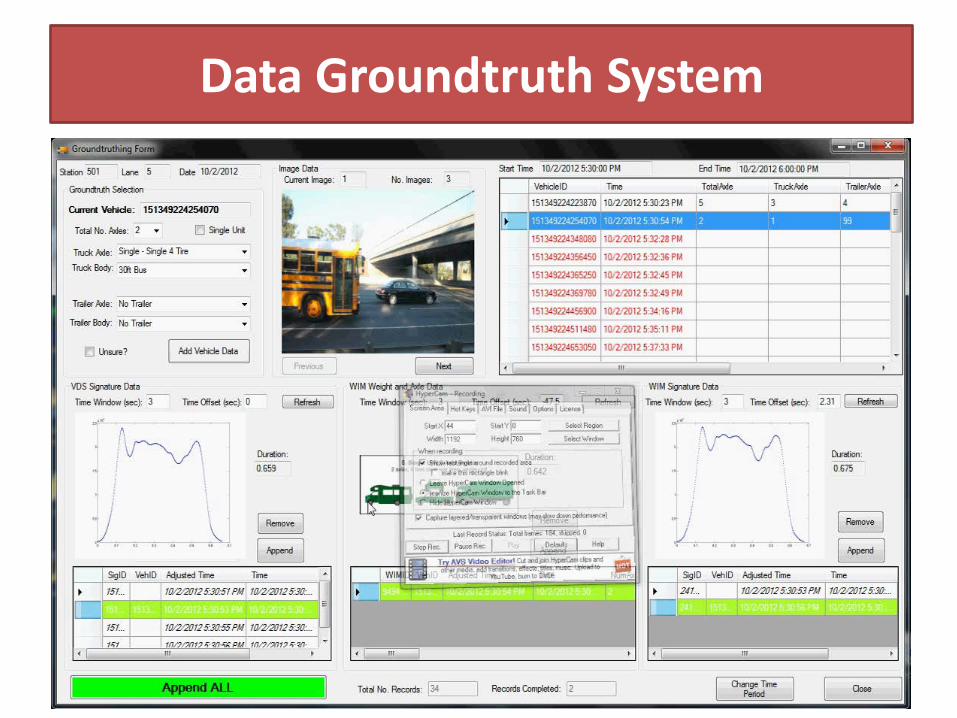
Data Groundtruth System
2

3
Model Design Two Systems of Body Classification Models Developed:
Inductive Signature only Model
(for existing ILD sites)
Integrated WIM and Inductive Signature Model
(for existing WIM sites)
1st to 2nd 3rd to 4th 4th to 5th2nd to 3rdAxle Spacing
WIM Site Data
Inductive Signature Dat a
Axle Weights + Axle Count, Gross Vehicle Weight, Vehicle Length
Inductive Signature Dat a
Duration

Body Classification Architecture: Two Systems of Models Signature Only Model System WIM and Signature Model System
4
Tier
1Ti
er 2
Tier
3
Single-Units Multi-Units
Signature Data
13 Classes
8 Classes
19 Classes
7 Classes
Single Unit Truck
Single Unit w/ Trailer
Tractor w/ Semi Trailer
Multiple Trailers
Passenger Vehicle
Paired WIM and Signature Data
FHWA Class 4
FHWAClass 5 - 13
FHWA Class 14
4 classes
Trailer Detection*
10 to 16 classes 5 classes
FHWAClass 5 - 13 FHWA
Class 5 - 13 FHWA
Class 5 - 13
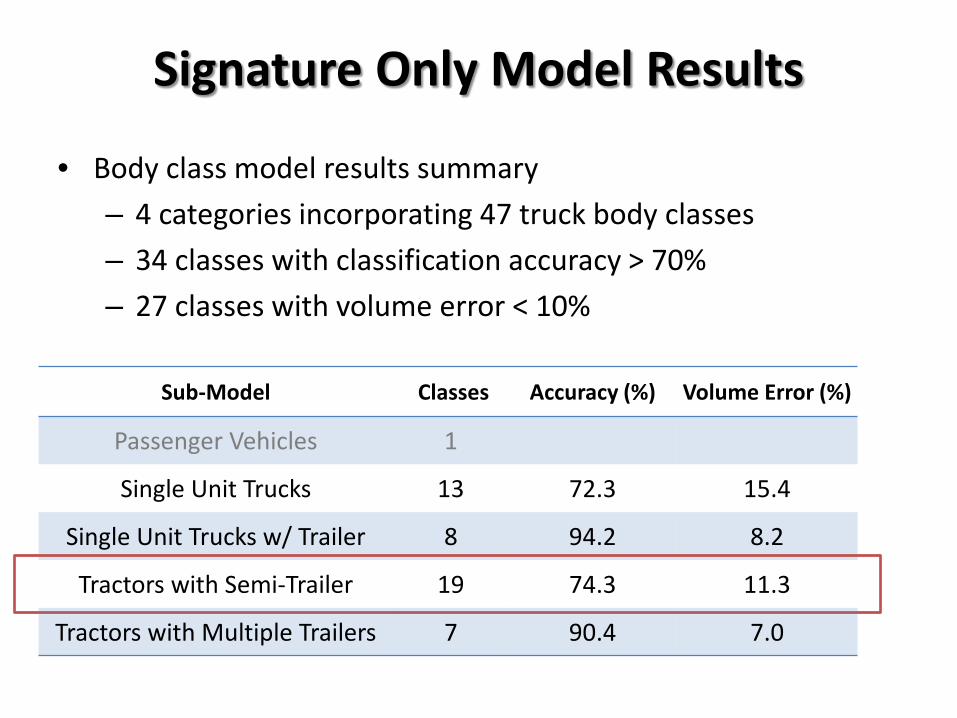
Signature Only Model Results
• Body class model results summary – 4 categories incorporating 47 truck body classes – 34 classes with classification accuracy > 70% – 27 classes with volume error < 10%
Sub-Model Classes Accuracy (%) Volume Error (%)
Passenger Vehicles 1
Single Unit Trucks 13 72.3 15.4
Single Unit Trucks w/ Trailer 8 94.2 8.2
Tractors with Semi-Trailer 19 74.3 11.3
Tractors with Multiple Trailers 7 90.4 7.0
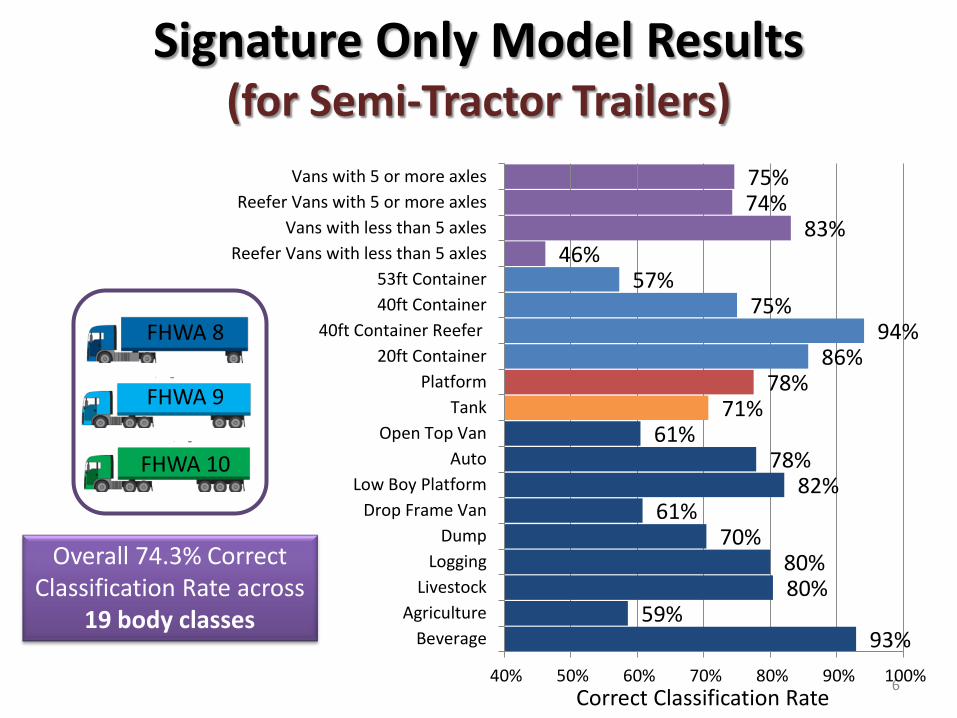
Signature Only Model Results (for Semi-Tractor Trailers)
Vans with 5 or more axles Reefer Vans with 5 or more axles
Vans with less than 5 axles Reefer Vans with less than 5 axles
53ft Container 40ft Container
40ft Container Reefer 20ft Container
Platform Tank
Open Top Van Auto
Low Boy Platform Drop Frame Van
Dump Logging
Livestock Agriculture
Beverage
FHWA 8
FHWA 9
FHWA 10
Overall 74.3% Correct Classification Rate across
19 body classes
6
75% 74%
83% 46%
57% 75%
94% 86%
78% 71%
61% 78%
82% 61%
70% 80% 80%
59% 93%
40% 50% 60% 70% 80% 90% 100% Correct Classification Rate

Integrated (WIM + Signature) Model Results
- System of 9 sub-models with 63 body classes - 52 classes with classification accuracy > 70% - 37 classes with volume error < 10%
Accuracy Volume Error Model Classes (%) (%)
FHWA 4 4 95.2 9.7 FHWA 5 10 75.3 6.8 FHWA 6 8 80.5 9.2 FHWA 7 4 100.0 0.0 FHWA 8 5 90.9 4.2
FHWA 9 Semi Tractors 16 75.4 12.2 FHWA 9 Single Trailers 5 96.7 1.7
FHWA 10 4 92.3 7.7 FHWA 11 and 12 7 92.7 8.0
7
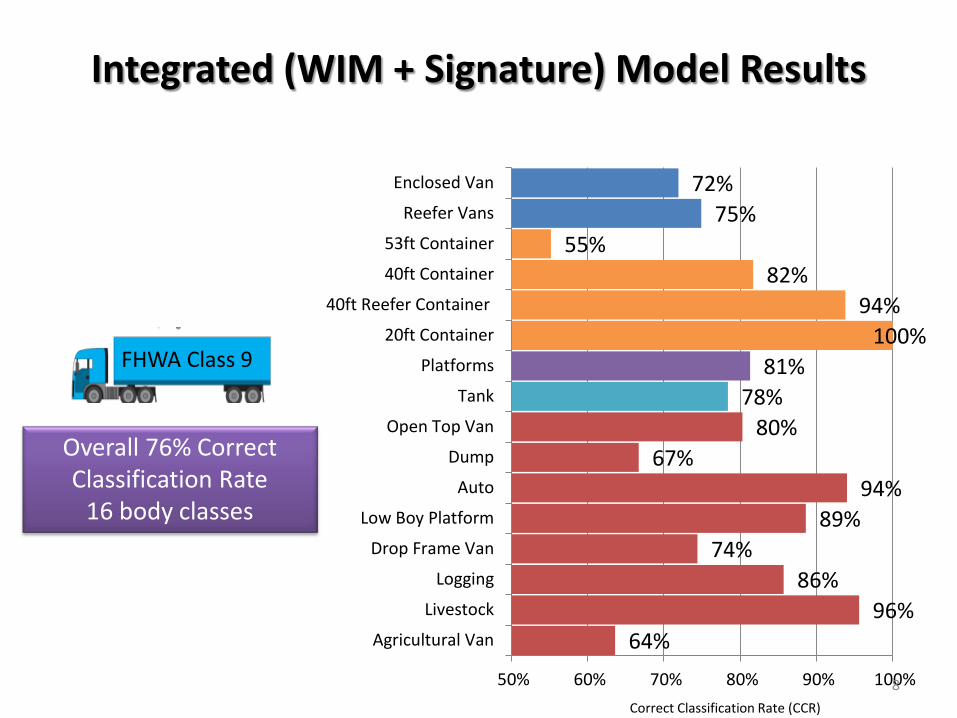
Integrated (WIM + Signature) Model Results
FHWA Class 9
Overall 76% Correct Classification Rate
16 body classes
Enclosed Van
Reefer Vans
53ft Container
40ft Container
40ft Reefer Container
20ft Container
Platforms
Tank
Open Top Van
Dump
Auto
Low Boy Platform
Drop Frame Van
Logging
Livestock
Agricultural Van
72% 75%
55% 82%
94% 100%
81% 78%
80% 67%
94% 89%
74% 86%
96% 64%
50% 60% 70% 80% 90% 100% Correct Classification Rate (CCR)
8
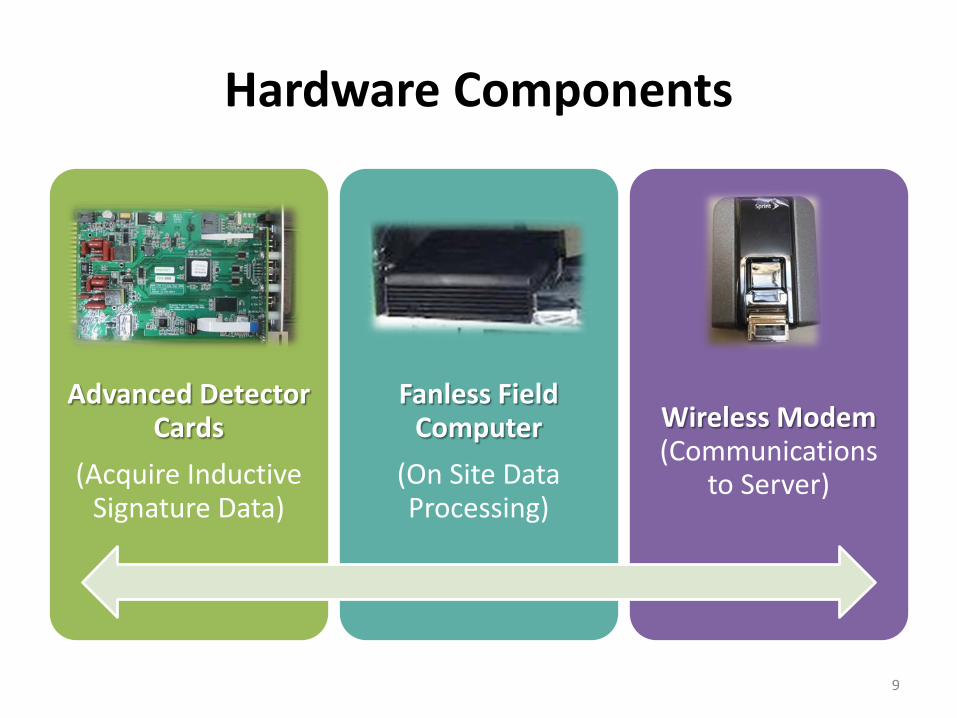
Hardware Components
Advanced Detector Cards
(Acquire Inductive Signature Data)
Fanless Field Computer
(On Site Data Processing)
Wireless Modem (Communications
to Server)
9
10
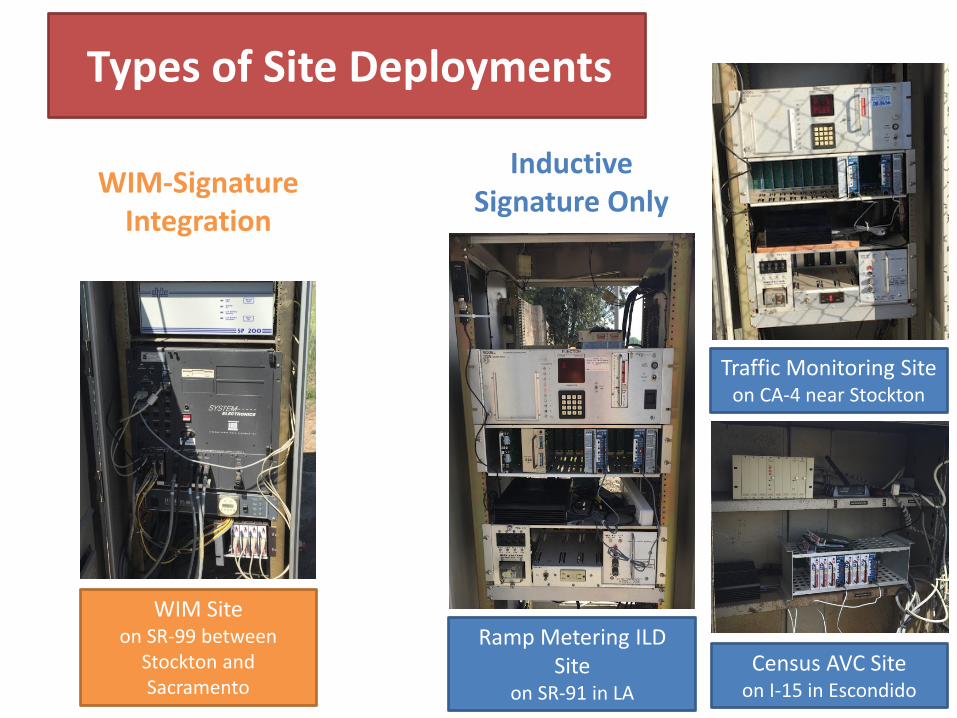
Types of Site Deployments
Inductive WIM-Signature Signature Only Integration
Traffic Monitoring Site on CA-4 near Stockton
Ramp Metering ILD Site
on SR-91 in LA
WIM Site on SR-99 between
Stockton and Sacramento
Census AVC Site on I-15 in Escondido
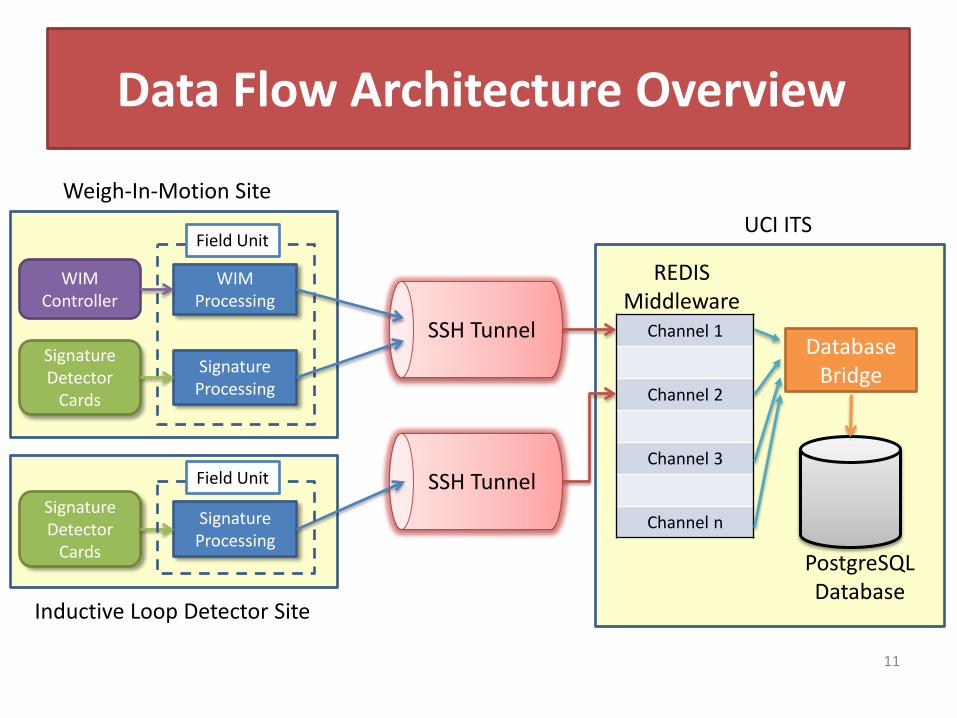
Data Flow Architecture Overview
Weigh-In-Motion Site UCI ITS
WIM Processing
Signature Processing
Signature Detector
Cards
SSH Tunnel
WIM Controller
Channel 1
Channel 2
Channel 3
Channel n
Field Unit
REDIS Middleware
Signature Processing
Signature Detector
Cards
SSH Tunnel Field Unit
Database Bridge
PostgreSQL Database
Inductive Loop Detector Site
11

LIVE DEMO
1. Live Signature Transmission 2. Walk Through TAMS Web Interface
12
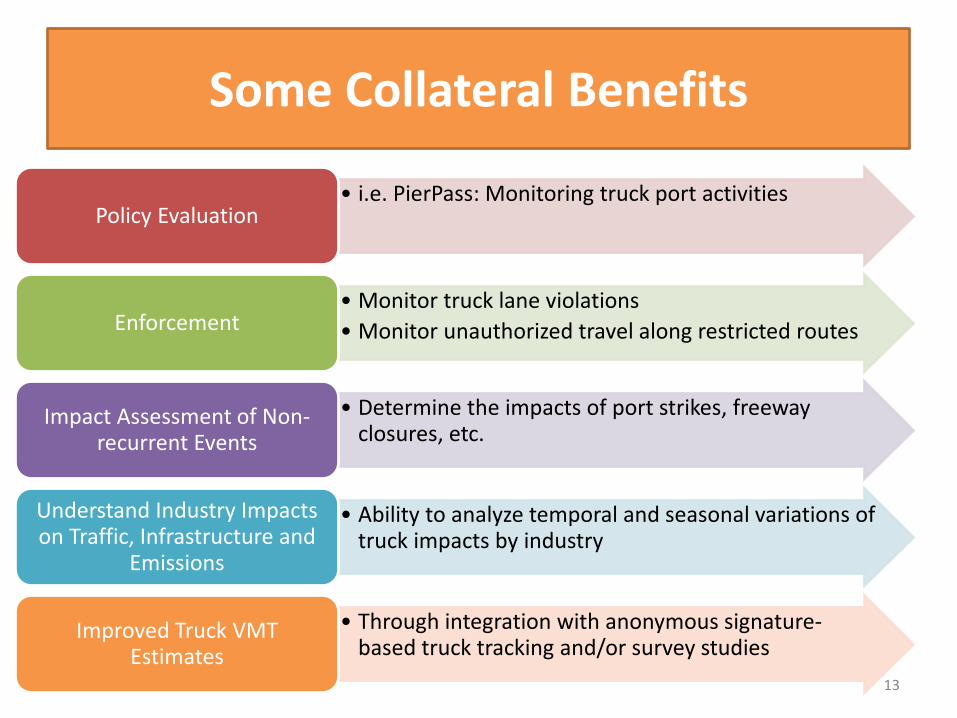
Some Collateral Benefits
• i.e. PierPass: Monitoring truck port activities Policy Evaluation
• Monitor truck lane violations • Monitor unauthorized travel along restricted routes Enforcement
• Determine the impacts of port strikes, freeway closures, etc.
Impact Assessment of Non-recurrent Events
• Ability to analyze temporal and seasonal variations of truck impacts by industry
Understand Industry Impacts on Traffic, Infrastructure and
Emissions
• Through integration with anonymous signature-based truck tracking and/or survey studies
Improved Truck VMT Estimates
13

Just Getting Started: A platform for future research and applications
• Raw signature data is being continuously archived
• Case in point: Activity inventory of cleaner trucks – Recognize trucks by model
year to obtain activity trends of clean vs older gross-polluting trucks?
14
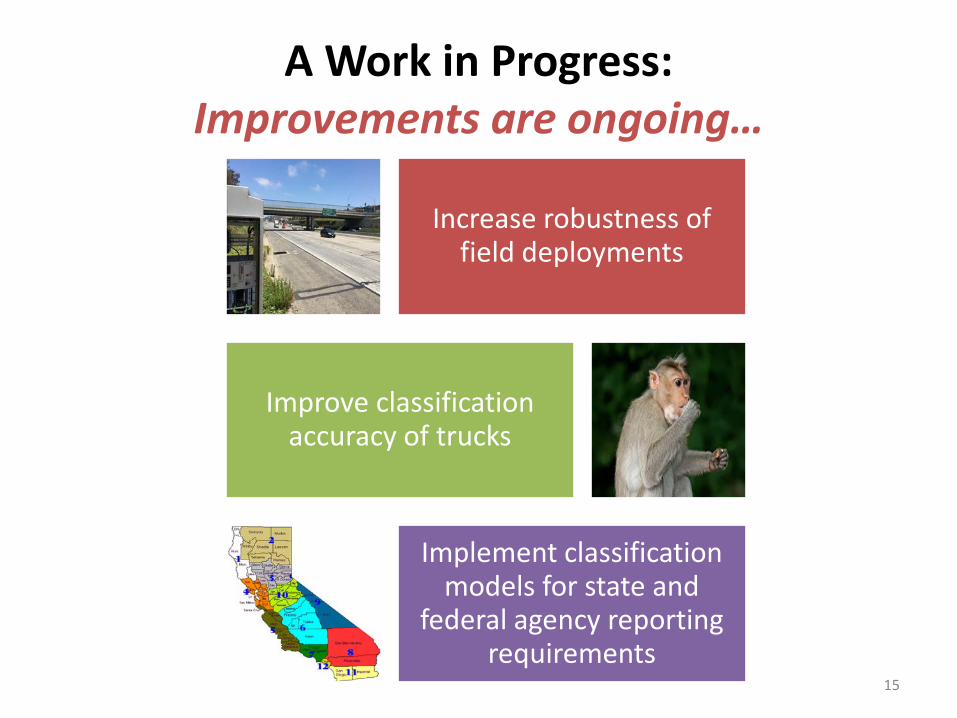
A Work in Progress: Improvements are ongoing…
Increase robustness of field deployments
Improve classification accuracy of trucks
Implement classification models for state and
federal agency reporting requirements
15
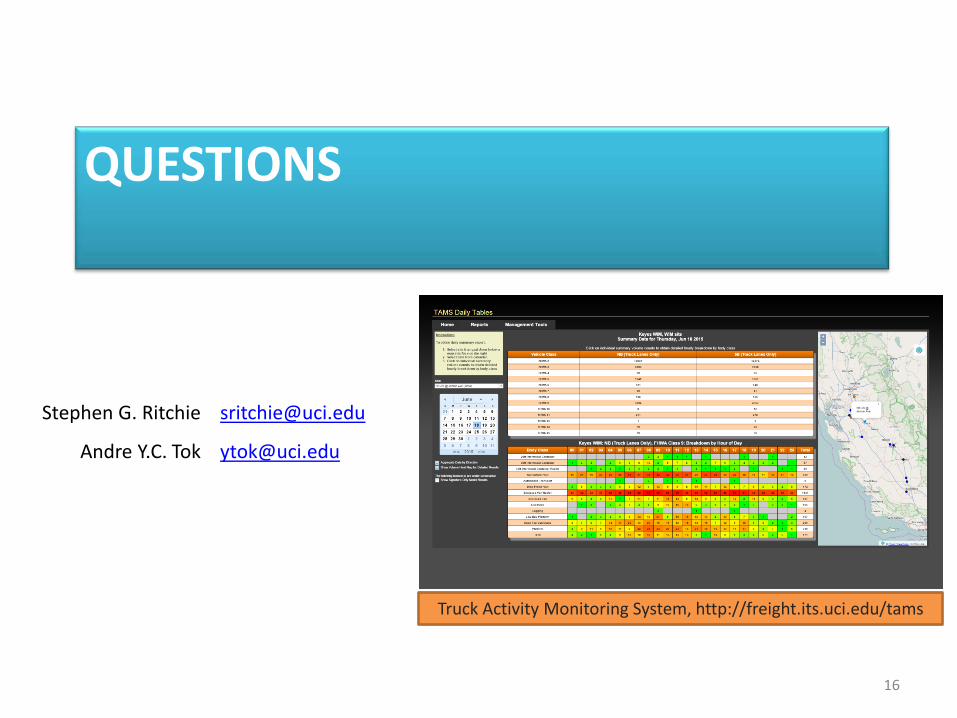
QUESTIONS
Stephen G. Ritchie [email protected]
Andre Y.C. Tok [email protected]
Truck Activity Monitoring System, http://freight.its.uci.edu/tams
16
Model Development
17
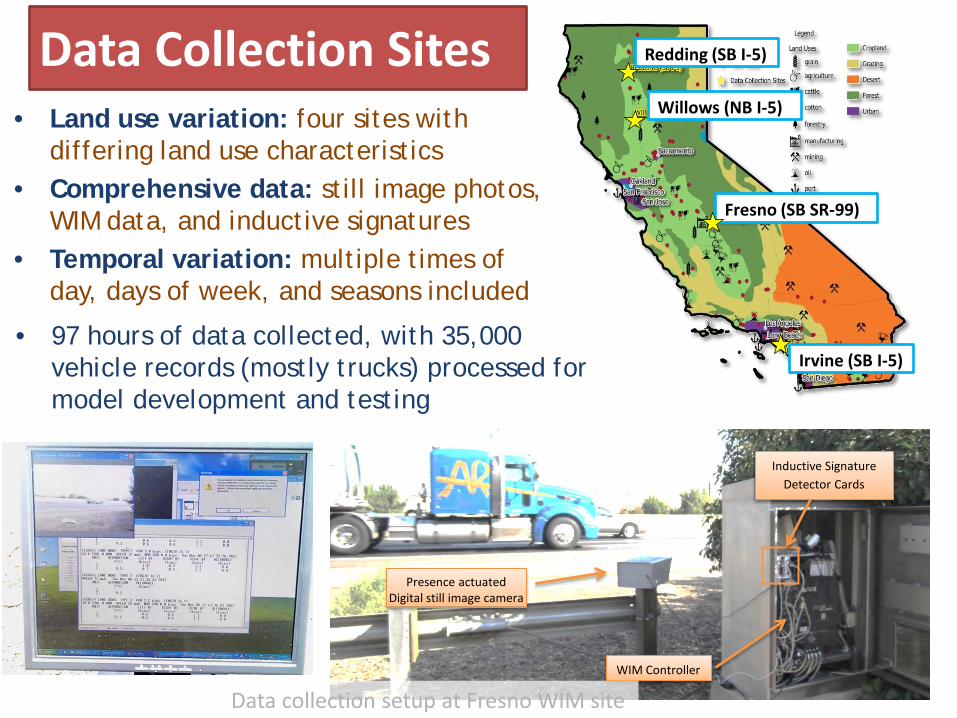
Redding (SB I-5)
Willows (NB I-5)
Fresno (SB SR-99)
Irvine (SB I-5)
Data Collection Sites • Land use variation: four sites with
differing land use characteristics • Comprehensive data: still image photos,
WIM data, and inductive signatures • Temporal variation: multiple times of
day, days of week, and seasons included
• 97 hours of data collected, with 35,000 vehicle records (mostly trucks) processed for model development and testing
18
Presence actuated Digital still image camera
Inductive Signature Detector Cards
WIM Controller
Data collection setup at Fresno WIM site

19
Where it all began… Investigation of Blade Inductive Sensors
Installation of Blade Sensors
• 1st vehicle classification study tofocus primarily on distinguishingdetailed truck configurations
• Utilized a temporary surface mount sensor
• Model capable of identifying over100 truck configurations
Truck crossing inductive sensors
Sensor layout at freeway exit ramp to San Onofre Weigh and Inspection Facility
Double Blade Sensors
Preformed 6’ Round Loop Sensor
20
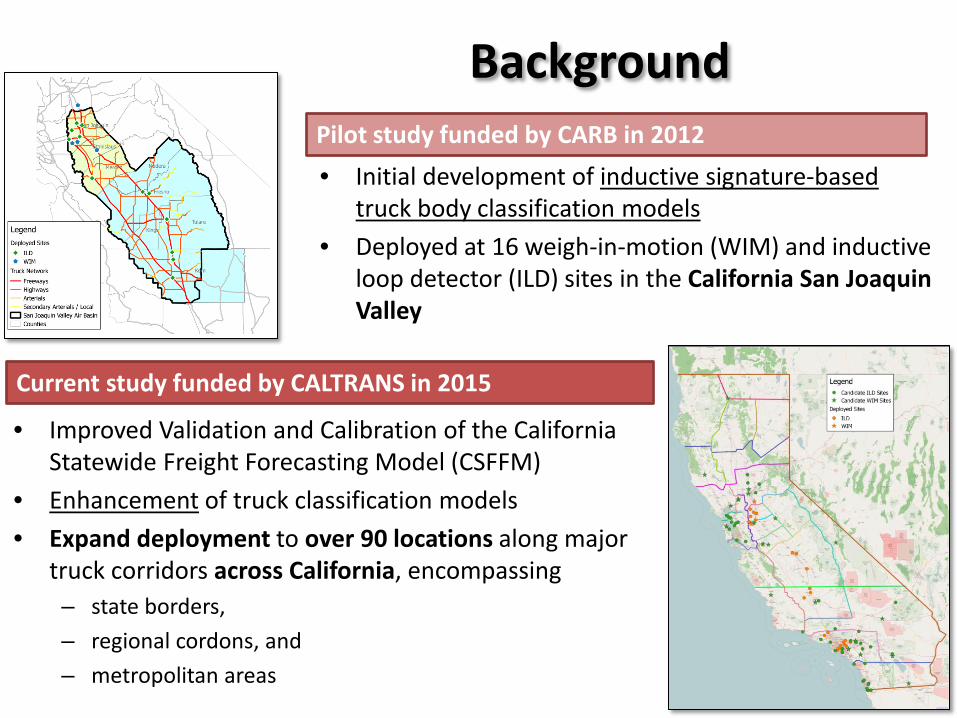
Background
• Improved Validation and Calibration of the California Statewide Freight Forecasting Model (CSFFM)
• Enhancement of truck classification models • Expand deployment to over 90 locations along major
truck corridors across California, encompassing – state borders, – regional cordons, and – metropolitan areas
Pilot study funded by CARB in 2012
Current study funded by CALTRANS in 2015
• Initial development of inductive signature-based truck body classification models
• Deployed at 16 weigh-in-motion (WIM) and inductive loop detector (ILD) sites in the California San Joaquin Valley
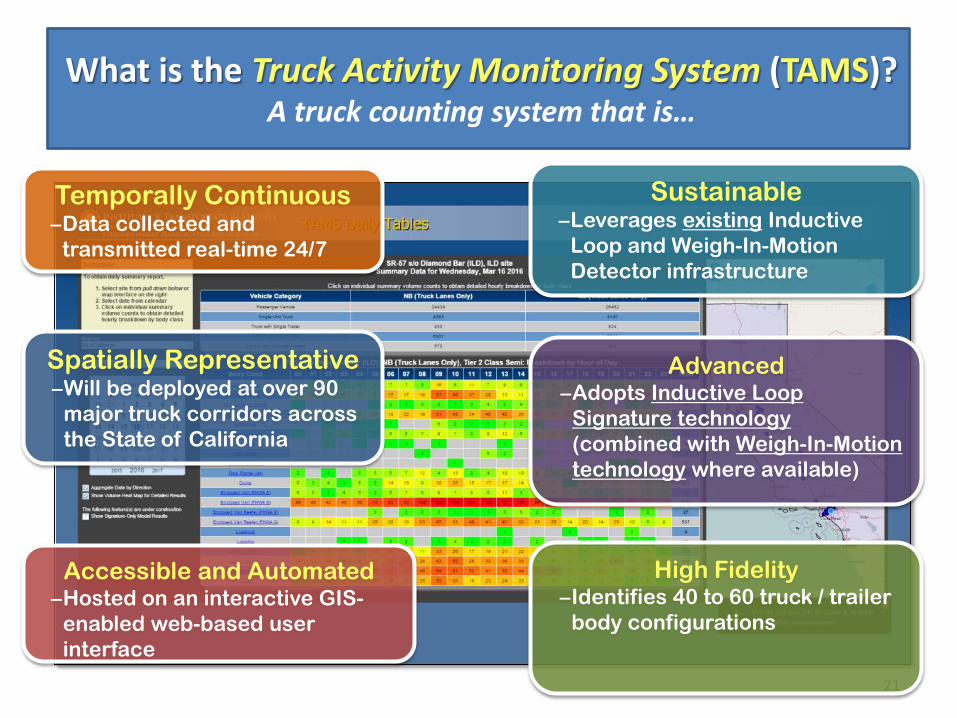
What is the Truck Activity Monitoring System (TAMS)? A truck counting system that is…
21
Spatially Representative –Will be deployed at over 90
major truck corridors across the State of California
Temporally Continuous –Data collected and
transmitted real-time 24/7
Sustainable –Leverages existing Inductive
Loop and Weigh-In-Motion Detector infrastructure
High Fidelity –Identifies 40 to 60 truck / trailer
body configurations
Advanced –Adopts Inductive Loop
Signature technology (combined with Weigh-In-Motion technology where available)
Accessible and Automated –Hosted on an interactive GIS-
enabled web-based user interface

Potential Applications
22
Estimate proportions of freight and non-freight truck movements
Statistics relating to empty movements in freight trucks
Temporal and spatial travel behavior of trucks by industry
Estimate proportions of long and short haul trips along major and
restricted truck corridors
Better understanding of truck travel patterns and
behavior

Detector Technologies Behind TAMS
Two Types of Detector Solutions:
Combined Weigh-In-Motion (WIM) and Inductive Signature
Technology at existing WIM sites
Standalone Inductive Signature
Technology at existing Inductive Loop
Detector sites
23

Weigh-In-Motion Technology Components
• Bending Plates – Measure Wheel/Axle
Weights
Bending Plates
Provides 13 axle-based FHWA classifications (14 in California)
Inductive Loop Sensors Traveled lane on freeway
• Inductive Loop Sensors – Presence detection
Over 100 Data WIM sites in California located along Provide speed, vehicle Major Truck Corridors
length and axle spacing measurements Weigh-In-Motion sensors located
along a freeway
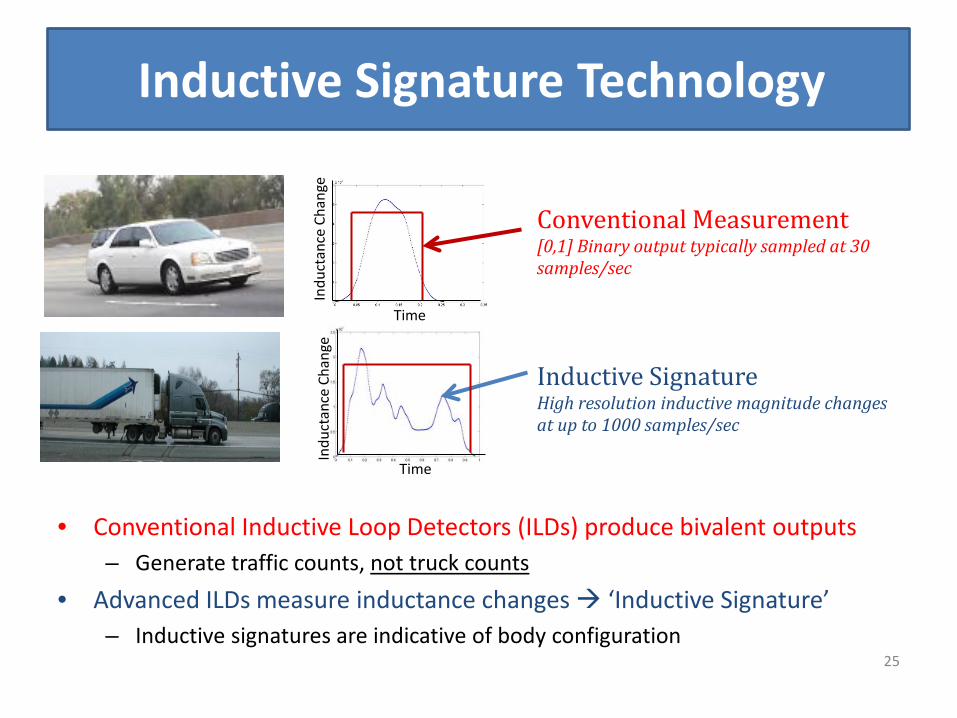
Inductive Signature Technology
Time In
duct
ance
Cha
nge
Time
Indu
ctan
ce C
hang
e
Conventional Measurement [0,1] Binary output typically sampled at 30 samples/sec
Inductive Signature High resolution inductive magnitude changes at up to 1000 samples/sec
• Conventional Inductive Loop Detectors (ILDs) produce bivalent outputs – Generate traffic counts, not truck counts
• Advanced ILDs measure inductance changes ‘Inductive Signature’ – Inductive signatures are indicative of body configuration
25

Sample FHWA Class 9 (5- Axle Semi-Trailer) signatures by trailer configuration
Enclosed Van Livestock Low Boy Platform
Tanks Drop Frame Van Basic Platform
26
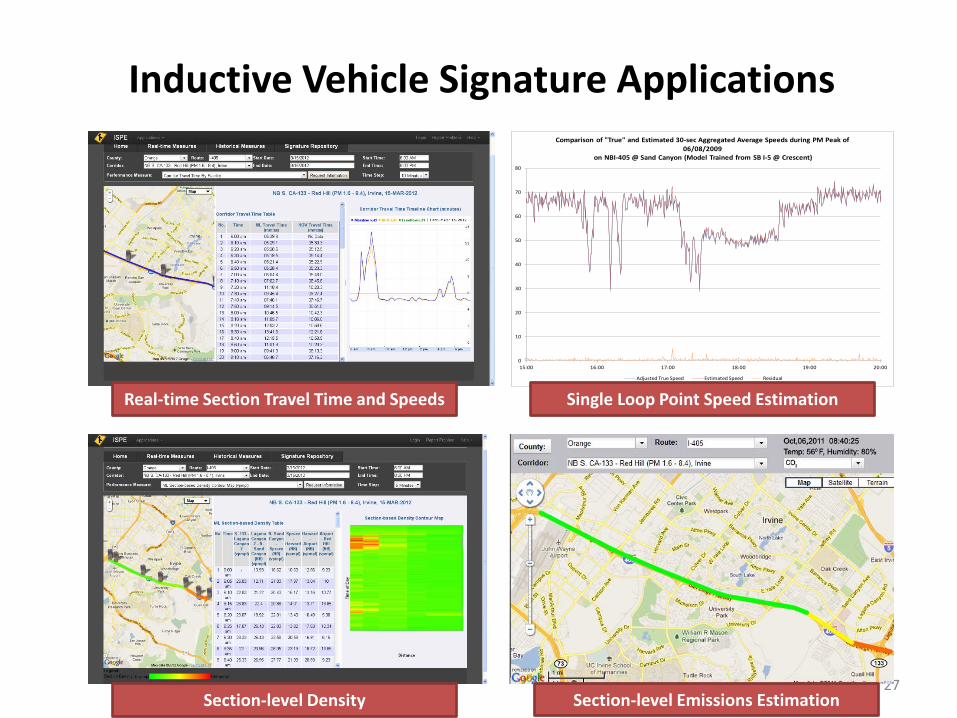
Inductive Vehicle Signature Applications
27
Real-time Section Travel Time and Speeds
Section-level Density Section-level Emissions Estimation
Comparison of "True" and Estimated 30-sec Aggregated Average Speeds during PM Peak of 06/08/2009
on NBI-405 @ Sand Canyon (Model Trained from SB I-5 @ Crescent) 80
70
60
50
40
30
20
10
0 15:00 16:00 17:00 18:00 19:00 20:00
Adjusted True Speed Estimated Speed Residual
Single Loop Point Speed Estimation

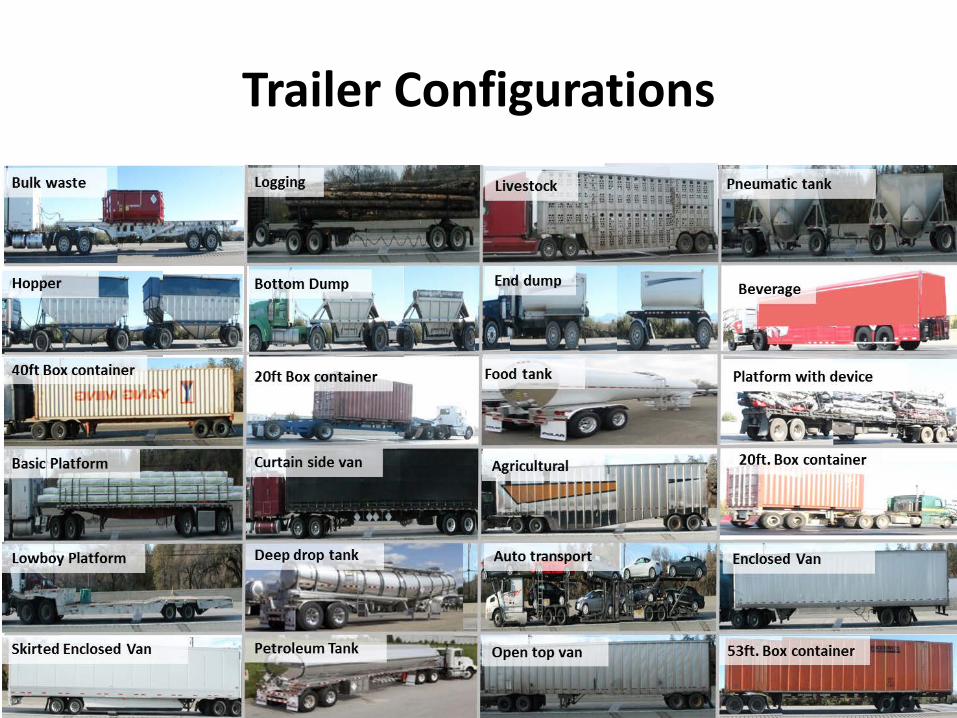
Truck Configurations
,...... ---
Bulk waste
Trailer Configurations

30
Existing Truck Activity Data Sources
• GPS • Cellphone
• Weigh-In-Motion • Automatic Vehicle
Classifier (AVC) System
• 2002 National Vehicle Inventory and Use Survey (VIUS)
• 2016 California VIUS • Regional Intercept
Surveys
Mobile Static / Count Data Surveys

31
Research Objective
Develop and deploy cutting-edge classification models that
– leverage existing detector infrastructure – to provide truck count data by detailed
configuration – using advanced inductive signature technology