Embed Size (px)
Citation preview
S
Culture, Profitability &
Productivity
In Harmony
BIZ
Business Growth Planning
BASICS
S No Culture without Profitability
S No Profitability without Culture
S No Profitability without Productivity
BIZ
Business Growth Planning - www.bizleap.com.au
CULTURE
Employee Evaluations That Will Drive Culture and Profitability
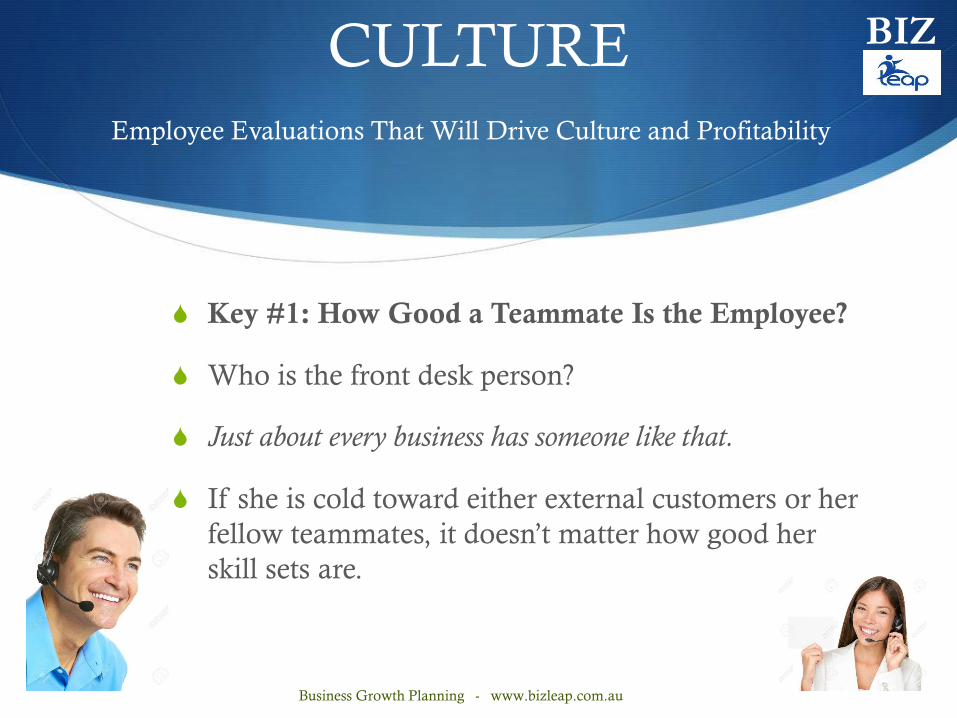
S Key #1: How Good a Teammate Is the Employee?
S Who is the front desk person?
S Just about every business has someone like that.
S If she is cold toward either external customers or her
fellow teammates, it doesn’t matter how good her
skill sets are.
BIZ
Business Growth Planning - www.bizleap.com.au

CULTURE
S Key #2: How Well Does the Employee Connect with External Customers?
S There are a lot of people who are technically sound but don’t do well with people.
S Can you hide these people? At some point they’ll likely have contact with a customer.
S Do you want those people to represent your business?
BIZ
Business Growth Planning - www.bizleap.com.au
CULTURE
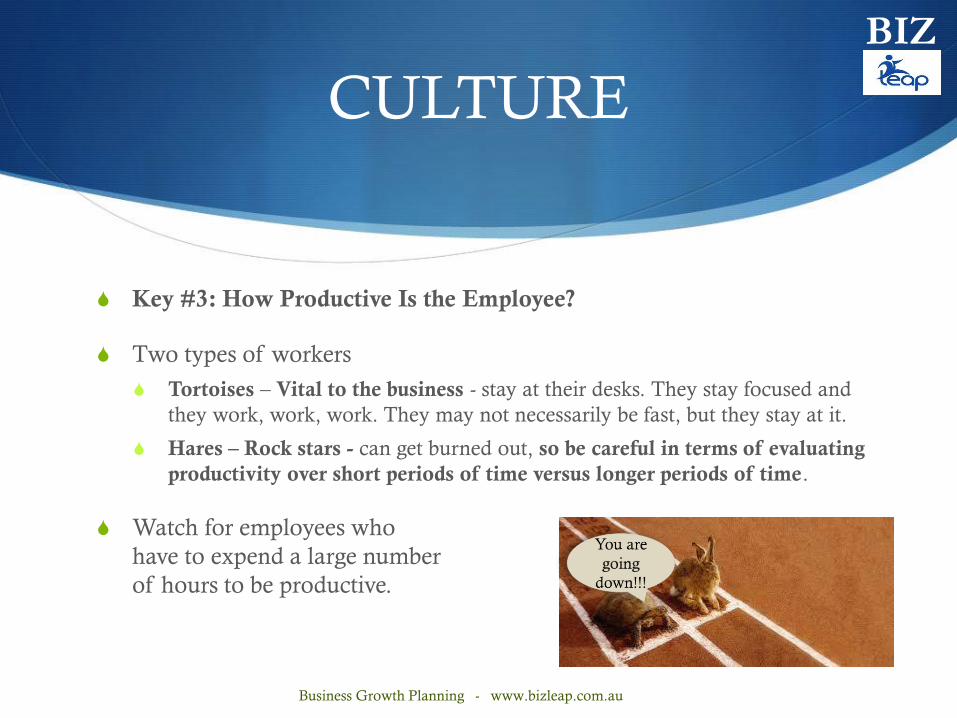
S Key #3: How Productive Is the Employee?
S Two types of workers
S Tortoises – Vital to the business - stay at their desks. They stay focused and
they work, work, work. They may not necessarily be fast, but they stay at it.
S Hares – Rock stars - can get burned out, so be careful in terms of evaluating
productivity over short periods of time versus longer periods of time.
S Watch for employees who
have to expend a large number
of hours to be productive.
BIZ
Business Growth Planning - www.bizleap.com.au
CULTURE
S Key #4: Does the Employee
Contribute at Your Targeted
Profitability Levels?
S Clearly you have to make a profit
from every employee or else you
have a broken business model;
what gross profit does every salary
dollar return?
BIZ
Business Growth Planning - www.bizleap.com.au
CULTURE
S Key #5: Core Competencies: Have
the Employee’s Responsibilities and
Skills Increased?
S Salary changes for only one of two
reasons:
S if the salary economy changed and we
adjusted the pay scale or
S if they moved up a level.
BIZ
Business Growth Planning - www.bizleap.com.au
PROFITABILITY
S Help Team members understand what it takes to make the
company profitable
S Help Team members understand what it takes to make their
jobs secure; (one day you don’t want to tell them the
business can’t afford to pay them.) Jack Stack
S Help Team members understand
what it takes to help them carve out
their future with your company.
BIZ
Business Growth Planning - www.bizleap.com.au

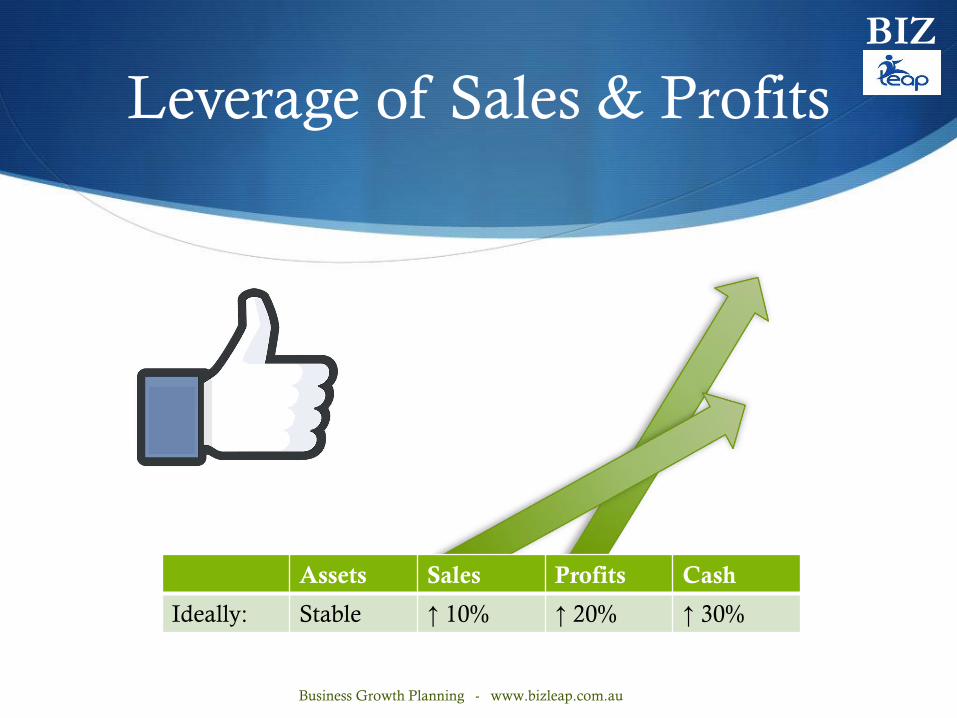
Leverage of Sales & Profits
Assets Sales Profits Cash
Ideally: Stable ↑ 10% ↑ 20% ↑ 30%
BIZ
Business Growth Planning - www.bizleap.com.au
Leverage of Sales & Profits
Assets Sales Profits Cash
Ideally: Stable ↑ 10% ↑ 20% ↑ 30%
BIZ
Business Growth Planning - www.bizleap.com.au
Efficiency
S Your efficiency score asks: How efficient are you at converting Sales into Profits? Here’s the formula we use to measure efficiency:
Profits ÷ Sales = Efficiency %
Example: $ 200,000/ $1,000,000 = .20c
BIZ
Business Growth Planning - www.bizleap.com.au
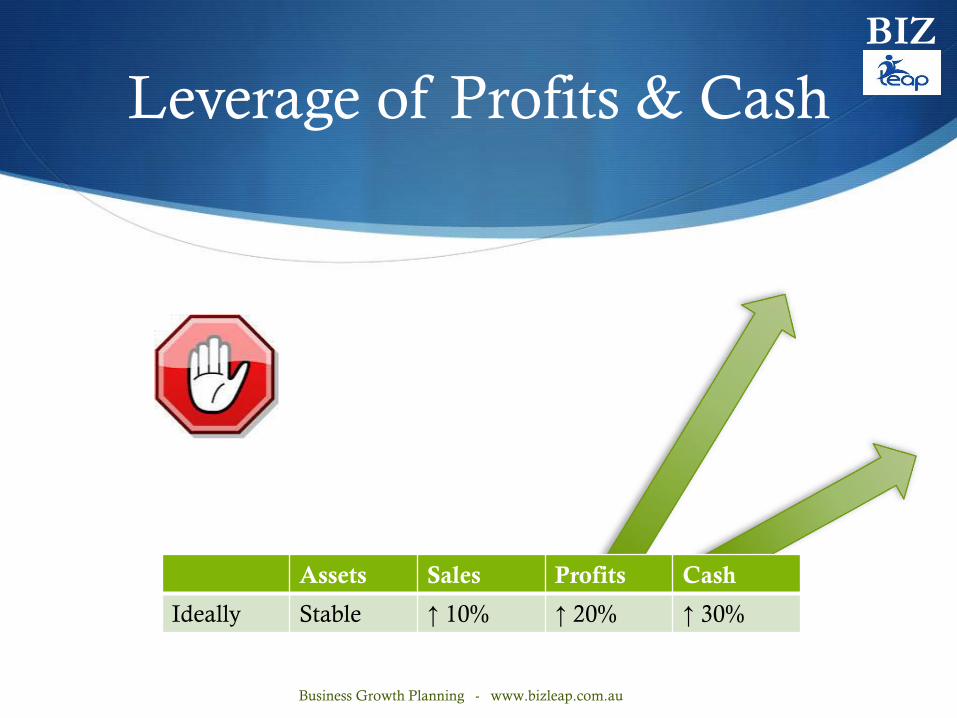
Leverage of Profits & Cash
Assets Sales Profits Cash
Ideally Stable ↑ 10% ↑ 20% ↑ 30%
BIZ
Business Growth Planning - www.bizleap.com.au

Leverage of Profits & Cash
Assets Sales Profits Cash
Ideally Stable ↑ 10% ↑ 20% ↑ 30%
BIZ
Business Growth Planning - www.bizleap.com.au
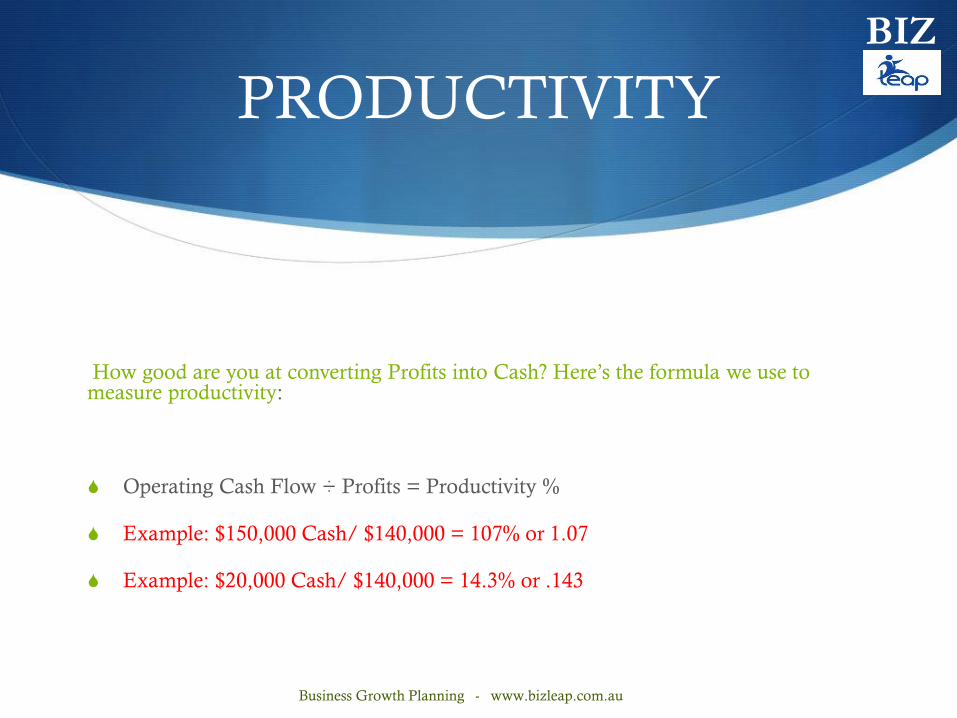
PRODUCTIVITY
How good are you at converting Profits into Cash? Here’s the formula we use to measure productivity:
S Operating Cash Flow ÷ Profits = Productivity %
S Example: $150,000 Cash/ $140,000 = 107% or 1.07
S Example: $20,000 Cash/ $140,000 = 14.3% or .143
BIZ
Business Growth Planning - www.bizleap.com.au
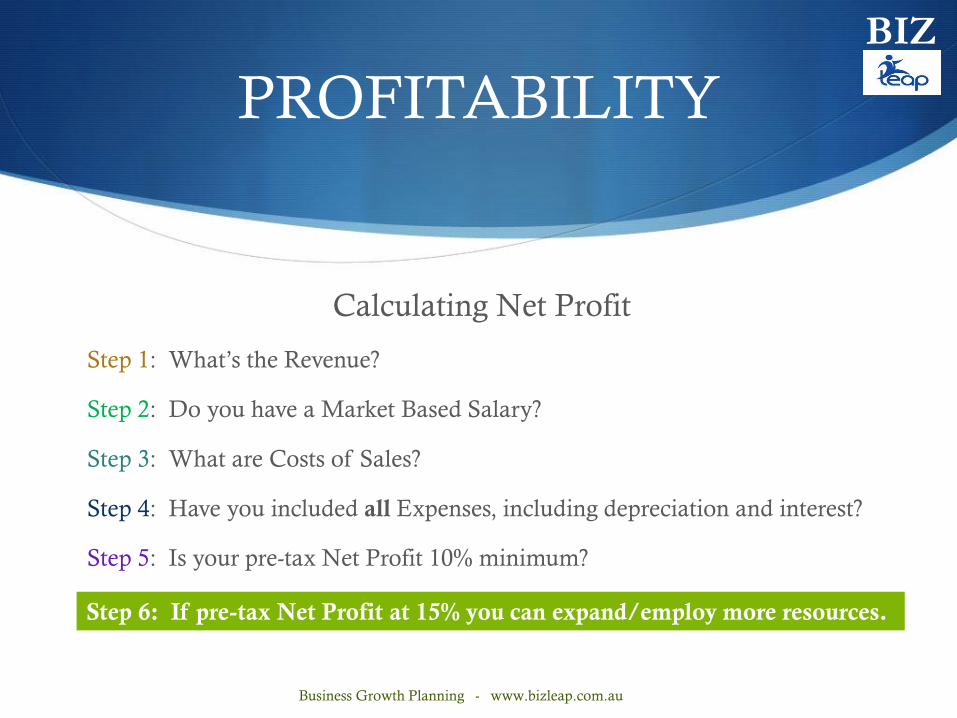
PROFITABILITY
Calculating Net Profit
Step 1: What’s the Revenue?
Step 2: Do you have a Market Based Salary?
Step 3: What are Costs of Sales?
Step 4: Have you included all Expenses, including depreciation and interest?
Step 5: Is your pre-tax Net Profit 10% minimum?
Step 6: If pre-tax Net Profit at 15% you can expand/employ more resources.
BIZ
Business Growth Planning - www.bizleap.com.au

PROFITABILITY
How to determine it?
Revenue
Salary Cap
Cost of Sales
Fixed Expenses
Net Profit
BIZ
Business Growth Planning - www.bizleap.com.au

PROFITABILITY
Team Bonuses & Targets
S What is your Critical Number, Cash flow, Profitability,
Productivity, Revenue/Sales, Stock, Expenses, Payroll,
Debtors?
S Tie bonuses and targets to the critical number of the
Company
S Make bonuses cumulative so Team doesn't lose motivation
The Bonus or targets are around the critical numbers of the Company
BIZ
Business Growth Planning - www.bizleap.com.au
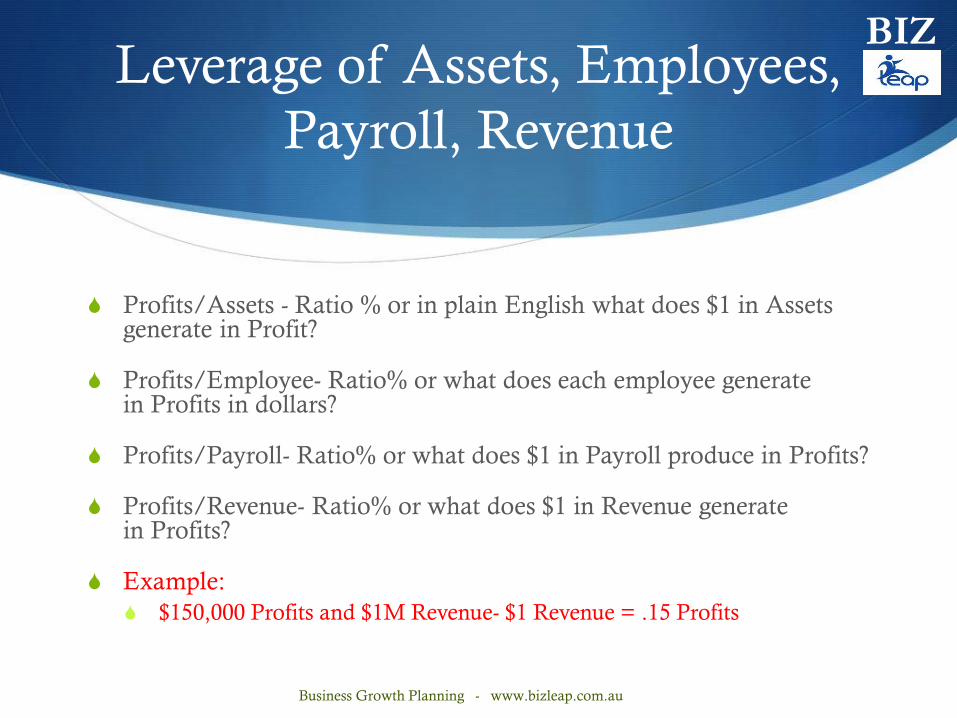
Leverage of Assets, Employees,
Payroll, Revenue
S Profits/Assets - Ratio % or in plain English what does $1 in Assets generate in Profit?
S Profits/Employee- Ratio% or what does each employee generate in Profits in dollars?
S Profits/Payroll- Ratio% or what does $1 in Payroll produce in Profits?
S Profits/Revenue- Ratio% or what does $1 in Revenue generate in Profits?
S Example:
S $150,000 Profits and $1M Revenue- $1 Revenue = .15 Profits
BIZ
Business Growth Planning - www.bizleap.com.au
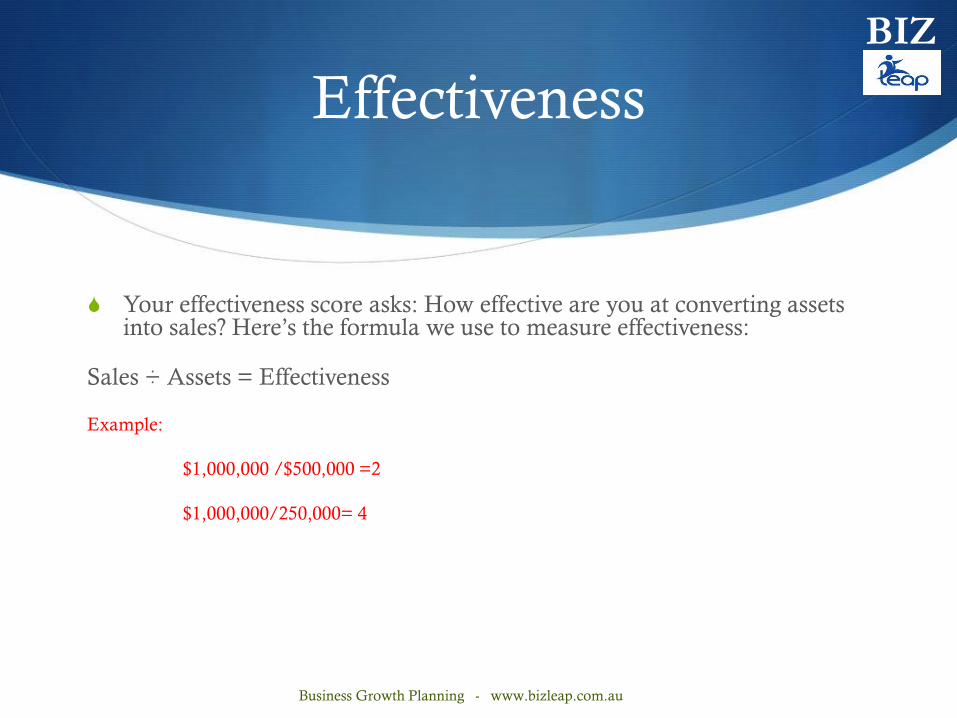
Effectiveness
S Your effectiveness score asks: How effective are you at converting assets into sales? Here’s the formula we use to measure effectiveness:
Sales ÷ Assets = Effectiveness
Example:
$1,000,000 /$500,000 =2
$1,000,000/250,000= 4
BIZ
Business Growth Planning - www.bizleap.com.au

Productivity Report
BIZ
Exhibit 8.2: Labor ProductivityLabor Efficiency
Period GP% Billings GP$ Labor Week MTD YTD
January 49.50% $ 145,000.00 $ 71,775.00 $ 35,000.00 $ 2.05 $ 2.05
February 51.20% $ 154,000.00 $ 78,848.00 $ 37,000.00 $ 2.13 $ 2.09
March 47.60% $ 180,000.00 $ 85,680.00 $ 40,000.00 $ 2.14 $ 2.11
April 50.10% $ 190,000.00 $ 95,190.00 $ 42,000.00 $ 2.27 $ 2.15
May
Week 1 50.00% $ 40,000.00 $ 20,000.00 10,000.00 $ 2.00 $ 2.00 $ 2.14
Week 2 50.00% $ 38,000.00 $ 19,000.00 9,500.00 $ 2.00 $ 2.00 $ 2.14
Week 3 50.00% $ 35,000.00 $ 17,500.00 11,000.00 $ 1.59 $ 1.85 $ 2.10
Week 4 50.00% $ 1.85 $ 2.10
Week 5 50.00% $ 1.85 $ 2.10
May Total $113,000.00 $ 56,500.00 $ 30,500.00 $ 1.85 $ 2.10
Business Growth Planning - www.bizleap.com.au
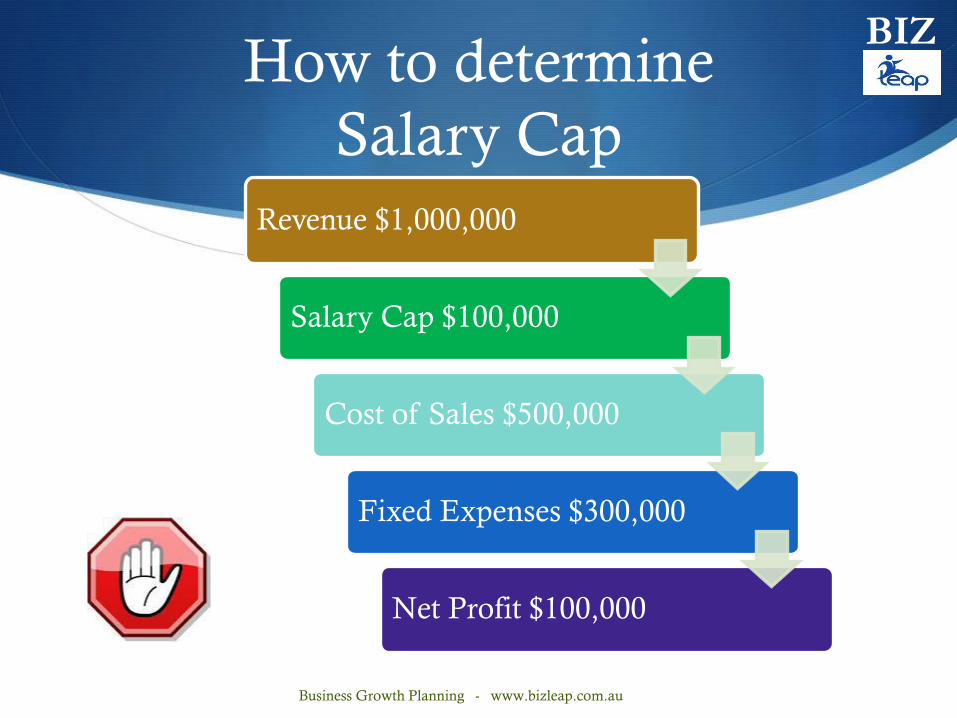
How to determine
Salary Cap
Revenue $1,000,000
Salary Cap $100,000
Cost of Sales $500,000
Fixed Expenses $300,000
Net Profit $100,000
BIZ
Business Growth Planning - www.bizleap.com.au
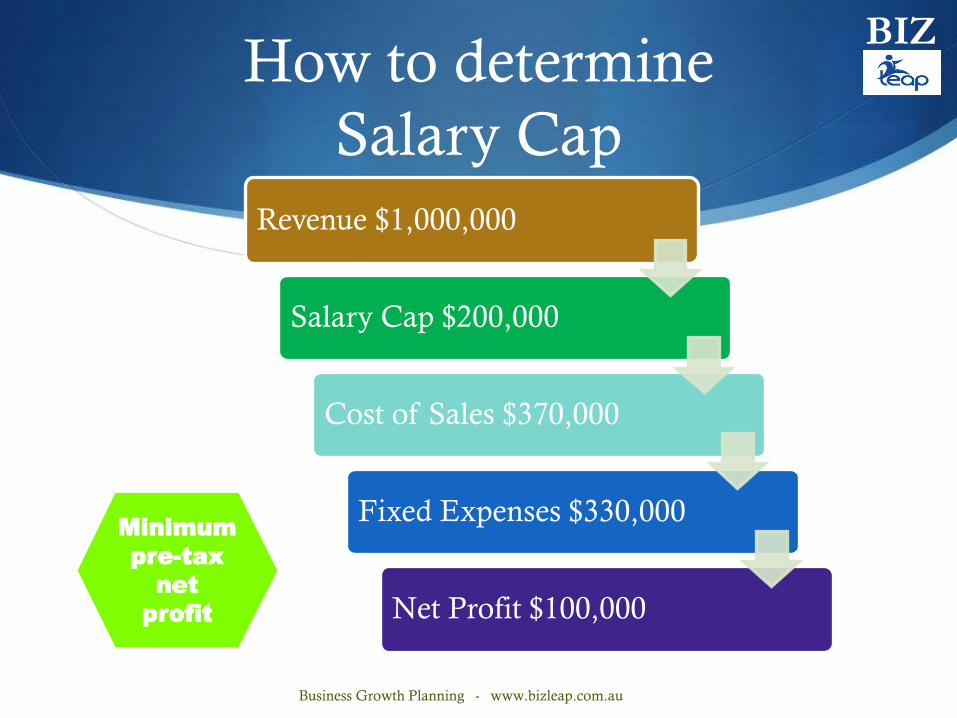
How to determine
Salary Cap
Revenue $1,000,000
Salary Cap $200,000
Cost of Sales $370,000
Fixed Expenses $330,000
Net Profit $100,000
Minimum
pre-tax
net
profit
BIZ
Business Growth Planning - www.bizleap.com.au
Productivity
Absorption Rate
S We like to see how many hours per week each team member
is working on prime time, including Admin Team.
S Then we can work out the
absorption rate ( the $ amount
per hour the company has to
pay each team member so overhead
expenses are covered).
BIZ
Business Growth Planning - www.bizleap.com.au
Productivity
Utilisation and Capacity
S Utilisation / Capacity = Efficiency For example, if an
accountant has a forty-hour week, but only produces
chargeable client work for twenty hours then the efficiency
rate = 0.50 or 50%.
In the example of the accountant, the twenty hours that are
being ‘wasted’ could have been spent doing other things.
BIZ
Business Growth Planning - www.bizleap.com.au
BIZ
Akio Yamada
Mirai Industries
Business Growth Planning - www.bizleap.com.au
S Acknowledgments to Jack Stack, Keith Cunningham, and
Greg Crabtree.
BIZ
Business Growth Planning - www.bizleap.com.au