Embed Size (px)
Citation preview
Case Study 2March 2017
Developing Online School Report CardsBuilding a Data Tool That Enhances Parent Understanding
and Engagement
States are required by law to develop school report cards that clearly convey school data to parents and community members. However, this information can be difficult for parents and community members to find and understand. There is often little context to explain the meaning or significance of the data, and further, the data is rarely provided through easily accessible channels or tailored to parents’ needs. In a 2016 report, the Data Quality Campaign found that only four state report cards have all of the student performance information initially required under No Child Left Behind Act (NCLB) and 19 states require three or more clicks from search engine results to reach the state report card.
Requirements on public reporting of school data have existed for states previously under NCLB. Now, under the reauthorized version of that law, the recent Every Student Succeeds Act (ESSA), states are required to develop school report cards that not only display the results of their school accountability systems (i.e., A-F grades or other school rating) but also a wider array of school-level data than ever before, including funding, teacher quality, post-secondary success and much more—in a parent-friendly format.
Though federal law has always required
school report cards, ESSA provides states
with an opportunity to reinvent their school
report cards as an easy-to-use, 21st century
tool for empowering parents and students.
With a focus on transparency—school report card data that is presented in a reliable way that parents can both easily access and understand—communities can more clearly measure progress and performance. Policymakers and advocates can strengthen accountability by highlighting and leveraging clear datapoints, ensuring that their schools are on the path to increasing student achievement. In addition, parents can have the information they need to make informed decisions about their children’s education.Initial design and development tasks focused on the data available to power the Know Your School tool. In order to meet the goals set for the tool, there needed to be clarity about what school performance data is available to report, an assessment of the quality of that data and an understanding of the SEA’s data collection strategy and release schedule.
To learn more about the issue brief series and the Know Your School Project, contact [email protected]
Approach Building User Friendly Online Report Cards
A Prototype for the NationThe Know Your School online report card tool is a prototype of a reimagined, transparent, online school report card for states. It is intentionally designed as a base for a state, with the capability of becoming a fully ESSA-complaint tool over time. The Know Your School tool was built using open-source front-end code that is accessible free of charge as a resource for other developers. This means that other project teams building online state school report cards can use the existing code to build on and adapt the design elements of this tool to further serve their communities’ needs. This tool provides state education agencies (SEAs) with a foundation for building a transparent online report card tool that drives engagement and increases parent understanding of school accountability data.
In the following case study, we will define the important considerations behind:
• Identifying the data that parents need to make decisions about their children’s education;
• Maintaining that information;
• Developing a tool to advance parents’ understanding of school grades; and
• Sustaining an online tool and data over time.
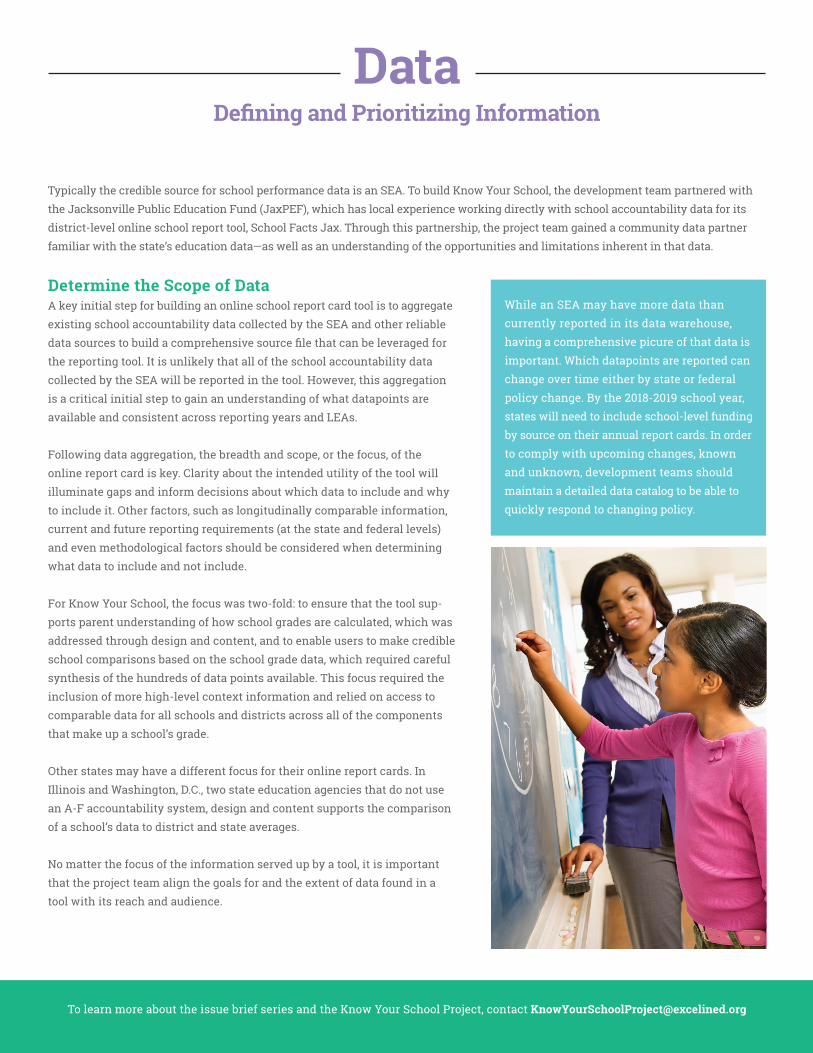
Typically the credible source for school performance data is an SEA. To build Know Your School, the development team partnered with the Jacksonville Public Education Fund (JaxPEF), which has local experience working directly with school accountability data for its district-level online school report tool, School Facts Jax. Through this partnership, the project team gained a community data partner familiar with the state’s education data—as well as an understanding of the opportunities and limitations inherent in that data.
To learn more about the issue brief series and the Know Your School Project, contact [email protected]
DataDefining and Prioritizing Information
Determine the Scope of Data A key initial step for building an online school report card tool is to aggregate existing school accountability data collected by the SEA and other reliable data sources to build a comprehensive source file that can be leveraged for the reporting tool. It is unlikely that all of the school accountability data collected by the SEA will be reported in the tool. However, this aggregation is a critical initial step to gain an understanding of what datapoints are available and consistent across reporting years and LEAs.
Following data aggregation, the breadth and scope, or the focus, of the online report card is key. Clarity about the intended utility of the tool will illuminate gaps and inform decisions about which data to include and why to include it. Other factors, such as longitudinally comparable information, current and future reporting requirements (at the state and federal levels) and even methodological factors should be considered when determining what data to include and not include.
For Know Your School, the focus was two-fold: to ensure that the tool sup-ports parent understanding of how school grades are calculated, which was addressed through design and content, and to enable users to make credible school comparisons based on the school grade data, which required careful synthesis of the hundreds of data points available. This focus required the inclusion of more high-level context information and relied on access to comparable data for all schools and districts across all of the components that make up a school’s grade.
Other states may have a different focus for their online report cards. In Illinois and Washington, D.C., two state education agencies that do not use an A-F accountability system, design and content supports the comparison of a school’s data to district and state averages.
No matter the focus of the information served up by a tool, it is important that the project team align the goals for and the extent of data found in a tool with its reach and audience.
While an SEA may have more data than currently reported in its data warehouse, having a comprehensive picure of that data is important. Which datapoints are reported can change over time either by state or federal policy change. By the 2018-2019 school year, states will need to include school-level funding by source on their annual report cards. In order to comply with upcoming changes, known and unknown, development teams should maintain a detailed data catalog to be able to quickly respond to changing policy.

To learn more about the issue brief series and the Know Your School Project, contact [email protected]
Review SEA Accountability Plan, Data Collection Methodology and Data Release ScheduleKnow Your School was designed to serve as an example of how an online school report card tool could help parents better understand and engage with their state’s accountability system. During the initial requirements-gathering phase, the project team worked to understand the components that make up Florida school grades and how they are measured across grade levels and subject areas. The team also explored the origins and history of school grades in Florida to consider how the data would need to be contextualized.
During the data collection and review, project teams should examine and map the SEA’s accountability plan to the data. Consider how the state calculates a school’s performance and how the data are used to inform that rating. By building an understanding of the methodology undergirding the SEA accountability plan, state report card teams can identify discrepancies across data points from different sources, ensuring that accurate comparisons can be made among schools, grades and population sub-groups served. This is critical for an online school report card tool that hinges on parents’ and families’ ability to make the most well-informed decisions.
Most SEAs release data throughout the year as it becomes available. Project teams should map the SEA data release schedule to its tool development efforts, and develop agile processes to support inevitable changes in release timing, fixes to incorrect discrete data points and entire data sets. Planning for the release of new data is an important consideration—both in development and in maintenance efforts, to ensure that the tool remains accurate and up to date over time. Additionally, the project team can clearly convey expectations around data updates to parents and community members that seek to understand this information in greater detail, aligning with a core commitment
to transparency and resulting in greater use of the tool among parents.
Assess and Document the Quality and Availability of DataOnce the data is curated, it must be reviewed to ensure each figure is properly sourced, indicating if the dataset is reliable and can be used to make inferences about a school’s performance. Systems are typically in place for school validation of data quality and assurance, but the additional step of developing quality assurance checks in the form of statistical scripts and spot checks can account for oversight. The project team’s work in assessing the data can also provide important validation and insight about outliers that can inform the types of charts and graphs that will best display a
given dataset.
There are some datapoints, such as principal names, website URLs and other descriptive characteristics about schools that change frequently and are not effectively sourced or monitored. Therefore, project teams should work to discover how non-systemically collected data can be aggregated, accessed or collected. In the case of a statewide tool, the goal is to develop a consistent reporting schedule that includes updates to non-systemically collected or hard-to-track information so that it can be
conveyed to users.
To successfully help a user understand a subject,
a clear and disciplined prioritization of the data
points is critical, as well as thoughtful visual
presentation and contextual information.
To learn more about the issue brief series and the Know Your School Project, contact [email protected]
Create a Data CatalogA data catalog is the documentation of the data analysis. It should explicitly document the data points that will be displayed in the school report card tool, define the sources of the data and explain the business rules behind any calculations. A data catalog accounts for variation in how individual items are reported across multiple source documents, identifying outliers and standardizing naming conventions and other rules or norms about the data. The Know Your School project team built a data catalog from raw data to ensure that data in the tool is consistent across years and subgroups. This exercise led to the addition of things like uniform prefixes to the data categories, so information can be easily scanned and categorized. These steps also make it easier for other members of the project team to identify the component data for school grades or other accountability ranking systems—from assessment scores to graduation rates.
A key purpose of the data catalog is to define the set of data that will be displayed within the school report card, as well as the available data that will not be displayed but could be accessed for future use. In the case of Know Your School, the data catalog focused on the data indicators that are part of the state’s accountability system such as achievement, learning gains and graduation rate (displayed on the School Grades tab). As the scope of the project grew, the data catalog expanded to include raw student performance data (displayed on the Student Performance tab) to show how schools are
serving different student populations.
Prioritize Your DataOnce your data is collected, curated and cataloged, determining a clear set of priorities for your school report card is critical so that you do not overwhelm the user. Know Your School is focused on unpacking school grades for parents. What goes into these grades? How are they determined? Those were the questions we set out to answer for users, and that prioritization is on display when reviewing a school’s report.
The first element a user should see when arriving on a school’s report card is the school grade. That is closely followed by the elements that go into the calculation for that grade. There is an intentional limit on the amount of information we’re giving the user during this initial interaction; instead, we explain the nuances of the calculation through both content and visuals.
To learn more about the issue brief series and the Know Your School Project, contact [email protected]
These are just handful of the data points that are collected and available within the system. Just because the data catalog contains thousands of data points doesn’t mean those should be immediately on display for users. Once a user has completed this initial interaction, they are well-equipped to move on to other sections that provide more data with less explanation.
That said, prioritization is still important. Deeply detailed data is only useful if it is relevant; it otherwise distracts from other important information. On Know Your School, performance data not directly related to the school grade calculation, as well as demographic information, is deliberately separate from the data that goes into the calculation for the school grade. Other
considerations include:
• Data that is not longitudinally comparable, and how it must be conveyed accurately for users;
• Unique data sets that may not thematically align to the rest of the information; and
• Data that might appear synonymous with other data points, but that is actually methodologically different.
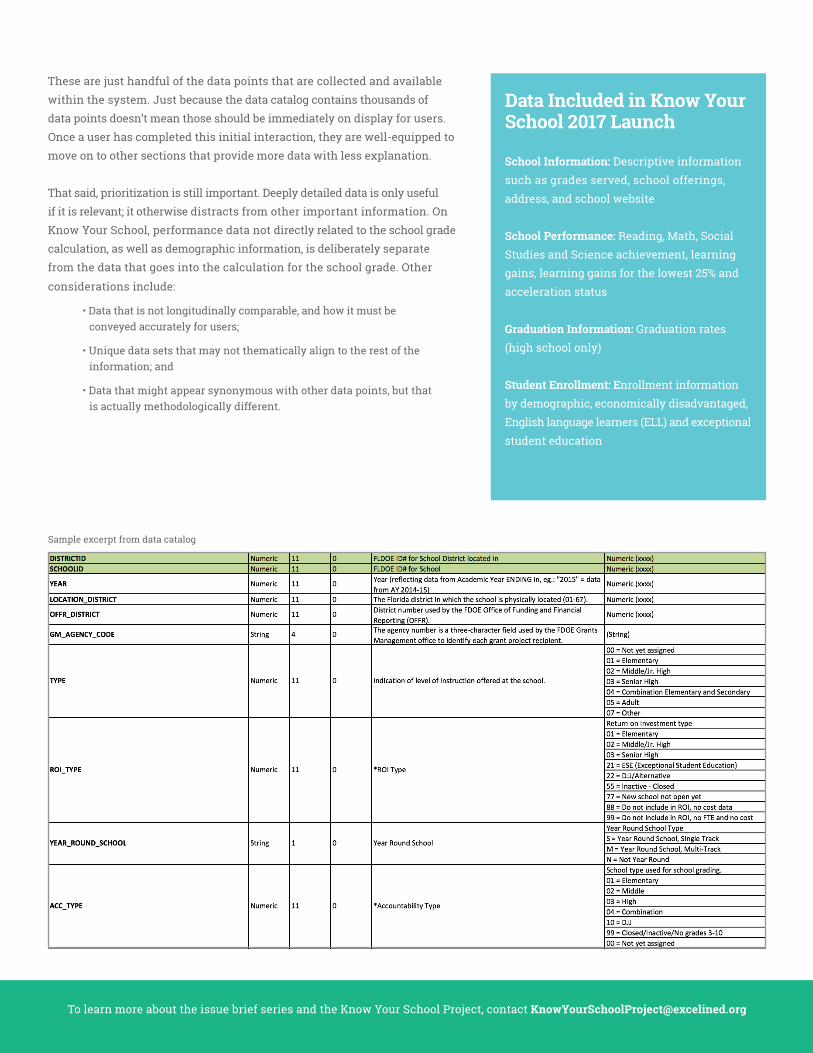
Data Included in Know Your School 2017 Launch
School Information: Descriptive information such as grades served, school offerings, address, and school website School Performance: Reading, Math, Social Studies and Science achievement, learning gains, learning gains for the lowest 25% and acceleration status
Graduation Information: Graduation rates (high school only)
Student Enrollment: Enrollment information by demographic, economically disadvantaged, English language learners (ELL) and exceptional student education
Sample excerpt from data catalog

To learn more about the issue brief series and the Know Your School Project, contact [email protected]
During the design of Know Your School, the project team prioritized existing feedback about parents’ and community members’ desires to better understand school performance data and learn how to engage in thoughtful conversations about it. Initial design principles and strategies were informed by focus group sessions with parents and others as well as findings from ExcelinEd’s My School Information Design Challenge. Additionally, the design team sought regular feedback from an advisory group of educators and online school report card power users. This advisory group provided feedback on the tool’s name, overall graphic design, the user path, and language used to describe data and its meaning.
More than simply a repository of data, the project team wanted to design the tool as a deliberate window into information that can enhance understanding and provoke conversations about data and what’s happening in schools. One way to enhance understanding of this complex data is through data visualizations and exhibits, or the different types of charts and graphs used to display the data in an understandable context, in an accessible online platform. Another strategy is to ensure the right level of context and explanatory
content is built into the design.
Here are a few essential concepts to consider when bringing school data online:
• Sort and group school data so that it is organized to promote action and parent understanding, while inviting users to drill deeper into the data by sequencing information complexity.
• More than simply explaining what data is, include information that helps parents understand context about the information and why it should matter to them.
• Encourage users to ask questions about what they see to inform future enhancements and provide searchable responses that create a living and robust information base.
• Consider the path the user will take through the information, and ensure enough information is provided in the form of explanatory text at the beginning so the user feels engaged, rather than overwhelmed.
• Use colors, shapes and other simple page elements, to enforce and strictly adhere to a design language that gives the user consistent touchpoints throughout their analysis of the data.
With these user goals in mind, the project team’s development and design partner, Social Driver, led mobile-first design efforts and the build of the website that connects with the robust, open-ended Application Programming Interface (API) to power the Know Your School online tool.
DevelopmentBringing Together Data and Functionality
As states move from data collection to tool development, they should follow these key steps:
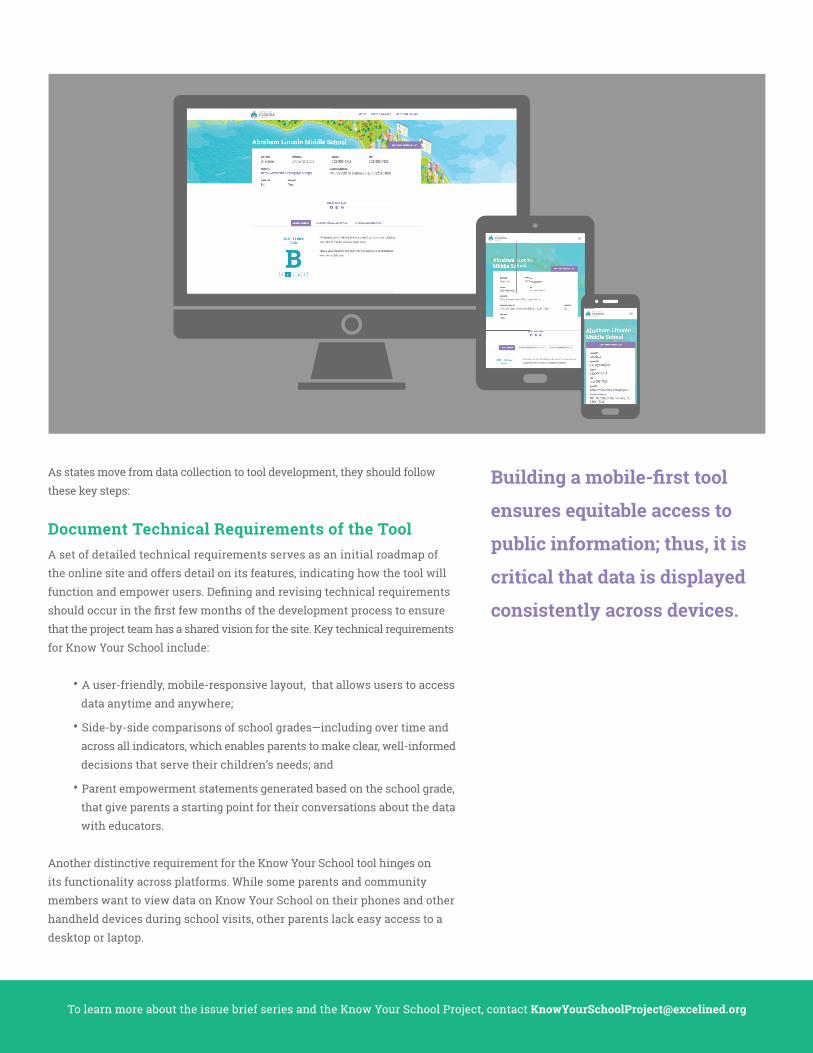
Document Technical Requirements of the ToolA set of detailed technical requirements serves as an initial roadmap of the online site and offers detail on its features, indicating how the tool will function and empower users. Defining and revising technical requirements should occur in the first few months of the development process to ensure that the project team has a shared vision for the site. Key technical requirements for Know Your School include:
• A user-friendly, mobile-responsive layout, that allows users to access data anytime and anywhere;
• Side-by-side comparisons of school grades—including over time and across all indicators, which enables parents to make clear, well-informed decisions that serve their children’s needs; and
• Parent empowerment statements generated based on the school grade, that give parents a starting point for their conversations about the data with educators.
Another distinctive requirement for the Know Your School tool hinges on its functionality across platforms. While some parents and community members want to view data on Know Your School on their phones and other handheld devices during school visits, other parents lack easy access to a desktop or laptop.
To learn more about the issue brief series and the Know Your School Project, contact [email protected]
Building a mobile-first tool
ensures equitable access to
public information; thus, it is
critical that data is displayed
consistently across devices.
To learn more about the issue brief series and the Know Your School Project, contact [email protected]
Select a Content Management System With proposed features in hand, the project team should select a content management system (CMS) to support the website. To support the mission of Know Your School, we selected WordPress, a platform which allows customization, is easy to use, and has widespread access.
The most widely-used CMS in the world, WordPress enhances the long-term sustainability of the tool by minimizing the cost of overhead. It is a highly customizable CMS that uses widely-understood programming and development approaches, meaning it is very easy for organizations to find developers to support WordPress. The open-source nature of WordPress allows other states to easily adapt the Know Your School template and platform to their unique situation without licensing cost. Maintenance is further reduced by hosting the platform with WPEngine. A specialized WordPress-only service, WPEngine proactively addresses patches, updates and other hosting minutiae.
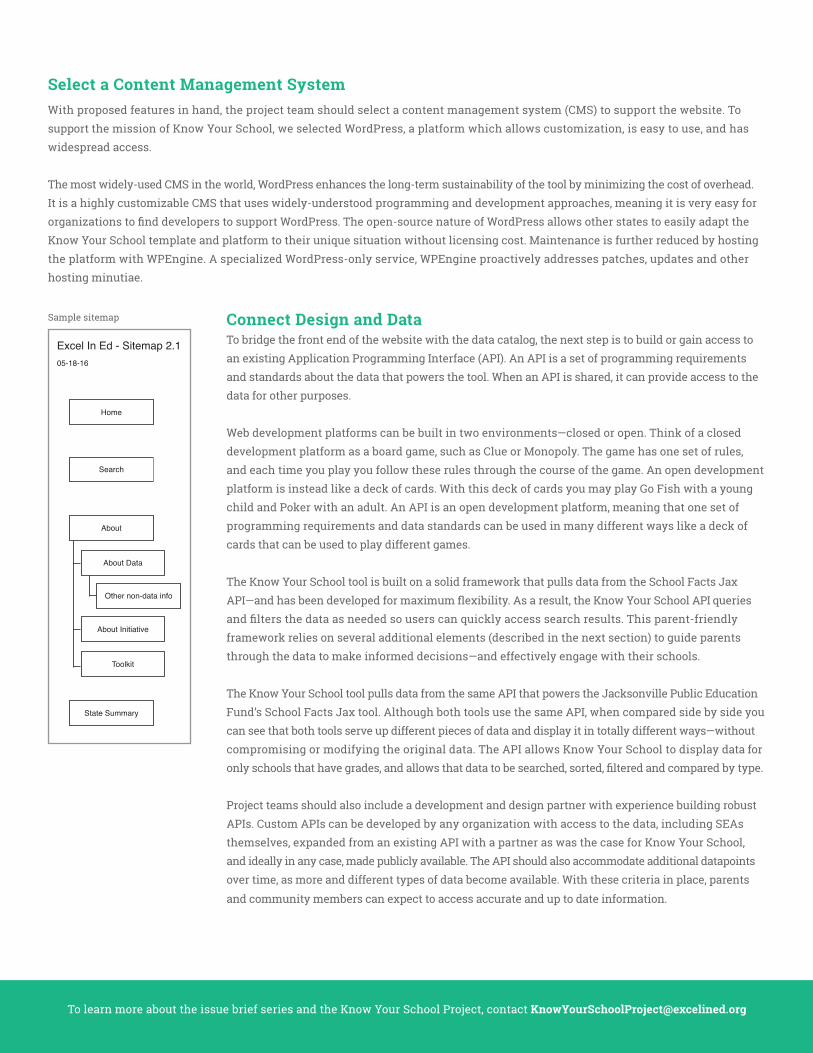
Connect Design and DataTo bridge the front end of the website with the data catalog, the next step is to build or gain access to an existing Application Programming Interface (API). An API is a set of programming requirements and standards about the data that powers the tool. When an API is shared, it can provide access to the data for other purposes.
Web development platforms can be built in two environments—closed or open. Think of a closed development platform as a board game, such as Clue or Monopoly. The game has one set of rules, and each time you play you follow these rules through the course of the game. An open development platform is instead like a deck of cards. With this deck of cards you may play Go Fish with a young child and Poker with an adult. An API is an open development platform, meaning that one set of programming requirements and data standards can be used in many different ways like a deck of cards that can be used to play different games.
The Know Your School tool is built on a solid framework that pulls data from the School Facts Jax API—and has been developed for maximum flexibility. As a result, the Know Your School API queries and filters the data as needed so users can quickly access search results. This parent-friendly framework relies on several additional elements (described in the next section) to guide parents through the data to make informed decisions—and effectively engage with their schools.
The Know Your School tool pulls data from the same API that powers the Jacksonville Public Education Fund’s School Facts Jax tool. Although both tools use the same API, when compared side by side you can see that both tools serve up different pieces of data and display it in totally different ways—without compromising or modifying the original data. The API allows Know Your School to display data for only schools that have grades, and allows that data to be searched, sorted, filtered and compared by type.
Project teams should also include a development and design partner with experience building robust APIs. Custom APIs can be developed by any organization with access to the data, including SEAs themselves, expanded from an existing API with a partner as was the case for Know Your School, and ideally in any case, made publicly available. The API should also accommodate additional datapoints over time, as more and different types of data become available. With these criteria in place, parents
and community members can expect to access accurate and up to date information.
Home
Search
By Text Search
By Address
By District
District List
FOOTER
Contact, Terms of Use, Privacy Policy
About
About Data
Other non-data info Potential area to show other data like this
Additional Filters will allowuser to narrow results
User can compare schoolsand then go directly to
single report card
About Initiative
Toolkit
State Summary
Compare Results
Report Card
Excel In Ed - Sitemap 2.1 05-18-16
Search Results Pages
Sample sitemap
�Site Name
School Name �
Find Your School
What Is This Tool?
Graphic explaining grades
Share this tool
� ��
A paragraph that will set expectation the user will be seeing data…
Mobile - Home Page With Filter
Search X
School Name
County
Address
∠
OR
OR
return123 space
Q W
A
Z X C V B N M
S D F G H J K L
E R T Y U I O P
Search
To learn more about the issue brief series and the Know Your School Project, contact [email protected]
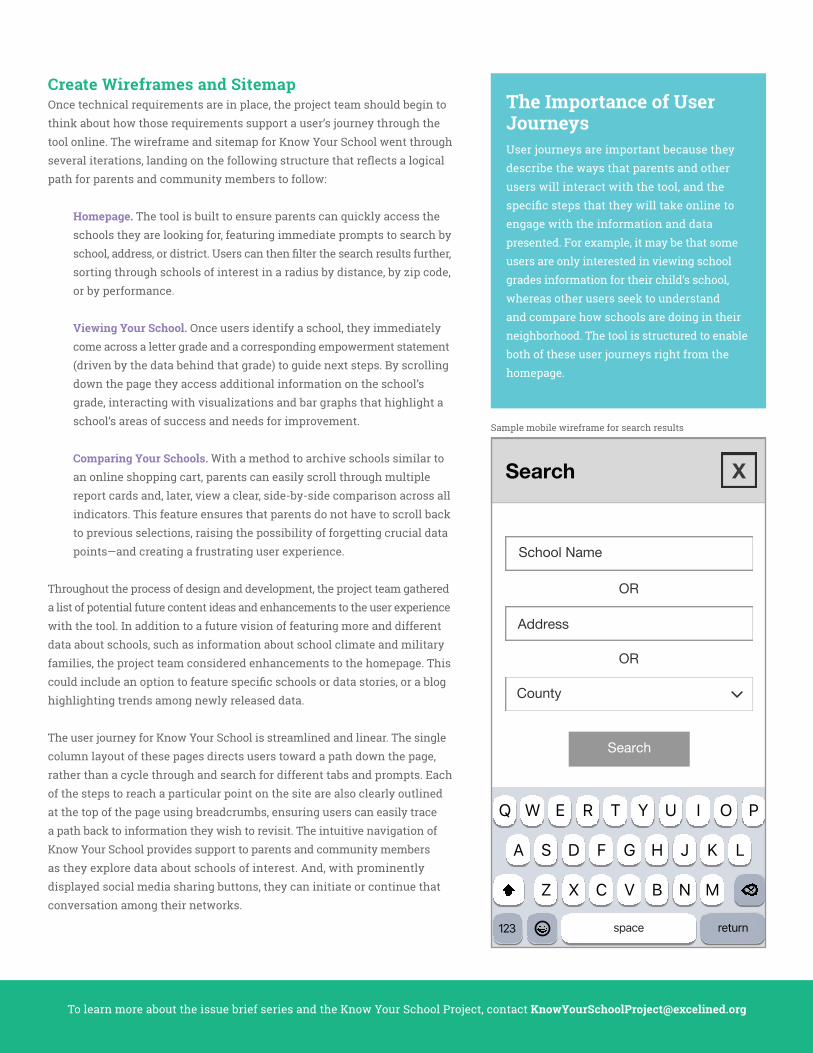
Create Wireframes and Sitemap Once technical requirements are in place, the project team should begin to think about how those requirements support a user’s journey through the tool online. The wireframe and sitemap for Know Your School went through several iterations, landing on the following structure that reflects a logical path for parents and community members to follow: Homepage. The tool is built to ensure parents can quickly access the schools they are looking for, featuring immediate prompts to search by school, address, or district. Users can then filter the search results further, sorting through schools of interest in a radius by distance, by zip code, or by performance.
Viewing Your School. Once users identify a school, they immediately come across a letter grade and a corresponding empowerment statement (driven by the data behind that grade) to guide next steps. By scrolling down the page they access additional information on the school’s grade, interacting with visualizations and bar graphs that highlight a school’s areas of success and needs for improvement.
Comparing Your Schools. With a method to archive schools similar to an online shopping cart, parents can easily scroll through multiple report cards and, later, view a clear, side-by-side comparison across all indicators. This feature ensures that parents do not have to scroll back to previous selections, raising the possibility of forgetting crucial data points—and creating a frustrating user experience.
Throughout the process of design and development, the project team gathered a list of potential future content ideas and enhancements to the user experience with the tool. In addition to a future vision of featuring more and different data about schools, such as information about school climate and military families, the project team considered enhancements to the homepage. This could include an option to feature specific schools or data stories, or a blog highlighting trends among newly released data.
The user journey for Know Your School is streamlined and linear. The single column layout of these pages directs users toward a path down the page, rather than a cycle through and search for different tabs and prompts. Each of the steps to reach a particular point on the site are also clearly outlined at the top of the page using breadcrumbs, ensuring users can easily trace a path back to information they wish to revisit. The intuitive navigation of Know Your School provides support to parents and community members as they explore data about schools of interest. And, with prominently displayed social media sharing buttons, they can initiate or continue that conversation among their networks.
The Importance of User JourneysUser journeys are important because they describe the ways that parents and other users will interact with the tool, and the specific steps that they will take online to engage with the information and data presented. For example, it may be that some users are only interested in viewing school grades information for their child’s school, whereas other users seek to understand and compare how schools are doing in their neighborhood. The tool is structured to enable both of these user journeys right from the homepage.
Sample mobile wireframe for search results
To learn more about the issue brief series and the Know Your School Project, contact [email protected]
Identify Analytics and Key Performance IndicatorsIn the process of development, project teams should consider the analytics and key performance indicators (KPI’s) that they want to use to understand how community members are accessing and using the tool. The Know Your School project team built out baseline metrics such as visits, visit length, and traffic source, all of which can provide an understanding of the user experience and the most frequently viewed data. Reporting can even extend to indicate which school report cards are accessed most often, the schools and variables that are compared to one another, and sharing activity. These metrics all shed light on user behavior and provide developers with opportunities to pinpoint the most effective strategies to increase engagement.
A focus on analytics also ensures the tool is continually responsive to key stakeholders’ needs. Trends in usage or in page access (i.e. if there is a focus of the user’s time on historical comparisons or the side-by-side comparisons) can inform future adjustments to the tool to align with those needs and interests. These data can also offer insights into which individual schools and overall data indicators are being accessed by users, as well as raise areas of opportunity to address parts of the tool that are confusing. With additional solicitation of stakeholder feedback, an online report card can provide parents with the appropriate action steps and achieve greater transparency.
Maintaining and Sustaining the ToolEven at the very beginning of online school report card development, project teams must think two to five years in the future. As they build APIs and chart out data workflows, project teams should also think about the underlying policies and protocols that ensure the tool’s longevity, such as regularly scheduled quality assurance checks and the ease with which the CMS can be updated to include new data. These protocols and policies are the basis of a solid sustainability plan, ideally drafted at the outset of the development process. The sustainability plan provides a framework for project teams and tool managers to ensure they budget for the human resources and funds to manage updates to the CMS and improvements to the tool without delay or interruption. A well-maintained tool can serve as an enduring, transparent roadmap for community members.
Ongoing maintenance and use planning are critical to the function, enhancement, security and use of any online tool. Recommended elements of a comprehensive sustainability plan include tactical and resource planning include:
• Tool hosting and maintenance for server and security upgrades;
• Data plan for aggregating, cleaning and implementing new years of data and adding new data indicators;
• Data workflow for ongoing changes and fixes;
• Quality assurance;
• Stakeholder engagement;
• Multi-language capabilities;
• Tool content updates and functionality enhancements; and
• Tool promotion and training.
States can use these foundational data and development steps to ensure that their school accountability information is both reliable and accurate—and presented in a compelling, accessible way. And, while elements from Know Your School are free and publicly available, states are encouraged to adapt the tool to their own communities’ needs. Transparency hinges on the clear, accessible presentation of information that parents and other educational stakeholders need, particularly in their specific educational environments, to make well-reasoned education decisions. States can use resources such as Be A Learning Hero’s focus group research to better understand what data parents are looking for in school report cards. It is also important to identify the appropriate scope of your tool and establish your data catalog with an understanding of your community’s own context and needs to advance student success. With this vision for success in mind, visualizations that enhance parent understanding around particular indicators and make use of features such as side-by-side comparisons will bring this data to life in a way that is useful and helpful for parents. We will explore the importance of local feedback and engagement in Case Study #3.
To help inform the decisions that go into the data and development of an online school report card tool, states can also leverage the open source code for Know Your School. The code powering Know Your School is publicly available via Github. On Github, state report card development teams will be able to download the open source code and API used to create Know Your School. Once downloaded, state report card development teams can use this code as the foundation for building its own next generation school report card tool, aligned to the best practices outlined in this case study. As noted in this case study, the team would:
• Identify the data that is important to the parents in their state for making decisions about their child’s education;
• Create a process and framework for maintaining the data in the school report card;
• Create a graphic interface and text unique to their state’s context; and
• Use the code available on Github to build the tool.
The pieces are in place for state report card development teams to create their own transparent, online school report cards.
On the following page, we outline a checklist for data acquisition and development that other state project teams can use to shape their own report cards. In March, we will release a third case study around how to leverage design and content decisions—and draw from continual stakeholder engagement—to continue to tailor report cards to communities’ specific needs.
Get Started Resources to Support Your Online Report Cards
To learn more about the issue brief series and the Know Your School Project, contact [email protected]
Case Study Series (Available) Case Study 1: Reimagining School Report Cards
Case Study 2: Data, Development, and Functionality
(Upcoming)Case Study 3: Design, Content, and Engagement
Timeline: A State Guide to Building Online School Report Cards
Learn more:knowyourflorida-school.org/about

To learn more about the issue brief series and the Know Your School Project, contact [email protected]
Data Collection and Curation
Months 1-3:
Determine the scope of the tool (local or statewide).
Assess and document the quality and availability of your accountability and other data.
Review the SEA’s accountability plan, data collection methodology and data release schedule.
Decide the high level categories and specific data indicators to be included and create a data catalog.
Months 4-6:
Confirm different cuts at the data across years (over time) or subgroups
Verify that all original data is “clean” and reconcile any irregularities or incomplete entries.
Months 7-9:
Load or migrate data into the API.
Create a plan to accommodate newly released data during development.
Months 10 and beyond:
Create a calendar of projected future data for implementation in the tool.
Enhance the API to accommodate new data indicators.
Update existing data.
Functionality and Development
Months 1-3:
Determine website hosting parameters and select an open source content management system (CMS) such as Drupal or WordPress.
Determine and document the structure and workflow for the Application Program Interface (API) and how it integrates with the curation, cleaning, verification and uploading of data into the tool.
Create detailed technical requirements documenting the scope and functionality of the tool, such as sort, search, comparison and customization features as well as presentation in multiple languages.
Months 4-6:
Finalize user experience journeys; create a wireframe and sitemap showing overall tool structure.
Set up data repository and establish the API.
Begin development of the tool, including analytics tracking.
Months 7-9:
Develop the front-end design and underlying back-end code needed to connect the data in the API to what users see in the tool.
Engage in rigorous quality assurance testing to ensure all data and functionality are working correctly in the tool across environments and website browsers.
Months 10 and beyond:
Develop new data displays and add or update supporting content.
Execute ongoing hosting and maintenance of the tool, such as updating the CMS.
Train staff on use of CMS and data workflow.
Create an annual sustainability plan for future costs to keep the tool live and up to date.
Checklist Steps for Data and Development