Embed Size (px)
Citation preview
International Journal of Logistics Management, Vol. 13, No. 1, 2002 1
Developing Market Specific Supply Chain Strategies
Martin Christopher, Cranfield School of Management, Cranfield University,Bedford, MK43 0AL
Denis R. Towill, Cardiff Business School, Cardiff University, Colum Drive,Cardiff, CF10 3EU
This paper examines the issues underlying the appropriate matching of pipelines to
marketplace needs under conditions of demand volatility and price pressure. It
describes a scenario where the philosophy of “one size fits all” does not apply to
pipeline design, implementation, and control. The paper reports on research
conducted by the authors and others on how appropriate global supply chain strategies
can be developed contingent upon market characteristics and which seek
simultaneously to achieve higher levels of customer responsiveness at less total cost
to the supply chain as a whole. The selection of the right strategy within a supply
chain lends itself to a taxonomic approach. We find that three dimensions (leading to
eight possible configurations) are adequate for this purpose. These key dimensions
are product characteristics, demand characteristics and replenishment lead-time.
Over the last decade or so, there has emerged a view that recognises that the route to
competitive advantage lies through the supply chain. Indeed, it has been suggested
that “supply chains compete, not companies” (1). The idea being that the unique set
of relations that typify the web of inter-connections between organisations in a
network enable the achievement of competitive advantage through lower costs and/or
greater differentiation.
Because of the complexity of todays supply chains, due in part to out-sourcing and
globalisation, the way in which these relationships are structured and managed can
make the difference between profit and loss.
As McCullen and Towill (2) have shown, globalisation of supply chains compounds
the logistical problem along three dimensions. These are replenishment level; time;
and distance. Hence a marketplace ripple can be amplified and distorted as it passes
International Journal of Logistics Management, Vol. 13, No. 1, 2002 2
from, say, the UK to Indonesia. Furthermore, there may well be a significant delay
before any response occurs at (say) the raw material supplier. Additionally, customer
choice and the nature of the product means that in pipeline terms “one size does not fit
all” (3, 4). Hence matching the pipeline to the product is a key issue in the
engineering of global supply chains.
Many marketplaces are now highly volatile and demand is difficult to predict. The
acceleration of technological and fashion changes has additionally resulted in
extremely short product life cycles. In this new environment non-availability means
that in the event of non-supply the particular sales opportunity is lost forever (5).
Consequently the focus in supply chain management must shift from the idea of cost
as the order winner to responsiveness as the market winner. The implication is that
the emphasis in supply chain management in the future must be on agility.
Agility implies the ability of the supply chain to react quickly to changes in market
demand – be they changes in volume, variety or mix. The characteristics of the agile
supply chain have been described elsewhere (6), but it is useful to contrast agility with
the philosophy of lean operations. Lean thinking is most often associated with the car
assembly industry and Japan in particular. Agility & leanness are not opposing
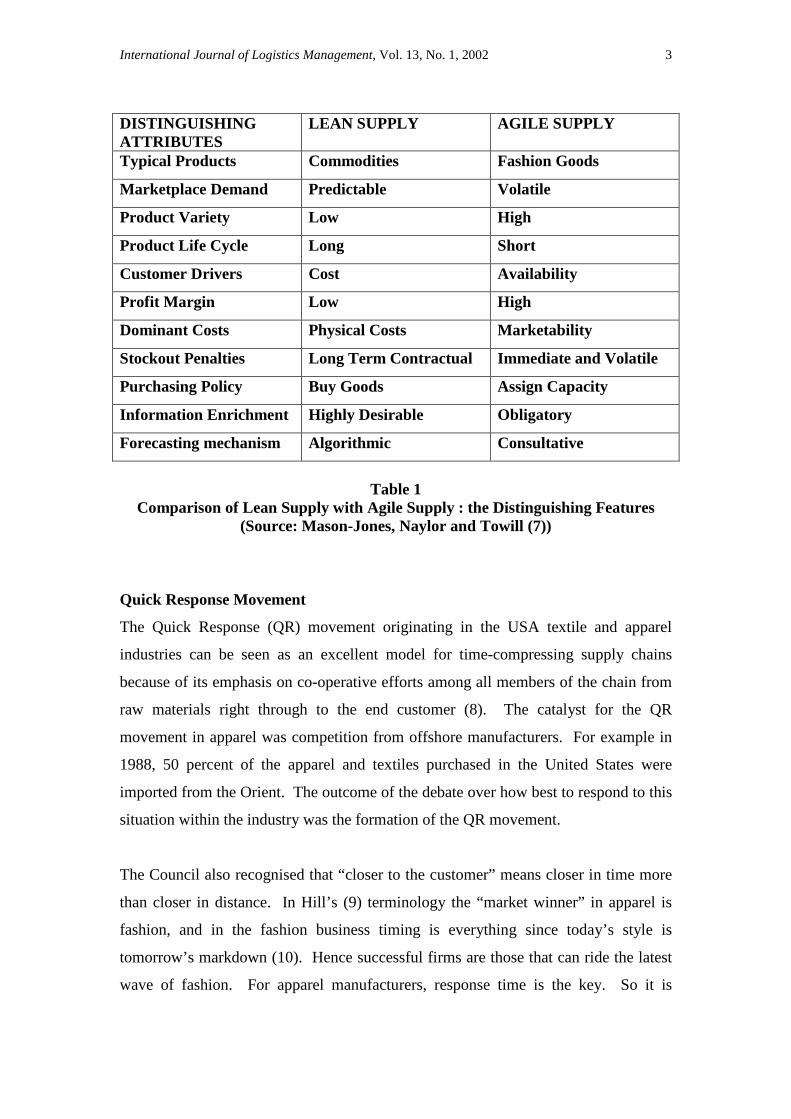
philosophies, rather they work best in certain contexts as Table 1 suggests.
International Journal of Logistics Management, Vol. 13, No. 1, 2002 3
DISTINGUISHINGATTRIBUTES
LEAN SUPPLY AGILE SUPPLY
Typical Products Commodities Fashion Goods
Marketplace Demand Predictable Volatile
Product Variety Low High
Product Life Cycle Long Short
Customer Drivers Cost Availability
Profit Margin Low High
Dominant Costs Physical Costs Marketability
Stockout Penalties Long Term Contractual Immediate and Volatile
Purchasing Policy Buy Goods Assign Capacity
Information Enrichment Highly Desirable Obligatory
Forecasting mechanism Algorithmic Consultative
Table 1Comparison of Lean Supply with Agile Supply : the Distinguishing Features
(Source: Mason-Jones, Naylor and Towill (7))
Quick Response Movement
The Quick Response (QR) movement originating in the USA textile and apparel
industries can be seen as an excellent model for time-compressing supply chains
because of its emphasis on co-operative efforts among all members of the chain from
raw materials right through to the end customer (8). The catalyst for the QR
movement in apparel was competition from offshore manufacturers. For example in
1988, 50 percent of the apparel and textiles purchased in the United States were
imported from the Orient. The outcome of the debate over how best to respond to this
situation within the industry was the formation of the QR movement.
The Council also recognised that “closer to the customer” means closer in time more
than closer in distance. In Hill’s (9) terminology the “market winner” in apparel is
fashion, and in the fashion business timing is everything since today’s style is
tomorrow’s markdown (10). Hence successful firms are those that can ride the latest
wave of fashion. For apparel manufacturers, response time is the key. So it is
International Journal of Logistics Management, Vol. 13, No. 1, 2002 4
essential to judge quickly what is selling and move it through the pipeline and onto
the racks before competitors (11).
Quick response provides a remedy to this problem by compressing the total pipeline,
thus eliminating some of those efficiency losses by moving manufacturing closer to
the consumer’s buying decision. Long pipelines also means that forecast horizons are
extended with the inevitable impact on forecast errors. As a rule of thumb the
forecast errors are as follows:
Start of Season ± 10%
Minus 16 weeks ± 20%
Minus 26 weeks ± 40%
QR has been defined at length by Lowson et al (12) as:
“A state of responsiveness and flexibility in which an organisation seeks to provide a
highly diverse range of products and services to a customer/consumer in the exact
quantity, variety and quality, and at the right time, place and price as dictated by real-
time customer/consumer demand. QR provides the ability to make demand
information driven decisions at the last possible moment in time ensuring that
diversity of offering is maximised and lead-times, expenditure, cost and inventory
minimised. QR places an emphasis upon flexibility and product velocity in order to
meet the changing requirements of a highly competitive, volatile and dynamic
marketplace. QR encompasses a strategy, structure, culture and set of operational
procedures aimed at integrating enterprises in a mutual network through rapid
information transfer and profitable exchange of activity.”
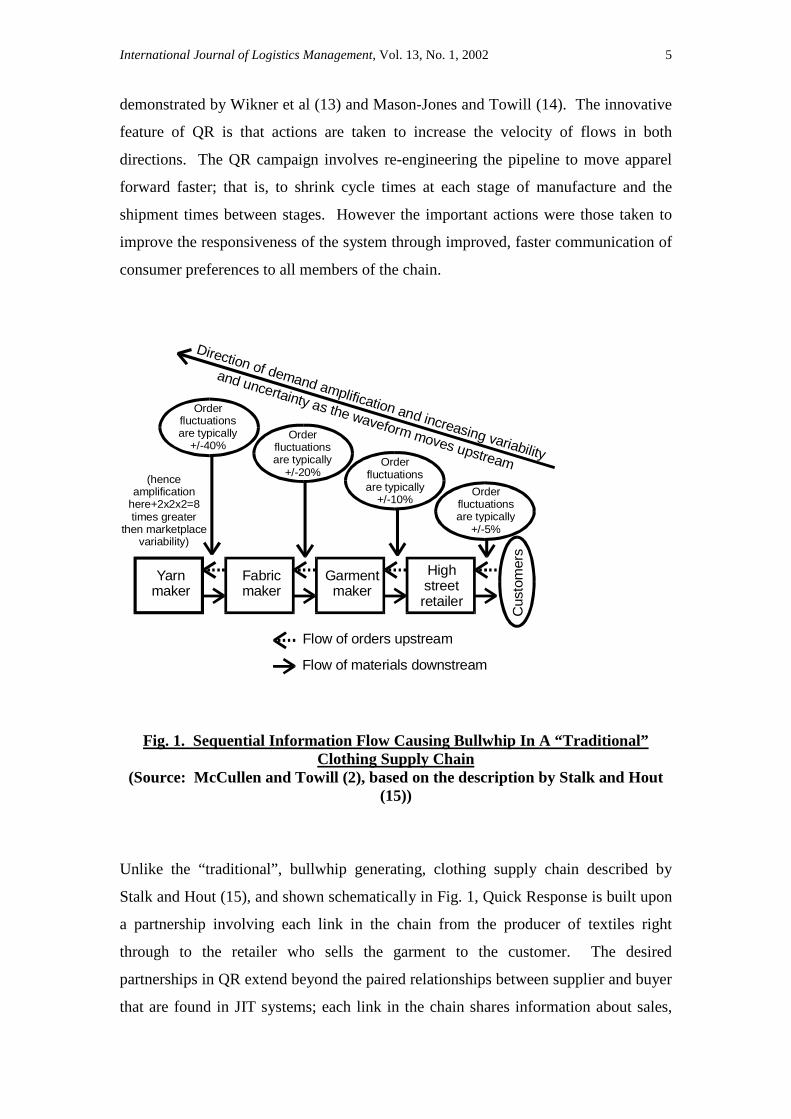
The significant conceptual breakthrough made in the QR movement was identifying
and exploiting the fact that the supply chain is a system of bi-directional flows. So
goods flow forward from the textile producer to the customer and information about
consumer demand, orders, and capacity commitments flows backward to apparel and
textile manufacturers. In control systems terminology this is a system with both
information feedforward and feedback, the advantages of which have been ably
International Journal of Logistics Management, Vol. 13, No. 1, 2002 5
demonstrated by Wikner et al (13) and Mason-Jones and Towill (14). The innovative
feature of QR is that actions are taken to increase the velocity of flows in both
directions. The QR campaign involves re-engineering the pipeline to move apparel
forward faster; that is, to shrink cycle times at each stage of manufacture and the
shipment times between stages. However the important actions were those taken to
improve the responsiveness of the system through improved, faster communication of
consumer preferences to all members of the chain.
Fig. 1. Sequential Information Flow Causing Bullwhip In A “Traditional”Clothing Supply Chain
(Source: McCullen and Towill (2), based on the description by Stalk and Hout(15))
Unlike the “traditional”, bullwhip generating, clothing supply chain described by
Stalk and Hout (15), and shown schematically in Fig. 1, Quick Response is built upon
a partnership involving each link in the chain from the producer of textiles right
through to the retailer who sells the garment to the customer. The desired
partnerships in QR extend beyond the paired relationships between supplier and buyer
that are found in JIT systems; each link in the chain shares information about sales,
Fabricmaker
Yarnmaker
Garmentmaker
Highstreetretailer
Flow of orders upstream
Flow of materials downstream
Cus
tom
ers
Orderfluctuationsare typically
+/-5%
Orderfluctuationsare typically
+/-10%
Orderfluctuationsare typically
+/-20%
Orderfluctuationsare typically
+/-40%
(henceamplification
here+2x2x2=8times greater
then marketplacevariability)
Direction of demand amplification and increasing variability
and uncertainty as the waveform moves upstream
International Journal of Logistics Management, Vol. 13, No. 1, 2002 6
orders, and inventories with the others. Retailers communicate information about
sales, not only to the apparel manufacturer, but also back to the textile producer.
Mutual co-operation among all partners is required if the system is to succeed in its
goal of increasing sales with less inventory in the total system. A successful
partnership means higher inventory turns and improved return on investment for each
link in the chain.
A trend to off-shore sourcing
As we have previously noted, offshore sourcing and manufacturing has been an
increasing trend across much of Western industry for several decades. The
motivation for this tendency to offshore sourcing has been primarily cost. However,
it could be argued that the concept of cost that has been employed in those decisions
is narrow in the extreme because the cost criteria employed is essentially the unit cost
of manufacture or purchase. Costs such as those associated with today’s wider view
of the supply chain are often ignored. Thus rarely is a realistic charge placed upon the
additional inventory that inevitably will be created as pipelines lengthen, neither is a
cost placed upon the risk that this might generate in terms of obsolescence, equally
the impact on the firm’s agility is not factored into the equation.
Whole sectors of industry – particularly in electronics and clothing – have migrated to
the Far East as the search for lower labour cost intensifies. Strangely, even industries
where labour costs represent only a small part of total value-added such as semi-
conductor fabrication have been seduced by this general trend.
A study by Lowson (16) of fifty European Union retailers found that 70% of their
total purchases came from outside the EU at purchase prices up to 35% lower than
could be obtained locally. Companies such as Marks & Spencer who as recently as
1990 sourced almost 100% of their garments in the British Isles (UK and Republic of
Ireland) had reduced this by half by 2000. A shirt sourced in Indonesia could be
purchased by Marks & Spencer buyers for £2.69 compared to £6.01 in Northern
Ireland (17).
Lowson also highlighted the fact that the retailers in his study were typically working
on order to delivery lead-times of between 48 and 60 weeks when ordering from
International Journal of Logistics Management, Vol. 13, No. 1, 2002 7
Asian sources. This clearly inhibits their agility and has the potential to place
themselves at some risk if demand for those products does not come up to
expectations.
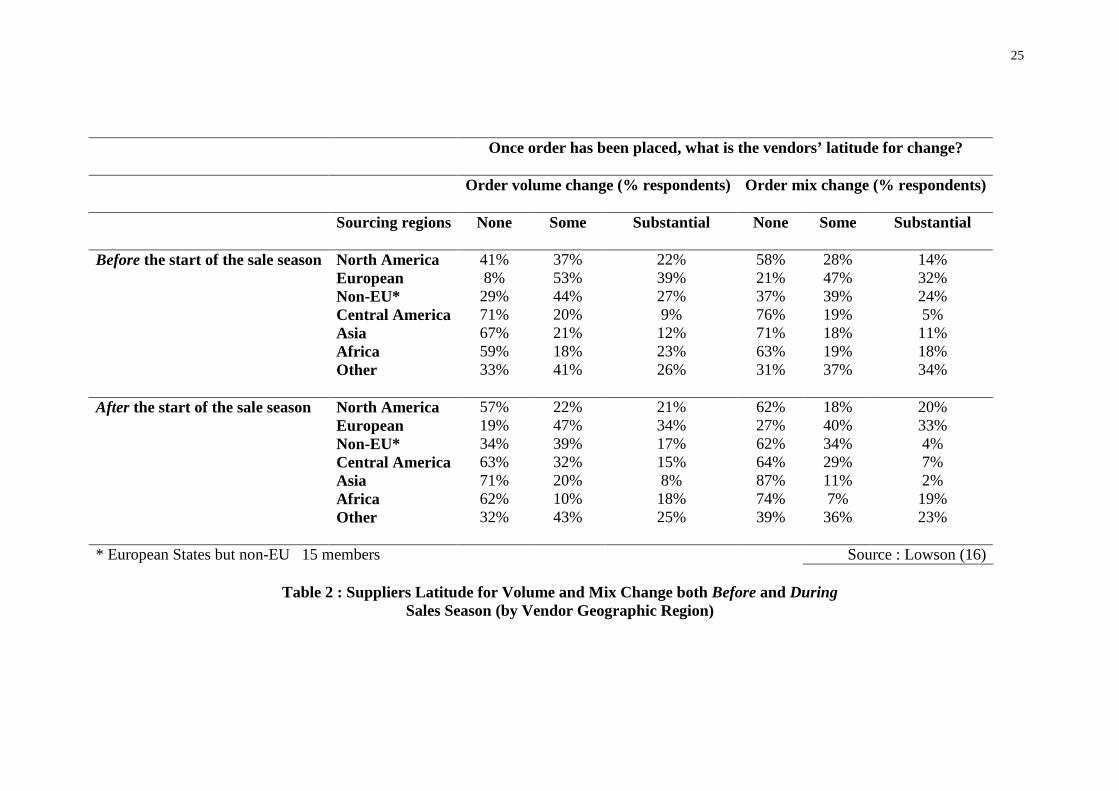
The same survey also examined the extent to which retailers’ flexibility was affected
by their choice of sourcing location. The findings are summarised in Table 2 below.
Take in table 2
To highlight the differences in flexibility and responsiveness by source location we
have applied a numerical weight to each column as follows:-
None x 0
Some x 1
Substantial x 3
The three resulting scores are then summed and divided by 300% (the maximum
possible score) to produce a metric highlighting volume and mix responsiveness
before and after the sales season commences. It seeks to provide a single aggregate
“score” which sheds insight into sourcing decisions, especially when coupled with
vendor lead times.
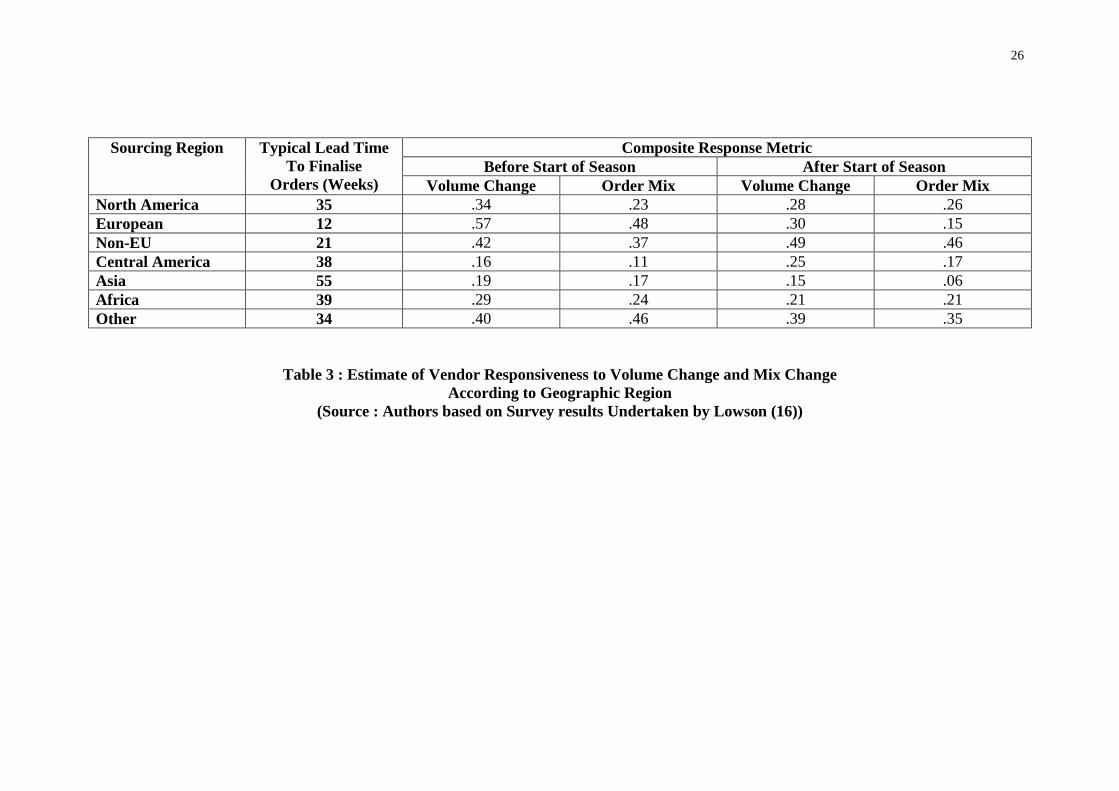
Table 3 shows the resulting scores along with the average lead-time that the
respondents associated with each sourcing location.
Take in table 3
These results suggest that the loss of flexibility that results from sourcing offshore can
be significant. The paradox is that these data are derived from retailers themselves
but dramatic though they may be, they seem not to influence the manufacturing cost-
based sourcing decisions. Whilst these findings result from a survey of retailers they
are not dissimilar to the experience of companies in industries such as electronics or
high technology generally.
International Journal of Logistics Management, Vol. 13, No. 1, 2002 8
What is called for is a wider definition of costs which is based upon total supply chain
costs. The limited definition of cost that is still the main driver in sourcing decisions
(i.e. unit manufacturing or purchase cost) is clearly inadequate and will not reflect the
true total costs of ownership. True supply chain costs need to incorporate such
elements as:-
Inventory carrying costs
cost of mark-downs
cost of loss sales
transaction costs (including letters of credit, customs clearance)
transportation (including emergency airfreight)
warehousing
duties
There will be many occasions where, even taking all the above costs into account, it
will still make sense to source in low-cost, offshore locations. For example, standard
products with limited variation in demand. However for other products where
demand is much more volatile and harder to predict, local sourcing may be preferable.
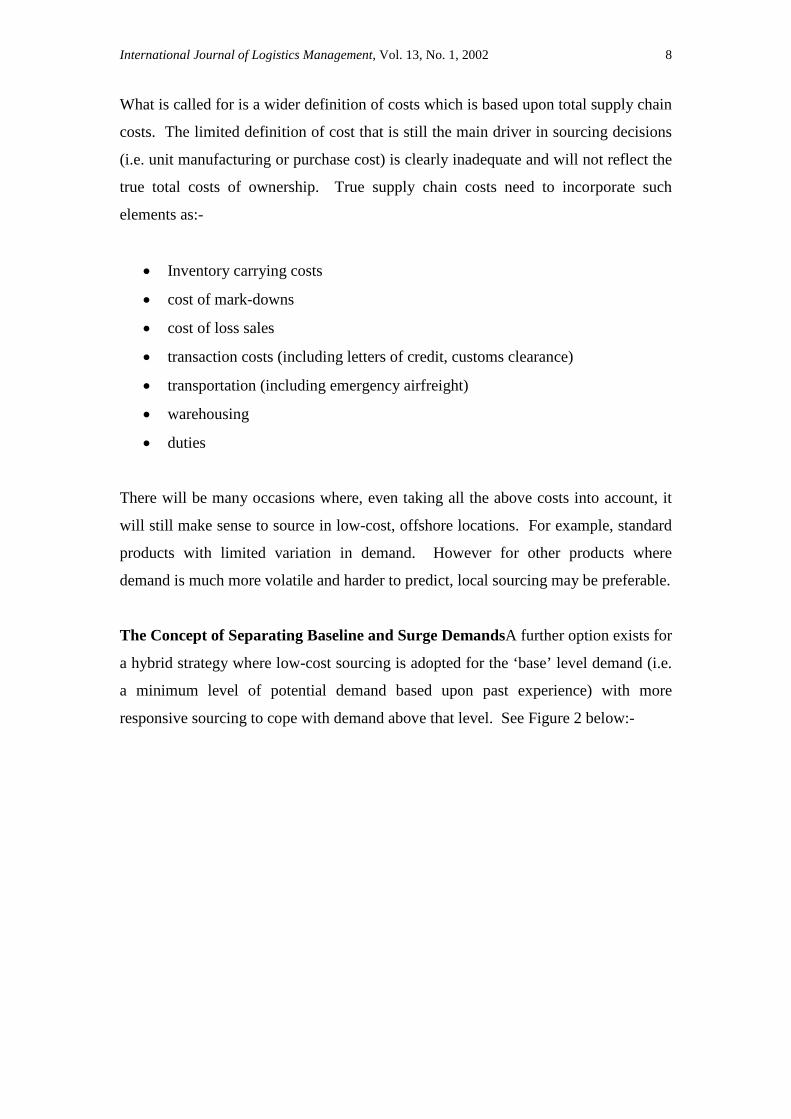
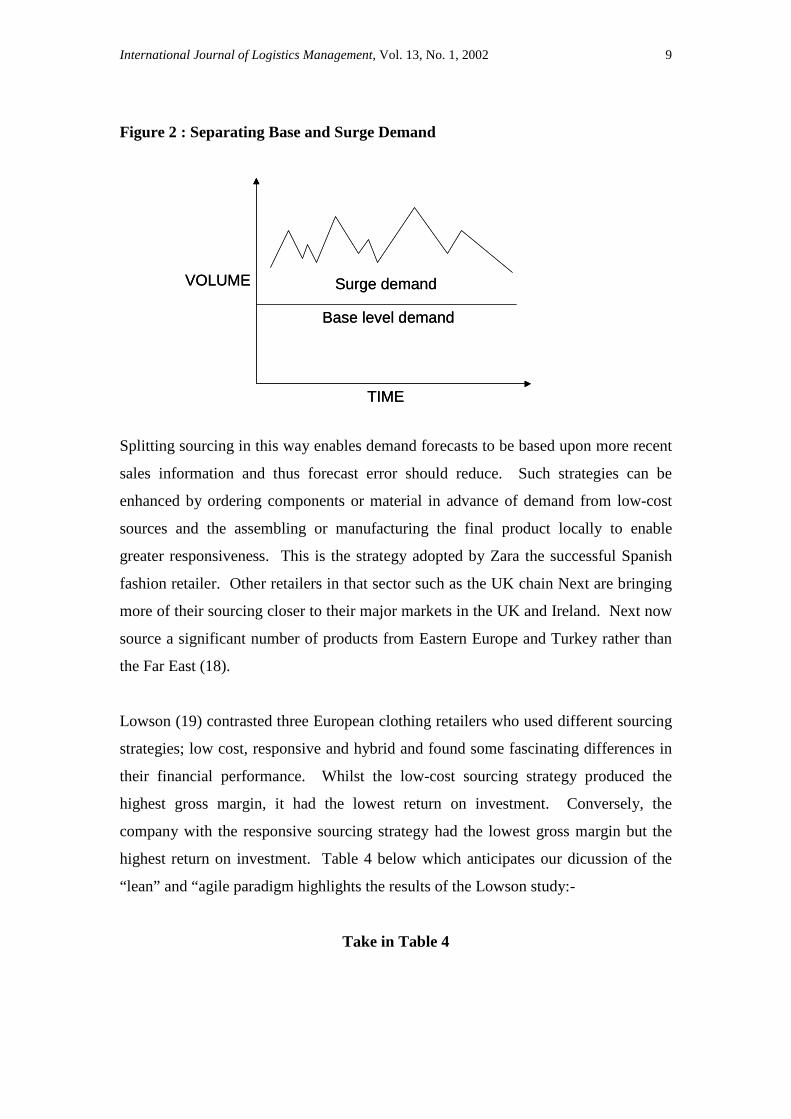
The Concept of Separating Baseline and Surge DemandsA further option exists for
a hybrid strategy where low-cost sourcing is adopted for the ‘base’ level demand (i.e.
a minimum level of potential demand based upon past experience) with more
responsive sourcing to cope with demand above that level. See Figure 2 below:-
International Journal of Logistics Management, Vol. 13, No. 1, 2002 9
Figure 2 : Separating Base and Surge Demand
Splitting sourcing in this way enables demand forecasts to be based upon more recent
sales information and thus forecast error should reduce. Such strategies can be
enhanced by ordering components or material in advance of demand from low-cost
sources and the assembling or manufacturing the final product locally to enable
greater responsiveness. This is the strategy adopted by Zara the successful Spanish
fashion retailer. Other retailers in that sector such as the UK chain Next are bringing
more of their sourcing closer to their major markets in the UK and Ireland. Next now
source a significant number of products from Eastern Europe and Turkey rather than
the Far East (18).
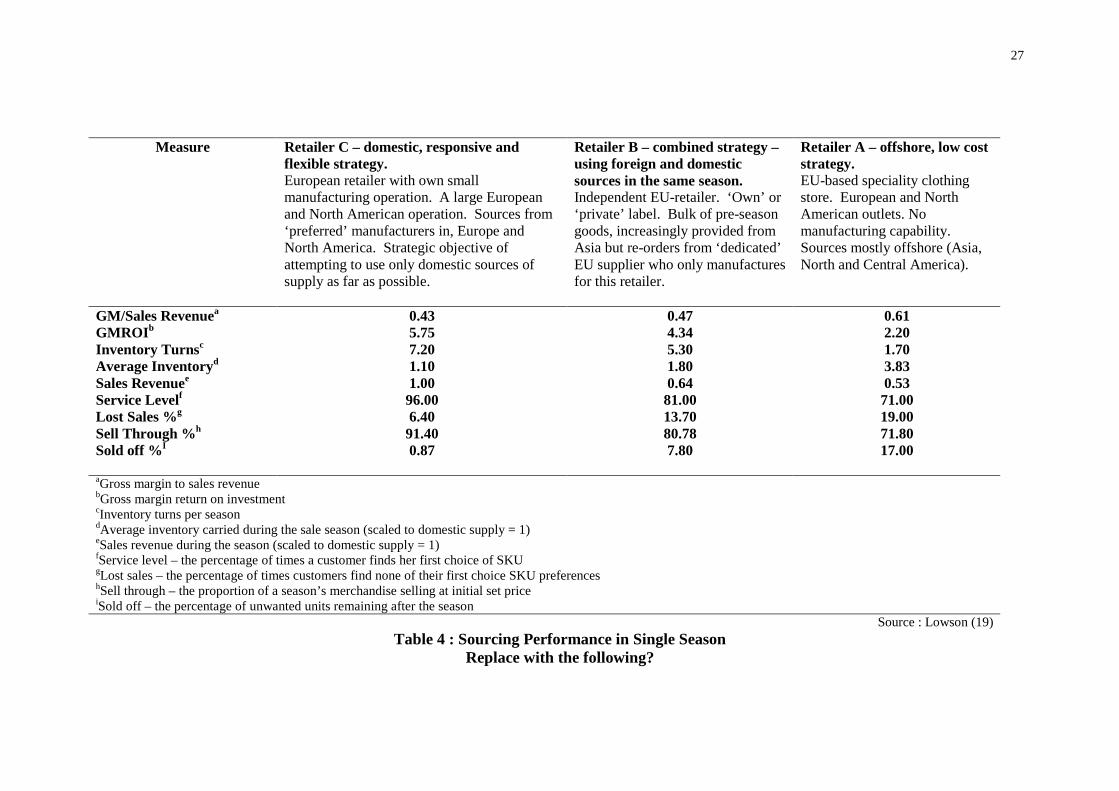
Lowson (19) contrasted three European clothing retailers who used different sourcing
strategies; low cost, responsive and hybrid and found some fascinating differences in
their financial performance. Whilst the low-cost sourcing strategy produced the
highest gross margin, it had the lowest return on investment. Conversely, the
company with the responsive sourcing strategy had the lowest gross margin but the
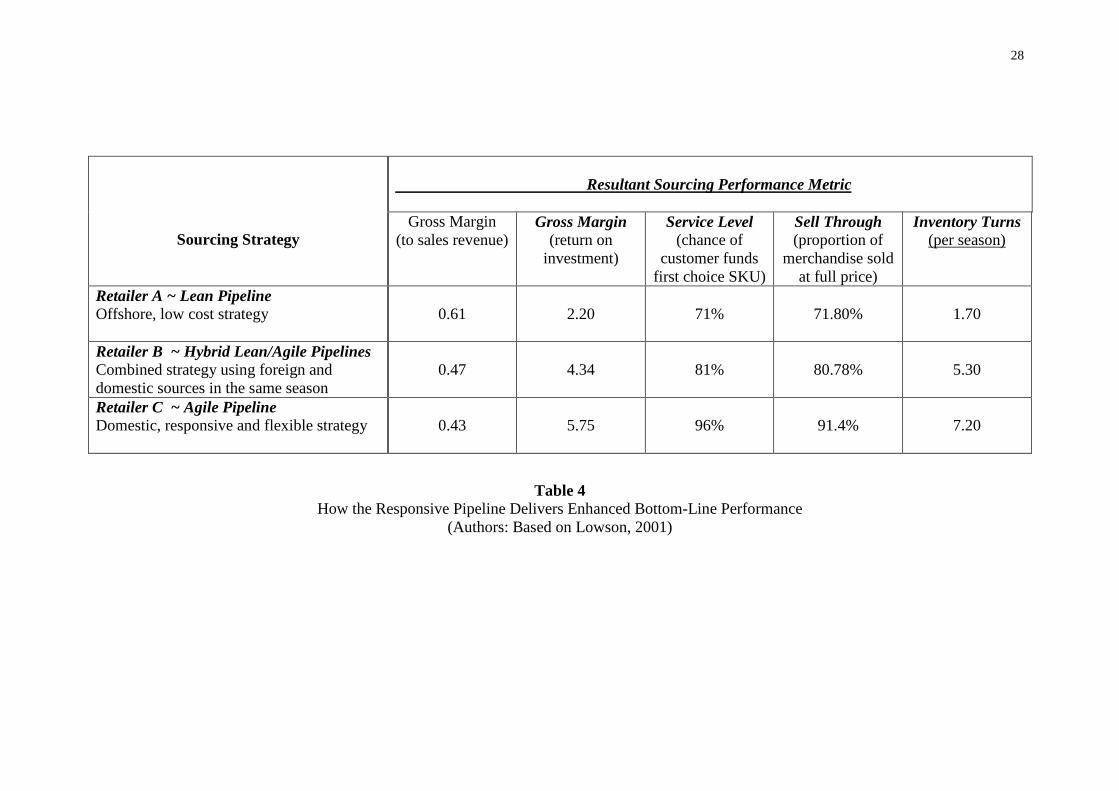
highest return on investment. Table 4 below which anticipates our dicussion of the
“lean” and “agile paradigm highlights the results of the Lowson study:-
Take in Table 4
TIME
Base level demand
VOLUME Surge demand
TIME
Base level demand
VOLUME Surge demand
International Journal of Logistics Management, Vol. 13, No. 1, 2002 10
The Decline of an Icon
As an example of a business which has faced challenges in managing a global
pipeline in a volatile market, we need look no further than Marks and Spencer (M&S),
a well-known UK retailer. As summarised by Christopher and Peck (20) the company
had had a century of unbridled success, prior to their fall from grace. In the 1920s the
business adopted the then revolutionary policy of buying direct from manufacturers,
instead of through wholesalers. These unique supplier relationships gave the business
an advantage that few of its rivals could match. By 1930 it was already recognisable
as an established and effective practitioner of keiritsu with its supply base (21).
Historically M&S has designed most of its clothes in-house before putting the designs
forward to favoured manufacturers with notoriously strict specifications regarding the
finished product. These manufacturers provided dedicated facilities for M&S who
required suppliers to refrain from bidding for work from other clients. The close
partnerships arrangements also relieved M&S of the need to allocate resources of its
own to technological research and development activities. The outcome of servicing
such a demanding client was a culture of continuous improvement within the
suppliers organisations and the loyalty of M&S through both good times and bad.
But this UK based supply strategy was inhibiting the development of the retail
business in Asia and the Pacific. Also M&S still officially encouraged its suppliers to
source in the UK, enabling it to maintain its ‘buy-British’ marketing stance. But their
suppliers were now struggling to remain price-competitive. Hence some had
therefore opted to supply at least a proportion of M&S’s orders from overseas
facilities or buy-in virtually finished goods produced in low-cost manufacturing
centres such as China. So in order to comply with “home” sourcing requirements, the
garments were then shipped to the UK for finishing. Some of the consignment would
then need to be returned to the region of origin for sale! This round-trip lengthened
the time delay before goods appeared in the shops, and in some instances distribution
charges added as much as £14 to an item that cost only £4 to make.
In 1998/99 failure to match supply with demand resulted in too much winter stock
costing M&S £150 million, of which £90 million was lost from pre-Christmas sales,
the remaining £60 million being the cost of clearing the excess stock. Some critics
International Journal of Logistics Management, Vol. 13, No. 1, 2002 11
pointed to overpricing and poor service as the reasons behind these falling sales.
Others claimed that customers were unhappy about a drop in quality of some
products. Retail analysts were also talking of a decline in product quality, putting it
down to an increase in overseas sourcing. In 1983 the company had sourced 90% of
its clothing in the UK, by 1994 this had slipped to 75% and then further downwards to
an estimated 65% in 1998. To become price competitive, M&S was then urging its
largest suppliers to relocate production to low-wage economies. By January 2000
M&S was indeed achieving its stated target by sourcing roughly 50% of its clothing
and general merchandise outside the UK.
When Price Deflation Impacts Demand
Historically M&S bought stock to cover over 100% of budgeted sales. Even now
they still make a forward commitment to 90% of the season’s merchandise. So the
10% uncommitted means there is far too little scope to respond when real demand is
known.
Wheatcroft (22) further infers that the company’s problems result largely from a
failure by M&S to remedy core problems relating to supply chain design and
operation. The symptoms are clearly visible via product-mix mismatch and non-
availability of key goods, especially in shoes and clothing. Disastrous performance in
these two product ranges dragged down comparable sales for M&S as a whole by
8.4% for the five weeks to November 4, 2000. Typically, poor availability cost the
knitwear division around £M6 in lost sales, and similar problems in the footwear
division cost around £M5. Even more surprising and worrying to the company is the
availability problem continuing to surround lingerie supply, which has a relatively
stable and predictable demand pattern.
In contrast the year 2000 performance of their UK competitor Next was outstanding.
Next share price rose 42p to 650p following pre-tax rise in profits of 18%.
Furthermore the Next CEO disputed claims that M&S were suffering from the
polarisation of the high street clothing market into branded goods at one end and
discounted goods at the other. His view was that “Peoples’ shopping habits are not
changing. You just have to be good at what you do.” The Next strategy is to be
aspirational and affordable. Shopping on price deflation has come to an end.
International Journal of Logistics Management, Vol. 13, No. 1, 2002 12
Shoppers are opting for higher-priced items as consumers become more interested in
quality and design.” (22). The Next sales growth continues to be maintained.
Designing and managing the supply chain to deliver just what the customer wants yet
again appears to be the key to business success.
As noted by Perry et al (23) in Australia there is now a clear trend for suppliers to the
domestic market to focus on high value-added local-demand products that can
compete with offshore imports. Also the evolution of the information economy has
had a clear impact on the Australian textile, clothing and footwear industry, providing
a potential means of control over emerging global supply chains. Communication
with overseas supply chain partners was a challenge, calling for high levels of use of
secure Extranets, EDI transaction platforms, CAD/CAM design and specification
transfer, email, facsimiles and the telephone. Perry et al (23) concluded that there is a
need for new organisational paradigms to cater for the increasingly complex supply
chain. In leadership terms they found that the close-knit retail-to-upstream supplier
partnerships that had been originally encouraged through government workshops and
assistance programmes had been eroded somewhat through the retreat of the retailers
back to their traditional power-based role of setting terms and standards for suppliers.
Role of “Lean” and “Agile” Paradigms in Modern Supply Chains
There has recently been some significant debate about the relative merits of the so-
called “lean” and “agile” approaches to supply chain management. There has been a
tendency to suggest that these approaches are mutually exclusive and represent
conflicting paradigms. In reality the two approaches can complement each other, and
in many cases there is a requirement for a “hybrid” lean/agile strategy to be adopted,
(24). Hence it is our contention that the issue is not “Lean versus Agile” rather it is
the judicious selection and integration of appropriate aspects of these paradigms
appropriate to the particular supply chain strategy.
The idea of “lean manufacturing” was popularised by Womack, Jones and Roos, (25),
together with the wider concepts of the “lean enterprise” (26). The focus of the lean
approach has essentially been on the elimination of waste or muda. The upsurge of
interest in lean manufacturing can be traced to the Toyota Production System (TPS)
with its focus on the reduction and elimination of waste. However, the origins of lean
International Journal of Logistics Management, Vol. 13, No. 1, 2002 13
manufacture are certainly visible in Spitfire aircraft production in the UK in World
War II, and Keiretsu date back to the USA automotive industry in 1915.
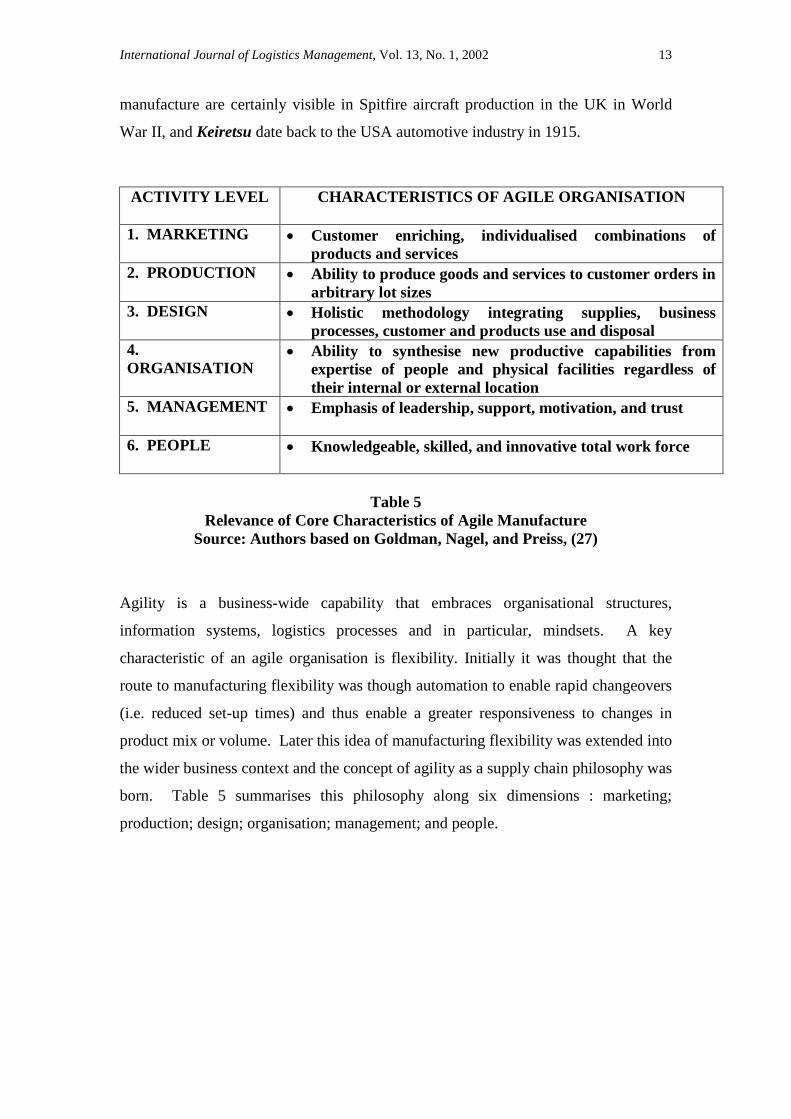
ACTIVITY LEVEL CHARACTERISTICS OF AGILE ORGANISATION
1. MARKETING Customer enriching, individualised combinations ofproducts and services
2. PRODUCTION Ability to produce goods and services to customer orders inarbitrary lot sizes
3. DESIGN Holistic methodology integrating supplies, businessprocesses, customer and products use and disposal
4.ORGANISATION
Ability to synthesise new productive capabilities fromexpertise of people and physical facilities regardless oftheir internal or external location
5. MANAGEMENT Emphasis of leadership, support, motivation, and trust
6. PEOPLE Knowledgeable, skilled, and innovative total work force
Table 5Relevance of Core Characteristics of Agile Manufacture
Source: Authors based on Goldman, Nagel, and Preiss, (27)
Agility is a business-wide capability that embraces organisational structures,
information systems, logistics processes and in particular, mindsets. A key
characteristic of an agile organisation is flexibility. Initially it was thought that the
route to manufacturing flexibility was though automation to enable rapid changeovers
(i.e. reduced set-up times) and thus enable a greater responsiveness to changes in
product mix or volume. Later this idea of manufacturing flexibility was extended into
the wider business context and the concept of agility as a supply chain philosophy was
born. Table 5 summarises this philosophy along six dimensions : marketing;
production; design; organisation; management; and people.
International Journal of Logistics Management, Vol. 13, No. 1, 2002 14
AgileSupply
Lean Supply
Market Qualifiers Market Winners
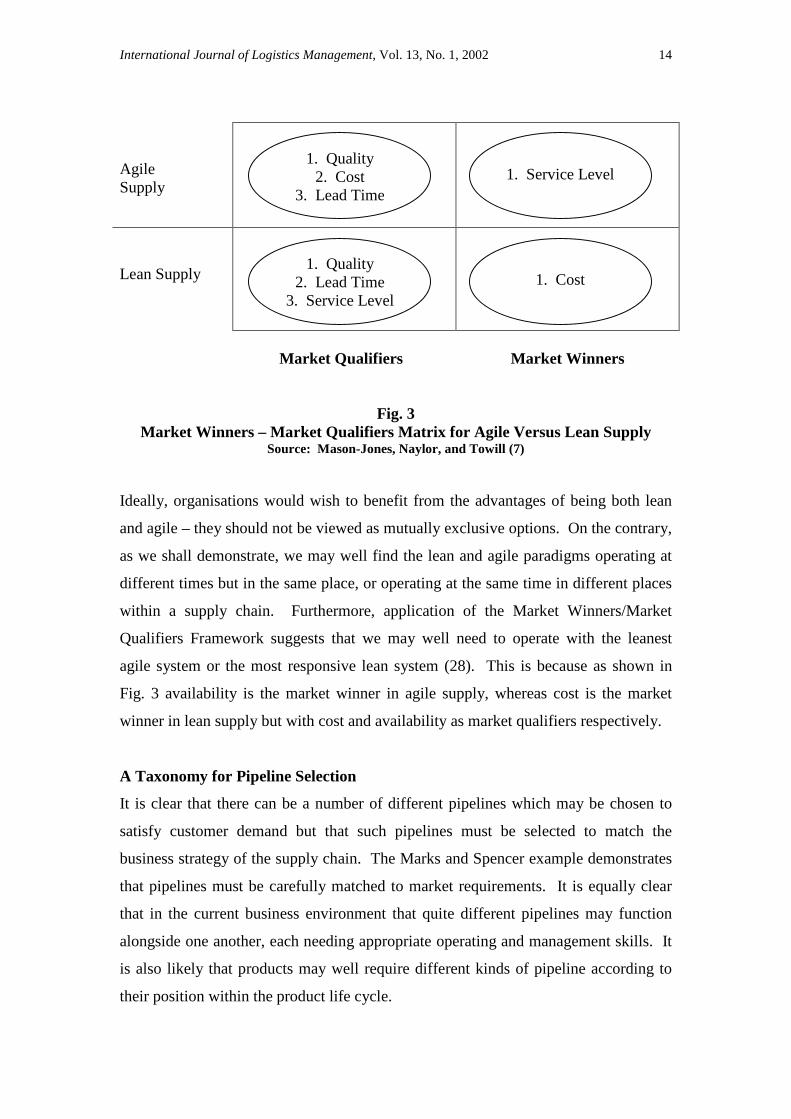
Fig. 3Market Winners – Market Qualifiers Matrix for Agile Versus Lean Supply
Source: Mason-Jones, Naylor, and Towill (7)
Ideally, organisations would wish to benefit from the advantages of being both lean
and agile – they should not be viewed as mutually exclusive options. On the contrary,
as we shall demonstrate, we may well find the lean and agile paradigms operating at
different times but in the same place, or operating at the same time in different places
within a supply chain. Furthermore, application of the Market Winners/Market
Qualifiers Framework suggests that we may well need to operate with the leanest
agile system or the most responsive lean system (28). This is because as shown in
Fig. 3 availability is the market winner in agile supply, whereas cost is the market
winner in lean supply but with cost and availability as market qualifiers respectively.
A Taxonomy for Pipeline Selection
It is clear that there can be a number of different pipelines which may be chosen to
satisfy customer demand but that such pipelines must be selected to match the
business strategy of the supply chain. The Marks and Spencer example demonstrates
that pipelines must be carefully matched to market requirements. It is equally clear
that in the current business environment that quite different pipelines may function
alongside one another, each needing appropriate operating and management skills. It
is also likely that products may well require different kinds of pipeline according to
their position within the product life cycle.
1. Quality2. Cost
3. Lead Time1. Service Level
1. Cost1. Quality
2. Lead Time3. Service Level
International Journal of Logistics Management, Vol. 13, No. 1, 2002 15
So pipelines are not fixed for all times. What is needed is continuous assessment of
the product range and market characteristics so that changing scenarios may be
identified. Against these product/market characteristics will be a number of
alternative options for pipeline design, dependent upon supply lead-times.
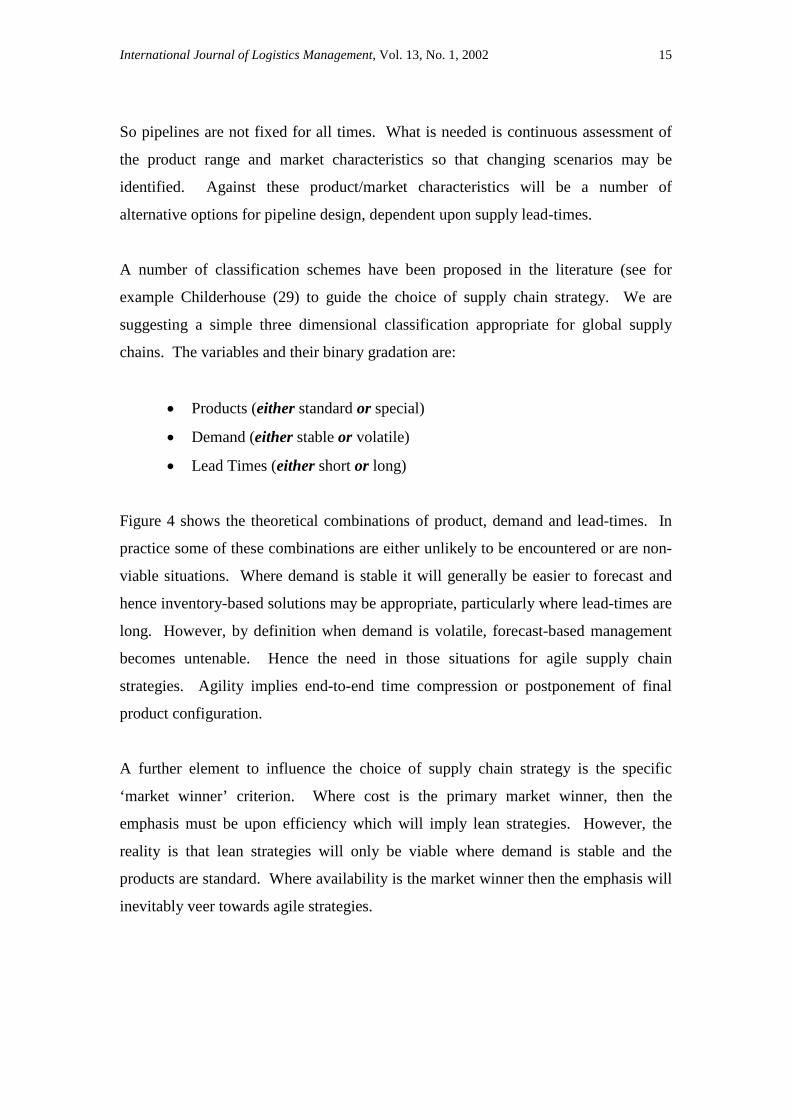
A number of classification schemes have been proposed in the literature (see for
example Childerhouse (29) to guide the choice of supply chain strategy. We are
suggesting a simple three dimensional classification appropriate for global supply
chains. The variables and their binary gradation are:
Products (either standard or special)
Demand (either stable or volatile)
Lead Times (either short or long)
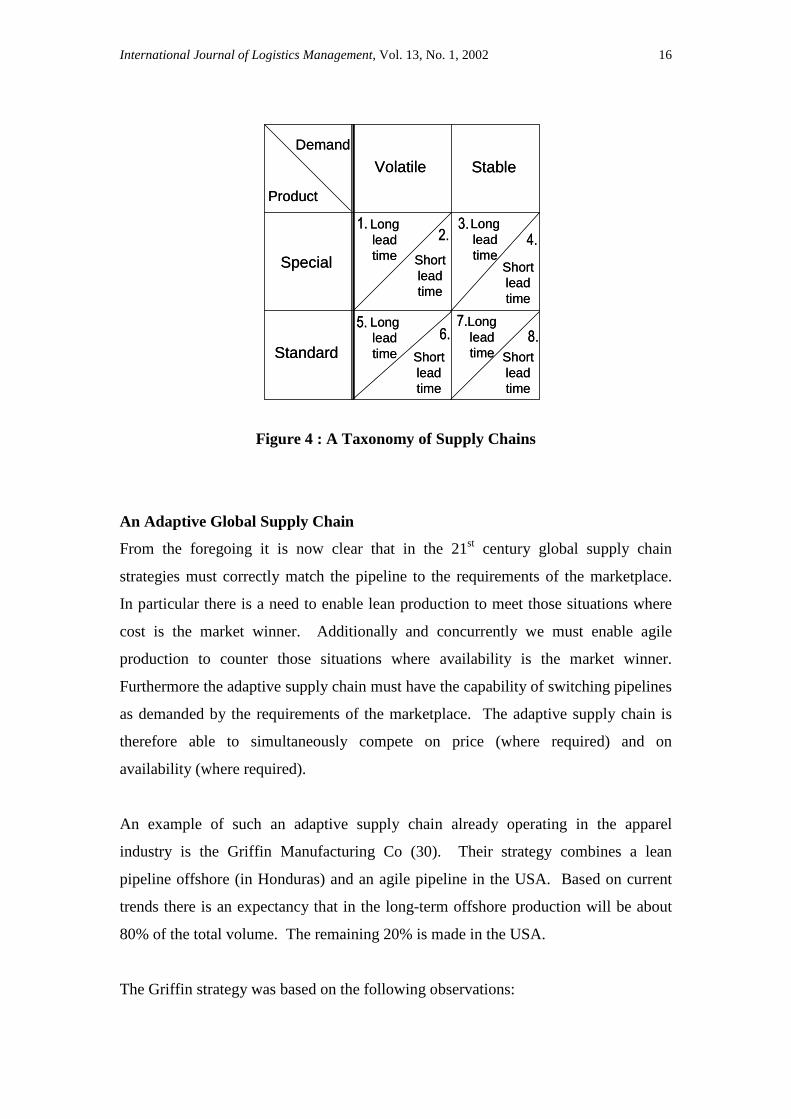
Figure 4 shows the theoretical combinations of product, demand and lead-times. In
practice some of these combinations are either unlikely to be encountered or are non-
viable situations. Where demand is stable it will generally be easier to forecast and
hence inventory-based solutions may be appropriate, particularly where lead-times are
long. However, by definition when demand is volatile, forecast-based management
becomes untenable. Hence the need in those situations for agile supply chain
strategies. Agility implies end-to-end time compression or postponement of final
product configuration.
A further element to influence the choice of supply chain strategy is the specific
‘market winner’ criterion. Where cost is the primary market winner, then the
emphasis must be upon efficiency which will imply lean strategies. However, the
reality is that lean strategies will only be viable where demand is stable and the
products are standard. Where availability is the market winner then the emphasis will
inevitably veer towards agile strategies.
International Journal of Logistics Management, Vol. 13, No. 1, 2002 16
Figure 4 : A Taxonomy of Supply Chains
An Adaptive Global Supply Chain
From the foregoing it is now clear that in the 21st century global supply chain
strategies must correctly match the pipeline to the requirements of the marketplace.
In particular there is a need to enable lean production to meet those situations where
cost is the market winner. Additionally and concurrently we must enable agile
production to counter those situations where availability is the market winner.
Furthermore the adaptive supply chain must have the capability of switching pipelines
as demanded by the requirements of the marketplace. The adaptive supply chain is
therefore able to simultaneously compete on price (where required) and on
availability (where required).
An example of such an adaptive supply chain already operating in the apparel
industry is the Griffin Manufacturing Co (30). Their strategy combines a lean
pipeline offshore (in Honduras) and an agile pipeline in the USA. Based on current
trends there is an expectancy that in the long-term offshore production will be about
80% of the total volume. The remaining 20% is made in the USA.
The Griffin strategy was based on the following observations:
Volatile Stable
Special
Standard
Demand
Product
Longleadtime
1.2.
Shortleadtime
3.4.
5.6.
7.8.
Longleadtime
Longleadtime
LongleadtimeShort
leadtime
Shortleadtime
Shortleadtime
Volatile Stable
Special
Standard
Demand
Product
Longleadtime
1.2.
Shortleadtime
3.4.
5.6.
7.8.
Longleadtime
Longleadtime
LongleadtimeShort
leadtime
Shortleadtime
Shortleadtime
International Journal of Logistics Management, Vol. 13, No. 1, 2002 17
A significant fraction of orders requires “instant” response
Forecasting accuracy is quite poor for a significant percentage of styles
Excess inventory is very expensive
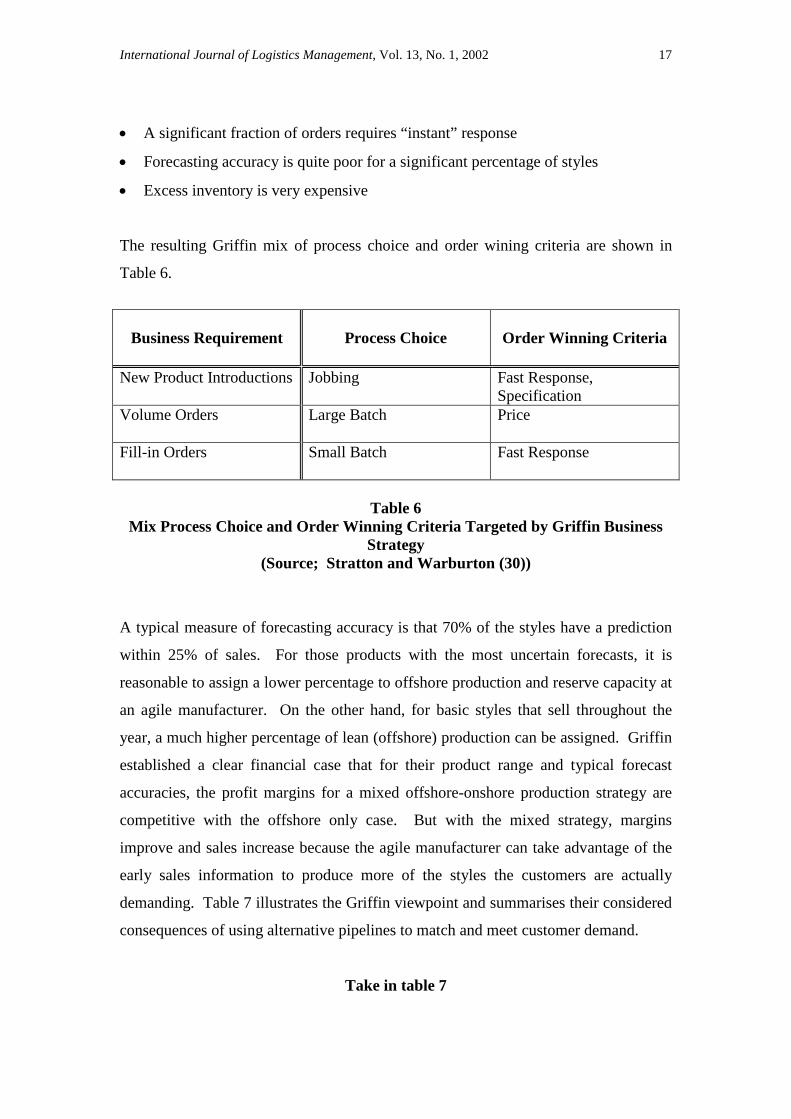
The resulting Griffin mix of process choice and order wining criteria are shown in
Table 6.
Business Requirement Process Choice Order Winning Criteria
New Product Introductions Jobbing Fast Response,Specification
Volume Orders Large Batch Price
Fill-in Orders Small Batch Fast Response
Table 6Mix Process Choice and Order Winning Criteria Targeted by Griffin Business
Strategy(Source; Stratton and Warburton (30))
A typical measure of forecasting accuracy is that 70% of the styles have a prediction
within 25% of sales. For those products with the most uncertain forecasts, it is
reasonable to assign a lower percentage to offshore production and reserve capacity at
an agile manufacturer. On the other hand, for basic styles that sell throughout the
year, a much higher percentage of lean (offshore) production can be assigned. Griffin
established a clear financial case that for their product range and typical forecast
accuracies, the profit margins for a mixed offshore-onshore production strategy are
competitive with the offshore only case. But with the mixed strategy, margins
improve and sales increase because the agile manufacturer can take advantage of the
early sales information to produce more of the styles the customers are actually
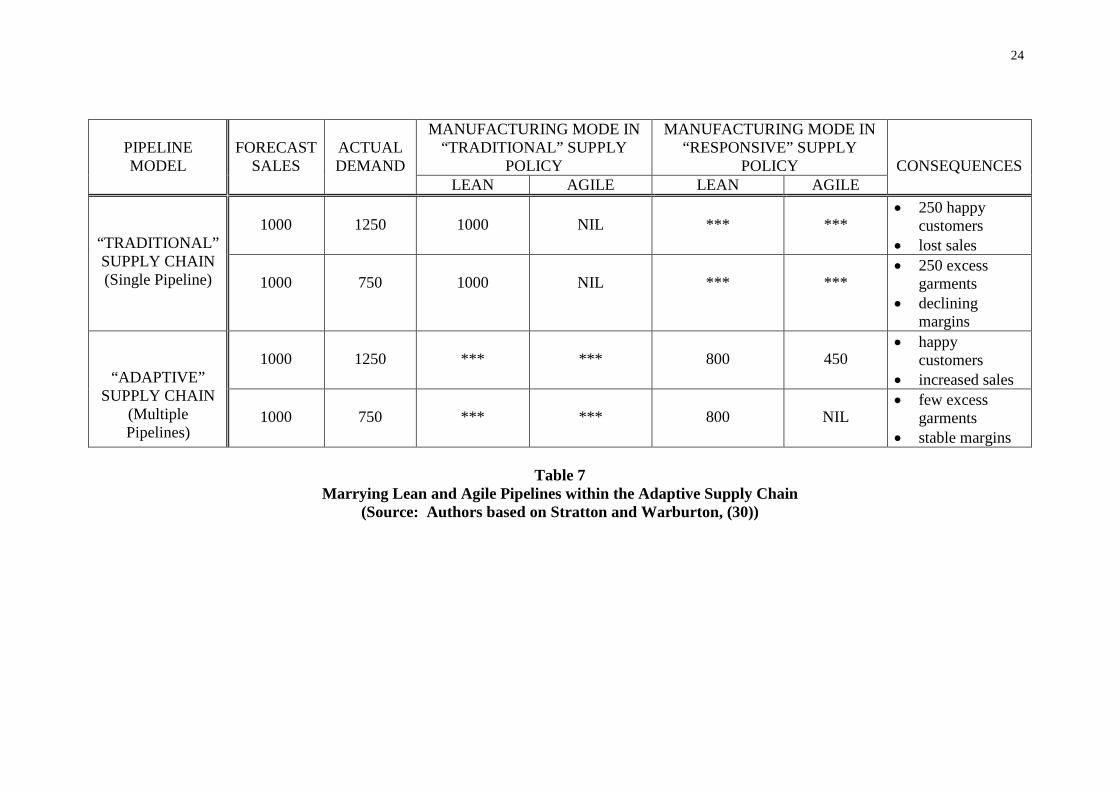
demanding. Table 7 illustrates the Griffin viewpoint and summarises their considered
consequences of using alternative pipelines to match and meet customer demand.
Take in table 7
International Journal of Logistics Management, Vol. 13, No. 1, 2002 18
There are a number of challenges associated with the mixed (adaptive pipeline)
strategy such as sharing the pain between retailer and manufacturer. In one sense
what is required of the retailer using the adaptive supply chain is a much more
challenging approach. Rather than ordering to forecast, the retailer has to analyse
forecasts. It is their remit to decide on offshore (lean) production commitments, and
USA (agile) capacity reservation. Hence retailers must share their sales data and
work continuously with manufacturers to get the exact inventory they need. When
sales increase, everyone will be satisfied. The retailer sells more products with fewer
markdowns, resulting in less excess inventory. Also, the manufacturer can make
minor adjustments (e.g. fill in sizes) to further tailor the inventory to the actual
demand. Finally, there is less profit leakage via “cannibalisation” due to sales
markdowns. Cannibalisation is the phenomenon whereby the customer buys two
cheaper garments now, thus avoiding a full price purchase in the future.
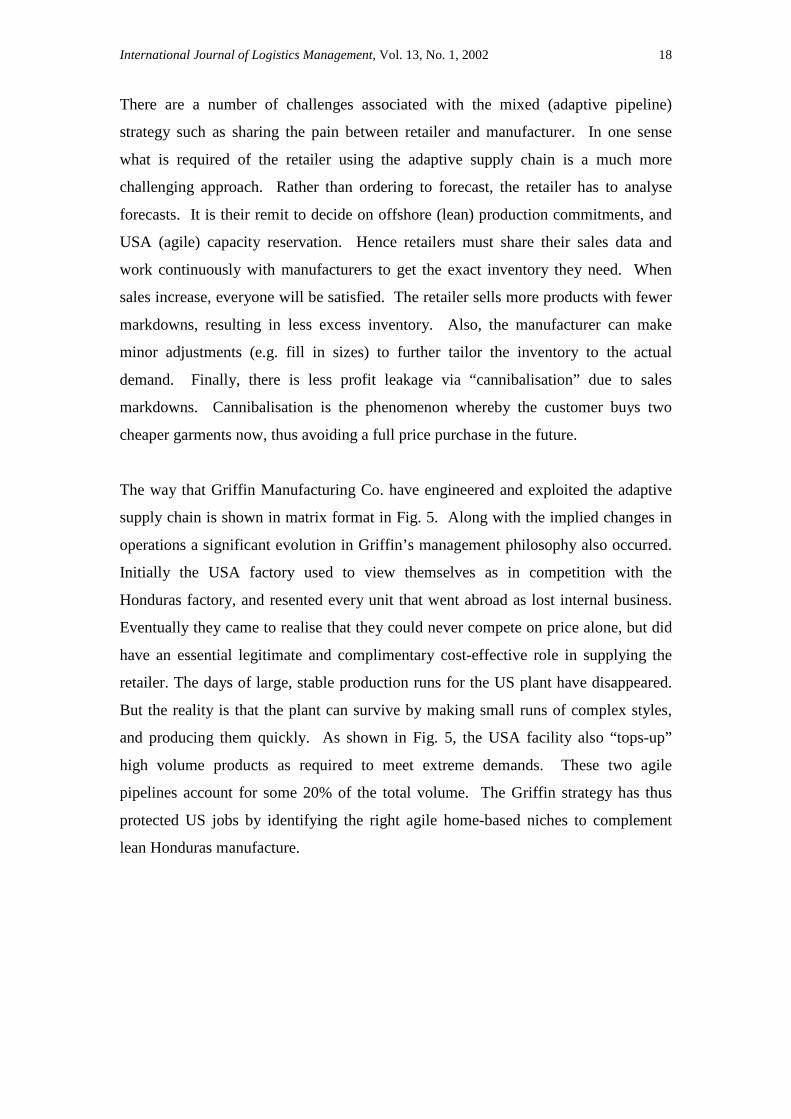
The way that Griffin Manufacturing Co. have engineered and exploited the adaptive
supply chain is shown in matrix format in Fig. 5. Along with the implied changes in
operations a significant evolution in Griffin’s management philosophy also occurred.
Initially the USA factory used to view themselves as in competition with the
Honduras factory, and resented every unit that went abroad as lost internal business.
Eventually they came to realise that they could never compete on price alone, but did
have an essential legitimate and complimentary cost-effective role in supplying the
retailer. The days of large, stable production runs for the US plant have disappeared.
But the reality is that the plant can survive by making small runs of complex styles,
and producing them quickly. As shown in Fig. 5, the USA facility also “tops-up”
high volume products as required to meet extreme demands. These two agile
pipelines account for some 20% of the total volume. The Griffin strategy has thus
protected US jobs by identifying the right agile home-based niches to complement
lean Honduras manufacture.
International Journal of Logistics Management, Vol. 13, No. 1, 2002 19
Demand
Product
Volatile Stable
Special
Standard
Fig. 5.Summary of the Griffin Manufacturing Company Pipeline Product Matrix for
Lean and Agile Supply(Source: Authors based on Stratton & Warburton (30))
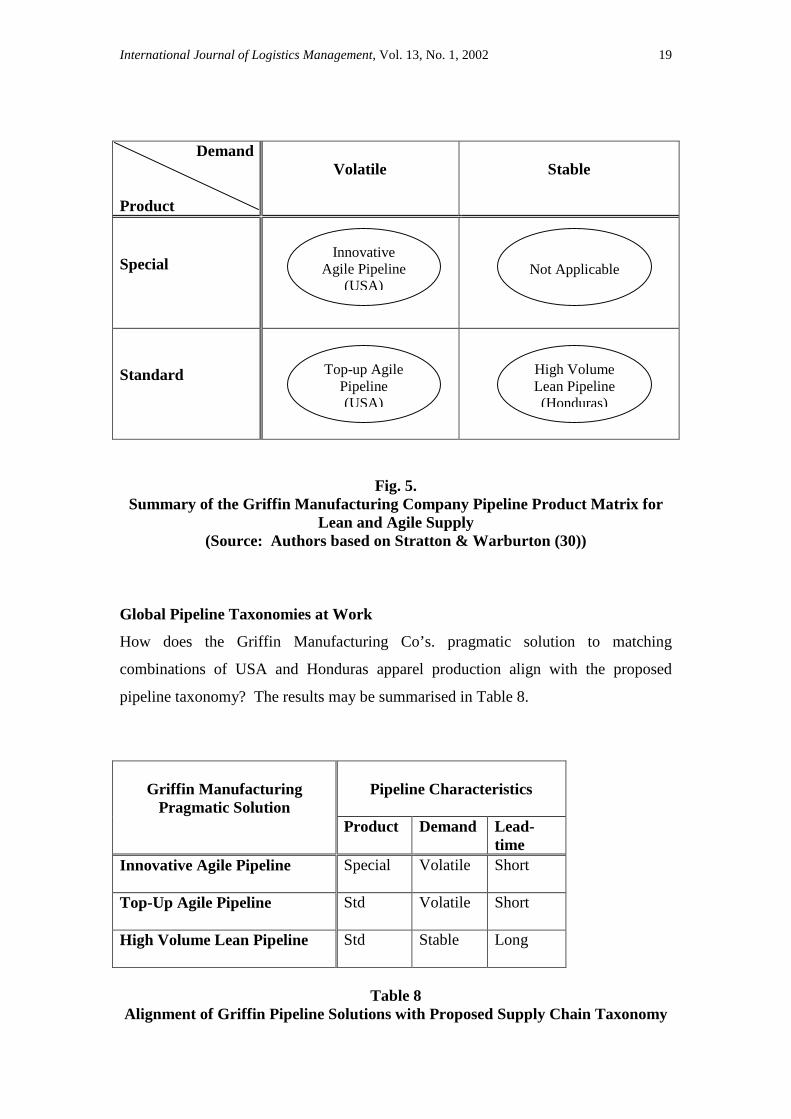
Global Pipeline Taxonomies at Work
How does the Griffin Manufacturing Co’s. pragmatic solution to matching
combinations of USA and Honduras apparel production align with the proposed
pipeline taxonomy? The results may be summarised in Table 8.
Pipeline CharacteristicsGriffin ManufacturingPragmatic Solution
Product Demand Lead-time
Innovative Agile Pipeline Special Volatile Short
Top-Up Agile Pipeline Std Volatile Short
High Volume Lean Pipeline Std Stable Long
Table 8Alignment of Griffin Pipeline Solutions with Proposed Supply Chain Taxonomy
InnovativeAgile Pipeline
(USA)
High VolumeLean Pipeline(Honduras)
Top-up AgilePipeline(USA)
Not Applicable
International Journal of Logistics Management, Vol. 13, No. 1, 2002 20
How many significantly different pipelines do we really need? The biggest need is
undoubtedly to move away from the “One Size Fits All” scenario. At the same time
there is little point in selecting a taxonomy yielding multiple possible pipelines if the
end result means that only a handful of solutions are eventually selected. This
“filtering” may be on the basis of management preference for specific pipelines, or on
the base of a cost-effectiveness model. We think a binary classification system has a
number of advantages. Firstly, analysts have to make a firm judgement in such a
situation – they cannot sit on the fence. Secondly, the use of binary codes tends to
avoid regression to the mean ~ “seeking to satisfy everyone, but pleasing no one”.
There is little point in using a taxonomy which does not lead to supply chain
managers being offered real choices in a language they understand. Our proposed
classification system based on Lead Times (Short/Long); Demand Predictability
(Stable/Volatile) and Product Type (Standard/Special) meets this requirement.
Conclusions
Present day marketplaces are volatile and at the same time extremely price sensitive.
Achieving success in this environment requires a good knowledge of pipeline
requirements from marketing back to materials manufacturers. Within supply chains
it is possible to identify some operations which are “lean” (without fat) and some
operations which are “agile” (nimble). The aim is to select and marry together the
particular combinations of lean/agile operations so as to match individual pipelines to
market needs.
In the paper we have developed a taxonomy suitable for this purpose. It is based on
demand (predictable/volatile), product (standard/special) and supply lead times
(long/short). This is seen to generate three feasible pipeline designs, all of which are
applicable within the global apparel supply chain framework. Generally the preferred
solution will be that predictable demand for standard items will be met via a lean
pipeline probably fed from overseas manufacturers. Volatile demand for special
items will then be met via an agile pipeline probably fed from home manufacturers.
A third pipeline design is for quick response to top-up standard products for which
there is an unexpected demand for specific colours, sizes, volume etc.
International Journal of Logistics Management, Vol. 13, No. 1, 2002 21
References
(1) Christopher, Martin, “Logistics and Supply Chain Management : Strategiesfor Reducing Costs and Improving Services” Pitman Publishing, London,1992.
(2) McCullen, Peter and Denis R. Towill, “Practical Ways of Reducing Bullwhip:the case of the Glosuch global supply chain”, International Journal ofOperations Management, Vol 26, No. 10, 2000, pp 24-30.
(3) Shewchuck, John. P., “Agile Manufacturing : One Size Does Not Fit All”,Proc. Int. Conf. on Manufacturing Value Chains, Troon, 1998, pp 143-150.
(4) Fuller, Joseph B., James O’Connor and Richard Rawlinson, “TailoredLogistics : the Next Advantage”, Harvard Business Review, May-June, 1993,pp 87-98.
(5) Fisher, Marshall L., Janice H. Hammond, Walter R Obermeyer, AnanathRaman, “Configuring a Supply Chain to Reduce the Cost of DemandUncertainty”, Production and Operations Management, Vol 6, No. 3, Fall,1997, pp 211-225.
(6) Towill, Denis R. and Martin Christopher, “The Supply Chain StrategyConundrum ~ to be Lean or Agile or to be Lean and Agile”, Proceedings ofthe International Logistics Symposium, Salzburg, 2001, pp 3-12.
(7) Mason-Jones, Rachel, James B. Naylor, and Denis R. Towill, “Lean, Agile orLeagile? Matching Your Supply Chain to the Marketplace”, InternationalJournal of Production Research, Vol 38(1`7), 2000, pp 4061-4070.
(8) Blackburn, Joseph D., “The Quick-Response Movement in the ApparelIndustry: a Case Study in Time Compressing Supply Chains”, in J.D.Blackburn (Ed) “Time Based Competition”, Business One Irwin, Homewood,1991, pp 246-269.
(9) Hill, Terry, Manufacturing Strategy : Text and Cases, Second Edition,MacMillan Press, London, 1993.
(10) Fisher, Marshall L., “What is the Right Supply Chain for your Product?”,Harvard Business Review, March/April, 1997, pp105-116.
(11) Fisher, Marshall L., Janice H. Hammond, Walter R. Obermeyer, AnanathRaman, “Making Supply Meet Demand in an Uncertain World”, HarvardBusiness Review, May-June, 1994, pp 83-93.
International Journal of Logistics Management, Vol. 13, No. 1, 2002 22
(12) Lowson, Robert, Russell King and Alan Hunter (1999), Quick Response:Managing the Supply Chain to Meet Customer Demand, John Wiley and SonsLtd., Chichester.
(13) Wikner, Joakim, Denis R. Towill, and Mohamed M. Naim, “SmoothingSupply Chain Dynamics”, International Journal of Production Economics,Vol 22, No. 3, 1991, pp 231-248.
(14) Mason-Jones, Rachel and Denis R. Towill (1997) “Information enrichment:designing the supply chain for competitive advantage”, International Journalof Supply Chain Management, Vol. 2, No. 4, pp 137-148.
(15) Stalk, Jnr. George H. and Hout, Thomas M., Competing Against Time, FreePress, New York, 1990.
(16) Lowson, Robert, “Analysing the Effectiveness of European Retail SourcingStrategies”, European Management Journal, Vol. 19, No. 5, 2001, pp 543-551.
(17) Christopher, Martin, and Helen Peck, “Moving Mountains at Marks andSpencer”, Case Study, Council of Logistics Management, USA, 2001.
(18) Shamoon, Stella, “The Next Big Thing”, The Times, London, U.K., 30 March2002.
(19) Lowson, Robert, “Analysing the Effectiveness of European Retail SourcingStrategies”, European Management Journal, Vol. 19, No. 5, 2001, pp 543-551
(20) Christopher, Martin & Helen Peck, “Moving Mountains at Marks & Spencer”,Case Study, Council of Logistics Management, USA, 2001.
(21) Drucker, Peter, “The Information that Executives Truly Need”, HarvardBusiness Review, Jan-Feb, 1995, pp 55-63.
(22) Wheatcroft, Patience, Business Commentary, The Times, London, 13September and 8 November 2000
(23) Perry, Marcia, Amrik S. Sohal and Richard Laney, “An Australian QuickResponse Supply Chain Model” Proceedings ISL - Logistics and the DigitalEconomy Conference, Salzburg, 2001.
(24) Christopher, Martin and Denis R. Towill, “Marrying the Lean and AgileParadigms”, Proc. EUROMA Conference, Ghent, 2000, pp 114-121.
(25) Womack, James P., David T. Jones & Daniel Roos, The Machine the Changedthe World, Macmillan, USA, 1990.
(26) Womack, James P.& David T. Jones, Lean Thinking, Simon & Schuster, USA,1996
International Journal of Logistics Management, Vol. 13, No. 1, 2002 23
(27) Goldman, Steven N., Roger N. Nagel & Kenneth Preiss, Agile Competitorsand Virtual Corporations, 1995
(28) McCullen, Peter, and Denis R. Towill, “Manufacturing Agility and the LeanSupply Chain”, Proc. MIM 2000 Conf, Aston, 2000, pp 424-431.
(29) Childerhouse, P., Enabling Seamless Market-Oriented Supply Chains, PhDThesis, Cardiff University, 2001
(30) Warburton, Roger & Roy Stratton, “Questioning the Relentness Shift toOffshore Manufacturing”, Supply Chain Management, Vol. 7, No. 2, 2002, pp101-108.
24
MANUFACTURING MODE IN“TRADITIONAL” SUPPLY
POLICY
MANUFACTURING MODE IN“RESPONSIVE” SUPPLY
POLICYPIPELINEMODEL
FORECASTSALES
ACTUALDEMAND
LEAN AGILE LEAN AGILECONSEQUENCES
1000 1250 1000 NIL *** *** 250 happy
customers lost sales“TRADITIONAL”
SUPPLY CHAIN(Single Pipeline) 1000 750 1000 NIL *** ***
250 excessgarments
decliningmargins
1000 1250 *** *** 800 450 happy
customers increased sales“ADAPTIVE”
SUPPLY CHAIN(MultiplePipelines)
1000 750 *** *** 800 NIL few excess
garments stable margins
Table 7Marrying Lean and Agile Pipelines within the Adaptive Supply Chain
(Source: Authors based on Stratton and Warburton, (30))
25
Once order has been placed, what is the vendors’ latitude for change?
Order volume change (% respondents) Order mix change (% respondents)
Sourcing regions None Some Substantial None Some Substantial
Before the start of the sale season North AmericaEuropeanNon-EU*Central AmericaAsiaAfricaOther
41%8%29%71%67%59%33%
37%53%44%20%21%18%41%
22%39%27%9%12%23%26%
58%21%37%76%71%63%31%
28%47%39%19%18%19%37%
14%32%24%5%11%18%34%
After the start of the sale season North AmericaEuropeanNon-EU*Central AmericaAsiaAfricaOther
57%19%34%63%71%62%32%
22%47%39%32%20%10%43%
21%34%17%15%8%18%25%
62%27%62%64%87%74%39%
18%40%34%29%11%7%36%
20%33%4%7%2%19%23%
* European States but non-EU 15 members Source : Lowson (16)
Table 2 : Suppliers Latitude for Volume and Mix Change both Before and DuringSales Season (by Vendor Geographic Region)
26
Composite Response MetricBefore Start of Season After Start of Season
Sourcing Region Typical Lead TimeTo Finalise
Orders (Weeks) Volume Change Order Mix Volume Change Order MixNorth America 35 .34 .23 .28 .26European 12 .57 .48 .30 .15Non-EU 21 .42 .37 .49 .46Central America 38 .16 .11 .25 .17Asia 55 .19 .17 .15 .06Africa 39 .29 .24 .21 .21Other 34 .40 .46 .39 .35
Table 3 : Estimate of Vendor Responsiveness to Volume Change and Mix ChangeAccording to Geographic Region
(Source : Authors based on Survey results Undertaken by Lowson (16))
27
Measure Retailer C – domestic, responsive andflexible strategy.European retailer with own smallmanufacturing operation. A large Europeanand North American operation. Sources from‘preferred’ manufacturers in, Europe andNorth America. Strategic objective ofattempting to use only domestic sources ofsupply as far as possible.
Retailer B – combined strategy –using foreign and domesticsources in the same season.Independent EU-retailer. ‘Own’ or‘private’ label. Bulk of pre-seasongoods, increasingly provided fromAsia but re-orders from ‘dedicated’EU supplier who only manufacturesfor this retailer.
Retailer A – offshore, low coststrategy.EU-based speciality clothingstore. European and NorthAmerican outlets. Nomanufacturing capability.Sources mostly offshore (Asia,North and Central America).
GM/Sales Revenuea
GMROIb
Inventory Turnsc
Average Inventoryd
Sales Revenuee
Service Levelf
Lost Sales %g
Sell Through %h
Sold off %I
0.435.757.201.101.00
96.006.40
91.400.87
0.474.345.301.800.64
81.0013.7080.787.80
0.612.201.703.830.53
71.0019.0071.8017.00
aGross margin to sales revenuebGross margin return on investmentcInventory turns per seasondAverage inventory carried during the sale season (scaled to domestic supply = 1)eSales revenue during the season (scaled to domestic supply = 1)fService level – the percentage of times a customer finds her first choice of SKUgLost sales – the percentage of times customers find none of their first choice SKU preferenceshSell through – the proportion of a season’s merchandise selling at initial set priceiSold off – the percentage of unwanted units remaining after the season
Source : Lowson (19)Table 4 : Sourcing Performance in Single Season
Replace with the following?
28
Resultant Sourcing Performance Metric
Sourcing StrategyGross Margin
(to sales revenue)Gross Margin
(return oninvestment)
Service Level(chance of
customer fundsfirst choice SKU)
Sell Through(proportion of
merchandise soldat full price)
Inventory Turns(per season)
Retailer A ~ Lean PipelineOffshore, low cost strategy 0.61 2.20 71% 71.80% 1.70
Retailer B ~ Hybrid Lean/Agile PipelinesCombined strategy using foreign anddomestic sources in the same season
0.47 4.34 81% 80.78% 5.30
Retailer C ~ Agile PipelineDomestic, responsive and flexible strategy 0.43 5.75 96% 91.4% 7.20
Table 4How the Responsive Pipeline Delivers Enhanced Bottom-Line Performance
(Authors: Based on Lowson, 2001)
29
Denis R. Towill is a University of Wales Research Professor and is presently Co-Director of the Logistics Systems Dynamics Group at CardiffUniversity. In 2000 he was awarded the Lord Hirst Premium by the Council of the Institution of Electrical Engineers for the paper“Management Theory – is it of any practical use?” Professor Towill has worked with many industries, including automotive, aerospace,mechanical, construction, electronic, steel supplies, and healthcare supply chains. He holds the degree of D.Sc from the University ofBirmingham. In 1988 he was elected a Fellow of the Royal Academy of Engineering in recognition of his contributions on the theory andapplication of systems engineering to a range of European industries. He can be reached at Cardiff University, Cardiff Business School,Aberconway Building, Colum Drive Cardiff, CF10 3EU, Wales, UK, Phone : 44 (0)29 20 876083, Fax : 44 (0)29 20 874301.
Martin G Christopher is Professor of Marketing and Logistics at Cranfield School of Management, Cranfield University, UK. He is alsoChairman of the Cranfield Centre for Logistics and Transportation, Europe’s leading centre for teaching and research in logistics and supplychain management. Dr Christopher is an Emeritus Fellow of the Institute of Logistics and Transport in the UK who in 1988 awarded him the SirRobert Lawrence Gold Medal for his contribution to logistics education. In 1997 he was jointly awarded the Council of Logistics Management’sFounder’s Award. He can be reached at Cranfield School of Management, Cranfield University, Cranfield, Bedford, England, MK43 0AL.Phone : 44 1234 751122, Fax : 44 1234 752691.