Embed Size (px)
Citation preview

Developing Infrastructureto Promote Electric Mobility
C A R L - O S C A R S A N D I N
Master of Science ThesisStockholm 2010

Carl-Oscar Sandin
Master of Science ThesisSTOCKHOLM 2010
Developing Infrastructure to Promote Electric Mobility
PRESENTED AT
INDUSTRIAL ECOLOGY ROYAL INSTITUTE OF TECHNOLOGY
Supervisor:
Larsgöran Strandberg Examiner:
Nils Brandt

TRITA-IM 2010:07 ISSN 1402-7615 Industrial Ecology, Royal Institute of Technology www.ima.kth.se

i
Acknowledgements
I would like to take this opportunity to thank those persons who have actively participated in the work of this thesis.
Ulrich Frieser, Vattenfall AB, for guidance, share of knowledge through the thesis work and good and learning discussions. Larsgöran Strandberg at the department of Industrial Ecology at KTH Stockholm for his guidance, discussions and interest in topic that was very motivating. Olle Johansson, Project Coordinator for Power Circle, for answering questions, sharing his thoughts and giving me contact information to actors on the market. Owe Sandin, Vattenfall AB, for discussion and making the thesis better as a report.
I would also like to thank all those who answered my questions and took time to discuss the thesis with me.
Carl-Oscar Sandin Stockholm, February 2010

ii
iii
Abstract
Electric mobility, E-mobility, will play a central role in a sustainable future transport system. The potential of curbing climate change in both short and long term are significant. E-mobility will also offer the possibility to leapfrog the Internal Combustion car, IC-car, economy for developing countries. The low dependence of oil will be a benefit but E-mobility will demand a well functional electricity grid. Development of this grid will be beneficial for the developing world. For the European society E-mobility will in long term offer lower operating costs, decreased dependence of oil and lower emission of pollutants and Green House Gases, GHGs. All these factors are beneficial for the European society.
The transition to E-mobility will depend upon a set of different factors and will call for different actions in order to overcome the barriers of E-mobility. A well developed charging infrastructure will be important in order to offer the full potential of E-mobility. The infrastructure will develop along with the market introduction of Electrical Vehicles, EVs. It is important that there are existing charging alternatives in the early introduction phase of EV in order to avoid the stagnation in the transition toward E-mobility. In order to provide the proper conditions for E-mobility, the determining factors must be investigated and evaluated. The four main factors are economical, social, R&D and infrastructure. The European driving patterns meet the offered operating range of an EV with ease. This means that EV has the potential to become an inner city vehicle under existing conditions.
The investigation of the four determining factors leads to a base from which an implementation plan is suggested. The implementation plan is directed toward governments, energy utilities and other active participants in the development. The key factors of the implementation plan are to actively engage in the market, see E-mobility as a disruptive technology, use spin-off companies and social transparency. In order to gain the most from the implementation plan it is important that the correct actions are taken at the correct time. Therefore the transition period is divided into three phases; the introduction phase, the commercial phase and the re-development phase.
The introduction phase will create the basic conditions for E-mobility. Government’s main action will be to invest in EVs and offer subsidies and other incentives to major companies that will equip their vehicle fleets with EVs. These actions will send signals toward vehicle Original Equipment Manufactures, OEMs, and other actors that the market of EVs is worth investing in. During the introduction phase try-out sessions, demonstrations and hearings will be important in order to communicate the advantages of E-mobility to society. Energy utilities will work to create roaming deals and standardization of important components and characteristics.
The commercial phase is the most important phase for social adoption of E-mobility. During this phase commercial businesses will use EV charging a competitive advantage. New business models will be one of the keys to fully adoption of E-mobility. Cross industry alliances will reduce the initial cost, offer the service of a vehicle without owning it and leasing deals. The perception of travelling will shift and reduction of operating cost will be evaluated against travel time and planning.
The re-development phase is based on a society that has adopted E-mobility. The development will proceed in order to offer more advantages to drivers but also to increase efficiency and to use the full potential of E-mobility.

iv
v
Table of Contents 1. Introduction. ........................................................................................................................... 1
1.1 Electric Mobility Obstacles .............................................................................................. 1 1.2 Limitations and Definitions .............................................................................................. 2 1.3 Methodology and Source Criticism .................................................................................. 2
2. Driving Forces ........................................................................................................................ 3 2.1 Environmental Situation ................................................................................................... 3 2.2 Economical Situation ........................................................................................................ 4 2.3 Social Situation ................................................................................................................. 5 2.4 Technological Situation .................................................................................................... 5 2.5 Sustainable Transport Alternative .................................................................................... 7 2.6 Barriers for Electric Mobility ........................................................................................... 8
3. Motorization ........................................................................................................................... 9 3.1 Passenger Mobility in Europe ........................................................................................... 9 3.2 European Car Fleet ......................................................................................................... 10
4. Electric Mobility System ...................................................................................................... 11 4.1 Electrical Vehicle and Plug-In Hybrid Vehicle .............................................................. 11
4.1.1 Electric Motor and Internal Combustion Engine ..................................................... 11 4.1.2 Accumulator ............................................................................................................. 11
4.2 Current Status ................................................................................................................. 12 4.2.1 Energy Density of Batteries ..................................................................................... 13 4.2.2 Cost of Batteries ....................................................................................................... 13
4.3 Infrastructure .................................................................................................................. 14 4.4 Efficiency of Electric Mobility ....................................................................................... 15
4.4.1 Different Vehicles Efficiencies ................................................................................ 15 4.4.2 Abatement Potential of Electric Mobility ................................................................ 17
4.5 Key-Findings of Current Conditions .............................................................................. 20 5. Development Theory ............................................................................................................ 23
5.1 Development Block ........................................................................................................ 23 5.2 Disruptive and Sustaining Technology ........................................................................... 25 5.3 Market Based Theories ................................................................................................... 25 5.4 Historical Development .................................................................................................. 28
6. Creating Conditions for Electric Mobility ........................................................................... 31 6.1 Infrastructure .................................................................................................................. 32
6.1.1 Regular Charging ..................................................................................................... 32 6.1.2 Semi-Fast Charging ................................................................................................. 33 6.1.3 Fast Charging ........................................................................................................... 33 6.1.4 Battery Swapping ..................................................................................................... 33 6.1.5 Infrastructure Models ............................................................................................... 33
6.2 Research & Development ............................................................................................... 34 6.2.1 Vehicle Models from Established Manufactures ..................................................... 34 6.2.2 Rising Competitors .................................................................................................. 35 6.2.3 Battery Developers ................................................................................................... 36 6.2.4 Payment Equipment ................................................................................................. 37 6.2.5 Standardizes Components ........................................................................................ 38
6.3 Economic ........................................................................................................................ 39 6.3.1 Subsidies, Incentives and Tax Releases ................................................................... 39 6.3.2 Business Actions ...................................................................................................... 41
6.4 Social .............................................................................................................................. 42
vi
6.4.1 Try-Out Sessions ...................................................................................................... 42 6.4.2 Potential Target Audience ........................................................................................ 43
6.5 Key-Findings Creating Conditions for Electric Mobility ............................................... 45 7. Implementation Process ...................................................................................................... 49
7.1 Implementation Plan ....................................................................................................... 49 7.2 Electric Mobility Markets ............................................................................................... 50 7.3 Cross Industry Alliances ................................................................................................. 51 7.4 Road Map of Development ............................................................................................. 52 7.5 Introduction Phase .......................................................................................................... 53
7.5.1 Parking Lot Alternative ............................................................................................ 54 7.5.2 The Commuter Alternative ...................................................................................... 55
7.6 Commercial Phase .......................................................................................................... 56 7.6.1 Shopping Mall Alternative ....................................................................................... 57 7.6.2 Consumer Matching Alternative .............................................................................. 57 7.6.3 The Fast Food Alternative ....................................................................................... 58 7.6.4 Payment Solutions ................................................................................................... 58
7.7 Re-Development Phase ................................................................................................... 59 7.7.1 V-2-G Society to Promote Renewable Energy ........................................................ 59 7.7.2 E-mobility Services .................................................................................................. 60
7.8 Key Findings Implementation Process ........................................................................... 61 8. Conclusions .......................................................................................................................... 65 9. References ............................................................................................................................ 67 Appendix 1. .............................................................................................................................. 73 Appendix 2 ............................................................................................................................... 75 Appendix 3. .............................................................................................................................. 77
vii
Table of Figures Figure 1. The concept of sustainable development and the triple bottom line. .......................... 3 Figure 2. The decrease of CO2-emission from IC-cars needed to reach target levels. .............. 6 Figure 3. EVs and PHEVs as a part of a sustainable transport solution. .................................. 7 Figure 4. The mobility rate in EU-27 and Sweden during the period of 1995-2006. ................ 9 Figure 5. Composition of European vehicle fleet divided after propulsion fuel. ..................... 10 Figure 6. Batteries used in EVs from first car to future prospects and respective capacity. ... 13 Figure 7. WtW efficiency of a diesel operated IC-car. ............................................................. 16 Figure 8. WtW efficiency of an EV operated on fossil fuel. ...................................................... 16 Figure 9. Estimated difference in CO2 emission between EVs and IC-cars. ............................ 18 Figure 10. Difference in range between different vehicles based on operating costs. ............. 19 Figure 11. The cognitive model of innovation and its three main steps (Adopted from Nigthinggale). ........................................................................................................................... 26 Figure 12. Innovations five sub-categories that affect the diffusion rate speed (adopted from Rogers). .................................................................................................................................... 26 Figure 13. Rogers Curve of adoption (adopted from Rogers). ................................................. 27 Figure 14. Timeline over the development phases of the EV and IC-car. ................................ 28 Figure 15. Factors included in the development toward a E-mobility. .................................... 31 Figure 16. Subsidies related to general EV related costs. ....................................................... 40 Figure 17. Different actors, businesses and components needed for E-mobility. .................... 51 Figure 18. Market development of charging infrastructure based on development phases. ... 52 Figure 19. The determining factors when providing parking areas with charging. ................ 53
Table of Tables Table 1. Six major barriers for alternatives fuel vehicles applied on EVs and PHEVs. ............ 8 Table 2. Distribution of amount of trips between different lengths of travel. .......................... 10 Table 3. Distribution of person km between different lengths of travel. .................................. 10 Table 4. Interconnection between battery characteristics; efficiency, weight, size and price. 12 Table 5. Charging characteristics for an 8 kWh battery. ......................................................... 14 Table 6. Efficiencies and primary sources for different vehicle technologies. ........................ 17 Table 7. Price estimation for daily usage of an EV driving 100 km. ....................................... 18 Table 8. Key-findings of the investigation of current conditions. ............................................ 21 Table 9. Some of the models planned to be introduced to the market in the coming years. .... 35 Table 10. Standardization of components in order to avoid lock-in on specific technology. .. 38 Table 11. Key-findings with directives on how to create conditions for E-mobility. ............... 47 Table 12. The four key-points of the implementation process with coherent directives. ......... 49 Table 13. Key-findings from implementation process. ............................................................. 64

viii
ix
Acronyms
AFV = Alternative Fuel Vehicles BEV = Battery Electric Vehicle BV = Battery Vehicle B2B = Business to Business B2C = Business to Consumer COx = Carbon Oxides EV = Electrical Vehicle E-mobility = Electric Mobility GDP = Gross Domestic Product GHG = Green House Gases HEV = Hybrid Electric Vehicle IC = Internal Combustion ICT = Information and Communications Technologies ISO = International Organization for Standardization Li-Ion = Lithium Ion Ni-Cad = Nickel Cadmium Ni-MH = Nickel Metal Hydride NOx = Nitrogen Oxides OEM = Original Equipment Manufactures OLEV = On Line Electric Vehicle OPEC = Organization of the Petroleum Exporting Countries PHEV = Plug-In Electric Vehicle PM10 = Particulate Matter with a diameter of 10 µm SOC = State of Charge TtW = Tank to Well WtW = Well to Wheel V-2-G = Vehicle to Grid

x
1
1. Introduction. The main base line of the thesis is that Electrical Vehicles, EVs, will be a significant part of the future transport system and that Plug-In Hybrid Electric Vehicles, PHEVs, will be a complement to support longer distance travel during the transition to electric mobility, E-mobility. Along with the development toward E-mobility there will be a simultaneously transition toward a low green house gases, GHGs, emitting electricity production. With these simultaneously improvements EVs will play an important part in curbing climate change, both in short and long term.
E-mobility will depend on the development and supply of vehicles as well as the infrastructural preparation. With a well prepared infrastructure the transition and adoption rate will increase. To this new business models and commercial interest will be the key to E-mobility success.
1.1 Electric Mobility Obstacles E-mobility will be based on EVs as a hub in the transport system. The EV is far from a new invention; in fact it entered the market earlier than the today common used internal combustion car, IC-car. Due to different circumstances the IC-car became the adopted transport alternative. The circumstances today are different, climate change, peak-oil, polluted cities and a developing world calls for a transition to another transport alternative. To this EVs and PHEVs could be the solution, but for E-mobility to be adopted the barriers and obstacles must be overcome.
There are main barriers and obstacles that have to be revealed, investigated and solved in order to create conditions that will increase the development and implementation rate toward E-mobility. The obstacles will be connected to economical, social, environmental and technological aspects. Therefore it is important that the actions taken consider these factors. The final result of the transition to E-mobility shall be a more sustainable transport society.
The economical obstacles are mainly connected to the initial purchase cost of an EV. There are also significant costs connected to the infrastructure problem; developing of infrastructure, the electricity grid and perhaps the need of more power plants in order to supply the increased electricity demand. In connection to this there is also the investment problem, vehicle original equipment manufactures, OEMs, have no interest in spending money on EVs if the conditions for EVs to operate in are unprepared. At the same time there will be a low interest in investing in infrastructure before there are any vehicles on the market.
E-mobility will provide a new transportation market with a lot of new business opportunities, to discover and investigate these opportunities is an important part of the implementation process. Many opportunities are hidden in the new infrastructure that will enable E-Mobility. The potential of these business models must be investigated and evaluated in order to gain from them during the implementation.
The obstacles connected to society are connected to the daily life of people and a part of an entrenched way of living. Therefore obstacles concerning range at one charge, the ability to trust the vehicle to solve un-expected events and ability to charge during long trips are dominating. The battery technology is a major obstacle and if it is based on Lithium-Ion cells, Li-Ion, it is important that the increase of batteries will not create a Lithium scarcity.

2
In order to create conditions that are suitable for the EVs and PHEVs to gain market shares in the solutions to presented obstacles will offer the base for the conditions. A need for a well balanced market introduction, further technological development, changes in social perceptions and a business climate that enables economic gain for manufactures and other companies.
1.2 Limitations and Definitions The EV will in this thesis mainly work as inner city vehicle and used to cover distances less than 150 km daily. For longer distances other vehicle types or ways to travel will be used, a suggestion is the PHEV or by train.
The study is based on the European market and the existing infrastructure. The E-mobility infrastructure is in this thesis used in order to describe the electricity grid and how charging sites are connected to it. A proper E-mobility infrastructure offer several different charging alternatives for the EV driver.
In the thesis the point of view is that an EV will never be better than the electricity produced and that the development toward E-mobility will progress along with the development toward an electricity production based on renewable resources and more efficient production ways. Therefore the EV is considered better than the IC-car in an environmental point of view.
1.3 Methodology and Source Criticism This thesis is based on a literature study of different areas as a pre-study. The pre-study involves statistics, historical patterns, theories and management models. The aim of the pre-study is to create a basic understanding and provide facts from which conclusions can be drawn. The further work will be to use this information to create a suggestion on conditions for E-mobility to develop under. These conditions will provide the key-points to an implementation plan with coherent business models. The final work is to evaluate the implantation plan against a predicted development in order to provide a road map of development considering electric mobility.
Since E-mobility at the moment face a lot of uncertainties, personal contacts with people involved in the ongoing development will be of importance. This in order to provide primary sources when uncertainties about the subject are high.
The sources used will have different credibility; sources that are important for the objectivity of the thesis will be based on scientific articles. The parts of the thesis that handle predictions and probable development the quantity of information will be preferred over objective articles. When predictions are used, it will be stated in the thesis and sources presented in coherent appendix. Based on this, the sources used are reliable and objective. All opinions and conclusions stated is those of the author and do not have to correspond with involved university and utility.
3
2. Driving Forces The ever changing conditions of the market and expectations from society forces companies globally to develop new products and services. The business climate today is regulated by an increased concern of the degradation of the environment, the tensions in the economic field and a concern of human well being as well as increased living conditions. These factors are a part of the triple bottom line that a sustainable development is based on (IUCN 2006). Figure 1 show the interaction between the different factors.
Figure 1. The concept of sustainable development and the triple bottom line.
As shown in Figure 1 sustainable development is an interaction of different factors, this figure illustrates the theoretical idea of sustainable development. In practice, today, the economical circle is larger than the social and environmental circles. The role of technology in sustainable development is often considered the driver of the development. Sustainable development is defined as “meeting the needs of present without compromising the ability of future generations to meet their needs” and was defined by the Bruntland commission in 1987.
Since transport is a complex system of interconnected elements and depends on a multiple set of factors a long term vision is needed for sustainable mobility (EC 2009a). But it is also important to find short and mid term solutions in order to curb the impact of todays transport system.
2.1 Environmental Situation Today there is a growing concern about the climate change and increasing amount of pollution in the atmosphere. There are clear evidences that the amount of GHGs and pollutants in the atmosphere is connected to industrial age and increased energy usage. Since the industrial revolution about 300 billion metric tons of carbon oxides, COx, have been released to the atmosphere (Sovacool 2009). The industrial revolution enabled many of the products and services that the developed society today are used to and depend upon but it also brought along an increased amount of GHGs and other pollutants to the atmosphere. One of the most mentioned GHG is the carbon dioxide, CO2, and it is released when fossil fuel is burned. The use of fossil fuel to run machinery, provide heat and light escalated during the industrial revolution. The introduction of the Internal Combustion engine, IC-engine, to the market increased the use of fossil fuel even more. The IC-car is driven by the help of an IC-engine burning fossil fuel and this contributes to the emission of GHGs and pollutants.
A result of the increased amount of CO2 in the atmosphere is the increased temperature on earth. It is estimated that there will be an increase with approximately 2 °C in mean global
Economical
EnvironmnetalSocial
4
surface temperature in 2100 (IPCC 2007). This increase and even higher temperature increases will have effects on the earth in forms of more extensive droughts and higher sea level. This will affect the world in a negative way economical, environmental and social.
That the transport sector is a major part of the environmental problem is well proved. A single IC-car emits, in year mean numbers, four to five tons of CO2 (Van Mierlo & Maggetto 2007). The transport sector in EU stands for 28 % of the total emissions. With this situation the amount of CO2 will pass 750 ppm in the end on the century (Sovacool 2009) if we continue to use fossil fuel.
Another environmental concern is the increased use of raw materials in industry, the life length of different products is shortened and more and more products and material end up on deposit areas. When the global population increases along with better living conditions the need of more products also increase.
In environmental concern a sustainable development is reached when the renewable resources is replenished at a higher rate than they are consumed by society. An alternative is the steady-state situation (Daly & Farley 2004) where the resources are used up at the same rate as they are replenished.
2.2 Economical Situation The global economy today is highly dependent on the ability to transport goods and humans but other services also depend upon transportation. The majority of the developed societies has a transport net built around the usage of IC-cars. These mean long distances between markets and homes or warehouses and stores. This part of the economy is highly dependent on personal transportation which today is solved by the IC-car.
Transport is an essential part of the European economy, approximately 7 % of the gross domestic product, GDP, is due to the transport industry and more than 5 % of the European population work in the industry (EC 2009a). The major part of these 5 % work with transport services including the equipment industry. Today the transport sector is to 98 % dependant on oil (Van Mierlo & Maggetto 2007). The high use of transport supported from fossil fuel lead to a decrease of oil in the world; non oil producing countries are becoming more and more dependent on oil producing countries. This creates an economical situation with a lot of difficulties as well as a situation that could paralyze entire societies if the oil would run out or if the Organization of the Petroleum Exporting Countries, OPEC, would choose to cut the supply. As the amount of oil decrease it is expected to be a price increase but also threatening geopolitical tensions due to the fact that the economy today is depending upon oil. That the oil production is a sensitive business was proved when British Petroleum, BP, closed one refinery in 2006 and the price on crude oil increased with 2 % (Sovacool 2009).
The industry must develop in a way that result in a emission decrease from 20 tons per capita to 2, 5 tons per capita by 2050 (Sovacool 2009) in order to not reach levels of 750 ppm of CO2 in the atmosphere. This will be a costly transition but it will also open up for new business alternatives and markets. The costs of doing nothing are estimated to be higher in long term than the costs of acting now (Stern 2007).
Due to the high amount of IC-cars on the roads there are also congestion problems. Congestion is negative to the environment and adds significant economical costs. Estimations are made that show that the approximate cost of road congestion is 1 % of EUs GDP which in 2007 corresponded to 123 billion euro’s (EU 2009). Households spend 13, 5 % of their
5
income on transport related gods and services. The main part of this is fuel costs and costs connected to purchase of vehicle (Ibid).
2.3 Social Situation The world population is estimated to exceed 9 billion by 2050. There is also a trend of an increased urbanization both in Europe and globally. The population in urban areas in Europe is estimated to increase from the current 72 % to 84 % in 2050. The population is estimated to increase from 700 million to 3 billion in 2050 (EC 2009c). This will result in more vehicles on the roads. In the cities the mobility of today emits GHGs and pollutants to the extent that it has an adverse physical effect on the inhabitant’s health (Van Mierlo & Maggetto 2007). The extensive use of IC-cars lead to an annual death of 1, 2 million people in traffic related accidents (Sovacool & Hirsh 2009). In the urban areas there is a lot of nitrogen oxides, NOx, and PM10 emissions, the latter is harmful to human health (EC 2009c). Urban transport accounts for 40 % of the total CO2 emissions from the transport sector and 70 % of the other pollutants emitted from traffic (Ibid). The higher population and the high grade of urbanization will lead to a higher amount of vehicles. This will lead to more dense and congested cities and a higher grade of natural resource depletion. This will have an adverse effect to human health.
Concerning the global equality the increasing price of oil have an effect on the gap between developed and developing countries. The increase of oil price does not only hit the developed countries but it also has a severe impact on developing countries. Both in the cost of oil and as a result of an inflated transport sector (Sovacool 2009).
The environmental effects might lead to an increased amount of flooding and severe storms that will affect coastal areas (Ibid). Population habitats are commonly placed by a water source and an increased population means more people living in troubled areas. The increased population creates a higher demand on nature resources, both concerning goods and services.
2.4 Technological Situation The technological development is important and manufactures globally stand in front of a toll-gate, try to increase efficiency of IC-engines more or shift to another technology. EU 20-20-20 target states that GHG emissions shall decrease with 20 % until 2020 but also that the amount or renewable energy used shall increase with 20 % (EC 2009b).
The emissions from passenger cars stand for 12 % of Europe’s total CO2 emissions. In order to decrease the emissions it is mainly increased fuel efficiency that is proposed. Today the emissions are approximately 160 g CO2 per km from the current car fleet. The target for EU is that 10 % of the transport fuel consumption comes from renewable sources e.g. bio-fuel and renewable electricity (EC 2009a).
There are some values on CO2 emissions that car manufactures must stay within on their new registered cars. If manufactures do not keep below these values there will be fines based on the extra GHGs emitted. There is a limit value for the entire fleet that must be met by all newly registered cars in the EU and it is 130 g of CO2 per km. The limited value means that heavier cars are allowed higher emission levels but in order to keep the mean value, lighter vehicles has to emit less. The target of 130 g CO2 per km for new manufactured cars in 2012 would stand for a reduction of 19 % in emission of CO2 from the European car fleet (EC 2009a).
6
The long term target to meet is 95 g of CO2 per km in 2020 and in order to enable it there is a period of phasing in for the manufactures. By 2012, 65 % of the newly registered cars from manufactures must keep within the limit value curve. The amount will increase for each year until it reaches 100 % in 2015 (EC 2009b).
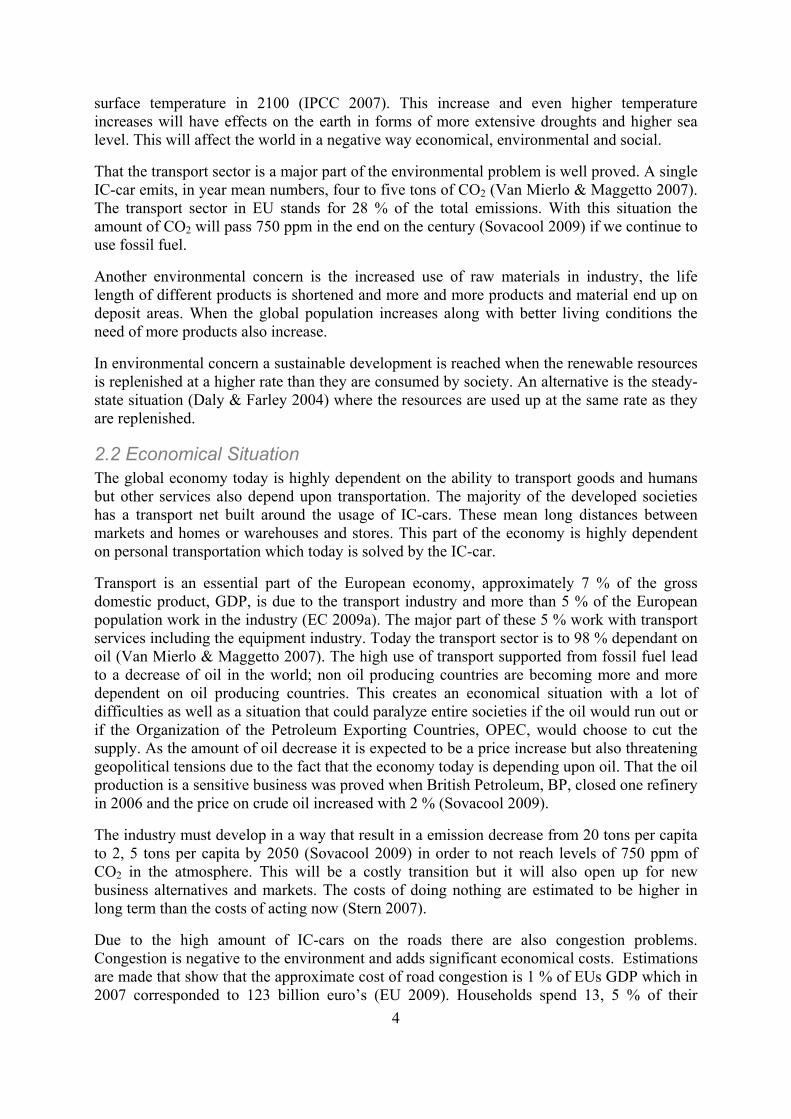
The penalty payments for emission if a manufactures average fleet is higher than the limit value will be based on exceeding grams of CO2. For the first excess gram per km of emission there will be a cost of € 5, for the second gram the amount will be € 15 and for the third € 25. For all grams per km over three grams each gram will cost € 95. The amount of excessive grams is then multiplied with the amount of cars in the manufactures newly registered fleet. These fees are for the years 2012-2018. In 2019 the payment will be € 95 for every gram, no cost reduction for a good try (EC 2009b).
Figure 2. The decrease of CO2-emission from IC-cars needed to reach target levels.
The doted target line in Figure 2 show the needed decrease in emission in order to reach the limit curve set for 2020. The decrease of the 12 year period between 1996 and 2008 was 24 grams CO2 per km. The decrease needed to reach 2020 target would be 65 grams of CO2 per km, for basically the same period of time. The curve in Figure 2 also indicates that there is stagnation in development. Therefore one of the major driving forces for manufactures to provide the market with EVs and PHEVs is the fact that it is the most economical way to meet the emission demands set by EU. The emission limit of 95 gram of CO2 per km might not be possible to reach for larger cars only by increased efficiency from engines. If IC-engines are used the cars have to be small and lighter than the cars are today.
The Asian market will play a major role for E-mobility; Asia is a growing market with an increased number of middle class populations (Gilbert et al 2008). New Asian vehicle manufactures will not have the possibility to compete with the established car manufactures considering the IC-platform and efficiency development. The Asian market has an urge for transport and the manufactures are planning to meet that demand with EVs. In China and India there is already a developed market for electrical two wheeled vehicles. In China there is an approximately 300 companies that today are involved in EV development, around 40 of these are already in the production stage of EVs (Ibid). This expanding market is what the established manufactures on the European and American market shall compete against.
90
110
130
150
170
190
1996 2000 2004 2008 2012 2016 2020
CO
2 pe
r km
Year
Emission Levels from IC-cars
Today
Target
7
2.5 Sustainable Transport Alternative Transport has to face several interconnected problems e.g. road congestion. Congestion mean more time on the roads which lead to a significant cost for both society and individual, it leads to higher emission of CO2 and other pollutants that effects environment and individual. Congestion also make people spend more time travelling, this is time that could be spent on family or leisure activities.
A sustainable future transport system based on a zero-emission approach could solve the interconnected problems. There are mainly two future transport societies that have potential to decrease the impact on the climate. It is the vehicle-to-grid, V2G, system supported by EVs. There is also the hydrogen system supported by fuel cells. For both systems the PHEV is an important complement in the transition.
The EV and the PHEV are the hubs of E-mobility. With less emission, higher efficiency and a potential to increase the use of renewable resources in energy sector, it connects the three different factors of sustainability. In a V2G system interaction between energy utilities and consumer will be higher and will lead to possible benefits for both.
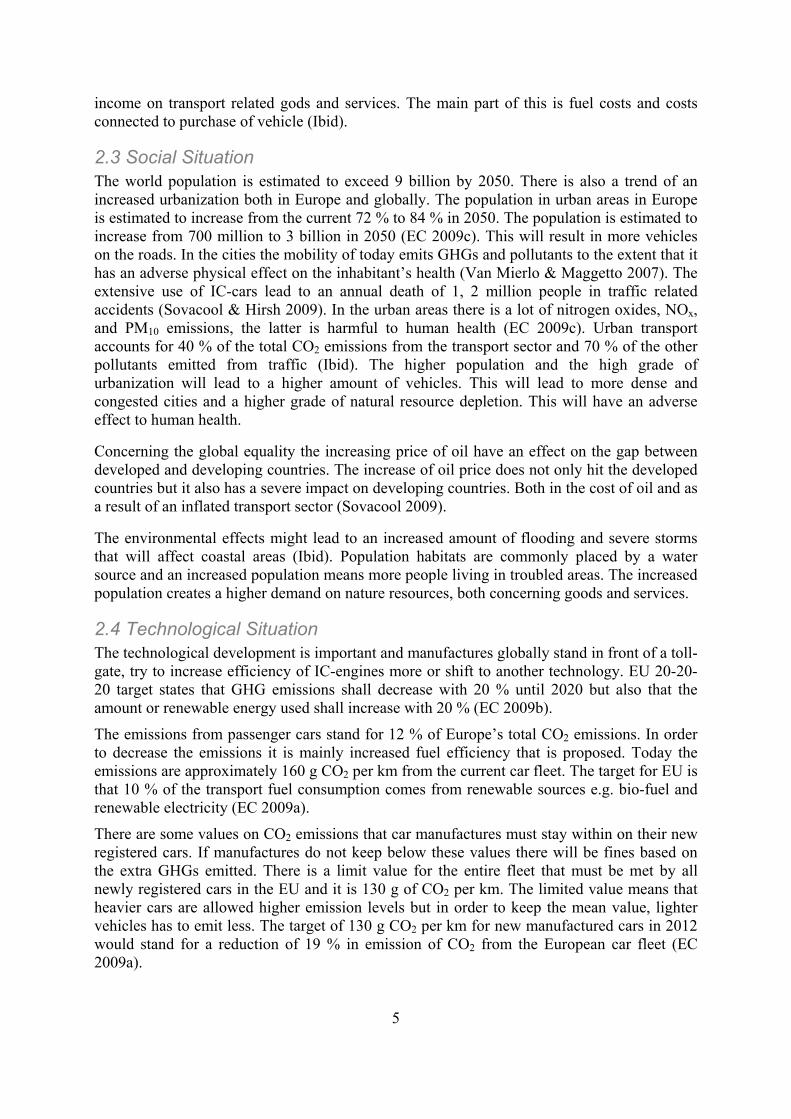
Figure 3. EVs and PHEVs as a part of a sustainable transport solution.
As shown in Figure 3 the transport system is interconnected with environmental, social and economical issues. This is problematic since actions taken in one area can create negative effects in another area. But it also brings a lot of opportunities and great possibilities to solve the interconnected problems given, E-mobility bring a lot of possible businesses models.
Since electricity can be produced from any primary energy source the use of EVs is a golden opportunity to make transport sector partly independent of oil. In this way the future security of energy is also improved (Offer et al 2009).
It is noticeable that there are strong incentives and driving forces behind an E-mobility society. Still, there are barriers that have to be overcome in order to enable the transition.
E-Mobility
Eco-nomical
SocialEnviron-mental
8
2.6 Barriers for Electric Mobility There are some central problems that EVs and PHEVs have to face, together with other alternative fuel vehicles, AFVs. It is barriers connected to market disadvantages in several of the interconnected markets that are dominated by the IC-car. Other barriers are that EV today is not a cost effective solution to the problem faced. The first barriers needs government support and incentives in order to gain markets share but the second barrier makes it harder to get the support needed since it is not economic viable (Romm 2006).
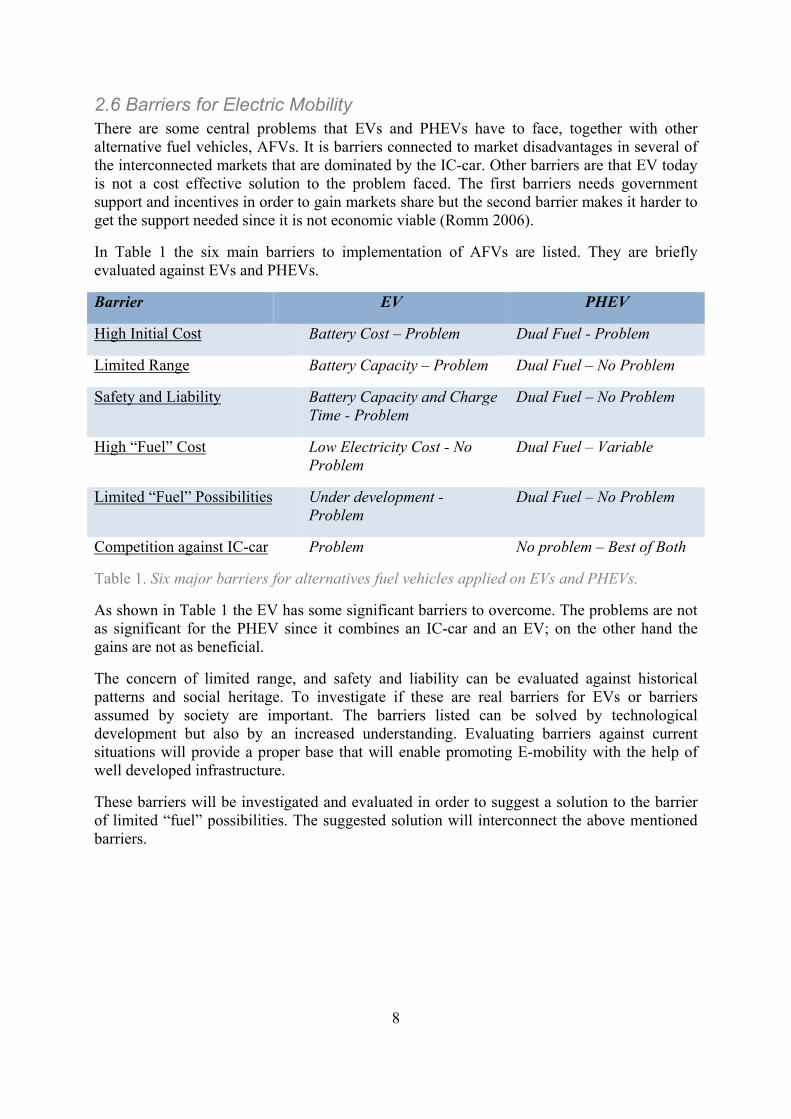
In Table 1 the six main barriers to implementation of AFVs are listed. They are briefly evaluated against EVs and PHEVs.
Barrier EV PHEV
High Initial Cost Battery Cost – Problem Dual Fuel - Problem
Limited Range Battery Capacity – Problem Dual Fuel – No Problem
Safety and Liability Battery Capacity and Charge Time - Problem
Dual Fuel – No Problem
High “Fuel” Cost Low Electricity Cost - No Problem
Dual Fuel – Variable
Limited “Fuel” Possibilities Under development - Problem
Dual Fuel – No Problem
Competition against IC-car Problem No problem – Best of Both
Table 1. Six major barriers for alternatives fuel vehicles applied on EVs and PHEVs.
As shown in Table 1 the EV has some significant barriers to overcome. The problems are not as significant for the PHEV since it combines an IC-car and an EV; on the other hand the gains are not as beneficial.
The concern of limited range, and safety and liability can be evaluated against historical patterns and social heritage. To investigate if these are real barriers for EVs or barriers assumed by society are important. The barriers listed can be solved by technological development but also by an increased understanding. Evaluating barriers against current situations will provide a proper base that will enable promoting E-mobility with the help of well developed infrastructure.
These barriers will be investigated and evaluated in order to suggest a solution to the barrier of limited “fuel” possibilities. The suggested solution will interconnect the above mentioned barriers.
9
3. Motorization The European society is an overall well developed society. There is an internal market for trade and the boarders are opening promoting people and companies to travel and trade. As a consequence personal transportation has become a vital part of the European society. Societies are built around the usage of IC-cars. Infrastructural development and increased urbanization has shortened the daily distance needed to travel. Therefore the perception of what is needed in daily range might be based on earlier society and driving patterns.
3.1 Passenger Mobility in Europe The modal distribution of passenger transport, passenger km, is 79 % by car, 8% by bus, 7% by air, 6 % by rail and less than 1 % by underground or tram (Van Mierlo & Maggetto 2007). These figures lead to an understandable high amount of cars in Europe.
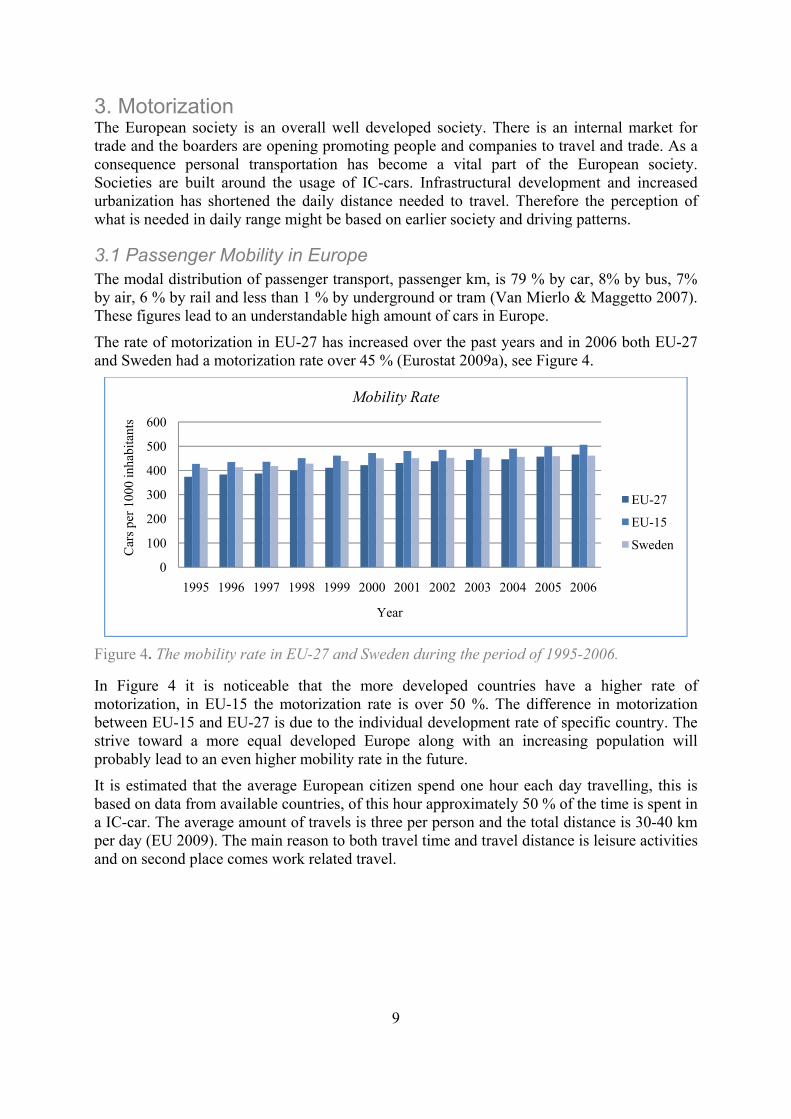
The rate of motorization in EU-27 has increased over the past years and in 2006 both EU-27 and Sweden had a motorization rate over 45 % (Eurostat 2009a), see Figure 4.
Figure 4. The mobility rate in EU-27 and Sweden during the period of 1995-2006.
In Figure 4 it is noticeable that the more developed countries have a higher rate of motorization, in EU-15 the motorization rate is over 50 %. The difference in motorization between EU-15 and EU-27 is due to the individual development rate of specific country. The strive toward a more equal developed Europe along with an increasing population will probably lead to an even higher mobility rate in the future.
It is estimated that the average European citizen spend one hour each day travelling, this is based on data from available countries, of this hour approximately 50 % of the time is spent in a IC-car. The average amount of travels is three per person and the total distance is 30-40 km per day (EU 2009). The main reason to both travel time and travel distance is leisure activities and on second place comes work related travel.
0
100
200
300
400
500
600
1995 1996 1997 1998 1999 2000 2001 2002 2003 2004 2005 2006
Car
s pe
r 10
00 in
habi
tant
s
Year
Mobility Rate
EU-27
EU-15
Sweden
10
Considering the length of each travel, numbers show that in Europe 97, 5 % of the trips made by vehicle are shorter than 100 km.
Trips per year in billions [109]
Mode Less than 100 km
Total share [%] Over 100 km Total share [%]
Driver 235,8 98,1 4,6 1,9
Passenger 134,7 97,9 2,8 2,1
Table 2. Distribution of amount of trips between different lengths of travel.
Even if trips over 100 km only stand for a total of 2, 5 % these trips stand for more than 40 % of the total person km in a year (EU 2009), see Table 3.
Person km per year in billions [109]
Mode Less than 100 km
Total share [%] Over 100 km Total share [%]
Driver 1 443, 4 59,4 987,1 40,6
Passenger 809,6 53,8 694,8 46,2
Table 3. Distribution of person km between different lengths of travel.
The conclusions that can be drawn from the presented information are that the vehicle fleet will increase and that a range of 100-200 km is more than enough for European citizen’s daily usage. This offered range can be compared to the average daily range of 40 km and it obvious that the understandings of driving patterns are poor. In addition to this 50 % of the trips in Europe are less than 10 km and 80 % is shorter than 25 km (IEA 2009).
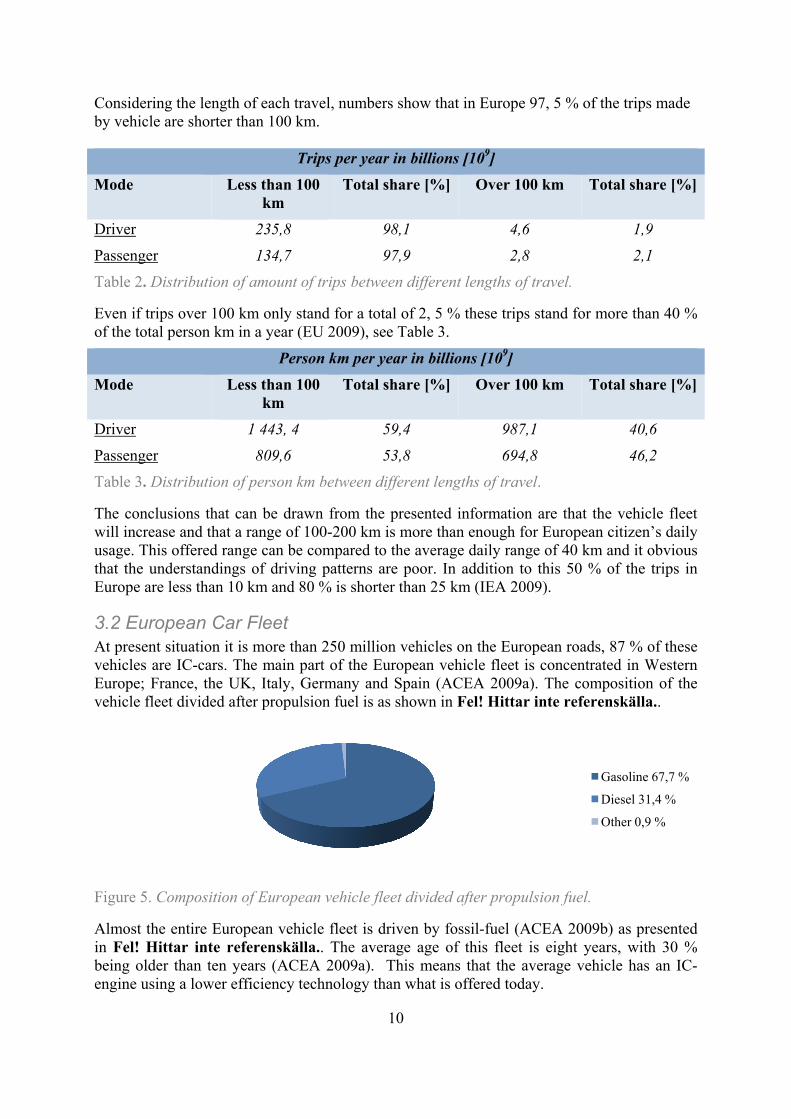
3.2 European Car Fleet At present situation it is more than 250 million vehicles on the European roads, 87 % of these vehicles are IC-cars. The main part of the European vehicle fleet is concentrated in Western Europe; France, the UK, Italy, Germany and Spain (ACEA 2009a). The composition of the vehicle fleet divided after propulsion fuel is as shown in Fel! Hittar inte referenskälla..
Figure 5. Composition of European vehicle fleet divided after propulsion fuel.
Almost the entire European vehicle fleet is driven by fossil-fuel (ACEA 2009b) as presented in Fel! Hittar inte referenskälla.. The average age of this fleet is eight years, with 30 % being older than ten years (ACEA 2009a). This means that the average vehicle has an IC-engine using a lower efficiency technology than what is offered today.
Gasoline 67,7 %
Diesel 31,4 %
Other 0,9 %
11
4. Electric Mobility System The E-mobility system is similar to the IC-car system though there are some different aspects. There is a difference between the vehicles and E-mobility will demand a different supportive infrastructure considering range and charging.
4.1 Electrical Vehicle and Plug-In Hybrid Vehicle The E-mobility fleet will consist of EVs and PHEVs; an EV only uses electricity to run the wheels. Since the storage unit is a battery it is also common that the EV is called a battery electric vehicle, BEV, or battery vehicle, BV.
Basically a PHEV is a vehicle that combines an IC-engine and an electric motor that is powered by a battery, like a Hybrid Electrical Vehicle, HEV. The difference is that it also has the ability to charge the battery directly from the grid, hence the plug in. In this way the electric motor and the battery supports the IC-engine and decrease fuel consumption. There are some characteristics that have to be fulfilled for a vehicle to be called a PHEV. The vehicle has to be able to idle-off, use regenerative braking, power assistance and engine downsizing, provide electric drive only and have an extended battery electric range (Hybridcenter 2007a). Some of these characteristics are common in other vehicles models. They will be classified hybrids and sorted in a range from mild to full. The interesting characteristics with the PHEV are the extended electric drive, plug-in function and the regenerative braking. A vehicle in motion is associated with kinetic energy, the faster the car goes the more energy, and when the car slow down or stops some of this energy is recovered and converted to electricity by a generator and stored in the battery for later use. On a conventional car the kinetic energy heat the brakes and energy is lost through heat.
It is the drive train that transfers the power that drives the wheels. In a hybrid vehicle the drive train can be set-up in three different ways (Hybridcenter 2007b); series, parallel and series/parallel drive train. This makes the PHEV more complicated than IC-cars and EVs. Both IC-cars and EVs are propelled by a single power source and don’t need divided drive trains.
The main technological components that an EV is built of are the electric motor, battery and controller. For PHEV there is an additional need of an IC-engine. To support the EV fleet, an infrastructure that enables charging possibilities is needed.
4.1.1 Electric Motor and Internal Combustion Engine
An electric motor uses electric energy and converts it to mechanical energy. The opposite, mechanical energy to electric energy is done by a generator and this is done in the process of regenerative braking. Typical efficiency of an electric motor is 70-90 %. The internal combustion engine is a machine that produces mechanical energy through burning fuel and air in a closed space. The efficiency of an IC-engine is commonly lower than 30 %. The efficiency rates of both the electric motor and IC-engine are dependant on in what way and under which circumstances it is used.
4.1.2 Accumulator
An EV do not produce electricity itself, expect from the electricity that is gained from the process of regenerative braking. Therefore there is a need to store electricity in the vehicle that can be used to drive it. There are different kinds of storage devices such as the accumulator and the super capacitor. The demand on rechargeable and portable characteristics for EVs make the accumulator best suited, the accumulator is more known as a battery.
12
The two determining factors of a battery are the power density and the energy density. The former defines the acceleration, the rate of which power can be delivered. The latter, energy density, is the total amount of deliverable energy, this determines the range of the vehicle (Gilbert 2008). A Li-ion battery, that is the probable solution, is built up by several cells that must be matched in order to make the battery as efficient as possible. It is the weakest cell that determines to what extent the battery can be depleted. On the other hand it is the best cell that will be charged fastest and this will slow down the charging of the weaker cells until they are fully charged (Söderlind 2009). The state of charge, SOC, is what determines the charge level of batteries and it is important that there is communication between battery and grid in order to provide the proper charging. A battery is constructed in a way that enables it to un-charge and charge several times, each of this time is called a cycle. The energy efficiency of cycle is between 65 – 85 % (NE 2009a). The fact that Li-Ion batteries have a high energy density along with the fact that they are rechargeable makes them suitable to use in EVs and PHEVs. There are though one significant difference between the batteries needed for EVs, PHEVs and HEVs. An EV needs high energy density while the HEV need high power capacity. The PHEV is a solution that requires both high energy and high power. This places the PHEV in the middle of the battery group with on major drawback. That is that the development of batteries is not based on the same demands for EVs and PHEVs.
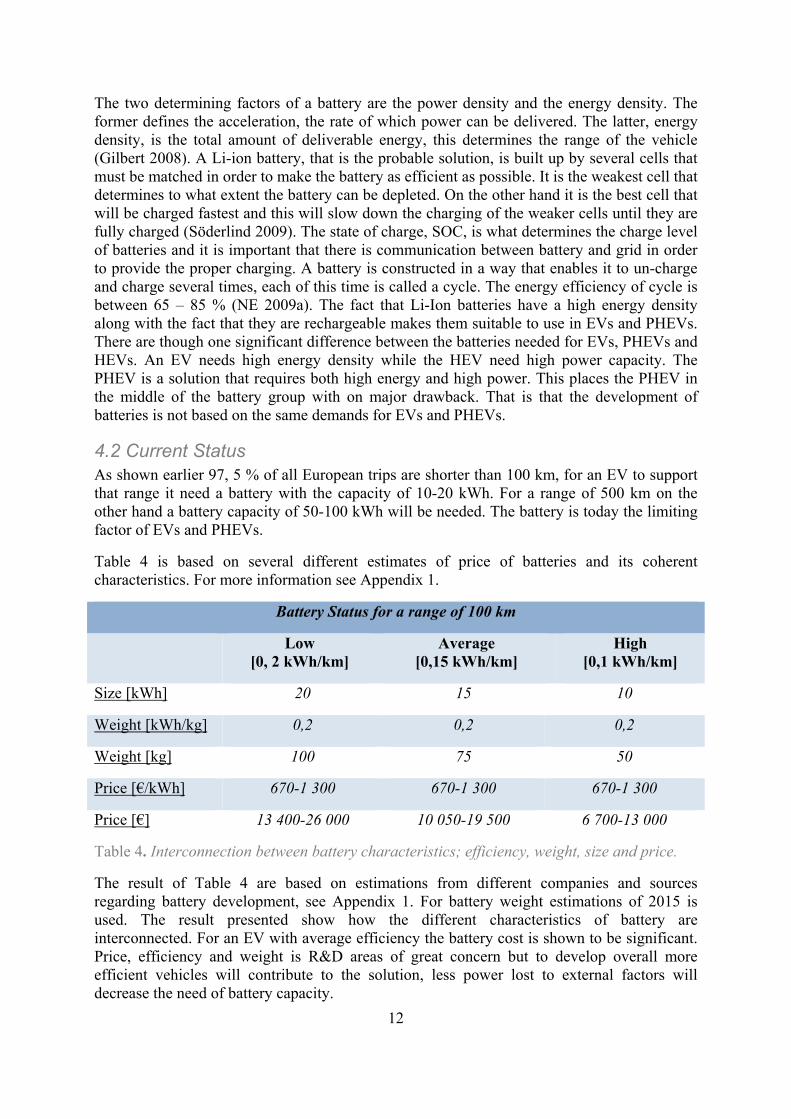
4.2 Current Status As shown earlier 97, 5 % of all European trips are shorter than 100 km, for an EV to support that range it need a battery with the capacity of 10-20 kWh. For a range of 500 km on the other hand a battery capacity of 50-100 kWh will be needed. The battery is today the limiting factor of EVs and PHEVs.
Table 4 is based on several different estimates of price of batteries and its coherent characteristics. For more information see Appendix 1.
Battery Status for a range of 100 km
Low [0, 2 kWh/km]
Average [0,15 kWh/km]
High [0,1 kWh/km]
Size [kWh] 20 15 10
Weight [kWh/kg] 0,2 0,2 0,2
Weight [kg] 100 75 50
Price [€/kWh] 670-1 300 670-1 300 670-1 300
Price [€] 13 400-26 000 10 050-19 500 6 700-13 000
Table 4. Interconnection between battery characteristics; efficiency, weight, size and price.
The result of Table 4 are based on estimations from different companies and sources regarding battery development, see Appendix 1. For battery weight estimations of 2015 is used. The result presented show how the different characteristics of battery are interconnected. For an EV with average efficiency the battery cost is shown to be significant. Price, efficiency and weight is R&D areas of great concern but to develop overall more efficient vehicles will contribute to the solution, less power lost to external factors will decrease the need of battery capacity.
13
4.2.1 Energy Density of Batteries
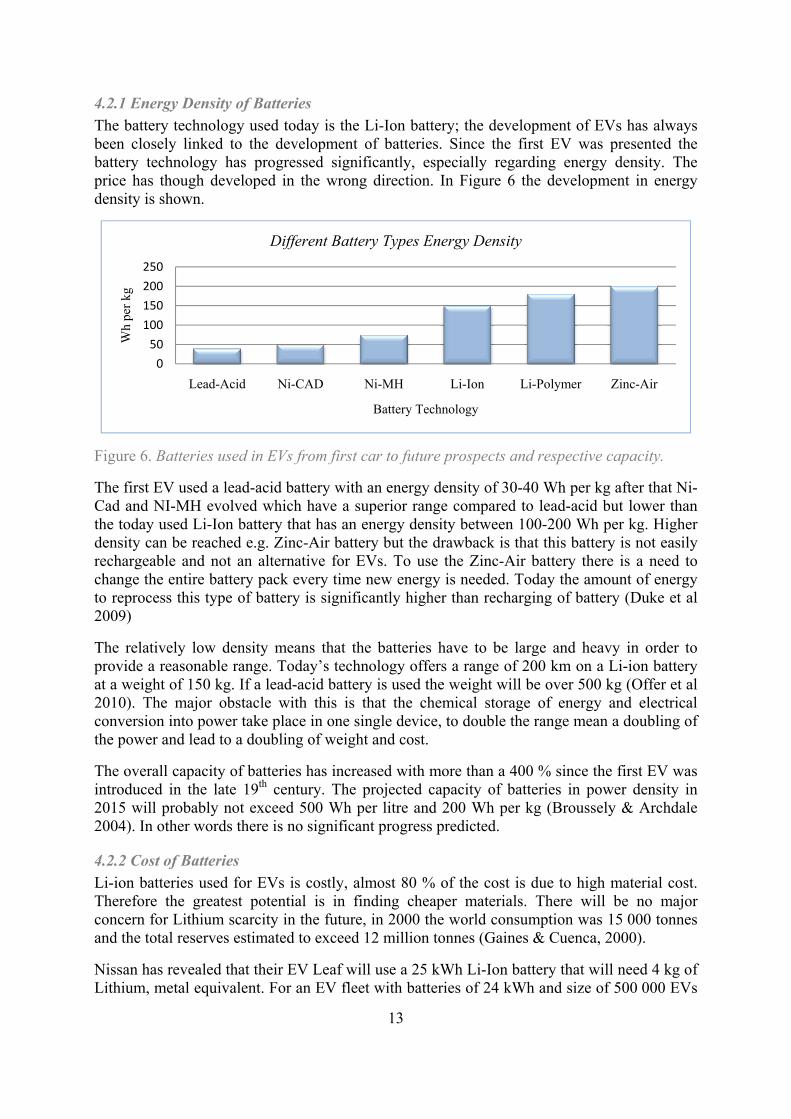
The battery technology used today is the Li-Ion battery; the development of EVs has always been closely linked to the development of batteries. Since the first EV was presented the battery technology has progressed significantly, especially regarding energy density. The price has though developed in the wrong direction. In Figure 6 the development in energy density is shown.
Figure 6. Batteries used in EVs from first car to future prospects and respective capacity.
The first EV used a lead-acid battery with an energy density of 30-40 Wh per kg after that Ni-Cad and NI-MH evolved which have a superior range compared to lead-acid but lower than the today used Li-Ion battery that has an energy density between 100-200 Wh per kg. Higher density can be reached e.g. Zinc-Air battery but the drawback is that this battery is not easily rechargeable and not an alternative for EVs. To use the Zinc-Air battery there is a need to change the entire battery pack every time new energy is needed. Today the amount of energy to reprocess this type of battery is significantly higher than recharging of battery (Duke et al 2009)
The relatively low density means that the batteries have to be large and heavy in order to provide a reasonable range. Today’s technology offers a range of 200 km on a Li-ion battery at a weight of 150 kg. If a lead-acid battery is used the weight will be over 500 kg (Offer et al 2010). The major obstacle with this is that the chemical storage of energy and electrical conversion into power take place in one single device, to double the range mean a doubling of the power and lead to a doubling of weight and cost.
The overall capacity of batteries has increased with more than a 400 % since the first EV was introduced in the late 19th century. The projected capacity of batteries in power density in 2015 will probably not exceed 500 Wh per litre and 200 Wh per kg (Broussely & Archdale 2004). In other words there is no significant progress predicted.
4.2.2 Cost of Batteries
Li-ion batteries used for EVs is costly, almost 80 % of the cost is due to high material cost. Therefore the greatest potential is in finding cheaper materials. There will be no major concern for Lithium scarcity in the future, in 2000 the world consumption was 15 000 tonnes and the total reserves estimated to exceed 12 million tonnes (Gaines & Cuenca, 2000).
Nissan has revealed that their EV Leaf will use a 25 kWh Li-Ion battery that will need 4 kg of Lithium, metal equivalent. For an EV fleet with batteries of 24 kWh and size of 500 000 EVs
0
50
100
150
200
250
Lead-Acid Ni-CAD Ni-MH Li-Ion Li-Polymer Zinc-Air
Wh
per
kg
Battery Technology
Different Battery Types Energy Density
14
in 2015 will demand around 2 000 tonnes of Lithium. This amount is approximately 10 % of the total Lithium production in 2008 (GLG 2009). Based on the supply there is a potential to supply up to 2 million EVs and HEVs in 2015. It is estimated that there is a world reserve of 4.1 million tonnes of lithium that can be used at economic profit (BERR 2008). These figures show that oversupply might be a bigger issue than lack of Lithium, oversupply might shift the supply-demand balance and cut prices on Lithium leading to less expensive batteries (GLG 2009).
The cost for a Li-ion battery is today approximately 700 € per kWh but it is estimated that the price of battery must be as low as 200 € per kWh in order to be attractive to the major market (Abrahamsson 2009). The Li-ion batteries today provide enough or more of the expectations concerning HEV and support drive (Chalk & Miller 2006).
Mass production of batteries will along with improved technologies be the most important ways to reduce the cost of batteries. To use similar batteries in a wide range of EVs will enable mass production. In the question of mass production the competition between developer and a mature battery technology is hard to over come.
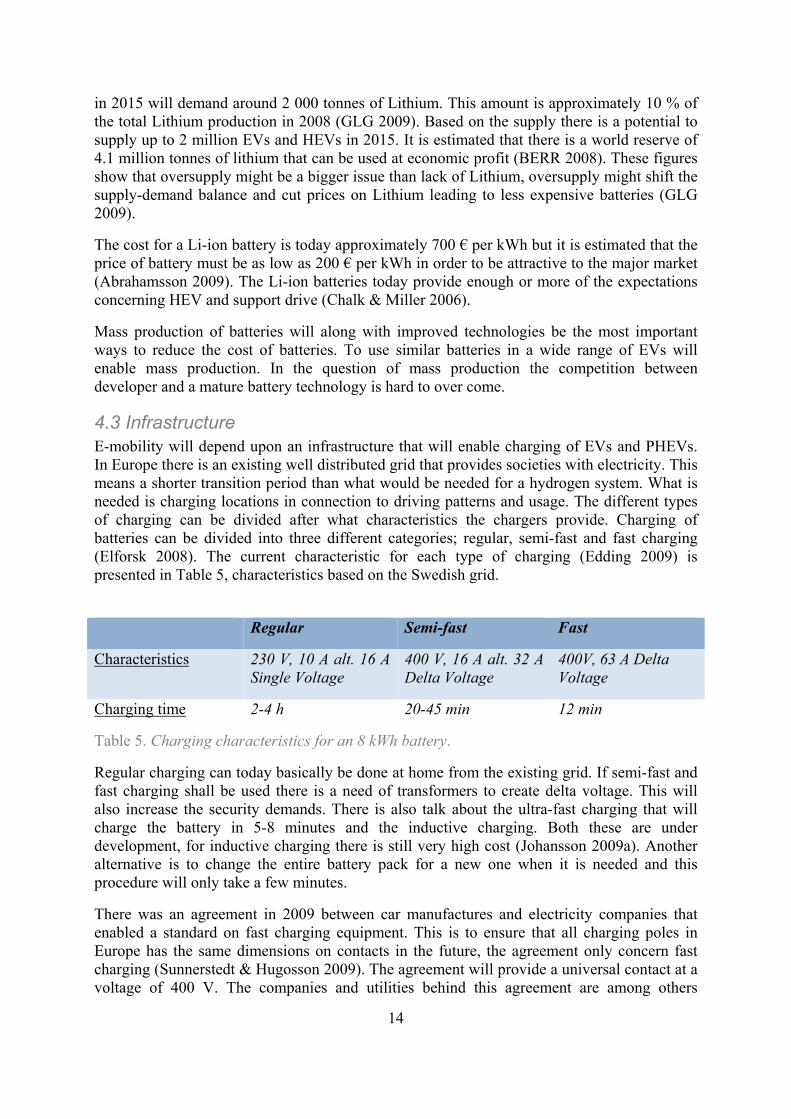
4.3 Infrastructure E-mobility will depend upon an infrastructure that will enable charging of EVs and PHEVs. In Europe there is an existing well distributed grid that provides societies with electricity. This means a shorter transition period than what would be needed for a hydrogen system. What is needed is charging locations in connection to driving patterns and usage. The different types of charging can be divided after what characteristics the chargers provide. Charging of batteries can be divided into three different categories; regular, semi-fast and fast charging (Elforsk 2008). The current characteristic for each type of charging (Edding 2009) is presented in Table 5, characteristics based on the Swedish grid.
Regular Semi-fast Fast
Characteristics 230 V, 10 A alt. 16 A Single Voltage
400 V, 16 A alt. 32 A Delta Voltage
400V, 63 A Delta Voltage
Charging time 2-4 h 20-45 min 12 min
Table 5. Charging characteristics for an 8 kWh battery.
Regular charging can today basically be done at home from the existing grid. If semi-fast and fast charging shall be used there is a need of transformers to create delta voltage. This will also increase the security demands. There is also talk about the ultra-fast charging that will charge the battery in 5-8 minutes and the inductive charging. Both these are under development, for inductive charging there is still very high cost (Johansson 2009a). Another alternative is to change the entire battery pack for a new one when it is needed and this procedure will only take a few minutes.
There was an agreement in 2009 between car manufactures and electricity companies that enabled a standard on fast charging equipment. This is to ensure that all charging poles in Europe has the same dimensions on contacts in the future, the agreement only concern fast charging (Sunnerstedt & Hugosson 2009). The agreement will provide a universal contact at a voltage of 400 V. The companies and utilities behind this agreement are among others
15
Vattenfall AB, EFD, Endesa, Ene, BMW, Fiat, Mitsubishi, Toyota, Volkswagen, Ford and GM.
Today there is a “chicken and egg” problem concerning the infrastructure (Romm 2006). In order for manufactures to provide the market with EVs there must be a developed infrastructure. The provider of charging spots on the other hand is not interested to provide charging when there are no EVs on the market.
4.4 Efficiency of Electric Mobility At the market today a vehicle is optimised to deliver e.g. acceleration, cruising efficiency and range (Offer et al 2010). An IC-car has to do a trade-off between acceleration and cruising efficiency but has the superior advantage of the high range due to the energy density in gasoline. In comparison to this the EV has superior efficiency of the motor but has problem with the energy density. The extremely high energy density in gasoline is the only reason that IC-car has been able to use such an in-efficient energy conversion device as the IC-engine. The tank of gasoline decides the range not the engine (Ibid).
4.4.1 Different Vehicles Efficiencies
The emissions emitted by a vehicle is dependent upon activity and driving patterns, energy density, and finally the amount of GHGs in the energy source used. An equation of a vehicles environmental impact would be;
The three different factors are all possible to influence, the largest potential is in decreasing the amount of GHGs in the energy but also the final energy density. Of course there is the possibility to have an impact of the activity and driving patterns. Based on the increasing population and the increased living standards a decreased activity is not probable. In this case it is more probable to reach a zero increase by increased efficiency. This does not mean that the developed world should ignore the fact that a decreased use of personal transportation is a part of the solution to transport related GHGs. On a global overall basis it is the final efficiency and the amount of GHGs in energy that can decrease the global environmental impact in short term.
The overall efficiency of a vehicle can be compared from source to final gain which is known as Well-to-Wheel, WtW, when concerning vehicles. The different stages in this WtW scenario is; primary energy source, distribution, the efficiency of the vehicles engine and the overall efficiency. If the source of energy is ignored there is a Tank-to-Wheel, TtW, efficiency.
16
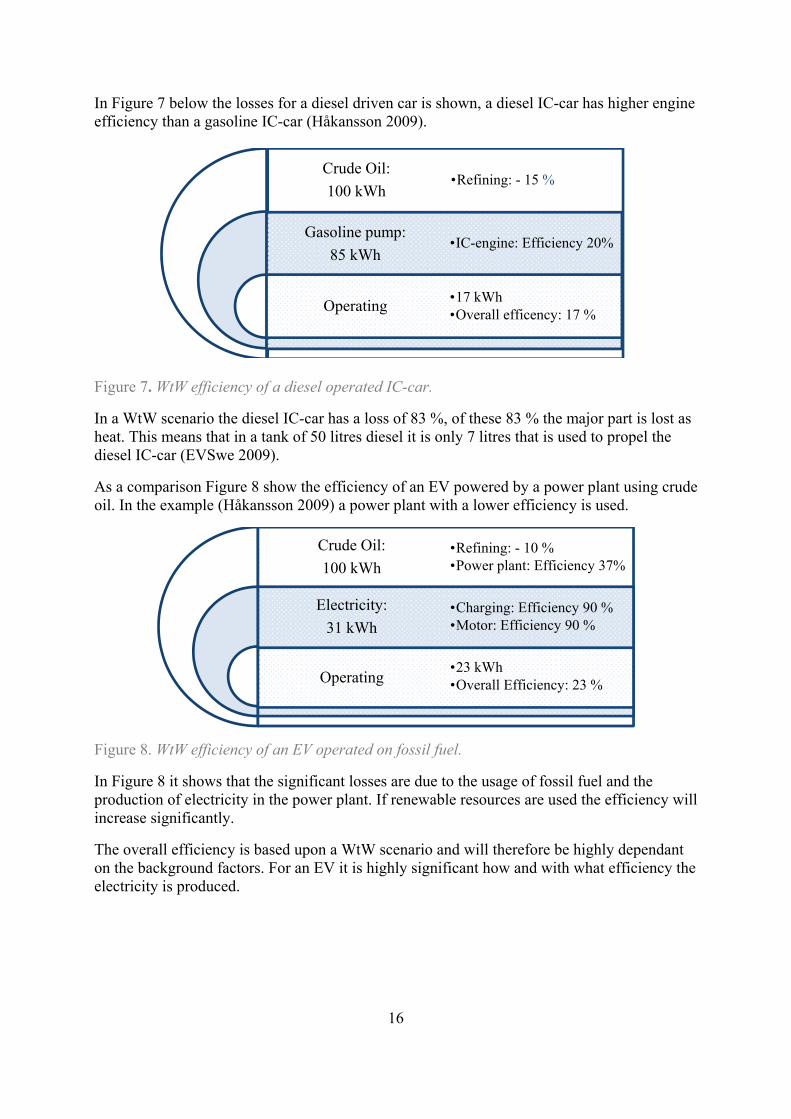
In Figure 7 below the losses for a diesel driven car is shown, a diesel IC-car has higher engine efficiency than a gasoline IC-car (Håkansson 2009).
Figure 7. WtW efficiency of a diesel operated IC-car.
In a WtW scenario the diesel IC-car has a loss of 83 %, of these 83 % the major part is lost as heat. This means that in a tank of 50 litres diesel it is only 7 litres that is used to propel the diesel IC-car (EVSwe 2009).
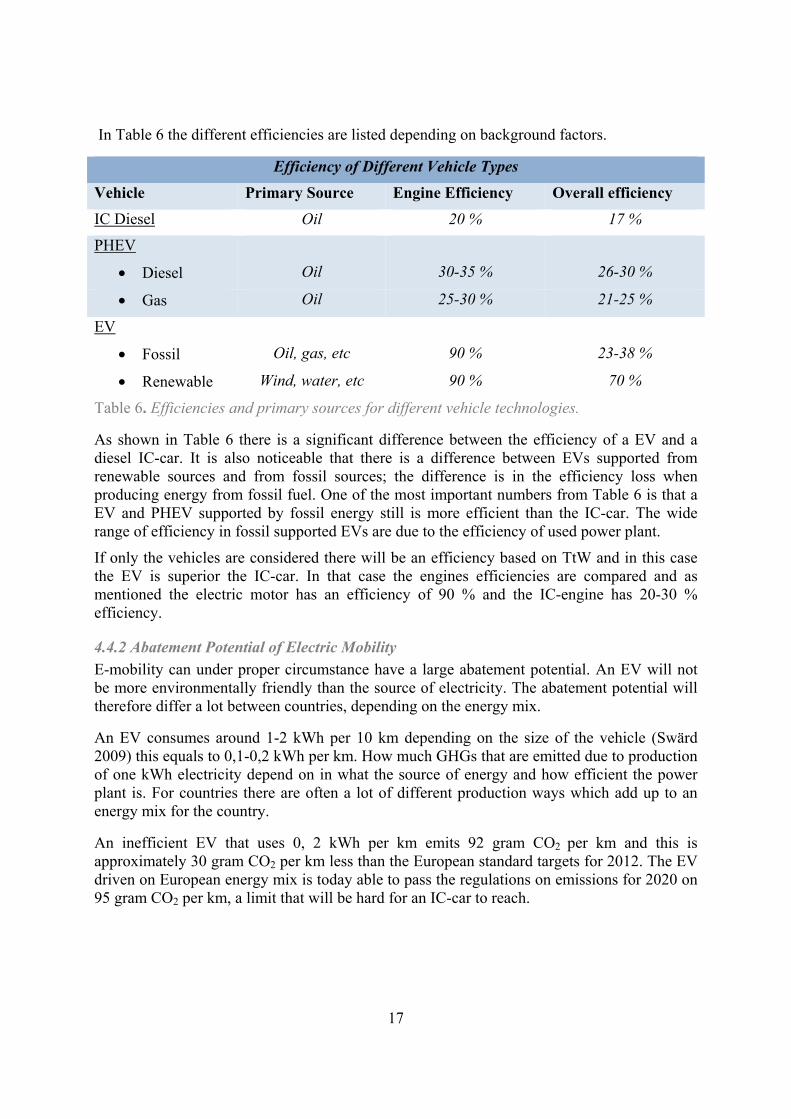
As a comparison Figure 8 show the efficiency of an EV powered by a power plant using crude oil. In the example (Håkansson 2009) a power plant with a lower efficiency is used.
Figure 8. WtW efficiency of an EV operated on fossil fuel.
In Figure 8 it shows that the significant losses are due to the usage of fossil fuel and the production of electricity in the power plant. If renewable resources are used the efficiency will increase significantly.
The overall efficiency is based upon a WtW scenario and will therefore be highly dependant on the background factors. For an EV it is highly significant how and with what efficiency the electricity is produced.
Crude Oil:
100 kWh
Gasoline pump:
85 kWh
Operating
•Refining: - 15 %
•IC-engine: Efficiency 20%
•17 kWh•Overall efficency: 17 %
Crude Oil:
100 kWh
Electricity:
31 kWh
Operating
•Refining: - 10 %•Power plant: Efficiency 37%
•Charging: Efficiency 90 %•Motor: Efficiency 90 %
•23 kWh•Overall Efficiency: 23 %
17
In Table 6 the different efficiencies are listed depending on background factors.
Efficiency of Different Vehicle Types
Vehicle Primary Source Engine Efficiency Overall efficiency
IC Diesel Oil 20 % 17 %
PHEV
• Diesel Oil 30-35 % 26-30 %
• Gas Oil 25-30 % 21-25 %
EV
• Fossil Oil, gas, etc 90 % 23-38 %
• Renewable Wind, water, etc 90 % 70 %
Table 6. Efficiencies and primary sources for different vehicle technologies.
As shown in Table 6 there is a significant difference between the efficiency of a EV and a diesel IC-car. It is also noticeable that there is a difference between EVs supported from renewable sources and from fossil sources; the difference is in the efficiency loss when producing energy from fossil fuel. One of the most important numbers from Table 6 is that a EV and PHEV supported by fossil energy still is more efficient than the IC-car. The wide range of efficiency in fossil supported EVs are due to the efficiency of used power plant.
If only the vehicles are considered there will be an efficiency based on TtW and in this case the EV is superior the IC-car. In that case the engines efficiencies are compared and as mentioned the electric motor has an efficiency of 90 % and the IC-engine has 20-30 % efficiency.
4.4.2 Abatement Potential of Electric Mobility
E-mobility can under proper circumstance have a large abatement potential. An EV will not be more environmentally friendly than the source of electricity. The abatement potential will therefore differ a lot between countries, depending on the energy mix.
An EV consumes around 1-2 kWh per 10 km depending on the size of the vehicle (Swärd 2009) this equals to 0,1-0,2 kWh per km. How much GHGs that are emitted due to production of one kWh electricity depend on in what the source of energy and how efficient the power plant is. For countries there are often a lot of different production ways which add up to an energy mix for the country.
An inefficient EV that uses 0, 2 kWh per km emits 92 gram CO2 per km and this is approximately 30 gram CO2 per km less than the European standard targets for 2012. The EV driven on European energy mix is today able to pass the regulations on emissions for 2020 on 95 gram CO2 per km, a limit that will be hard for an IC-car to reach.
18
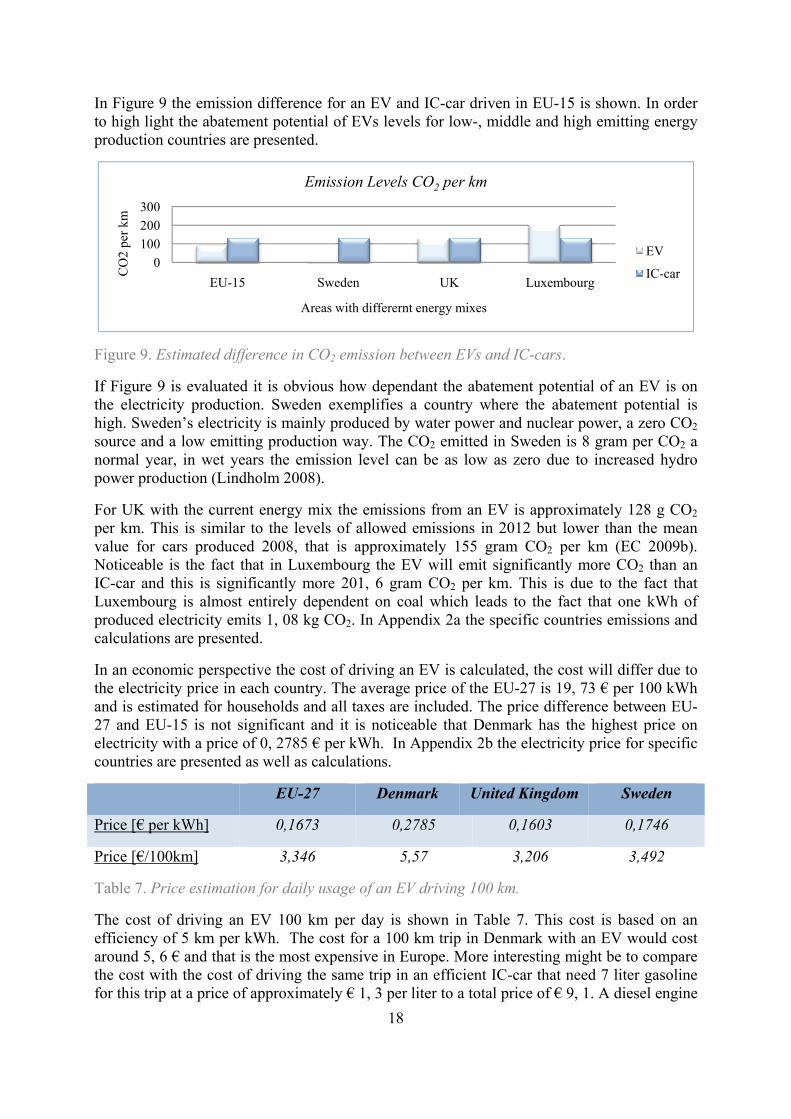
In Figure 9 the emission difference for an EV and IC-car driven in EU-15 is shown. In order to high light the abatement potential of EVs levels for low-, middle and high emitting energy production countries are presented.
Figure 9. Estimated difference in CO2 emission between EVs and IC-cars.
If Figure 9 is evaluated it is obvious how dependant the abatement potential of an EV is on the electricity production. Sweden exemplifies a country where the abatement potential is high. Sweden’s electricity is mainly produced by water power and nuclear power, a zero CO2 source and a low emitting production way. The CO2 emitted in Sweden is 8 gram per CO2 a normal year, in wet years the emission level can be as low as zero due to increased hydro power production (Lindholm 2008).
For UK with the current energy mix the emissions from an EV is approximately 128 g CO2 per km. This is similar to the levels of allowed emissions in 2012 but lower than the mean value for cars produced 2008, that is approximately 155 gram CO2 per km (EC 2009b). Noticeable is the fact that in Luxembourg the EV will emit significantly more CO2 than an IC-car and this is significantly more 201, 6 gram CO2 per km. This is due to the fact that Luxembourg is almost entirely dependent on coal which leads to the fact that one kWh of produced electricity emits 1, 08 kg CO2. In Appendix 2a the specific countries emissions and calculations are presented.
In an economic perspective the cost of driving an EV is calculated, the cost will differ due to the electricity price in each country. The average price of the EU-27 is 19, 73 € per 100 kWh and is estimated for households and all taxes are included. The price difference between EU-27 and EU-15 is not significant and it is noticeable that Denmark has the highest price on electricity with a price of 0, 2785 € per kWh. In Appendix 2b the electricity price for specific countries are presented as well as calculations.
EU-27 Denmark United Kingdom Sweden
Price [€ per kWh] 0,1673 0,2785 0,1603 0,1746
Price [€/100km] 3,346 5,57 3,206 3,492
Table 7. Price estimation for daily usage of an EV driving 100 km.
The cost of driving an EV 100 km per day is shown in Table 7. This cost is based on an efficiency of 5 km per kWh. The cost for a 100 km trip in Denmark with an EV would cost around 5, 6 € and that is the most expensive in Europe. More interesting might be to compare the cost with the cost of driving the same trip in an efficient IC-car that need 7 liter gasoline for this trip at a price of approximately € 1, 3 per liter to a total price of € 9, 1. A diesel engine
0
100
200
300
EU-15 Sweden UK Luxembourg
CO
2 pe
r km
Areas with differernt energy mixes
Emission Levels CO2 per km
EV
IC-car
19
is a better alternative than gasoline with an efficiency of 0, 5 liter per km and an approximately price of € 1, 1 per liter diesel.
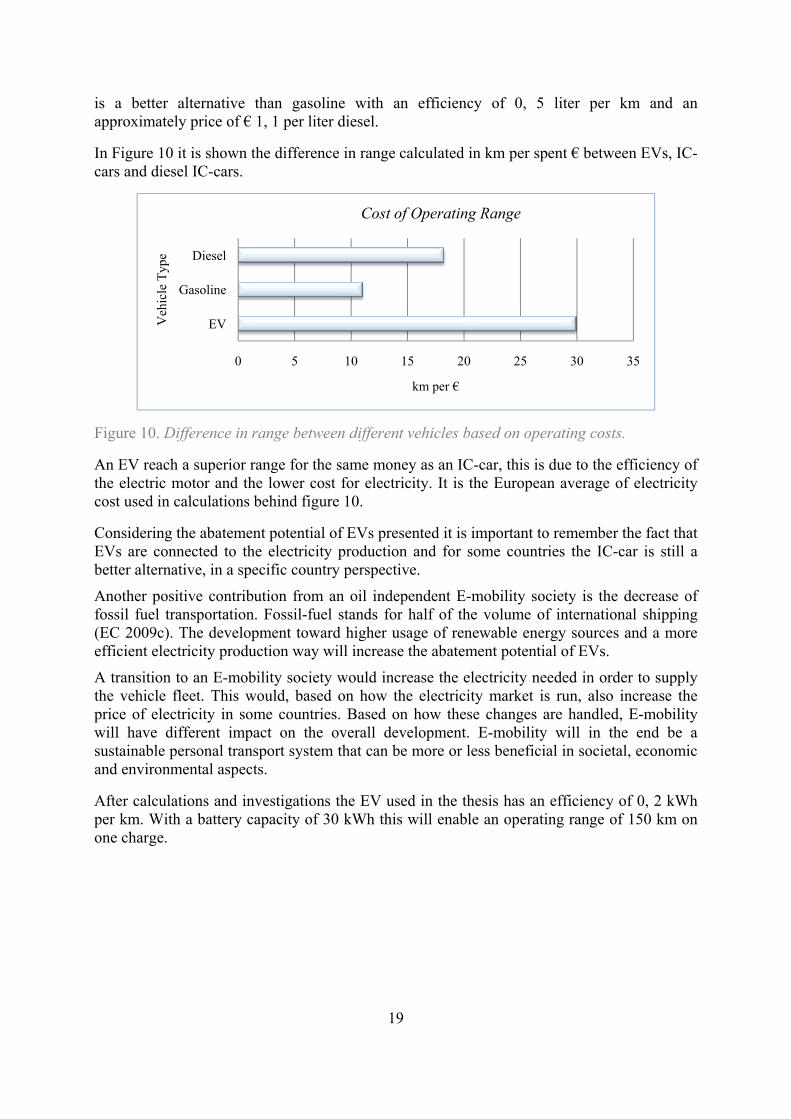
In Figure 10 it is shown the difference in range calculated in km per spent € between EVs, IC-cars and diesel IC-cars.
Figure 10. Difference in range between different vehicles based on operating costs.
An EV reach a superior range for the same money as an IC-car, this is due to the efficiency of the electric motor and the lower cost for electricity. It is the European average of electricity cost used in calculations behind figure 10.
Considering the abatement potential of EVs presented it is important to remember the fact that EVs are connected to the electricity production and for some countries the IC-car is still a better alternative, in a specific country perspective.
Another positive contribution from an oil independent E-mobility society is the decrease of fossil fuel transportation. Fossil-fuel stands for half of the volume of international shipping (EC 2009c). The development toward higher usage of renewable energy sources and a more efficient electricity production way will increase the abatement potential of EVs.
A transition to an E-mobility society would increase the electricity needed in order to supply the vehicle fleet. This would, based on how the electricity market is run, also increase the price of electricity in some countries. Based on how these changes are handled, E-mobility will have different impact on the overall development. E-mobility will in the end be a sustainable personal transport system that can be more or less beneficial in societal, economic and environmental aspects.
After calculations and investigations the EV used in the thesis has an efficiency of 0, 2 kWh per km. With a battery capacity of 30 kWh this will enable an operating range of 150 km on one charge.
0 5 10 15 20 25 30 35
EV
Gasoline
Diesel
km per €
Veh
icle
Typ
e
Cost of Operating Range
20
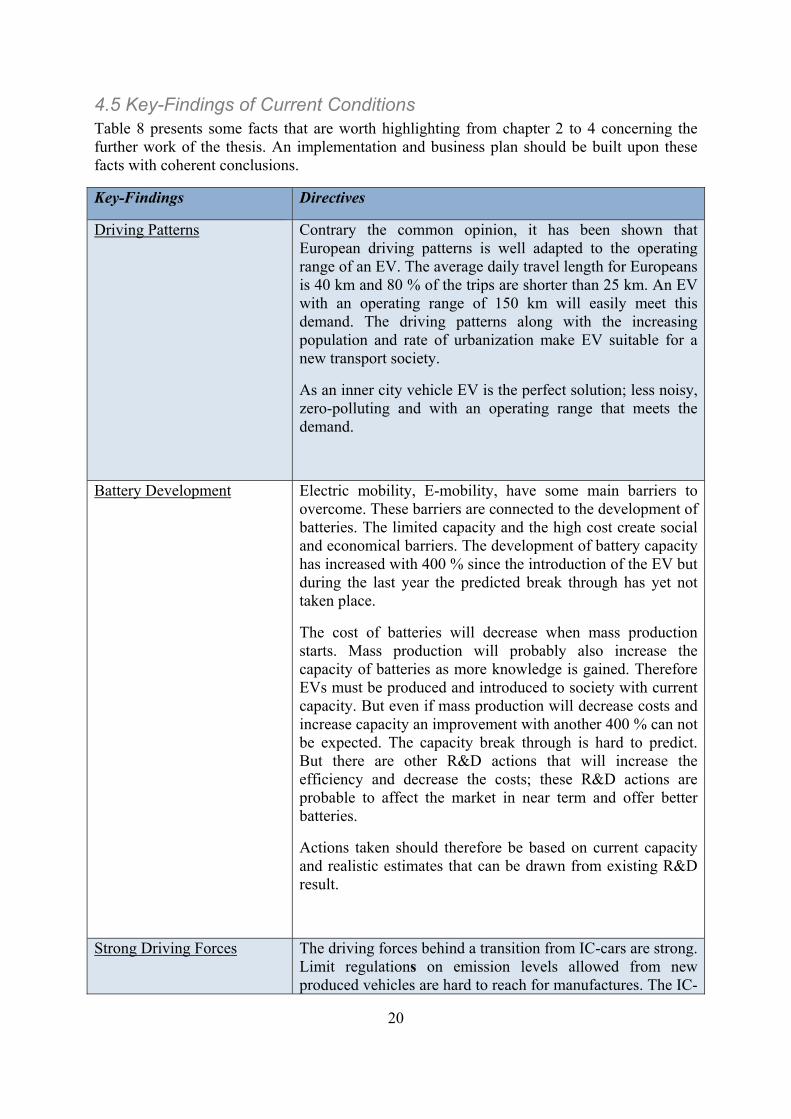
4.5 Key-Findings of Current Conditions Table 8 presents some facts that are worth highlighting from chapter 2 to 4 concerning the further work of the thesis. An implementation and business plan should be built upon these facts with coherent conclusions.
Key-Findings Directives
Driving Patterns Contrary the common opinion, it has been shown that European driving patterns is well adapted to the operating range of an EV. The average daily travel length for Europeans is 40 km and 80 % of the trips are shorter than 25 km. An EV with an operating range of 150 km will easily meet this demand. The driving patterns along with the increasing population and rate of urbanization make EV suitable for a new transport society.
As an inner city vehicle EV is the perfect solution; less noisy, zero-polluting and with an operating range that meets the demand.
Battery Development Electric mobility, E-mobility, have some main barriers to overcome. These barriers are connected to the development of batteries. The limited capacity and the high cost create social and economical barriers. The development of battery capacity has increased with 400 % since the introduction of the EV but during the last year the predicted break through has yet not taken place.
The cost of batteries will decrease when mass production starts. Mass production will probably also increase the capacity of batteries as more knowledge is gained. Therefore EVs must be produced and introduced to society with current capacity. But even if mass production will decrease costs and increase capacity an improvement with another 400 % can not be expected. The capacity break through is hard to predict. But there are other R&D actions that will increase the efficiency and decrease the costs; these R&D actions are probable to affect the market in near term and offer better batteries.
Actions taken should therefore be based on current capacity and realistic estimates that can be drawn from existing R&D result.
Strong Driving Forces The driving forces behind a transition from IC-cars are strong. Limit regulations on emission levels allowed from new produced vehicles are hard to reach for manufactures. The IC-
21
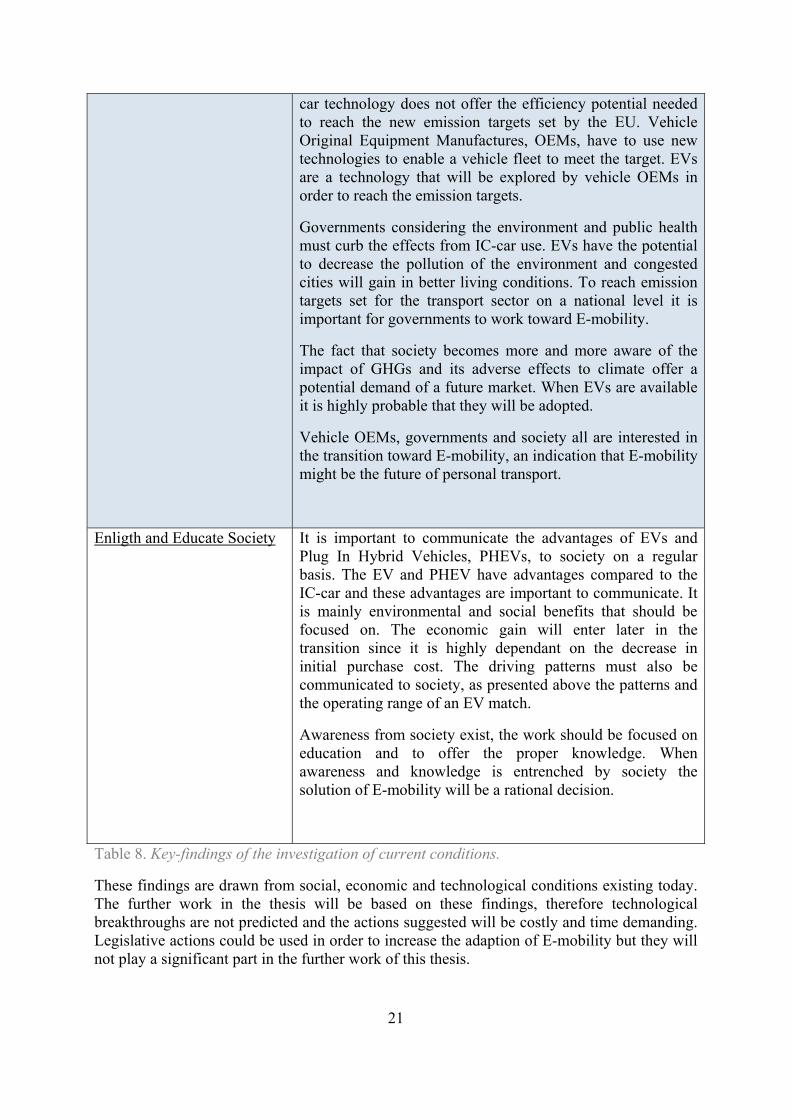
car technology does not offer the efficiency potential needed to reach the new emission targets set by the EU. Vehicle Original Equipment Manufactures, OEMs, have to use new technologies to enable a vehicle fleet to meet the target. EVs are a technology that will be explored by vehicle OEMs in order to reach the emission targets.
Governments considering the environment and public health must curb the effects from IC-car use. EVs have the potential to decrease the pollution of the environment and congested cities will gain in better living conditions. To reach emission targets set for the transport sector on a national level it is important for governments to work toward E-mobility.
The fact that society becomes more and more aware of the impact of GHGs and its adverse effects to climate offer a potential demand of a future market. When EVs are available it is highly probable that they will be adopted.
Vehicle OEMs, governments and society all are interested in the transition toward E-mobility, an indication that E-mobility might be the future of personal transport.
Enligth and Educate Society It is important to communicate the advantages of EVs and Plug In Hybrid Vehicles, PHEVs, to society on a regular basis. The EV and PHEV have advantages compared to the IC-car and these advantages are important to communicate. It is mainly environmental and social benefits that should be focused on. The economic gain will enter later in the transition since it is highly dependant on the decrease in initial purchase cost. The driving patterns must also be communicated to society, as presented above the patterns and the operating range of an EV match.
Awareness from society exist, the work should be focused on education and to offer the proper knowledge. When awareness and knowledge is entrenched by society the solution of E-mobility will be a rational decision.
Table 8. Key-findings of the investigation of current conditions.
These findings are drawn from social, economic and technological conditions existing today. The further work in the thesis will be based on these findings, therefore technological breakthroughs are not predicted and the actions suggested will be costly and time demanding. Legislative actions could be used in order to increase the adaption of E-mobility but they will not play a significant part in the further work of this thesis.

22
23
5. Development Theory If transportation is seen more as a function and to what purpose it serve it provide a different view of the IC-car. The IC-car will no longer be a list of components nor a machine consistent of wheels, engine and gears. To consider the function and purpose is the system approach (Churchman 1968) to the transportation question. When transportation is considered a system there are other points to be considered; total objectives of the system, the environment of the system and its constraints, resources of the system, components of the system and finally the management of the system. To implement EVs and PHEVs into the transport society this system approach might be a good way to approach the situation. The transport system consists of several elements: infrastructure, transport vehicles, nodes and equipment. To this there are also Information and Communications Technologies, ICT, applications related to the infrastructure, network services and operational as well as administrative procedures. If the transport system shall work, all these interrelated components have to work together (EC 2009c).
5.1 Development Block A development block is a set of factors that are interdependent and interconnected. The widespread use of IC-cars is a remarkable example of a development block of the past; no other block has had such an impact on our economy as the IC-car block (Dahmén 1989). Therefore the development block theory by Dahmén is a good framework for the development of EVs and PHEVs.
The interdependent factors can be seen in price and cost differences in the market or in the creating of new markets by entrepreneur activities in other markets. Since it is a block consisting of different factors some parts of the block can be incomplete and this creates opportunities as well as difficulties (Ibid). These incomplete parts of the block can create a situation when development is stuck in a pre-mature phase and complementary factors are missing. When these factors are added or developed the full potential of development is released and the technique can reach its full potential. When it is a lack of complementary stages it represents structural tensions in the block. Structural tension can be a result of lack of knowledge as well as the resistance from groups that have interests in other areas and have now interest in further development. Even if structural tension, in some cases, keep development phase low it contributes to a more balanced development. The structural tension ensures that a technology stops when its complementary parts are unbalanced and in this way complementary parts get the chance to re-develop (op.cit.). Historically when system change it is due to result of subsystems gradually changing and this is known as technological transition (Hillman et al 2008).
The development is not independent of policy involvement in order to complete the development block. An uncompleted transformation block are often indicated by price and cost signals. At this moment the technologies in the block may cause economical losses on the market but can also show signals of a future of promising prospects. At this moment entrepreneurs play an important role promoting the technology, especially if the complementary factors in order to complete the block are forthcoming. The entrepreneurial work does not have to be based on knowledge of current block, it is as important that an active search of new possibilities and solutions is undertaken (Dahmén, 1989). Single entrepreneurs or group of entrepreneurs may complete a part of the development block on their own.
24
By promoting and investing in infrastructure therefore entrepreneurs play a vital part in the development of an EV society. A well developed infrastructure will help in releasing the full potential of an EV.
Concerning the further development of an EV society there are clear structural tensions and an obvious need for entrepreneurs. The EV block can be divided into different parts; the electric motor, battery, mechanical structure and infrastructure including charging possibilities. Each of these factors has sub-factors that they depend upon and that control further development.
The EV development block has a wide range of structural tensions, there are factors that are highly developed and there are factors that need a lot of development. The electric motor is very efficient and the energy losses compared to an IC-engine are minimal. The battery capacity on the other hand can not provide the same range as a tank of gasoline. The shortcoming of the battery together with long charging time is the major structural tensions that hold back the development of E-mobility. Battery and infrastructure obstacles have no major effect on the electric motor, it is highly developed. The mechanical structure on the other hand is not considered as under-developed but is dependant on the further development of the battery in order to evolve more. The battery size and weight will affect the safety restrictions of the mechanical structure. On the other hand the more efficient electric motor has potential to offer new designs of the mechanical structure. The design will have possibilities to gain even more in efficiency due to aerodynamic and placement of the electric motor. The design of the IC-car today offer the comfort and safety that many people want, this design is available also for EVs. This means that people will be able to have the same size of vehicle even in the coming years, this will be provided by the PHEV mainly. As earlier mentioned the efficiency of the EV is not only dependent on the battery and its characteristics but also the vehicle body design considering aerodynamics and friction.
The battery and the infrastructure are the two factors that currently are developing in order to reach the full potential of the EV. In order to provide the sufficient support to the development there is a need for entrepreneurs and policy involvement as well as economic incentives. For the moment the development of the EV block is not gaining anything at the tension situation since it basically just keeps the EV of the market. Therefore it is even more important to provide sufficient help in form of policies and incentives since the development will not solve itself during its time out on the market, if considered EVs.
A development that is a part of the structural tensions are the PHEV that is developed in order to provide the range of an IC-car but still be as environmental and economical on shorter more daily trips. Due to the problem with battery capacity and charging time there is a need for the PHEVs and it is a precursor and a complementary stage that is needed in order to get the EV block to complete its transformation.
There is also a stand off between supply and demand; the Prius and Insight are two models on the market. They look similar and if the model does not suit the consumer there are no other alternative. Therefore it is important to have a couple of different models on the market. People do not buy the vehicle only because it is an EV they buy the function vehicle provide and are more concerned of size and liability than what drives it. The market has to provide cars in different sizes in order to attract a large part of the public. The larger vehicles might be PHEVs and the smaller EVs in order to keep prices down and open up the market for the public.
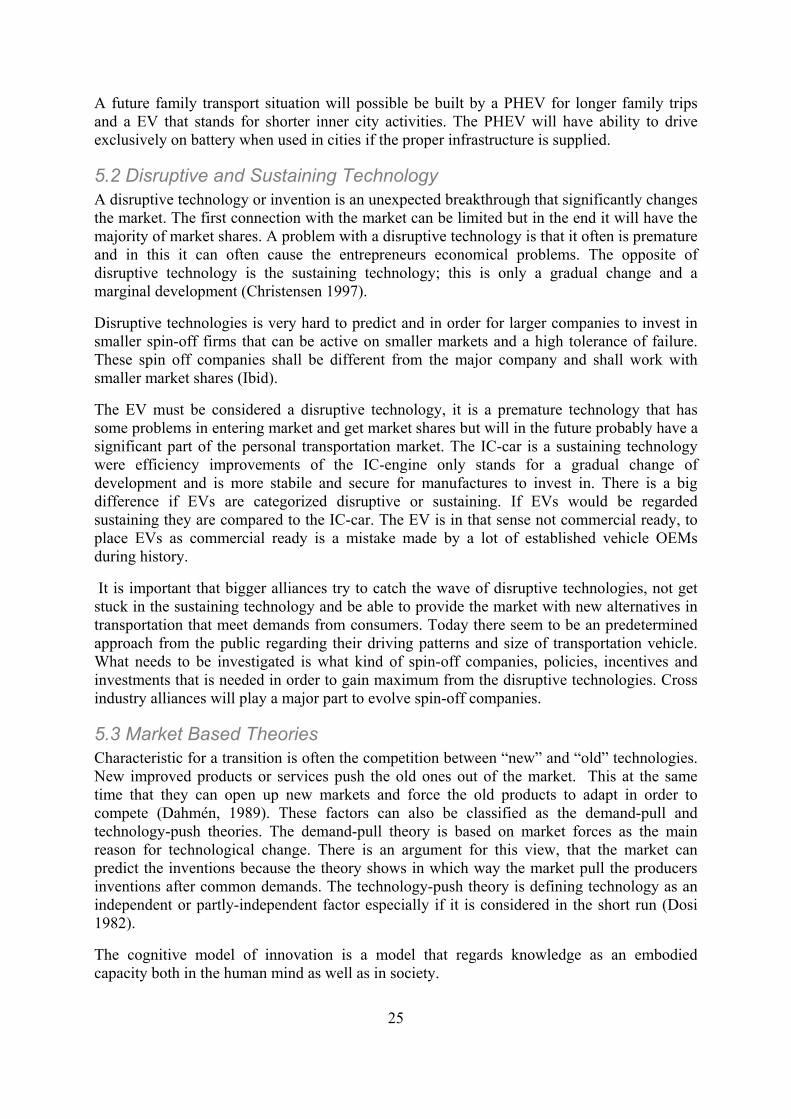
25
A future family transport situation will possible be built by a PHEV for longer family trips and a EV that stands for shorter inner city activities. The PHEV will have ability to drive exclusively on battery when used in cities if the proper infrastructure is supplied.
5.2 Disruptive and Sustaining Technology A disruptive technology or invention is an unexpected breakthrough that significantly changes the market. The first connection with the market can be limited but in the end it will have the majority of market shares. A problem with a disruptive technology is that it often is premature and in this it can often cause the entrepreneurs economical problems. The opposite of disruptive technology is the sustaining technology; this is only a gradual change and a marginal development (Christensen 1997).
Disruptive technologies is very hard to predict and in order for larger companies to invest in smaller spin-off firms that can be active on smaller markets and a high tolerance of failure. These spin off companies shall be different from the major company and shall work with smaller market shares (Ibid).
The EV must be considered a disruptive technology, it is a premature technology that has some problems in entering market and get market shares but will in the future probably have a significant part of the personal transportation market. The IC-car is a sustaining technology were efficiency improvements of the IC-engine only stands for a gradual change of development and is more stabile and secure for manufactures to invest in. There is a big difference if EVs are categorized disruptive or sustaining. If EVs would be regarded sustaining they are compared to the IC-car. The EV is in that sense not commercial ready, to place EVs as commercial ready is a mistake made by a lot of established vehicle OEMs during history.
It is important that bigger alliances try to catch the wave of disruptive technologies, not get stuck in the sustaining technology and be able to provide the market with new alternatives in transportation that meet demands from consumers. Today there seem to be an predetermined approach from the public regarding their driving patterns and size of transportation vehicle. What needs to be investigated is what kind of spin-off companies, policies, incentives and investments that is needed in order to gain maximum from the disruptive technologies. Cross industry alliances will play a major part to evolve spin-off companies.
5.3 Market Based Theories Characteristic for a transition is often the competition between “new” and “old” technologies. New improved products or services push the old ones out of the market. This at the same time that they can open up new markets and force the old products to adapt in order to compete (Dahmén, 1989). These factors can also be classified as the demand-pull and technology-push theories. The demand-pull theory is based on market forces as the main reason for technological change. There is an argument for this view, that the market can predict the inventions because the theory shows in which way the market pull the producers inventions after common demands. The technology-push theory is defining technology as an independent or partly-independent factor especially if it is considered in the short run (Dosi 1982).
The cognitive model of innovation is a model that regards knowledge as an embodied capacity both in the human mind as well as in society.
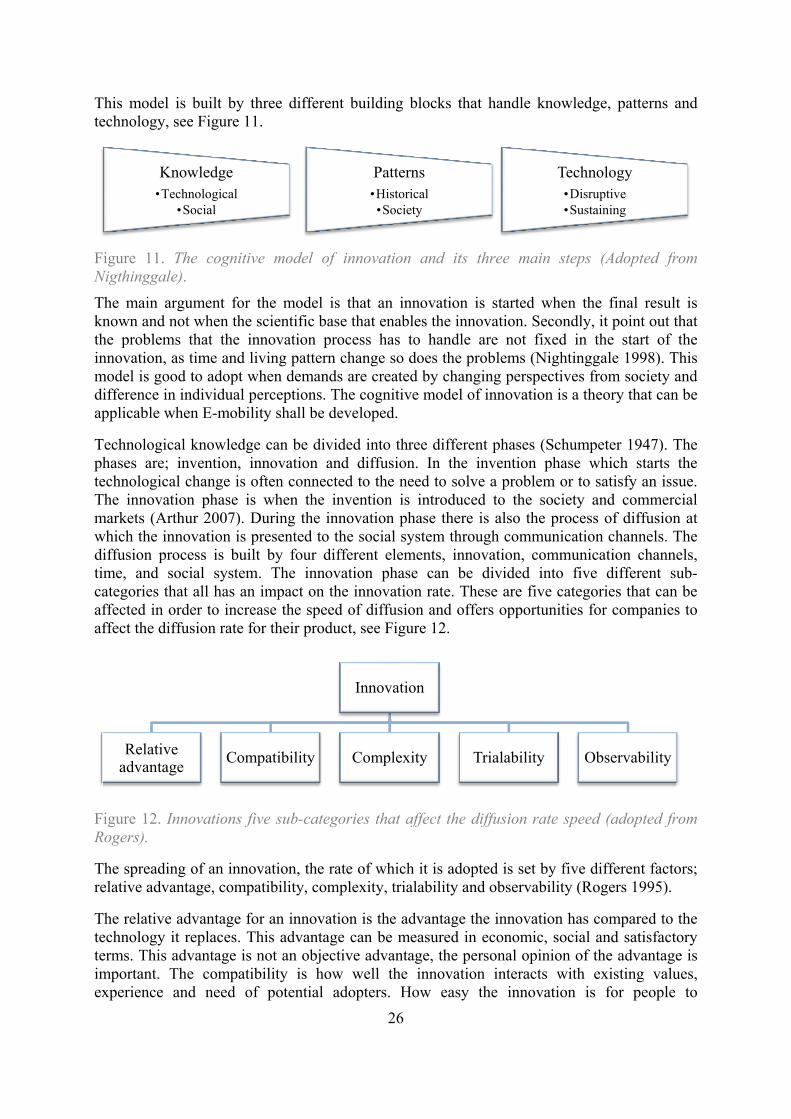
26
This model is built by three different building blocks that handle knowledge, patterns and technology, see Figure 11.
Figure 11. The cognitive model of innovation and its three main steps (Adopted from Nigthinggale).
The main argument for the model is that an innovation is started when the final result is known and not when the scientific base that enables the innovation. Secondly, it point out that the problems that the innovation process has to handle are not fixed in the start of the innovation, as time and living pattern change so does the problems (Nightinggale 1998). This model is good to adopt when demands are created by changing perspectives from society and difference in individual perceptions. The cognitive model of innovation is a theory that can be applicable when E-mobility shall be developed.
Technological knowledge can be divided into three different phases (Schumpeter 1947). The phases are; invention, innovation and diffusion. In the invention phase which starts the technological change is often connected to the need to solve a problem or to satisfy an issue. The innovation phase is when the invention is introduced to the society and commercial markets (Arthur 2007). During the innovation phase there is also the process of diffusion at which the innovation is presented to the social system through communication channels. The diffusion process is built by four different elements, innovation, communication channels, time, and social system. The innovation phase can be divided into five different sub-categories that all has an impact on the innovation rate. These are five categories that can be affected in order to increase the speed of diffusion and offers opportunities for companies to affect the diffusion rate for their product, see Figure 12.
Figure 12. Innovations five sub-categories that affect the diffusion rate speed (adopted from Rogers).
The spreading of an innovation, the rate of which it is adopted is set by five different factors; relative advantage, compatibility, complexity, trialability and observability (Rogers 1995).
The relative advantage for an innovation is the advantage the innovation has compared to the technology it replaces. This advantage can be measured in economic, social and satisfactory terms. This advantage is not an objective advantage, the personal opinion of the advantage is important. The compatibility is how well the innovation interacts with existing values, experience and need of potential adopters. How easy the innovation is for people to
Knowledge•Technological
•Social
Patterns•Historical•Society
Technology•Disruptive•Sustaining
Innovation
Relativeadvantage
Compatibility Complexity Trialability Observability
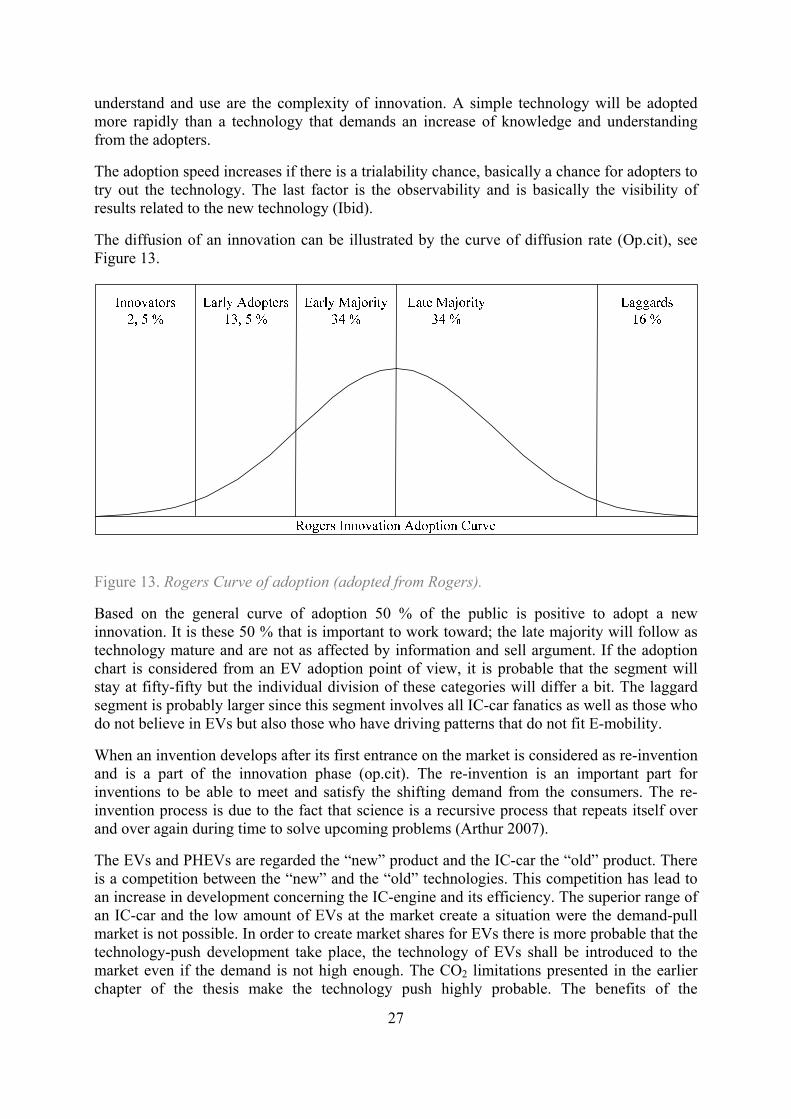
27
understand and use are the complexity of innovation. A simple technology will be adopted more rapidly than a technology that demands an increase of knowledge and understanding from the adopters.
The adoption speed increases if there is a trialability chance, basically a chance for adopters to try out the technology. The last factor is the observability and is basically the visibility of results related to the new technology (Ibid).
The diffusion of an innovation can be illustrated by the curve of diffusion rate (Op.cit), see Figure 13.
Figure 13. Rogers Curve of adoption (adopted from Rogers).
Based on the general curve of adoption 50 % of the public is positive to adopt a new innovation. It is these 50 % that is important to work toward; the late majority will follow as technology mature and are not as affected by information and sell argument. If the adoption chart is considered from an EV adoption point of view, it is probable that the segment will stay at fifty-fifty but the individual division of these categories will differ a bit. The laggard segment is probably larger since this segment involves all IC-car fanatics as well as those who do not believe in EVs but also those who have driving patterns that do not fit E-mobility.
When an invention develops after its first entrance on the market is considered as re-invention and is a part of the innovation phase (op.cit). The re-invention is an important part for inventions to be able to meet and satisfy the shifting demand from the consumers. The re-invention process is due to the fact that science is a recursive process that repeats itself over and over again during time to solve upcoming problems (Arthur 2007).
The EVs and PHEVs are regarded the “new” product and the IC-car the “old” product. There is a competition between the “new” and the “old” technologies. This competition has lead to an increase in development concerning the IC-engine and its efficiency. The superior range of an IC-car and the low amount of EVs at the market create a situation were the demand-pull market is not possible. In order to create market shares for EVs there is more probable that the technology-push development take place, the technology of EVs shall be introduced to the market even if the demand is not high enough. The CO2 limitations presented in the earlier chapter of the thesis make the technology push highly probable. The benefits of the
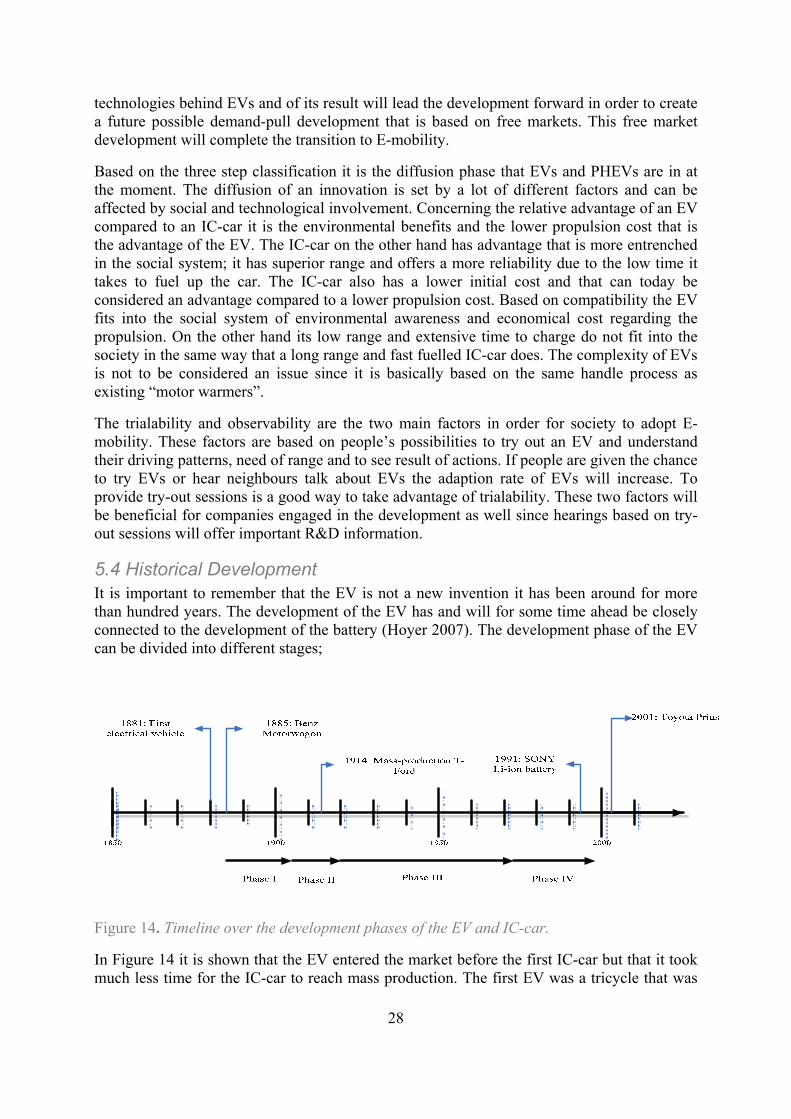
28
technologies behind EVs and of its result will lead the development forward in order to create a future possible demand-pull development that is based on free markets. This free market development will complete the transition to E-mobility.
Based on the three step classification it is the diffusion phase that EVs and PHEVs are in at the moment. The diffusion of an innovation is set by a lot of different factors and can be affected by social and technological involvement. Concerning the relative advantage of an EV compared to an IC-car it is the environmental benefits and the lower propulsion cost that is the advantage of the EV. The IC-car on the other hand has advantage that is more entrenched in the social system; it has superior range and offers a more reliability due to the low time it takes to fuel up the car. The IC-car also has a lower initial cost and that can today be considered an advantage compared to a lower propulsion cost. Based on compatibility the EV fits into the social system of environmental awareness and economical cost regarding the propulsion. On the other hand its low range and extensive time to charge do not fit into the society in the same way that a long range and fast fuelled IC-car does. The complexity of EVs is not to be considered an issue since it is basically based on the same handle process as existing “motor warmers”.
The trialability and observability are the two main factors in order for society to adopt E-mobility. These factors are based on people’s possibilities to try out an EV and understand their driving patterns, need of range and to see result of actions. If people are given the chance to try EVs or hear neighbours talk about EVs the adaption rate of EVs will increase. To provide try-out sessions is a good way to take advantage of trialability. These two factors will be beneficial for companies engaged in the development as well since hearings based on try-out sessions will offer important R&D information.
5.4 Historical Development It is important to remember that the EV is not a new invention it has been around for more than hundred years. The development of the EV has and will for some time ahead be closely connected to the development of the battery (Hoyer 2007). The development phase of the EV can be divided into different stages;
Figure 14. Timeline over the development phases of the EV and IC-car.
In Figure 14 it is shown that the EV entered the market before the first IC-car but that it took much less time for the IC-car to reach mass production. The first EV was a tricycle that was
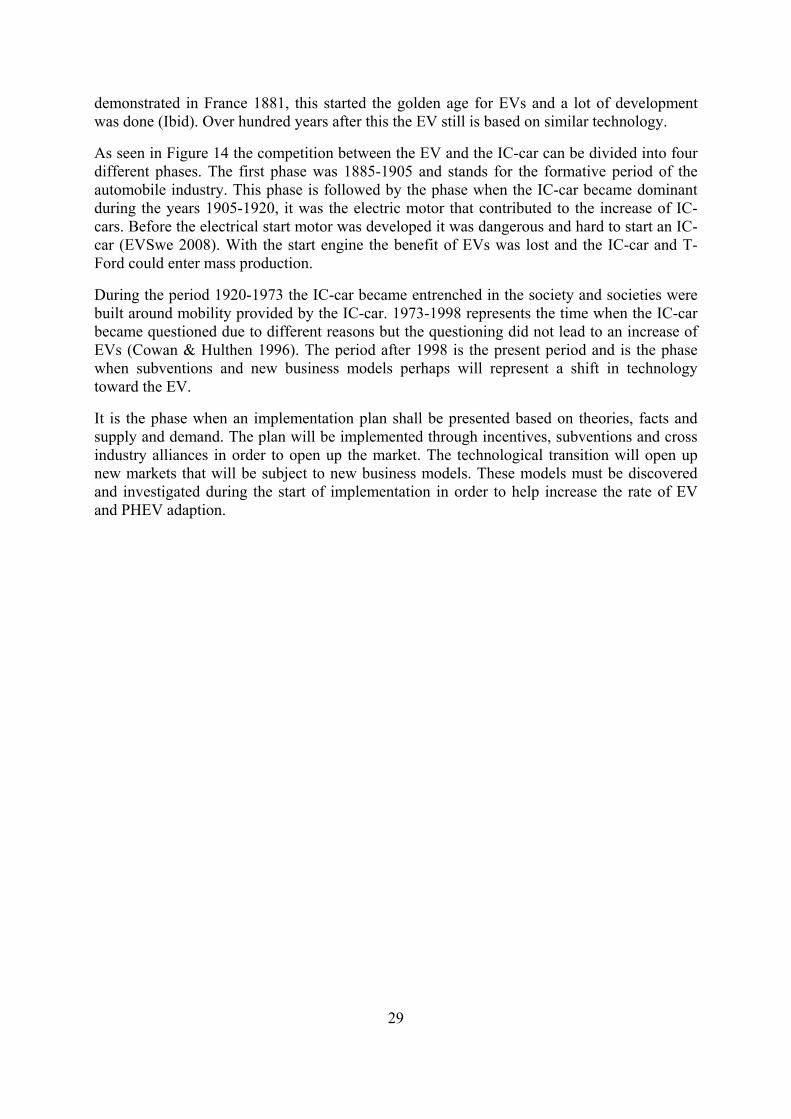
29
demonstrated in France 1881, this started the golden age for EVs and a lot of development was done (Ibid). Over hundred years after this the EV still is based on similar technology.
As seen in Figure 14 the competition between the EV and the IC-car can be divided into four different phases. The first phase was 1885-1905 and stands for the formative period of the automobile industry. This phase is followed by the phase when the IC-car became dominant during the years 1905-1920, it was the electric motor that contributed to the increase of IC-cars. Before the electrical start motor was developed it was dangerous and hard to start an IC-car (EVSwe 2008). With the start engine the benefit of EVs was lost and the IC-car and T-Ford could enter mass production.
During the period 1920-1973 the IC-car became entrenched in the society and societies were built around mobility provided by the IC-car. 1973-1998 represents the time when the IC-car became questioned due to different reasons but the questioning did not lead to an increase of EVs (Cowan & Hulthen 1996). The period after 1998 is the present period and is the phase when subventions and new business models perhaps will represent a shift in technology toward the EV.
It is the phase when an implementation plan shall be presented based on theories, facts and supply and demand. The plan will be implemented through incentives, subventions and cross industry alliances in order to open up the market. The technological transition will open up new markets that will be subject to new business models. These models must be discovered and investigated during the start of implementation in order to help increase the rate of EV and PHEV adaption.

30
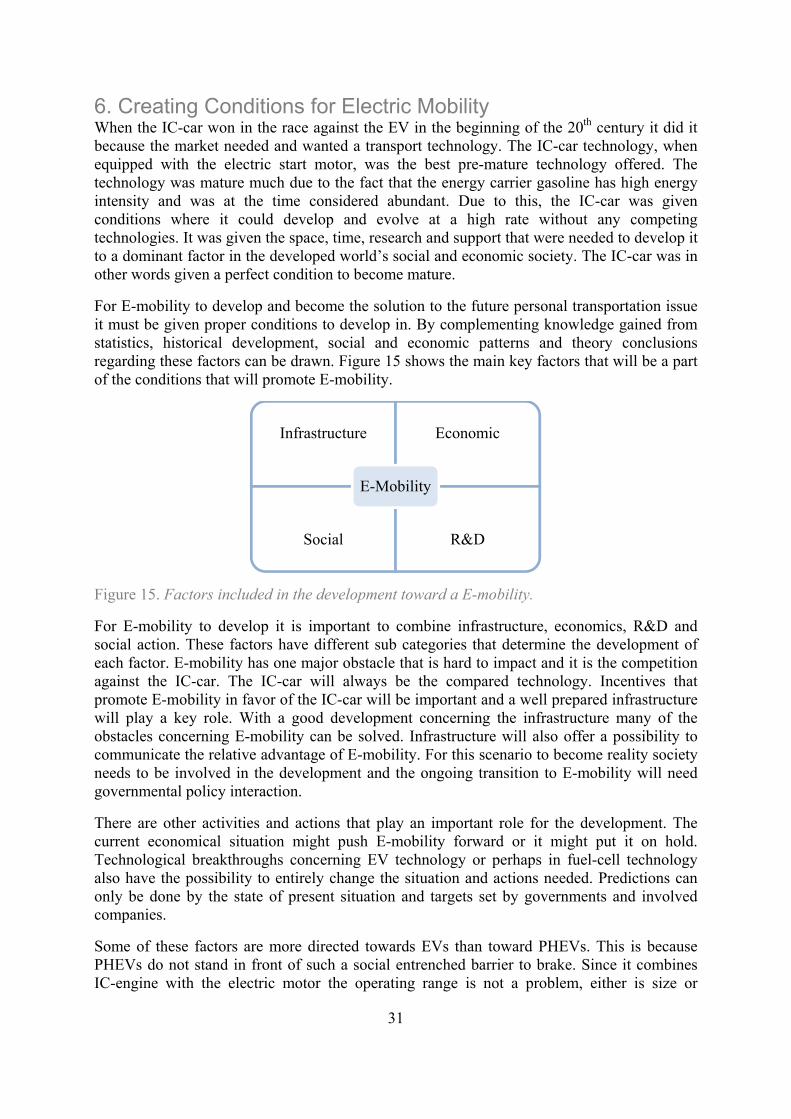
31
6. Creating Conditions for Electric Mobility When the IC-car won in the race against the EV in the beginning of the 20th century it did it because the market needed and wanted a transport technology. The IC-car technology, when equipped with the electric start motor, was the best pre-mature technology offered. The technology was mature much due to the fact that the energy carrier gasoline has high energy intensity and was at the time considered abundant. Due to this, the IC-car was given conditions where it could develop and evolve at a high rate without any competing technologies. It was given the space, time, research and support that were needed to develop it to a dominant factor in the developed world’s social and economic society. The IC-car was in other words given a perfect condition to become mature.
For E-mobility to develop and become the solution to the future personal transportation issue it must be given proper conditions to develop in. By complementing knowledge gained from statistics, historical development, social and economic patterns and theory conclusions regarding these factors can be drawn. Figure 15 shows the main key factors that will be a part of the conditions that will promote E-mobility.
Figure 15. Factors included in the development toward a E-mobility.
For E-mobility to develop it is important to combine infrastructure, economics, R&D and social action. These factors have different sub categories that determine the development of each factor. E-mobility has one major obstacle that is hard to impact and it is the competition against the IC-car. The IC-car will always be the compared technology. Incentives that promote E-mobility in favor of the IC-car will be important and a well prepared infrastructure will play a key role. With a good development concerning the infrastructure many of the obstacles concerning E-mobility can be solved. Infrastructure will also offer a possibility to communicate the relative advantage of E-mobility. For this scenario to become reality society needs to be involved in the development and the ongoing transition to E-mobility will need governmental policy interaction.
There are other activities and actions that play an important role for the development. The current economical situation might push E-mobility forward or it might put it on hold. Technological breakthroughs concerning EV technology or perhaps in fuel-cell technology also have the possibility to entirely change the situation and actions needed. Predictions can only be done by the state of present situation and targets set by governments and involved companies.
Some of these factors are more directed towards EVs than toward PHEVs. This is because PHEVs do not stand in front of such a social entrenched barrier to brake. Since it combines IC-engine with the electric motor the operating range is not a problem, either is size or
Infrastructure Economic
Social R&D
E-Mobility
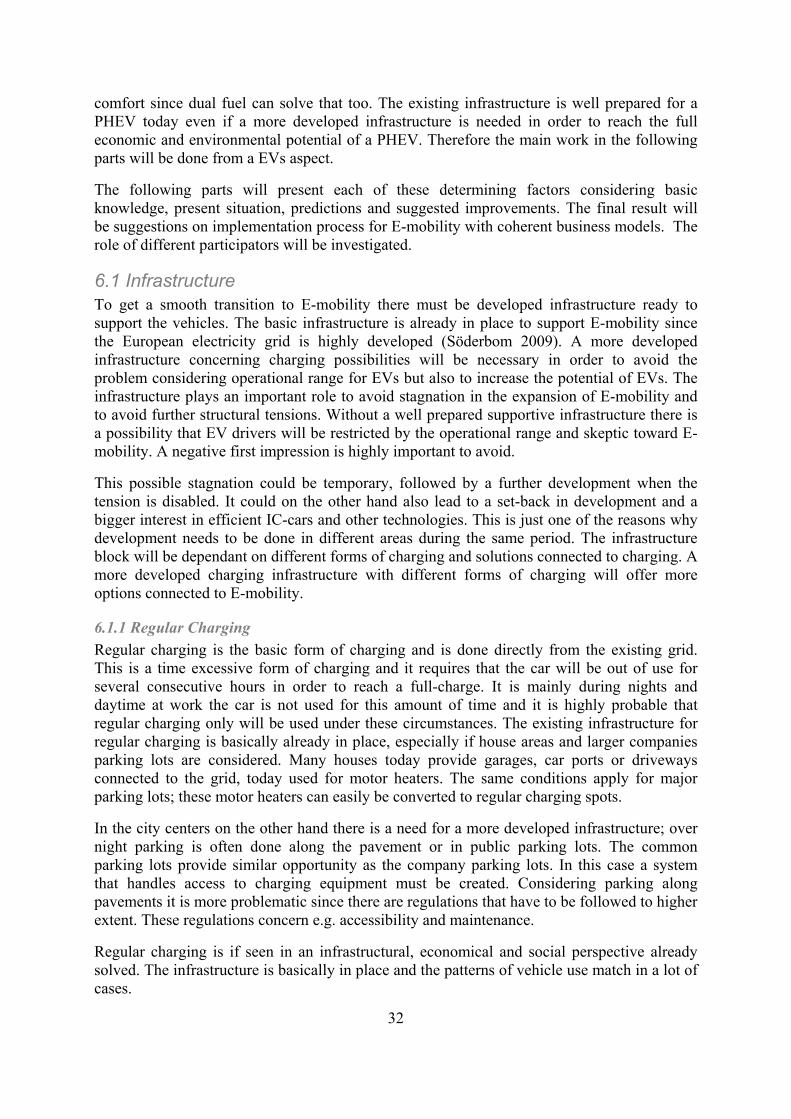
32
comfort since dual fuel can solve that too. The existing infrastructure is well prepared for a PHEV today even if a more developed infrastructure is needed in order to reach the full economic and environmental potential of a PHEV. Therefore the main work in the following parts will be done from a EVs aspect.
The following parts will present each of these determining factors considering basic knowledge, present situation, predictions and suggested improvements. The final result will be suggestions on implementation process for E-mobility with coherent business models. The role of different participators will be investigated.
6.1 Infrastructure To get a smooth transition to E-mobility there must be developed infrastructure ready to support the vehicles. The basic infrastructure is already in place to support E-mobility since the European electricity grid is highly developed (Söderbom 2009). A more developed infrastructure concerning charging possibilities will be necessary in order to avoid the problem considering operational range for EVs but also to increase the potential of EVs. The infrastructure plays an important role to avoid stagnation in the expansion of E-mobility and to avoid further structural tensions. Without a well prepared supportive infrastructure there is a possibility that EV drivers will be restricted by the operational range and skeptic toward E-mobility. A negative first impression is highly important to avoid.
This possible stagnation could be temporary, followed by a further development when the tension is disabled. It could on the other hand also lead to a set-back in development and a bigger interest in efficient IC-cars and other technologies. This is just one of the reasons why development needs to be done in different areas during the same period. The infrastructure block will be dependant on different forms of charging and solutions connected to charging. A more developed charging infrastructure with different forms of charging will offer more options connected to E-mobility.
6.1.1 Regular Charging
Regular charging is the basic form of charging and is done directly from the existing grid. This is a time excessive form of charging and it requires that the car will be out of use for several consecutive hours in order to reach a full-charge. It is mainly during nights and daytime at work the car is not used for this amount of time and it is highly probable that regular charging only will be used under these circumstances. The existing infrastructure for regular charging is basically already in place, especially if house areas and larger companies parking lots are considered. Many houses today provide garages, car ports or driveways connected to the grid, today used for motor heaters. The same conditions apply for major parking lots; these motor heaters can easily be converted to regular charging spots.
In the city centers on the other hand there is a need for a more developed infrastructure; over night parking is often done along the pavement or in public parking lots. The common parking lots provide similar opportunity as the company parking lots. In this case a system that handles access to charging equipment must be created. Considering parking along pavements it is more problematic since there are regulations that have to be followed to higher extent. These regulations concern e.g. accessibility and maintenance.
Regular charging is if seen in an infrastructural, economical and social perspective already solved. The infrastructure is basically in place and the patterns of vehicle use match in a lot of cases.
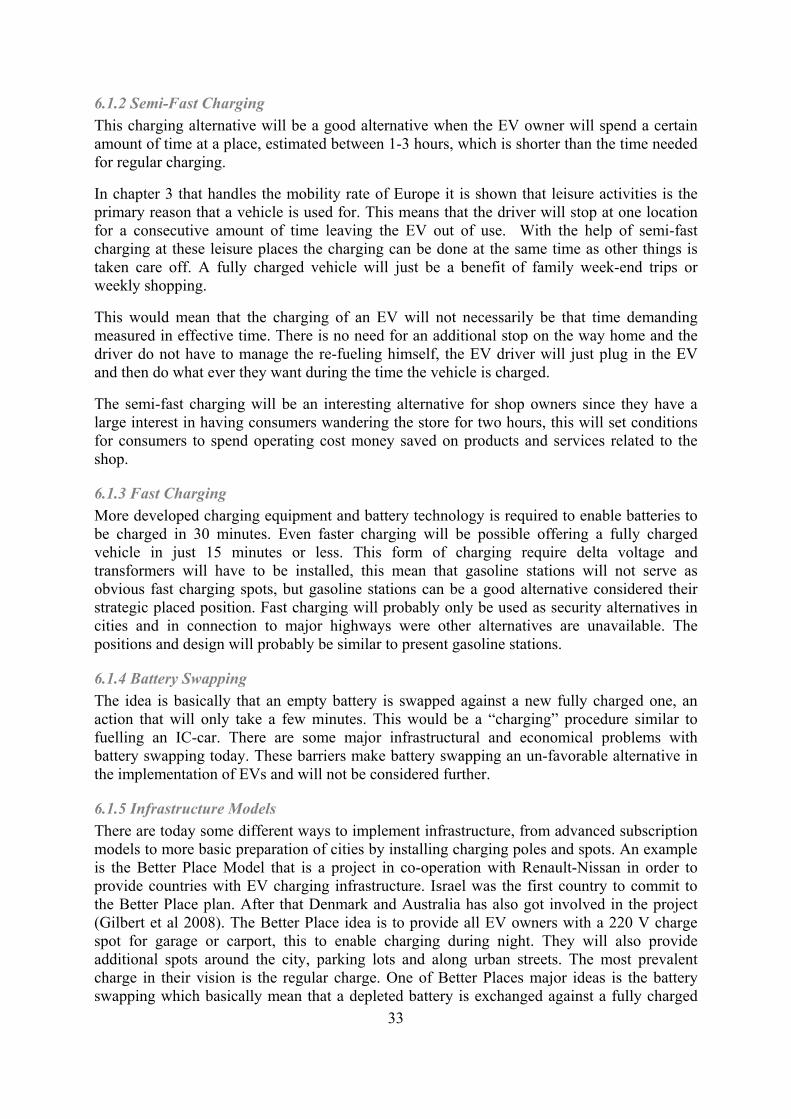
33
6.1.2 Semi-Fast Charging
This charging alternative will be a good alternative when the EV owner will spend a certain amount of time at a place, estimated between 1-3 hours, which is shorter than the time needed for regular charging.
In chapter 3 that handles the mobility rate of Europe it is shown that leisure activities is the primary reason that a vehicle is used for. This means that the driver will stop at one location for a consecutive amount of time leaving the EV out of use. With the help of semi-fast charging at these leisure places the charging can be done at the same time as other things is taken care off. A fully charged vehicle will just be a benefit of family week-end trips or weekly shopping.
This would mean that the charging of an EV will not necessarily be that time demanding measured in effective time. There is no need for an additional stop on the way home and the driver do not have to manage the re-fueling himself, the EV driver will just plug in the EV and then do what ever they want during the time the vehicle is charged.
The semi-fast charging will be an interesting alternative for shop owners since they have a large interest in having consumers wandering the store for two hours, this will set conditions for consumers to spend operating cost money saved on products and services related to the shop.
6.1.3 Fast Charging
More developed charging equipment and battery technology is required to enable batteries to be charged in 30 minutes. Even faster charging will be possible offering a fully charged vehicle in just 15 minutes or less. This form of charging require delta voltage and transformers will have to be installed, this mean that gasoline stations will not serve as obvious fast charging spots, but gasoline stations can be a good alternative considered their strategic placed position. Fast charging will probably only be used as security alternatives in cities and in connection to major highways were other alternatives are unavailable. The positions and design will probably be similar to present gasoline stations.
6.1.4 Battery Swapping
The idea is basically that an empty battery is swapped against a new fully charged one, an action that will only take a few minutes. This would be a “charging” procedure similar to fuelling an IC-car. There are some major infrastructural and economical problems with battery swapping today. These barriers make battery swapping an un-favorable alternative in the implementation of EVs and will not be considered further.
6.1.5 Infrastructure Models
There are today some different ways to implement infrastructure, from advanced subscription models to more basic preparation of cities by installing charging poles and spots. An example is the Better Place Model that is a project in co-operation with Renault-Nissan in order to provide countries with EV charging infrastructure. Israel was the first country to commit to the Better Place plan. After that Denmark and Australia has also got involved in the project (Gilbert et al 2008). The Better Place idea is to provide all EV owners with a 220 V charge spot for garage or carport, this to enable charging during night. They will also provide additional spots around the city, parking lots and along urban streets. The most prevalent charge in their vision is the regular charge. One of Better Places major ideas is the battery swapping which basically mean that a depleted battery is exchanged against a fully charged
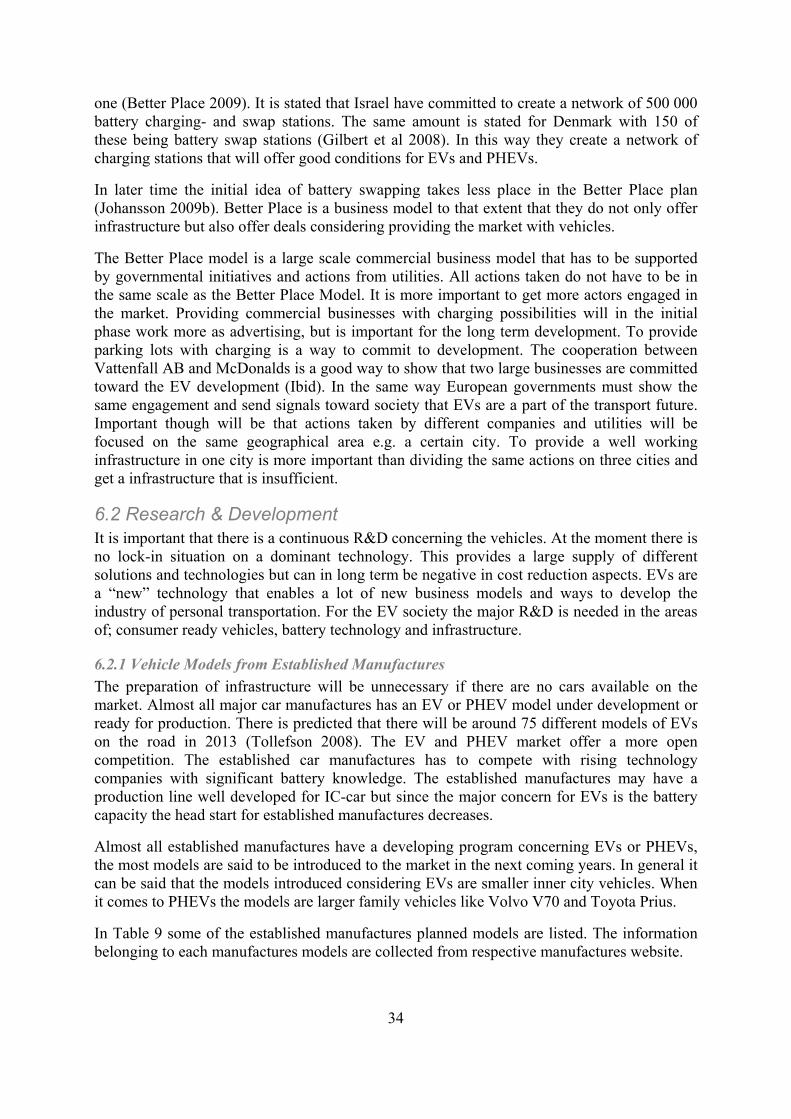
34
one (Better Place 2009). It is stated that Israel have committed to create a network of 500 000 battery charging- and swap stations. The same amount is stated for Denmark with 150 of these being battery swap stations (Gilbert et al 2008). In this way they create a network of charging stations that will offer good conditions for EVs and PHEVs.
In later time the initial idea of battery swapping takes less place in the Better Place plan (Johansson 2009b). Better Place is a business model to that extent that they do not only offer infrastructure but also offer deals considering providing the market with vehicles.
The Better Place model is a large scale commercial business model that has to be supported by governmental initiatives and actions from utilities. All actions taken do not have to be in the same scale as the Better Place Model. It is more important to get more actors engaged in the market. Providing commercial businesses with charging possibilities will in the initial phase work more as advertising, but is important for the long term development. To provide parking lots with charging is a way to commit to development. The cooperation between Vattenfall AB and McDonalds is a good way to show that two large businesses are committed toward the EV development (Ibid). In the same way European governments must show the same engagement and send signals toward society that EVs are a part of the transport future. Important though will be that actions taken by different companies and utilities will be focused on the same geographical area e.g. a certain city. To provide a well working infrastructure in one city is more important than dividing the same actions on three cities and get a infrastructure that is insufficient.
6.2 Research & Development It is important that there is a continuous R&D concerning the vehicles. At the moment there is no lock-in situation on a dominant technology. This provides a large supply of different solutions and technologies but can in long term be negative in cost reduction aspects. EVs are a “new” technology that enables a lot of new business models and ways to develop the industry of personal transportation. For the EV society the major R&D is needed in the areas of; consumer ready vehicles, battery technology and infrastructure.
6.2.1 Vehicle Models from Established Manufactures
The preparation of infrastructure will be unnecessary if there are no cars available on the market. Almost all major car manufactures has an EV or PHEV model under development or ready for production. There is predicted that there will be around 75 different models of EVs on the road in 2013 (Tollefson 2008). The EV and PHEV market offer a more open competition. The established car manufactures has to compete with rising technology companies with significant battery knowledge. The established manufactures may have a production line well developed for IC-car but since the major concern for EVs is the battery capacity the head start for established manufactures decreases.
Almost all established manufactures have a developing program concerning EVs or PHEVs, the most models are said to be introduced to the market in the next coming years. In general it can be said that the models introduced considering EVs are smaller inner city vehicles. When it comes to PHEVs the models are larger family vehicles like Volvo V70 and Toyota Prius.
In Table 9 some of the established manufactures planned models are listed. The information belonging to each manufactures models are collected from respective manufactures website.
35
Manufacture EV PHEV Notifications
Renault-Nissan Z.E.-line, - Available 2011-2012, range 100-160
Volvo/Vattenfall - V70 Available 2012, range 50 km
BMW/Vattenfall MINI-E - Test run in Berlin, range 250 km
Toyota FT EV-II Prius Secured range 19 km (Prius)- 80 km
Wolkswagen E-UP! - Range 130 km
Daimler E-Cell E-Cell Plus Range 100-200
General Motors Chevy Volt Available 2009-2010 , range 60 km
Mitsubishi iMiEV 2 Models Available 2009-2010, range 160 km
Suzuki SWIFT Test session, range 20 km
Peugeot iON Available 2010, range 130 km
Table 9. Some of the models planned to be introduced to the market in the coming years.
Most manufactures state an operational range on battery for their vehicles. For EVs that range is between 80 km to 250 km, the average range is around 150 km. For PHEVs the range is between 19 km to 60 km. Toyota has chosen to state the secure range which is the guaranteed range on a battery charge, this range is 19 km.
The majority of manufactures presents the charging time for regular charging from a wall socket. This means that the vehicles can be regular charged from the existing infrastructure.
With the operational ranges presented by manufactures in mind it is important to remember that the operational range of an EV is highly dependant on operational cycle. Therefore it would be good if manufactures could agree upon an international operational cycle standard. This would make it easier for consumers to value different models. Another way to create reliable feeling toward a EVs operational range is the secure range offered by Toyota. The problem the secure range is that it is not long enough. The operational range guarantee would be based on different driving cycles. These cycles will differ based on country, city and individual driving patterns. American cycles differ from European and a average cycle for specific markets would probably be set.
6.2.2 Rising Competitors
The perhaps most important development regarding vehicles is the one taking place among the rising competitors. The amount of new competitors committed to the EV market is large, in China there was in 2007 over 300 companies committed to EVs and at least 40 of them are active in production (Gilbert et al 2008).
The rising competitors in the European and American markets offer some of interesting niche models, Fisker Kharma launches a luxury PHEV and Tesla Roadster a sport EV that is developed by Tesla Motor. Both these models show that EVs and PHEVs can be as fast and luxury as the IC-cars. From the Asian market there is another kind of models developed. Interesting models are the low price models that shall replace Tata Motors models Indica and
36
Nano. These two models are also under development to become EVs. Tara Tiny is one of the models presented as a competitor to Indica and Nano, Tara Tiny is an EV model that will have retail price around US $ 2 500 and offer a operating range of 100 km (Jacqout 2008). This model is, compared to Kharma and Roadster, far from luxury but perhaps a more needed alternative that will play a more significant part in the EV society.
Along with this massive EV development China has also embarked upon developing a massive infrastructure and is well on their way to become the world leader concerning EV technology (Gilbert et al 2008). The large market in Asia will probably press the price of EV production and in a few years supply markets in west with less expensive EVs.
There are one big difference between the West market and the Asian market concerning the development of EVs. The Asian market is developing in order to meet a demand for transport alternative while the markets in West develop EVs and PHEVs that shall meet demands for comfort and entrenched habits. Compared to historical development the Asian approach will play a more important role in the development and probably end up with higher shares of the EV market. The established manufactures try to apply the benefits of IC-car models with some new added values and the rising competitors show vehicles in a niche market. The rising competitors on the Asian market on the other hand seem to work more for better batteries and lower price.
The aim should be for utilities and companies that actively engage in the transition to focus on EVs. The focus should also be to provide the market with small functional models at a lower cost, more similar to the Asian development. To use PHEVs as precursor is not suggested, PHEVs shall rather be a complement to EVs in E-mobility. The PHEV is on the other hand the natural transition vehicle and offer the size comfort and operating range for longer travels. The PHEV has significant benefits in the “dual fuel” operating technology and this will not bring a new perception on travelling. There might be an unnecessary stagnation in the development if PHEVs are used as a precursor vehicle for the EV. The best development should of course be the simultaneous development but the infrastructure should be developed to fit EV patterns.
6.2.3 Battery Developers
Almost every EV manufacture has a partnership with a battery developer in order to provide the vehicles with state of the art batteries. In China there are more than 300 companies involved in advanced battery development (Ibid). The R&D on the battery side is primary considering higher energy- and power density, price reduction and usage of different materials.
There are some interesting R&D also considering the usage of batteries and maintenance. In Uppsala a small technique company called Electroengine work on the possibilities to change individual cells in a battery and make the battery work as one unit. Communication between the cells will enable the battery to work as one unit. This would mean that the batteries will no longer be controlled by the weaker cell and will not be as sensitive to temperatures. The difference in cell capacity is not only affecting depleting but also charging of the battery (Söderlind 2009). A technology like this would open up the second hand market and make the risks of leasing batteries smaller; the leasing company can take batteries back and repair it instead of providing an entirely new one.
Better battery capacity and the possibilities to repair batteries will open up the EV and PHEV market in ways that are difficult to predict. Smaller progress in important areas of battery
37
development will affect the entire market and a large progress will probably work as a disruptive technology all over again. To expect a breakthrough in battery capacity will not be good corner stone in order to create better conditions for E-mobility. The current operating range of batteries with some progress due to new ideas and higher scale of production will be the base for further work. The development of batteries is connected to new forms of charging as well. The R&D in the charging area is mainly considering faster charging alternatives but also the design and characteristics of charging poles. It is an ongoing R&D concerning all charging alternatives but they can be considered to be in the development phase rather than in the research phase.
A charging type that could have a significant impact on the transition to operate larger vehicles on electricity is the inductive charging. Inductive charging is based on wireless transmission with the help of an electromagnetic field. This means wireless charging for EVs and will also enable charging during operating, when stopped at special charging lanes. Nissan is developing this system in order to use it for their future vehicles (Vaughan & van der Zee 2009). On the Asian market the Korea Advanced Institute of Technology, KAIST, has a demo vehicle called On Line Electric Vehicle, OLEV. This vehicle use inductive charging and gets electricity from cables in the road-bed. KAIST claims that OLEV has reached an efficiency of 80 % when the distance between engine and road cable is 1 centimeter. When the distance increase there is a loss in efficiency and it drops to 60 % (Vandervelde 2009). This is a system that does not use batteries in the vehicle at all. Development of this technology would enable heavier vehicles e.g. inner city busses to be operated by electricity. Inner city bus schedules operate in specific patterns which make it possible to equip depot and congested routes with inductive charging. At the moment this technology is expensive and quiet low in efficiency. Another drawback is that it needs developing of both the battery and the infrastructure side.
Besides the inductive charging the regular charging will be developed in a way that could offer ultra-fast charging in the future, charging time will be down to a few minutes. To use this charging higher current and voltage must be used and this will increase security demand on the equipment. It will also be important that the battery will be able to receive the charge without being damaged.
6.2.4 Payment Equipment
In the introduction phase of the EVs the electricity used to charge in public places and company parking lots will probably be paid for by the provider of the parking with charging possibilities or included in the parking fee. Home charging will be part of the ordinary electricity bill. In all these scenarios the energy utility will charge for the electricity and there is a need for a measuring unit connected to the charger. It is also possible that the commercial businesses that provide free charging want to connect the charging to their business, or if several businesses share a parking lot, to divide the bill in a proper way. Lock mechanism can be of importance if there is a need for the chargers to only be used by the consumer it is offered to, e.g. parking lot charging and charging at home.
The retail market today provides some alternatives. Technology and experience can be drawn from other areas that need to provide electricity outlets e.g. small boat marinas. GARO provides two charging poles, one controlled by mobile phone and the other connected to existing parking meters. Tally Key has provided McDonalds with their charging pole in Stockholm and has experience from providing marinas and camping areas with electricity. Their poles are designed to handle rough weather and the software is programmed to handle
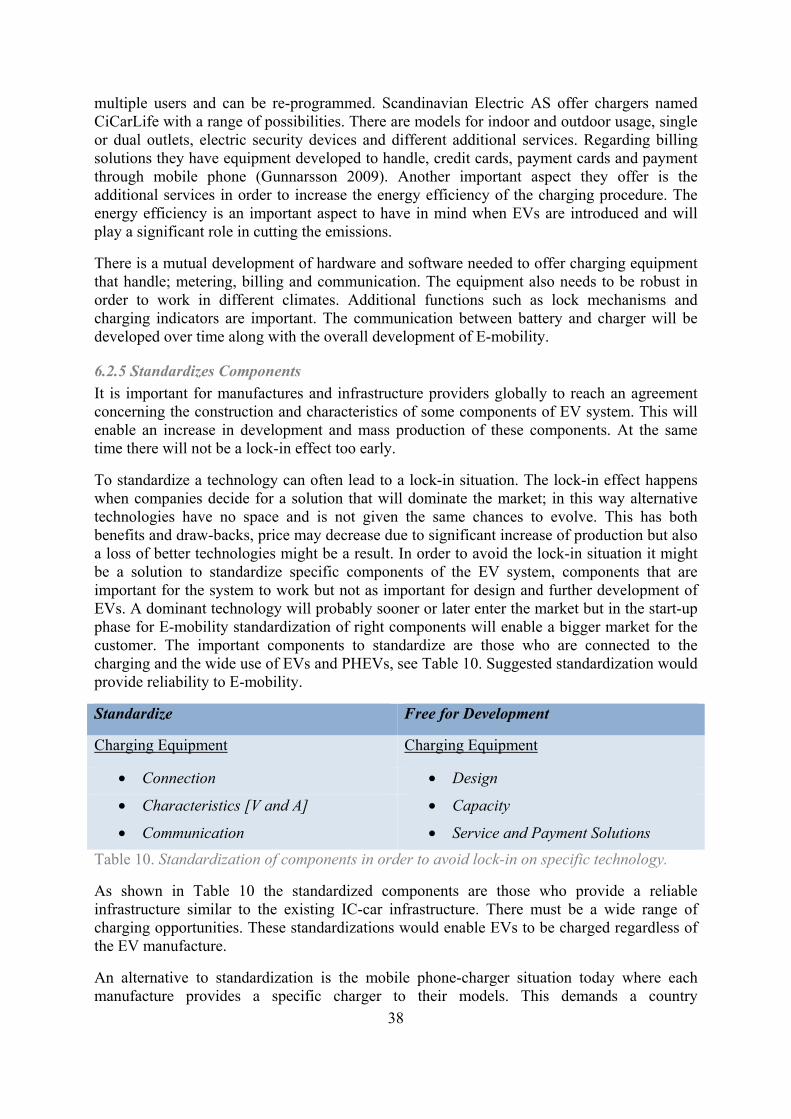
38
multiple users and can be re-programmed. Scandinavian Electric AS offer chargers named CiCarLife with a range of possibilities. There are models for indoor and outdoor usage, single or dual outlets, electric security devices and different additional services. Regarding billing solutions they have equipment developed to handle, credit cards, payment cards and payment through mobile phone (Gunnarsson 2009). Another important aspect they offer is the additional services in order to increase the energy efficiency of the charging procedure. The energy efficiency is an important aspect to have in mind when EVs are introduced and will play a significant role in cutting the emissions.
There is a mutual development of hardware and software needed to offer charging equipment that handle; metering, billing and communication. The equipment also needs to be robust in order to work in different climates. Additional functions such as lock mechanisms and charging indicators are important. The communication between battery and charger will be developed over time along with the overall development of E-mobility.
6.2.5 Standardizes Components
It is important for manufactures and infrastructure providers globally to reach an agreement concerning the construction and characteristics of some components of EV system. This will enable an increase in development and mass production of these components. At the same time there will not be a lock-in effect too early.
To standardize a technology can often lead to a lock-in situation. The lock-in effect happens when companies decide for a solution that will dominate the market; in this way alternative technologies have no space and is not given the same chances to evolve. This has both benefits and draw-backs, price may decrease due to significant increase of production but also a loss of better technologies might be a result. In order to avoid the lock-in situation it might be a solution to standardize specific components of the EV system, components that are important for the system to work but not as important for design and further development of EVs. A dominant technology will probably sooner or later enter the market but in the start-up phase for E-mobility standardization of right components will enable a bigger market for the customer. The important components to standardize are those who are connected to the charging and the wide use of EVs and PHEVs, see Table 10. Suggested standardization would provide reliability to E-mobility.
Standardize Free for Development
Charging Equipment Charging Equipment
• Connection • Design
• Characteristics [V and A] • Capacity
• Communication • Service and Payment Solutions
Table 10. Standardization of components in order to avoid lock-in on specific technology.
As shown in Table 10 the standardized components are those who provide a reliable infrastructure similar to the existing IC-car infrastructure. There must be a wide range of charging opportunities. These standardizations would enable EVs to be charged regardless of the EV manufacture.
An alternative to standardization is the mobile phone-charger situation today where each manufacture provides a specific charger to their models. This demands a country
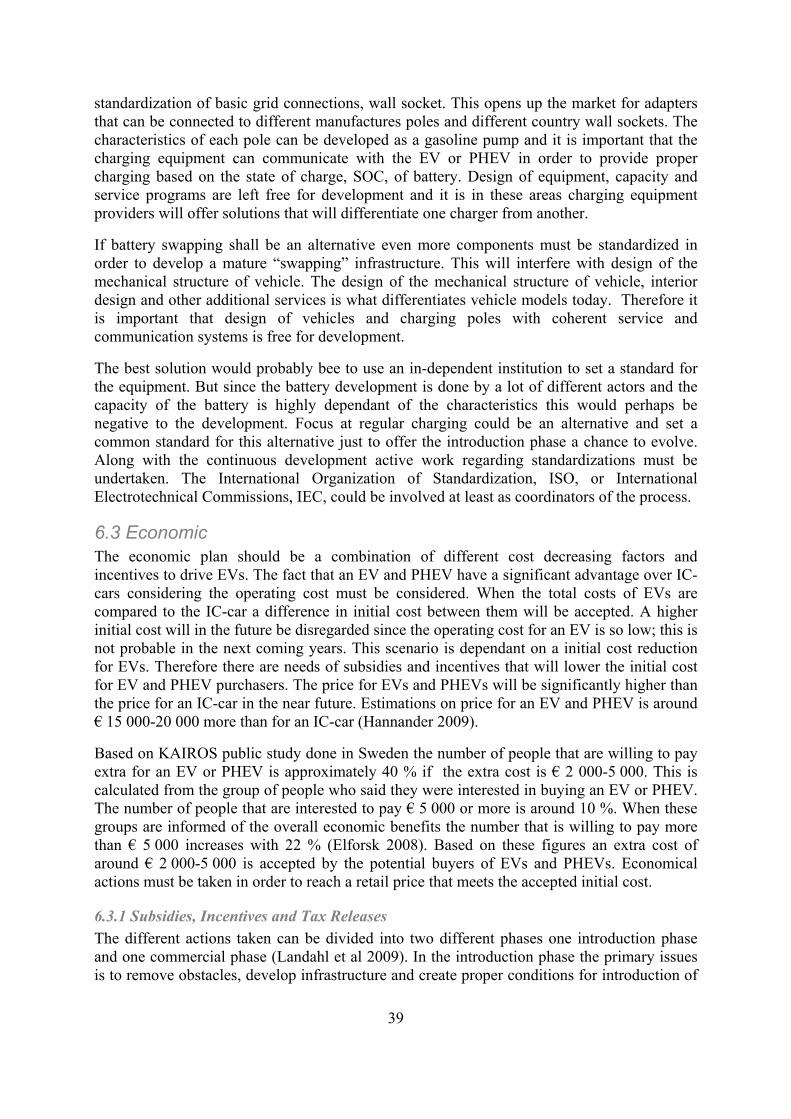
39
standardization of basic grid connections, wall socket. This opens up the market for adapters that can be connected to different manufactures poles and different country wall sockets. The characteristics of each pole can be developed as a gasoline pump and it is important that the charging equipment can communicate with the EV or PHEV in order to provide proper charging based on the state of charge, SOC, of battery. Design of equipment, capacity and service programs are left free for development and it is in these areas charging equipment providers will offer solutions that will differentiate one charger from another.
If battery swapping shall be an alternative even more components must be standardized in order to develop a mature “swapping” infrastructure. This will interfere with design of the mechanical structure of vehicle. The design of the mechanical structure of vehicle, interior design and other additional services is what differentiates vehicle models today. Therefore it is important that design of vehicles and charging poles with coherent service and communication systems is free for development.
The best solution would probably bee to use an in-dependent institution to set a standard for the equipment. But since the battery development is done by a lot of different actors and the capacity of the battery is highly dependant of the characteristics this would perhaps be negative to the development. Focus at regular charging could be an alternative and set a common standard for this alternative just to offer the introduction phase a chance to evolve. Along with the continuous development active work regarding standardizations must be undertaken. The International Organization of Standardization, ISO, or International Electrotechnical Commissions, IEC, could be involved at least as coordinators of the process.
6.3 Economic The economic plan should be a combination of different cost decreasing factors and incentives to drive EVs. The fact that an EV and PHEV have a significant advantage over IC-cars considering the operating cost must be considered. When the total costs of EVs are compared to the IC-car a difference in initial cost between them will be accepted. A higher initial cost will in the future be disregarded since the operating cost for an EV is so low; this is not probable in the next coming years. This scenario is dependant on a initial cost reduction for EVs. Therefore there are needs of subsidies and incentives that will lower the initial cost for EV and PHEV purchasers. The price for EVs and PHEVs will be significantly higher than the price for an IC-car in the near future. Estimations on price for an EV and PHEV is around € 15 000-20 000 more than for an IC-car (Hannander 2009).
Based on KAIROS public study done in Sweden the number of people that are willing to pay extra for an EV or PHEV is approximately 40 % if the extra cost is € 2 000-5 000. This is calculated from the group of people who said they were interested in buying an EV or PHEV. The number of people that are interested to pay € 5 000 or more is around 10 %. When these groups are informed of the overall economic benefits the number that is willing to pay more than € 5 000 increases with 22 % (Elforsk 2008). Based on these figures an extra cost of around € 2 000-5 000 is accepted by the potential buyers of EVs and PHEVs. Economical actions must be taken in order to reach a retail price that meets the accepted initial cost.
6.3.1 Subsidies, Incentives and Tax Releases
The different actions taken can be divided into two different phases one introduction phase and one commercial phase (Landahl et al 2009). In the introduction phase the primary issues is to remove obstacles, develop infrastructure and create proper conditions for introduction of
40
EVs. The commercial phase is about increasing the supply of EVs, information, try-out sessions, supportive development and economical incentives.
The different economical actions can generally be divided into two categories; economic actions toward vehicle OEMs and actions taken toward companies and public. Actions taken toward OEMs will mainly be to create incentives for them to provide the market with vehicles. Governments have an interest in expansion of national OEMs and different economic support plans must be created. These actions from governments will send signals to vehicle OEMs that the EV market is worth investing in. The actions toward companies and public can be divided into economic gain and cost reduction incentives.
The government could as an example offer a subsidy of 25 % for the first 10 000 sold EVs. This would cut the initial price of EVs and start a demand of vehicles (Johansson 2009a). An alternative to this is a subsidy based on a period of years where the subsidy cost decreases at the same time as understanding of other benefits increase and production costs decrease. Subsidies on EVs will play an important role in both introduction and commercial phase. The total cost of ownership, TCO, for an EV should be supported by subsidies in order to make the EV competitive with an IC-car. But as the EV becomes more economic competitive it is important that the subsidies decrease.
Figure 16. Subsidies related to general EV related costs.
In Figure 16 the general idea of how subsidies shall work during the introduction of EVs. That subsidies work in a proper way is important due to the fact that it is tax money that will be used for the economic support.
Offer percentage cut on the taxable value of fringe benefits for a couple of years, would increase the amount of company cars (Johansson 2009a). The tax value fringe is an economic reduction incentive and will serve the purpose off purchasing companies to invest in EVs to their vehicle fleet. To offer environmental friendly cars not to pay congestion charging and offer free parking is two incentives that can be used in order to increase incentives to drive an
41
EV. Free charging and assumptions from congestion tax is economic gain incentives and will provide the EV driver with a good feeling each time it is used.
To put extra taxes on CO2 emitting vehicles is another way to support EVs. Israel has a taxation system based on a “green index” that sets the extra tax when a vehicle is purchased. A extra tax of 10 % for the most environmental friendly vehicle and a tax of 60 % for the worst (Andersen et al 2009). This will proceed until 2014.
Along with the need for actions taken today it is important to use studies and evaluate the actions taken earlier concerning similar initiatives. The evaluating report of the “Promoting Clean Cars” project in Stockholm in the framework of BioEthanol for Sustainable Transport, BEST, evaluates the effect of economic incentives and subsidies in order to promote environmentally friendly vehicles. The evaluation concluded that incentives that reduce operating cost are of more importance than incentives that reduce initial cost (Sunnerstedt 2009). Economic incentives were rated as follow (Landahl et al 2009). Reduction of tax value for company cars and low price on alternative fuel was rated highest. Followed by exemption from congestion tax and price subsidies and free parking.
This evaluation is regarding alternative fuel vehicles including EVs. It is important to remember that the extra purchase cost for an alternative fuel vehicle is significantly lower than for an EV. That lower operating cost is of significant importance for consumer is positive for the E-mobility development. The incentive to reduce the personal environmental impact was also rated high.
A combined system of incentives and subsidies will create an economic situation that is beneficial enough for private persons. Economic help in form of subsidies and incentives will increase the implementation phase mainly from the product side; the supply side. It will represent incentives to provide additional infrastructure. It will also provide incentives for manufactures to provide the market with EVs. The main cost reduction will come through mass production and governmental economic actions.
As an example Electricite de France, EDF, works actively in France to transit the vehicle fleet toward a electrified vehicle fleet (ER 2009). The French government presented in 2008 a financial plan that set aside € 2, 5 billion for development of EVs and technology over a ten year period (Abuelsamid 2009). This funding will enable R&D, new factories at the same time that it will keep development in France which will provide job alternatives. Besides this funding the French government also has promised to buy around 50 000 EVs to governmental companies and communities (Johansson 2009). This is a clear indication that they believe in an EV society and this works as an incentive for manufactures to provide vehicles. When the government indicates signals like this it also provide reasons to invest in the EV market. The French government has also stated that they want at least 100 000 EVs on the road in 2015 in order to reach 2 million EVs in 2020. To provide the necessary infrastructure they have mandate that one million recharging spots shall be in place in 2015. This will increase to 4 million spots in 2020 and a way to reach that is that new apartment complex must after 2012 have charging spots in their parking lots (EV 2009).
6.3.2 Business Actions
A way for major car manufactures, utilities and entrepreneur firms to increase the implementation rates and get a front seat in the development of E-mobility is to offer deals to consumers. This can be similar to the mobile phone subscriber deal, to offer a quantity discount or simply cut the initial price.
42
The battery is the component that increases the cost of EVs significant, a good way to decrease this cost is to offer battery leasing to customers. As an additional service to car leasing which is another possibility. The Better Place basic concept for business model is to separate battery ownership from vehicle ownership. This means that the consumer leases the battery and gets the vehicle in a deal depending on what type of subscription the consumer signs up for. The fee of subscription will depend on the millage covered, alternatives from simply purchasing battery to millage fee and returning battery (Andersen et al 2009). A similar model is developed in France between EDF and Toyota.
The problem with this today is the high risk for companies engaging in the leasing procedure. The cost of batteries is high and at current state it is hard and expensive to repair batteries.
6.4 Social A family car fleet in the future can be a larger PHEV as a family car and a smaller EV as the supplement car. This would enable the need of European daily commute life but also offer the range needed for the occasional longer trips. Based on the fact of daily European travel life it is obvious that the EV is a solution that can meet the range demand, especially for inner city conditions. For those who travel significantly more the PHEV is a solution that will provide the excessive range for the longer trips but at the same time enable electric supported short trips. This is facts that have to be communicated to the society in a transparent way.
It is important to show society that EV works for the majority of the Europeans driving patterns. The environmental and economical propulsion benefits must be communicated to society in a clear way. Perceptions of travelling and how to charge will have to be changed and understood in the transition to EVs. This will happen automatically as the development continually replace the vehicle fleet and economical gains will be valued against a new way of travelling. The best way to communicate this is through a transparent policy and try-out sessions that will enable society to create there own perception of EVs.
6.4.1 Try-Out Sessions
Probably the best way to advocate EVs is through try out sessions where people can build their own opinion, which will be spread through the community. Another benefit is that at the same time companies get the chance to try products and infrastructure. Together with try-out sessions the infrastructure issue is more or less based on people’s historical opinions and estimations of their use of car and needed range. This means that the social entrenched habits are more important than economic factors; it is an understanding and learning process. A process that is dependent on learning and understanding often need policy and implementation plans to be transparent.
It is important in what way the information is provided to the society and therefore it is important to let people try and understand EVs and PHEVs in daily life. In Berlin a project is started in order for the society to try-out and evaluate EVs in daily usage. BMW provide the try-out session with 50 EVs and Vattenfall provide the needed infrastructure. The infrastructure provided is constructed in a way that ensures that other EV try-out sessions can use the charging equipment (Vattenfall 2008). There are similar try-out sessions actions taken around Europe. Another important aspect of the Berlin try-out session could be the steps taken toward a standardized agreement; try-out sessions can gain even more if utilities involved can cooperate in order to evaluate common solutions that are beneficial for all parts involved.
43
The result of the try-out session will lead to a higher knowledge of usability and what kind of infrastructure that is needed. This information will be useful when governments, companies and utilities shall provide parking lots or public sites with charging equipment. It enables society to gain knowledge of EVs without the economic risk of purchasing the EV. Economical low risk is important since the EV is connected to uncertainties regarding operating range, reliability and capability. This is a good example on how knowledge can be gained for both consumers and producers. The producer can find out what is expected, needed and what the actual driving patterns are at the same time as the consumer find out how often the need to charge their EV. Try out-sessions are typical example of how to spread an innovation through diffusion to society.
6.4.2 Potential Target Audience
The importance of getting EVs out on the market is high but it is also important that try-out sessions are directed to the right target groups. Travel distance must meet the operating range of the EV and the daily working pattern must collaborate with the charging time of the EV. For other circumstances other transport alternatives are preferred. If EVs would be introduced to the wrong target groups there could be both problems in work related questions but also a negative first public opinion. The negative opinion would be significantly hard to overcome since there is an existing alternative in the IC-car available on the market.
The primary target audiences in a short term perspective are major companies and governmental projects that have car fleets of hundreds of cars. Big companies can provide employees with EVs for the daily commute and they have probably already the parking lot with possibilities for regular charging, see motor heaters. There is no need for a car fleet consisting of only EVs, provide the fleet with an amount of EVs and let employees try them out. This has also a benefit in that the employees are able to try EVs without putting anything at stake.
As time goes and the car fleet needs to be renewed an EV will be a natural replacement vehicle to the IC-car. For employees this kind of leasing would provide them with a car that, depending on travel distance, could take them to work and home free since they only has to charge it on the companies parking lot. This would both provide the company and society with an environmental profile and lower long term operating cost for their vehicle fleets.
In the later stages of the introduction of EVs there is an individual target audience. This target group consists of innovators, early adopters and early majority. At this stage it is the early majority that is the most important target group. They will by starting to use EVs affect the late majority group that will follow after the early majority. The innovators and early adopters will already have EVs and purchased EVs as soon they were available on the market without the need of persuading. The laggards on the other hand will not be persuaded easily. But they stand for only 16 % and if the other 84 % are convinced the laggards can be neglected. This is based on a general theory of adaption, Rogers’s adoption of innovation curve (Rogers 1995), and must be treated as a general. Half the population will be positive and the other half will have a more critical view on E-mobility, in general theory. The surrounding conditions for EVs with low operating costs and environmental benefits will make the positive groups larger. The high initial cost and uncertainties connected to operational range will have the opposite effect.
A suggested individual target group is younger people actively engaged in their carrier who will purchase their first or second vehicle. The vehicle is not used in work but rather for
44
personal transport. Beneficial with this target group is that they, in most cases, are used to travel with public transportation. Travel with public transportation has two significant benefits for the transition to E-mobility. The economic post for transportation is already in the budget and the routines travel planning. The felling of freedom of driving an IC-car and laziness is not as entrenched as it is in groups used to private transportation. In general the cost of traveling for groups used to public transportation are lower than for those that are used to transport by IC-car. A too significant increase in the budget for transportation would hardly be acceptable for the group used to personal transportation. Therefore the potential to drive for free will be of extra interest to this group even if it includes more planning and less freedom than an IC-car can offer. The transportation aspects on the value of money considered is of more importance. Groups used to drive an IC-car might have a larger post in their budget for transportation. The low degree of travel planning needed has increased the value of freedom for them, at a higher cost. A rational decision for groups used to drive IC-cars is to take the car instead of public transportation.
Another benefit with first time buyers is that the first car is often a city car of smaller size; the EVs with the most potential today are small city sized cars. The model, size and comfort will be of less importance for this category. But to this group there is a significant importance of cost reduction or company involvement in order to cut purchase cost or split over payoff periods. When it is time to purchase the family vehicle the ongoing development should have decreased prices on PHEVs or created an EV that can meet the operational range demands. For families owning two cars it is probable that the new one will be the smaller inner city vehicle, therefore it is important to provide proper incentives in order to make the family choose an EV.

45
6.5 Key-Findings Creating Conditions for Electric Mobility Some key-findings and conclusions can be drawn from the investigations and evaluations on how to create conditions suitable for E-mobility to develop. These findings are presented in
Table 11.
Key-Findings Directives
Divide actions between participant actors
Different actors should focus on different areas of development concerning E-mobility. Governments should act in order to reduce the total operating cost of an EV and to provide incentives toward vehicle OEMs to provide the market with EV models. One way to provide these incentives toward vehicle OEMs is to provide governmental companies with vehicle fleets consisting of EVs. Governments should also stand for subsidies and economic support to other major companies with large vehicle fleets. If governments and major companies state an interest in shifting their vehicle fleets to EVs, this demand should be an incentive for vehicle OEMs to provide the market with EVs. These vehicle fleets has to be supported with charging possibilities in connection to the workplace.
Organizations such as housing cooperatives should be supported economically if they choose to provide their housing areas with charging possibilities. Lease associations and new constructions could be obliged to provide charging possibilities for their residents. If governments and major companies solve the charging connected to their parking lots and residential areas is provided with charging possibilities the infrastructure to support PHEVs are in place. This infrastructure is essential to make EVs functional as daily commute transportation.
The main development of infrastructure in public areas and connected to commercial sites should be handled by interested participators. The construction and placement of public charging alternatives will be provided by companies with commercial interest in EV development. The use of EV charging as a way to offer added value toward customer will be a driver for the development of public EV charging possibilities. The development of this infrastructure will gain from try-out sessions and demonstration projects.
Diversified actions will create a more balanced market that does not depend entirely on governmental incentives.
Focus on Infrastructure to Support EVs
The infrastructure development should be based on the operational range of EVs. The focus should be to offer charging possibilities that will enable an EV to work as a daily commute alternative.
Even if a PHEV is the natural transition vehicle toward E-mobility that will offer the size and comfort of a long distance vehicle it is
46
important to focus on EVs and its coherent development concerning infrastructure. The existing charging infrastructure today is enough for a PHEV to operate in. For a PHEV to run out of battery is not a problem since it is supported by the dual fuel technologies.
A simultaneously development is preferred but if one technology should be the leading technology the focus should be on EVs.
Try-Out Sessions and Demonstrations
Try-out sessions and demonstration projects together with public interaction will be highly important for the development of E-mobility. It will be beneficial for the public, governments and companies. To offer society a chance to try EVs at no or a low cost will be important. The target group should mainly be the early majority with daily patterns that fit the operating range of EVs.
The transition to E-mobility will be dependant on social acceptance and try-out sessions will be a good way to promote E-mobility and increase acceptance.
Subsidies and Incentives
The economic actions can be divided into different categories. The main categories are two; vehicle OEMs and the consumer side consistent of major companies and the public.
The subsidies that are mentioned for the vehicle OEMs shall work in order to make it possible for vehicle OEM to supply the market with EV models. When the production cost is reduced the subsidies shall be reduced.
For major companies the reduced tax fringe value is probably the most important. The subsidies and incentives directed to EV drivers can be divided into gains and reductions. Gains will be the incentives that are offered at an operational basis such as reduced operating cost, free parking and exemption from congestion charges. The gain incentives will work as its best when they are offered on a regular basis and offer economic value. The reduction incentives are purchase subsidies or added equipment offered. The reduction incentives are used in order to persuade the consumer to buy the product.
Standardization It is important to standardize some components in the E-mobility system. Characteristics concerning the charging procedure is important to reach an agreement upon and could be standardized by a stand-alone organization e.g. ISO.
At the same time it is highly important to leave some components free for development and innovation in order to gain maximum of E-

47
mobility. Components that are not limiting must be free for innovation. The lock-in effect will probably take place sooner or later anyway.
Table 11. Key-findings with directives on how to create conditions for E-mobility.
These key-findings are suggested ways to overcome the barriers considering economic, technological and social issues. If development theory shall be applied, the cognitive model of innovation is a model that applies all these findings. By looking at the key-findings another conclusion can be drawn and that is the importance of a system integrator in order to get these actions to work together at the proper time. The system integrator will act to avoid structural tensions in the development.

48
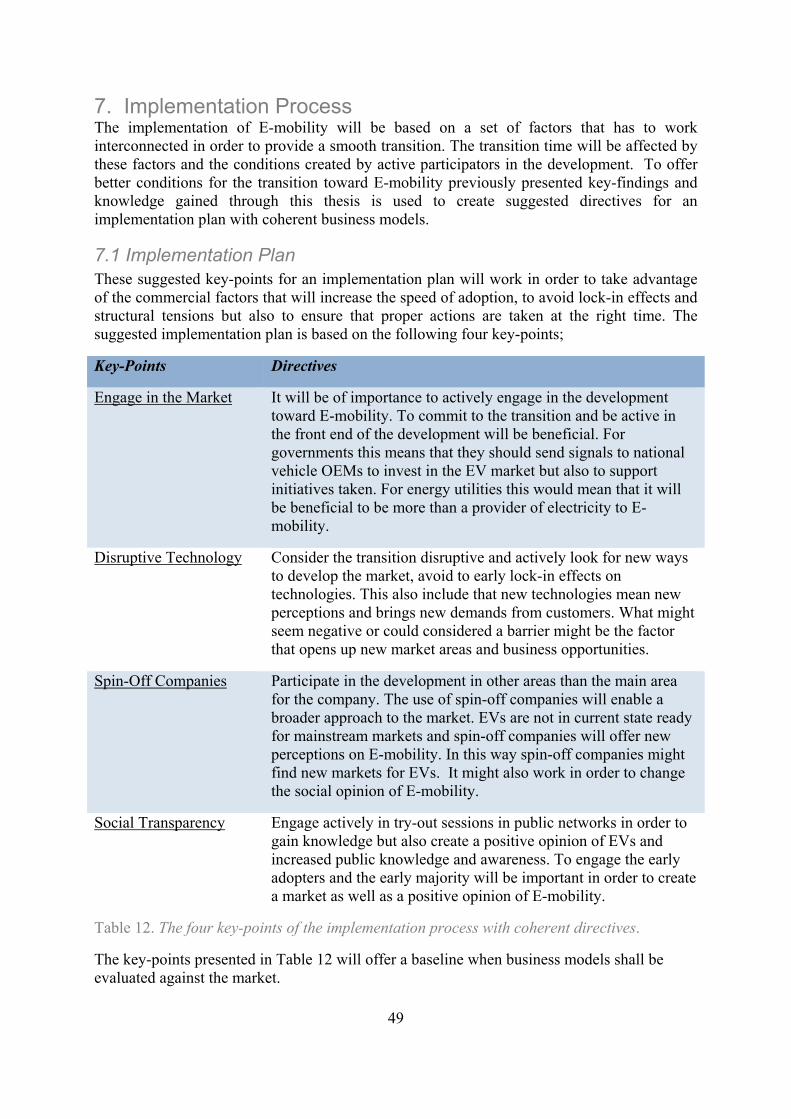
49
7. Implementation Process The implementation of E-mobility will be based on a set of factors that has to work interconnected in order to provide a smooth transition. The transition time will be affected by these factors and the conditions created by active participators in the development. To offer better conditions for the transition toward E-mobility previously presented key-findings and knowledge gained through this thesis is used to create suggested directives for an implementation plan with coherent business models.
7.1 Implementation Plan These suggested key-points for an implementation plan will work in order to take advantage of the commercial factors that will increase the speed of adoption, to avoid lock-in effects and structural tensions but also to ensure that proper actions are taken at the right time. The suggested implementation plan is based on the following four key-points;
Key-Points Directives
Engage in the Market
It will be of importance to actively engage in the development toward E-mobility. To commit to the transition and be active in the front end of the development will be beneficial. For governments this means that they should send signals to national vehicle OEMs to invest in the EV market but also to support initiatives taken. For energy utilities this would mean that it will be beneficial to be more than a provider of electricity to E-mobility.
Disruptive Technology Consider the transition disruptive and actively look for new ways to develop the market, avoid to early lock-in effects on technologies. This also include that new technologies mean new perceptions and brings new demands from customers. What might seem negative or could considered a barrier might be the factor that opens up new market areas and business opportunities.
Spin-Off Companies Participate in the development in other areas than the main area for the company. The use of spin-off companies will enable a broader approach to the market. EVs are not in current state ready for mainstream markets and spin-off companies will offer new perceptions on E-mobility. In this way spin-off companies might find new markets for EVs. It might also work in order to change the social opinion of E-mobility.
Social Transparency Engage actively in try-out sessions in public networks in order to gain knowledge but also create a positive opinion of EVs and increased public knowledge and awareness. To engage the early adopters and the early majority will be important in order to create a market as well as a positive opinion of E-mobility.
Table 12. The four key-points of the implementation process with coherent directives.
The key-points presented in Table 12 will offer a baseline when business models shall be evaluated against the market.
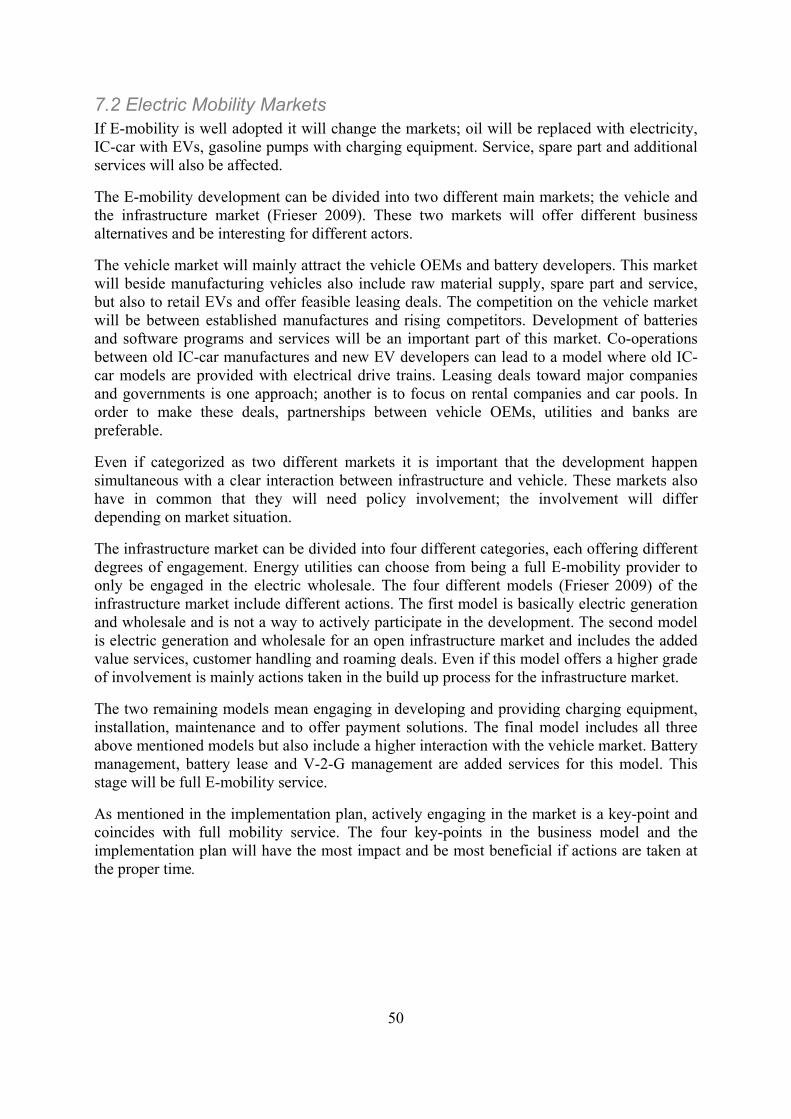
50
7.2 Electric Mobility Markets If E-mobility is well adopted it will change the markets; oil will be replaced with electricity, IC-car with EVs, gasoline pumps with charging equipment. Service, spare part and additional services will also be affected.
The E-mobility development can be divided into two different main markets; the vehicle and the infrastructure market (Frieser 2009). These two markets will offer different business alternatives and be interesting for different actors.
The vehicle market will mainly attract the vehicle OEMs and battery developers. This market will beside manufacturing vehicles also include raw material supply, spare part and service, but also to retail EVs and offer feasible leasing deals. The competition on the vehicle market will be between established manufactures and rising competitors. Development of batteries and software programs and services will be an important part of this market. Co-operations between old IC-car manufactures and new EV developers can lead to a model where old IC-car models are provided with electrical drive trains. Leasing deals toward major companies and governments is one approach; another is to focus on rental companies and car pools. In order to make these deals, partnerships between vehicle OEMs, utilities and banks are preferable.
Even if categorized as two different markets it is important that the development happen simultaneous with a clear interaction between infrastructure and vehicle. These markets also have in common that they will need policy involvement; the involvement will differ depending on market situation.
The infrastructure market can be divided into four different categories, each offering different degrees of engagement. Energy utilities can choose from being a full E-mobility provider to only be engaged in the electric wholesale. The four different models (Frieser 2009) of the infrastructure market include different actions. The first model is basically electric generation and wholesale and is not a way to actively participate in the development. The second model is electric generation and wholesale for an open infrastructure market and includes the added value services, customer handling and roaming deals. Even if this model offers a higher grade of involvement is mainly actions taken in the build up process for the infrastructure market.
The two remaining models mean engaging in developing and providing charging equipment, installation, maintenance and to offer payment solutions. The final model includes all three above mentioned models but also include a higher interaction with the vehicle market. Battery management, battery lease and V-2-G management are added services for this model. This stage will be full E-mobility service.
As mentioned in the implementation plan, actively engaging in the market is a key-point and coincides with full mobility service. The four key-points in the business model and the implementation plan will have the most impact and be most beneficial if actions are taken at the proper time.
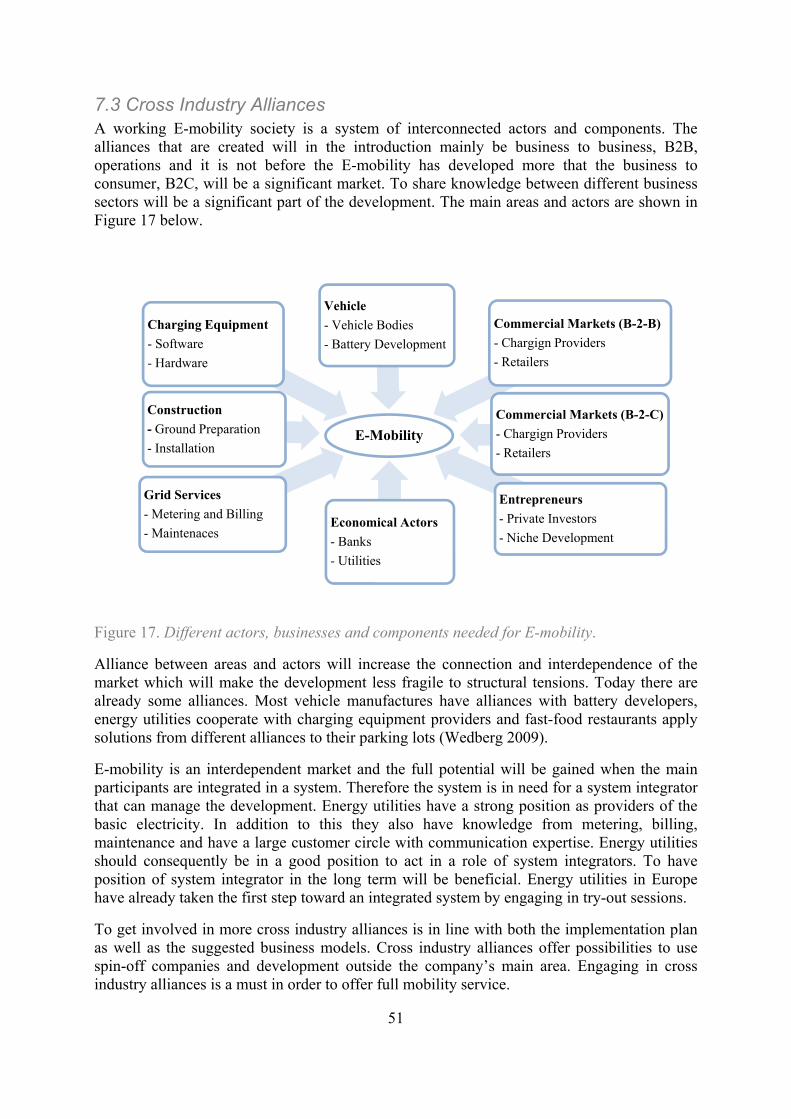
51
7.3 Cross Industry Alliances A working E-mobility society is a system of interconnected actors and components. The alliances that are created will in the introduction mainly be business to business, B2B, operations and it is not before the E-mobility has developed more that the business to consumer, B2C, will be a significant market. To share knowledge between different business sectors will be a significant part of the development. The main areas and actors are shown in Figure 17 below.
Figure 17. Different actors, businesses and components needed for E-mobility.
Alliance between areas and actors will increase the connection and interdependence of the market which will make the development less fragile to structural tensions. Today there are already some alliances. Most vehicle manufactures have alliances with battery developers, energy utilities cooperate with charging equipment providers and fast-food restaurants apply solutions from different alliances to their parking lots (Wedberg 2009).
E-mobility is an interdependent market and the full potential will be gained when the main participants are integrated in a system. Therefore the system is in need for a system integrator that can manage the development. Energy utilities have a strong position as providers of the basic electricity. In addition to this they also have knowledge from metering, billing, maintenance and have a large customer circle with communication expertise. Energy utilities should consequently be in a good position to act in a role of system integrators. To have position of system integrator in the long term will be beneficial. Energy utilities in Europe have already taken the first step toward an integrated system by engaging in try-out sessions.
To get involved in more cross industry alliances is in line with both the implementation plan as well as the suggested business models. Cross industry alliances offer possibilities to use spin-off companies and development outside the company’s main area. Engaging in cross industry alliances is a must in order to offer full mobility service.
E-Mobility
Grid Services
- Metering and Billing
- Maintenaces
Construction
- Ground Preparation
- Installation
Charging Equipment
- Software
- Hardware
Vehicle
- Vehicle Bodies
- Battery Development
Commercial Markets (B-2-B)
- Chargign Providers
- Retailers
Economical Actors
- Banks
- Utilities
Entrepreneurs
- Private Investors
- Niche Development
Commercial Markets (B-2-C)
- Chargign Providers
- Retailers
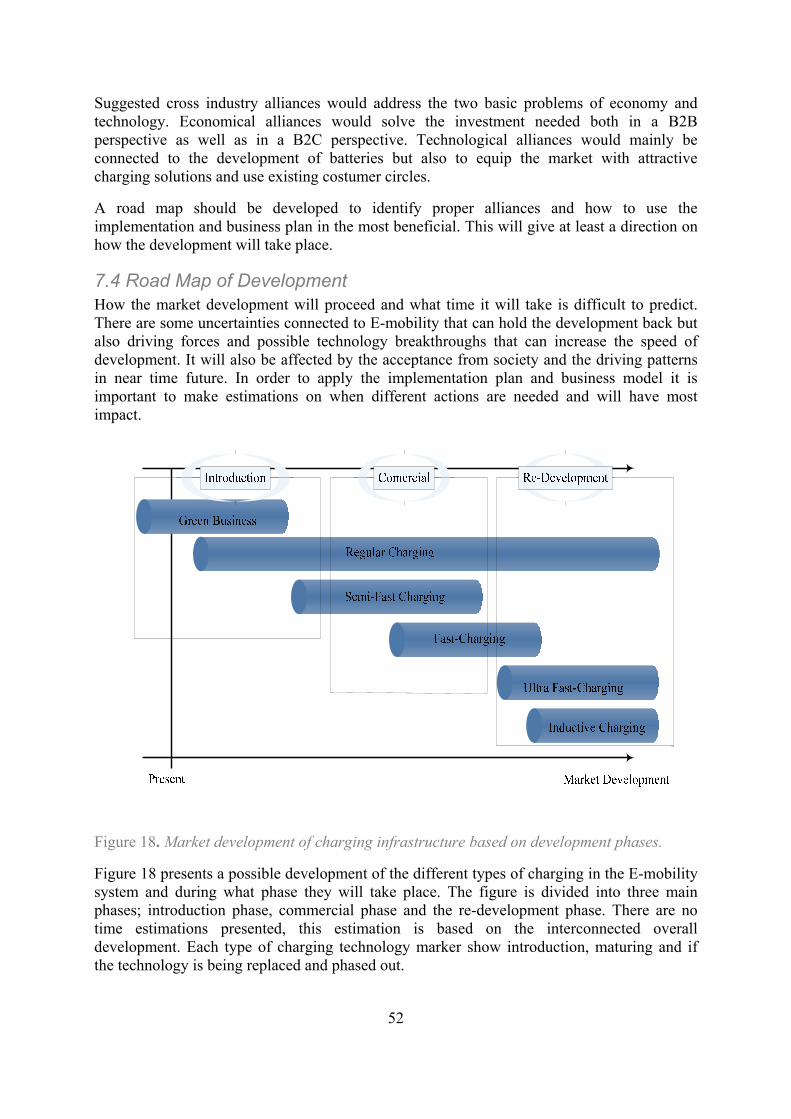
52
Suggested cross industry alliances would address the two basic problems of economy and technology. Economical alliances would solve the investment needed both in a B2B perspective as well as in a B2C perspective. Technological alliances would mainly be connected to the development of batteries but also to equip the market with attractive charging solutions and use existing costumer circles.
A road map should be developed to identify proper alliances and how to use the implementation and business plan in the most beneficial. This will give at least a direction on how the development will take place.
7.4 Road Map of Development How the market development will proceed and what time it will take is difficult to predict. There are some uncertainties connected to E-mobility that can hold the development back but also driving forces and possible technology breakthroughs that can increase the speed of development. It will also be affected by the acceptance from society and the driving patterns in near time future. In order to apply the implementation plan and business model it is important to make estimations on when different actions are needed and will have most impact.
Figure 18. Market development of charging infrastructure based on development phases.
Figure 18 presents a possible development of the different types of charging in the E-mobility system and during what phase they will take place. The figure is divided into three main phases; introduction phase, commercial phase and the re-development phase. There are no time estimations presented, this estimation is based on the interconnected overall development. Each type of charging technology marker show introduction, maturing and if the technology is being replaced and phased out.
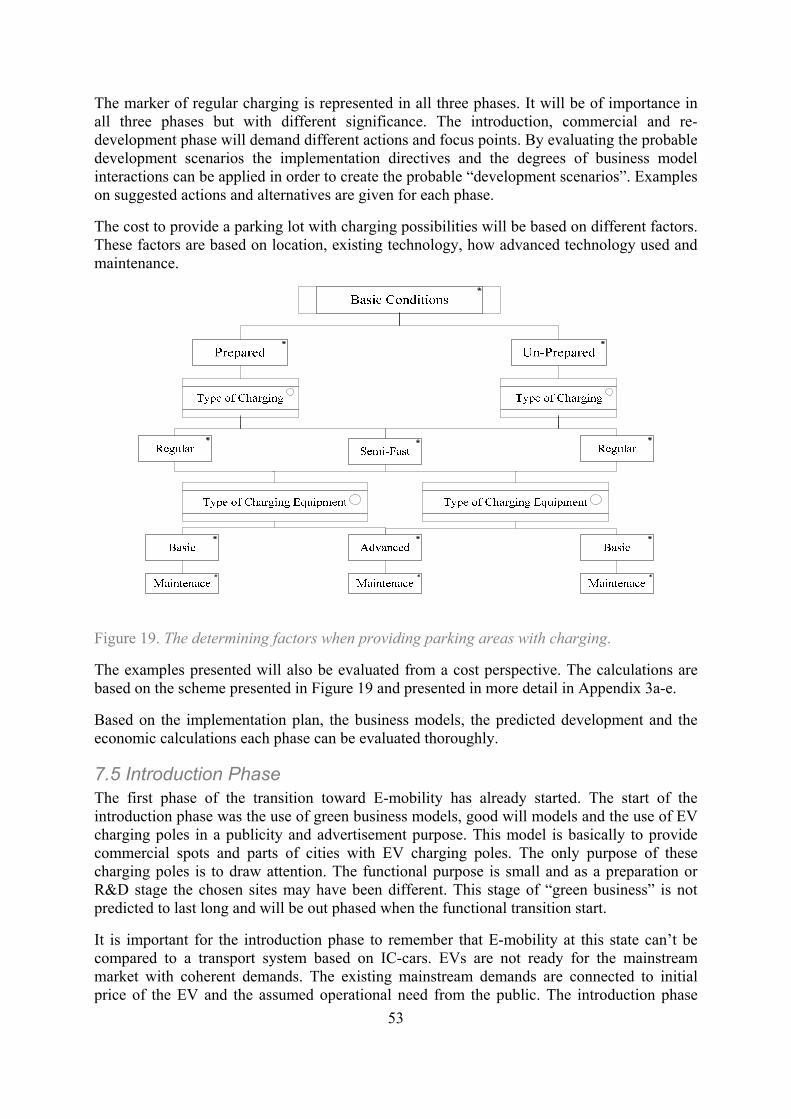
53
The marker of regular charging is represented in all three phases. It will be of importance in all three phases but with different significance. The introduction, commercial and re-development phase will demand different actions and focus points. By evaluating the probable development scenarios the implementation directives and the degrees of business model interactions can be applied in order to create the probable “development scenarios”. Examples on suggested actions and alternatives are given for each phase.
The cost to provide a parking lot with charging possibilities will be based on different factors. These factors are based on location, existing technology, how advanced technology used and maintenance.
Figure 19. The determining factors when providing parking areas with charging.
The examples presented will also be evaluated from a cost perspective. The calculations are based on the scheme presented in Figure 19 and presented in more detail in Appendix 3a-e.
Based on the implementation plan, the business models, the predicted development and the economic calculations each phase can be evaluated thoroughly.
7.5 Introduction Phase The first phase of the transition toward E-mobility has already started. The start of the introduction phase was the use of green business models, good will models and the use of EV charging poles in a publicity and advertisement purpose. This model is basically to provide commercial spots and parts of cities with EV charging poles. The only purpose of these charging poles is to draw attention. The functional purpose is small and as a preparation or R&D stage the chosen sites may have been different. This stage of “green business” is not predicted to last long and will be out phased when the functional transition start.
It is important for the introduction phase to remember that E-mobility at this state can’t be compared to a transport system based on IC-cars. EVs are not ready for the mainstream market with coherent demands. The existing mainstream demands are connected to initial price of the EV and the assumed operational need from the public. The introduction phase

54
will be a learning process and the precise development can not be predicted. The knowledge will be learned from society at the same time as actors can gain from that knowledge. Even if the development can not be predicted it is important to try to predict what kind of conditions that will help the transition toward E-mobility.
For the introduction phase it is important that roaming deals are developed. These deals are important to enable an open infrastructure where charging can take place independent on who is the electricity provider. These roaming deals will be between energy utilities and concern how the profit shall be shared but can also work as a framework for joint investments. Perhaps it will be of most importance when business models in commercial aspects are used. Standardization and roaming deals are important decisions that must be taken from key-actors. The GSM net has been able to set European roaming deals and also been able to attract joint investments in the GSM net. These actions can be used to leapfrog some of the problems that will be brought due to profit and investment sharing on national level. A European roaming deal together with standardization will open up borders for E-mobility.
The dominant factor in the introductions phase will be the regular charging that take place at home at night time and day time charging at work. The circumstances needed for this phase is that vehicle has to be left standing for a consecutive amount of time, during night and at work. The regular charging uses the existing grid and can be used with standard outlets. This will make it suitable for the introduction phase when EVs are introduced to the market. Regular charging taking place at home will use similar charging equipment as the one used at company parking lots.
More advanced technology and better social understanding together with try-out sessions will indicate the direction of development. The key is to start the introduction at the right sites and direct it toward the correct target audience and vehicle fleets. Another important factor to consider can be a more concentrated geographical introduction, more actions taken in fewer cities.
To use existing conditions will be serve dual purposes, it will decrease the investment needed and it will show that EVs can be used without the need of major additional installations.
7.5.1 Parking Lot Alternative
Major parking lots provide the proper site and target audience. The basic conditions are in place and the cost will be on the company. By providing the parking with charging equipment it will offer benefits similar to the one gained from try-out sessions. It will also send signals that the company is committed to the development of E-mobility. These signals can be of high importance for the public opinion but also important toward business partners.
The main benefit is to offer a market for vehicles and R&D chances for companies. It could be the first step for a company’s vehicle fleet to be replaced by EVs and the employees of the company will also get a chance to try out EVs without risking personal economic loss. The social transparency of the first phase is important and will benefit from the key-points from adoption of innovation. It will offer trialability, possibilities to try an EV, and a first introduction to the relative advantage of E-mobility. In long term development the parking lot alternative will be of importance to a V-2-G society, both as a central hub in the system but also for R&D purposes.
To equip a parking lot with regular charging equipment will not be that expensive. It is a low cost solution that offers low symbolic value but it will still be noticeable as EV charging due
55
to the charging boxes. The cost will be low since the solution is based on pre-existing motor heaters connections and low charging technology need. The equipment cost for a single charger will be between € 200-500, for this expense a charger with a lock mechanism and indication function is provided. The total cost for 10 chargers will be approximately € 4 500. This cost is based on ground preparation, equipment and installation. For calculations see Appendix 3a.
To provide company parking lots with charging equipment is a functional and supportive step in the development. The commercial forces used are low but the parking lot alternative offer a base line for further development. The parking lot solution is a low cost solution where equipment is placed at the best suited sites possible. It uses a low degree of technology and the electricity will be paid for by the parking lot provider. For companies that actively works toward shifting their vehicle fleet to EVs and for companies that work with the development of E-mobility and engage in try out sessions this will be a good and affordable alternative.
The cost to equip the parking lot with charging equipment can be compared to the operational gains from using EVs in the vehicle fleet. If the company pays for the operating cost, gasoline or electricity, the payback time for this investment would be approximately 15 days, equivalent to three working weeks. This is due to the price difference between gasoline and electricity. The usefulness of this payback time can be discussed since it neglects the high initial cost of EVs. Calculations presented in Appendix 3b.
There are other places where the vehicle is left for a long time, for example long term parking in connection to train stations or airports. Distance travel with train or by planes is often dependent on a personal transport alternative at the departure and arrival site. This opens up business opportunities for interconnected businesses.
7.5.2 The Commuter Alternative
To interconnect EV charging possibilities with major commute stations is a way to provide an advantage for major travel companies but also to provide the travel from commute station to final destination. Often there is already long term parking with connection to the grid at the commute station. The fee for charging the EV will probably be included in the fee for parking. Parking like this would in a commercial sense be beneficial for train companies.
Cooperation with car pool companies could offer package deals for travelers, free charging at the departure parking lot and travel ticket with a fully charged EV at destination in order to provide the inner city travelling. From environmental aspect this would be a good way to decrease the CO2 emissions. This alternative should also be supported by governments in order to lower emission on a national level. The incentives in this alternative are those who are attractive to private users and also solve the old argument that a car is needed at arrival site.
The cost for this alternative will be more expensive than the parking lot alternative, assumed that there are no motor heaters at the site increases the preparation cost along with more advanced equipment used. This adds up to a total cost of € 10 000 for ten chargers. For calculations see Appendix 3c.
The parking lot and commuter alternative are investments that in short term will have low, probably no, economic gain but will open up the market to more actors ready to invest and engage. The initial cost for this investment will be covered by the company or utility that provides it. The charging will be free or included in a parking fee. The electricity cost will be

56
covered by company or utility providing the parking lot. The knowledge and the head start gained from this can be significantly beneficial in a long term development.
This phase is more focused on implementing and providing the proper market conditions for E-mobility. Therefore the key-points from the implementation plan are important. All four points are involved in this phase and as the disruptive key-point suggests the continuous development can shift toward other solutions. According to the business models it is mainly point one and two, electricity wholesale and roaming deals, for an open market that is involved. This phase will mainly consider B2B and B2G, alliances between energy utilities and different OEMs will take place and contracts with governments will be signed.
From the governmental side the recommended actions are to offer reductions of the taxable value of fringe benefits for a couple of years in order to increase the amount of company EVs. To invest in EV fleet for national businesses is another important action, equipping parking lots in connection to these fleets with charging possibilities should be included. Governmental actions should be directed toward major vehicle fleets.
Regular charging will become mature quite early due to the good basic conditions. As regular charging becomes more common and the vehicle fleet of EVs increases, mainly because company vehicle fleets, semi-fast charging will be introduced. The semi-fast charging will be the start signal for the commercial phase where competitive advantage is the predicted key-driver.
7.6 Commercial Phase When regular charging and EVs become more common, more and more parking lots will be able to provide charging. Leisure site parking lots will start offer charging as a competitive advantage toward other competing businesses. To offer charging possibilities will be an important factor when EV drivers shall choose leisure sites to visit. In the introduction and commercial phase is probable that EV drivers will charge when ever they are given a chance. This due to the fact that it is for free but also to ensure that the vehicle always is fully charged in order to provide a feeling of reliability.
During the commercial phase the introduction of semi-fast charging and ongoing development of fast-charging will be important. During this phase infrastructure development should strive to increase the feeling of independence for EV drivers. When more and more charging opportunities are given EV drivers becomes less dependant on regular charging at home and at work. Another positive aspect with the charging equipment is that it will not decrease the amount of parking spaces. Leisure centers aim to attract as much customers as possible and therefore need a lot of parking spots.
In addition to more and more charging opportunities offered, EV drivers will use Global Positioning System, GPS, services to a higher extent. GPS services will increase the reliability of E-mobility since it will keep the driver aware of were he can charge. GPS services will be able to provide charging opportunities connected to the state of charge of the battery. Internet services will provide the same service but accessible without GPS. This will further increase the reliability of E-mobility but also increase the need for similar E-mobility services
The commercial phase is based on the competitive advantage and the fact that charging an EV takes time and will naturally take place during other activities.
57
7.6.1 Shopping Mall Alternative
A larger shopping mall will be a natural site to offer semi fast charging to the customers. This scenario would mean that the EV could be charged in 1-3 hours with help of semi-fast charging. This charging time for the EV to be fully charged coincides with time spent by consumers in a shopping mall. If a shopping mall offers free charging to customers this will be a good way to attract customers. In connection to a mall the expensive can be shared between several commercial businesses or provided by parking lot owner. This will provide incentives for customers to choose a specific mall or cinema, the charging will be free and the extra cost for electricity will be covered by additional sale of products or services. These incentives correspond to two important factors; economical and on a regular basis. The investments connected to this alternative are set by amount of participant providers at the site. If the investment can be split between providers the preparation cost will be lower but it will require a higher technology of the charging equipment. The fact that this alternative will demand delta voltage transformers also increases the cost.
At these sites there are no existing motor heaters connections and there is a significant need of ground preparation work. The price of the charging pole will be between € 2 150 and 2 500. This will offer a payment solution based on the existing public transportation system. These poles are equipped with two outlets each and can be connected to a transformer that will cost € 3 000 and ensure delta voltage. Ground preparation work and installation will cost € 1 000 per pole. The total investment will be € 21 500, if a credit card terminal is added that will add an extra investment of € 14 000. For calculations see Appendix 3d.
During this phase consumer matching alternatives grow strong. Subsidies and development of batteries, car pools and rental services will provide EVs to the public. More and more consumer matching will be available when battery leasing becomes a more interesting alternative. Subscriptions that offer a monthly usage will be a convenient way for consumers to purchase vehicle. Car pools subscriptions will offer consumers a vehicle without the high initial purchase cost and with low operating costs. For these alternatives it is important with a well developed public infrastructure charging net, since home charging may not be provided in rental scenarios.
7.6.2 Consumer Matching Alternative
Car pools and rental companies that offer EVs to the public will during the commercial phase be able to use this as a competitive advantage compared to ones who do not. People will be able to try out an EV when they need to rent a car or participate in a car pool; the EV will be something new and will attract consumers.
Later in the commercial phase rental firms and car pools will offer inner city people the possibility to use the service of a vehicle without owning it. EVs can in this stage be compared to public communication cards that offer free travel for a monthly fee, since the operational costs are low. A monthly fee paid upfront will ensure access to a vehicle when needed and parking lot spot will be of no concern since it is provided by the rental firm.
A connection between public transportation and car pool companies could offer monthly subscriptions that offer a certain amount of trips by public transportation and pre-paid amount of kWh. Higher use will be charged for retroactive.
Leasing deals for EVs could include access to a PHEV for 3 weeks a year for family vacations. The investment for a car pool alternative will be similar to the commercial parking

58
lot, only infrastructure considered. Access to vehicle will be enabled through member card system. If the car pool shall be effective a booking service and service that show where fully charged vehicles are available is needed. This means a higher level of connection between charger and communication channels. Car pools and rental firms will be the first steps taken toward provide individual solutions to personal transportation, mainly in the inner cities.
During the commercial phase the development of fast-charging will be important, this in order to offer competitive advantage for businesses were activities take 30 minutes or less. When EVs can be charged in 30 minutes it may be offered by almost all commercial business in order to gain customers. The full potential of EV charging is offered to the commercial business sector.
7.6.3 The Fast Food Alternative
Fast charging will take approximately 30 minutes in order to get a fully charged battery. 30 minutes or more is an estimation of a common “fast-food” stop or lunch, lunch time at working days is an hour. For lunch restaurants and fast food restaurants along highways charging will be a natural added value to offer. An EV driver driving an EV with a range capacity of 300-400 km will probably find this stop natural on a longer trip anyway. For lunch restaurants the free charging will be a important factor when it comes to choosing restaurants, both along highways and in suburbs. Fast-food restaurants along highways will have the potential of becoming the new gasoline stations.
Cost estimations for fast charging are hard to estimate, the determining factors are in a R&D stage. But at this phase it is probable that the development has provided fast charging.
The fast food alternative and fast charging together with a higher adoption of E-mobility will be one of the final steps toward a new perception of traveling. Commercial business alternatives will seek new ways to connect EV drivers to their business and therefore the development of software, payment solutions and added value services will increase. The charging will be free and therefore the additional sale of products and services must be re-connected to the right business.
7.6.4 Payment Solutions
There are different alternatives on how to connect the free charging back to the provider. One alternative is the today commonly used member card. Major commercial businesses today often offer member cards to their costumers. An EV driver could apply to have the member card connected to the charger which would enable him to activate charging at arrival. The equipment will be able to save the member card information and the billing process is solved.
If the charging is provided by fast-food restaurants a natural alternative is to include it in meals. In this way charging can be started from the cashier when something is ordered. Charging can be included in meals or just for free as soon as something is ordered.
A bonus system can be used and a certain amount of travel will offer the EV driver to a certain amount of free charging. Free charging in comparison to travel points, special offers and bonus checks. Payment solutions will be connected with business ideas from commercial businesses and service providers. To develop more and better payment solutions will be a key in order to use commercial forces.
In comparison to the implementation plan and business models this stage assumes a full E-mobility transition and therefore the business models will be of more importance. Integrated

59
energy services will be significant in order to keep development connected and the infrastructure open from both provider and consumer perspectives. In the commercial phase it is of importance that the commercial businesses gain from the competitive advantage. It will probably open the market to time extensive services that coincide with the time spent charging. Excessive time will be evaluated against free charging and other economic and social incentives. With a more developed EV usage society will learn more about driving patterns and personal transport need.
At the commercial phase B2C will provide an expansion of the market. This will offer alliances between different business sectors. Vehicle OEMs, energy utilities and banks can create alliances to provide EV purchases with profitable payback deals or leasing deals mainly to private consumers. The cross industry alliances that are created at this phase will connect the different actors in a more integrated system. A good example to this is the development of commercial payment solutions where billing knowhow will be used together with hardware solutions concerning electric poles and software programming. This solution will in next stage be applied to a commercial business that will gain economic from additional sales of ordinary products or services.
Subsidies that create incentives for private customers to invest in EV will be of importance in this phase and should be provided by governments. The initial cost of EVs and PHEVs will probably have decreased due to more production and sale of vehicles. Free charging, free parking and exceptions from congestion charges and environmental taxes will be useful.
The first steps toward full E-mobility will during this phase be taken and as E-mobility becomes more common. The development moves toward a new development phase where the new registered vehicles for personal transport are EVs and PHEVs. Social adoption will determine whether the development proceed to the next phase or not.
7.7 Re-Development Phase The infrastructure provides charging for personal E-mobility and at this phase the earlier used technologies are replaced by new more efficient technologies. Regular charging at home and at parking lots will still be one of the main charging alternatives. New apartments are equipped with parking alternatives connected to the grid and offer natural charging spots for people living in the inner city. The charging patterns for personal transportation have become more similar to mobile phone charging; some charge as soon as time is given and some when it is needed. Re-development of the society starts when the existing net has become mature and can provide E-mobility as personal transportation.
7.7.1 V-2-G Society to Promote Renewable Energy
A personal transportation system consisting of or shifting towards EVs offer a good way to curb GHG emissions. The EV fleet offers an extra battery park that can be used to store the energy generated from fluctuated sources during night time when electricity usage is low. The energy can be “sold” back into to grid from the vehicle during peak hours. An economic EV driver will in this way be able to decrease operating cost to minimum by charging during low cost hours and selling it back during high cost hours, peak hours. Price of electricity will shift depending on when the EV is charged.
For an EV fleet to be a regulative force considering peak hours a capacity of 500 MWh has to be reached. An EV fleet of 50 000 vehicles with battery capacity of 20 kWh is calculated to
60
supply the extra capacity needed. The EVs will still work as a transport solution, batteries are not totally depleted.
This development brings incentives to invest more in renewable energy sources, both for energy utilities but also for private users. Energy utilities need of scale production in order to gain economic benefit and private users can by providing their vehicle with e.g. solar panels provide their own power plant.
The re-development will also include heavy vehicles such as public transport busses. Transportation alternatives that are used in similar patterns will become involved into the E-mobility. Public transportation is supported by ultra-fast charging stations and zones with inductive charging. There is a higher degree of connection between EVs and commute transportation.
The competitive advantages will not be as significant, charging possibilities will rather be taken for granted. This advantage will be replaced by additional travel planning and extra value from soft-ware producers and charging providers. Battery development will open up the leasing market and offer business models that will cut the cost of EVs.
7.7.2 E-mobility Services
In a new transport society more and more mobility services will have to evolve to make it easier for the driver to navigate in traffic. Active GPS solutions will work to minimize road congestions and also offer driver different road suggestions based on the EVs state of charge and charging possibilities. GPS providers can offer equipment that suggests primary stops at charging locations where a specific service provider benefits from the charging.
Services that will offer information over internet concerning charging possibilities will be of interest. Where and who provides the nearest charging spots and what other services is offered at the site can easily be checked out from a mobile phone. The price situation and possibilities to sell back at peak hours can be stated, this to offer the EV driver a competitive situation in a V-2-G society.
The development to full E-mobility offer leasing deals and a mature battery technology decreases the initial costs of EVs. Leasing of batteries will decouple battery ownership from vehicle ownership. A higher grade of battery technology will also offer a second hand market for batteries e.g. used in large battery parks. On the other hand the development might take another turn and customers will only purchase the battery and lease the mechanical structure. This would be interesting in vacation aspects but also in cities with seasonal weather changes.
Personal transportation has developed to a fully integrated system with economical, environmental and social benefits. The electricity grid is the energy provider, vehicle OEMs supplies the market with vehicles, the use of personal services and added value are the commercial forces and all of this is integrated and managed by different energy utilities.
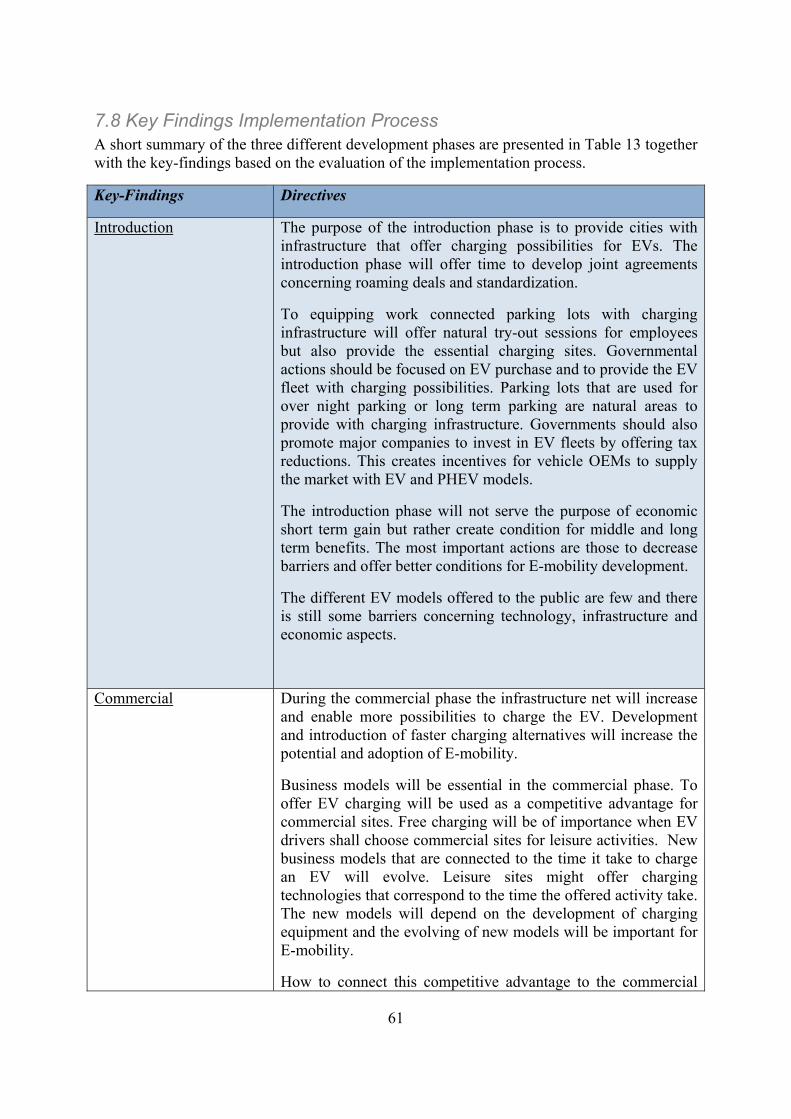
61
7.8 Key Findings Implementation Process A short summary of the three different development phases are presented in Table 13 together with the key-findings based on the evaluation of the implementation process.
Key-Findings Directives
Introduction The purpose of the introduction phase is to provide cities with infrastructure that offer charging possibilities for EVs. The introduction phase will offer time to develop joint agreements concerning roaming deals and standardization.
To equipping work connected parking lots with charging infrastructure will offer natural try-out sessions for employees but also provide the essential charging sites. Governmental actions should be focused on EV purchase and to provide the EV fleet with charging possibilities. Parking lots that are used for over night parking or long term parking are natural areas to provide with charging infrastructure. Governments should also promote major companies to invest in EV fleets by offering tax reductions. This creates incentives for vehicle OEMs to supply the market with EV and PHEV models.
The introduction phase will not serve the purpose of economic short term gain but rather create condition for middle and long term benefits. The most important actions are those to decrease barriers and offer better conditions for E-mobility development.
The different EV models offered to the public are few and there is still some barriers concerning technology, infrastructure and economic aspects.
Commercial During the commercial phase the infrastructure net will increase and enable more possibilities to charge the EV. Development and introduction of faster charging alternatives will increase the potential and adoption of E-mobility.
Business models will be essential in the commercial phase. To offer EV charging will be used as a competitive advantage for commercial sites. Free charging will be of importance when EV drivers shall choose commercial sites for leisure activities. New business models that are connected to the time it take to charge an EV will evolve. Leisure sites might offer charging technologies that correspond to the time the offered activity take. The new models will depend on the development of charging equipment and the evolving of new models will be important for E-mobility.
How to connect this competitive advantage to the commercial
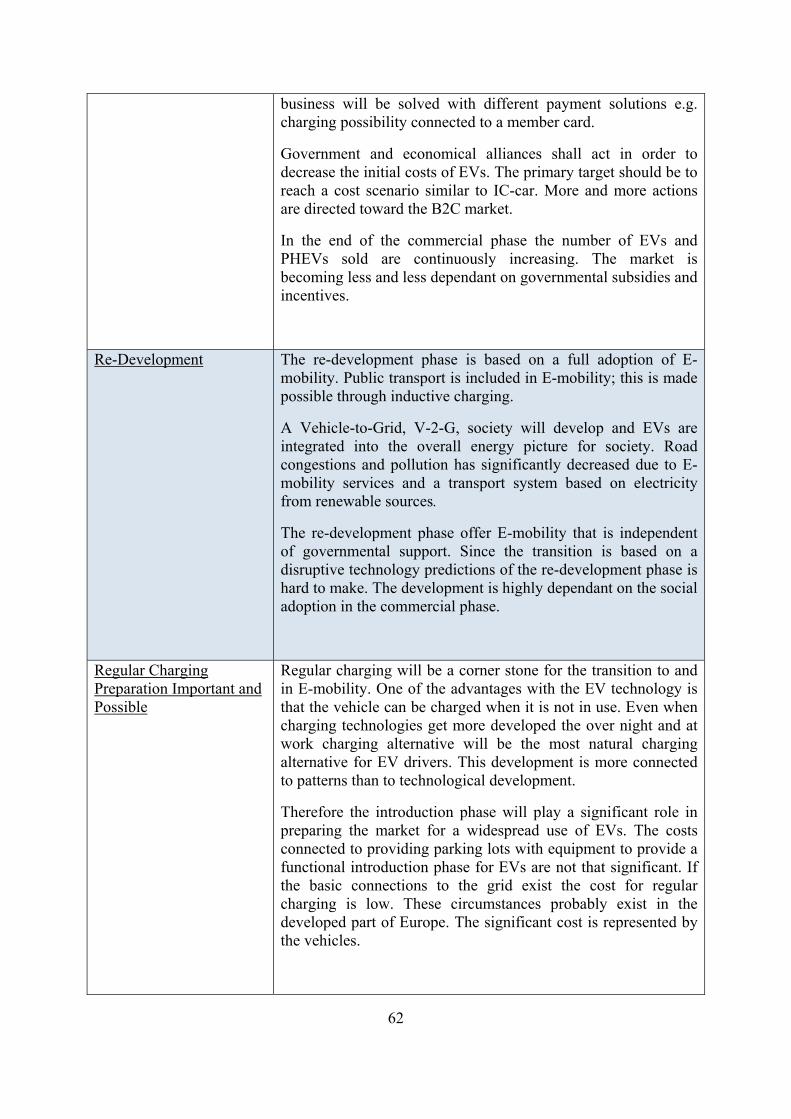
62
business will be solved with different payment solutions e.g. charging possibility connected to a member card.
Government and economical alliances shall act in order to decrease the initial costs of EVs. The primary target should be to reach a cost scenario similar to IC-car. More and more actions are directed toward the B2C market.
In the end of the commercial phase the number of EVs and PHEVs sold are continuously increasing. The market is becoming less and less dependant on governmental subsidies and incentives.
Re-Development The re-development phase is based on a full adoption of E-mobility. Public transport is included in E-mobility; this is made possible through inductive charging.
A Vehicle-to-Grid, V-2-G, society will develop and EVs are integrated into the overall energy picture for society. Road congestions and pollution has significantly decreased due to E-mobility services and a transport system based on electricity from renewable sources.
The re-development phase offer E-mobility that is independent of governmental support. Since the transition is based on a disruptive technology predictions of the re-development phase is hard to make. The development is highly dependant on the social adoption in the commercial phase.
Regular Charging Preparation Important and Possible
Regular charging will be a corner stone for the transition to and in E-mobility. One of the advantages with the EV technology is that the vehicle can be charged when it is not in use. Even when charging technologies get more developed the over night and at work charging alternative will be the most natural charging alternative for EV drivers. This development is more connected to patterns than to technological development.
Therefore the introduction phase will play a significant role in preparing the market for a widespread use of EVs. The costs connected to providing parking lots with equipment to provide a functional introduction phase for EVs are not that significant. If the basic connections to the grid exist the cost for regular charging is low. These circumstances probably exist in the developed part of Europe. The significant cost is represented by the vehicles.
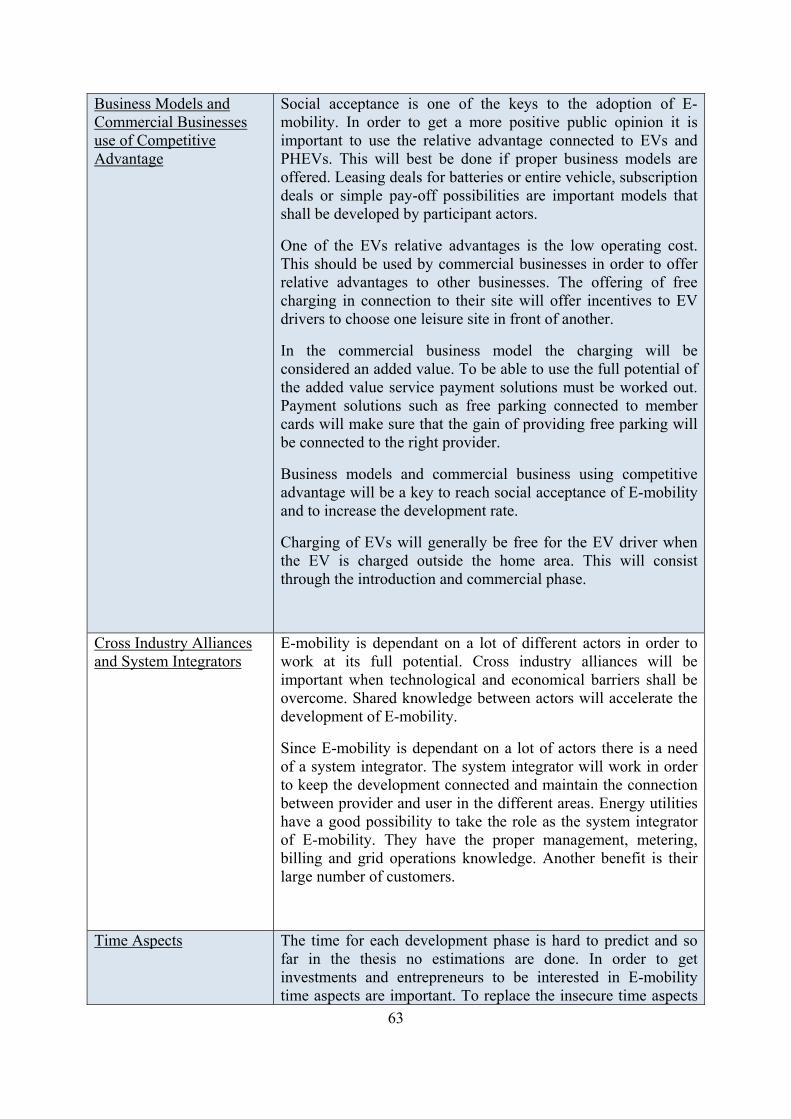
63
Business Models and Commercial Businesses use of Competitive Advantage
Social acceptance is one of the keys to the adoption of E-mobility. In order to get a more positive public opinion it is important to use the relative advantage connected to EVs and PHEVs. This will best be done if proper business models are offered. Leasing deals for batteries or entire vehicle, subscription deals or simple pay-off possibilities are important models that shall be developed by participant actors.
One of the EVs relative advantages is the low operating cost. This should be used by commercial businesses in order to offer relative advantages to other businesses. The offering of free charging in connection to their site will offer incentives to EV drivers to choose one leisure site in front of another.
In the commercial business model the charging will be considered an added value. To be able to use the full potential of the added value service payment solutions must be worked out. Payment solutions such as free parking connected to member cards will make sure that the gain of providing free parking will be connected to the right provider.
Business models and commercial business using competitive advantage will be a key to reach social acceptance of E-mobility and to increase the development rate.
Charging of EVs will generally be free for the EV driver when the EV is charged outside the home area. This will consist through the introduction and commercial phase.
Cross Industry Alliances and System Integrators
E-mobility is dependant on a lot of different actors in order to work at its full potential. Cross industry alliances will be important when technological and economical barriers shall be overcome. Shared knowledge between actors will accelerate the development of E-mobility.
Since E-mobility is dependant on a lot of actors there is a need of a system integrator. The system integrator will work in order to keep the development connected and maintain the connection between provider and user in the different areas. Energy utilities have a good possibility to take the role as the system integrator of E-mobility. They have the proper management, metering, billing and grid operations knowledge. Another benefit is their large number of customers.
Time Aspects The time for each development phase is hard to predict and so far in the thesis no estimations are done. In order to get investments and entrepreneurs to be interested in E-mobility time aspects are important. To replace the insecure time aspects
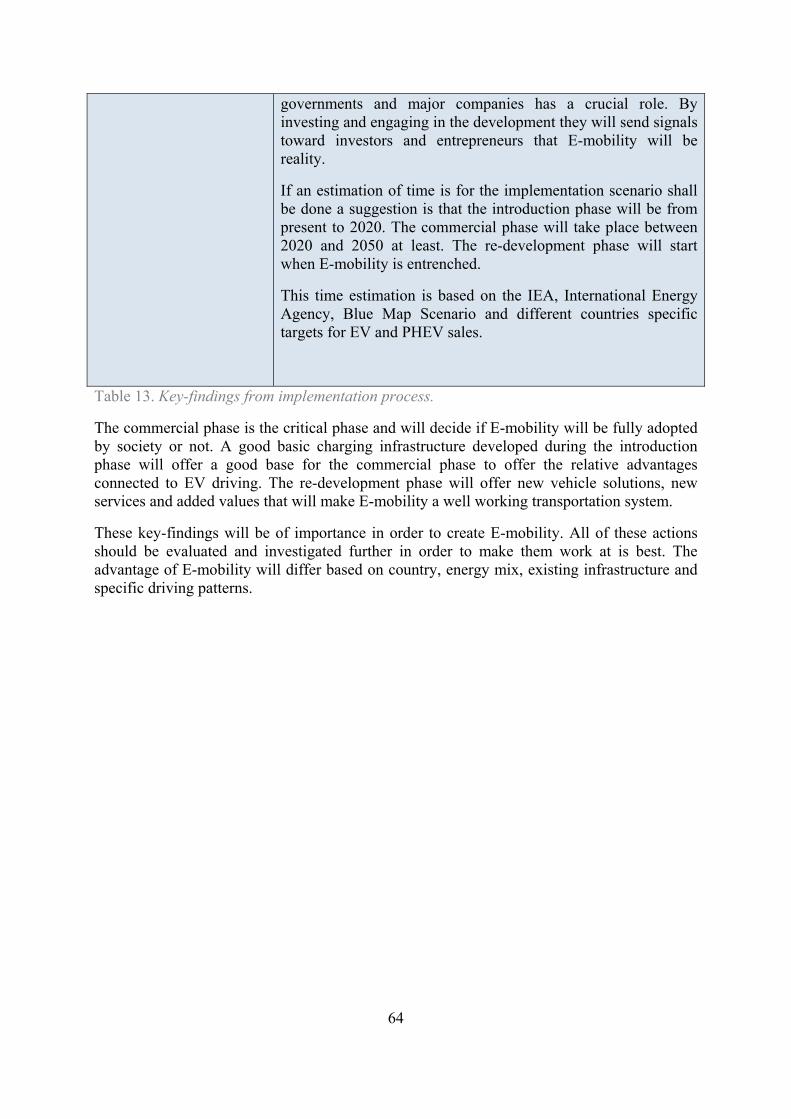
64
governments and major companies has a crucial role. By investing and engaging in the development they will send signals toward investors and entrepreneurs that E-mobility will be reality.
If an estimation of time is for the implementation scenario shall be done a suggestion is that the introduction phase will be from present to 2020. The commercial phase will take place between 2020 and 2050 at least. The re-development phase will start when E-mobility is entrenched.
This time estimation is based on the IEA, International Energy Agency, Blue Map Scenario and different countries specific targets for EV and PHEV sales.
Table 13. Key-findings from implementation process.
The commercial phase is the critical phase and will decide if E-mobility will be fully adopted by society or not. A good basic charging infrastructure developed during the introduction phase will offer a good base for the commercial phase to offer the relative advantages connected to EV driving. The re-development phase will offer new vehicle solutions, new services and added values that will make E-mobility a well working transportation system.
These key-findings will be of importance in order to create E-mobility. All of these actions should be evaluated and investigated further in order to make them work at is best. The advantage of E-mobility will differ based on country, energy mix, existing infrastructure and specific driving patterns.
65
8. Conclusions The overall conclusion that can be drawn is that E-mobility is a reality for future personal transportation and that it offers a lot of benefits. There are although some major barriers that has to be overcome in order to gain from these benefits. The two main barriers are economical and social. The right charging infrastructure and interaction from active participants will be a way to overcome these barriers. In order to provide proper charging infrastructure it is important to understand patterns in society and how people react to different incentives. The implementation of E-mobility must be based on this. The shift to E-mobility is a major transition that will open up new markets and offer business opportunities during the development phase. These new opportunities are important to take advantage of and use in the implementation work. The transition will be dependant on governmental interaction. At the same time it is important that when E-mobility is adopted it will continue to develop without governmental involvement.
The social factors are connected to perceptions of traveling based on historic needs and predetermined opinions. The average operating range needed in Europe is 40 km and that is a range that can be provided by EVs today without the need to recharge. This and other facts concerning advantages that EVs have, has to be communicated to society in a proper way. The best way to get a positive opinion of EVs is to offer public try-out session and demonstrations in connection to hearings and information actions. The important target groups is the early adopters and the early majority, people that are interested in EVs and do not actively look for obstacle and barriers connected to E-mobility.
The economical barriers are mainly connected to the high initial cost of vehicles. This cost will decrease when large scale production of batteries and EV starts. But for this to happen there is a need for an EV market in order for vehicle OEMs to invest in the development. In this governments play a vital role in equipping their vehicle fleets with EVs and provide charging infrastructure in connection to workplace. Governmental involvement will be important in order to send signals to OEMs that the EV market is worth investing in. Governments should also provide subsidies and tax benefits for major companies and individuals that are interested in investing in EVs.
The transition toward E-mobility shall focus on providing charging infrastructure that corresponds to the needs of an EV. The PHEV shall be seen as a complement and supportive vehicle to EVs. If the infrastructure is developed after the needs of PHEVs there is a strong possibility that there will be stagnation in the development. The PHEV will although play an important role as a long distance vehicle in the transition toward full E-mobility.
A transition to E-mobility will be based on three main phases; introduction phase, commercial phase and re-development phase. These phases serve different purpose but have the final aim in common, to promote E-mobility. In each of these phases involvement from utilities and governments will play an important role. To ensure that the actions taken in each phase have a positive effect on the overall development it is important that they are based on social, economical, technological and environmental factors. The different phases have in common that the charging will be provided for free, at least in the introduction and commercial phase. When charging take place during night in the driver’s private garage the cost will end up on the bill but at commercial sites or at parking lots the provider of the parking area will have to stand for the charging cost or it will be included in the regular parking fee.

66
The main purpose of the introduction phase is to provide conditions for the EV development in a later phase. During the introduction phase governments and major companies shall invest in EVs for their vehicle fleet. For companies involved in the transition toward E-mobility, this phase can be used in R&D purposes as well as in providing try-out sessions and hearings with the public. The introduction phase has no short term economic gain but offer time in order to develop roaming deals, standardization of components and joint businesses that will ensure economic gain in long term scenarios. Active participating in the introduction phase will offer a head start when the development moves on and E-mobility becomes more adopted by society. Standardization of characteristics connected to charging possibilities will be highly important. A stand-alone organization such as ISO could help in order to reach an agreement.
In the commercial phase business models will be essential for the adoption of E-mobility to society. To use charging as competitive advantage will provide commercial business incentives to invest in EV charging. Charging at commercial spots will be an incentive that corresponds to high rated incentives by society, economic gain offered often. For commercial business there will also be a need to complement the commercial charging with payment solutions. Payment solutions will connect the benefits from providing charging back to the correct provider. During this phase cross industry alliances will be promoted in order to develop added value services besides charging. In the commercial phase the B2C markets will open up and there must be incentives for potential EV drivers.
During the commercial phase leasing deals between manufactures and companies as well as between manufactures and individuals will be important to cut the initial cost of an EV and further increase the production of EVs. Cross industry alliances between OEMs and banks will offer affordable EVs. Cross industry alliances will during this phase also serve the purpose of developing solutions and services that will put extra value to driving an EV. To use knowledge from different business areas and apply to a common solution will be important for the development of charging equipment. Business models that are oriented toward decoupling the use of a vehicle from owning it will evolve.
If the development toward E-mobility and E-mobility itself shall work there is need for a system integrator. Energy utilities have the proper knowledge and customer circles to take this role. The system integrator will be a very important role in a society based on E-mobility. The commercial phase is the most important phase if E-mobility shall be adopted by society but will only be possible if the introduction phase has offered suitable conditions.
The re-development will start the process all over again. E-mobility will be target for efficiency development and societies like V-2-G will evolve.
This thesis suggests an implementation plan and actions that shall be taken over a long time and actively be evaluated against the current state of development. It is important that E-mobility is a disruptive technology and need to be handled based on that. The presented barriers are hard to overcome and they will vary depend on national and local conditions. Therefore the suggested actions must be evaluated and designed based on countries given conditions.

67
9. References Abrahamson, H., 2009., Ansvarslöst tala om marknadsklar elbil, Ny Teknik [Online]. Available at: NyTeknik http://www.nyteknik.se/nyheter/fordon_motor/bilar/article597866.ece [Accessed 2009-09-25] Abuelsamid, S., 2009. France to spend €2,5 billion to jump start EV deployment, Greenautoblog. [Online] Available at: http://green.autoblog.com/2009/10/02/france-to-spend-2-5-billion-to-jump-start-ev-deployment/ [Accessed: 2009-11-12] ACEA, 2009a. Vehicles in use, European Automobile Manufactures’ Association. [Online] Available at: http://www.acea.be/index.php/news/news_detail/vehicles_in_use/ [Accessed: 2010-01-18] ACEA, 2009b. The European vehicle fleet composition, European Automobile Manufactures’ Association. [Online] Available at: http://www.acea.be/images/uploads/files/20090529_european_vehicle_fleet.pdf [Accessed: 2010-01-18] Adams W.M., Professor of Conservation and Development, Department of Geography, University of Cambridge, UK Available at: http://cmsdata.iucn.org/downloads/iucn_future_of_sustanability.pdf [Accessed: 2009-09-09] Andersen, PH., Mathews, JA., & Rask, M., 2009. Integrating private transport into renewable energy policy: The strategy of creating intelligent recharging grids for electric vehicles. Energy policy. [Online] vol. 37, pp. 2481-2486 Available at: Sciencedirect.com Arthur, WB., 2007. The struture of invention, Research Policy, [online]. Vol. 36, pp. 274-287. Available at: Sciencedirect.com Automotor, 2008. Andelen Diesel bilar på väg ned?, Auto motor & sport [webpage] Available at: http://www.automotorsport.se/news/14499/andelen-dieselbilar-på-väg-ned/ [Accessed: 2009-11-05] BERR, 2008. Investigation into the scope for the transport sector to switch to electric vehicles and plug-in hybrid vehicles, Department for Business Enterprise & Regulatory Reform, [online]. Available at: http://www.berr.gov.uk/files/file48653.pdf [Accessed: 2009-10-20] Better Place, 2009. The solution, Better Place. [Online] Available at: http://www.betterplace.com/solution/ [Accessed: 2009-10-01] Broussely, M. & Archdale, G., 2004. Li-ion batteries and portable power source prospects for the next 5-10 years, Journal of Power Sources, [online]. vol 136, pp. 386-394. Available at: Sciencedirect.com Chalk, S.G., & Miller, J.F., 2006. Key challenges and recent progress in batteries, fuel cells, and hydrogen storage for clean energy systems, Journal of Power Sources, [online]. No 159, pp. 73-80. Available at: sciencedirect.com Churchman, CW., 1968. The systems approach, Dell pub.co., New York. pp. 1-47 Available at: Sciencedirect.com Christensen, CM., 1997. The Innovators dilemma. Harvard Business School Press. ISBN: 978-0-87584-585-2
68
Cowan, R. & Hulthen, S., 1996. Escaping lock-in: The case of electrical vehicle, Technological forecasting and social change, [Online]. Vol. 53, pp. 61-79 Available at: Sciencedirect.com Dahmén, E., 1989., Development blocks in industrial economics, Development Blocks and Industrial Transformation’ In Industrial dynamics, technological organizational, and structural changes in industries and firms. Edited by Bo Carlsson pp. 109-122 Daly, HE. & Farley, J., 2004. Ecological Economics – Principles and applications, Island Press. ISBN 1-55963-312-3 Dosi, G., 1982. Technological paradigms and technological trajectories, Research Policy, [Online]. vol. 11, pp. 147-162 Available at: Sciencedirect.com Duke, M., Andrews, D. & Anderson, T., 2009. The feasibility of long range battery electric cars in New Zealand, Energy Policy,[Online]. Vol. 37, pp. 3455-3462 Available at: Sciencedirect.com EABEV, 2009. Energy consumption, CO2 emissions and other considerations related to Battery Electric Vehicles, European Association for Battery Electric vehicles. [Online] Available at: http://ec.europa.eu/transport/strategies/doc/2009_future_of_transport/contributions/20090408_eabev_%28scientific_study%29.pdf [Accessed: 2009-10-22] EC, 2009a. European Commission. Regulation; setting emission performance standards for new passenger cars as apart of the community’s integrated approach to reduce CO2 emission from light duty vehicles [Online] Available at: http://eur-lex.europa.eu/LexUriServ/LexUriServ.do?uri=OJ:L:2009:140:0001:0015:EN:PDF [Accessed: 2009-09-09] EC, 2009b. European Commission on Climate. The climate action and renewable energy package [webpage] Available at: http://ec.europa.eu/environment/climat/climate_action.htm [Accessed: 2009-09-08] EC, 2009c. European Commission on a sustainable future of transport. Towards an integrated, technology-led and user friendly system. Publications office of the European Union, ISBN 978-92-79-13114-1 Available at: http://ec.europa.eu/transport/publications/doc/2009_future_of_transport.pdf [Accessed: 2009-10-06] Edding, J., 2009. Förstudie avseende behov, placering och kostnad för uppsättning av stolpar för anslutning och uppladdning av elhybridfordon, Huddinge Kommunstyrelse [Online] Available at: http://www.huddinge.se/upload/PolitikOdemokrati/Kstyrelse/Dokument/Kallelser/2009/2009-05-25/Förstudie%20för%20laddstolpar%20-%20tjut%20_2_.pdf [Accessed: 2009-11-20] Elforsk, 2008. Elforsk rapport 09:40, Plug in road 2020. [Online] Available at: http://www.powercircle.org/se/Attachments/34/org/09_40_rapport_screen.pdf [Accessed:2009-11-10 ] ER, 2009. Kunskapsunderlag Angående Marknaden för Elfordon och Laddhybrider, Statens energimyndighet. [Online] Available at: [Accessed: 2009-11-12]

69
EU, 2009. The Future of transportation, Focus Group, [Online] Available at: http://ec.europa.eu/transport/strategies/doc/2009_future_of_transport/2009_the_future_of _transport.pdf [Accessed: 2009-10-05] Euractive, 2004. Euro 5 emission standards for cars, Available at: http://www.euractiv.com/en/transport/euro-5-emissions-standards-cars/article-133325 [Accessed: 2009-11-6] Eurostat, 2009. Motorisation rate, European Commission Available at: http://epp.eurostat.ec.europa.eu/tgm/table.do?tab=table&init=1&language=en&pcode=tsdpc340&plugin=1 [Accessed:2009-09-16] EV, 2009. French Government Announces 2.2 Billion USD EV Initiative, Ev.com. [Online] Available at: http://www.ev.com/ev-news/global-news/french-government-announces-2-2-billion-usd-ev-initiative.html Accessed: 2009-11-12 EVSwe, 2008. Elmotorn dödade elbilen, EV Sweden. Available at: http://evworld.com/international/sverige/index.cfm?link=ROLIGA%20FAKTA [Accessed: 2009-09-25] EVSwe, 2009. Varför el-drift, EV Sweden. Available at: http://evworld.com/international/sverige/index.cfm?link=VARF%C3%96R%20ELDRIFT [Accessed: 2009-09-22] Gaines, L., & Cuenca, R., 2000. Cost of Lithium-Ion batteries for vehicles, United States Department of Energy. Center for Transportation Research Argonne National Laboratory, [online] Available at: http://www.transportation.anl.gov/pdfs/TA/149.pdf [Accessed: 2009-10-21] Gilbert, R., Fleet, B. and K. Li, J., 2008. Situation Analysis for the Current State of Electric Vehicle Technology, Natural Resources Canadian Electric Vehicle Industry. [Online]. Available at: [Accessed: 2009-11-11] GLG 2009. Nissan breaks silence on lithium consumption, Gerson Lehrman Group. [Online] Available at: www.glgroup.com/News/Nissan-breaks-silence-on-lithium-consumption-42764.html [Accessed: 2009-10-20] Hillman, KM., & Sandén BA, 2008, Exploring technology paths: The development of alternative transport fuels in Sweden 2007-2020. Technological Forecasting and Change’, vol. 75, pp. 1279-1302. Available at: Sciencedirect.com Hoyer, KG., 2007. The history of alternative fuels in transportation: The case of electric and hybrid cars, Utilities Policy, [online], vol. 16, pp. 63-71. Available at: Sciencedirect.com Hybridcenter, 2007a. Hybrids Under the Hood, part 1. Hybridcenter.org Available at: www.hybridcenter.org/hybrid-center-how-hybrid-cars-work-under-the-hood.html#1_IdleOff [Accessed: 2009-09-11] Hybridcenter, 2007b. Hybrids Under the Hood, part 2. Hybridcenter.org Available at: www.hybridcenter.org/hybrid-center-how-hybrid-cars-work-under-the-hood-2.html [Accessed: 2009-09-11]
70
Håkansson, E., 2009., Jämförelse av energieffektivitet mellan olika typer av bilar, EV World Sverige, [Online] Available at: http://evworld.com/international/sverige/index.cfm?link=VARFÖR%20ELDRIFT [Accessed: 2009-09-23] IEA, 2009. Technology Roadmap: Electric and plug-in hybrid electric vehicles, International Energy Agency. Available at: http://www.iea.org/papers/2009/EV_PHEV_Roadmap.pdf [Accessed: 2009-12-18] IPCC, 2007: Summary for Policymakers. In: Climate Change 2007: The Physical Science Basis. Contribution of Working Group I to the Fourth Assessment Report of the Intergovernmental Panel on Climate Change, [online] [Solomon, S., D. Qin, M. Manning, Z. Chen, M. Marquis, K.B. Averyt, M.Tignor and H.L. Miller (eds.)]. Cambridge University Press, Cambridge, United Kingdom and New York, NY, USA. Available at: http://www.ipcc.ch/pdf/assessment-report/ar4/wg1/ar4-wg1-spm.pdf [Accessed: 2009-09-09] IUCN, 2006. The future of sustainability: Re-thinking Environment and Development in the Twenty-first Century. The world conservation union [online] Jacqout, JE., 2008. Out Nano-ing the Nano: Tara’s Tiny to be the world cheapest car. Treehugger [Online] Available at: http://www.treehugger.com/files/2008/02/out_nanoing_the.php [Accessed: 2010-01-20] Kyler, J., 2002. Assessing your external environment: STEEP analysis. Competia.com [Online] Vol. 33 Available at: http://www.mbaboost.com/content/177/ [Accessed: 2009-11-26] Landahl, G. & Sunnerstedt, E., 2009. Promoting clean cars: A case study of Stockholm and Sweden, Project BEST. Available at: http://www.best-europe.org/upload/BEST_documents/incentives/D.5.12%20Promoting%20Clean%20Cars%20Report.pdf [Accessed: 2009-11-30] Lindholm, K., 2008. Miljö och klimat, Svensk Energi. Available at: http://www.svenskenergi.se/sv/Om-el/Miljo-och-klimat/Klimatpaverkan/koldioxidutslapp/ [Accessed: 2009-09-16 ] Nightinggale, P., 1998. A cognitive model of innovation, Research Policy, vol. 27, pp. 689-709 Available at: Sciencedirect.com NE, 2009a. Ackumulator, National Encyklopedin.[Online] Available at: http://ne.se/lang/ackumulator/107858 [Accessed: 2009-09-15] NE, 2009b. Energidensitet I primär- och laddningsbara batterier, National Encyklopedin. Available at: http://ne.se/lang/batteri/124967/190016 [Accessed: 2009-09-15] Offer, GJ., Howey, D., Contestabile, M., Clauge, R. & Brandon, NP. 2010. Comparative analysis of battery electric, hydrogen fuel cell and hybrid vehicles in a future sustainable road transport system, Energy Policy, [Online]. Vol. 38, pp. 24-29. Available at: Scincedirect.com Petersen, J., 2009. Lithium-ion Batteries: 9 years of price stagnation, Seeking Alpha, [Online]. Available at: http://seekingalpha.com/article/129570-lithium-ion-batteries-9-years-of-price-stagnation [Accessed: 2009-10-20]

71
Schumpeter, J., 1947. Trilogy of invention. Available at: Sciencedirect.com Rogers, EM, 1995, ‘Diffusion of innovation’, The Free Press Available at: Sciencedirect.com Romm, J., 2006. The Car and fuel of the future, Energy Policy [Online]. Vol. 34, pp. 2609-2614 Available at: Sciencedirect.com Sovacool, BK., 2009. Introduction to: Sound climate, energy, transport policy for a carbon constrained world, Policy and Society, [Online]. No. 27, pp. 273-283 Available at: Sciencedirect.com Sovacool, BK and Hirsh, RF, 2009. Beyond batteries: An examination of the benefits and barriers to plug-in hybrid electrical vehicles (PHEVs) and a vehicle to grid (V2G) transition, Energy Policy, [online], vol. 37, pp. 1095-1103. Available at: Scinecedirect.com Stern, N., 2007. The Economics of Climate Change- The Stern Review, Cabinet Office-HM Treasury, Great Britain, Cambridge University Press [Accessed: 2009-11-12] Sunnerstedt, E & Hugosson, B., 2009. Strategi för elbilar och laddhybrider, Stockholm Stad Miljö förvaltningen, [Online]. pp. 7 Available at: http://insyn.stockholm.se/miljo/document/2009-05-13/Dagordning/20/20.pdf [Accessed 2009-09-25] SvD, 2009, Batteritillverkare, Svenska Dagbladet [Online] Availble at: http://www.svd.se/naringsliv/motor/artikel_3273251.svd [Accessed at:2009-10-05] Swärd, L., 2009. Frågor och svar om elbilar, DN: Allt om motor. Available at: http://www.alltommotor.se/guider/allt-om-elbil-fragor-och-svar-1.12401 [Accessed: 2009-09-16] Söderlind, A., 2009. Närkontakt, Auto Motor Sport. Vol. 20 pp. 90-94. Available at: http://193.41.214.79/news/19460/electroengines-saab-9-3-med-eldrift--provkörd/ [Accessed:2009-11-25] Tollefson, J., 2008. Charging up the future, Nature, [Online] Vol. 456, pp. 436-440 Available at: http://www.nature.com/news/2008/081126/full/456436a.html [Accessed: 2009-10-05] Wedberg, E., 2009. McDonalds bygger nät för laddning av el-bilar, Teknikens Värld, [Online] Available at: http://www.teknikensvarld.se/nyheter/090430-mcdonalds-elbilar/index.xml [Accessed: 2010-01-24] Van Mierlo, J. & Maggetto, G., 2007., Fuel cell or battery: Electric cars are the future, Fuel Cells 07, [Online]. No.2, pp. 165-173 Available at: Wiley InterScience; interscience.wiley.com Vandervelde, J., 2009. Korean EV runs without batteries by induction charging. All Cars electric, [Online] Available at: http://www.allcarselectric.com/blog/1034778_korean-ev-runs-without-batteries-by-induction-charging [Accessed: 2009-12-16]
72
Vattenfall, 2008. Vattenfall är med och testar elbilar, Vattenfall AB ”Forskning och Utveckling”. [Online] Available at: http://www.vattenfall.se/www/vf_se/vf_se/518304omxva/518334vxrxv/523254forsk/819906elxix/1492381vatte/index.jsp?WT.ac=search_success [Accessed: 2009-11-30] Vaughan, A. & van der Zee, B., 2009. Nissans plug-free electric car. The Guardian, [Online] Available at: http://www.guardian.co.uk/business/2009/jul/20/nissan-electric-car-plug-free [Accessed: 2009-12-16] Personal Contacts Frieser, U. Personal discussion with Ulrich Frieser from Vattenfall Business Group Pan-Europe. [Date: 2009-11-25] Gunnarsson 2009. E-mail correspondence with Ingvar Gunnarsson from Scandinavian Electrics. [Date: 2009-12-23] Hannander 2009. E-mail correspondence with Max Hannander from Trivector Traffic AB. [Date: 2009-12-11] Johansson, 2009a. E-mail correspondence with Olle Johansson, project coordinator Power Circle [Date:2009-11-] Johansson, 2009b. Personal discussion with Olle Johansson, project coordinator Power circle. [Date: 2009-11-23] Söderbom, 2009. E-mail korrespondens med Johan Söderbom, Vattenfall AB. [Date: 2009-11-22]
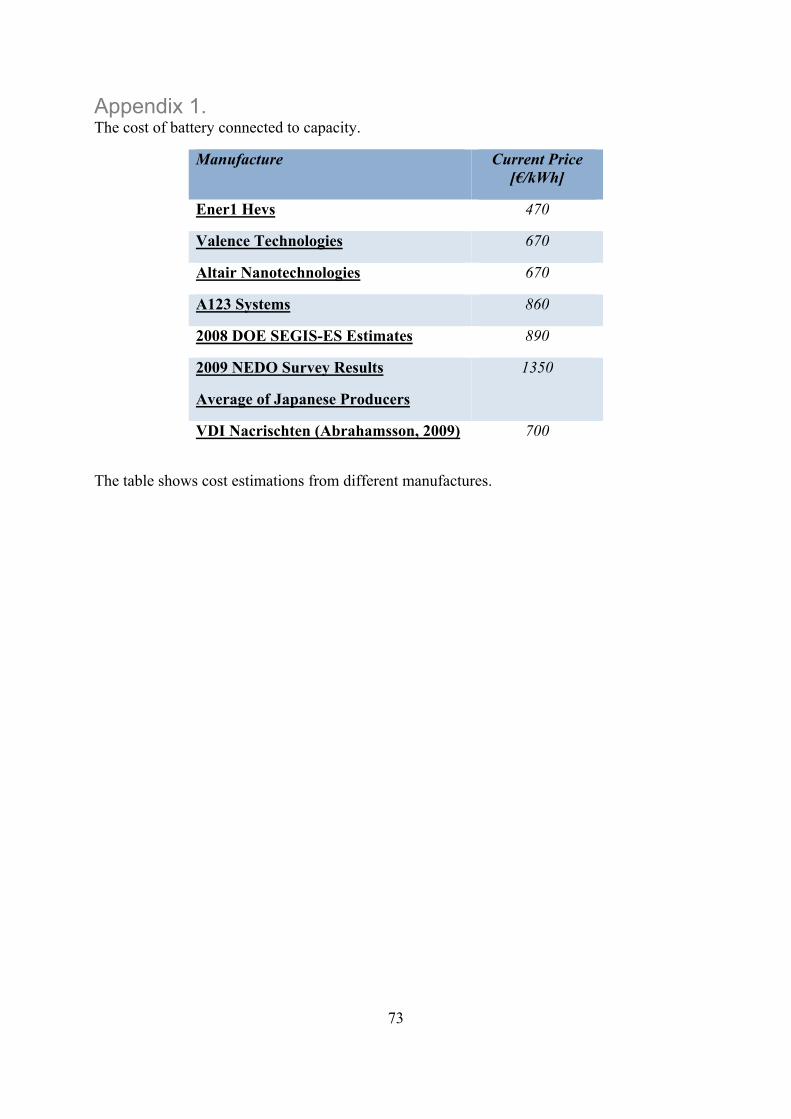
73
Appendix 1. The cost of battery connected to capacity.
Manufacture Current Price [€/kWh]
Ener1 Hevs 470
Valence Technologies 670
Altair Nanotechnologies 670
A123 Systems 860
2008 DOE SEGIS-ES Estimates 890
2009 NEDO Survey Results
Average of Japanese Producers
1350
VDI Nacrischten (Abrahamsson, 2009) 700
The table shows cost estimations from different manufactures.

74
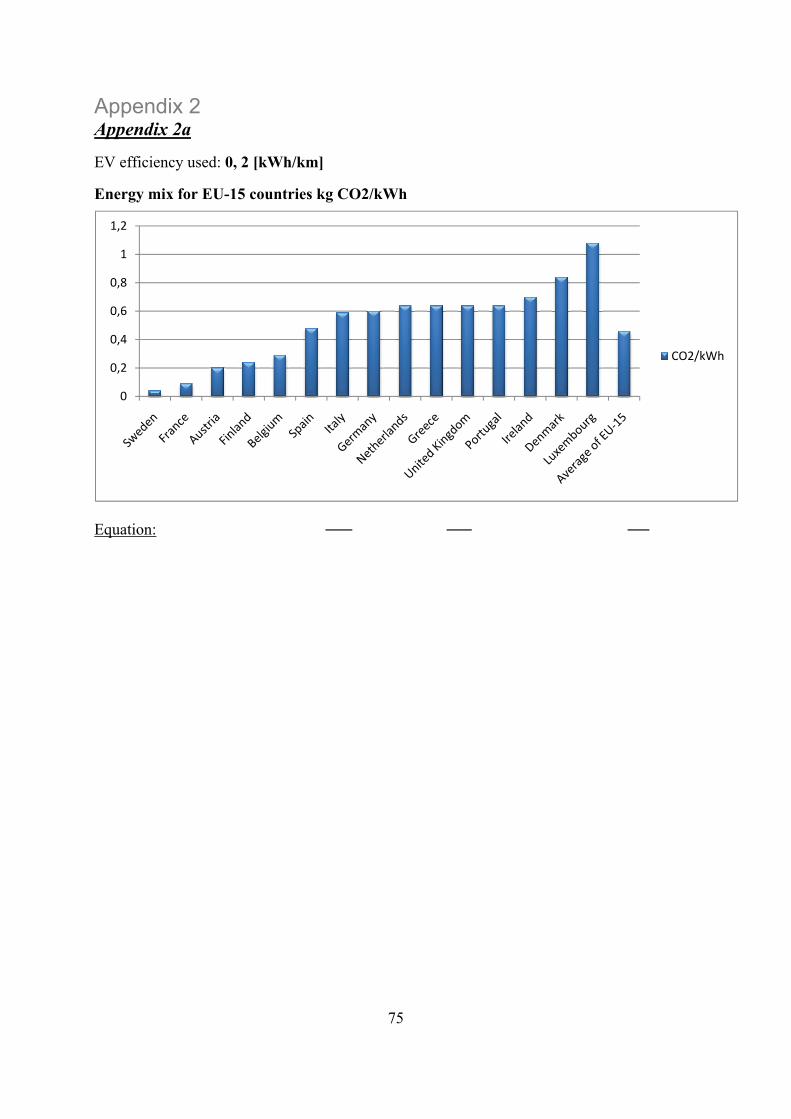
75
Appendix 2 Appendix 2a
EV efficiency used: 0, 2 [kWh/km]
Energy mix for EU-15 countries kg CO2/kWh
Equation:
0
0,2
0,4
0,6
0,8
1
1,2
CO2/kWh

76
Appendix 2b EV efficiency used: 0, 2 [kWh/km]
Price of electricity
Equations:
EV operating cost:
IC-car and Diesel car:
Operating range:
0
5
10
15
20
25
30EU
-27
EU-1
5 BE BG CZ DK
DE EE IE EL ES FR IT CY LV LT LU HU
MT
NL
AT PL PT RO SI SK FI SE UK
€pe
r 10
0 kW
h

77
Appendix 3. The cost calculations used to determine the cost of equipping a parking lot with EV charging equipment.
Charging equipment cost used in calculations, a compilation of different manufactures estimates.
Model Tallykey Scandinavian Electric
Elforsk Trivector YIT Abrahamsson
Easiest Solution
- - - 200-500 300-500
Simple Pole - 1 000 700 - 800- 1 000
700
Pole with payment equipment
2 500 2 150 1 200 2 000 -
Credit Card Pole
- 140 000 - - -
Transformer (Delta Voyage)
- - - 3 000 -
Installation Work (10 spots)
5 000 -
Appendix 3a
Parking lot alternative calculations
The basic conditions for the parking lot are good, there are pre-installed engine heathers and proper connection to the grid. The installation cost will only depend on the amount of charging spots and time needed for installation.
• Installation costs will be set to € 200 for installation of 10 chargers.
The charging spots will be of the more robust and un-advanced kind, no payment system is needed but perhaps some lock possibility. It is positive if the spot can handle both 10 Amps and 16 Amps.
The design of the charging spot shall fulfill a symbolic value and communicate that it is a charger for EVs in order to gain good will.
• The equipment cost will be € 300-500 a piece. (If a pole or more a communicative spot is wanted the price will increase significantly).
78
The maintenance of these chargers will be low since there are no advanced components. Wear and tear will not be that significant but potential sabotage is always a determining factor.
• Maintenance costs are set to a yearly cost of € 200 for 10 chargers.
The total initial cost for installing 10 regular charging spots on a parking lot with good basic conditions is;
• The total cost is € 3 500 – 5 500. (Used in thesis € 4 500).
Appendix 3b
Parameters used in pay-back calculations:
Used figures
Average driving: 40 km Days per year: 200
Gasoline cost: € 12/ L Electricity cost: € 0, /kWh
IC-car efficiency: 0, 07 L/ km EV efficiency: 0,75kWh/km
Needed gasoline: 2, 8 L Needed electricity: 30 kWh
Pay-Back Calculation for an EV fleet consistent of 10 EVs:
Initial Cost Charging Equipment = € 4300.
Daily Propulsion Cost EV = € 60.
Daily Propulsion Cost IC-car = € 340.
Daily Propulsion Cost Difference = + € 280.
Pay-Back Time = Initial Charging Equipment / Daily Propulsion Cost Difference
Pay-Back Time ≈ 15 days, 3 working weeks.
Appendix 3c
Commuter alternative calculations
The basic conditions for the parking lot are good, there are an existing grid that the charging equipment can be connected to. Some work to draw cables and cover them up must be done.
• Installation cost will be set to € 5 000 for installation of 10 charging poles.
This scenario sets higher demands on the charging equipment since the charging poles shall be used by different users but also shall the cost for the electricity be divided between different providers. Some kind of payment system will be used and some sort of access function is needed.

79
• The charger will cost from € 700 - 1000 and provide the easiest form of payment solution through member card.
The maintenance cost will be based on how functional the software is and how the payment is solved.
• Maintenance costs are set to a yearly cost of € 1 000 for 10 chargers.
The total initial cost for installing 10 regular charging poles is;
• The total cost is € 9 500-11 000. (Used in thesis € 10 000).
Appendix 3d
Shopping Mall Alternative Calculations
The basic connections are similar to the parking lot alternative, a large open area with a nearby grid. Motor heaters are not existent.
• Installation cost will be set to € 5 000 for installation of 10 charging poles.
The demands on the charging equipment will be quiet high.
• Equipment cost are set to € 2 500 for 5 charger with 2 outlets each. Additional cost transformer for delta voltage, cost € 3 000.
The maintenance cost will be based on how functional the software is and how the payment is solved.
• Maintenance costs are set to a yearly cost of € 1 500 for 10 chargers.
The total initial cost for installing 10 regular charging poles is;
• The total cost is € 21 500. (Used in thesis € 21 500).
Appendix 3e
V-2-G preparation and calculations
500 MWh / 10 kWh = 50 000 vehicles.
The EVs has a battery capacity of 20 kWh, 10 of these 20 can be used during peak hours. This leave the EV with half the battery left charged that can provide operation rang if needed.

80


TRITA-IM 2010:07 ISSN 1402-7615 Industrial Ecology, Royal Institute of Technology www.ima.kth.se