Embed Size (px)
Citation preview

Developing ImprovedCivil Aircraft Arresting Systems
AIRPORTCOOPERATIVE RESEARCH PROGRAMACRP
REPORT 29
Sponsored by the Federal Aviation Administration

TRANSPORTATION RESEARCH BOARD 2009 EXECUTIVE COMMITTEE*
OFFICERS
CHAIR: Adib K. Kanafani, Cahill Professor of Civil Engineering, University of California, Berkeley VICE CHAIR: Michael R. Morris, Director of Transportation, North Central Texas Council of
Governments, ArlingtonEXECUTIVE DIRECTOR: Robert E. Skinner, Jr., Transportation Research Board
MEMBERS
J. Barry Barker, Executive Director, Transit Authority of River City, Louisville, KYAllen D. Biehler, Secretary, Pennsylvania DOT, HarrisburgLarry L. Brown, Sr., Executive Director, Mississippi DOT, JacksonDeborah H. Butler, Executive Vice President, Planning, and CIO, Norfolk Southern Corporation,
Norfolk, VAWilliam A.V. Clark, Professor, Department of Geography, University of California, Los AngelesDavid S. Ekern, Commissioner, Virginia DOT, RichmondNicholas J. Garber, Henry L. Kinnier Professor, Department of Civil Engineering, University of
Virginia, CharlottesvilleJeffrey W. Hamiel, Executive Director, Metropolitan Airports Commission, Minneapolis, MNEdward A. (Ned) Helme, President, Center for Clean Air Policy, Washington, DCRandell H. Iwasaki, Director, California DOT, SacramentoSusan Martinovich, Director, Nevada DOT, Carson CityDebra L. Miller, Secretary, Kansas DOT, TopekaNeil J. Pedersen, Administrator, Maryland State Highway Administration, BaltimorePete K. Rahn, Director, Missouri DOT, Jefferson CitySandra Rosenbloom, Professor of Planning, University of Arizona, TucsonTracy L. Rosser, Vice President, Regional General Manager, Wal-Mart Stores, Inc., Mandeville, LARosa Clausell Rountree, CEO–General Manager, Transroute International Canada Services, Inc.,
Pitt Meadows, BCSteven T. Scalzo, Chief Operating Officer, Marine Resources Group, Seattle, WAHenry G. (Gerry) Schwartz, Jr., Chairman (retired), Jacobs/Sverdrup Civil, Inc., St. Louis, MOC. Michael Walton, Ernest H. Cockrell Centennial Chair in Engineering, University of Texas, AustinLinda S. Watson, CEO, LYNX–Central Florida Regional Transportation Authority, OrlandoSteve Williams, Chairman and CEO, Maverick Transportation, Inc., Little Rock, AR
EX OFFICIO MEMBERS
Thad Allen (Adm., U.S. Coast Guard), Commandant, U.S. Coast Guard, Washington, DCPeter H. Appel, Administrator, Research and Innovative Technology Administration, U.S.DOTJ. Randolph Babbitt, Administrator, Federal Aviation Administration, U.S.DOTRebecca M. Brewster, President and COO, American Transportation Research Institute, Smyrna, GAGeorge Bugliarello, President Emeritus and University Professor, Polytechnic Institute of New York
University, Brooklyn; Foreign Secretary, National Academy of Engineering, Washington, DCJames E. Caponiti, Acting Deputy Administrator, Maritime Administration, U.S.DOTCynthia Douglass, Acting Deputy Administrator, Pipeline and Hazardous Materials Safety
Administration, U.S.DOTLeRoy Gishi, Chief, Division of Transportation, Bureau of Indian Affairs, U.S. Department of the
Interior, Washington, DCEdward R. Hamberger, President and CEO, Association of American Railroads, Washington, DCJohn C. Horsley, Executive Director, American Association of State Highway and Transportation
Officials, Washington, DCRose A. McMurry, Acting Deputy Administrator, Federal Motor Carrier Safety Administration, U.S.DOTRonald Medford, Acting Deputy Administrator, National Highway Traffic Safety Administration,
U.S.DOTVictor M. Mendez, Administrator, Federal Highway Administration, U.S.DOTWilliam W. Millar, President, American Public Transportation Association, Washington, DCPeter M. Rogoff, Administrator, Federal Transit Administration, U.S.DOTJoseph C. Szabo, Administrator, Federal Railroad Administration, U.S.DOTPolly Trottenberg, Assistant Secretary for Transportation Policy, U.S.DOTRobert L. Van Antwerp (Lt. Gen., U.S. Army), Chief of Engineers and Commanding General,
U.S. Army Corps of Engineers, Washington, DC
ACRP OVERSIGHT COMMITTEE*
CHAIR
James WildingIndependent Consultant
VICE CHAIR
Jeff HamielMinneapolis–St. Paul
Metropolitan Airports Commission
MEMBERS
James CritesDallas–Fort Worth International AirportRichard de NeufvilleMassachusetts Institute of TechnologyKevin C. DollioleUnison ConsultingJohn K. DuvalBeverly Municipal AirportKitty FreidheimFreidheim ConsultingSteve GrossmanJacksonville Aviation AuthorityTom JensenNational Safe Skies AllianceCatherine M. LangFederal Aviation AdministrationGina Marie LindseyLos Angeles World AirportsCarolyn MotzHagerstown Regional AirportRichard TuckerHuntsville International Airport
EX OFFICIO MEMBERS
Sabrina JohnsonU.S. Environmental Protection AgencyRichard MarchiAirports Council International—North AmericaLaura McKee Air Transport Association of AmericaHenry OgrodzinskiNational Association of State Aviation OfficialsMelissa SabatineAmerican Association of Airport ExecutivesRobert E. Skinner, Jr.Transportation Research Board
SECRETARY
Christopher W. JenksTransportation Research Board
*Membership as of October 2009.*Membership as of October 2009.

TRANSPORTAT ION RESEARCH BOARDWASHINGTON, D.C.
2009www.TRB.org
A I R P O R T C O O P E R A T I V E R E S E A R C H P R O G R A M
ACRP REPORT 29
Research sponsored by the Federal Aviation Administration
Subject Areas
Aviation
Developing ImprovedCivil Aircraft Arresting Systems
Matthew A. Barsotti
John M. H. Puryear
David J. Stevens
PROTECTION ENGINEERING CONSULTANTS, LLCAustin, TX

AIRPORT COOPERATIVE RESEARCH PROGRAM
Airports are vital national resources. They serve a key role in trans-portation of people and goods and in regional, national, and inter-national commerce. They are where the nation’s aviation systemconnects with other modes of transportation and where federal respon-sibility for managing and regulating air traffic operations intersectswith the role of state and local governments that own and operate mostairports. Research is necessary to solve common operating problems,to adapt appropriate new technologies from other industries, and tointroduce innovations into the airport industry. The Airport Coopera-tive Research Program (ACRP) serves as one of the principal means bywhich the airport industry can develop innovative near-term solutionsto meet demands placed on it.
The need for ACRP was identified in TRB Special Report 272: AirportResearch Needs: Cooperative Solutions in 2003, based on a study spon-sored by the Federal Aviation Administration (FAA). The ACRP carriesout applied research on problems that are shared by airport operatingagencies and are not being adequately addressed by existing federalresearch programs. It is modeled after the successful National Coopera-tive Highway Research Program and Transit Cooperative Research Pro-gram. The ACRP undertakes research and other technical activities in avariety of airport subject areas, including design, construction, mainte-nance, operations, safety, security, policy, planning, human resources,and administration. The ACRP provides a forum where airport opera-tors can cooperatively address common operational problems.
The ACRP was authorized in December 2003 as part of the Vision100-Century of Aviation Reauthorization Act. The primary partici-pants in the ACRP are (1) an independent governing board, the ACRPOversight Committee (AOC), appointed by the Secretary of the U.S.Department of Transportation with representation from airport oper-ating agencies, other stakeholders, and relevant industry organizationssuch as the Airports Council International-North America (ACI-NA),the American Association of Airport Executives (AAAE), the NationalAssociation of State Aviation Officials (NASAO), and the Air TransportAssociation (ATA) as vital links to the airport community; (2) the TRBas program manager and secretariat for the governing board; and (3) the FAA as program sponsor. In October 2005, the FAA executed acontract with the National Academies formally initiating the program.
The ACRP benefits from the cooperation and participation of airportprofessionals, air carriers, shippers, state and local government officials,equipment and service suppliers, other airport users, and research orga-nizations. Each of these participants has different interests and respon-sibilities, and each is an integral part of this cooperative research effort.
Research problem statements for the ACRP are solicited periodicallybut may be submitted to the TRB by anyone at any time. It is theresponsibility of the AOC to formulate the research program by iden-tifying the highest priority projects and defining funding levels andexpected products.
Once selected, each ACRP project is assigned to an expert panel,appointed by the TRB. Panels include experienced practitioners andresearch specialists; heavy emphasis is placed on including airport pro-fessionals, the intended users of the research products. The panels pre-pare project statements (requests for proposals), select contractors, andprovide technical guidance and counsel throughout the life of theproject. The process for developing research problem statements andselecting research agencies has been used by TRB in managing cooper-ative research programs since 1962. As in other TRB activities, ACRPproject panels serve voluntarily without compensation.
Primary emphasis is placed on disseminating ACRP results to theintended end-users of the research: airport operating agencies, serviceproviders, and suppliers. The ACRP produces a series of researchreports for use by airport operators, local agencies, the FAA, and otherinterested parties, and industry associations may arrange for work-shops, training aids, field visits, and other activities to ensure thatresults are implemented by airport-industry practitioners.
ACRP REPORT 29
Project 07-03ISSN 1935-9802ISBN 978-0-309-11813-2Library of Congress Control Number 2009941761
© 2009 National Academy of Sciences. All rights reserved.
COPYRIGHT INFORMATION
Authors herein are responsible for the authenticity of their materials and for obtainingwritten permissions from publishers or persons who own the copyright to any previouslypublished or copyrighted material used herein.
Cooperative Research Programs (CRP) grants permission to reproduce material in thispublication for classroom and not-for-profit purposes. Permission is given with theunderstanding that none of the material will be used to imply TRB or FAA endorsementof a particular product, method, or practice. It is expected that those reproducing thematerial in this document for educational and not-for-profit uses will give appropriateacknowledgment of the source of any reprinted or reproduced material. For other uses ofthe material, request permission from CRP.
NOTICE
The project that is the subject of this report was a part of the Airport Cooperative ResearchProgram conducted by the Transportation Research Board with the approval of theGoverning Board of the National Research Council. Such approval reflects the GoverningBoard’s judgment that the project concerned is appropriate with respect to both thepurposes and resources of the National Research Council.
The members of the technical advisory panel selected to monitor this project and to reviewthis report were chosen for recognized scholarly competence and with due considerationfor the balance of disciplines appropriate to the project. The opinions and conclusionsexpressed or implied are those of the research agency that performed the research, andwhile they have been accepted as appropriate by the technical panel, they are notnecessarily those of the Transportation Research Board, the National Research Council, orthe Federal Aviation Administration of the U.S. Department of Transportation.
Each report is reviewed and accepted for publication by the technical panel according toprocedures established and monitored by the Transportation Research Board ExecutiveCommittee and the Governing Board of the National Research Council.
The Transportation Research Board of the National Academies, the National ResearchCouncil, and the Federal Aviation Administration (sponsor of the Airport CooperativeResearch Program) do not endorse products or manufacturers. Trade or manufacturers’names appear herein solely because they are considered essential to the clarity andcompleteness of the project reporting.
Published reports of the
AIRPORT COOPERATIVE RESEARCH PROGRAM
are available from:
Transportation Research BoardBusiness Office500 Fifth Street, NWWashington, DC 20001
and can be ordered through the Internet at
http://www.national-academies.org/trb/bookstore
Printed in the United States of America


C O O P E R A T I V E R E S E A R C H P R O G R A M S
CRP STAFF FOR ACRP REPORT 29
Christopher W. Jenks, Director, Cooperative Research ProgramsCrawford F. Jencks, Deputy Director, Cooperative Research ProgramsMichael R. Salamone, ACRP ManagerMarci A. Greenberger, Senior Program OfficerEileen P. Delaney, Director of PublicationsDoug English, Editor
ACRP PROJECT 07-03 PANELField of Design
Kevin B. Bleach, Port Authority of New York & New Jersey, New York, NY (Chair)Efren T. Gonzalez, Roanoke Regional Airport Commission, Roanoke, VA Antonio A. Trani, Virginia Polytechnic Institute and State University, Blacksburg, VA Gary Warren, Minneapolis-St. Paul Metropolitan Airports Commission, Minneapolis, MN Xiaosong “Sean” Xiao, Xcel Energy, Substation Engineering and Design, Eden Prairie, MN Michel Hovan, FAA Liaison Ryan E. King, FAA Liaison Richard Marchi, Airports Council International - North America Liaison Christine Gerencher, TRB Liaison
AUTHOR ACKNOWLEDGMENTS
The research reported herein was performed under ACRP Project 07-03 by Protection EngineeringConsultants (PEC).
Mr. Matthew A. Barsotti, M.S., Principal at PEC, was the Principal Investigator (PI). The other authorsof this report were Mr. John M. H. Puryear, M.S., Project Engineer at PEC; and David J. Stevens, Ph.D.,P.E., Senior Principal and Co-PI at PEC. Testing and evaluation support was provided by Mr. Jason Pat-ton, Research Engineer at Southwest Research Institute (SwRI). Supporting research was provided byTimothy Walilko, Ph.D., Senior Engineer at Applied Research Associates (ARA); Subhash Narang, Ph.D.,Principal at Shakti Technologies; Eric B. Williamson, Ph.D., P.E., Associate Professor at the University ofTexas at Austin; and Maria C. Garci Juenger, Assistant Professor at the University of Texas at Austin. Air-port operations consultation was provided by Gordon S. Chace, A.A.E., C.A.E.
The authors wish to acknowledge the assistance provided by Engineered Arresting Systems Corpora-tion (ESCO), which provided valuable data and information regarding the EMAS system.
The authors would also like to acknowledge the companies that generously provided design conceptsand materials for evaluation: Grid Technologies, Inc.; Norsk Glassgjenvinning AS; Pittsburgh Corning;and Tensar International.
The informative airport survey results would not have been possible without the participation of the manyairport management personnel, who painstakingly gathered information regarding their facilities and expe-riences. The Minneapolis-St. Paul Metropolitan Airport Commission and the Port Authority of New Yorkand New Jersey provided site tours and ongoing information to the research team. Many individuals at theFAA provided valuable references and insight, including David Rathfelder, E.C. Hunnicutt, and Ryan King.
Jim Day, P.E., Nielen Stander, Ph.D., and Willem Roux, Ph.D. (Livermore Software Technology Cor-poration) have continually provided outstanding technical help and advice with various LS-DYNA andLS-OPT questions and issues. Oleh Baran, Ph.D. (DEM Solutions) provided ongoing assistance with Dis-crete Element Modeling (DEM) facets of the project.

ACRP Report 29: Developing Improved Civil Aircraft Arresting Systems is a report that evalu-ates alternative materials that could be used for an engineered material arresting system(EMAS), as well as potential active arrestor designs for civil aircraft applications. Currently,there is only one manufacturer that has been approved by the FAA. This report provides anevaluation of (1) cellular glass foam, (2) aggregate foam, (3) engineered aggregate, and (4) amain-gear engagement active arrestor system. Airport operators will find the updated costinformation and performance considerations useful, airport planning firms will be aided byevaluating future options with respect to runway dimensions and land requirements, and man-ufacturers of alternative products will be encouraged to see the performance characteristics ofother materials and the potential process by which they may be able to gain approval.
There are many airports today that are land constrained and therefore unable to complywith FAA design standards to ensure that there is adequate room at runway ends for over-runs. There can be many reasons why an airport does not have the space and would wish topursue an alternative. An EMAS is one such alternative.
However, there is currently only one system that meets the FAA standards for arrestingcivil aircraft. The cost associated with acquiring and installing the cellular material is high,installation is labor-intensive, and there are no tests with which to verify the durability andintegrity over time. There have been several ideas for alternative civil aircraft arresting sys-tems submitted to the FAA; however, none have undergone testing or been submitted withthe appropriate data necessary for approval.
Under ACRP 07-03, Protection Engineering Consultants was asked to (1) identify andevaluate the most promising alternatives, (2) identify the steps that must be taken to havethose alternatives approved for use within the United States, (3) conduct a sensitivity analy-sis of the FAA’s design and performance parameters for civil aircraft arresting systems andthe potential effects on system design that result from varying one or more of the parame-ters (e.g., aircraft leaving the runway at 60 knots rather than 70 knots), and (4) documentthe advantages and disadvantages of each alternative.
This report provides alternatives to the current system, the steps required to pursueapproval, and the performance characteristics of the candidate materials. The research teamaccomplished these objectives in part by (1) conducting a literature review, (2) surveyingairport operators with installed systems, (3) reviewing FAA design parameters and holdingdiscussions with the FAA, and (4) conducting an in-depth engineering evaluation of thearresting capabilities for the candidate systems.
F O R E W O R D
By Marci A. GreenbergerStaff OfficerTransportation Research Board

C O N T E N T S
1 Summary
19 Chapter 1 Introduction19 1.1. Project Background19 1.2. EMAS Nomenclature20 1.3. EMAS Description20 1.4. Research Approach
22 Chapter 2 Literature Review22 2.1. General22 2.2. Historical Aircraft Arrestor Research and Development23 2.3. Recent Arrestor Research23 2.4. Landing Gear and Aircraft Dynamics23 2.5. Airport Operations24 2.6. Accidents and Incidents24 2.7. Financial24 2.8. Patents
25 Chapter 3 Survey of U.S. Airport Operators25 3.1. Site Visits27 3.2. Participating Survey Airports27 3.3. Standard EMAS27 3.4. FAA Requirements28 3.5. Installation31 3.6. Maintenance32 3.7. Observations for Survey Regarding EMAS32 3.8. Perception of Active Arrestor33 3.9. Observations for Survey Regarding Active Arrestors
34 Chapter 4 Review and Documentation of FAA Parameters34 4.1. Relevant Literature34 4.2. Parameter Diagram34 4.3. Parameter Relationships35 4.4. Critical Parameters
39 Chapter 5 Sensitivity Analysis39 5.1. Introduction39 5.2. Results and Discussion
43 Chapter 6 Approval and Commercialization Study43 6.1. Approval Process for New Arrestor Development43 6.2. Normal Approval Process43 6.3. Equivalent Approval Process44 6.4. Updating of the ARRESTOR Code

46 Chapter 7 Identification and Initial Assessment of Alternatives46 7.1. General Approach46 7.2. Vendor-Developed Alternatives46 7.3. Classification of Alternatives48 7.4. Initial Assessment of Alternatives48 7.5. Crushable Material Systems55 7.6. Displaceable Material Systems58 7.7. Cable/Net Active Systems
60 Chapter 8 Experimentation Overview60 8.1. Scope and Emphasis60 8.2. Evaluation Process60 8.3. Order of Discussion
63 Chapter 9 Glass Foam Arrestor Concept63 9.1. Concept Description63 9.2. Testing and Modeling Approach66 9.3. Testing Effort72 9.4. Modeling Effort80 9.5. Arrestor Performance Predictions84 9.6. Estimated System Cost and Upkeep85 9.7. Transition to a Fielded System86 9.8. Summary
87 Chapter 10 Engineered Aggregate Arrestor Concept87 10.1. Concept Description87 10.2. Modeling and Testing Approach89 10.3. Testing Effort94 10.4. Modeling Effort
103 10.5. Arrestor Performance Predictions104 10.6. Estimated System Cost and Upkeep108 10.7. Transition to Fielded System108 10.8. Summary
110 Chapter 11 Aggregate Foam Arrestor Concept110 11.1. Concept Description111 11.2. Testing and Modeling Approach113 11.3. Testing Effort118 11.4. Modeling Effort125 11.5. Arrestor Performance Predictions132 11.6. Estimated System Cost and Upkeep134 11.7. Transition to a Fielded System135 11.8. Summary
137 Chapter 12 Depth-Varying Foam Material137 12.1. Depth-Varying Foam Concept137 12.2. Depth-Varying Profiles Considered137 12.3. Modeling Approach140 12.4. Metamodel Analysis142 12.5. Transition to Fielded System143 12.6. Summary

144 Chapter 13 Summary of Passive System Candidates144 13.1. Overview144 13.2. Performance Comparison145 13.3. Environmental Performance Comparison146 13.4. Cost Comparison147 13.5. Summary Comparison
148 Chapter 14 Main-Gear Engagement Active System Concept148 14.1. Overview of Active System Deployment148 14.2. Prediction of Arresting Loads150 14.3. Landing Gear Engagement153 14.4. Summary
155 Chapter 15 Conclusions155 15.1. Study Phase156 15.2. Experimentation Phase157 15.3. Final Conclusions
158 References
160 Appendix A Bibliography
162 Appendix B Survey Details
174 Appendix C EMAS Calculations
178 Appendix D Active Arrestor Calculations
181 Appendix E Human Injury Study
184 Appendix F Tire Models
188 Appendix G Arrestor Prediction Code
195 Acronyms and Abbreviations

S U M M A R Y
Introduction
Passenger aircraft can overrun the available runway area during takeoff and landing, creatingaccidents involving aircraft damage and loss of life. The increasing speed and weight of modernpassenger aircraft require longer runways, but many airports are land-locked by surroundingbuildings, bodies of water, or geographic features that prevent runway extension. These facts,combined with the increasing volume of air traffic, make overrun risks more relevant todaythan when many U.S. airports were first constructed.
To mitigate overruns that take place, the Federal Aviation Administration (FAA) now requiresthat all runways have a Runway Safety Area (RSA) beyond the normal runway surface, typicallywith a length of 1,000 ft. This area provides an additional deceleration zone for planes that cannotstop before reaching the runway end. However, some airports do not have sufficient land areato meet this requirement. In such cases, the airport can install an arrestor system that providesan equivalent to the standard RSA. This use of arrestor systems permits the airport to satisfy theFAA requirement within a smaller land space.
Currently, the only type of civil aircraft arresting system that meets FAA standards is an Engi-neered Material Arresting System (EMAS). A number of airports have installed EMAS, and thesearrestors have demonstrated the ability to bring aircraft to a stop in several overrun incidents.
However, various issues and concerns regarding the current EMAS technology exist. Atmany airports, the land area at the end of a runway is inadequate to accommodate a full-sizedEMAS system. The costs associated with acquiring and installing an EMAS are high due to thelabor-intensive assembly process. The durability of the system over time is unknown, and notests are currently available that can verify that an installed EMAS maintains its original designcharacteristics.
The objective of this research was to advance the development of alternative civil aircraftarresting systems to safely decelerate aircraft that overshoot the runway. The research sought toevaluate alternatives to the current EMAS technology, with the goal of finding options that mightoffer better performance, lower cost, or higher durability. The research involved technical andnon-technical aspects such as candidate system evaluation, cost estimation, standards-relatedinvestigation, and airport surveys. A number of candidate systems and materials were evaluated;some were similar in function to the current system, while some were categorically different.
EMAS Nomenclature
In general, the FAA advisory circular regarding EMAS provides latitude regarding the materialsand construction methods that may be used; multiple EMAS designs could exist. At present,however, only one manufacturer has an approved EMAS design, which is the Engineered Arresting
Developing Improved Civil Aircraft Arresting Systems
1

2
Systems Corporation, or ESCO. In general use, the term “EMAS” has largely become synonymouswith this ESCO product. Nevertheless, “EMAS” as a system definition could be expanded in thefuture to include a number of other arrestors besides this current product. Many of the newarrestor system concepts discussed in this report, if eventually approved and fielded, would qualifyas EMAS systems.
As such, it is necessary to clarify the nomenclature that will be followed in this report.When technical comparisons are made regarding the design, construction, and performance of“EMAS,” the term will refer to the systems presently deployed. When regulatory discussions areundertaken, the term will refer to the general requirements that pertain to the current and futurepassive arrestor systems. When clarification is required, qualifications such as “current EMAS,”“current EMAS design,” or “current EMAS technology” will be used to denote the ESCO product.
EMAS Description
An EMAS is a surface-based arrestor constructed as a large bed that resides in the RSA beyondthe end of a runway (Figure S-1). EMAS dimensions can vary considerably, but typical dimen-sions are approximately 300 ft in length by 150 ft in width, with a nominal 75-ft setback from therunway end. Depending on the available space in the RSA, it can be more cost-effective to installshorter EMAS beds with longer setbacks.
The current EMAS design features 4-ft by 4-ft blocks of cellular (foamed) cement, usually inone of two compressive strengths. The blocks have narrow gaps between them for venting anddrainage, and the tops of these joints are sealed against rain. The depth of the blocks variesdepending on the bed design. The sides of the bed stair-step for pedestrian and emergency vehicleaccess. These side step blocks are not considered in performance calculations for the arrestingbed. Prior to installing an EMAS, the site must be prepared with a paved surface that provides asolid foundation for the bed and adequate drainage.
Two generations of EMAS are currently installed at U.S. airports. The older JBR-501 design usedpainted cement board tops for the individual blocks and caulking to seal the joints in between. Thenewer JBR-502 design uses plastic tops, which do not require painting, and silicone tape to sealthe joints.
As the only current FAA-approved arresting system, the current EMAS design will serve as abaseline for the arrestor alternatives examined in this research.
Figure S-1. EMAS arrestor, Minneapolis–St. Paul (MSP) airport.

Research Approach
The research was divided into two phases. The first, the study phase, included research,identification of alternatives, and an initial down-selection of the most promising candidatearrestor concepts. The second, the experimentation phase, focused on evaluating the candidateconcepts through testing and modeling.
Survey of U.S. Airport Operators
To obtain information and opinions regarding the existing EMAS from end-users, a surveywas taken of 14 U.S. airports, and site visits were made to three. The information obtained wasa mixture of objective data and subjective opinions. The airport operators were asked questionsregarding past and present experience with EMAS pertaining to installation, maintenance,overrun performance, and its related costs. Additionally, a smaller survey of pilots and pilotorganizations was undertaken. Many suggestions, opinions, and concerns were voiced. However,this summary will focus on the cost components.
For baseline cost information regarding EMAS, the study referred to FAA Order 5200.9,Financial Feasibility and Equivalency of Runway Safety Area Improvements and Engineered MaterialArresting Systems. It provided guidelines for estimating the costs to establish an EMAS at an airportand for estimating the life-cycle costs of a system.
Airport operators were asked to provide the preparatory paving cost and installation cost foreach arrestor installed at their airports. Eight airports provided preparatory paving and installationcosts for a total of 11 arrestors. By way of comparison, the cost design values according to FAAOrder 5200.9 were based on five separate EMAS installations.
The mean cost values reported by the airports are shown in Table S-1. They were normalizedby the associated pavement and bed areas. The survey costs were corrected for inflation and areexpressed in 2007 dollars. For comparison, the suggested values of preparatory paving cost andinstallation cost from FAA Order 5200.9 are included in the table, in 2007 dollars. As shown, themean reported paving and installation costs were significantly higher than the design costsestimated in FAA Order 5200.9. Actual costs also appeared to exceed the expectations of FAAOrder 5200.9 with regard to annual maintenance.
While the survey included more airports than the original data set used to create Order 5200.9,it did not include all EMAS systems installed at U.S. airports. It is possible that the average costscould shift if the remaining airports were included.
Although essentially based on anecdotal experiences, the researchers have noted a general lackof awareness regarding the existence, usage, and function of EMAS among airline pilots. Thislack of awareness has been observed in both newer and seasoned pilots. It is unclear whether the
3
FAA Order 5200.9
Survey
Normalized Preparatory Paving Cost per Square Foot
$15 $48
Normalized Installation Cost per Square Foot
$85 $134
Cost to Establish EMAS (CTEE) per Square Foot
$100 $182
Cost for 150 x 300-ft Bed $4.5M $8.2M
Table S-1. Normalized mean costs from surveycompared with FAA Order 5200.9 (2007 dollars).

4
awareness is higher for pilots that typically land at airports with EMAS. Unfortunately, responsefrom the pilot community was limited during the survey process.
Review of FAA Parameters
The design parameters for an EMAS are based on FAA requirements contained in AdvisoryCircular 150/5220-22A. These parameters were reviewed to determine their relative impact onthe cost, size, and performance of installed arrestors.
Exit Speed
Exit speed is how fast an aircraft is travelling when it rolls past the end of the runway. The advi-sory circular requires that an EMAS have a standard design exit speed of 70 knots (standard case)and a minimum of 40 knots (non-standard case). In designing an arrestor, the bed constructionwould be specified to ensure that the aircraft serviced by the runway could be stopped with theseexit speeds. The 70-knot standard is intended to enable arrest of 90% of overruns, which historicaldata indicated was statistically the case. The 40-knot minimum is provided as an exception forairports with highly constrained RSAs.
A review of the overrun data collected in a recent ACRP study on aircraft overruns and under-shoots indicated that the 70-knot requirement may no longer be sufficient to reach the intended90% arrest rate (ACRP Report 3). Analysis of the new data conducted during this research effortsuggests that the 90% threshold may have shifted to just above 80 knots. This could affect thedesign speeds for aircraft arrestors if a 90% criterion is to be maintained. Additional investigationmay be warranted regarding the accuracy of the reported data that was used in the assessment.
Damage to Aircraft
The advisory circular requires that the arrestor not cause structural damage to the aircraft.This mandate has a direct impact on the arrestor’s cost and performance. The requirementscould be altered to permit overloading of the aircraft landing gear if certain criteria are met. Forexample, if an aircraft continues to penetrate beyond 75% of the bed length, it could enter an“all or nothing” zone, where the resistance of the bed increases in a final attempt to arrest the air-craft. The landing gear may be damaged, but that may be preferable to the alternative of failingto stop the aircraft. A more robust approach could include an overall risk assessment for the facilityand the aircraft serviced by the runway, since the consequences of an unimpeded overrun wouldnot be equal for all facilities.
Cost
The sensitivity of EMAS cost was assessed in the vicinity of the 40-knot minimum and 70-knotstandard exit speeds. The impact of shifting the exit speeds of the advisory circular was assessed.
• The estimated length and cost of an EMAS with a 50-knot design exit speed is about 60%greater than an EMAS with a 40-knot design exit speed.
• The estimated length and cost of an EMAS with an 80-knot design exit speed is about 30%greater than an EMAS with a 70-knot design speed.
Thus, increasing the exit speed requirements would have a direct cost and size impact onarrestor bed installations.

5
Commercialization Study
A commercialization study was undertaken to assess the requirements for a manufacturer tobring a new arrestor system to market. The study examined necessary steps to obtain FAAapproval and identified barriers to market entry.
One barrier to entry that was identified is a lack of predictive tools for manufacturers to assessaircraft landing gear loads. Without this predictive capability, it would prove difficult to satisfythe safe-design requirements specified in Advisory Circular 150/5220-22A.
The FAA computer program, “ARRESTOR,” though an old code at present, can predictarresting distances for various bed geometries. It models a general crushable foam material andpermits the user to specify different compression strengths to be modeled. As such, ARRESTORcould serve the up-and-coming manufacturers who do not have in-house predictive codes.
ARRESTOR currently contains a limited library of aircraft: the B707, B727, and B747. Only oneof these aircraft is still in broad service, the B747. To serve as a modern planning tool, a broaderrange of aircraft should be considered for ARRESTOR. Alternately, a new design program couldbe developed. The Arrestor Prediction Code (APC) developed in the current effort could serveas the basis for such a replacement.
Identification and Selection of Alternatives
The identification of different arrestor alternatives to EMAS was approached through severalmeans. The FAA William J. Hughes Technical Center supplied a list of manufacturers that hadpreviously contacted them with different proposed arrestor concepts, materials, or designs.Those companies were subsequently contacted to determine if there was still active interest inarrestor development. Additionally, the research team reviewed historical arrestor designs andbrainstormed to develop new concepts.
Following the identification of alternatives, taxonomy was developed to classify the differentoptions and provide clarity of comparison. An initial assessment of the alternatives led to the selec-tion of several promising candidates for detailed research in the experimentation phase of the effort.
The maturity of the different concepts varied widely. Some companies simply had an alternativecrushable material that could be used in a similar manner as the cellular cement of current EMAS,but with potentially improved durability. Other companies had more well-developed ideas,including patents, design drawings, and calculations for energy absorption. The broad range ofmaturity required an initial assessment of the alternatives in order to determine the most prom-ising concepts for inclusion in the experimentation stage of the research.
Based on the initial screening and down-selection process, four arrestor candidates wereselected for the experimentation phase of the effort:
1. Glass foam arrestor concept (passive),2. Aggregate foam arrestor concept (passive),3. Engineered aggregate arrestor (passive), and4. Main-gear engagement active arrestor concept (active).
Please note that the TRB and ACRP do not endorse specific products. Research results are pro-vided to assist in the evaluation of options by others.
Candidate 1: Glass Foam
Cellular glass foam was proposed as a material and would be made as a modification of anexisting insulating product (Figure S-2). The material would be used in a large bed either com-posed of blocks akin to the current EMAS design or constructed as a monolithic structure. The

6
chemical makeup and closed-cell properties of glass foam suggested good chemical resistance,excellent durability to the environment, and resistance to water absorption. The potentialimprovement in durability suggested the possibility of reduced maintenance and replacementneeds for an arrestor using this material.
The glass foam material offered relatively similar mechanical properties to that of cellularcement because both materials are low-density crushable foams. However, glass foam in generalappeared to be less fragile, easier to handle, and potentially more durable than the cellularcement. Additionally, adhesives and moisture sealants are available for glass foams that permitjoining and weatherproofing.
Because the glass foam material is generally manufactured in blocks sized at approximately24 × 18 × 6 inches, two variants are possible (Figure S-3):
1. Block Method. The block method would use 4-ft square blocks of the foam, analogous to thecurrent EMAS construction approach. The blocks would be constructed by adhering multiplesmaller blocks together, followed by the potential addition of top and/or bottom cap materials.The sides of the block could potentially be sprayed with a sealant to further weatherproofthe blocks. These blocks would be transported to and installed at a runway in essentially thesame manner as the current EMAS beds.
2. Monolithic Method. The monolithic method would be assembled on-site at the runway bystacking and gluing blocks into a single large structure. The final assembly would then be fittedwith a continuous top cover layer composed of a roll/spray-on polymer. This layup wouldpreclude the need for joint seams, sealants, and maintenance, which are required for the currentEMAS design. Moisture sealing of the vertical sides of individual blocks would be unnecessary.Monolithic layups such as this have been used in building roof applications.
Candidate 2: Aggregate Foam
An aggregate foam arrestor concept was proposed. The arrestor would use rough-brokenfoam aggregate made from recycled glass (Figure S-4). The foamed, or aerated, glass material has
Figure S-2. Cellular glass foam material.

7
Glass Foam Arrestor Concept 1: Block Method
Seams Between Blocks,Sealed with Tape/Caulk
Each Major Block is a Glued Assemblage of Smaller Blocks
Lid
Glass Foam Arrestor Concept 2: Monolithic Method
Monolithic Sealant Top Layer without Joints
Small Blocks Glued Together in Brick Pattern
Figure S-3. Glass foam arrestor variants: block method (top) and monolithicmethod (bottom).
Figure S-4. Aggregate foam material: microstructure (upper-left),as a pile (upper-right), and individual pieces (bottom).

8
nominally 80% void space by volume. Its closed-cell microstructure makes it resistant to waterabsorption and degradation.
An arrestor using the aggregate foam would be constructed by creating a basin and filling itwith the material. An engineered turf would serve as a top cover layer for the bed (Figure S-5),which can serve several purposes:
1. Prevent material dispersion due to jet blast;2. Mitigate material spraying during overrun by an aircraft tire, thus limiting engine ingestion
hazard;3. Regulate water drainage and potential ice crust formation in winter; and4. Act as a structural component to prevent lightweight land vehicles from penetrating the
arrestor bed.
This simple fill-and-cover construction would likely produce lower manufacture and installationcosts than the block construction methods used at present. This potential advantage is offset by thepossibility that the material could settle over time and result in altered arresting performance.
Candidate 3: Engineered Aggregate
An engineered aggregate arrestor concept was proposed. Its primary material is a sphericalengineered aggregate that has excellent flow properties and resists settling and compaction thatare more typical for angular gravels (Figure S-6).
This material would reside in a shallow bed and be covered with a reinforced turf layer. However,the engineered aggregate may also be used without a turf layer, which has been done at four airportsin the UK. Other top layer materials are possible, such as a thin asphalt skim coat. Figure S-7
Aggregate Foam Bed
Cover Layer of Engineered Turf
Arrestor Basin
Figure S-5. Aggregate foam arrestor concept.
Figure S-6. Engineered aggregate.

illustrates the cover-layer variant of the engineered aggregate arrestor concept. The confining toplayer would serve similar purposes as that of the aggregate foam concept.
The engineered aggregate solution offered the advantage of construct-in-place simplicity,requiring no fabrication of blocks or cure time. Repairs after overruns would essentially involveshoveling or scraping the material back into place, with little material replacement required.
Candidate 4: Main-Gear Engagement System
Active arresting systems have long been used to arrest military aircraft. Prior attempts havebeen made to adapt them for use with civil transport aircraft, using over-wing barrier nets toengage the wings and fuselage in the absence of a tail hook. To surpass these predecessors, anynew attempts to adapt the active systems would require innovation and new sensor approaches.However, the active systems offer elegance and a decided performance advantage over passivesystems. As such, they were revisited in this effort and re-examined for feasibility.
The active system concept evaluated was a main-gear engagement cable-based arrestor. Forthis concept, a cable-based arrestor would pop up from underneath to engage the main landinggear as the aircraft passes by. Military-style arrestor brakes would retain the cable at either endto decelerate the aircraft (Figure S-8). An aircraft identification system would determine thetype of plane being engaged, and embedded runway sensors would detect the overrun event,compute aircraft speed, and determine the timing for deployment. The system would, therefore,be automated and not require manual activation. Pilot overrides could be included if desired.
One of the main advantages of the cable-based arrestor is that the nose gear would not beengaged. As shown in Figure S-9, the nose gear would only be loaded vertically due to the weight of
9
Aggregate Bed
Cover Layer of Engineered Turf
Figure S-7. Engineered aggregate arrestor concepts.
BrakingUnit
BrakingUnit
Figure S-8. Main-gear engagement active arrestor.

10
the aircraft and pitching moment. This main-gear engagement approach circumvents the weaknessof the crushable bed systems: it does not subject the nose gear to drag loads. Consequently, itwould be possible to achieve higher decelerations and shorter stopping distances. Further, withautomated servo control of the braking units, it could obtain uniform decelerations for a widerange of aircraft weights. Therefore, the deceleration performance could readily exceed that ofpassive arrestor beds.
Experimentation Overview
The research funding did not support full-scale testing on a broad enough basis to bemeaningful for the effort. Because the experimentation phase was intended to compare themost promising alternatives to the current EMAS technology, and because there were severalcandidates to evaluate, a modeling-centric approach was adopted. Within this approach, various physical tests were performed in order to characterize the materials involved and toprovide a basis for calibrating high-fidelity computer models of the systems. The models werethen used to assess the performance of the arrestor concepts in different configurations andfor different aircraft.
The candidate systems and evaluation methods are given in Table S-2. As the table indicates,the passive systems shared similar evaluation approaches, but the active system differed.
Crushable material technologies were emphasized most because they have a proven trackrecord; finding a similar material solution with better life-cycle performance would provide auseful alternative in the near-term.
VNGVMG
DMG
Figure S-9. Loads on aircraft subjected to active arrestordeceleration.
Category System Evaluation Approach
Crushable material systems
• Candidate 1: Glass foam
• Candidate 2: Aggregate foam
Displaceable material systems
• Candidate 3: Engineered aggregate
• Material testing
• One-wheel bogey testing
• Numerical modeling to develop tire/material response surfaces
• Overall aircraft response evaluation using an aircraft suspension model
Active systems • Candidate 4: Main-gear engagement active system
• Extended paper study
• Analytical spreadsheet model
Table S-2. Summary of evaluation methods for candidates.

Aggregate systems have historically experienced a discrepancy of acceptance, seeing use in theUK but not in the U.S. The evaluation approach outlined herein offers the promise of resolving thequestion of predictable arresting performance.
The evaluation method for the passive systems was composed of (1) modeling and (2) physicaltesting. Figure S-10 illustrates a simplified version of the modeling and testing approach.
The active system approach required a feasibility study to determine its merit. As such, a smalltask was dedicated to completing a more detailed paper/analytical study.
Early in the research effort, ESCO provided best-case EMAS arrestment prediction data for threeaircraft from different size regimes: the CRJ-200, B737-800, and B747-400 (Figure S-11). Inorder to compare the candidate systems’ performance with these EMAS baseline cases, aircraftcomputer models for each were developed. As such, these three aircraft are cited throughout theevaluation.
11
Figure S-10. Simplified diagram of modeling and testing approach.
88 ft
130 ft
230 ft
B747-400MTOW = 875,000
CRJ 200MTOW = 51,000
B737-800MTOW = 174,200
Figure S-11. Three evaluation aircraft for the effort.

12
Passive System Evaluation Results
Overview
The experimentation phase evaluated three passive arrestor candidate systems:
1. Glass foam arrestor,2. Aggregate foam arrestor, and3. Engineered aggregate arrestor.
Each demonstrated relative strengths and weaknesses. All three options provide concepts withincreased material durability over cellular cement, which would likely result in longer life cyclesand decreased maintenance requirements.
Performance Comparison
The performance of the different candidates can be compared in two primary ways: based on(1) single-aircraft or (2) multi-aircraft bed designs. When comparing single-aircraft bed designs, thethickness of each bed and its material properties are optimized for the plane of interest. However,the bed designs for the different aircraft may not be compatible with one another. For example, abest-case design for the B747-400 was typically found to overload the landing gear of the CRJ-200.
When comparing multi-aircraft bed designs, a single bed is designed for best-case perfor-mance with all three of the subject aircraft simultaneously. A single-bed thickness and materialproperty are determined such that the overall performance is optimized for all three aircraft.
The single-aircraft comparisons always produce the shortest feasible stopping distances.However, the multi-aircraft comparisons are more relevant to actual applications at airports,where arrestor beds are designed as a compromise between the different aircraft serviced.
Figure S-12 compares the best single-aircraft bed designs for the three alternatives and comparesthem to the current EMAS technology. The four sets of bars show very similar trends in terms ofrelative stopping lengths for the different aircraft. The glass foam stopping distances are slightlyshorter than those of the current EMAS (except for the B737-800, where it is slightly longer),while the other two concepts would require slightly longer beds. The performance similarity of
0
100
200
300
400
500
600
700
Current EMAS Glass Foam EngineeredAggregate
AggregateFoam
Sto
pp
ing
Dis
tan
ce (
ft)
CRJ-200
B737-800
B747-400
Figure S-12. Comparison of single-aircraft bed performance for all candidates: distance travelled in bed for full arrestassuming 70-knot exit speed.

glass foam and the current EMAS is not surprising because both designs use crushable foam blockmaterial with similar mechanical behavior. However, this comparison of single-aircraft perfor-mance is ultimately less relevant to real applications than the multi-aircraft comparisons that follow.
Figure S-13 compares the best multi-aircraft arrestor bed designs for the three alternatives. Ineach case, the B747-400 required the longest bed for arrestment from a 70-knot exit speed. Itshould be noted that performance predictions for the existing EMAS have not been included inthe figure because the design cases provided did not apply to multi-aircraft bed designs. In general,the material could be assumed to follow a similar trend to glass foam, owing to the mechanicalsimilarities just discussed.
In comparing Figure S-12 with Figure S-13, the trend for leading and trailing concepts shiftsconsiderably. The differences illustrate how substantially the multi-aircraft performance deviatesfrom aircraft considered individually. For the multi-aircraft case, bars of similar height indicateimproved equality in the treatment of the three aircraft. Of the three concepts, the aggregate foamshows the most consistent performance, with dramatic reduction in the stopping distance forthe B747-400.
As an example, for a bed with a practical 400-ft length, the exit speeds for each aircraft are asshown in Table S-3. The 400-ft bed would obtain a full 70-knot exit speed rating for the CRJ-200with all arrestor concepts. Both the glass foam and aggregate foam beds would further obtain a70-knot rating for the B737-800, while the engineered aggregate falls behind at only 63 knots.For the B747-400, none of the beds obtains a full 70-knot rating; the aggregate foam leads at56 knots and the engineered aggregate falls to below the minimum allowable speed at 39 knots.
13
0
100
200
300
400
500
600
700
800
900
1000
CurrentEMAS
Glass Foam EngineeredAggregate
AggregateFoam
Sto
pp
ing
Dis
tan
ce (
ft)
CRJ-200
B737-800
B747-400
DA
TA
NO
TA
VA
ILA
BL
E
Figure S-13. Comparison of multi-aircraft bed performance for all candidates: distance travelled in bed for full arrestassuming 70-knot exit speed.
Aircraft Glass Foam Engineered Aggregate
Aggregate Foam
CRJ-200 70+ 70+ 70+
B737-800 70+ 63 70+
B747-400 46 39 56
Table S-3. Comparison of multi-aircraft bed performance: exit speeds for full arrest in 400-ft bed.

14
Overall, the performance of the three concepts can be summarized as below:
• The aggregate foam concept provided the best overall mixed-fleet bed performance, showingthe smallest spread in arrestor performance for the three aircraft. However, the bed designmust be correctly specified to prevent oscillatory “porpoising” behavior of the aircraft.
• The engineered aggregate produced speed-dependent landing gear loads. This would typicallyrequire designs to hedge against overloading by under-designing them, resulting in longerarrests than illustrated above.
• The glass foam beds produced the most predictable and constant decelerations without speeddependence or porpoising effects.
Environmental Performance Comparison
From an environmental performance standpoint, all three alternatives appear likely to offersuperior performance to the current EMAS technology. The environmental performance estimatesare based on some test data, historical usage of the materials, and engineering judgment. Anexhaustive environmental test program has not been undertaken as part of this program.
Life-cycle performance has been assumed to result from a combination of the core materialsused and the protective measures taken to shield those materials from the elements.
From a materials standpoint, the glass foam and aggregate foam concepts both use closed-cellglass foams that inherently resist water penetration. The engineered aggregate is composed ofhard spherical pellets. All three of these materials appear to offer superior inherent resistance togeneral handling and moisture/chemical exposure when compared to cellular cement.
With regard to protective measures, methods for covering and sealing the three candidatematerials against moisture, standing water, jet blast, and freezing conditions have been examined(see respective chapters). For the aggregate foam and engineered aggregate approaches, the useof geo-plastics and geo-textiles could render the beds essentially isolated from water entrainmentand freeze–thaw damage. The glass foam material could be packaged in a manner similar to thatof the current EMAS cellular cement or equipped with an alternative monolithic sealed top layer.
Cost Comparison
The relative costs for the current EMAS and the candidate systems are compared in Figure S-14and Figure S-15, using survey cost assumptions and estimates from Order 5200.9, respectively.The general trends appear similar in either case, with the aggregate foam concept providing theleast expensive alternative, and the glass foam providing the most expensive alternative. The costsin the figures denote the total cost to establish such a system and do not include life-cycle costsof bed replacement and maintenance.
Summary Comparison
Glass foam provided equivalent dynamic behavior to the currently approved EMAS system.Its performance, cost, and construction are also similar to the current EMAS. However, use ofglass foam with a monolithic construction offers reduced maintenance and a longer service life.Additionally, glass foam could be constructed using a stratified depth-varying layup, whichwould likely improve multi-aircraft bed performance.
Aggregate foam provided a novel approach that featured excellent multi-aircraft bed perfor-mance due to its depth-varying crushable material; this would effectively lead to shorter arrestorbeds. Its cost was the lowest of the alternatives, combining an inexpensive material with a simpleinstallation process.

Engineered aggregate features the most durable candidate arrestor material, much of whichcould be reused after an arresting event. It has a cost that falls between the other concepts. Itsspeed-dependent nature produces weaker multi-aircraft performance, which would requirelonger arrestor beds to obtain the same exit speed ratings.
Active System Evaluation Results
The main-gear engagement active system concept offered multiple advantages not available inpassive surface-based arrestor beds. Feedback control offered the potential for ideal decelerationof aircraft. The energy-absorbing brakes could adjust automatically to apply less load on a small
15
$-
$1
$2
$3
$4
$5
$6
$7
Co
st t
o E
stab
lish
($M
)
Installation
Site Preparation
Aggre
gate
Foa
m
Glass F
oam
Curre
nt E
MAS
Engine
ered
Agg
rega
te
Figure S-15. Relative estimated cost comparison assumingOrder 5200.9 costs (150’ x 300’ bed).
$-
$1
$2
$3
$4
$5
$6
$7
$8
$9
Co
st t
o E
stab
lish
($M
)
Installation
Site Preparation
Aggre
gate
Foa
m
Glass F
oam
Curre
nt E
MAS
Engine
ered
Agg
rega
te
Figure S-14. Relative estimated cost comparison assumingsurvey costs (150’ x 300’ bed).
16
plane than a large one, enabling one arrestor to treat all aircraft equally. The overall effect of theseadvantages would be shorter arresting distances for the entire design fleet of aircraft.
Load calculations undertaken confirmed that the essential mechanics for the arrestor systemwould function as anticipated. Tension regulation in the cable would be essential to preventoverloading of the landing gear.
Despite these promising features, a number of complicating issues remain for the active systemconcept:
• Aircraft identification and speed calculation would be required for the system to functioncorrectly. Systems to accomplish both could likely be developed, although research of suchfacets has not yet been undertaken.
• Cable sizes are of concern because the thicker cables required for rapidly arresting large planescould be heavy enough to damage smaller ones.
• The cable engagement process would likely result in damage to landing gear doors, actuators,wiring, and hydraulic features on the front side of the main struts.
• The window of time for deploying the system could be narrow when the aircraft has low slungengines because the vertical path of the cable or net must miss the engine nacelles yet engagethe main strut above the tires.
• The geometry of some aircraft would exclude the possibility of engaging the main gear. Theseaircraft could not be engaged and arrested by a main-gear cable/net system.
For these reasons, the active system approach is feasible for stopping aircraft, but the main-gearengagement concept should be eliminated from consideration. Over-wing barrier net systemshave been developed in the past, and they may still offer the best overall engagement approach.Past engagement issues for the nets could be resolved using automation concepts as discussed,thereby eliminating the need for direct triggering by airport personnel.
Conclusions
In the first phase, research was done into multiple studies of different topics relevant to devel-oping arrestor alternatives. After identifying promising alternatives, several candidate conceptswere selected for detailed evaluation in the second, experimentation phase. In the second phase,testing and modeling were used to evaluate the performance of the candidates. This sectionsummarizes important conclusions from both phases of research.
Study Phase
The survey of U.S. airport operators revealed that actual EMAS costs appear to exceed the pre-dicted values contained in FAA Order 5200.9 in terms of preparatory paving, installation, andmaintenance. While the survey included more airports than the original data set used to createOrder 5200.9, it did not include all EMAS systems installed at U.S. airports. It is possible that theaverage costs could shift once the remaining airports were included. However, since the surveydata for the cost to establish an EMAS (CTEE) was 1.8 times higher than the predicted value, anupdate to the guidance document may be advisable.
A review of aircraft overrun data led to a revised probability curve for aircraft overrun exitspeeds. This revised curve indicated that 90% of aircraft overruns may no longer take place at orbelow an exit speed of 70 knots. The new curve suggests that the 90% threshold may have shiftedto just above 80 knots. This could affect the design speeds for aircraft arrestors if a 90% criterionis to be maintained. Additional investigation may be warranted regarding the accuracy of thereported data that was used in the assessment. However, increasing the 70-knot standard exit
speed or the 40-knot minimum exit speed requirements would have a notable impact on the sizeand cost of arrestor systems.
The FAA EMAS design requirements currently prohibit damage to the aircraft, which typicallyresults in arrestor bed designs constrained by the rearward nose-gear loads. More aggressivedecelerations would be possible if the designs were permitted to collapse the nose gear as long asthe main gear remained intact. Prior EMAS testing suggests that this may pose minimal hazardsto aircraft occupants. However, aircraft with low-slung engines could potentially be damagedand/or ingest arrestor material in such cases, and the risks of these effects have not been quantified.Additional concerns would apply to turbo-prop aircraft, where propeller damage could presentadditional hazards. It may be advantageous to revisit the requirements regarding landing gearloading in order to determine if case-by-case exceptions may be permissible. In some circumstances,the benefits of aggressive arrestor performance may outweigh the risks of failing to stop an overrun.
The approval and commercialization study determined that the current lack of a general pre-dictive software tool presents a barrier for new entrants to the arrestor system field. Developmentof such a tool, or an update of the older ARRESTOR code, should be considered.
Although based on anecdotal experiences, the researchers have noted a seeming lack of aware-ness regarding the existence, usage, and function of EMAS among airline pilots. This lack ofawareness has been observed in both newer and seasoned pilots. It is unclear whether awarenessis greater among pilots that typically land at airports with EMAS. Unfortunately, response fromthe pilot community was limited during the survey process. Nevertheless, it may be beneficial toconsider pursuit of an educational effort to increase awareness of the existence and function ofEMAS within the pilot community.
Experimentation Phase
The experimentation phase of the effort involved an extensive evaluation of four arrestorcandidates:
1. Glass foam arrestor (passive),2. Aggregate foam arrestor (passive),3. Engineered aggregate arrestor (passive), and4. Main-gear engagement active arrestor (active).
A combined modeling and simulation effort successfully replicated each candidate in order toevaluate its merit and compare it with the existing EMAS performance.
Passive System Evaluation
The findings of this research indicate that a fieldable system is feasible for all three passivesystem candidates.
The aggregate foam concept offers superior multi-aircraft performance due to its depth-varyingmaterial properties. This multi-aircraft performance is arguably the most important factor forkeeping arrestor beds short, reducing land requirements, and increasing the rated aircraft exitspeeds. Additionally, it provides a substantially lower estimated cost per square foot. However,because the aggregate foam concept uses a novel crushable material and cover layer, the numberof unknowns is greater. The arrestor materials require additional evaluation in order to producehigh-confidence performance estimations. Overall, the combination of unknown factors andanticipated cost and performance improvements make it a moderate-risk/high-payoff concept.
Conversely, the glass foam concept is the most conservative of the three alternatives in terms ofdevelopment risk and payoff. Glass foam provides an alternative to the current EMAS technology
17

18
with promising improvements regarding service life and maintenance, but at equivalent cost andperformance. The mechanics of the material are predictable with relatively few unknown factors.Overall, the combination of unknown factors and anticipated cost and performance improve-ments make it a low-risk/moderate-payoff concept.
Finally, the engineered aggregate concept provides a feasible alternative, but one without aparticular distinguishing advantage. It provides cost savings and increased material durability.However, the speed-dependent arrestor performance generally requires longer arrestor beds anddiminishes the multi-aircraft performance. As with the aggregate foam, the materials to be used willrequire additional characterization in order to make high-confidence performance estimations.Overall, the combination of unknown factors and anticipated cost and performance improvementsmake it a moderate-risk/low-payoff concept.
The selection of one or more of these alternatives for fielding and approval is a task that requiresconsideration by the relevant stakeholders, which include the government, airport community,and manufacturers. Each candidate offers different advantages, risk levels, and payoff potential.Depending on the development track that is pursued, manufacturer investment may be required.The extensiveness of subsequent development plans and the associated costs may determine thefeasibility of such participation. As a precursor to any such development, it is recommended thatthe concepts for pursuit be determined and that the relevant manufacturers be contacted forpreliminary discussions of development scope and participation.
Active System Evaluation
The main-gear engagement active system candidate is not recommended for additional pursuit.While stopping the aircraft proved mechanically feasible, engaging the main-gear struts involvedmultiple complexities, including damage to landing gear features, damage to landing gear baydoors, and timing and deployment complexity. Additionally, some aircraft geometries madecapture infeasible altogether.
Nevertheless, active systems remain feasible if barrier nets are used for engagement. Using thesuggested sensor and activation methods, an automated system could be developed that wouldeliminate the need for manual triggering, but permit pilot overrides. The active system approachoffers the highest theoretical deceleration limits, which could produce substantially shorterarrestment distances than any passive system alternative.
The survey findings indicate that endeavors to implement an active civil aircraft arrestingsystem would meet with resistance by the aviation community. If pursued, it is recommendedthat an educational component be included to increase awareness and reduce misconceptionsregarding such systems.
Final Conclusions
The research effort achieved its stated objective, which was to advance the development ofalternative civil aircraft arresting systems. The research evaluated four alternatives to the currentcellular cement EMAS technology and successfully identified options that can provide improvedperformance, lower cost, and/or higher durability.
Pursuing full development and testing of one or more of these candidate systems would be thenext step toward obtaining requisite FAA approval. Once fielded, the new arrestor system wouldprovide additional options to airport operators for achieving RSA compliance. Increasing thechoices available would allow decision makers to select the arrestor option that best fits withthe budgetary, climate, and space constraints of the facility.
19
1.1. Project Background
Passenger aircraft can overrun the available runway area during takeoff and landing, creating accidents involv-ing aircraft damage and loss of life. The increasing speedand weight of modern passenger aircraft require longerrunways, but many airports are landlocked by surroundingbuildings, bodies of water, or geographic features that pre-vent runway extension. These facts, combined with theincreasing volume of air traffic, make overrun risks morerelevant today than when many U.S. airports were first constructed.
To mitigate overruns that take place, the Federal AviationAdministration (FAA) now requires that all runways have aRunway Safety Area (RSA) beyond the normal runway sur-face, typically with a length of 1,000 ft. This area provides anadditional deceleration zone for planes that cannot stop beforereaching the runway end. However, some airports do not havesufficient land area to meet this requirement. In such cases,the airport can install an arrestor system that provides anequivalent to the standard RSA. This use of arrestor systemspermits the airport to satisfy the FAA requirement within asmaller land space (1).
Currently, the only type of civil aircraft arresting systemthat meets FAA standards is an Engineered Material ArrestingSystem (EMAS). A number of airports have installed EMAS,and these arrestors have demonstrated the ability to bringaircraft to a stop in several overrun incidents.
However, various issues and concerns regarding the current EMAS technology exist. The costs associated withacquiring and installing an EMAS are high due to the labor-intensive assembly process. At many airports, the land areaat the end of a runway is inadequate to accommodate a full-sized EMAS system. In such cases, either additionalland must be developed for accommodation or a reduced-performance EMAS must be installed. The durability of thesystem over time is unknown, and no tests are currently
available that can verify that an installed EMAS maintainsits original design characteristics.
The objective of this research was to advance the develop-ment of alternative civil aircraft arresting systems to safelydecelerate aircraft that overshoot the runway. The researchsought to evaluate alternatives to the current EMAS technol-ogy, with the goal of finding options that might offer betterperformance, lower cost, or higher durability. The researchinvolved technical and non-technical aspects such as can-didate system evaluation, cost estimation, standards-relatedinvestigation, and airport surveys. A number of candidatesystems and materials were evaluated; some were similar infunction to the current system while some were categoricallydifferent.
1.2. EMAS Nomenclature
In general, the FAA advisory circular regarding EMAS pro-vides latitude regarding the materials and construction methodsthat may be used; multiple EMAS designs could exist (1). Atpresent, however, only one manufacturer has an approvedEMAS design, which is the Engineered Arresting Systems Cor-poration, or ESCO. In general use, the term “EMAS” has largelybecome synonymous with this ESCO product. Nevertheless,“EMAS” as a system definition could be expanded in the futureto include a number of other arrestors besides this currentproduct. Many of the new arrestor system concepts discussedin this report, if eventually approved and fielded, would qualifyas EMAS systems.
As such, it is necessary to clarify the nomenclature that willbe followed in this report. When technical comparisons aremade regarding the design, construction, and performance of“EMAS,” the term will refer to the systems presently deployed.When regulatory discussions are undertaken, the term will referto the general requirements that pertain to the current andfuture passive arrestor systems. When clarification is required,qualifications such as “current EMAS,” “current EMAS design,”
C H A P T E R 1
Introduction
or “current EMAS technology” will be used to denote theESCO product.
1.3. EMAS Description
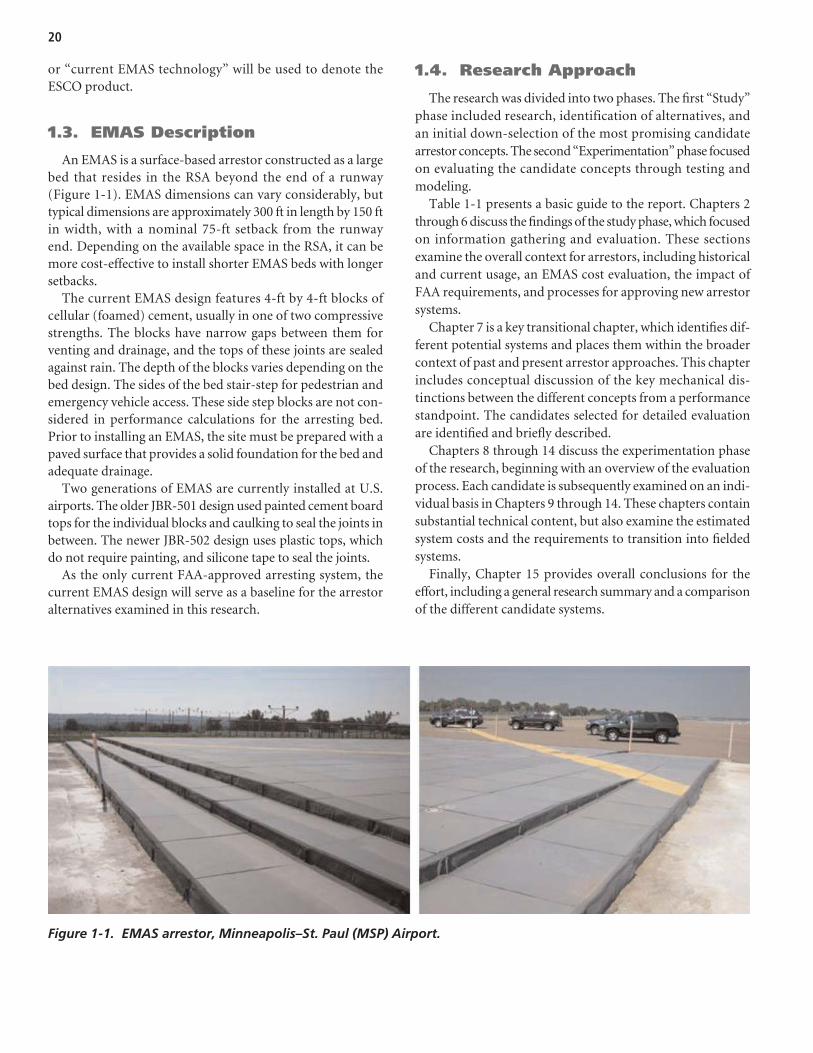
An EMAS is a surface-based arrestor constructed as a largebed that resides in the RSA beyond the end of a runway(Figure 1-1). EMAS dimensions can vary considerably, buttypical dimensions are approximately 300 ft in length by 150 ftin width, with a nominal 75-ft setback from the runwayend. Depending on the available space in the RSA, it can bemore cost-effective to install shorter EMAS beds with longersetbacks.
The current EMAS design features 4-ft by 4-ft blocks ofcellular (foamed) cement, usually in one of two compressivestrengths. The blocks have narrow gaps between them forventing and drainage, and the tops of these joints are sealedagainst rain. The depth of the blocks varies depending on thebed design. The sides of the bed stair-step for pedestrian andemergency vehicle access. These side step blocks are not con-sidered in performance calculations for the arresting bed.Prior to installing an EMAS, the site must be prepared with apaved surface that provides a solid foundation for the bed andadequate drainage.
Two generations of EMAS are currently installed at U.S.airports. The older JBR-501 design used painted cement boardtops for the individual blocks and caulking to seal the joints inbetween. The newer JBR-502 design uses plastic tops, whichdo not require painting, and silicone tape to seal the joints.
As the only current FAA-approved arresting system, thecurrent EMAS design will serve as a baseline for the arrestoralternatives examined in this research.
1.4. Research Approach
The research was divided into two phases. The first “Study”phase included research, identification of alternatives, andan initial down-selection of the most promising candidatearrestor concepts. The second “Experimentation” phase focusedon evaluating the candidate concepts through testing andmodeling.
Table 1-1 presents a basic guide to the report. Chapters 2through 6 discuss the findings of the study phase, which focusedon information gathering and evaluation. These sectionsexamine the overall context for arrestors, including historicaland current usage, an EMAS cost evaluation, the impact ofFAA requirements, and processes for approving new arrestorsystems.
Chapter 7 is a key transitional chapter, which identifies dif-ferent potential systems and places them within the broadercontext of past and present arrestor approaches. This chapterincludes conceptual discussion of the key mechanical dis-tinctions between the different concepts from a performancestandpoint. The candidates selected for detailed evaluationare identified and briefly described.
Chapters 8 through 14 discuss the experimentation phaseof the research, beginning with an overview of the evaluationprocess. Each candidate is subsequently examined on an indi-vidual basis in Chapters 9 through 14. These chapters containsubstantial technical content, but also examine the estimatedsystem costs and the requirements to transition into fieldedsystems.
Finally, Chapter 15 provides overall conclusions for theeffort, including a general research summary and a comparisonof the different candidate systems.
20
Figure 1-1. EMAS arrestor, Minneapolis–St. Paul (MSP) Airport.

21
Chapter Content
Introduction Chapter 1. Introduction Project background and research introduction
Study Phase
Chapter 2. Literature Review
Chapter 3. Survey of U.S. Airport Operators
Chapter 4. Review and Documentation of FAA Parameters
Chapter 5. Sensitivity Analysis
Chapter 6. Approval and Commercialization Study
Discuss research findings on indicated topics
TransitionChapter
Chapter 7. Identification and Initial Assessment of Alternatives
Important background preceding candidate assessment
Chapter 8. Experimentation Overview Overview of evaluation approach to candidate systems
Experimentation Phase
Chapter 9. Glass Foam Arrestor Concept
Chapter 10. Engineered Aggregate Arrestor Concept
Chapter 11. Aggregate Foam Arrestor Concept
Chapter 12. Depth-Varying Foam Material
Chapter 13. Summary of Passive System Candidates
Chapter 14. Main-Gear Engagement Active System Concept
Detailed evaluation of candidate systems
Conclusion Chapter 15. Conclusions Overall conclusions for research
Appendices
Appendix A. Bibliography
Appendix B. Survey Details
Appendix C. EMAS Calculations
Appendix D. Active Arrestor Calculations
Appendix E. Human Injury Study
Appendix F. Tire Models
Appendix G. Arrestor Prediction Code
Additional research details
Table 1-1. Guide to report.

22
2.1. General
The literature review began with research into past arrestorsystem development and current arrestor requirements bythe FAA. This research identified a number of technical areasof interest, which then turned into second- and third-stageliterature research. Altogether, over 130 references werecollected and reviewed on a spectrum of topics pertinent toarrestor systems. A summary of important information gleanedfrom this research is given in this section; the annotatedbibliography (Appendix A) contains a more complete listingof documents. Table 2-1 summarizes the scope of the literaturereview.
2.2. Historical Aircraft ArrestorResearch and Development
Substantial historical work has been done in the area ofarrestor system development. FAA and industry documenta-tion was reviewed, sometimes requiring retrieval in hard-copyform due to the age of the material.
Civil arrestor research in the 1980s examined the usage ofmaterials such as clay, sand, gravel, water, and foam to developa “soft ground” arrestor, as discussed by Cook (2). Thesematerials are passive in nature, with no moving parts. Thearrestment of the aircraft is accomplished by these materialsas they impart a drag load on the landing gear, absorbingkinetic energy and bringing the aircraft to a stop. Cook dis-cusses how materials such as clay, sand, and water were notappropriate for various reasons. For sand and clay materials,the mechanical behavior could not be consistently predicteddue to sensitivity to moisture content. Water could be shownto perform well mechanically, but only at speeds less than50 knots, with the additional disadvantages of attractingwaterfowl and freezing in cold climates. Subsequent researchwas undertaken to examine different variants of foam arrestor(3), from which it was determined that a cementitious foamprovided advantages over polymer foams. Gravel spray caused
by the aircraft tire was identified as a potential engine inges-tion hazard. Additional, limited documentation was reviewedfor gravel arresting system research undertaken in the UnitedKingdom (UK) (4).
The emphasis on development shifted, taking a directionthat focused on crushable materials such as phenolic foamand cellular cement (sometimes referred to as aerated/foamedcement/concrete). White and Agrawal (5) outline that theadvantage of the crushable foam materials is predictability of thedrag load imparted on the landing gear and constant mechani-cal properties over a broad temperature range. Cellular cementeventually became the material of choice due to its near-zerorebound after crushing and chemically inert composition.
Computer modeling and simulation have played a substan-tial role throughout the development of these passive arrestingtechnologies. Initially, predictive codes had been developedfor the modeling of taxi, takeoff, and landing on soil landingstrips (6). These methods were adapted to the soft-groundarresting concept to evaluate different materials. Landing gearloads for the main and nose gear struts have been a historicalarea of scrutiny (2). Loadings to the nose gear in particularwere noted, since materials like gravel could jeopardize theintegrity of the gear and cause potential collapse.
One military code, FITER1, was adapted for civil arrestingapplications and called “ARRESTOR,” documented by Cooket al. (7). It featured three aircraft (B707, B727, and B747) andcould be used to model different foam arresting bed geome-tries. Heymsfield et al. (8) have recently used the ARRESTORcode to perform sensitivity analyses on various parameters.This program has presently been superseded in capability bya proprietary predictive code used by the EMAS manufac-turer, ESCO.
Active arresting systems that use military-type friction brakes(BAK-12, etc.) have been adapted to civilian aircraft in the past.Documentation in our research has been sparse on this subject,however, and the majority of knowledge gained on the sub-ject has been through discussions with ESCO and by reviewing
C H A P T E R 2
Literature Review

a number of their product brochures. Active arresting systemshave seen the most widespread use for military aircraft withtail hooks. To arrest civilian aircraft, netting systems areused to either wrap over the aircraft wings or engage the mainlanding gear struts. The former approach presents hazards foroccupant emergency egress from the aircraft, as the nettingcan block exit hatches. The latter approach has technical dif-ficulties due to widely varying landing gear geometries.
2.3. Recent Arrestor Research
Due to some of the present concerns regarding the life-cycleperformance of the arrestors, Minneapolis–St. Paul Airport(MSP) has conducted several limited research and testingefforts. Stouffer (9) performed in-situ environmental testson the arrestor bed and found a high relative humidity insidethe bed, indicating the trapping of moisture inside the blocks.Stehly (10) conducted testing on some older blocks of theMSP 12R/30L arrestor, including fire-truck overruns and roughin-situ compression tests. Both tests indicated that performancedegradation had occurred since the 1999 installation.
Design reports for arrestor beds were reviewed (11), as wellas relevant excerpts from airport certification manuals (12). Thedesign reports indicate that, in actual practice, the exit-speedperformance of a given arrestor bed can vary widely across theaircraft fleet; some aircraft will be arrested at higher speedsthan others.
Some literature was found pertaining to gravel truckarresting systems, typically used for arresting runaway truckson downhill roadways. Rogers (13) discusses cold-weathertesting information that demonstrates the potential for aggre-gate arresting beds to freeze over and become ineffective inharsh winter environments.
2.4. Landing Gear and Aircraft Dynamics
Landing gear was studied by the project team followingthe review of soft-ground arrestors. A key performance metricfor soft-ground arresting systems is the consistency and pre-
dictability of the loads imparted to the landing gear: loadingsthat are too high can damage or fail the gear, and loadings thatare too low will not efficiently arrest the aircraft. Accurateprediction of these loads cannot be obtained without alsocapturing the dynamic response of the aircraft and landinggear. Much like driving a car over speed bumps, the suspensionresponse can dictate the overall degree of bounce and sub-sequent pitching, or “porpoising,” that occurs. Inconsistentmaterials can lead to more porpoising, and hence higher loadson the landing gear.
While many documents have been reviewed, a few will besingled out here. Currey (14) provides a general text describingthe fundamentals of design and analysis of landing gear, allow-ing for the general sizing of struts, tires, etc. Pritchard’s (15)overview of landing gear dynamics provides a substantial arrayof simulation options, which will be employed in the secondphase of the effort. Chester (16) outlines a modeling approachfor a generalized aircraft of varying size, with a focus on land-ing gear dynamics and overall airframe response. Altogether,we find that relevant variables to the current problem includestrut stiffness and stroke length, tire pressure and dimensions,aircraft mass and moments of inertia, etc. Since these proper-ties for an actual aircraft are proprietary manufacturer infor-mation, the information from these references will provebeneficial for approximation.
Experimental studies undertaken by the FAA have beenreviewed. Micklos and DeFiore (17) discuss video analysistechniques for determining aircraft parameters based on obser-vations of aircraft landings. Tipps et al. (18) describe landinggear load factor statistical studies based on in-service aircraftmeasurements. These and similar reports focus on determiningthe level of loading that in-service aircraft actually experience,often with a focus toward determining the appropriateness ofthe current Federal Aviation Regulations (FAR) requirements.As such, they have less relevance to the current effort, whereload limits for aircraft are the focus.
2.5. Airport Operations
In order to understand the implications of arrestor designon airport operations, several sections of CFR Part 14 werereviewed (19, 20).
FAA Order 5200.8 outlines the Runway Safety Area Pro-gram (21). The intent of the program is to ensure that all Part139 airports in the United States are brought into compliancewith RSA requirements. Historical data shows that mostoverruns take place at speeds of 70 knots or less, and thataircraft typically come to rest within 1,000 ft of the end of therunway (Section 4.4.1). Consequently, a standard RSA has atypical length of 1,000 ft. For airports not in compliance, fiveremedial measures are described: relocating runways, reducingrunway length, a combination approach, the use of declared
23
Document Type Topical Areas
Government research
Government regulations
Journal papers
Patents
Manufacturer specifications and research
Reference books
Magazine/newspaper/Internet articles
Arrestor systems
Aircraft and landing geardynamics
Airport operations
Modeling and simulation
Material science
Table 2-1. Literature review summary.

distances, or the installation of an EMAS. From an operationsstandpoint, any arrestor developed must accomplish the goalspecified by the EMAS advisory circular: to arrest aircraft withan exit speed of 70 knots, thereby providing protection thatis equivalent to a standard RSA (1).
The current status of the Part 139 airports is summarizedin an FAA database (22), which was consulted for determiningthe survey participant pool.
2.6. Accidents and Incidents
Two major studies have documented historical overrunaccidents and incidents. In 1990, David (23) conducted anextensive review of overruns and summarized historical eventdata, including the distance travelled and the final locationof the aircraft with respect to the runway end and center-line. DOT/FAA/CT 93-80 (5, p. 1) gives a histogram sum-marizing the exit speed distribution. This plot producedthe historical basis for associating an exit speed of 70 knotsor less with capturing roughly 90% of overruns. The arrestorshave historically used 70 knots as a design objective for this reason.
In 2007, Hall et al. (24) revisited the topic with a study forTRB/ACRP. This research involved newer data compiled fromseveral database sources pertaining to landing overruns, landingundershoots, and takeoff overruns. The database compiled inthat study was obtained and reviewed, and served as a sub-sequent basis for the risk assessment of this effort. The 90%exit speed appears to have shifted since the previous research,and per the current data, it appears that the threshold couldnow be higher than 70 knots (Chapter 5).
AC 150/5200-37 presents guidance on safety manage-ment systems (SMS) and includes relevant risk assessmentapproaches (25). It has become apparent through the literaturereview that the reliability and risk for passive arrestors is lessunderstood than for military-type systems. The military sys-tems have been well characterized and are required to pass a97.5% reliability criterion; no parallel currently exists for civilsystems. The SMS guidance presents a paradigm to be adoptedwith civil arresting systems.
National Transportation Safety Board (NTSB) incidentreports for several overruns were reviewed, including someinvolving arrestor beds (26–28). These documents providesome information in terms of exit speed and distance travelledthrough the arrestor beds. However, detailed informationregarding the loading and deceleration effected by the arrestorsis not provided.
2.7. Financial
FAA Order 5200.9 provided guidelines for estimating thecosts to establish an EMAS at an airport (29). It provided aprocess for estimating the life-cycle costs of a system and estab-lished guidelines for comparing that cost to maximum feasiblethresholds. The data contained therein served as a baseline forcomparison with the airport operator survey (Chapter 3).
2.8. Patents
Various patents, dated from 1962 to the present, were iden-tified pertaining to aircraft arrestor concepts. These patentsare given in the annotated bibliography (Appendix A).
24

25
To obtain information and opinions regarding the existingEMAS from end-users, a survey was taken of 14 U.S. airports,and site visits were made to three. This section summarizes thefindings of the survey data and personnel interviews. As such,the information is a mixture of objective data and subjectiveopinions. The opinions and ideas expressed are those of theparticipating individuals and do not reflect the positions orrecommendations of the ACRP.
3.1. Site Visits
In July 2007, site visits were made to three airports with EMASarrestors: John F. Kennedy International (JFK), LaGuardiaAirport (LGA), and Minneapolis–St. Paul International (MSP).At each of these airports, discussions were held with operations,maintenance, and management personnel regarding theirexperiences with EMAS.
3.1.1. JFK Airport Site Visit
JFK has two arrestors installed at the facility, as detailed inTable 3-1. Runway designations indicate the departure end ofthe runway where the EMAS is installed.
Several overrun incidents have occurred at JFK since theinstallation of the arrestor beds. Airport management per-sonnel believe that two or three of these overruns could haveresulted in aircraft damage or occupant injury if the arrestorsystems had not been present.
JFK has a maintenance agreement with the manufacturer,which performs quarterly inspections; on-site maintenancepersonnel perform daily visual checks of the arrestors. The bedsexperience some washout of material. Personnel have relatedthat there does not seem to be a good method at present fordetermining moisture content inside the arrestor beds. Paintingand re-caulking have been historical maintenance issues withthe bed and are included in the manufacturer maintenanceagreement.
Site preparation was a significant cost for the airport atthe time of installation. Since installation, landing light arraysthat come up through the bed are difficult to access due to theobstruction created by the arrestor blocks.
Factors that JFK personnel identified for future improve-ment to the arrestor included better quantification of life-cyclecharacteristics, such as (1) the effects of rainfall on the arrestorbed, (2) the effects of freeze–thaw cycles on degradation of thearrestor material, and (3) the effects of good or poor mainte-nance on long-term performance.
3.1.2. LGA Airport Site Visit
LGA airport has two EMAS arrestors installed at the facility,as shown in Table 3-2.
LGA has a maintenance agreement with the manufacturer,which performs quarterly inspections; on-site maintenancepersonnel perform daily visual checks of the arrestors. Paintingand joint re-caulking have been historical maintenance issueswith the bed, and are included in the manufacturer maintenanceagreement. The painting and caulking repairs typically mustbe done at night due to the associated runway closure, but nighttemperatures and the required cure times can make this dif-ficult. Drainage seems to be an issue; water can be seen to seepout of the arrestor for a day after a substantial rain. Figure 3-1and Figure 3-2 show some maintenance issues; repair of suchissues is fairly routine.
Factors that LGA personnel identified for future improve-ment to the arrestor included similar life-cycle considerationsas for the JFK facility. Additionally, they expressed a desireto see future arrestor construction handled more like otherpaving projects, with standardized ASTM material tests/specifications and multiple vendors that could bid on the work.They hope to see strides made toward including embeddedsensors in future arrestors, allowing for ongoing monitoring ofthe internal environment of the arrestor blocks. They would likemetrics for characterizing the aging of an arrestor, allowing
C H A P T E R 3
Survey of U.S. Airport Operators
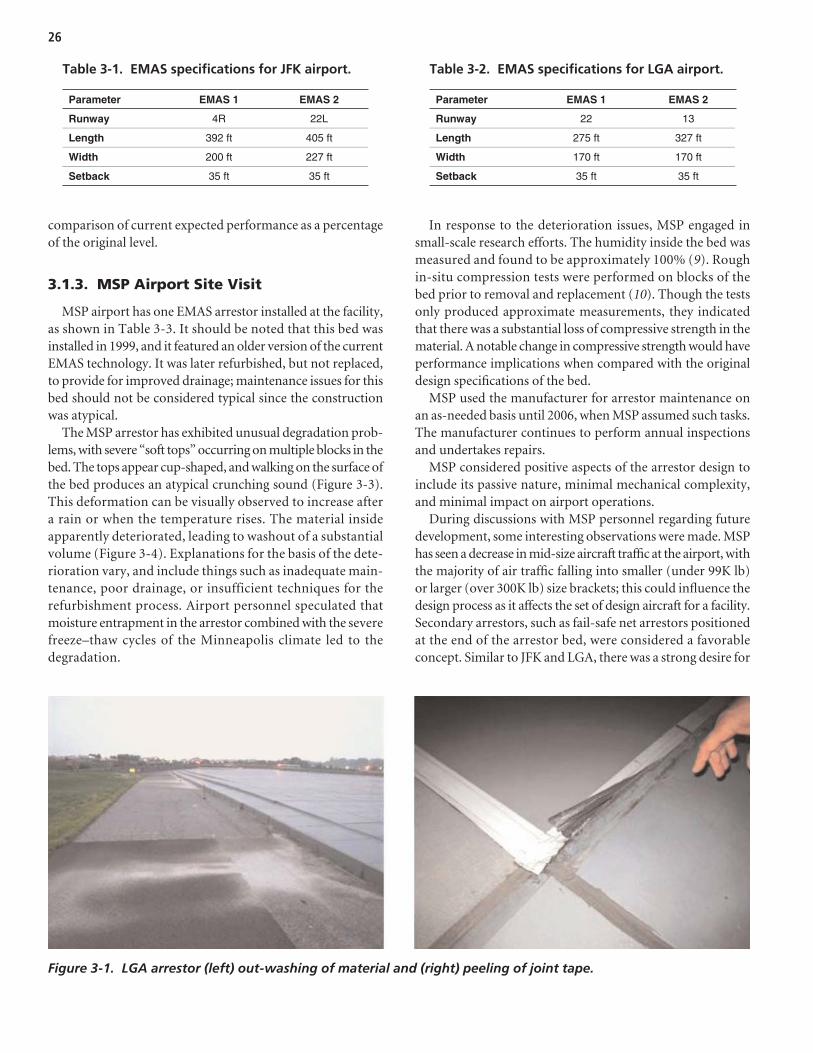
comparison of current expected performance as a percentageof the original level.
3.1.3. MSP Airport Site Visit
MSP airport has one EMAS arrestor installed at the facility,as shown in Table 3-3. It should be noted that this bed wasinstalled in 1999, and it featured an older version of the currentEMAS technology. It was later refurbished, but not replaced,to provide for improved drainage; maintenance issues for thisbed should not be considered typical since the constructionwas atypical.
The MSP arrestor has exhibited unusual degradation prob-lems, with severe “soft tops” occurring on multiple blocks in thebed. The tops appear cup-shaped, and walking on the surface ofthe bed produces an atypical crunching sound (Figure 3-3).This deformation can be visually observed to increase aftera rain or when the temperature rises. The material insideapparently deteriorated, leading to washout of a substantialvolume (Figure 3-4). Explanations for the basis of the dete-rioration vary, and include things such as inadequate main-tenance, poor drainage, or insufficient techniques for therefurbishment process. Airport personnel speculated thatmoisture entrapment in the arrestor combined with the severefreeze–thaw cycles of the Minneapolis climate led to thedegradation.
In response to the deterioration issues, MSP engaged insmall-scale research efforts. The humidity inside the bed wasmeasured and found to be approximately 100% (9). Roughin-situ compression tests were performed on blocks of thebed prior to removal and replacement (10). Though the testsonly produced approximate measurements, they indicatedthat there was a substantial loss of compressive strength in thematerial. A notable change in compressive strength would haveperformance implications when compared with the originaldesign specifications of the bed.
MSP used the manufacturer for arrestor maintenance onan as-needed basis until 2006, when MSP assumed such tasks.The manufacturer continues to perform annual inspectionsand undertakes repairs.
MSP considered positive aspects of the arrestor design toinclude its passive nature, minimal mechanical complexity,and minimal impact on airport operations.
During discussions with MSP personnel regarding futuredevelopment, some interesting observations were made. MSPhas seen a decrease in mid-size aircraft traffic at the airport, withthe majority of air traffic falling into smaller (under 99K lb)or larger (over 300K lb) size brackets; this could influence thedesign process as it affects the set of design aircraft for a facility.Secondary arrestors, such as fail-safe net arrestors positionedat the end of the arrestor bed, were considered a favorableconcept. Similar to JFK and LGA, there was a strong desire for
26
Parameter EMAS 1 EMAS 2
Runway 4R 22L
Length 392 ft 405 ft
Width 200 ft 227 ft
Setback 35 ft 35 ft
Table 3-1. EMAS specifications for JFK airport.
Parameter EMAS 1 EMAS 2
Runway 22 13
Length 275 ft 327 ft
Width 170 ft 170 ft
Setback 35 ft 35 ft
Table 3-2. EMAS specifications for LGA airport.
Figure 3-1. LGA arrestor (left) out-washing of material and (right) peeling of joint tape.

instrumentation, embedded or otherwise, that could char-acterize the arrestor bed’s internal condition and expectedperformance capabilities.
3.2. Participating Survey Airports
Surveys were sent to 16 airports, and 14 of those airportsreturned completed surveys. The airport names, location IDs,aircraft rescue and fire fighting (ARFF) indexes, approximatenumber of annual operations, and number of EMAS arrestorsare shown in Table 3-4.
3.3. Standard EMAS
FAA AC 150/5220-22a defines an EMAS as standard if it hasthe capacity to arrest an aircraft at 70 knots (1). A non-standardEMAS is compliant if it has the capacity to arrest an aircraftat the minimum exit speed of 40 knots. To assess airportconformity with these requirements, airports with an EMASwere asked whether each of their arrestors was standard.Airports that returned surveys had installed 11 arrestorsaltogether. Four of those 11 arrestors were listed as standard,and 7 of them were listed as non-standard (Figure 3-5).
Each EMAS receives an exit speed rating for all the aircraftthat it must service. Typically, some aircraft can be arrested at
higher exit speeds than others. Airports were asked to providethe design aircraft and corresponding exit speed ratings foreach EMAS.
For the 11 arrestor systems of the survey, 37 aircraft/exit-speed combinations were reported. These combinationsconstituted the design cases for the arrestors. The distributionof design cases over intervals from 0 to 80 knots is shown in Fig-ure 3-6. Of all the design cases, 14% of the aircraft had designexit speeds below 40 knots; 62% had design speeds between40 and 70 knots; and 24% had design exit speeds greater than70 knots. For the cases below 40 knots, it should be noted thatthe arrestor beds involved still met the 40-knot standard fora number of aircraft, but not all aircraft listed.
3.4. FAA Requirements
As part of the survey, airport operators were questionedabout FAA requirements pertaining to arrestors. When askedwhether FAA requirements for arrestor bed performanceare too rigid, 8% responded yes, 54% responded no, and 38%responded no opinion. Similarly, when asked whether FAArequirements for RSA dimensions are too rigid, 31% respondedyes, 46% responded no, and 23% responded no opinion. Theseresults are also shown in Figure 3-7.
Airport operators were also asked to provide verbal commen-tary on FAA requirements concerning arrestor bed perfor-mance and RSA dimensions. Those comments are summarizedin the following list:
• The 70-knot requirement for the standard arrestor couldbe lower;
• FAA regulations could consider that, in some cases, an RSAwith an arrestor is safer than an RSA that satisfies generaldimensional requirements; and
• FAA regulations could consider permitting damage to nosegear in extreme overrun scenarios.
27
Figure 3-2. LGA arrestor: peeling paint.
Parameter EMAS 1
Runway 12R
Length 160 ft
Width 216 ft
Setback 630 ft
Table 3-3. EMAS specificationsfor MSP airport.
Figure 3-3. MSP Airport: soft tops on EMAS blocks.

3.5. Installation
3.5.1. Cost
Airport operators were asked to provide the preparatorypaving cost and installation cost for each arrestor installed attheir airport. A total of 8 airports provided preparatory pavingand installation costs for a total of 11 arrestors. These arrestorswere installed from 1999 to 2007. By way of comparison, the
cost design values according to FAA Order 5200.9 were basedon 5 separate EMAS installations.
The mean cost values reported by the airports are shown inTable 3-5. They were normalized by the associated pavementand bed areas. The survey costs were corrected for inflation andare expressed in 2007 dollars. For comparison, the suggestedvalues of preparatory paving cost and installation cost fromFAA Order 5200.9 are included in the table, in 2007 dollars (30).
28
Figure 3-4. MSP airport: material out-wash.
Airport Name Loc. ID ARFF Index
Annual Operations
No. EMAS
Anchorage International ANC E 289,472 0
Baton Rouge Metropolitan BTR C 94,852 1
Boston Logan International BOS E 409,066 2
Denver International DEN E 586,151 0
Minneapolis–St. Paul International MSP E 475,000 1
Nashville International BNA C 215,830 0
New York Kennedy International JFK E 411,145 2
New York La Guardia Airport LGA D 404,990 2
Pittsburgh International PIT D 237,696 0
Roanoke Regional ROA B 86,091 1
San Diego International SAN D 220,485 1
Seattle Tacoma International SEA E 340,058 0
Teterboro TEB E 250,000 1
Ronald Reagan Washington National DCA C 278,151 0
Table 3-4. Airports participating in the survey of U.S. airportoperators (29).

As shown, the mean reported paving and installation costswere significantly higher than the design costs estimated inFAA Order 5200.9.
Figure 3-8 compares the total cost to establish an EMAS(CTEE) based on the survey data and cost estimates fromOrder 5200.9. The CTEE is the sum of the preparatory andinstallation costs. Individual data points indicate the costs forthe arrestor beds from the surveyed airports. For the purposesof comparison, the survey and estimated Order 5200.9 costswere normalized to a runway width of 150 ft and convertedto 2007 dollars.
Figure 3-9 compares the estimated life-cycle cost over a20-year period, calculated per the methods outlined in Order5200.9. The life-cycle costs are based on a combination of theCTEE, the annual maintenance costs, and a full bed replace-ment after 10 years. Using this method, the life cycle costs canbe calculated using either the reported survey costs or estimatesbased on Order 5200.9.
In the plot, the longer-dashed line defines the maximumfeasible cost in FAA Order 5200.9, which is considered the
per-RSA upper cost threshold for EMAS. If life-cycle costs forthe RSAs are calculated using the estimated EMAS costs fromOrder 5200.9, the data points fall below the maximum feasiblecost line. However, when actual reported costs from the sur-vey are used, the overall cost trend is substantially higher thanthe threshold.
A point of contrast with the CTEE data is that the life-cycle costs are calculated per RSA, rather than per EMASbed. Typically, a runway has an EMAS located on only one end. However, for one of the surveyed airports, twoEMAS beds were on the same runway. This case is shown in the right-most two data points of Figure 3-8, which aremerged into one per-RSA data point on the right side ofFigure 3-9.
3.5.2. Inconvenience
Airport operators were asked to rate the inconvenience ofinstalling an EMAS from one (none) to five (severe). Eightoperators responded, and the results are shown in Figure 3-10.
29
Non-Standard
64%
Standard36%
Figure 3-5. Percentage of standard and non-standard EMAS.
0
2
4
6
8
10
12
0-40 40-45 45-50 50-55 55-60 60-65 65-70 70-75 75-80
Fre
quen
cy
Exit Speed [kts]
Figure 3-6. Exit speed histogram for design aircraft cases of survey.
No46%
Yes31%
NoOpinion
23%
No54%
Yes8%
NoOpinion
38%
FAA RSA DimensionRequirements Too Rigid?
FAA Bed PerformanceRequirements Too Rigid?
Figure 3-7. Airport operator perception of FAA requirements.

30
FAA Order 5200.9
Survey
Normalized Preparatory Paving Cost per Square Foot
$15 $48
Normalized Installation Cost per Square Foot
$85 $134
Cost to Establish EMAS (CTEE) per Square Foot
$100 $182
Cost for 150 x 300-ft Bed $4.5M $8.2M
Table 3-5. Normalized mean costs from surveycompared with FAA Order 5200.9 (2007 dollars).
300
Bed Length [ft]
Co
st [
$M]
350150
10
0
2
4
6
8
12
14
16
200 250 400
Survey CTEE
Fit - Survey CTEE
Order 5200.9 CTEE
Fit - Order 5200.9 CTEE
450
Figure 3-8. Comparison of cost to establish EMAS (CTEE) per bed fromOrder 5200.9 and project survey (2007 dollars).
300
Bed Length [ft]
Co
st [
$M]
350150
10
15
20
30
25
0
5
35
200 250 400
Fit - Order 5200.9 Life-Cycle Cost
Fit - Survey Life-CycleCost
Survey Life-Cycle Cost
Order 5200.9 MaxFeasible Cost
Order 5200.9 Life-CycleCost
450
Figure 3-9. Comparison of life-cycle costs for EMAS per RSA from Order 5200.9and project survey (2007 dollars).
From the figure, installation of an EMAS was moderatelyinconvenient, with an average rating of 3.4.
Operators were also asked to provide verbal commentaryon the cost and inconvenience of installing the arrestor beds.These comments are characterized as follows:
• Installing the arrestors is too expensive;• The need to repave the surface supporting the arrestor is
expensive and inconvenient; and• Future arrestor installations will be subjected to wetland
and environmental permit approval.

3.6. Maintenance
Airport operators were asked to provide the annual costof maintaining their arrestors. Six airports provided annualmaintenance costs for eight beds. Those maintenance costswere divided by the area of the associated arrestor bed toobtain a cost per square foot of arrestor bed. There was a sig-nificant amount of scatter in the maintenance costs reportedby airports, and the average was significantly higher than thevalues suggested by FAA Order 5200.9. The results are shownin Table 3-6. Mean, high, and low costs are included in thetable and compared to the value in Order 5200.9. For com-parison, the survey values were divided by the Order 5200.9value to provide a ratio to its value.
To assess the durability of the current EMAS technology,airports were asked to rate the severity of maintenance require-ments for the arrestors on a scale of 1 (none) to 5 (severe).Airports were questioned about maintenance requirementsin the following six categories: peeling paint, leaching of thematerial, caulking failure, joint tape debonding, soft tops onarrestor bed, and drainage problems. The severity of main-tenance requirements by category, with respect to the yearthat the arrestor was installed, are shown in Figure 3-11 (left).Responses for arrestors that were installed in the same yearwere averaged. Average maintenance, which is the average ofthe maintenance numbers from each of these six categories,is included in Figure 3-11 (right).
From Figure 3-11, airport operators perceive the currentEMAS to require a significant amount of maintenance. In fact,for all years prior to 2006 (except 2004), the average mainte-nance requirement was above three. That is, in most cases,airport operators perceive the arrestors to require mainte-nance closer to severe than to none.
Whether the airport had a maintenance contract with the manufacturer had little effect on the average mainte-nance required. That is, the weighted average maintenance
31
None (1)0% Mild (2)
12%
Moderate (3)50%
Substantial (4)25%
Severe (5)13%
Figure 3-10. Inconvenience of arrestor system installation.
Mean Low High Order5200.9
Maintenance Cost [$/ft2] $3.05 $0.11 $6.89 $0.36
Ratio of Order 5200.9 8.5 0.3 19.1 1.0
Table 3-6. Maintenance costs from survey comparedwith Order 5200.9 values.
Mai
nte
nan
ce R
equ
irem
ents
Year
Peeling paint Leaching
Caulk failure Tape debonding
Soft tops Drainage problems
Mai
nte
nan
ce R
equ
irem
ents
Year
Figure 3-11. Maintenance by category (left) and average maintenance (right).

for arrestors with a manufacturer contract was 3.0, while theweighted average maintenance for arrestors without a manu-facturer contract (maintenance was performed either by localcontractors or airport personnel) was 2.7.
In addition to providing numerical responses, airport oper-ators provided verbal commentary on the maintenance require-ments. When asked to describe the negative traits of their EMASsystems, many cited maintenance problems. Their responsesare summarized as follows:
• Arrestor beds require continual maintenance and inspection,which are both expensive and inconvenient;
• The durability of the arrestors is uncertain, and the effectof possible deterioration on performance is unknown;
• Airports with arrestors installed prior to 2003 mentionedthat the top layer of the beds tended to deteriorate; and
• The arrestor beds are susceptible to being damaged by airportoperations vehicles.
When airport operators were asked about what changesshould be made to the arrestor design, the durability was againa significant concern. Comments pertaining to durability andmaintenance are summarized below:
• A means should be developed for assessing the arrestingcapability of an installed arrestor;
• The inconvenience of maintaining the bed should bedecreased;
• Adherence of paint should be improved; and• The method of taping and caulking to seal tops of bed
blocks could be improved.
It should be noted that the manufacturer has developed asecond-generation top—colored plastic as opposed to thefirst-generation painted cement board—that it claims is moredurable.
3.7. Observations for SurveyRegarding EMAS
The survey respondents and site visit personnel had avariety of opinions, ideas, and desires regarding the currentEMAS technology. Issues regarding maintenance varieddue to differences in region, bed age, etc. With respect to themaintenance-related responses, it should be considered thatEMAS designs have been improved over time, and now usedifferent environmental protection measures than in the past.Not all user responses reflected experience with the mostrecent version of available EMAS designs.
Many respondents expressed a desire to incorporate inte-grated sensing technologies into the arrestor beds to monitor
their physical condition over time. Representatives from theFAA indicated that such sensing methods may or may not befeasible for the future due to several technical complications.Laboratory tests have underscored the difficulties associatedwith this concept.
Costs for an EMAS appear to exceed the expectations ofFAA Order 5200.9 with regard to the three main categories:preparation, installation, and maintenance. While the surveyincluded more airports than the original data set used to createOrder 5200.9, it did not include all EMAS systems installed atU.S. airports. It is possible that the average costs could shiftonce the remaining airports were included.
3.8. Perception of Active Arrestor
3.8.1. Survey of U.S. Airport Operators
Airport operators were asked how comfortable they wouldbe with installing a net-based or cable-based active arrestorfor civil aircraft. The possible responses were not comfortable,low, moderate, and highly comfortable. The results are shownin Figure 3-12. A full 86% of respondents were either notcomfortable or had low comfort with use of an active arrestorfor civil aircraft. None of the operators responded with “highlycomfortable.”
3.8.2. Other Aviation Organizations
As part of the survey effort, 23 individuals, many repre-senting pilot organizations, were contacted to provide inputon the appropriateness of active arrestors for civil aircraft.Appendix B provides a list of the organizations contacted.These individuals were selected to provide insight into theperspective of pilots and other aviation personnel.
32
NotComfortable
64%
Moderate14%
Low22%
Figure 3-12. Level of comfort with active arrestor.

Of the 23 individuals contacted, only 3 completed the cir-culated questionnaire. Therefore, available comments fromthis group cannot be taken as representative of the broaderaviation or pilot communities. However, their comments,which are summarized below, provide some insight into howdeployment of an active arrestor for civil aircraft would bereceived.
• Active arrestors are inappropriate for civil aircraft:– Active arrestors involve too many potential complications.– Net-based or cable-based engagement would likely hinder
passenger egress once the aircraft has stopped.• Any activation of the arrestor should be under the control
of the pilot, not the air traffic controller.• The location of any arrestor at an airport should be noted
on airport diagram charts using a standardized format.
3.9. Observations for SurveyRegarding Active Arrestors
Overall, the concept of an active arrestor was not wellreceived by the survey participants. Contributing issues thathave been identified include the historical need for personnelto activate such an arrestor, determining whether groundpersonnel or pilots would have control over the activation,and a sense of unreliability due to the mechanical complexityof such systems.
Countering these concerns, several automated triggeringconcepts have been developed that could remove the need formanual activation, and pilot control or override can be incor-porated in such systems (Section 7.7). Later sections discussthat the reliability of active systems can actually be higher thanthat of the current EMAS technology, even though passivesystems have no moving parts (Section 5.2.2).
33

34
4.1. Relevant Literature
Of the documents reviewed, those most relevant to deter-mining the basis of FAA parameters governing the arrest ofcivil aircraft are as follows:
AC 150/5220-9a. Aircraft Arresting Systems on Civil Airports.FAA, 2006.
AC 150/5220-22a. Engineered Materials Arresting Systems(EMAS) for Aircraft Overruns. FAA, 2005.
Order 5200.9. Financial Feasibility and Equivalency of RunwaySafety Area Improvements and Engineered Material ArrestingSystems. FAA, 2004.
Order 5200.8. Runway Safety Area Program. FAA, 1999.Runway Safety Area Status Database. FAA, 2007.
4.2. Parameter Diagram
Figure 4-1 illustrates the FAA parameters governing civilaircraft arrestors. Parameters specifically cited in the EMASadvisory circular (or elsewhere) are shown with underscores.
At the most general level, the parameters were categorizedas either inputs or outputs. Many of the inputs listed areessentially requirements, and these requirements can apply tothe initial or final conditions of an arresting event. The man-ner in which the FAA drafts its requirements will govern theoutputs: arrestor cost, size, performance, and so on. As such,one could summarize by saying that the inputs are requirementsand the outputs are consequences of the requirements. Changesin the requirements will have an impact on system cost, themanner of the arrestor function, and so on.
4.3. Parameter Relationships
Figure 4-2 illustrates a detailed version of the prior param-eter diagram, showing the relationships from a standpoint ofdesigning and installing an arrestor.
The performance requirements, as set forward by theFAA, combined with the site constraints, would drive theselection of an appropriate arrestor type for the facility. For civil applications, there is currently only one EMASoption; however, this could broaden upon approval of otheralternatives.
Given the performance requirements of the standards andthe site constraints, the specific arrestor design for the facilitywould be determined. This final system design determines thecost for the system installation. The arrestor type determinesthe nature of the maintenance and repairs required, directlyaffecting those cost components. The arrestor type also has themost substantial impact on the installation time, service life,and downtime during repairs. The particular specificationsof the installed system do not have a great effect on the timecomponents.
From a regulatory standpoint, the performance requirementsput forward by the FAA regarding exit speeds and the post-event aircraft condition (permissible level of damage) havethe most tangible impact on system cost. While other factorsmay affect cost as well, the connectivity is more difficult toquantify. Chapter 5 demonstrates the cost impact of theseparameters.
Figure 4-3 illustrates the parameter relationships for anoverrun event. Within this context, design considerations areno longer relevant. The diagram assumes that all design deci-sions were previously made and that an arrestor system hasbeen installed at the facility.
During an arresting event, the initial conditions (upper left)of the aircraft type, exit speed, etc., interact with the arrestorsystem to produce a performance output. The arrestor trans-lates the overrun conditions into deceleration loads on theplane, an overall stopping distance, etc.
The arrestor type and specifications will impact the performance significantly. As the research later shows, dif-ferent arrestor types have different inherent performancecapabilities.
C H A P T E R 4
Review and Documentation of FAA Parameters
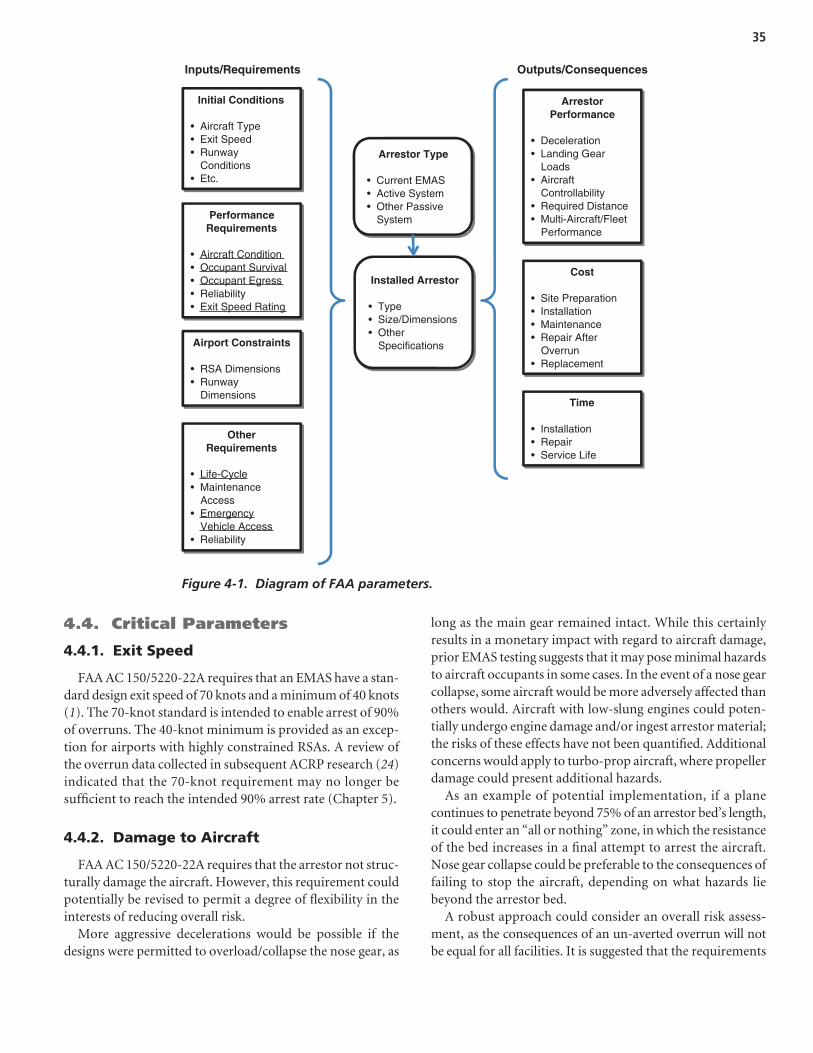
4.4. Critical Parameters
4.4.1. Exit Speed
FAA AC 150/5220-22A requires that an EMAS have a stan-dard design exit speed of 70 knots and a minimum of 40 knots(1). The 70-knot standard is intended to enable arrest of 90%of overruns. The 40-knot minimum is provided as an excep-tion for airports with highly constrained RSAs. A review ofthe overrun data collected in subsequent ACRP research (24)indicated that the 70-knot requirement may no longer besufficient to reach the intended 90% arrest rate (Chapter 5).
4.4.2. Damage to Aircraft
FAA AC 150/5220-22A requires that the arrestor not struc-turally damage the aircraft. However, this requirement couldpotentially be revised to permit a degree of flexibility in theinterests of reducing overall risk.
More aggressive decelerations would be possible if thedesigns were permitted to overload/collapse the nose gear, as
long as the main gear remained intact. While this certainlyresults in a monetary impact with regard to aircraft damage,prior EMAS testing suggests that it may pose minimal hazardsto aircraft occupants in some cases. In the event of a nose gearcollapse, some aircraft would be more adversely affected thanothers would. Aircraft with low-slung engines could poten-tially undergo engine damage and/or ingest arrestor material;the risks of these effects have not been quantified. Additionalconcerns would apply to turbo-prop aircraft, where propellerdamage could present additional hazards.
As an example of potential implementation, if a planecontinues to penetrate beyond 75% of an arrestor bed’s length,it could enter an “all or nothing” zone, in which the resistanceof the bed increases in a final attempt to arrest the aircraft.Nose gear collapse could be preferable to the consequences offailing to stop the aircraft, depending on what hazards liebeyond the arrestor bed.
A robust approach could consider an overall risk assess-ment, as the consequences of an un-averted overrun will notbe equal for all facilities. It is suggested that the requirements
35
Initial Conditions
• Aircraft Type• Exit Speed• Runway
Conditions• Etc.
Performance Requirements
• Aircraft Condition• Occupant Survival• Occupant Egress• Reliability• Exit Speed Rating
Airport Constraints
• RSA Dimensions• Runway
Dimensions
Other Requirements
• Life-Cycle • Maintenance
Access• Emergency
Vehicle Access• Reliability
Arrestor Type
• Current EMAS• Active System• Other Passive
System
Arrestor Performance
• Deceleration • Landing Gear
Loads• Aircraft
Controllability• Required Distance• Multi-Aircraft/Fleet
Performance
Cost
• Site Preparation• Installation• Maintenance• Repair After
Overrun• Replacement
Time
• Installation• Repair• Service Life
Inputs/Requirements Outputs/Consequences
Installed Arrestor
• Type• Size/Dimensions• Other
Specifications
Figure 4-1. Diagram of FAA parameters.
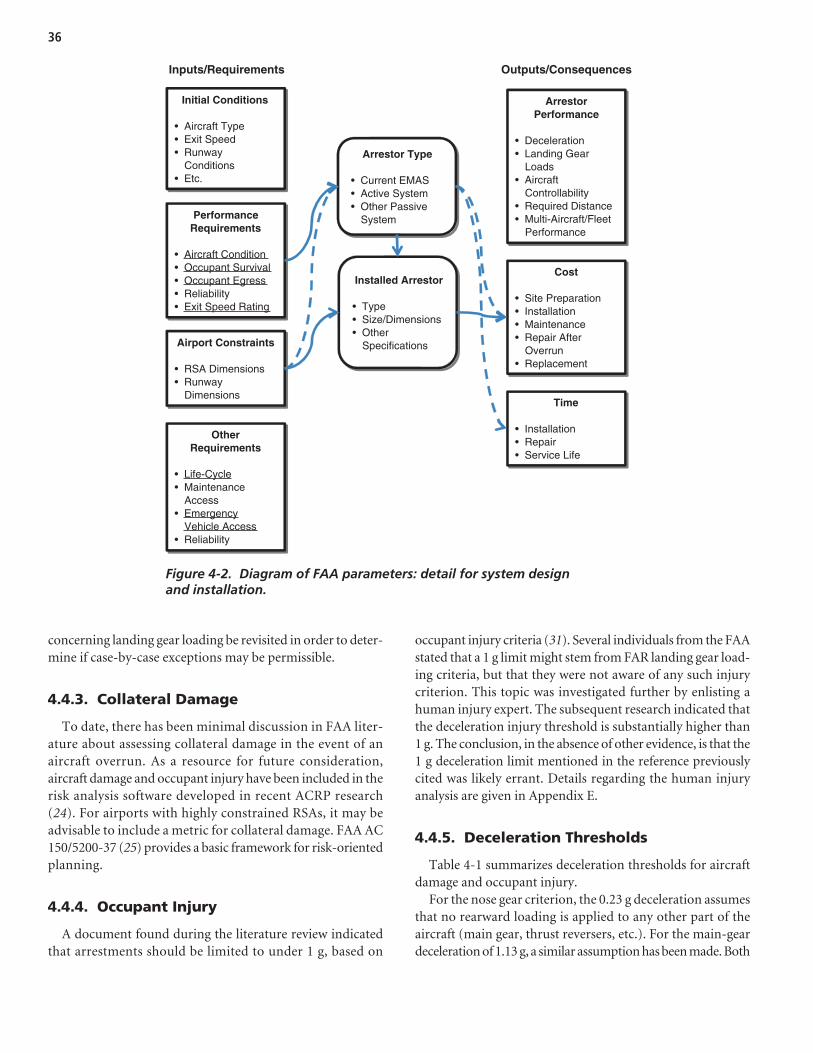
concerning landing gear loading be revisited in order to deter-mine if case-by-case exceptions may be permissible.
4.4.3. Collateral Damage
To date, there has been minimal discussion in FAA liter-ature about assessing collateral damage in the event of anaircraft overrun. As a resource for future consideration,aircraft damage and occupant injury have been included in therisk analysis software developed in recent ACRP research(24). For airports with highly constrained RSAs, it may beadvisable to include a metric for collateral damage. FAA AC150/5200-37 (25) provides a basic framework for risk-orientedplanning.
4.4.4. Occupant Injury
A document found during the literature review indicatedthat arrestments should be limited to under 1 g, based on
occupant injury criteria (31). Several individuals from the FAAstated that a 1 g limit might stem from FAR landing gear load-ing criteria, but that they were not aware of any such injurycriterion. This topic was investigated further by enlisting ahuman injury expert. The subsequent research indicated thatthe deceleration injury threshold is substantially higher than1 g. The conclusion, in the absence of other evidence, is that the1 g deceleration limit mentioned in the reference previouslycited was likely errant. Details regarding the human injuryanalysis are given in Appendix E.
4.4.5. Deceleration Thresholds
Table 4-1 summarizes deceleration thresholds for aircraftdamage and occupant injury.
For the nose gear criterion, the 0.23 g deceleration assumesthat no rearward loading is applied to any other part of theaircraft (main gear, thrust reversers, etc.). For the main-geardeceleration of 1.13 g, a similar assumption has been made. Both
36
Initial Conditions
• Aircraft Type• Exit Speed• Runway
Conditions• Etc.
Performance Requirements
• Aircraft Condition• Occupant Survival• Occupant Egress• Reliability• Exit Speed Rating
Airport Constraints
• RSA Dimensions• Runway
Dimensions
Other Requirements
• Life-Cycle • Maintenance
Access• Emergency
Vehicle Access• Reliability
Arrestor Type
• Current EMAS• Active System• Other Passive
System
Arrestor Performance
• Deceleration • Landing Gear
Loads• Aircraft
Controllability• Required Distance• Multi-Aircraft/Fleet
Performance
Cost
• Site Preparation• Installation• Maintenance• Repair After
Overrun• Replacement
Time
• Installation• Repair• Service Life
Inputs/Requirements Outputs/Consequences
Installed Arrestor
• Type• Size/Dimensions• Other
Specifications
Figure 4-2. Diagram of FAA parameters: detail for system design and installation.

37
Initial Conditions
• Aircraft Type• Exit Speed• Runway
Conditions• Etc.
Performance Requirements
• Aircraft Condition• Occupant Survival• Occupant Egress• Reliability• Exit Speed Rating
Airport Constraints
• RSA Dimensions• Runway
Dimensions
Other Requirements
• Life-Cycle • Maintenance
Access• Emergency
Vehicle Access• Reliability
Arrestor Type
• Current EMAS• Active System• Other Passive
System
Arrestor Performance
• Deceleration • Landing Gear
Loads• Aircraft
Controllability• Required Distance• Multi-Aircraft/Fleet
Performance
Cost
• Site Preparation• Installation• Maintenance• Repair After
Overrun• Replacement
Time
• Installation• Repair• Service Life
Inputs/Requirements Outputs/Consequences
Installed Arrestor
• Type• Size/Dimensions• Other
Specifications
Figure 4-3. Diagram of FAA parameters: detail for arresting event performance.
Event/Criteria Deceleration
Nose Gear Rearward Failure 0.23 g
Main-Gear Rearward Failure 1.13 g
Combined Main- and Nose-Gear Rearward Failure 1.36 g
Long duration (typical arrest) 4.00 g Traumatic Brain Injury (TBI) Threshold
Short duration (<1 sec) 9.00 g
Typical EMAS Deceleration (Section 5.2.1) ~ 0.35 to 0.85 g
Table 4-1. Deceleration thresholds for aircraft damageand occupant injury.

of these values represent cases that, in practice, are probablyunattainable. Surface-based arrestors will apply a decelerationload to the main and nose gear struts simultaneously.
As such, the combined main and nose gear deceleration of1.36 g is the most useful landing gear metric. It representsthe theoretical limit for aircraft deceleration that could beobtained by perfectly distributed loading of the main and nosegear struts, such that all struts were at their maximal loadingthresholds simultaneously. While not realistically attainable,the 1.36 g deceleration would represent the ideal case.
The long-duration traumatic brain injury (TBI) thresh-old is most appropriate for application to typical aircraftarrests, which would last for several seconds. For short-duration pulsed loads, the 9 g limit could be assumed instead.Details regarding the human injury analysis are given inAppendix E.
Given the deceleration thresholds indicated, the aircraftlimit loads would constrain the arrestment rate, rather thanoccupant injury criteria. The landing gear loads have been thehistorical limitation for EMAS designs. The nose and maingear are not loaded in an ideal fashion, with the nose gear loadgenerally limiting the obtainable decelerations to 0.35 to 0.85 g.
Perhaps the only realistic way in which to obtain higherdecelerations for an aircraft is via an active arrestor system,using either cables or barrier nets to engage the aircraft. Suchsystems would open the possibility of exceeding the 1.36 glimitation, at which point the 4 g TBI criterion would becomethe performance constraint. Obviously, arrestment distancescould be reduced significantly. Offsetting this advantage, air-frame damage could result from such loads on the aircraft.Assessing the potential impact to the aircraft was beyond theresearch scope.
38

39
ESCO generously supplied the research team with plots ofvelocity versus distance for several EMAS design cases. Thecases were best-performance arrestor designs for three aircraft:the CRJ-200, B737-800, and B747-400. From these plots, asubstantial amount of data was derived for the sensitivityanalysis. Technical details for the following subsections arefound in Appendix C.
5.1. Introduction
The sensitivity analysis investigated the dependence of costand reliability on mechanical parameters. Life-cycle issues,such as the durability of the bed, were not considered as partof the sensitivity analysis. Only the parameters discussed inChapter 4 that have bearing on the mechanics of arrestmentare included in this sensitivity analysis (Table 5-1).
5.1.1. Reliability
The reliability of an EMAS refers to the percentage of over-runs arrested for a given configuration. Reliability is inherentlya probabilistic measure, and there are two empirical studiesthat have been conducted to establish relationships betweencumulative percentage of overruns and exit speed. The firstof these was discussed in DOT/FAA/CT-93/80 (5). A morerecent study was conducted by the ACRP (24). Both studieswere considered as part of this analysis.
Data was extracted from Figure 1 in DOT/FAA/CT-93/80and from an overrun database compiled by the ACRP. Thetwo sets of data were used to create cumulative distributionplots of overruns as a function of exit speed. As Figure 5-1shows, the trends of the older and newer data differ.
5.1.2. Cost
The cost parameter in Table 5-1 refers to the total initialcost for an EMAS, including the preparatory paving cost and
installation cost, but not recurring maintenance costs. There aretwo possible premises for the cost estimates: FAA Order 5200.9and the cost data from the Survey of U.S. Airport Operators(Chapter 3) (30). Results presented in this section used normal-ized cost values, and therefore did not depend on which costestimates were used.
5.2. Results and Discussion
5.2.1. Design Cases
For the purposes of the sensitivity analysis, standard designconditions were assumed: a 75-ft setback, no reverse thrust, anda 0.25 braking friction coefficient. The decelerations of thethree design aircraft—CRJ-200, B737-800, and B747-400—were significantly different. Figure 5-2 shows the mean decel-erations and error bars representing one standard deviation,the data of which was extracted manually from ESCO-provideddeceleration plots.
As a brief aside, we note here that the B747 has less thanone-half of the deceleration of a CRJ-200, which underscoresan inherent limitation of crushable material arrestors. Evenin the best-case designs (shown here), they simply are not aseffective on some plane types as others. Section 7.5 givesfurther explanation regarding the mechanical basis for thegross difference in deceleration.
For the sensitivity analysis, exit speed was varied in thevicinity of the 40-knot minimum and 70-knot standard exitspeeds. This showed the impact on cost and reliability if therequirements of the EMAS advisory circular were shifted by5 to 10 knots. All three design aircraft were used for the study,and the results associated with each aircraft type were normal-ized and averaged.
5.2.2. Reliability
To assess the sensitivity of arrestor bed reliability to changesin the critical values of exit speed, cumulative percentage of
C H A P T E R 5
Sensitivity Analysis
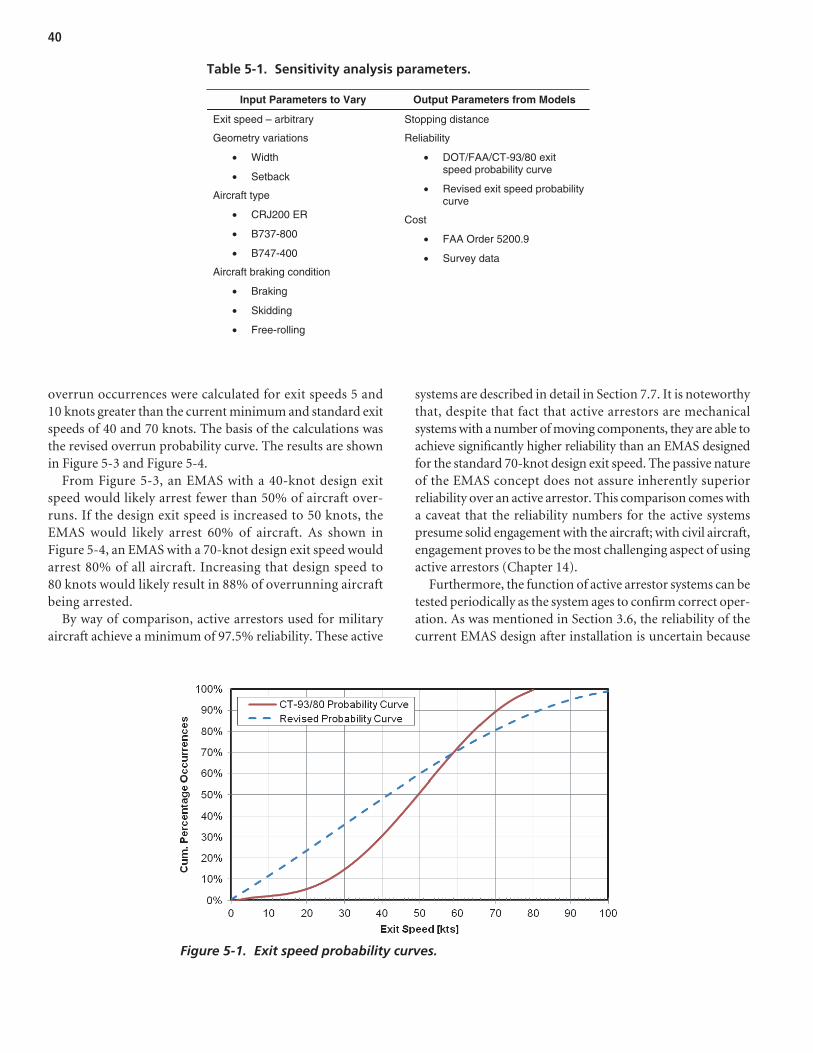
overrun occurrences were calculated for exit speeds 5 and10 knots greater than the current minimum and standard exitspeeds of 40 and 70 knots. The basis of the calculations wasthe revised overrun probability curve. The results are shownin Figure 5-3 and Figure 5-4.
From Figure 5-3, an EMAS with a 40-knot design exitspeed would likely arrest fewer than 50% of aircraft over-runs. If the design exit speed is increased to 50 knots, theEMAS would likely arrest 60% of aircraft. As shown in Figure 5-4, an EMAS with a 70-knot design exit speed wouldarrest 80% of all aircraft. Increasing that design speed to 80 knots would likely result in 88% of overrunning aircraftbeing arrested.
By way of comparison, active arrestors used for militaryaircraft achieve a minimum of 97.5% reliability. These active
systems are described in detail in Section 7.7. It is noteworthythat, despite that fact that active arrestors are mechanicalsystems with a number of moving components, they are able toachieve significantly higher reliability than an EMAS designedfor the standard 70-knot design exit speed. The passive natureof the EMAS concept does not assure inherently superiorreliability over an active arrestor. This comparison comes witha caveat that the reliability numbers for the active systemspresume solid engagement with the aircraft; with civil aircraft,engagement proves to be the most challenging aspect of usingactive arrestors (Chapter 14).
Furthermore, the function of active arrestor systems can betested periodically as the system ages to confirm correct oper-ation. As was mentioned in Section 3.6, the reliability of thecurrent EMAS design after installation is uncertain because
40
Input Parameters to Vary Output Parameters from Models
Exit speed – arbitrary
Geometry variations
• Width
• Setback
Aircraft type
• CRJ200 ER
• B737-800
• B747-400
Aircraft braking condition
• Braking
• Skidding
• Free-rolling
Stopping distance
Reliability
• DOT/FAA/CT-93/80 exit speed probability curve
• Revised exit speed probability curve
Cost
• FAA Order 5200.9
• Survey data
Table 5-1. Sensitivity analysis parameters.
Figure 5-1. Exit speed probability curves.

5.2.3. Cost
As shown in Figure 5-5 and Figure 5-6, cost sensitivitywas assessed in the vicinity of the 40-knot minimum and70-knot standard exit speeds. Sensitivity is expressed in termsof arrestor bed costs for the current design exit speeds. Theestimated cost of an EMAS with a 50-knot design exit speedis 60% greater than the cost of an EMAS with a 40-knotdesign exit speed. In addition, the estimated cost of an EMASwith an 80-knot design exit speed is about 30% greater thanthe cost of an EMAS with a 70-knot design speed. It shouldbe noted that these cost impacts would apply to any type ofEMAS and would not be confined to the current EMASdesign.
Thus, if the 70-knot exit speed in the EMAS advisory circular were increased to 80 knots, in order to return to thetargeted reliability of 90%, future construction costs could beexpected to increase by 30%, on average.
As shown in Figure 5-7, cost is essentially proportional tobed length. From a physics standpoint, the distance that a tirerolls through an EMAS is proportional to absorbed energy,
the internal condition cannot presently be tested. In light ofthe survey data, it must be acknowledged that it is possible thatdegradation of the cellular cement could decrease the per-formance—and hence, reliability—of EMAS without beingdetected.
41
0.0
0.2
0.4
0.6
0.8
1.0
1.2
CRJ200 ER B737-800 B747-400
Dec
eler
atio
n [g
's]
Increasing MTOW
Figure 5-2. Mean EMAS decelerationof design aircraft.
Figure 5-3. Reliability impact of increasing the minimum exit speed requirement.
Figure 5-4. Reliability impact ofincreasing the standard exit speed.
Figure 5-5. Cost impact of increasing the minimum exitspeed requirement.
Figure 5-6. Cost impact of increasing the standard exitspeed.
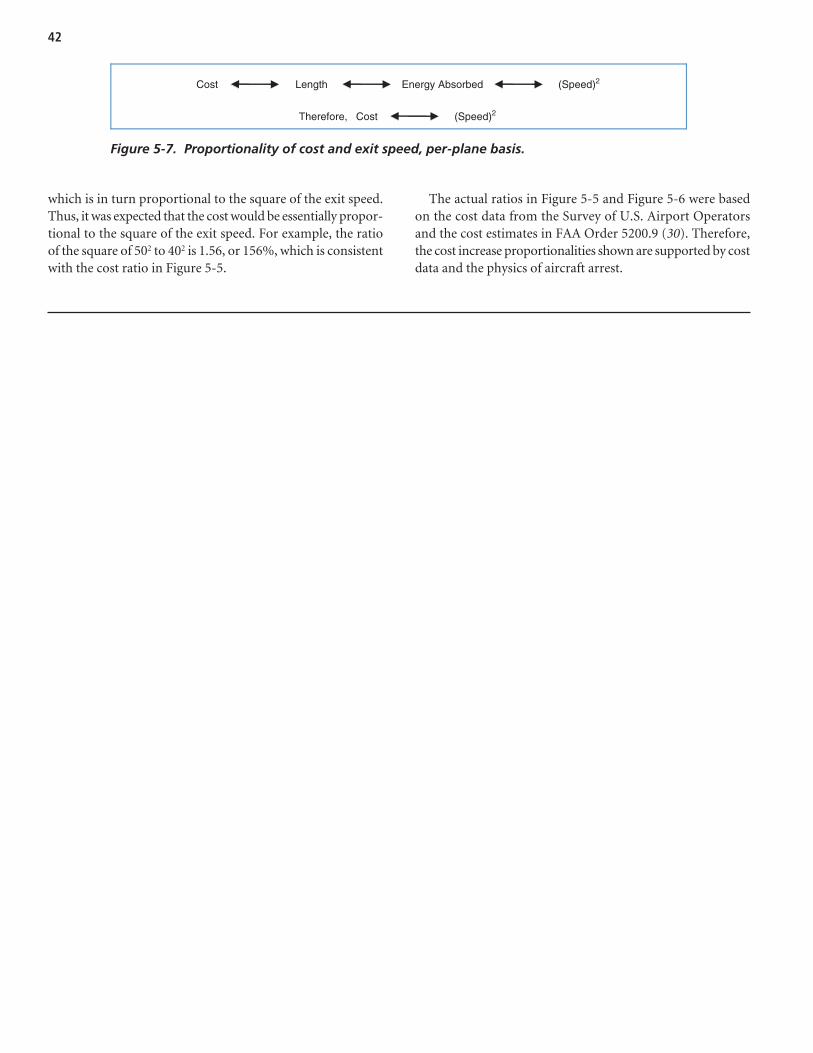
which is in turn proportional to the square of the exit speed.Thus, it was expected that the cost would be essentially propor-tional to the square of the exit speed. For example, the ratioof the square of 502 to 402 is 1.56, or 156%, which is consistentwith the cost ratio in Figure 5-5.
The actual ratios in Figure 5-5 and Figure 5-6 were basedon the cost data from the Survey of U.S. Airport Operatorsand the cost estimates in FAA Order 5200.9 (30). Therefore,the cost increase proportionalities shown are supported by costdata and the physics of aircraft arrest.
42
Cost Length Energy Absorbed (Speed)2
Therefore, Cost (Speed)2
Figure 5-7. Proportionality of cost and exit speed, per-plane basis.

43
6.1. Approval Process for New Arrestor Development
The researchers engaged in discussions with both the FAAand manufacturers regarding the approval of new arrestorsystems. Currently, only one EMAS system has obtained FAAapproval, and new entrants to the arrestor market often cannotdetermine what steps to take toward gaining approval for theirnew designs. All parties concurred that a process is neededwhereby new arrestor systems can be developed and gain FAAapproval.
As a starting point, the FAA has stated that the essentialperformance requirements contained in AC 150/5220-22awill be required for other arresting system alternatives. TheFAA has determined that the Airport Engineering/AirportSafety and Standards division, AAS-100, will act as the primarypoint of contact for companies submitting concepts.
Discussions with the FAA generated a number of ideasregarding the approval process. This report outlines a poten-tial approval process, intended as a starting point for ongoingdialogue and modification.
Based on the historical development of the EMAS conceptand the technical issues involved in arrestor systems, a two-branch approval process is proposed (Figure 6-1). A normalapproval process would be required for arrestors substantiallydifferent from the current EMAS design. For systems thatdo not differ substantially, however, a shorter “equivalence”process is recommended. When a manufacturer submits aconcept to the FAA, the first step would require identifyingwhether or not the system qualifies as a design equivalent tothe current EMAS or constitutes a different dynamic approach.This determination will then dictate what further steps themanufacturer would need to take for approval.
6.2. Normal Approval Process
The “normal” approval process would require the stagesoutlined in Figure 6-2. This process does not assume thatan arrestor is passive, nor that it engages the aircraft at the
tire/ground interface. The normal process is intended forapplication to a full spectrum of design concepts. It requiresthat a manufacturer undertake (1) initial data collection, (2)feasibility calculations, (3) first-principles computer modeling,and (4) small-scale testing. The results would be submittedto the FAA as an application for a Cooperative Research andDevelopment Agreement (CRDA). The CRDA would thenfacilitate full-scale aircraft testing, which should be requiredfor systems fundamentally dissimilar from the existing EMASdesign. After testing, the manufacturer would be required todemonstrate the ability to predict system performance witha computer model, as applied to different sizes and types of aircraft. Finally, the manufacturer would apply for FAAapproval of the system.
6.3. Equivalent Approval Process
Obviously, the normal process would require substantialfinancial investment and involve several complex steps. Forsome applicants, these factors could preclude involvement, thusstalling potential improvements to the current EMAS approach.The “equivalence” process of Figure 6-3 allows for a simplifica-tion to the normal approach if certain conditions are met.
The equivalence process would require that the new conceptconstitute an equivalent to the current EMAS design at amechanical level. It is restricted to replacement materialsthat are laid out in a geometrically similar bed and produce adynamically analogous load on the landing gear. An aggregatesystem, for example, would not constitute such an equivalent,since it has other physical mechanisms at work than a crushablefoam material (Section 7.4). Meanwhile, another crushablefoam could constitute such an equivalent. To date, many crush-able materials have been proposed as alternatives to cellularcement (Sections 7.3 and 7.4). The cellular cement could bereplaced with a different crushable medium of similar prop-erties and still obtain analogous arresting performance.
Further, the term “equivalent” is not intended to preventnew materials from superseding cellular cement. It requires
C H A P T E R 6
Approval and Commercialization Study

that the mechanical behavior be sufficiently analogous topermit the same predictive models to be employed (i.e., theARRESTOR code, etc.). However, improvements in otherareas, such as life-cycle performance, would be encouraged.
To demonstrate equivalence, the manufacturer would(1) conduct thorough material testing, (2) generate feasibil-ity calculations, (3) perform small-scale tests, and (4) make thecase for equivalence in report form. The FAA would then reviewthis report and make a determination as to how compellingthe data appears.
6.4. Updating of the ARRESTOR Code
For the near-term development of alternative materialsvia the equivalent approval process, it would be necessary tohave a prediction and planning program. ARRESTOR, thoughan old code at present, can predict arresting distances forvarious bed geometries. It models a general crushable foammaterial and permits the user to specify different compressionstrengths to be modeled. As such, ARRESTOR could serve the
44
Figure 6-1. Approval paths for system approval.
Develop Concept
Initial Data Collection & Testing• Mechanical Behavior• Life-Cycle Expectations
Initial Feasibility Calculations• Material energy capacity• Estimated arrest distance• Estimated deceleration
Initial Modeling• Numerical model (FEA, CFD,
DEM, etc) of one-wheel bogey• Vary speeds, tire pressure,
aircraft mass, landing gear configuration
Small Scale Testing• One-wheel bogey tests, or
equivalent if active system• Sample bed cross-section
environmental test
Apply for FAA Cooperative Research and Development
Agreement
Full Scale Testing• Full-scale aircraft testing using
transport-category aircraft• Requires FAA cooperation
Develop Predictive Model• Incorporate testing and modeling
data from past• Validate accuracy of model
FAA Approval
Develop Design Program• Allows planning for particular
facility
Figure 6-2. Proposed normal approval process for new arrestor systems in general.

up-and-coming manufacturers who do not have in-housepredictive codes.
ARRESTOR currently has a limited library of aircraft: theB707, 727, and 747. Only one of these aircraft is still in broadservice, the B747. To act as a modern planning tool, a broaderrange of aircraft is needed. It is possible to accomplish thisthrough two means. First, the aircraft manufacturers could besolicited for actual aircraft data. Second, the code could use a
generalized aircraft model of arbitrary size, combined withparametric variation across a range of values. Other approachesmay be possible.
Alternately, a new design program could be developed. TheArrestor Prediction Code (APC) developed in the current effort(Appendix G) could serve as the basis for such a replacement.For new manufacturers to participate actively in the arrestorsystem market, an updated predictive code would be necessary.
45
Develop Material• Depends upon material and
manufacturer
Material Testing• Mechanical Properties• Life-Cycle Properties
Initial Feasibility Calculations• Material energy capacity• Estimated arrest distance• Estimated deceleration
Small Scale Testing• One-wheel bogey tests• Sample bed cross-section
environmental test
Submit FAA Equivalence Report• Present data• Demonstrate EMAS
equivalence
FAA Approval
Integrate Into Design Program (ARRESTOR)• Allows planning for particular
facility
Figure 6-3. Proposed equivalence approval path for new crushable bed arrestor systems.

46
7.1. General Approach
The identification and ideation of different arrestor alter-natives was approached through several avenues:
• Vendors with design ideas were contacted,• Internal brainstorming meetings were undertaken,• Technical literature was reviewed, and• General web searches were undertaken.
Following the identification of alternatives, taxonomy wasdeveloped to classify the different options and provide clarity ofcomparison. An initial assessment of the alternatives led to theselection of several promising candidates for detailed research inthe experimentation phase of the effort. Please note that the TRBand ACRP do not endorse specific products. Research resultsare provided to assist in the evaluation of options by others.
7.2. Vendor-Developed Alternatives
The FAA William J. Hughes Technical Center supplied alist of manufacturers that had previously contacted them withdifferent proposed arrestor concepts, materials, or designs.Those companies were subsequently contacted to determineif there was still active interest in arrestor development.
The maturity of the different concepts varied widely. Somecompanies simply had an alternative crushable material thatcould be used in a similar manner as the current cellularcement design, but with potentially improved durability.Other companies had more well-developed ideas, includingpatents (Appendix A), design drawings, and calculations forenergy absorption. The broad range of maturity required aninitial assessment of the alternatives (Section 7.4) in order todetermine the most promising concepts for inclusion in theexperimentation stage of the research.
7.3. Classification of Alternatives
When trying to sort through the myriad of ideas devel-oped and identified, it became apparent that some of theconcepts did not differ as greatly as initially assumed. For
instance, within the domain of crushable foams, there isminimal difference in the dynamic arrestment processexpected for different materials. A crushable polymer foam,a crushable cellular cement, and a crushable metal foam willfunction in a fairly similar manner where their compressive(crush) strengths and other material properties are thesame. There are many foams available, and delving into thenuances that separate them has minimal benefit. This isespecially true when compared with the differences, forexample, between crushable foam arrestors and gravelarrestors. The dynamic responses of these arrestors are quitedifferent.
The classification structure that was developed divided thealternatives by dynamic behavior. Table 7-1 shows the classifica-tion for the different concepts in abbreviated form. Section 7.4expands upon this table and indicates those alternatives thatwere selected for the detailed research. Subsequent chapters dis-cuss the detailed research findings.
The systems were grouped into two broad classifications:passive systems, with no moving parts, and active systems,with moving mechanical components. Thereafter, they weregrouped into four categories based on the energy absorptionapproach used.
1. Crushable Materials. Crushable materials absorb energythrough permanent deformation of the material, eitherthrough brittle fracture or plastic deformation.• The aircraft is engaged at the tire/ground interface.• Current EMAS and phenolic foam beds are examples of
crushable material systems.2. Displaceable Materials. Displaceable materials do not
undergo a physical breakdown of the material itself. Instead,the material is moved, and energy is absorbed throughmomentum transfer or the internal friction of the material.The mechanical behavior of these materials is fundamentallydissimilar from the crushable material and results in a dif-ferent dynamic system response.• The aircraft is engaged at the tire/ground interface.
C H A P T E R 7
Identification and Initial Assessment of Alternatives

47
• Water ponds are included in this category, as are bedsof loose aggregate (gravel, etc.) where the individualpieces are compacted and moved, but not generallybroken.
3. Cable and Netting Systems. Cable and netting systemsutilize two components: (1) braking devices to absorbenergy (water, hydraulic, electro-magnetic, etc.), and (2) an engagement system that connects the aircraft andthe braking device (cables, nets, etc.).• Engagement can be done with an aircraft tail hook, the
main gear, or the wings.
• Military arrestors, such as the BAK-12, are included inthis category.
4. Mechanical Surface Systems. Mechanical surface systemsuse mechanical components that absorb energy as theaircraft rolls across different movable panels at groundlevel.• The aircraft is engaged at the tire/ground interface.• The concepts in this category are few, encapsulated
in the referenced U.S. Patent 6,969,213 (32); neverthe-less, this approach represents a categorically differentarresting method.
Category Subcategory Technology Covering Layer
Applicable
Current Civil Use
DetailedResearch
Cellular cement (current EMAS)
Yes Yes
Phenolic foam Yes
Metal foam Yes
Glass foam Yes Yes
Crushable foams
Depth-varying foam
Yes Yes
Loose crushable fill
Glass aggregate foam
Yes Yes
Pumice aggregate
Yes
Styrofoamaggregate
Yes
Hollow microspheres
Yes
Crushable Materials
Crushable aggregates with binder
Ceramic glass aggregate
Yes
Clay Soil
Sand Yes
Gravel Yes Loose aggregates
Engineered aggregate
Yes Yes Yes
PA
SS
IVE
SY
ST
EM
S
Displaceable Materials
Fluids Water or Glycol pond
Yes
Hydraulic brake Yes
Water impeller
Textile
Braking devices
Eddy-currentbrake
Over-wing barrier nets
Cable/Net Systems
Engagementdevices
Landing gear strut engagement
Yes
AC
TIV
E S
YS
TE
MS
Mechanical SurfaceSystems
Surface of spring-supported panels
Yes
Table 7-1. Classification of alternatives.

48
The Subcategory and Technology columns show progres-sively more detail on the concepts in each category.
The Covering Layer Applicable column indicates whether agiven concept can be combined with a covering layer. Cover-ing layers are often used to preserve the crushable or displace-able materials from the environment, jet blast, and so on. Thecurrent EMAS design uses such a “covering layer.” The latestgeneration uses thin plastic tops, while the prior generationused cement board tops. Water ponds historically had differ-ent covering concepts suggested to keep the water clean andprevent evaporation or animal intrusion. For new arrestor can-didates, a variety of creative covering layer concepts have beensuggested by different vendors, all with similar purposes—toprovide a durable top layer that protects the medium while notinterfering with its arresting function.
The Detailed Research column indicates whether a giventechnology underwent further evaluation in the experimen-tation phase of the research.
It should be noted that combined approaches could beused by coupling a passive arresting bed with an active net orcable-based arresting system.
7.4. Initial Assessment of Alternatives
The preliminary vetting process involved two components:(1) an initial physics analysis to determine if a concept hadthe energy capacity and physical feasibility to arrest and air-craft, and (2) analysis of other factors, such as flammability,environmental considerations, life-cycle performance, and so on.
Table 7-2 gives the assessment criteria that were used toevaluate different concepts. In the analysis findings that follow, criteria of minimal relevance to different technologiesare often excluded from the discussion.
As previously shown in Table 7-1, the array of alternativesis broad. Table 7-3 expands upon Table 7-1 with evaluationcomments. Arresting alternatives selected as candidates forthe experimental investigation are denoted with a “C.” Foralternatives not selected, the evaluation comments providerationales for exclusion.
7.5. Crushable Material Systems
7.5.1. Drag Loading Dynamics
In general, all of the crushable material alternatives func-tion on the same physical premise. The aircraft tires compactthe material as they roll forward through it. The compactionof the material can take several forms at the microscale: brit-tle fracture, plastic deformation, reduction in void space, andso on. However, at the macroscale, the effect is similar: the
aircraft is slowed by the drag load of the material and theenergy absorbed is proportional to the volume of materialcompacted (Figure 7-1).
Some materials, such as phenolic foam, exhibit a reboundafter compaction, where the material rises back up to a smallextent after the tire rolls over it. This rebound is inherentlyinefficient and undesirable. The currently used cellular cementis advantageous because it has nearly zero rebound.
7.5.2. Essential Material Properties
To select a crushable material that is suitable for an arrestorbed, several properties must be considered. Figure 7-2 illus-trates a typical compression stress-strain curve for a crushablefoam.
The load increases up to a plateau value, typically desig-nated as the compressive strength of the foam (σu). Duringthe plateau stage, the foam is compacted, and the void spacesof the foam microstructure collapse. When the void spaceshave been fully compacted, the plateau ends and the materialhardens. The degree of compression that has occurred at theend of this plateau will be referred to as the maximum com-pressive strain of the material (εmax). In actuality, furthercompression can take place, but not without dramaticallyhigher compression forces. For the purposes of the arrestorapplications, the concept of maximum compressive strain isuseful.
The maximum compression helps determine the overallenergy absorption potential for the material because energyabsorption relates to the area under the stress-strain curve.Greater maximum compression strain values correspondto long plateau regions in the load curve and high energyabsorption.
7.5.3. Effect of Landing Gear Configuration
The configuration of the tires on the aircraft’s strutsdirectly affects the efficiency of the crushable material sys-tems. Figure 7-3 shows several landing gear tire configu-rations; in each case, only the leading tires participate incrushing the material and generate drag load. However, thevertical load on the strut is divided among all the tires. Thedual configuration, and analogs to it, forms the most efficientcoupling, since all tires participate in generating drag load.The dual tandem and tridem configurations are less efficient,regardless of the particular crushable material used. Theseefficiency reductions would typically only apply to the mainstruts of the aircraft because inline tires are uncommon for thenose gear.
The pneumatic pressure of the tires has an effect on thetire-material interface. Often referred to as “flotation,” theground pressure affects how much the tires sink into a soft

49
Criteria/Requirements Comments
Arresting Performance
Energy absorption The system must have the energy absorption capacity to arrest the aircraft.
Mechanical engagement The system must effectively engage the aircraft for the energy capacity to be employed.
Scalability The system must either actively or inherently scale its stopping force appropriate to the aircraft size/type toprevent overly abrupt deceleration of smaller aircraft while not sacrificing capabilities with larger aircraft.
Reliability Device complexity in general will increase maintenance-related concerns and reliability. However, passive systems also have associated reliability despite the absence of moving parts.
Post-Arrest Factors
Emergency personnel access to aircraft
System must permit emergency personnel and vehicles toaccess the aircraft after an arrest.
Emergency egress of passengers
System must permit emergency exits to open and allow evacuation of passengers.
Costs
Purchase/installation cost May be resolvable with refinement of production process and volume production. Some facilities may support higher cost than others.
Repair cost Some alternatives will have little to no repair costs following an overrun, depending on the materials used.
Maintenance cost Both active and passive systems have been shown torequire maintenance.
Life-Cycle Factors
Pollution hazard Material hazards can probably be mitigated with proper packaging.
Temperature performance Likely not resolvable with packaging or treatments of the system. This includes coupling with the moisture criteria in the form of freeze–thaw cycle performance.
UV sensitivity Arrestor beds that use covering layers (cement board, plastic, other) inherently protect the arresting materials from UV exposure. Paint and dye for the covering layers must be selected for resistance.
Moisture performance May be resolvable with proper packaging of materials used.
Jet Blast resistance Cover layers tend to resolve jet blast issues.
Chemical resistance May be resolvable with proper packaging of materials used.
Non-flammable The materials involved, or their location, must be inherently non-flammable.
Table 7-2. Assessment criteria for concept evaluation.

50
Subcategory Technology Evaluation Comments
Cellular cement Current EMAS material. Baseline for passive system comparison.
Moisture and freeze–thaw related issues have been qualitatively observed, but not quantified.
Phenolic foam Previously evaluated by FAA and since superseded by cellular cement (5).
Similar material properties as cellular cement, but with more material rebound (disadvantageous).
Flammability concerns.
Metal foam Excellent mechanical properties for energy absorption.
Cost prohibitive.
Corrosion vulnerability.
Glass foam Glass-based material that is chemically inert and has moisture-resistant properties.
Material generally stronger than required for an arrestor application, but can be modified.
Density for desired mechanical properties will require determination through experimentation.
C
CrushableFoams
Depth-varying foam Concept proposed by research team.
Depth-varying foam idea involves hardening material throughout the arrestor bed depth. This variant would be broadly applicable and not tied to a particular foam material.
(Depth-varying foam concept evaluated in a parallel graduate studyresearch effort (33). Summary findings included in this report.)
C
LooseCrushableFill
Crushable aggregatefoam
Glass-based material that is chemically inert and has moisture-resistant properties.
Made of recycled glass, it offers potential cost savings over cellular glass foam.
Density for desired mechanical properties will require determination through experimentation.
C
Pumice aggregate
Styrofoam aggregate
Novel concepts developed by research team, but deemed less viable than hollow microsphere concept.
Hollow microspheres Novel concept developed by research team.
Hollow plastic or glass microspheres connected with a cementitious binder.
Offers potential immunity to moisture and freeze–thaw degradation and has pour-in-place simplicity.
Brief experiments indicated that obtaining the necessary 80% void ratios was infeasible.
CrushableAggregates with Binder
Ceramic glass aggregate Crushable ceramic glass aggregate connected with a phosphate cement binder.
This solution offered the possibility of a pour-in-place crushable material, which would reduce cost compared with prefabricated block installation.
Concerns regarding moisture penetration and subsequent freeze–thaw performance.
Eliminated from consideration due to lack of manufacturer interest.
ClaySoil
Sand
Previously evaluated by FAA (2).
Mechanical properties too dependent on moisture and temperature.
LooseAggregates
Gravel Previously evaluated by FAA (2).
Gravel composed of angular pieces settles over time, altering bed response.
Loose gravel poses ingestion hazard for aircraft.
Table 7-3. Arrestor alternatives with evaluation comments.

51
Subcategory Technology Evaluation Comments
LooseAggregates
Engineered aggregate Aggregate used in the UK without covering layer, this poses a possible ingestion hazard.
Concept allows for one of several covering layers, potentially eliminating this problem.
Unlike normal gravel, engineered aggregate’s spherical shape prevents settling of the bed over time.
Moist freezing conditions could potentially freeze particulates together.
Issue: deceleration loading expected to be speed-dependent, which is not a desired trait.
C
Fluids Water or glycol pond Previously evaluated by FAA (2).
Freezing in winter, contamination, and attracting animals made ponds impractical.
Emergency vehicle access and passenger evacuation hindered.
Loadings only suitable up to certain velocity thresholds (<50 knots).
Hydraulic brake
Water impeller
Textile
All three of these arresting brakes are commercially available at present and are typically used for military aircraft.
The hydraulic braking systems, such as those used for BAK-12 arrestors, are applicable and offer the feature of active servo-controlled loading, making them capable of the most idealized loading of the various arrestor options.
Coupling with an appropriate engagement device for civil applications remains the problem to be solved.
CBrakingDevices
Eddy-current brake Typically used in roller-coaster applications.
While viable, no inherent advantage has been found when compared with the time-proven hydraulic friction brakes.
Barrier nets Long-standing design option, commercially available.
Must be erected to a height that interferes with normal flight path, requiring active deployment in an overrun event.
Imparts loading to the leading edge of the wings, with potential for entanglement with leading edge flaps.
Can wrap over emergency exits, hindering egress of passengers and crew.
Engagement Devices
Landing gear strut engagement
Long-standing design option.
Low-slung engine design on some current civil aircraft creates timing issues regarding deployment.
Range of landing gear dimensions and interfering landing gear features (gear doors, electrical/hydraulic features, etc.) creates further deployment complexities.
C
Mechanical Surface
Surface of spring-supported panels
Unique design approach that offers fully reversible system, which would not require repair after arresting events (32).
Pulsed loading on landing gear due to surface segmentation would reduce performance compared with monolithic foam beds. Reducing pulse strengths to avoid landing gear overloadswould require discretization of surface into many small panels.
Number of mechanical components and degrees-of-freedom could be substantial, which creates concerns regarding maintenance, reliability, and cost.
Table 7-3. (Continued).

Compression Stress (σ)
CompressionStrain (ε)
Energy Absorbed inCompression
Plateau
σu
εmax
Figure 7-2. Crushable foam stress-strain curve.
Dual Tridem(Only Lead Tires Involved in Arresting)
Dual
Dual Tandem(Only Lead Tires Involved in Arresting)
Figure 7-3. Effect of inline tires on arresting loads.
52
Material Initial Height
Pavement Height
Material Compressed Height
Direction of Travel
Vertical LoadImparted
Drag LoadImparted
Energy Consumed Proportional to Volumeof Material Crushed
Figure 7-1. Physical performance of crushable materials.
surface. Tires with higher pneumatic pressures tend to penetrate more deeply; lower pressure tires tend to pene-trate less.
Table 7-4 gives several sample pneumatic tire ground pres-sures, as well as the compressive strength of the currentEMAS cellular cement. As may be seen, the internal pressureof the aircraft tire is greater than the strength of the EMASmaterial. A typical heavy truck with an 80-psi tire, however,has a pressure very close to that of the EMAS material, indi-cating a poor matchup in which the truck may or may noteffectively crush the material. A reduction in the drag loadwould be expected in this case. Finally, the car’s 35-psiground pressure is lower than the compression strength ofthe arresting material.
Note that the EMAS material strengths cited in the tableare based on a punch test methodology developed by themanufacturer that includes both compression and shearstrength components together (34). The uniaxial compres-sion strength of the EMAS material would actually be lessthan these values.

53
The simple tire comparison above has implications for thecurrent research. There can be a substantial variation in pneu-matic tire pressure for different types of planes. Aircraft withlower tire pressures will tend to skim the top of an arrestorbed, and those with higher pressures will dig in more deeply.Also, differences in pressure between the main- and nose-geartires can affect the relative loading that each strut experiences.
The dependencies on landing gear configuration andpneumatic tire pressure are limitations of the crushable mate-rial approach.
7.5.4. Overall Aircraft Dynamics
When overrunning the arrestor bed, the nose gear andmain gear of the aircraft experience vertical and drag loads(Figure 7-4). For the main gear, this is normal, as they havebeen designed for braking loads. In contrast, the nose gear isnot normally fitted with brakes, and so is not typically designedto be subjected to the same rearward loading as the main gear.The drag load that the arrestor bed applies to the nose gear con-stitutes an unnatural way to slow the aircraft.
In addition, the deceleration of the aircraft generates a for-ward pitching motion that increases the vertical load on thenose gear. This in turn drives the nose gear deeper into thearrestor bed, generating additional drag loads on it.
A critical distinction must be made with regard to decel-eration of the aircraft created by (1) a normal braking stop,and (2) an arrestor-bed stop: it is insufficient to compare thetwo stops using the gross aircraft g-loading. For example, let
us assume a case of a 0.5 g deceleration created by normal brak-ing or created by an arrestor bed (Table 7-5). The loading onthe aircraft is similar in most respects. The 0.5 g deceleration inthe braking case is entirely due to the drag load on the main-gear struts. The 0.5 g deceleration in the arrestor bed case is dueto drag loads on all three struts: part of the 0.5 g is achieved bythe main gear and part by the nose gear. The exact breakdownin percent contributions from the nose and main gear cannotbe determined without an overall aircraft dynamics model,which will be developed in Phase 2 of this effort.
7.5.5. Summary of Mechanical Factors
To summarize the dynamics of crushable material arrestorbeds, the following factors have a direct impact on the over-all performance:
• Material properties– Compressive strength (σu)– Shear strength (τ)– Maximum compressive strain (εmax)– Volumetric energy absorption
• Material depth• Landing gear configuration• Pneumatic tire pressure• Limiting landing gear design loads, with special consider-
ation for the nose gear– Vertical limit load– Longitudinal (drag-direction) limit load
DNG
VNGVMG
DMG
Figure 7-4. Overall aircraft loading dynamics.
Vehicle or Material Ground/Pneumatic Pressure
EMAS Material Strength
Arresting Efficiency
Typical Car 35 psi 60 – 80 psi Negligible
Typical Work Truck 80 – 100 psi 60 – 80 psi Questionable
B737-800 185 psi (nose gear)
205 psi (main gear)
60 – 80 psi High
Table 7-4. Sample pneumatic tire pressures.

When all of these factors are combined, the performanceof an arrestor bed varies across a given fleet of aircraft. Fig-ure 7-5 illustrates the spread in design speeds for a typicalarrestor bed, where the dashed line shows the average exitspeed. The spread in exit speeds (43 to 57 knots in this case)represents the non-ideal performance that naturally resultsfrom designing the bed for a mixture of aircraft. The illus-trated bed is most efficient for a B737, which it can arrest atnearly 60-knots, and it is least efficient for the DC-10. Theplot shows that the weight of the aircraft alone does notdrive the stopping efficiency of the bed: the most efficientstops are achieved for aircraft between 150,000 and 200,000 lbs,with efficiency decreasing to the left and right. Thus, the
aggregate combination of the listed mechanical factors pro-duces the aircraft stopping efficiency on a case-by-case basis.
A similar performance variation is expected to persist forall surface-based arrestor beds, regardless of the crushablematerial chosen.
7.5.6. Candidate 1: Glass Foam
Cellular glass foam was proposed as a material and wouldbe made as a modification of an existing insulating product(Figure 7-6). The material would be used in a large bed eithercomposed of blocks akin to the current EMAS or constructedas a monolithic structure.
The chemical makeup and closed-cell properties of glassfoam suggested good chemical resistance, excellent durabil-ity to the environment, and resistance to water absorption(36). The potential improvement in durability suggested thepossibility of reduced maintenance and replacement needsfor an arrestor using this material.
Chapter 9 discusses the glass foam concept evaluation indetail.
7.5.7. Candidate 2: Aggregate Foam
An aggregate foam arrestor concept has been proposed. Thearrestor would use rough-broken foam aggregate made fromrecycled glass (Figure 7-7) (37, 38). The foamed, or aerated,glass material has nominally 80% void space by volume. Itsclosed-cell microstructure makes it resistant to water absorp-tion and degradation.
An arrestor using this material would be created by filling ashallow basin with the loose material and covering it with a
Variable BrakingDeceleration
Arrestor BedDeceleration
Gross Deceleration 0.5 g 0.5 g
Braking Condition Typical Reduced (due to arrestor material)
Thrust Reverser Not used Not used
Main-Gear Vertical Loading
Typical Typical
Main-Gear Drag Loading Typical (caused by braking)
Typical/reduced (caused by arrestor
material)
Nose-Gear Vertical Loading
Typical Typical
Nose-Gear Drag Loading Near zero (rolling friction only)
High (drag loading due to arrestor
material)
Table 7-5. Comparison of braking and arrestor bed deceleration.
0
10
20
30
40
50
60
16,600 148,000 150,000 200,000 255,000 335,000 455,000
B1900 MD-82 B737-400 B727-200 B757B 767 DC-10
Rat
ed E
xit
Sp
eed
fo
r A
ircr
aft
(kn
ots
)
Aircraft Weight (lbs) and Type
Figure 7-5. Exit speeds for sample EMAS arrestor (35).
54
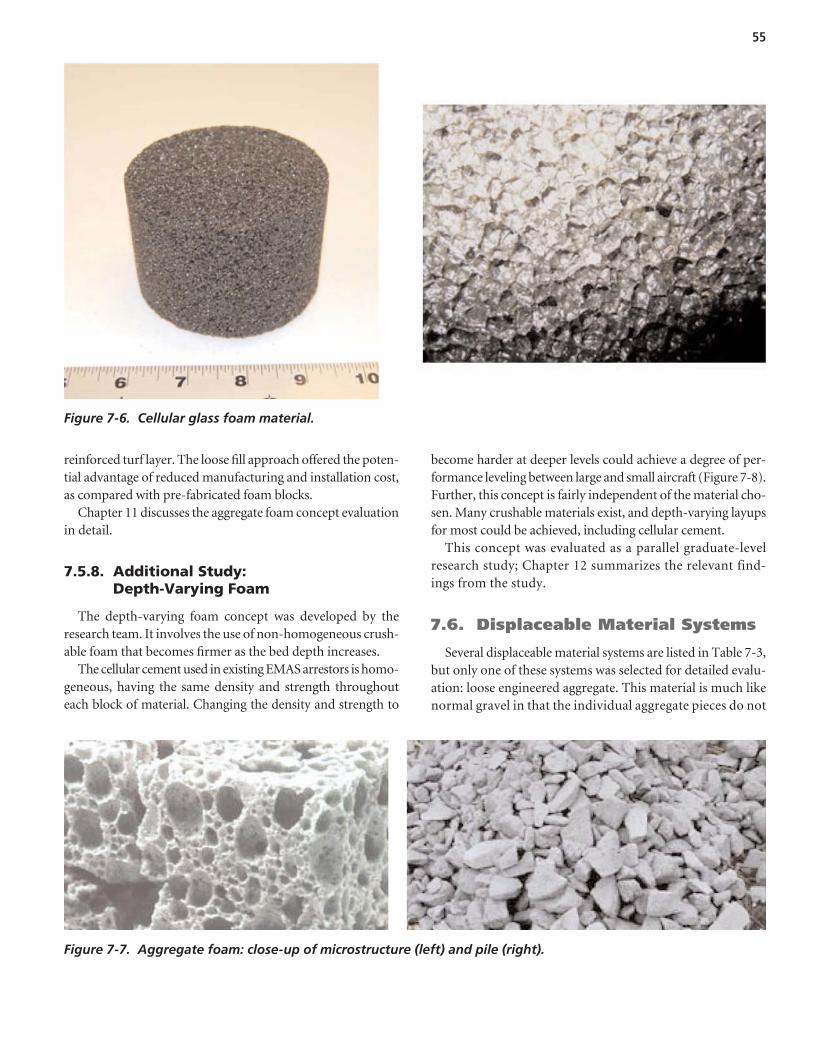
55
become harder at deeper levels could achieve a degree of per-formance leveling between large and small aircraft (Figure 7-8).Further, this concept is fairly independent of the material cho-sen. Many crushable materials exist, and depth-varying layupsfor most could be achieved, including cellular cement.
This concept was evaluated as a parallel graduate-levelresearch study; Chapter 12 summarizes the relevant find-ings from the study.
7.6. Displaceable Material Systems
Several displaceable material systems are listed in Table 7-3,but only one of these systems was selected for detailed evalu-ation: loose engineered aggregate. This material is much likenormal gravel in that the individual aggregate pieces do not
Figure 7-6. Cellular glass foam material.
Figure 7-7. Aggregate foam: close-up of microstructure (left) and pile (right).
reinforced turf layer. The loose fill approach offered the poten-tial advantage of reduced manufacturing and installation cost,as compared with pre-fabricated foam blocks.
Chapter 11 discusses the aggregate foam concept evaluationin detail.
7.5.8. Additional Study: Depth-Varying Foam
The depth-varying foam concept was developed by theresearch team. It involves the use of non-homogeneous crush-able foam that becomes firmer as the bed depth increases.
The cellular cement used in existing EMAS arrestors is homo-geneous, having the same density and strength throughouteach block of material. Changing the density and strength to

Pavement Height
Material Compressed Height
Vertical Load
ImpartedDragLoad
Imparted
Lower Region Compacted, Solid-Like Behavior
Upper Surface Can Spray at High Speed
Upper Region has Pseudo-Fluid-Like Behavior
Rut CreatedDirection of Travel
Figure 7-9. Physical performance of gravel/aggregate materials.
56
MaterialBecomes
Harder
Figure 7-8. Depth-varying material concept.
(in general) break or compress. They can be compacted by removing the void spaces between them, or they can bedisplaced. However, after a tire overrun, they can simply be raked back into the ruts with little change in the effec-tiveness of the material. Gravel systems are most often usedfor arresting large trucks that lose effective braking ondown-hill roads, but they have been used for aircraft in theU.K. (4, 13).
The engineered aggregate differs from normal gravel inthat the particulates are all roughly spherical, instead of angu-lar or elongated shapes. This has the principal advantage ofpreventing settling of the material over time, which is typicalfor normal gravels. Similarly, since the particulates are madeof the same material, the friction between individual pieces ismore consistent.
7.6.1. Drag Load Dynamics
Although a gravel-type arrestor bed appears to load thelanding gear in a similar fashion as the current EMAS design,the dynamics involved are quite different. The tire–gravelinteraction is highly complex because aggregates have morethan one mode of behavior.
Consider a pile of sand or gravel, created by pouring thematerial from a spout above it. The pile forms in a cone shapewhose sides are at an inclined “angle of repose.” At an angle
steeper than the angle of repose, the material runs freely, act-ing similarly to a fluid (39). The loose sand or gravel thatpours on top slides down the surface, returning the sides onceagain to the angle of repose. At slopes shallower than theangle of repose, the material does not behave like a fluid, buta solid: a fluid would eventually flatten out into a pancakeshape of uniform thickness, as a puddle. Mechanically, theangle of repose is determined by the internal angle of frictionfor the material. This angle of friction divides the differentregimes of behavior.
For a tire rolling through an aggregate, the physical behav-ior follows the illustration of Figure 7-9. The material belowa certain level behaves in a solid-like fashion and undergoescompaction beneath the weight of the tire. Above this level,fluid-like behavior dominates, and the material is pushed outof the way of the tire, similar to water being pushed by thehull of a boat. The uppermost part of the aggregate can sprayto the sides at high speed when the tire cuts through the ma-terial quickly. In the “wake,” a rut is left in the gravel.
Altogether, there are three major components to the energydissipation:
1. Compaction of the lower layer,2. Friction between pieces of aggregate moving around the
tire, and3. Momentum transfer in projecting the aggregate away from
the tire.
Unlike the crushable material systems, the drag load fromthe aggregate is highly rate dependent. The momentumcomponents are proportional to the tire speed squared (2,p. 8). This means that the drag load decreases as the aircraftslows, progressively exerting less stopping force. It has alsobeen found that at higher rates, the tires skim the surface,not penetrating as deeply and generating lower drag loads(2, p. 16).
Low inter-particle friction allows for more fluid-like behav-ior and permits the tires to sink more deeply into the aggregate

57
(13). This can be either desirable or undesirable, depending onthe vehicle to be stopped. For truck arresting, allowing the vehi-cle to sink to the axles is positive, as the gravel also engages theundercarriage of the truck. For an airplane, however, there is noundercarriage to halt the descent into the medium, and sinkingtoo deeply could result in drag loads high enough to cause land-ing gear to fail.
Another factor related to internal friction is the impact ofenvironmental variables such as moisture, dust, or ice in thearrestor bed. Dry, clean gravel generally has lower inter-particlefriction than damp, dusty gravel. Friction, or the resistanceof sliding between the particles, is in contrast to cohesion, orthe sticking of the particles together. Dust, moisture, and icecan all generate cohesion between the particles as well. Insevere winter environments, testing has revealed that anopen bed of gravel can form a deep ice crust layer, renderingit ineffective (13).
A variant to be considered in this research effort involvesapplying a protective cover layer to the aggregate bed (Fig-ure 7-10). Open arrestor beds produce a spray from theuppermost layer of the aggregate, which could be ingested byan aircraft engine; this cover layer will protect against inges-tion. It could also mitigate or eliminate the development ofice crusts in cold environments. However, the layer couldalter the dynamic response of the aggregate bed because theaggregate would be confined. Thin protective cover layersadded to crushable systems do not induce a fundamentalchange in dynamic behavior, so this effect (if it exists) wouldbe unique to covered aggregate beds.
Altogether, the aggregate behavior is highly complex andmust be treated as an entirely different dynamic response fromthat of the crushable material systems.
7.6.2. Effect of Landing Gear Configuration
The effect of the landing gear configuration is essentiallythe same as for the crushable system (Section 7.5.3).
7.6.3. Overall Aircraft Dynamics
The overall aircraft dynamics are the same as for the crush-able system (Section 7.5.4).
7.6.4. Summary of Mechanical Factors
To summarize the dynamics of aggregate/gravel arrestorbeds, the following factors have a direct impact on the over-all performance:
• Material properties– Particle size/gradation– Particle shape– Particle density
• Inter-particulate properties– Internal angle of friction– Inter-particle friction– Inter-particle cohesion
• Speed of travel• Material depth• Landing gear configuration• Pneumatic tire pressure• Limiting landing gear design loads, with special consider-
ation for the nose gear– Vertical limit load– Longitudinal (drag-direction) limit load
7.6.5. Candidate 3: Engineered Aggregate
An engineered aggregate arrestor concept is called theEngineered Root-zone Arresting System (ERAS). It uses amanufactured aggregate composed of nearly spherical parti-cles (Figure 7-11) and is topped with a reinforced turf coverlayer.
Vertical Load
ImpartedDrag Load
Imparted
Top Cover LayerResults In MaterialConfinement
Figure 7-10. Physical performance of gravel/aggregate materials with confining top layer. Figure 7-11. Engineered aggregate.

58
The engineered aggregate solution offers the advantage ofconstruct-in-place simplicity, requiring no fabrication ofblocks or cure time. Repairs after overruns would essentiallyinvolve shoveling or scraping the material back into place,with little material replacement required.
Chapter 10 discusses the engineered aggregate concept eval-uation in detail.
7.7. Cable/Net Active Systems
Active arresting systems have long been deployed to arrestmilitary planes. Prior attempts have been made to adapt themfor use with civil transport aircraft. To surpass these predeces-sors, any new attempts to adapt the active systems wouldrequire innovation and new sensor approaches. However, theactive systems offer elegance and a decided performanceadvantage over passive systems. As such, they have been revis-ited in this effort and re-examined for feasibility.
7.7.1. Braking Devices
A wide range of braking technologies has been developedto arrest military aircraft, including hydraulic brakes, waterimpellers, and textiles. Hydraulic brakes function much likeautomobile disc brakes, where a caliper compresses to a rotat-ing disc. Water impellers dissipate kinetic energy by generat-ing turbulence in a reservoir of water. Finally, textile devicesabsorb kinetic energy by tearing fibers.
Of the three types of braking devices, the hydraulic brake,pictured in Figure 7-12, is the most precise. Because it featuresservo-controlled loading, it is capable of applying a consistentdeceleration profile to a variety of aircraft. As a result, thehydraulic brake could be used to apply the ideal decelerationprofile to a given aircraft, thus minimizing the stopping dis-tance. For example, hydraulic brakes could be used to stop aB747-400 with a 1 g deceleration at 70 knots. Furthermore, themilitary hydraulic brakes have a minimum of 97.5% reliabil-
ity. Therefore, if civil aircraft could be engaged with hydraulicbrakes, the result would be a highly efficient and reliable arrest-ing system.
Figure 7-13 shows an active arrestor with a barrier netengagement. During aircraft engagement, the nose of the air-craft passes through the barrier net, and the net wraps overthe aircraft wings. A braking device is then used to deceleratethe aircraft. As Figure 7-13 suggests, over-wing barrier netsare a commercially available technology.
There are three issues that complicate use of barrier nets forcivil aircraft. First, because the arrestor constitutes a verticalobstruction, it cannot remain erected at the runway end undernormal conditions. Thus, in the event of an overrun, either thepilot or an air traffic controller would activate the arrestor. Asdiscussed in Section 3.8, airport operators and pilots haveexpressed hesitancy about use of active arrestors for civil air-craft. Also, for most net-based arrestors, activation requiresapproximately two seconds. Thus, detection of an overrun anddeployment of the arrestor may require more time than isavailable to engage the aircraft in an emergency.
Second, any net-based engagement of civil aircraft wouldsubject the leading edge wing flaps to loads for which theywere not designed. The flaps could either become entangledor suffer damage as a result.
Third, nets tend to envelope the fuselage of the aircraft.This result is problematic for civil aircraft because it couldhinder emergency egress of occupants.
7.7.2. Candidate 4: Main-Gear Engagement System
Given the complications associated with barrier net engage-ment, a main-gear engagement approach was considered. ForFigure 7-12. Hydraulic brake (servo controlled) (40).
Figure 7-13. Deployed barrier net (41).

59
this concept, a cable-based arrestor would pop up fromunderneath to engage the main landing gear and deceleratethe aircraft. This approach to arresting the aircraft is illus-trated in Figure 7-14.
One of the main advantages of the cable-based arrestor is that the nose gear would not be engaged. As shown in Fig-ure 7-15, the nose gear would only be loaded vertically, due tothe weight of the aircraft and pitching moment. This main-gear engagement approach circumvents the weakness of thecrushable bed systems: it does not subject the nose gear to dragloads. Consequently, it would be possible to achieve higherdecelerations and shorter stopping distances. Further, withautomated servo control of the braking units, it could obtainuniform decelerations for a wide range of aircraft weights.
Chapter 14 discusses the active arrestor concept evaluationin detail.
BrakingUnit
BrakingUnit
Figure 7-14. Main-gear engagement activearrestor (42).
VNGVMG
DMG
Figure 7-15. Loads on aircraft subjected to active arrestor deceleration (42).

60
This chapter briefly summarizes the overall experimenta-tion process followed for the candidate evaluations. It pro-vides context for the interrelationships and commonalities ofChapters 9 through 14, which document the evaluations on asystem-by-system basis.
8.1. Scope and Emphasis
The research funding did not support full-scale testing on abroad enough basis to be meaningful for the effort. Because theexperimentation phase was intended to compare the mostpromising alternatives to the current system, and because therewere several to evaluate, a modeling-centric approach wasadopted. Within this approach, various physical tests were per-formed in order to characterize the materials involved and toprovide a basis for calibrating high-fidelity computer modelsof the systems. The models were then used to assess the per-formance of the arrestor concepts in different configurationsand for different aircraft.
The candidate systems and evaluation methods are givenin Table 8-1. As the table indicates, the passive systems sharedsimilar evaluation approaches, but the active system differed.The experimentation does not include the current ESCO cel-lular cement material. Comparisons between different candi-dates and the current EMAS technology were made based onoverall aircraft deceleration.
The majority of the experimentation emphasis was placed onthe passive systems (Candidates 1 through 3), which includedtesting and high-fidelity modeling. Figure 8-1 shows the relativeemphasis given to each of the areas.
Crushable material technologies were emphasized mostbecause they have a proven track record; finding a similarmaterial solution with better life-cycle performance wouldprovide a useful alternative in the near-term.
Aggregate systems have historically experienced a dis-crepancy of acceptance, seeing use in the UK but not withinthe U.S. The evaluation approach outlined herein offers the
promise of resolving the question of predictable arrestingperformance.
The active system approach required a feasibility study todetermine its merit. As such, a small 10% allotment was ded-icated to completing a more detailed paper/analytical study.
8.2. Evaluation Process
The evaluation method for the passive systems was com-posed of (1) modeling and (2) physical testing. Figure 8-2 illus-trates a simplified version of the modeling and testing approach.
The materials underwent laboratory testing and small-scale one-wheel bogey tests. The data was used to constructmodels and undertake a more substantial array of simula-tions for the tire–arrestor interface. These simulations pro-vided data for a wide range of dynamic cases with variousspeeds of travel, tire sizes, and bed dimensions.
The simulation data was collected into databases, whichwere referenced by the APC (Appendix G). The APC wasused to simulate the aircraft suspension response to differentarrestor bed designs. It predicted landing gear loads, the effectsof material property alterations, and overall arresting perform-ance. The viability of each alternative was assessed based on thebest-case performance obtained through the APC simulations.
Early in the research effort, best-case EMAS arrestment pre-diction data was provided for three aircraft from different sizeregimes: the CRJ-200, B737-800, and B747-400 (Figure 8-3).In order to compare the candidate systems’ performance withthese EMAS baseline cases, aircraft models for each weredeveloped for use in the APC. These three aircraft are citedthrough the evaluation chapters.
8.3. Order of Discussion
The candidates were numbered per the sequence of discus-sion from Chapter 7, which was ordered in accordance withthe mechanical classification of the arrestor systems. The
C H A P T E R 8
Experimentation Overview

61
Category System Evaluation Approach
Crushable Material Systems
• Candidate 1: Glass foam
• Candidate 2: Aggregate foam
Displaceable Material Systems
• Candidate 3: Engineered aggregate
• Material testing
• One-wheel bogey testing
• Numerical modeling to develop tire/material response surfaces
• Overall aircraft response evaluation using an aircraft suspension model
Active Systems • Candidate 4: Main-gear engagementactive system
• Extended paper study
• Analytical spreadsheetmodel
Table 8-1. Summary of evaluation methods for candidates.
Active Systems10%
EngineeredAggregate
System34%
Glass Foam andAggregate Foam
Systems56%
Figure 8-1. Relative emphasis for different systems duringexperimentation phase.
CharacterizeMaterials Through
Testing
DevelopComputer Models
to Match TestData
• Create Performance Databases
Predict Tire-Arrestor Interface
Loads
Predict AircraftArrestment
Performance
• Utilize Arrestor Prediction Code (APC)
Figure 8-2. Simplified diagram of modeling and testing approach.

crushable concepts were discussed first, followed by the engi-neered aggregate and active systems.
However, in the detailed evaluation of the following chap-ters, the sequence is altered. The glass foam and engineeredaggregate concepts are discussed first, in Chapters 9 and 10.
These two candidates serve as bounding mechanical cases;prior discussion of these concepts simplifies the subsequentdiscussion of the aggregate foam concept. As such, aggregatefoam is placed third (Chapter 11).
62
88 ft
130 ft
230 ft
B747-400MTOW = 875,000
CRJ 200MTOW = 51,000
B737-800MTOW = 174,200
Figure 8-3. Three evaluation aircraft for the effort. (MTOW = Minimum takeoff weight.)

63
9.1. Concept Description
9.1.1. System Overview
Glass foam is a crushable low-density material that has beenproposed as an arrestor (Figure 9.1). The foam has a closed-cell microstructure that prevents water absorption and makesit an excellent thermal insulator. Glass foam has materialproperties that suggest excellent durability to the environmentand good chemical resistance. Typically manufactured in solidblocks of various sizes, the foam can be cut into a variety ofshapes for different applications.
Because both materials are low-density crushable foams,the glass foam material exhibited properties similar to cellularcement. However, glass foam in general appeared to be lessfragile, easier to handle, and potentially more durable thanthe cellular cement. Additionally, adhesives and moisturesealants are available for glass foams that permit joining andweatherproofing.
Because the glass foam material is generally manufacturedin blocks sized at approximately 24 × 18 × 6 inches, two vari-ants are possible (Figure 9-2):
1. Block Method. The block method would use 4-ft squareblocks of the foam, analogous to the current EMAS con-struction approach. The blocks would be constructed byadhering multiple smaller blocks together, followed by thepotential addition of top and/or bottom cap materials.The sides of the block could potentially be sprayed with asealant to further weatherproof the blocks. These blockswould be transported to and installed at a runway in essen-tially the same manner as the current EMAS beds.
2. Monolithic Method. The monolithic method would beassembled on-site at the runway by stacking and gluingblocks into a single large structure. The final assembly wouldthen be fitted with a continuous top cover layer composedof a roll/spray-on polymer. This layup would preclude theneed for joint seams, sealants, and maintenance, which are
required for the current EMAS design. Moisture sealing ofthe vertical sides of individual blocks would be unnecessary.Monolithic layups such as this have been used in buildingroof applications.
9.1.2. Performance Considerations
Because glass foam material is a lightweight crushable foambearing many similarities to cellular cement, the list of perfor-mance considerations at the outset was relatively short. Issuesfor evaluation included:
• Compression performance of the material in terms of energyabsorption and rebound characteristics,
• Required density/strength for effective arresting,• Balance of compression and shear strengths of the material,• Rate dependence of the material, and• Durability to freeze–thaw exposure.
9.2. Testing and ModelingApproach
The goal for the performance evaluation was to performtesting that would allow calibration of high-accuracy computermodels of the glass foam concept. The testing and modelingapproach for the glass foam material was comprehensive innature, and the final outcome was a well-calibrated numericalmodel for predicting arrestment loads.
The testing and modeling approach for the glass foamconcept is illustrated by Figure 9-3. Five major stages areillustrated by the larger process bubbles of the chart:
1. Arrestor Material Testing and Modeling. Laboratory andpendulum testing generated test data, and computermodels of the material were calibrated to match it.
2. Tire Modeling. Aircraft tire models for the three test air-craft were built and calibrated to match manufacturer performance specifications.
C H A P T E R 9
Glass Foam Arrestor Concept

64
Figure 9-1. Glass foam material: cylinder test specimen (left) and close-up of cellular microstructure (right).
Glass Foam Arrestor Concept 1: Block Method
Seams Between Blocks, Sealed with Tape/Caulk
Each Major Block is a Glued Assemblage of Smaller Blocks
Lid
Glass Foam Arrestor Concept 2: Monolithic Method
Monolithic Sealant Top Layer without Joints
Small Blocks Glued Together in Brick Pattern
Figure 9-2. Glass foam arrestor variants: block method (top) and monolithicmethod (bottom).

3. Aircraft Modeling. A generalized aircraft model wasdeveloped to predict the suspension response of the planeand its deceleration during a ground roll. This model wasthen incorporated into an APC for determining stoppingdistances and landing gear loads when an aircraft is driventhrough an arrestor bed. A library of aircraft definitionswas created to represent the three test aircraft.
4. Metamodeling. The arrestor material and tire models werecombined to produce an overrun model for determining the
loads exerted on the different aircraft tires by the arrestorbed. Large data sets were generated using simulation batchesfor each tire and arrestor combination. These data sets werethen accessible by the arrestor prediction code (next step).
5. Performance Predictions. The preceding four developmentstages culminated in the final, bottom-most process on thefigure. The APC was used to predict arresting distances,landing gear loads, and ideal arrestor bed designs for thedifferent aircraft.
65
(5) Performance Predictions
Predict Arresting Performance for Test Aircraft (APC/MATLAB)
(2) Tire Modeling
Manufacturer Tire Data
Build Tire Model (LS-DYNA)
Calibrate Tire Model to Match Data
(LS-OPT)
Final Tire Models
(1) Arrestor Material Testing/Modeling
Conduct Material Tests
Build Models Replicating Tests
(LS-DYNA)
Calibrate Model to Match Test Data
(LS-OPT)
Final Material Model
Test Data
(3) Aircraft Modeling
Develop Arrestor Prediction Code (APC) (MATLAB)
Manufacturer Aircraft Data
Develop Estimated Aircraft Parameters
Aircraft Library
(4) Metamodeling
Build Combined Tire/Arrestor Models
(LS-DYNA)
Batch Simulations for Tire/Arrestor Combinations
(LS-OPT)
Metamodel Data
Figure 9-3. Testing and modeling process for glass foam arrestor evaluation.
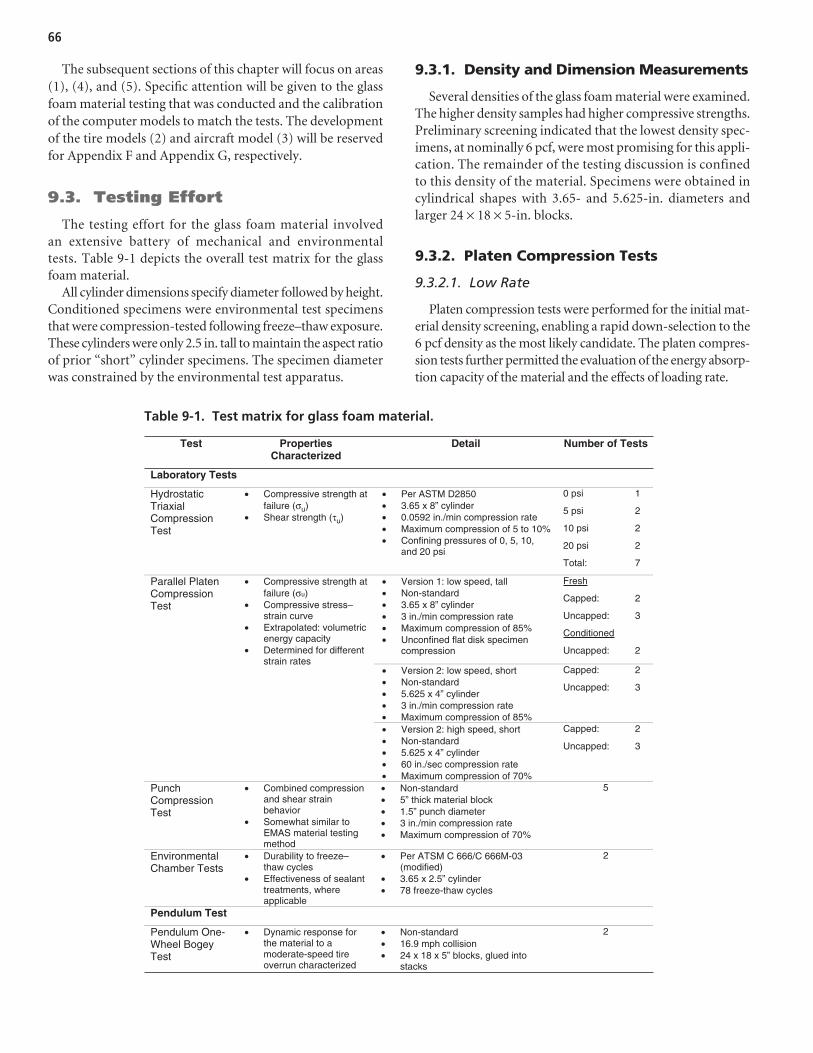
The subsequent sections of this chapter will focus on areas(1), (4), and (5). Specific attention will be given to the glassfoam material testing that was conducted and the calibrationof the computer models to match the tests. The developmentof the tire models (2) and aircraft model (3) will be reservedfor Appendix F and Appendix G, respectively.
9.3. Testing Effort
The testing effort for the glass foam material involved an extensive battery of mechanical and environmentaltests. Table 9-1 depicts the overall test matrix for the glassfoam material.
All cylinder dimensions specify diameter followed by height.Conditioned specimens were environmental test specimensthat were compression-tested following freeze–thaw exposure.These cylinders were only 2.5 in. tall to maintain the aspect ratioof prior “short” cylinder specimens. The specimen diameterwas constrained by the environmental test apparatus.
9.3.1. Density and Dimension Measurements
Several densities of the glass foam material were examined.The higher density samples had higher compressive strengths.Preliminary screening indicated that the lowest density spec-imens, at nominally 6 pcf, were most promising for this appli-cation. The remainder of the testing discussion is confinedto this density of the material. Specimens were obtained incylindrical shapes with 3.65- and 5.625-in. diameters andlarger 24 × 18 × 5-in. blocks.
9.3.2. Platen Compression Tests
9.3.2.1. Low Rate
Platen compression tests were performed for the initial mat-erial density screening, enabling a rapid down-selection to the6 pcf density as the most likely candidate. The platen compres-sion tests further permitted the evaluation of the energy absorp-tion capacity of the material and the effects of loading rate.
66
Test PropertiesCharacterized
Detail Number of Tests
Laboratory Tests
HydrostaticTriaxialCompressionTest
• Compressive strength at failure (σu)
• Shear strength (τu)
• Per ASTM D2850 • 3.65 x 8” cylinder • 0.0592 in./min compression rate • Maximum compression of 5 to 10% • Confining pressures of 0, 5, 10,
and 20 psi
0 psi
5 psi
10 psi
20 psi
Total:
1
2
2
2
7
• Version 1: low speed, tall • Non-standard • 3.65 x 8” cylinder • 3 in./min compression rate • Maximum compression of 85% • Unconfined flat disk specimen
compression
Fresh
Capped:
Uncapped:
Conditioned
Uncapped:
2
3
2
• Version 2: low speed, short • Non-standard • 5.625 x 4” cylinder • 3 in./min compression rate • Maximum compression of 85%
Capped:
Uncapped:
2
3
Parallel Platen Compression Test
• Compressive strength at failure (σu)
• Compressive stress–strain curve
• Extrapolated: volumetric energy capacity
• Determined for different strain rates
• Version 2: high speed, short • Non-standard • 5.625 x 4” cylinder • 60 in./sec compression rate • Maximum compression of 70%
Capped:
Uncapped:
2
3
PunchCompressionTest
• Combined compression and shear strain behavior
• Somewhat similar to EMAS material testing method
• Non-standard • 5” thick material block • 1.5” punch diameter • 3 in./min compression rate • Maximum compression of 70%
5
Environmental Chamber Tests
• Durability to freeze–thaw cycles
• Effectiveness of sealant treatments, where applicable
• Per ATSM C 666/C 666M-03 (modified)
• 3.65 x 2.5” cylinder • 78 freeze-thaw cycles
2
Pendulum Test
Pendulum One-Wheel BogeyTest
• Dynamic response for the material to a moderate-speed tire overrun characterized
• Non-standard • 16.9 mph collision • 24 x 18 x 5” blocks, glued into
stacks
2
Table 9-1. Test matrix for glass foam material.

Low-rate platen tests were conducted by placing a cylindricalspecimen between two metal platens. The upper platen wasthen displaced downward at a fixed rate of 3 in. per minuteuntil the specimen was fully compressed.
The platen tests were conducted with and without Sor-bothane capping material on the top and bottom of the spec-imens to determine whether capping was beneficial or not.For the uncapped specimens, the material crushed in a local-ized failure zone immediately adjacent to the platen. Thesespecimens maintained their shape throughout the durationof the loading up to the final 85% compression state, whichaided in capturing the full energy absorption of the material(Figure 9-4).
When caps were used, the specimens tended to split alongvertical planes, causing a shape change that often led to earlyterminations of the compression test (Figure 9-5). The un-capped approach was eventually favored due to its superior testrepeatability and its ability to capture the full energy capacityof the material.
Tall and short cylinder specimens were tested for compar-ison with the hydrostatic triaxial tests, which used tall cylinders(3.65 × 8 in.), and the high-rate platen tests, which used shortcylinders (5.625 × 4 in.).
The glass foam material exhibited a characteristic crush-able foam load history that rose to a plateau value, where it remained until the material approached full compression(Figure 9-6). Near full compression, the material hardened andthe loading increased. The stress–strain curve was integratedto produce the energy absorption curve shown in the figure.No measurable rebound occurred after compression.
9.3.2.2. High Rate
High-rate compression tests (60 in.-s) were conducted onshort cylinders (5.625 × 4 in.) to evaluate the effects of rapidcompression on the material. For a B747 main-gear tire travel-ling at 70 knots, the average vertical compression rate would be40 in./(in.-s). The test produced an average strain rate of 150 in./(in.-s), which exceeds the overrun case by a substantial margin.
When comparing the high- and low-rate loading curves,only a minimal difference is observed, which could be due onlyto inertial effects of the material. Overall, the high-rate platen
67
Figure 9-4. Low-rate uncapped platen test of glass foam pre-test (left) and post-test (right).
Figure 9-5. Mid-test splitting of low-rate cappedplaten test cylinder of glass foam.

tests indicate that there is little to no practical rate effect in thematerial for the loading regimes of interest (Figure 9.7).
9.3.2.3. Hydrostatic Triaxial Tests
The hydrostatic triaxial tests evaluated the glass foam per-formance at different confining pressures to determine if anystrength increase or bulking deformation took place. Neitherwas anticipated because the glass foam material behaved as aone-dimensional foam with little to no observed lateral bulking(low Poisson ratio).
The specimens were tall cylinders (3.65 × 8 in.) placedbetween platens using Sorbothane caps at the top and bottom(Figure 9-8, left). The specimens were fitted with flexiblemembrane sleeves before immersion in a pressurized vessel ofwater. While at this hydrostatic pressure, the specimens werecompressed axially until failure.
As observed in the platen tests, the use of capping inducedvertical failure plane formation in the specimen (Figure 9-8,right), which typically occurred at a compression displacementof about 5%. This failure load did show a mild dependence on
68
Strain [in./in.]
Str
ess
[psi
]
En
erg
y A
bso
rpti
on
[p
si/in
2 ]
0 0.1 0.2 0.3 0.4 0.5 0.6 0.7 0.8 0.90
10 6
0
20 12
30 18
40 24
50 30
60 36
70 42
80 48
Stress, Average of Test DataEnergy Absorbed Per Unit Volume
Figure 9-6. Average load history for glass foammaterial from low-rate platen tests, tall specimen.
Strain [in./in.]
Str
ess
[psi
]
En
erg
y A
bso
rpti
on
[p
si/in
3 ]
0 0.1 0.2 0.3 0.4 0.5 0.6 0.7 0.80
10 8
0
20 16
30 24
40 32
50 40
60 48
70 56
Stress, Average of Test DataEnergy Absorbed Per Unit Volume
Figure 9-7. Average load history for glass foammaterial from high-rate platen tests, short specimen.
Sorbothane Cap
Figure 9-8. Hydrostatic triaxial compression test of glass foam pre-test (left) and post-test (right).

confinement pressure, though no bulking behaviors wereobserved.
9.3.3. Punch Tests
Punch tests were performed by pressing a 1.5-in. diameter,smooth-sided punch into a 5-in. thick block of the material(Figure 9-9). The glass foam material compressed cleanly,leaving a smooth-sided hole in the block. These tests were
similar to the characterization tests performed by the currentEMAS manufacturer (34). However, the tests differed withregard to the proportional aspect ratio of the punch, the punchshape, the specimen size, and the loading rate.
The resulting load was due to a combination of the com-pression strength of the material (area under the punch) andthe shear strength of the material (circumferential edge of thepunch). Figure 9-10 illustrates the averaged load history forthe punch tests. As shown, the effective “pressure” on the
69
Figure 9-9. Punch test of glass foam test specimen pre-test (left) and post-test (right).
Strain (in./in.)
Pre
ssu
re (
psi
)
En
erg
y A
bso
rpti
on
(p
si/in
3 )
0 0.1 0.2 0.3 0.4 0.5 0.6 0.7 0.8 0.90 0
20 10
40 20
60 30
80 40
100 50
120 60
140 70
160 80
180 90
200 100
Compression Force AverageEnergy Absorption
Figure 9-10. Average load history for glass foam material frompunch test with stress normalized for cross-sectional area of 1.5-in. diameter punch.

punch was nominally 140 psi, which compares at 2.5 timesthe nominal 55 psi strength of the material exhibited in theplaten tests (Figure 9-6). This increase in apparent strengthis due to confinement and shear contributions. In arrestorapplications, the shear strength of the material would be rele-vant along the vertical walls of the tire rut.
9.3.4. Pendulum Tests
9.3.4.1. Pendulum Apparatus
In addition to the small-scale laboratory tests, a larger-scaleone-wheel bogy test was conducted using a large pendulumtest apparatus. The pendulum test apparatus featured a heavy4,400-lb mass that hung from an overhead support frame,giving it a swing arc of 24.5 ft. The mass was hoisted to thedesired height and then released; the speed of the mass wascontrolled by the release height.
The pendulum mass was fitted with a strut and wheelassembly, which Figure 9-11 illustrates in an exploded view. Thestrut was instrumented with three load cells that measuredloads at the connections. These three connection loads wereresolved into orthogonal vertical and drag loads on the strutand wheel assembly.
To reduce the number of variables in the design, a rigidaluminum wheel form was used rather than a pneumatic tire.The diameter and width were 14.8 and 5.5 in., respectively.These proportions were based on a nominal one-third scaleB737-800 main-gear tire, which has a diameter and width of44.5 and 16.5 in., respectively.
9.3.4.2. Glass foam retention box.
Below the pendulum assembly, a box was constructed toretain larger blocks of the glass foam, which each measured24 × 18 × 5 in. The blocks were arranged in one row, 6 blockslong and 2 blocks in depth, for a total of 12 blocks. The over-all dimensions were 9 ft in length, 2 ft in width, and 10 in. inheight. The upper and lower blocks were glued in 6 pairs,which were placed in the retention box and held in place byan upper cap rail around the perimeter. The block pairs werenot adhered to one another. Figure 9-12 shows the overallpendulum apparatus with the glass foam blocks beneath it.
9.3.4.3. Tests Executed
For the tests, the pendulum was set to swing such that thewheel penetrated to a depth of nominally one-third diameter,or 5.0 in. One swing height was used to produce an averageoverrun speed of 16.9 mph. Due to the single-use nature ofthe material and the limited supply of evaluation samples,two tests were conducted for these conditions. Both tests gaveconsistent results.
Figure 9-13 shows the rut created through the material bythe strut and wheel of the pendulum; the wheel cut a cleanpath through the material, leaving the RG-1 material adjacentto the rut essentially undamaged. This behavior was consistentwith expectations based on the small-scale testing.
9.3.4.4. Landing Gear Loads
The loading history for the pendulum strut showed oscil-lations in both the drag and vertical loads (Figure 9-14). It isbelieved that these pulses were caused by the seams betweenthe block pairs in the bed. As the wheel approached the end ofa block, the load decreased; when the wheel began to overrunthe next block, the load increased. Since the blocks were notglued at the seams, these joints presented a discontinuity inthe material. The pulsing effect was further amplified by the
70
Figure 9-11. Pendulum test device with one-wheelbogy.

71
Pendulum Mass
Strut andWheel
Assembly
Retention Boxwith Glass FoamBlocks
Cap Rail
Figure 9-12. Overview of pendulum test setup for glass foam.
Figure 9-13. Post-test results from pendulum test for glass foam.

rigid wheel used in the strut assembly, which prevented naturalsmoothing that might result with a pneumatic tire.
In arrestor applications, the severity of the loading pulsesdepends on several variables:
• Relative compressive strength of the material,• Flexibility of the pneumatic aircraft tire,• Relative penetration depth of the tire, and• Glued or non-glued approach to joints in the material.
In applications involving a flexible tire, or where the blocksare glued at all joints, the loading pulses are expected to smoothsubstantially. However, the appearance of these pulses gener-ated questions regarding the feasibility of using separate blocksof the material in an analogous manner to the current approachfor EMAS. Whether or not these pulses would occur duringoverruns into the existing EMAS beds is unclear. The natureof the pulses suggests that an arrestor design using a foamblock material should explicitly include this seam effect; itis not sufficient to make a general assumption that separateblocks essentially give the same loading as a continuous bedof the material.
9.3.5. Environmental Tests
A basic set of environmental tests was conducted todetermine the necessity for weatherproofing the glass foammaterial. Two 3.65 × 2.5-in. cylinders were subjected to fullyimmersed freeze–thaw testing, per ATSM C 666/C 666M-03.The specimens were subjected to 78 freeze–thaw cycles, duringwhich they absorbed water and partially eroded (Figure 9-15).
(Standardized testing generally uses 300 freeze–thaw cycles.Due to the test duration required, this was abbreviated to aplanned 50 cycles for this effort. An unplanned cycling overrunat the test facility resulted in a total of 78 cycles.)
Following the environmental tests, the specimens were sub-jected to a low-speed platen compression test (Figure 9-16)to determine the performance degradation. When comparedwith the fresh material, the samples exhibited a 60% decreasein energy absorption capacity and compression strength.
Mechanically, the closed cell foam limits water absorption,such that water penetrates only the outer-most open pores ofthe foam. Upon freezing, the expanding water cracks the cells,permitting progressively deeper penetration into the specimenas the cyclical testing proceeds. The degradation observed is,therefore, not surprising.
These environmental tests represent the most severe ofcircumstances, where the specimens are fully immersed inwater, without normal countermeasures of drainage, protectivepackaging, or sealants. Information provided by the manu-facturer indicates that cyclical temperature and humidity donot degrade the material over time, and a number of sealantsare available to prevent water absorption, if required.
Overall, these tests indicate that the glass foam materialshould be protected from immersion conditions caused bystanding water, as is done for the current cellular cementmaterial. Additional testing could be conducted to characterizedurability in non-immersion scenarios, or in immersion con-ditions where a sealant has been applied to the material.
9.4. Modeling Effort
The modeling effort involved several stages, as shown pre-viously in the flowchart of Figure 9-3. A high-fidelity modelfor the glass foam material was calibrated to match the test data(Figure 9-3, block 1). Using this material model, an arrestor
72
Time (s)
Fo
rce
(lb
f)
0 0.05 0.1 0.15 0.2 0.25 0.3 0.350
1000
2000
3000
4000
5000
6000
7000
8000
Drag ForceVertical Force
Figure 9-14. Loading history for glass foam pendulum test.
Figure 9-15. Glass foam specimen after environmentalfreeze–thaw testing.

bed model was constructed and coupled with tire models forthe different aircraft (Figure 9-3, block 4). Finally, large batchesof simulations were conducted using these paired models, whichgenerated volumes of data for use by the APC (also block 4).
This section will discuss the arrestor model developmentand batch simulation process. Performance predictions forthe glass foam arrestor concept are reserved for the followingsection (9.5).
9.4.1. Smoothed Particle Hydrodynamics(SPH) Formulation
The glass foam arrestor models were developed in LS-DYNA,a general-purpose finite element modeling code. WithinLS-DYNA, a number of formulations exist for representingsolids and fluids. Due to the high compressibility of the glassfoam material, an SPH mesh-free formulation was employed.SPH offered the ability to represent high-dislocation solidswith accuracy while maintaining time-efficient simulations.
Because SPH uses particles instead of the more typical finiteelements, the illustrations in this section depict the materialas a collection of small spheres. These particles are not dis-jointed pieces of aggregate, but are instead mathematically inter-connected to represent a continuous solid material (Lagrangianformulation).
9.4.2. Calibration to Physical Tests
9.4.2.1. Constitutive Model
LS-DYNA currently offers about 200 constitutive models;of these, about 18 are applicable to various foams. Based onprior experience and on a review of the LS-DYNA keywordmanual, several candidates were singled out for evaluation.After some experimentation, *MAT_CRUSHABLE_FOAMwas selected as the best overall choice. This material model
has parameters as given by Table 9-2. The calibration processrequired defining these material parameters such that the modelperformance matched that of the physical material tests.
9.4.2.2. Multi-Tester Model
A multi-tester model was constructed to simultaneouslyreplicate the four laboratory material tests (Figure 9-17). Thematerial parameters of the multi-tester model were optimizedusing LS-OPT, an optimization software package. LS-OPTran the simulations in batches iteratively; after each iteration,it narrowed the region of interest, effectively zooming in closerto the predicted optimum calibration point. After 8 iterationsof 12 simulations each, the design was optimized for a best-fitset of material parameters.
Table 9-3 gives a summary of the calibration process, includ-ing the final accuracy of the calibrated model. Test metricsmarked with an asterisk were optimization criteria, whichLS-OPT attempted to minimize. The remaining metrics weremeasured, but did not act as optimization criteria.
Of the various metrics given, the energy absorption valueswere the most critical to match accurately. As shown, all energy
73
Figure 9-16. Platen testing of glass foam environmental test specimen.
Parameter Symbol Description
MID Material ID number
RO ρ Density
E E Young’s modulus
PR ν Poisson’s ratio
LCID Load curve ID for nominal stress versus strain
TSC Tensile stress cutoff
DAMP Rate sensitivity via damping coefficient
Table 9-2. Parameters for *MAT_063 or*MAT_CRUSHABLE_FOAM.

74
Shell membrane with 10 psi confinement
Punch Specimen Hydrostatic Triaxial
Specimen
High Rate Platen
Specimen
Low Rate PlatenSpecimen
(1/4 Symmetry)
Specimens After Compression
Figure 9-17. Multi-tester model for glass foam material calibration.
Table 9-3. Multi-tester specifications for glass foam material calibration.
Test to Replicate Description Accuracy of Calibration
• 3.65 x 8-in. cylinder
• Match stress–strain load curve with root-mean-squared error (RMSE) to 85% compression*
7.0%
Low-Speed Platen Test
• Match energy absorption at 85% compression* 5.0%
• 5.625 x 4-in. cylinder
• Match stress–strain load curve with RMSE to 50% compression*
17.7%
High-Speed Platen Test
• Match energy absorption at 50% compression* 2.9%
• 3.65 x 8-in. cylinder
• 10 psi hydrostatic pressure
Hydrostatic Triaxial Test
• Match stress at 5% compression 19%
• Large block
• Match stress–strain load curve with RMSE to 70% compression
8.4%
Punch Test
• Match energy absorption at 70% compression 1.2%

metrics were within 5% of the actual test values. The matchingof the stress–strain load curves proved less consistent, whichwas expected since those curves tended to vary among the testspecimens as well.
The hydrostatic triaxial specimens proved somewhat dif-ficult to calibrate due to a nuance of the SPH formulation,which proved challenging to fit with a hydrostatic membraneload. Since the glass foam material exhibited little pressuredependence in testing, this was deemed a low-priority calibra-tion point.
9.4.2.3. Pendulum Model
Using LS-DYNA, a model was constructed to replicate thependulum tests (Figure 9-18). Because the material had beenwell-calibrated via the multi-tester, the pendulum model wasused for validation of the material model, rather than forcalibration. The pendulum strut was omitted because thepenetrate depth of the actual test only allowed the wheel tocontact the glass foam material. The foam bed was constructedwith half-symmetry, such that it measured 9 ft in length, 1 ftin width, and 10 in. in depth. The bottom and outer sidesof the bed were constrained to simulate the presence of theconfining box.
The wheel followed an arced path approximating that ofthe actual strut, with the same 1⁄3-diameter penetration depthinto the arrestor bed. The wheel began with no rotation andwas allowed to freely spin upon contact with the arrestor bed,just as in the actual test (Figure 9-19).
The SPH particles were sized to 0.75 in., which was based onparticle size scaling relationships developed in other simulationsets to maintain reasonable accuracy. This provided four par-ticles across the half-width of the wheel, which was the smallestcharacteristic length of the interface. A separate particle sizeconvergence study was not undertaken for this model.
The resulting loads matched the test data well, though nopulses were observed due to the lack of material seams in themodel (Figure 9-20). The average drag and vertical loads werewithin 6% and 1% of the average test results, respectively.Since the test data showed a 6 to 10% variation for these twometrics, the model is within the experimental data scatter.
Overall, the pendulum model validated that the glass foammaterial was well calibrated.
9.4.3. Tire and Arrestor Simulations
Using the calibrated glass foam material model previouslydescribed (Section 9.4.2), a large-scale arrestor model wascreated in LS-DYNA to simulate overruns by aircraft tires. No
75
Figure 9-18. Overview of glass foam pendulum model.
Figure 9-19. Action sequence from glass foam pendulum model.
Time (s)
Fo
rce
(lb
f)
0 0.05 0.1 0.15 0.2 0.25 0.3 0.350
2000
4000
6000
8000
Test Drag ForceTest Vertical ForceModel Drag ForceModel Vertical Force
Figure 9-20. Comparison of test and model load histories for glass foam pendulum test.

protective cover layer for the bed was included in the model;it was assumed that a well-designed cover layer (likely madeof thin plastic or a spray-on polymer) should have minimalimpact on the mechanical response. The model further assumeda continuous material, and material seams were not included.Figure 9-21 illustrates the model with a 36-in. depth and aB737-800 main-gear tire (Goodyear H44.5 × 16.5) at 50%penetration depth.
9.4.3.1. Arrestor Bed Models
The arrestor bed models were constructed using half-symmetry to reduce computation time. They varied in sizedepending on the aircraft tire being used. The bed length wasdetermined by the distance required for the tire to make acertain number of rotations such that the loading settled to asteady-state condition. The bed width was determined by thetire width such that artificial boundary effects were minimaland the response approximated that of a wide bed of the
material. The smallest bed, used for the 18-in. nose tire of theCRJ-200, was 120 in. long and 9 in. wide. The largest bed, usedfor the 49-in. main tire of the B747-400, was 225 in. long and36 in. wide.
All beds were constructed with a 36-in. depth. However, theeffective depth of the bed was adjusted by use of a movablerigid plane (Figure 9-22). Only the upper part of the material,above the rigid plane, was involved in the overrun compression.This approach enabled various depths to be rapidly configuredwithin a single arrestor bed model.
SPH particle sizes were chosen based on the tire size. Anerror estimation process was undertaken to determine therequired particle size to maintain an acceptably low discretiza-tion error. For the larger tires, a 2 in. particle size was foundto have less than a 4% error for the predicted drag and verti-cal loads. For smaller tires, the particle size was reduced to 1 in.to maintain similar size proportionality. Based on the parti-cle and bed size variations, a typical bed model had nominally45K particles.
76
Arrestor and TireModel Uses Half-
Symmetry
Small Pieces of GlassFoam Fragment Off of Bed
MaterialCompressedby Tire
Tire PenetratesVertically to a
Prescribed Depth
Deformable FiniteElement Aircraft
Tire Model
SPH Arrestor Bed
Figure 9-21. Model of combined tire and glass foam arrestor system.

9.4.3.2. Tire Models
The tire models were fully deformable finite element models(FEM), as discussed in Appendix F. Table 9-4 summarizes thetire models developed. Each tire model was calibrated to matchthe actual tire’s load-deflection performance up to 80% of themaximum bottoming load. This 80% load became a limitcriterion during the batch simulations.
The deformable nature of the tires produced an accuraterepresentation of the interface between the tire and the arrestormaterial. As the load on the tire increased due to deeper bedpenetration, the contact area became flatter with an increasedsurface area. This shape change created a correspondingincrease in the load on the tire.
9.4.3.3. Sequencing of Simulations
Because the tires in the LS-DYNA simulations weredeformable and were allowed to spin freely, a sequencingmethod was required to create stable, fast-running simula-tions. These two factors were additional complications thatwere not present in the EDEM software package aggregatesimulations. However, the inclusion of these factors led tohigher-fidelity results.
From a mechanical standpoint, as the axle of the wheelpenetrated the bed vertically, both the tire and the arrestor
material underwent compression. The interplay of the tireand arrestor compression created oscillations in the measuredloads. This oscillating behavior was further amplified by thefree-spinning nature of the tire. Eventually the tire wouldsettle to a constant rate of rotation, which proved to be afunction of the forward speed, depth, and interface friction.It was found that a minimum forward travel distance wasrequired for the loads and rotation to reach steady-state con-ditions before load measurements could be made.
Sequencing options included several factors:
• Prescribed vertical penetrations versus prescribed verticalloads,
• Applying the vertical penetration/load before or after begin-ning the forward motion, and
• Applying the forward motion before or after making contactwith the bed.
Depending on the sequencing method used to accelerate thetire and set the penetration depth, the initial oscillations couldbe more or less severe. This in turn could require longer orshorter simulation times and longer or shorter arrestor beds.Because the arrestor–tire models were to be run repeatedly inlarge batches, it was important to develop a sequencing method-ology that would produce efficient simulation run times.
Multiple methods were attempted through experimentationbefore settling on the approach illustrated by Figure 9-23. Thetire was first pressed downward into the material to a prescribeddepth. Then the tire was accelerated to the desired forwardspeed and spun-up to an initial rotation speed (typically aboutone-third of the ideal rotation rate expected on hard pavement).The prescribed spin rate was then released, allowing the tireto settle to a natural rotation rate, while the forward motioncontinued at a constant speed. After the oscillations settledout of the system, the steady-state vertical and drag loads weremeasured.
The final result was an accurate prediction of the loads onthe tire under free-spinning un-braked conditions.
77
36-inch Deep Bed
Rigid Plane at 18-inch Depth
Only Upper Part of Material Involved in Compression
Figure 9-22. Adjustable height of glass foam arrestor bed.
Aircraft Landing Gear Tire Designation
Main Gear H29x9.0-15 CRJ-200
Nose Gear R18x4.4
Main Gear H44.5x16.5-21 B737-800
Nose Gear H27x7.7-15
Main Gear H49x19-22 B747-400
Nose Gear H49x19-22
Table 9-4. FEM tire library for glassfoam arrestor models.

9.4.4. Batch Simulations
Using the arrestor bed model, large batches of simulationswere conducted to generate substantial bodies of data for a widerange of overrun conditions. This data was then assembledinto “metamodels” for uploading and use by the APC.
9.4.4.1. Methodology
Batch simulations were conducted for each tire with threeopen variables:
• Speed, from 10 to 70 knots (Speeds below 10 knots wereimpractical due to the long simulation times required for
a tire to travel the required minimum distance. Loadingat speeds below 10 knots was based on the extrapolatedmetamodel data fit.);
• Bed depth, in incremental depths from 3 to 36 in. (Fig-ure 9-24); and
• Penetration into the bed, from 10% to 100% of maximumpenetration depth.
Due to the two sources of compression (arrestor material andtire), the definition for penetration depth was more complexthan for the rigid tire approach used for the aggregate arrestormodels. Two conditions defined the maximum penetrationdepth:
78
Tire presses down into arrestor
Tire accelerates forward and is given an initial spin rate
Tire continues forward and is allowed to f reely spin
Steady-state vertical and drag loads are measured
Tire begins above arrestor
Figure 9-23. Sequencing method for glass foam arrestor model.
Bed Depth
Bottoming Depth
Rut DepthPenetrationDepth
TireDeflection
Figure 9-24. Depth definitions for glass foam bed models.
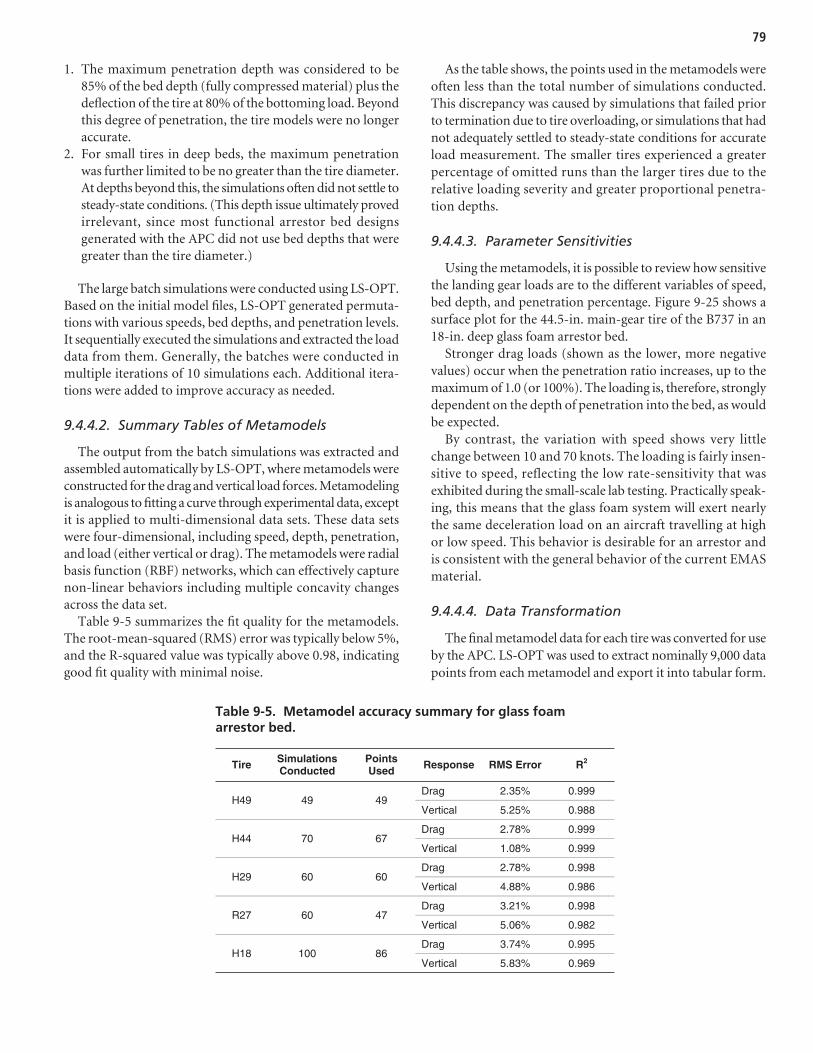
1. The maximum penetration depth was considered to be85% of the bed depth (fully compressed material) plus thedeflection of the tire at 80% of the bottoming load. Beyondthis degree of penetration, the tire models were no longeraccurate.
2. For small tires in deep beds, the maximum penetrationwas further limited to be no greater than the tire diameter.At depths beyond this, the simulations often did not settle tosteady-state conditions. (This depth issue ultimately provedirrelevant, since most functional arrestor bed designsgenerated with the APC did not use bed depths that weregreater than the tire diameter.)
The large batch simulations were conducted using LS-OPT.Based on the initial model files, LS-OPT generated permuta-tions with various speeds, bed depths, and penetration levels.It sequentially executed the simulations and extracted the loaddata from them. Generally, the batches were conducted inmultiple iterations of 10 simulations each. Additional itera-tions were added to improve accuracy as needed.
9.4.4.2. Summary Tables of Metamodels
The output from the batch simulations was extracted andassembled automatically by LS-OPT, where metamodels wereconstructed for the drag and vertical load forces. Metamodelingis analogous to fitting a curve through experimental data, exceptit is applied to multi-dimensional data sets. These data setswere four-dimensional, including speed, depth, penetration,and load (either vertical or drag). The metamodels were radialbasis function (RBF) networks, which can effectively capturenon-linear behaviors including multiple concavity changesacross the data set.
Table 9-5 summarizes the fit quality for the metamodels.The root-mean-squared (RMS) error was typically below 5%,and the R-squared value was typically above 0.98, indicatinggood fit quality with minimal noise.
As the table shows, the points used in the metamodels wereoften less than the total number of simulations conducted.This discrepancy was caused by simulations that failed priorto termination due to tire overloading, or simulations that hadnot adequately settled to steady-state conditions for accurateload measurement. The smaller tires experienced a greaterpercentage of omitted runs than the larger tires due to therelative loading severity and greater proportional penetra-tion depths.
9.4.4.3. Parameter Sensitivities
Using the metamodels, it is possible to review how sensitivethe landing gear loads are to the different variables of speed,bed depth, and penetration percentage. Figure 9-25 shows asurface plot for the 44.5-in. main-gear tire of the B737 in an18-in. deep glass foam arrestor bed.
Stronger drag loads (shown as the lower, more negativevalues) occur when the penetration ratio increases, up to themaximum of 1.0 (or 100%). The loading is, therefore, stronglydependent on the depth of penetration into the bed, as wouldbe expected.
By contrast, the variation with speed shows very littlechange between 10 and 70 knots. The loading is fairly insen-sitive to speed, reflecting the low rate-sensitivity that wasexhibited during the small-scale lab testing. Practically speak-ing, this means that the glass foam system will exert nearlythe same deceleration load on an aircraft travelling at highor low speed. This behavior is desirable for an arrestor andis consistent with the general behavior of the current EMASmaterial.
9.4.4.4. Data Transformation
The final metamodel data for each tire was converted for useby the APC. LS-OPT was used to extract nominally 9,000 datapoints from each metamodel and export it into tabular form.
79
Tire SimulationsConducted
PointsUsed Response RMS Error R2
Drag 2.35% 0.999 H49 49 49
Vertical 5.25% 0.988
Drag 2.78% 0.999 H44 70 67
Vertical 1.08% 0.999
Drag 2.78% 0.998 H29 60 60
Vertical 4.88% 0.986
Drag 3.21% 0.998 R27 60 47
Vertical 5.06% 0.982
Drag 3.74% 0.995 H18 100 86
Vertical 5.83% 0.969
Table 9-5. Metamodel accuracy summary for glass foamarrestor bed.
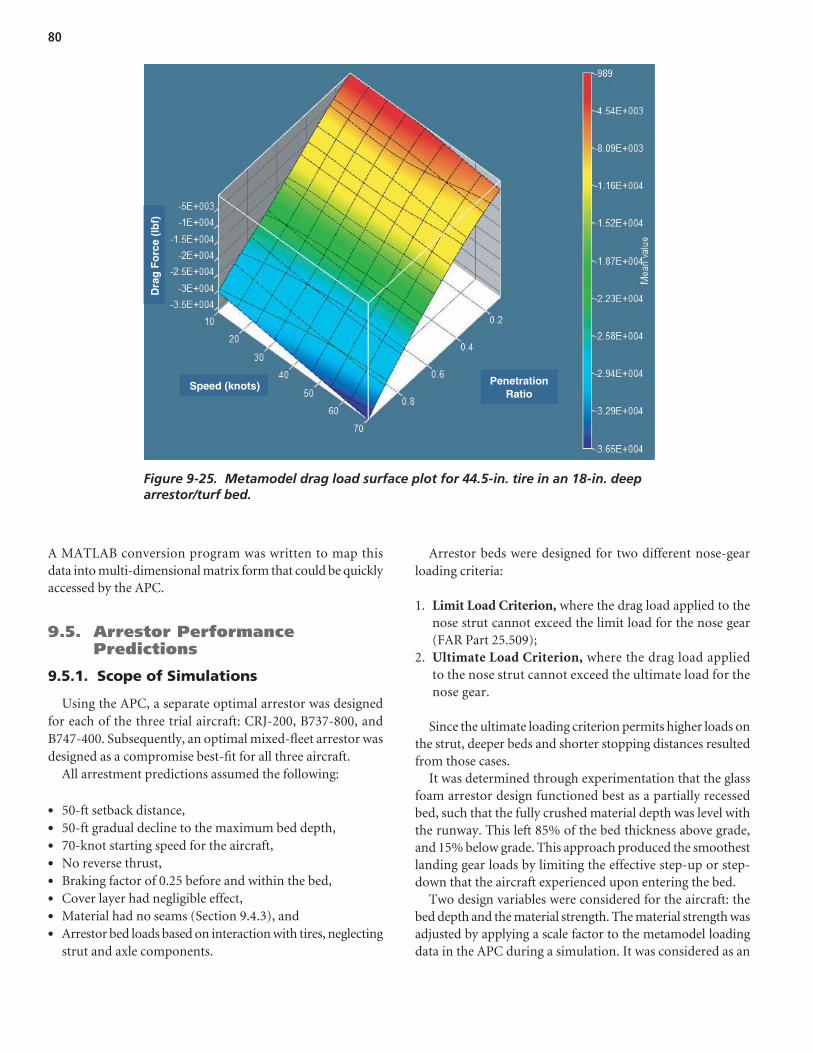
A MATLAB conversion program was written to map thisdata into multi-dimensional matrix form that could be quicklyaccessed by the APC.
9.5. Arrestor PerformancePredictions
9.5.1. Scope of Simulations
Using the APC, a separate optimal arrestor was designedfor each of the three trial aircraft: CRJ-200, B737-800, andB747-400. Subsequently, an optimal mixed-fleet arrestor wasdesigned as a compromise best-fit for all three aircraft.
All arrestment predictions assumed the following:
• 50-ft setback distance,• 50-ft gradual decline to the maximum bed depth,• 70-knot starting speed for the aircraft,• No reverse thrust,• Braking factor of 0.25 before and within the bed,• Cover layer had negligible effect,• Material had no seams (Section 9.4.3), and• Arrestor bed loads based on interaction with tires, neglecting
strut and axle components.
Arrestor beds were designed for two different nose-gearloading criteria:
1. Limit Load Criterion, where the drag load applied to thenose strut cannot exceed the limit load for the nose gear(FAR Part 25.509);
2. Ultimate Load Criterion, where the drag load appliedto the nose strut cannot exceed the ultimate load for thenose gear.
Since the ultimate loading criterion permits higher loads onthe strut, deeper beds and shorter stopping distances resultedfrom those cases.
It was determined through experimentation that the glassfoam arrestor design functioned best as a partially recessedbed, such that the fully crushed material depth was level withthe runway. This left 85% of the bed thickness above grade,and 15% below grade. This approach produced the smoothestlanding gear loads by limiting the effective step-up or step-down that the aircraft experienced upon entering the bed.
Two design variables were considered for the aircraft: thebed depth and the material strength. The material strength wasadjusted by applying a scale factor to the metamodel loadingdata in the APC during a simulation. It was considered as an
80
Figure 9-25. Metamodel drag load surface plot for 44.5-in. tire in an 18-in. deeparrestor/turf bed.
Dra
g F
orc
e (l
bf)
Speed (knots) PenetrationRatio
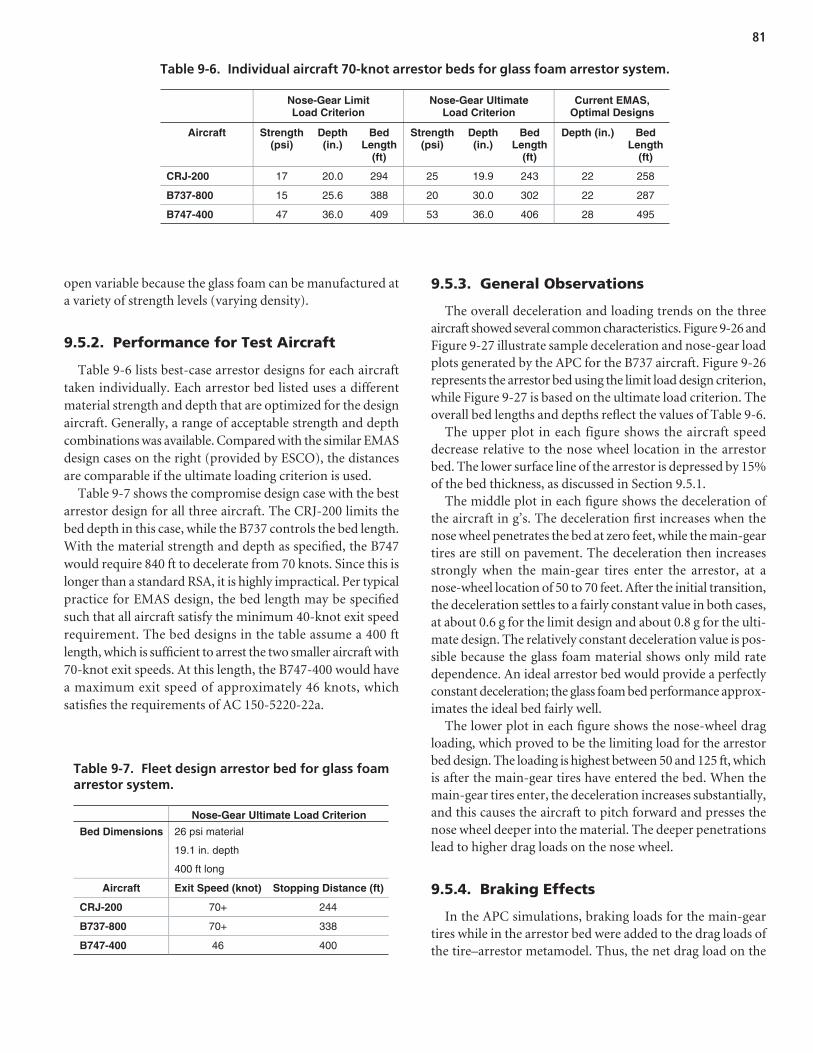
open variable because the glass foam can be manufactured ata variety of strength levels (varying density).
9.5.2. Performance for Test Aircraft
Table 9-6 lists best-case arrestor designs for each aircrafttaken individually. Each arrestor bed listed uses a differentmaterial strength and depth that are optimized for the designaircraft. Generally, a range of acceptable strength and depthcombinations was available. Compared with the similar EMASdesign cases on the right (provided by ESCO), the distancesare comparable if the ultimate loading criterion is used.
Table 9-7 shows the compromise design case with the bestarrestor design for all three aircraft. The CRJ-200 limits thebed depth in this case, while the B737 controls the bed length.With the material strength and depth as specified, the B747would require 840 ft to decelerate from 70 knots. Since this islonger than a standard RSA, it is highly impractical. Per typicalpractice for EMAS design, the bed length may be specifiedsuch that all aircraft satisfy the minimum 40-knot exit speedrequirement. The bed designs in the table assume a 400 ftlength, which is sufficient to arrest the two smaller aircraft with70-knot exit speeds. At this length, the B747-400 would havea maximum exit speed of approximately 46 knots, whichsatisfies the requirements of AC 150-5220-22a.
9.5.3. General Observations
The overall deceleration and loading trends on the threeaircraft showed several common characteristics. Figure 9-26 andFigure 9-27 illustrate sample deceleration and nose-gear loadplots generated by the APC for the B737 aircraft. Figure 9-26represents the arrestor bed using the limit load design criterion,while Figure 9-27 is based on the ultimate load criterion. Theoverall bed lengths and depths reflect the values of Table 9-6.
The upper plot in each figure shows the aircraft speeddecrease relative to the nose wheel location in the arrestorbed. The lower surface line of the arrestor is depressed by 15%of the bed thickness, as discussed in Section 9.5.1.
The middle plot in each figure shows the deceleration ofthe aircraft in g’s. The deceleration first increases when thenose wheel penetrates the bed at zero feet, while the main-geartires are still on pavement. The deceleration then increasesstrongly when the main-gear tires enter the arrestor, at anose-wheel location of 50 to 70 feet. After the initial transition,the deceleration settles to a fairly constant value in both cases,at about 0.6 g for the limit design and about 0.8 g for the ulti-mate design. The relatively constant deceleration value is pos-sible because the glass foam material shows only mild ratedependence. An ideal arrestor bed would provide a perfectlyconstant deceleration; the glass foam bed performance approx-imates the ideal bed fairly well.
The lower plot in each figure shows the nose-wheel dragloading, which proved to be the limiting load for the arrestorbed design. The loading is highest between 50 and 125 ft, whichis after the main-gear tires have entered the bed. When themain-gear tires enter, the deceleration increases substantially,and this causes the aircraft to pitch forward and presses thenose wheel deeper into the material. The deeper penetrationslead to higher drag loads on the nose wheel.
9.5.4. Braking Effects
In the APC simulations, braking loads for the main-geartires while in the arrestor bed were added to the drag loads ofthe tire–arrestor metamodel. Thus, the net drag load on the
81
Nose-Gear Limit Load Criterion
Nose-Gear Ultimate Load Criterion
Current EMAS, Optimal Designs
Aircraft Strength (psi)
Depth (in.)
BedLength
(ft)
Strength(psi)
Depth (in.)
BedLength
(ft)
Depth (in.) Bed Length
(ft)
CRJ-200 17 20.0 294 25 19.9 243 22 258
B737-800 15 25.6 388 20 30.0 302 22 287
B747-400 47 36.0 409 53 36.0 406 28 495
Table 9-6. Individual aircraft 70-knot arrestor beds for glass foam arrestor system.
Nose-Gear Ultimate Load Criterion
Bed Dimensions 26 psi material
19.1 in. depth
400 ft long
Aircraft Exit Speed (knot) Stopping Distance (ft)
CRJ-200 70+ 244
B737-800 70+ 338
B747-400 46 400
Table 9-7. Fleet design arrestor bed for glass foamarrestor system.

82
-10
0
10
20
30
40
50
60
70
Sp
eed
[kn
ot]
an
d D
epth
[in
.]
Aircraft Velocity and Bed Profile
Aircraft Speed
Upper Surface of Arrestor
Lower Surface of Arrestor
-50 0 50 100 150 200 300250 350 4000.1
0.2
0.3
0.4
0.5
0.6
0.7
0.8
Nose-Wheel Location [ft]
-50 0 50 100 150 200 300250 350 400
Nose-Wheel Location [ft]
-50 0 50 100 150 200 300250 350 400
Location [ft]
Dec
eler
atio
n [
g]
Aircraft Decleration
Aircraft Deceleration
0
5
10
15
20
25
30
35
40
Fo
rce
(kip
)
Landing Gear Forces - NOSE STRUT
Nose Gear Drag
Nose Gear Limit Load
Nose Gear Ultimate Load
Figure 9-26. Limit criterion glass foam arrestor design plots for B737-800 showing speed (top), deceleration (middle) andnose-gear drag load (bottom).

83
Aircraft Speed
Upper Surface of Arrestor
Lower Surface of Arrestor
Aircraft Deceleration
Nose Gear Drag
Nose Gear Limit Load
Nose Gear Ultimate Load
-10
0
10
20
30
40
50
60
70
Sp
eed
[kn
ot]
an
d D
epth
[in
.]
Aircraft Velocity and Bed Profile
-50 0 50 100 150 200 300250 350
1
0.2
0.3
0.4
0.5
0.6
0.7
0.8
0.9
Nose-Wheel Location [ft]
-50 0 50 100 150 200 300250 350
Nose-Wheel Location [ft]
-50 0 50 100 150 200 300250 350
Location [ft]
Dec
eler
atio
n [
g]
Aircraft Decleration
0
5
10
15
20
25
30
35
40
Fo
rce
(kip
)
Landing Gear Forces - NOSE STRUT
Figure 9-27. Ultimate criterion glass foam arrestor design plotsfor B737-800 showing speed (top), deceleration (middle) andnose-gear drag load (bottom).

main-gear tires was due to the braking plus the arrestor resis-tance. As an approximate solution, this approach worked welland was appropriate.
However, a small side study conducted during the meta-modeling process indicated that braking applied to the maingear tires could cause the penetration depth to increase. Sincethe arrestor metamodel loads assumed a non-braked free-spinning wheel, this depth change would not be captured.
For a bottomed tire, little increase is feasible and this effectwould likely not occur. For a non-bottomed tire, however, thetendency to penetrate deeper would lead to higher arrestordrag loads on the tire. Since this effect would only apply to thebraked wheels of the main gear, it would benefit the deceler-ation process while not affecting the nose gear. Stopping dis-tances could be somewhat reduced by this effect, though it isunclear by what amount or in what limited subset of arrestordesign cases.
9.5.5. Effect of Material Seams
As previously discussed, seams in the glass foam materialproduced notable pulses in the pendulum test strut loading(Section 9.3.4.4). However, the metamodels for the materialassume a monolithic arrestor bed without seams.
If seams were present in the material, such as in the designconcept featuring separate blocks (Section 9.1.1), they couldimpart pulsed drag loads to the nose gear. Pulsed loads wouldrequire a reduction in the bed depth to ensure that the peakloads did not exceed the limit or ultimate thresholds for the nosegear. Consequently, the arrestment distances would increase.
Since the effect of the material seams in a fielded system hasnot been established, the caveats of Section 9.3.4.4 apply tothese observations.
9.6. Estimated System Cost and Upkeep
9.6.1. Installation Process
The arrestor beds would likely use sloped entry and terracedsides regions, with a slight vertical depression below the runwaylevel (described further in Section 9.5). For the block variantof the system, the glass foam would be manufactured andassembled into the larger blocks while at the productionfacility. These blocks would then be transported to the airportand laid in place in the RSA. Because of the lower density ofthe material (∼6 pcf), a 4-ft block may only weigh 200 lbs; thiscould permit placement of the blocks using pallet jacks ordolly-type devices rather than forklifts. After placement, theseams would be sealed using joint tape or caulk.
For the monolithic variant, the glass foam would be shippedto the site without prior assembly. The small blocks would thenbe hand-laid in rows and layers, with glue applied in between.
After the monolithic bed was completed, a roll-on or spray-on polymer would be applied to the surface to seal the bed.The hand-laying process would require more time than plac-ing larger blocks; however, the final bed would have reducedmaintenance needs thereafter due to the lack of joints.
9.6.2. Cost to Establish System
A preliminary estimate was made for the cost to establish aglass foam arrestor system. It must be noted that the cost esti-mate from this section is only a basic approximation for thepurposes of comparing the different arrestor alternatives.The cost estimate is based on a mixture of information fromthe manufacturer, the airport survey, and FAA Order 5200.9.To develop a more accurate estimate of the costs to installsuch a system, it is recommended that a detailed cost quote besought from a firm qualified to undertake an installation effort.Where possible, the methodologies used were consistent withthe prior survey information collected regarding the existingEMAS (Section 3.5).
The glass foam arrestor concepts would require site prepa-ration and paving similar to the current EMAS. It was assumedthat the costs for this preparation would be identical to thesite preparation cost for an EMAS.
In terms of manufacturing cost, lower density versions ofthe material are more expensive than the commercially avail-able insulating product. To provide a conservative cost estimate,the upper bound for the possible cost range was assumed.
The installation cost estimate was separated into specificmaterials and general installation labor needs. Because thesecosts were specific to the glass foam arrestor concepts, they donot have a direct connection to any prior EMAS data. Discus-sions with a potential manufacturer produced cost estimatesfor the foam blocks, adhesive to join the blocks, and a polymertop coating material. The labor costs were estimated basedon similar labor needs for installation of glass foam in roofapplications.
Finally, the site preparation and estimated EMAS costs werecomputed in two ways: (1) assuming average survey costs fromthis research, and (2) assuming FAA Order 5200.9 costs. Thefinal cost estimates for both options are given in Table 9-8and Table 9-9, respectively.
Using the survey cost assumptions of Table 9-8, a 300-ftarrestor bed would cost approximately 7% less than the cur-rent EMAS design. If the Order 5200.9 costs are assumed,the glass foam system would be nominally 37% more expen-sive (Table 9-9). Due to the preliminary nature of the esti-mated system cost, it is feasible that actual costs for the systemwould be higher based on unforeseen elements. A conservativeapproach would conclude that the cost for this concept willprobably be similar to that of EMAS.
In addition to the tables in this section, longer-term life-cycleissues could also be considered. FAA Order 5200.9 includes a
84

standard 10-year replacement interval for an EMAS, whichtranslates into present-value life-cycle costs. Such a replace-ment could arguably be unnecessary for this arrestor concept(Section 10.6.4). Eliminating the assumed 10-year replacementcould effectively trim about $2.6M of present-value life cyclecosts (based on the EMAS replacement cost estimates of thesurvey).
9.6.3. Maintenance
The glass foam material is expected to have a superiordurability when compared with cellular cement. Glass foamdoes not exhibit the tendency to crumble during handlingthat occurs with cellular cement, nor does it exhibit overtsensitivity to moisture due to its closed cell microstructure.Many industrial applications of glass foam materials indicatethat long service life is possible with little degradation as longas mild protective measures are taken.
In the monolithic version of the concept, joint tape/caulkmaintenance would not be required. Annual maintenancecould be limited to upkeep of the required yellow chevronmarkings on the arrestor.
9.6.4. Replacement and Overhaul
It is not anticipated that replacement of the bed would berequired after 10 years, as anticipated for an EMAS in FAA
Order 5200.9. Based on other fielded applications for glass foammaterial, life cycles of 20 years should be realistic, with somepast applications indicating that it can last as long as 50 years.This effectively reduces the life-cycle cost of the concept. Sincethe installation costs are expected to be similar to the existingEMAS, the elimination of a 10-year bed replacement wouldeffectively trim $3.5M of present-value life-cycle costs.
However, the top cover layer applied to the material mustalso be considered. Polymer coatings and plastic lids candegrade when exposed to ultraviolet radiation and varyingweather conditions. Overhaul may be required to replace orrepair the top material periodically.
9.6.5. Repair
Repairs after an overrun would parallel those of the currentEMAS design. Damaged sections of glass foam material wouldrequire removal and replacement after aircraft extraction.
9.7. Transition to a Fielded System
In order to transition the glass foam concept to a fieldedsystem, the following additional development steps may beadvisable.
9.7.1. Low Material Density Calibration
As shown in the example arrestor beds of Table 9-6 andTable 9-7, the compressive strengths for optimal designsranged from 17 to 53 psi. Since the material tested and cali-brated during the research had a nominal strength of 55 psiwith a 6-pcf density, the fielded material will be softer andlighter. To estimate the needed density and strength, themetamodel data was simply scaled, which was an appropriatesimplification.
However, in migrating to a fielded system, several standarddensities would probably be selected to provide flexibility dur-ing the design of actual arrestors (currently done with EMAS).For each density, some testing would be required to generatecalibration data. The foam glass material model would requireminor adjustments to compensate for the alterations. Freshmetamodel data should then be generated such that datascaling would no longer be required in the arrestor designprocess.
9.7.2. Cover Layer Design
Two major cover-layer design concepts are possible:
1. Plastic lids, applied to the block version of the concept, or2. Spray-on or roll-on polymer coating, applied to the mono-
lithic concept.
85
Cost Category Glass Foam System
Current EMAS
Site Preparation $ 2.17 $ 2.17
Installation $ 5.49 $ 6.03
Cost to Establish $ 7.65 $ 8.19
Percent of EMAS 93%
Table 9-8. Estimated costs to establish glassfoam arrestor, 150 x 300 ft, assuming surveyaverage costs for current EMAS, units ofmillions USD.
Cost Category Glass Foam System
Current EMAS
Site Preparation $ 0.68 $ 0.68
Installation $ 5.49 $ 3.83
Cost to Establish $ 6.17 $ 4.50
Percent of EMAS 137%
Table 9-9. Estimated costs to establish glassfoam arrestor, 150 x 300 ft, assuming Order5200.9 costs for current EMAS, units of millions USD.

For either case, the material type and thickness of the layermust be established. The material should be selected based onultraviolet and weather durability. A material that can bedyed to a pavement gray color would be preferable, such as iscurrently in use for plastic EMAS tops. Paint application foryellow chevron markers would be required.
After selection of a cover layer material that meets thesegeneral requirements, a moderate to full-scale test bed shouldbe constructed for overrun testing by a one-wheel bogy appa-ratus or an aircraft. Such testing would ensure that the coverlayer does not negatively impact the mechanical decelerationperformance of the bed.
9.7.3. Seam Effect Characterization
The research performed to date has identified that seamsbetween glass foam blocks should be investigated further.Seams in the material have been observed to generate pulsedloads on a rigid tire form during testing; it is not presentlyknown how substantial such loading pulses might be onactual landing gear.
One evaluation method could involve using a one-wheelbogy apparatus fitted with a full-scale pneumatic tire that istowed through the material. Direct comparisons could be madebetween fully glued test beds and those having un-glued seams.
9.7.4. Braking Dynamics
The research performed has identified that braking in theglass foam material may require further study. The currentmodeling method of the APC makes simplifying assumptionsregarding this phenomenon that are sufficient for a concept-level evaluation. However, to ensure accuracy of design pre-dictions, some additional tests may be beneficial. One methodwould involve using a one-wheel bogy apparatus fitted withbrakes and a load measurement system that is towed throughthe material.
9.7.5. Full-Scale Testing
A full-scale aircraft overrun test of the glass foam arrestorbed may or may not be critical to approve and field such asystem. The mechanical nature of the system is very similarto that of the current EMAS, which leaves fewer unknownfactors than for the other concepts evaluated. A one-wheel
bogy test apparatus may prove sufficient to characterize theremaining unknown factors of the concept, such as the coverlayer, seam effects, and braking dynamics.
9.8. Summary
Of the candidate systems evaluated, the glass foam arrestorconcept is most similar to the current EMAS. It uses blocks ofcrushable foam material that are installed on a paved surface.While the mechanical properties differ somewhat from cel-lular cement, the overall dynamic behavior proves analogous.Consequently, the glass foam concept could be considered anequivalent to the existing EMAS technology, with the caveatthat bed thicknesses and material properties would not beidentical.
The material is closed-cell glass foam, which provides inher-ent moisture and chemical resistance and improved handlingdurability as compared with cellular cement. Manufacturerinformation regarding past use indicates that long servicelife is possible, potentially eliminating the standard 10-yearreplacement for an EMAS assumed in FAA Order 5200.9.Water immersion must be avoided, so drainage measureswould still be required for the bed.
Installation of the system would rival the current EMASdesign in terms of time and effort required. Repair of the bedafter an overrun would be analogous to the current EMASrequirements. Preparatory paving requirements would beidentical. The cost to establish such a system would be nom-inally equal to, or greater than, EMAS; however, life-cycle costscould be reduced due to longer bed life. Maintenance needscould be reduced for a monolithic version of the concept,which would have no joints to seal with tape or caulk.
The APC predictions for the glass foam arrestor show fairlyconstant deceleration throughout the arrestment with littlespeed dependence, which are desirable characteristics. Arrest-ing distances were comparable to the current EMAS. Of thethree candidates evaluated, the multi-aircraft design case for theglass foam concept showed moderate performance. Arrestingdistances varied with the aircraft size.
Transition to a fielded system would require selecting acovering material and finalizing a set of foam densities thatcould be used for different arrestor applications. Additionalinvestigation would be advisable to determine the impact ofmaterial seams in producing pulsed landing gear loads.
86

87
10.1. Concept Description
10.1.1. System Overview
An engineered aggregate arrestor concept has been pro-posed. Its primary material is a spherical engineered aggre-gate that has excellent flow properties and resists settling andcompaction that are more typical for angular gravels (Fig-ure 10-1). This material would reside in a shallow bed and becovered with a reinforced turf layer. However, the engineeredaggregate may also be used without a turf layer, which hasbeen done at four airports in the UK. Other top layer materi-als are possible, such as a thin asphalt skim coat. Figure 10-2illustrates the two major variants of the engineered aggregatearrestor concept.
The difference between the two concepts is the existence ofa confining top layer, which can serve several purposes:
1. Prevent aggregate dispersion due to jet blast;2. Mitigate aggregate spraying during overrun by aircraft
tire, thus limiting engine ingestion hazard;3. Regulate water drainage and potential ice crust formation
in winter; and4. Act as a structural component to prevent lightweight land
vehicles from penetrating the arrestor bed.
Because the engineered aggregate materials are not greatlyaffected by water, the bed can be designed to handle precipita-tion in two different ways (Figure 10-3).
1. Drainage Approach. This approach would allow waterdrainage downward through the bed. In this case, the bedwould be designed to prevent standing water within it usingnormal civil engineering design practices.
2. Waterproof Approach. In the second approach, a compos-ite top layer could be employed to prevent water drainagethrough the bed. It would likely be composed of a channel-ized or cuspated plastic layer, overlaid with a geo-textile
fabric layer, and finally topped with reinforced turf. Pre-cipitation would not seep through the aggregate in thiscase, but would run off to the perimeter of the arrestorbed. Hence, the bed would be kept dry and the materialresponse during an overrun would likely prove moreconsistent.
10.1.2. Performance Considerations
The dynamic performance issues for the engineered aggre-gate concept are different from those of the crushable mate-rial candidates. During the assessment process, the followingaspects were considered:
• Dynamic behavior and energy absorption,• The degree of non-linearity of the landing gear loading and
danger of failing the nose gear,• Performance in a short-landing situation that involves an
aircraft touchdown inside the arrestor bed,• Applicability to arresting a wide range of aircraft types,• Vulnerability to ice crust formation in severe winter envi-
ronments, and• Effect of a cover layer on the performance of the aggregate
system.
10.2. Modeling and TestingApproach
As with the crushable systems, the goal for the performanceevaluation was to perform testing that would allow cali-bration of high-accuracy computer models of the engi-neered aggregate concept. Determining the necessary physicaltests was driven by the requirements of the modeling soft-ware. Therefore, a modeling method capable of high-fidelity aggregate simulations was determined first, and the required tests for material characterization followedthereafter.
C H A P T E R 1 0
Engineered Aggregate Arrestor Concept
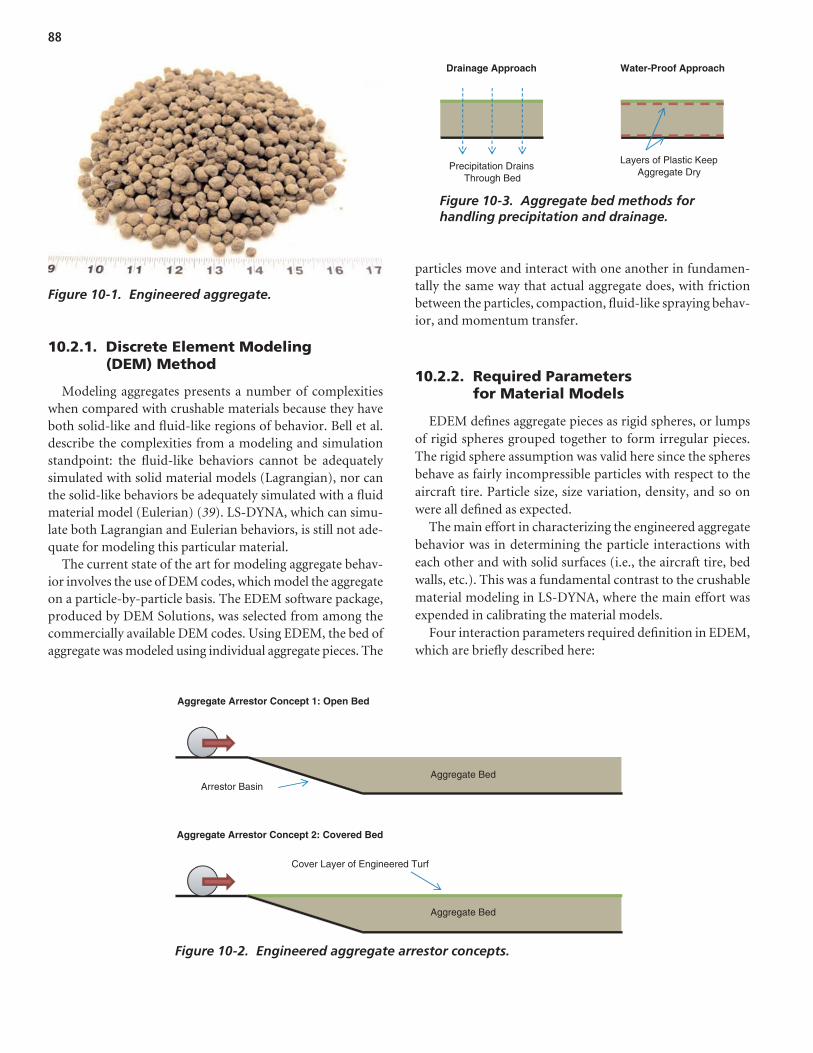
10.2.1. Discrete Element Modeling (DEM) Method
Modeling aggregates presents a number of complexitieswhen compared with crushable materials because they haveboth solid-like and fluid-like regions of behavior. Bell et al.describe the complexities from a modeling and simulationstandpoint: the fluid-like behaviors cannot be adequatelysimulated with solid material models (Lagrangian), nor canthe solid-like behaviors be adequately simulated with a fluidmaterial model (Eulerian) (39). LS-DYNA, which can simu-late both Lagrangian and Eulerian behaviors, is still not ade-quate for modeling this particular material.
The current state of the art for modeling aggregate behav-ior involves the use of DEM codes, which model the aggregateon a particle-by-particle basis. The EDEM software package,produced by DEM Solutions, was selected from among thecommercially available DEM codes. Using EDEM, the bed ofaggregate was modeled using individual aggregate pieces. The
particles move and interact with one another in fundamen-tally the same way that actual aggregate does, with frictionbetween the particles, compaction, fluid-like spraying behav-ior, and momentum transfer.
10.2.2. Required Parameters for Material Models
EDEM defines aggregate pieces as rigid spheres, or lumpsof rigid spheres grouped together to form irregular pieces.The rigid sphere assumption was valid here since the spheresbehave as fairly incompressible particles with respect to theaircraft tire. Particle size, size variation, density, and so onwere all defined as expected.
The main effort in characterizing the engineered aggregatebehavior was in determining the particle interactions witheach other and with solid surfaces (i.e., the aircraft tire, bedwalls, etc.). This was a fundamental contrast to the crushablematerial modeling in LS-DYNA, where the main effort wasexpended in calibrating the material models.
Four interaction parameters required definition in EDEM,which are briefly described here:
88
Figure 10-1. Engineered aggregate.
Aggregate Bed
Aggregate Bed
Cover Layer of Engineered Turf
Aggregate Arrestor Concept 1: Open Bed
Aggregate Arrestor Concept 2: Covered Bed
Arrestor Basin
Figure 10-2. Engineered aggregate arrestor concepts.
Drainage Approach Water-Proof Approach
Precipitation Drains Through Bed
Layers of Plastic Keep Aggregate Dry
Figure 10-3. Aggregate bed methods forhandling precipitation and drainage.

1. Coefficients of Static Friction – a standard friction def-inition based on the contact force between particle/particle and particle/surface.
2. Coefficients of Rolling Friction – defines the resistance ofthe particles to tumbling/rolling past one another or over asurface, which could be due to shape irregularities (jagged-ness) or other material properties.
3. Coefficients of Restitution – defines the degree of reboundthat particles have following a collision.
4. Particle Bond Strengths – defines a bonding force betweenparticles simulating glue or adhesion-type forces. Here thisparameter was used to define the bonding of particlestogether for simulating a turf layer.
These parameters drove the selection of suitable physical testsof both the engineered aggregate and reinforced turf materials.Naturally, this collection of tests differed substantially fromthose of the crushable material candidates.
10.3. Testing Effort
10.3.1. Density and DimensionMeasurements
The density and dimensions of the engineered aggregatewere measured for several hundred randomly selected aggre-gate particles. The particle size was found to follow a boundednormal distribution, with a diameter mean and standarddeviation of 0.348 and 0.047 in., respectively. The particleswere essentially round, with an average max/min diameterratio of 1.24.
The density of the actual material, on a per-particle basis,was 94.9 pcf, while the effective density of the continuumaggregate was 52.1 pcf. This leads to nominally 45% voidspace in the aggregate bed.
The high void percentage and sphericity of the particleslead to good drainage through the bed and effectively limitthe settling of the material over time. The density is aboutthree times greater than that of typical EMAS cellular cement(∼18 pcf). The higher density leads to an increased sensitivityto speed in an arresting application; higher speeds will lead tohigher loads on the landing gear.
10.3.2. Angle of Repose
Angle of repose measurements (Figure 10-4) were performedby overturning and raising a 5-gal bucket of the engineeredaggregate material, allowing the material to spill and settle intoa pile. The sides of the resulting heap settled to the aggregate’snatural angle of repose. The test was repeated several times forthe dry material, and again for wet material, which had beenfully soaked and drained. The dry and wet angle of reposemeasurements averaged to 18.7 and 19.4 degrees, respectively.
The higher angle of the wet samples results from increased wetparticle adhesion.
This physical test eventually helped to calibrate the coeffi-cient of rolling friction in the DEM model.
10.3.3. Hydrostatic Triaxial Tests
Standard hydrostatic triaxial compression tests (Figure 10-5)were performed on the engineered aggregate at various con-fining pressures in accordance with ASTM D2850. Cylindricalsamples of the aggregate were enclosed in a flexible membraneand subjected to various hydrostatic confinement pressures.The specimens were then compressed uniaxially until the spec-imen bulged and deformed out of its original cylindrical shape.
The aggregate behaved much like a soil sample, which wasin accordance with expectations. Values obtained from thesetests included the elastic modulus of the material, the inter-nal angle of friction, and the effective particle-to-particlecohesion. These tests further illustrated that the behavior ofthe material was consistent with essentially non-deformingparticles and standard aggregate/soil behavior, thereby con-firming that DEM modeling of the material was appropriate.
10.3.4. Pendulum Tests
10.3.4.1. Test Apparatus
In addition to the small-scale laboratory tests, a larger-scaleone-wheel bogy test was conducted using a large pendulumtest apparatus. The pendulum test apparatus featured a heavy4,400-lb mass that hung from an overhead support frame,giving it a swing arc of 24.5 ft. The mass was hoisted to thedesired height and then released; the speed of the mass wascontrolled by the release height.
The pendulum mass was fitted with a strut and wheelassembly, which Figure 10-6 illustrates in an exploded view.The strut was instrumented with three load cells that meas-ured loads at the connections. These three connection loadswere resolved into orthogonal vertical and drag loads on thestrut and wheel assembly.
To reduce the number of variables in the design, a rigidaluminum wheel form was used rather than a pneumatic tire.
89
Figure 10-4. Angle of repose test for engineeredaggregate material.

After cutting the initial rut, the pendulum continued toswing back and forth until eventually coming to rest. Loadmeasurements were only considered for the initial passthrough the material. The final resting position and resultingrut are illustrated in Figure 10-9.
Figure 10-10 shows the average drag and vertical forcesduring the pendulum swing for the different permutations ofthe test matrix. The error markers atop the bars indicate a90% confidence interval, as an indication of the spread in thetest results for the three repetitions of each case. The dragforce is defined as the rearward load on the strut, whichwould decelerate the aircraft (Figure 7.9). The vertical forceis defined as the upward load, which would support the air-craft from sinking further into the aggregate.
Overall, both the speed and the moisture conditions affectthe outcome, but speed has the greatest effect. Reducing thespeed from 17.2 to 8.5 mph created a 65% reduction in thedrag force. Wetting the aggregate increased the drag force by26%.
These findings were consistent with initial observations andassumptions regarding the aggregate as an arrestor medium.The imparted landing gear load is highly dependent on thespeed of the aircraft overrun and somewhat dependent on themoisture content of the aggregate.
The results of these tests were subsequently used to helpcalibrate the coefficients of static friction and restitution forthe aggregate material.
90
Figure 10-5. Hydrostatic test specimen for engineered aggregate pre-test (left) andpost-test (right), 10 psi confining pressure.
The diameter and width were 14.8 and 5.5 in., respectively.These proportions were based on a nominally one-third scaleB737-800 main-gear tire, which has a diameter and width of44.5 and 16.5 in., respectively. Although this wheel size wassmaller than full-scale, it was substantially larger than the typ-ical particle size; this ensured the continuum-type behaviorof the aggregate that was necessary for characterization.
Below the pendulum assembly, a bed of aggregate was con-structed with a length of 22 ft, a width of 8 ft, and a depth of22.5 in. Figure 10-7 shows the overall pendulum apparatuswith the aggregate bed beneath it.
10.3.4.2. Test Matrix
For the test series, the pendulum was set to swing such thatthe wheel penetrated to a depth of one-half diameter, or 7.4 in. Two swing heights were used to produce speeds of 17.2and 8.5 mph. For the high speed tests, both wet and dry bedswere used. The wet bed was well soaked with water andallowed to freely drain prior to every test. Three repetitionswere conducted for each permutation tested, as shown in thetest matrix of Table 10-1.
10.3.4.3. Test Results
Figure 10-8 gives an action sequence of photos for the pen-dulum strut cutting a rut through the material.

10.3.5. Tensile Turf Tests
10.3.5.1. Overview and Assumptions
The reinforced turf material used a sandy soil mixed withsmall swatches of reinforcing material. Grass seed was plantedin this soil base and grown to maturity. The resulting turflayer had changing properties through its thickness, withgrass on top and sandy soil on the bottom.
Characterizing the reinforced turf required non-standardtesting procedures. Several different test methodologies wereconsidered, including punch tests, tensile tests, and tearingtests. At the small scale, the soil and reinforcement swatchmixture presented problems of heterogeneous properties,which eliminated some of the punch test concepts from con-sideration. To ensure a generally homogeneous behavior, thespecimen size needed to be fairly large.
For tire overruns, it was assumed that the material wouldessentially act as a confining membrane layer atop the aggre-gate. It was further assumed that the through-thicknesshomogeneities could be neglected in the DEM models, wherethe turf layer would be represented using a homogeneouslayer with equivalent membrane properties. This layer of par-ticles would use defined particle bonds to create a membrane-type behavior.
With that end in mind, a simple tensile test was selected asthe best all-around means of determining membrane per-formance. It produced results that could be transferred tobond strength values in the DEM modeling code.
While the tests sought to characterize the material prop-erties for the turf layer, this was undertaken with fairlymodest expectations for exactness. In actual application,the use of a turf layer presents several factors that could bedifficult to control. The strength of the layer would bedependent on:
• Type of soil base used (sandy, clayey, etc.),• Amount of reinforcement per unit area,• Type of grass used (regionally dependent),• Age/maturity of the grass, and• Seasonal rainfall levels.
Therefore, the tests sought only to establish a nominalstrength level for the turf layer, which in practice could either bestronger or weaker for different arrestor beds, at different timesof the year, and at different ages.
10.3.5.2. Tests Conducted
The turf specimens began as 4-ft square samples, whichwere 4.6 in. thick with a nominal areal density of 30 psf. Fromthese squares, test specimens were cut out in dog-bone shapes,which narrowed to an 8-in. wide neck that was 8 in. long(Figure 10-11). The total specimen length was 14.25 in. Thesespecimens were clamped in a special jig and attached to a ten-sile testing device. The specimens were then pulled apart axi-ally, and the load history was recorded. Three specimens weretested overall, with a typical failure strength of 120 lbf atelongations of 4 in.
10.3.6. Environmental Tests
Environmental tests were considered for the engineeredaggregate and turf materials. However, after consideration ofthe nature of both materials, as well as the body of existingresearch information, it was determined that such testingwould not be included in the research effort. A simple set ofenvironmental tests was not useful, and a comprehensive setof tests was not affordable within the current effort.
91
Figure 10-6. Pendulum test device with one-wheelbogy.
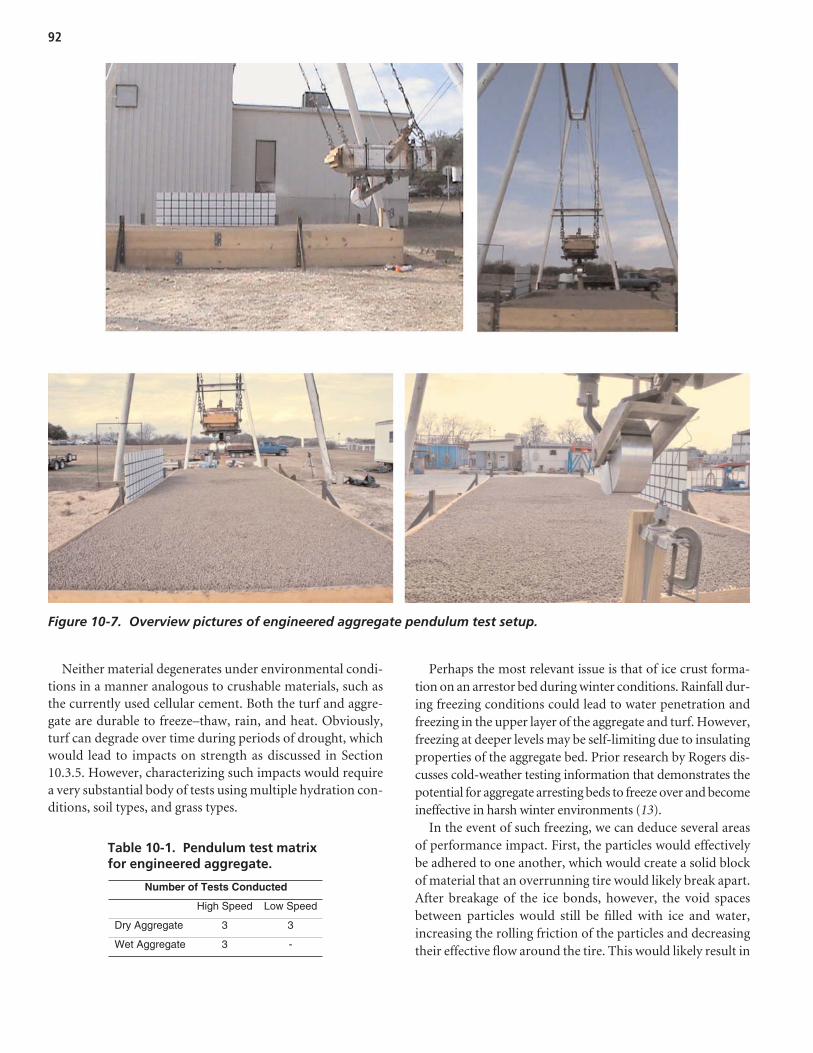
Neither material degenerates under environmental condi-tions in a manner analogous to crushable materials, such asthe currently used cellular cement. Both the turf and aggre-gate are durable to freeze–thaw, rain, and heat. Obviously,turf can degrade over time during periods of drought, whichwould lead to impacts on strength as discussed in Section10.3.5. However, characterizing such impacts would requirea very substantial body of tests using multiple hydration con-ditions, soil types, and grass types.
Perhaps the most relevant issue is that of ice crust forma-tion on an arrestor bed during winter conditions. Rainfall dur-ing freezing conditions could lead to water penetration andfreezing in the upper layer of the aggregate and turf. However,freezing at deeper levels may be self-limiting due to insulatingproperties of the aggregate bed. Prior research by Rogers dis-cusses cold-weather testing information that demonstrates thepotential for aggregate arresting beds to freeze over and becomeineffective in harsh winter environments (13).
In the event of such freezing, we can deduce several areasof performance impact. First, the particles would effectivelybe adhered to one another, which would create a solid blockof material that an overrunning tire would likely break apart.After breakage of the ice bonds, however, the void spacesbetween particles would still be filled with ice and water,increasing the rolling friction of the particles and decreasingtheir effective flow around the tire. This would likely result in
92
Figure 10-7. Overview pictures of engineered aggregate pendulum test setup.
Number of Tests Conducted
High Speed Low Speed
Dry Aggregate 3
3
3
Wet Aggregate -
Table 10-1. Pendulum test matrixfor engineered aggregate.

increased drag and/or vertical loads on the tire. Overall pen-etration of the tire could prove similar to that in a normalbed, or it could be diminished. However, predictability of thetotal performance impact is difficult since the degree of suchcrusting would be variable.
To assess such effects on performance, a larger test bedwould have to be constructed and subjected to artificial rain
and freeze–thaw conditions. Further, this would need to befollowed for the two different drainage and waterproofingapproaches to the arrestor bed. In the former, the ice crustcould penetrate below the turf layer; in the latter, it should beconfined to the turf alone.
Larger testing as described above was beyond the scopeof the current effort. However, it would be advisable if the
93
Figure 10-8. Pendulum wheel passing through engineered aggregate material (upper left is first frame, lower right is last frame).
Figure 10-9. Post-test view of rut in engineeredaggregate created by pendulum wheel.
0
200
400
600
800
1,000
1,200
Drag Avg Force (lbf)
HS Dry
HS Wet
LS Dry
Vertical Avg Force (lbf)
Figure 10-10. Plot comparing strut forces for high-speed dry, high-speed wet, and low-speed dryconditions.

engineered aggregate concept is to be transitioned into afieldable system.
10.4. Modeling Effort
The modeling effort sought to replicate the important behav-iors of the engineered aggregate arrestor system concept.The aggregate and turf simulations were conducted usingthe EDEM software, which is a DEM code, as discussed inSection 10.2.1.
10.4.1. Particle Sizes and Shapes
10.4.1.1. Size Selection
In the DEM method, the model particles are often largerthan the actual real-world particles. Because DEM modelingis a numerical method, various levels of fidelity are possible.High fidelity simulations will use a large number of smallerparticles, while low fidelity simulations use a reduced numberof larger particles. If the particles chosen are too large, accu-racy suffers. Conversely, if the particles are too small, simula-tion times rapidly increase to impractical levels. The generalgoal for such models is to select a particle size that gives suffi-cient accuracy while keeping simulation times short.
During the course of the model development and calibration,care was taken to select particle sizes that struck the right bal-ance of accuracy and time efficiency. For the aggregate models,particle diameters were as small as 0.348 in. (the actual aggre-gate size) and as large as 2 in. in diameter. The size required forgood accuracy was highly dependent on the size of the tire orstructure that was interacting with the material. Larger wheels
passing through the material permitted larger particles to beused with negligible decrease in accuracy.
10.4.1.2. Size Distributions
Section 10.3.1 discussed the particle size variation of theengineered aggregate, which followed a bounded normal dis-tribution. This normal distribution was important to repli-cate in EDEM because it affects the packing density and thevoid ratio of the particles. As such, all aggregate simulationsused the same normal distribution regardless of size scaling.
The turf material was represented using uniformly sizedparticles in EDEM.
10.4.1.3. Shapes
The average maximum-to-minimum diameter ratio of theaggregate was 1.24, which is close to that of a perfect sphere(1.0). As such, all aggregate particles were modeled as simplespheres. The irregularities in shape were essentially accountedfor through the coefficient of rolling friction for the aggre-gate, which is discussed further in Section 9.4.2.1.
10.4.2. Calibration to Physical Tests
The aggregate and turf models were calibrated to match thephysical tests as closely as possible. Properties of density, par-ticle size distribution, and so on were simply entered into thesoftware. However, the particle interaction properties of theaggregate and particle bonding properties of the turf requirediterative determination. This section briefly summarizes theoutcome of the long calibration process.
94
Figure 10-11. Reinforced turf material (left) and dog-bone specimen in tensile testjig (right).

10.4.2.1. Angle of Repose
The angle of repose test was replicated in EDEM using abucket of identical size, filled with particles. The bucket wasthen removed, and the particles were allowed to fall and set-tle into a heap (Figure 10-12). Simulations were conductedfor several scaled particle sizes ranging from the actual size of0.348 in. up to 1 in. in diameter. Each model had nominally35K particles and 43K particle-to-particle contacts.
The coefficient of rolling friction for the aggregate wasdetermined using this method, and it was found to be depen-dent on the particle diameter. Therefore, in all subsequentsimulations, the coefficient of rolling friction was matched tothe scaled particle size to ensure accurate results.
The overall accuracy of the predicted angle of repose waswithin 1⁄2 degree (Figure 10-13).
10.4.2.2. Hydrostatic Triaxial Tests
The hydrostatic triaxial tests were not replicated in EDEMdue to software limitations. EDEM does not support deform-able structure modeling or pressure load applications. Bothof these features would be required to replicate the elasticmembrane that surrounded the triaxial test articles and theapplied hydrostatic pressure.
The hydrostatic triaxial tests nevertheless revealed that theaggregate performed normally and had no unusual character-istics that might make the use of EDEM inappropriate. Thetests also provided data for the shear modulus of the aggre-gate material, which was a parameter required in EDEM.
10.4.2.3. Pendulum Tests
An EDEM model was constructed to replicate the pendu-lum tests and was used to calibrate the remaining aggregatematerial parameters (Figure 10-14). The pendulum strut wassimplified in the model to include only the features that inter-acted with the aggregate in the actual test. The aggregate bedwas 16 ft in length, 5 ft in width, and 22.5 in. in depth. Themodel bed width was less than the actual bed width (8 ft) inorder to reduce the particle count, but was still wide enoughto prevent substantial boundary effects.
The strut followed an arced path approximating that of theactual strut, with the same 1⁄2-diameter penetration depth intothe arrestor bed. The wheel was set to a constant rotation rateapproximating the observed rotation rate of the wheel on testvideo.
Several particle sizes were attempted, and an error conver-gence study was undertaken. It was determined that a 1.0-in.particle diameter was required for the relatively small pendu-lum strut/wheel assembly. The particle size error was esti-mated to be less than 6%. The model had a total of 315Kparticles and 781K particle contacts.
Figure 10-14 and Figure 10-15 show the pendulum modelreplicating the high-speed test. The shading indicates the rel-ative particle speeds as the one-wheel bogy passes through thearrestor bed. Figure 10-16, by contrast, shows the compres-sion force on the particles, indicating the region of high load-ing in front of and beneath the wheel.
The pendulum tests were used to calibrate two criticalparameter sets for the aggregate: the coefficients of restitutionand the coefficients of static friction. Both parameters mustbe defined for particle-to-particle and particle-to-surfaceinteractions. These interactions had a substantial effect on thepredicted loads for the pendulum strut as it passed throughthe aggregate bed.
After calibrating these parameters, the pendulum modelmatched the test results for both the high- and low-speed testsfor the dry aggregate bed. Figure 10-17 shows a graphicalcomparison of the simulation and test data, where the errorbars indicate the scatter of the actual test data. The deviationsfrom the true test data for the low- and high-speed tests are3.1% and 3.0%, respectively.
Recalling the speed dependence manifested during thephysical tests (Figure 10-10), it was important that the aggre-gate model be capable of capturing this effect. It was clearfrom the calibration results in this section that the model didin fact do this with high accuracy. This lends confidence tothe later predictions made for even faster overrun situations,at speeds as high as 70 knots (81 mph).
10.4.2.4. Turf Tests
The turf tensile test was replicated in EDEM using a layerof particles joined together with a bond contact definition(Figure 10-18). The bonded layer was then pulled apart usingsimulated clamps at either end. The geometry of the tensilespecimen is not an exact match to that of the physical testsdue to the rigid geometry limitations of EDEM. However, theloaded area reflects the 8-in. wide region used in the physicaltest specimens. The model had a total of 946 particles, 2,126contacts, and 1,937 bonds.
Figure 10-18 illustrates the tensile loading of the modelturf. The failure of the specimen is progressive, and as the turfis stretched an increasing number of inter-particle bonds arebroken. The bonds were defined in terms of stiffness and fail-ure strength, in both normal and shear directions. Iterativecombinations of these four parameters were tried until theoverall turf strength and elongation at failure matched theactual test specimens. Other material properties (shear mod-ulus, Poisson’s ratio, etc.) were taken from nominal values forsand or the aggregate model, depending on appropriateness.
The tensile strength of the model turf was within 1% of thetest data average, while the energy absorption was within 11%of the test data average. However, the spread in the test dataitself was +/– 7% and 11% for these quantities, respectively.
95

96
Figure 10-12. Angle of repose simulation in EDEM.

Given the highly variable nature of the turf as a material, thisaccuracy was deemed sufficient for the needs of the evaluation.
10.4.3. Tire and Arrestor Simulations
Using the calibrated aggregate and turf material modelspreviously described (Section 9.4.2), a large-scale arrestormodel was created in EDEM to simulate overruns by aircrafttires. Figure 10-19 illustrates the model with a 36-in. depth anda B737-800 main-gear tire (Goodyear H44.5x16.5) at 50%penetration depth.
10.4.3.1. Arrestor Bed Models
The arrestor bed models for the aircraft tire simulationswere 8 ft wide and 25 ft long. Versions of the arrestor bed
model were created with different depths in 6-in. increments,from 6 to 36 in. The deeper the bed, the more particles wereincluded. However, the turf layer was always 4.6 in. deep,since this was a fixed layer thickness. All bed depths citedinclude the thickness of the turf layer.
Compared with the pendulum model, this new model waslonger, wider, and deeper, giving a larger overall volume ofaggregate. As such, larger particles became a practical neces-sity to keep simulation times efficient. A particle size conver-gence study using the B737 main-gear tire showed that a 2-in.diameter particle could be used with an estimated particle sizeerror of less than 6%.
For the 36-in. depth, the model had a total of 149K parti-cles, including 138K aggregate particles and 11K turf parti-cles. The particles formed 372K contacts, and the turf layerhad 15K inter-particle bonds.
97
Figure 10-13. Angle of repose measurement.
Figure 10-14. Overall view of engineered aggregate pendulum model, velocityfringe plot.
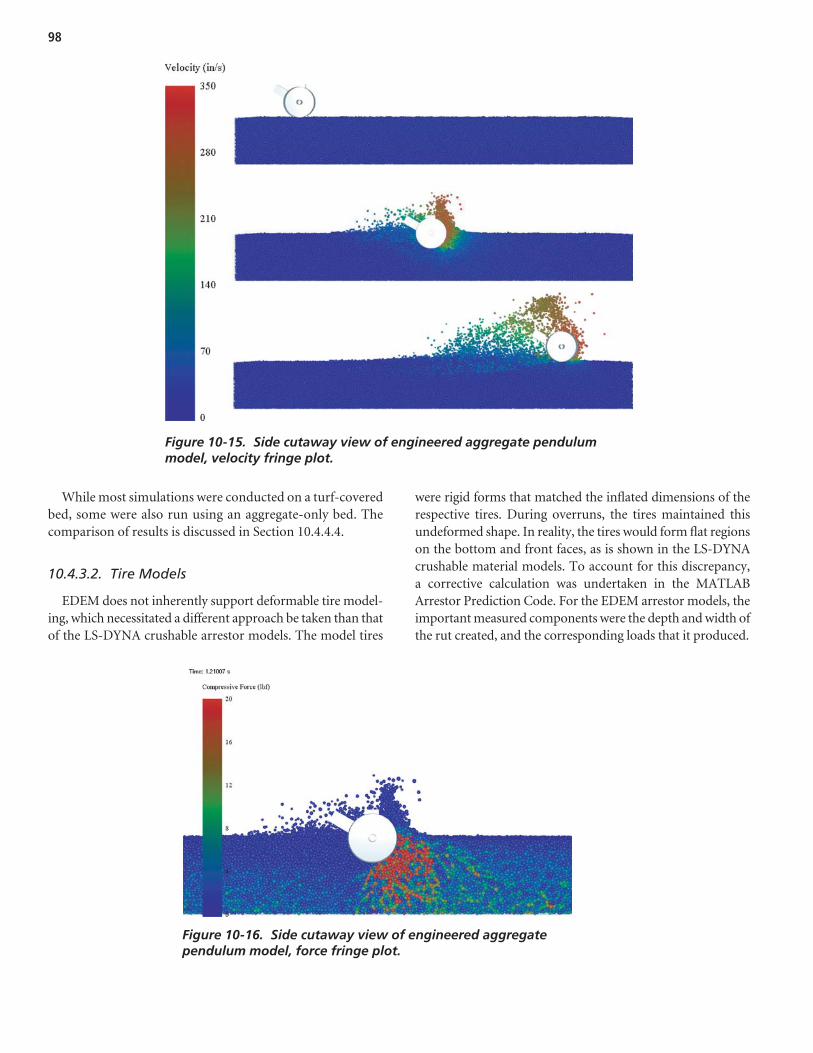
While most simulations were conducted on a turf-coveredbed, some were also run using an aggregate-only bed. Thecomparison of results is discussed in Section 10.4.4.4.
10.4.3.2. Tire Models
EDEM does not inherently support deformable tire model-ing, which necessitated a different approach be taken than thatof the LS-DYNA crushable arrestor models. The model tires
were rigid forms that matched the inflated dimensions of therespective tires. During overruns, the tires maintained thisundeformed shape. In reality, the tires would form flat regionson the bottom and front faces, as is shown in the LS-DYNAcrushable material models. To account for this discrepancy, a corrective calculation was undertaken in the MATLABArrestor Prediction Code. For the EDEM arrestor models, theimportant measured components were the depth and width ofthe rut created, and the corresponding loads that it produced.
98
Figure 10-15. Side cutaway view of engineered aggregate pendulummodel, velocity fringe plot.
Figure 10-16. Side cutaway view of engineered aggregatependulum model, force fringe plot.

from the 44.5-in. and 27-in. tire models using width correc-tion factors.
The tire path through the arrestors was based on a pre-scribed motion using a fixed forward speed and rotation rate.As the tire passed through the bed, a steady-state loadingresulted. The vertical and horizontal loading at this state wasmeasured.
Unlike the LS-DYNA arrestor models, the tire spin couldnot be released to settle at a steady self-rotation rate in EDEM,
Because the tires were non-deforming, the tire library wassimplified down to three tires instead of the five tires used inthe crushable models (Table 10-2). The 44.5-in. and 49-in.main-gear tires of the B737 and B747 were very close to thesame size. Similarly, the 29-in. main-gear CRJ-200 tire and27-in. nose gear B737 tire were very close to the same size.The ruts each tire created would, therefore, be similar. Assuch, predictions for the 49-in. and 29-in. tires were scaled
99
0
100
200
300
400
Fo
rce
(lb
f)
Low-Speed Test (8.5 mph)
Test
Simulation
0
200
400
600
800
Fo
rce
(lb
f)
High-Speed Test (17.2 mph)
Test
Simulation
X Fo
rce
Avg
Z Fo
rce
Avg
X Fo
rce
Avg
Z Fo
rce
Avg
Figure 10-17. Engineered aggregate pendulum model datacomparison to test data.
Clamp Motion
Loose Turf ParticlesAfter Bonds Broken
Figure 10-18. Turf tensile test model showingturf particles (dark) and bonds (light).
Turf Layer withBonded Particles
Aggregate Layer withLoose Particles
Loose Turf ParticlesAfter Bonds Broken
Figure 10-19. Model of combined tire and engineeredaggregate arrestor system showing aggregate (light)and turf (dark) particles.

since EDEM does not have inherent dynamics calculationsfor the rigid tire parts. Instead, it was held at a constant pre-scribed rate, assumed to be the ideal rate of spin that the tirewould have on a hard surface with no slippage at the givenforward speed. This unfortunate necessity affected the pre-diction accuracy because the tires can exert a forward “driv-ing” type of torque due to their constant rotation rate. Theimpact of this effect was mitigated by prescribing a low tire-to-aggregate friction of 0.10, which limits any fictitious drivingeffects. The impact of such driving was deemed a second-ordereffect in the simulations.
Future simulations using the aggregate could potentiallylink EDEM with a dynamics code for improved accuracy;such enhancements were, however, outside the scope of thecurrent effort.
10.4.4. Batch Simulations
Using the arrestor bed model, large batches of simulationswere conducted to generate substantial bodies of data for awide range of overrun conditions. This data was then assem-bled into “metamodels” for uploading and use by the APC.
10.4.4.1. Methodology
Batch simulations were conducted for each tire with threeopen variables:
• Speed, from 10 to 70 knots (Speeds below 10 knots wereimpractical due to the long simulation times required for a
tire to travel the required minimum distance. Loading atspeeds below 10 knots was based on the extrapolated meta-model data fit.);
• Bed depth, from 6 to 36 inches (Figure 10-20); and• Penetration into the bed, from 10% to 100% of bottom-
ing depth.
Batch simulations for the EDEM arrestor models weremore involved than for the LS-DYNA models because theoptimization software, LS-OPT, could not automatically cre-ate parameterized variants of the models. Consequently, theinput files were created manually prior to running, usingexperimental design points specified by LS-OPT. After thesimulations were finished, the measured load data was thenextracted manually and assembled into a form that could beread back into LS-OPT. The time-consuming nature of thismanual approach led to a simplified process: simulationswere done in batches of 50 for each tire in a single iteration.No additional add-on runs were undertaken, which was oftendone for the LS-DYNA batches in an attempt to increase theaccuracy of the final data set.
10.4.4.2. Summary Tables of Metamodels
The output from the batch simulations was assembled anduploaded into LS-OPT, where metamodels were constructedfor the drag and vertical load forces. Metamodeling is analo-gous to fitting a curve through experimental data, except it isapplied to multi-dimensional data sets. Here, the data sets are
100
Aircraft Landing Gear Tire Designation Modeling Method
Main Gear H29x9.0-15 Scaled from H27 Data CRJ-200
Nose Gear R18x4.4 Modeled in EDEM
Main Gear H44.5x16.5-21 Modeled in EDEM B737-800
Nose Gear H27x7.7-15 Modeled in EDEM
Main Gear H49x19-22 Scaled from H44.5 DataB747-400
Nose Gear H49x19-22 Scaled from H44.5 Data
Table 10-2. Tire library simplification for engineeredaggregate arrestor models.
Bed Depth
BottomingDepth
PenetrationDepth
Figure 10-20. Depth definitions for engineered aggregatebed models.

four-dimensional, including speed, depth, penetration, andload (either vertical or drag). The metamodels used for theseresponses were RBF networks, which can effectively capturenon-linear behaviors including multiple concavity changesacross the data set.
Table 10-3 summarizes the fit quality for the metamodels.The RMS error was typically below 5%, and the R-squaredvalue was typically above 0.99, indicating good fit quality withminimal noise.
In the table, two outlier points were eliminated from eachdata set such that the metamodels were constructed using 48of the 50 original experimental design points. Reasons for theoutliers generally were data measurement issues arising froma failure of the run to reach steady-state conditions prior tothe tire exiting the arrestor bed.
10.4.4.3. Parameter Sensitivities
Using the metamodels, it is possible to review how sensitivethe landing gear loads are to the different variables of speed,bed depth, and penetration percentage. The unusual featurefor the engineered aggregate system is that the response is verysensitive to forward speed. Practically speaking, this means thatthe engineered aggregate system will exert more load on thelanding gear when the aircraft is travelling at high speed, andless at low speed.
Figure 10-21 shows a surface plot for the metamodel. Thedrag force in this case becomes stronger (more negative)where the speed increases. For a deep penetration along theleft-front edge of the plot, the loading at 70 knots is 34,700 lbf,and at 10 knots it is only 2,400 lbf—a factor of 14 difference.
101
Tire Experimental Points
PointsUsed Response RMS Error R2
Drag 3.52% 0.999 H44 50 48
Vertical 4.20% 0.996
Drag 4.38% 0.998 H27 50 48
Vertical 8.38% 0.982
Drag 7.59% 0.993 R18 50 48
Vertical 5.00% 0.987
Table 10-3. Metamodel accuracy summary for engineeredaggregate/turf arrestor bed.
Dra
g F
orce
(lb
f)
Speed (knots) Penetration Depth Ratio
Figure 10-21. Metamodel drag load surface plot for 44.5-in. tire in an18-in. deep arrestor/turf bed.

The drag load was found to be dependent on speed and speed-squared terms:
10.4.4.4. Effect of Turf Cover Layer
The presence of the turf cover layer produced a milddecrease in the rate sensitivity as compared with a bed of plainaggregate without a cover layer. Table 10-4 compares the rela-tive sensitivities of the two systems to the aircraft speed(H44.5x16.5-22 tire). It may be possible to further enhance thismitigating effect with design improvements to the cover layer.
Another advantage of the turf layer is a predicted reductionin the aggregate ejecta thrown from the tire rut. Figure 10-22shows a comparison for an 18-in. deep bed with a 44.5-in. tireat a deep penetration level (99%). In the left-hand illustra-tion, the aggregate particle flyout is shown with the turf layeromitted. The right-hand image is the analogous case for a bedwith no turf cover layer. The maximum aggregate particle
Drag A Speed B Speed C= ⋅ + ⋅ +2
velocities are similar in both cases (∼1,000 in./s), but the vol-ume of debris appears to be reduced where the turf layer ispresent.
If the ejecta plume is mitigated in this way, it could reducethe risk of ingesting aggregate particles in the aircraft engines.However, the reality of this predicted behavior requires con-firmation through physical testing.
10.4.4.5. Effects of Penetration Depth
The bi-layer construction of the turf-covered aggregate bedcan lead to situations where the tire creates a tunnel beneaththe turf surface. Figure 10-23 illustrates such a situation,where the turf layer is stretched, but not broken, above thesmall 18-in. diameter tire. In actuality, the landing gear ver-tical strut member would sever the turf layer, preventing acomplete tunnel. Additionally, bed designs of this relativedepth would typically not be feasible because they wouldoverload the landing gear.
10.4.4.6. Data Transformation
The final metamodel data for each tire was converted foruse by the APC. LS-OPT was used to extract nominally 9,000data points from each metamodel and export them into tab-ular form. A MATLAB matrix conversion program was writ-ten to map this data into multi-dimensional matrix form thatcould be quickly accessed by the APC.
For the two tires not explicitly modeled, the appropriateresponse surface data was scaled to produce an approximatemetamodel (Section 10.4.3.2).
102
System Drag Force Vertical Force
Aggregate/Turf -14 20
Aggregate Only -20 23
Percent Advantage for Aggregate/Turf
30% 13%
Table 10-4. Comparison of speed sensitivities for engineered aggregate systems with and without turf cover layer.
Figure 10-22. Ejecta plumes of engineered aggregate for beds with (left) and without (right) turf cover layers.

10.5. Arrestor PerformancePredictions
10.5.1. Scope of Simulations
Using the APC, a separate optimal arrestor was designedfor each of the three trial aircraft: CRJ-200, B737-800, andB747-400. Subsequently, an optimal mixed-fleet arrestor wasdesigned as a compromise best-fit for all three aircraft.
All simulations assumed a turf-covered arrestor bed withdry aggregate. If a drainage-type arrestor bed were used, theaggregate would be intermittently wet and dry, and longerarrestor designs would be required.
It was determined through experimentation that the aggre-gate arrestor design functioned best as a fully recessed bed, withthe top of the turf level with the runway, and the remainder ofthe material placed in a basin below grade.
The predicted stopping distances for the three aircraft aregiven in Table 10-5. All arrestment predictions assumed thefollowing:
• 50-ft setback distance;• 50-ft gradual decline to the maximum bed depth;• 70-knot starting speed for the aircraft;• No reverse thrust;• Braking factor of 0.25 before and within the bed; and• Arrestor bed loads based on interaction with tires, neglect-
ing strut and axle components.
Arrestor beds were designed for two different nose-gearloading criteria:
1. Limit Load Criterion, where the drag load applied to thenose strut cannot exceed the limit load for the nose gear(FAR Part 25.509);
2. Ultimate Load Criterion, where the drag load applied to thenose strut cannot exceed the ultimate load for the nose gear;
Since the ultimate loading criterion permits higher loads onthe strut, deeper beds and shorter stopping distances resultedfrom those cases.
10.5.2. Performance for Test Aircraft
Table 10-5 lists best-case arrestor designs for each aircrafttaken individually. Each arrestor bed listed uses a differentmaterial strength and depth that are optimized for the designaircraft. Generally, a range of acceptable strength and depthcombinations was available. Compared with the similarEMAS design cases on the right (provided by ESCO), the dis-tances are comparable if the ultimate loading criterion is used.
Table 10-6 shows the compromise design case with the bestarrestor design for all three aircraft. The CRJ-200 controls thebed depth in this case, while the B737 controls the bed length.With the material strength and depth as specified, the B747
103
Figure 10-23. Tunneling of tire below turf surface.
Nose-Gear Limit Load Criterion
Nose-Gear Ultimate Load
Criterion
Current EMAS, Optimal Designs
Arrestor BedDesign
Depth(in.)
BedLength
(ft)
Depth(in.)
BedLength
(ft)
Depth(in.)
BedLength
(ft)
Single Aircraft
CRJ-200 9.6 495 14.1 310 20 258
B737-800 13.5 462 19.5 361 20 287
B747-400 29.1 568 34.7 517 26 495
Table 10-5. APC predicted 70-knot stopping distances for engineeredaggregate arrestor system.
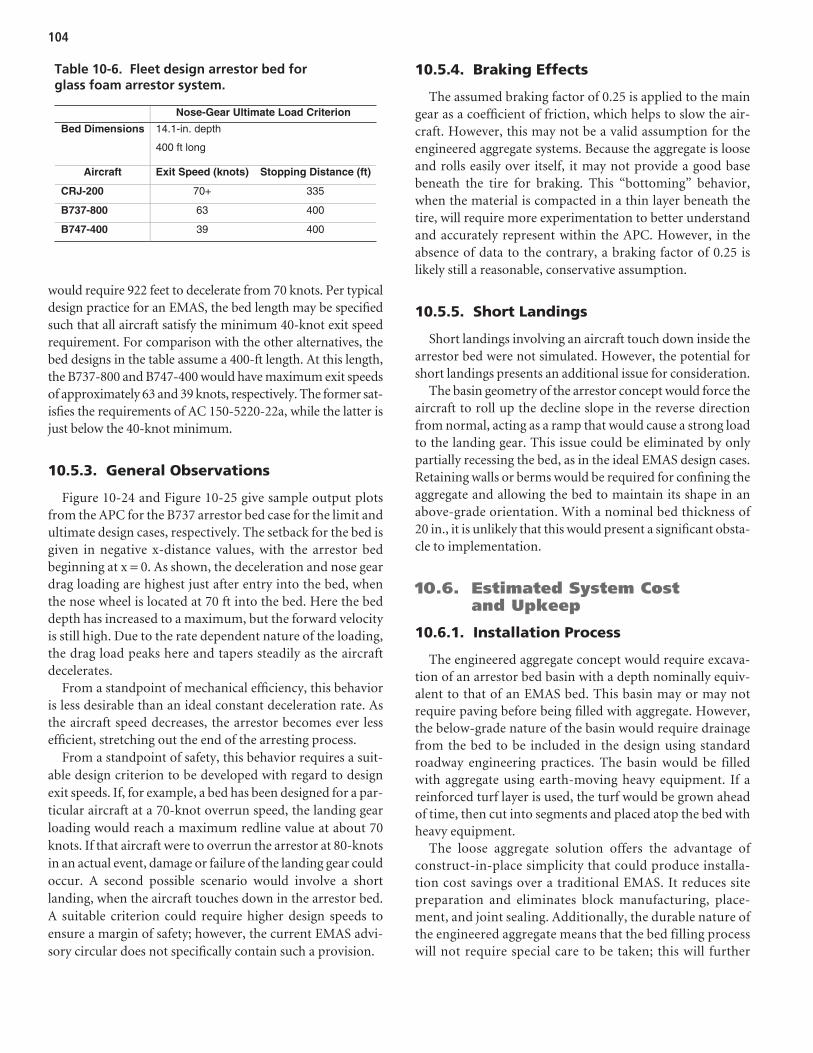
would require 922 feet to decelerate from 70 knots. Per typicaldesign practice for an EMAS, the bed length may be specifiedsuch that all aircraft satisfy the minimum 40-knot exit speedrequirement. For comparison with the other alternatives, thebed designs in the table assume a 400-ft length. At this length,the B737-800 and B747-400 would have maximum exit speedsof approximately 63 and 39 knots, respectively. The former sat-isfies the requirements of AC 150-5220-22a, while the latter isjust below the 40-knot minimum.
10.5.3. General Observations
Figure 10-24 and Figure 10-25 give sample output plotsfrom the APC for the B737 arrestor bed case for the limit andultimate design cases, respectively. The setback for the bed isgiven in negative x-distance values, with the arrestor bedbeginning at x = 0. As shown, the deceleration and nose geardrag loading are highest just after entry into the bed, whenthe nose wheel is located at 70 ft into the bed. Here the beddepth has increased to a maximum, but the forward velocityis still high. Due to the rate dependent nature of the loading,the drag load peaks here and tapers steadily as the aircraftdecelerates.
From a standpoint of mechanical efficiency, this behavioris less desirable than an ideal constant deceleration rate. Asthe aircraft speed decreases, the arrestor becomes ever lessefficient, stretching out the end of the arresting process.
From a standpoint of safety, this behavior requires a suit-able design criterion to be developed with regard to designexit speeds. If, for example, a bed has been designed for a par-ticular aircraft at a 70-knot overrun speed, the landing gearloading would reach a maximum redline value at about 70knots. If that aircraft were to overrun the arrestor at 80-knotsin an actual event, damage or failure of the landing gear couldoccur. A second possible scenario would involve a short landing, when the aircraft touches down in the arrestor bed.A suitable criterion could require higher design speeds toensure a margin of safety; however, the current EMAS advi-sory circular does not specifically contain such a provision.
10.5.4. Braking Effects
The assumed braking factor of 0.25 is applied to the maingear as a coefficient of friction, which helps to slow the air-craft. However, this may not be a valid assumption for theengineered aggregate systems. Because the aggregate is looseand rolls easily over itself, it may not provide a good basebeneath the tire for braking. This “bottoming” behavior,when the material is compacted in a thin layer beneath thetire, will require more experimentation to better understandand accurately represent within the APC. However, in theabsence of data to the contrary, a braking factor of 0.25 islikely still a reasonable, conservative assumption.
10.5.5. Short Landings
Short landings involving an aircraft touch down inside thearrestor bed were not simulated. However, the potential forshort landings presents an additional issue for consideration.
The basin geometry of the arrestor concept would force theaircraft to roll up the decline slope in the reverse directionfrom normal, acting as a ramp that would cause a strong loadto the landing gear. This issue could be eliminated by onlypartially recessing the bed, as in the ideal EMAS design cases.Retaining walls or berms would be required for confining theaggregate and allowing the bed to maintain its shape in anabove-grade orientation. With a nominal bed thickness of 20 in., it is unlikely that this would present a significant obsta-cle to implementation.
10.6. Estimated System Cost and Upkeep
10.6.1. Installation Process
The engineered aggregate concept would require excava-tion of an arrestor bed basin with a depth nominally equiv-alent to that of an EMAS bed. This basin may or may notrequire paving before being filled with aggregate. However,the below-grade nature of the basin would require drainagefrom the bed to be included in the design using standardroadway engineering practices. The basin would be filledwith aggregate using earth-moving heavy equipment. If areinforced turf layer is used, the turf would be grown aheadof time, then cut into segments and placed atop the bed withheavy equipment.
The loose aggregate solution offers the advantage of construct-in-place simplicity that could produce installa-tion cost savings over a traditional EMAS. It reduces sitepreparation and eliminates block manufacturing, place-ment, and joint sealing. Additionally, the durable nature ofthe engineered aggregate means that the bed filling processwill not require special care to be taken; this will further
104
Nose-Gear Ultimate Load Criterion
Bed Dimensions 14.1-in. depth
400 ft long
Aircraft Exit Speed (knots) Stopping Distance (ft)
CRJ-200 70+ 335
B737-800 63 400
B747-400 39 400
Table 10-6. Fleet design arrestor bed for glass foam arrestor system.
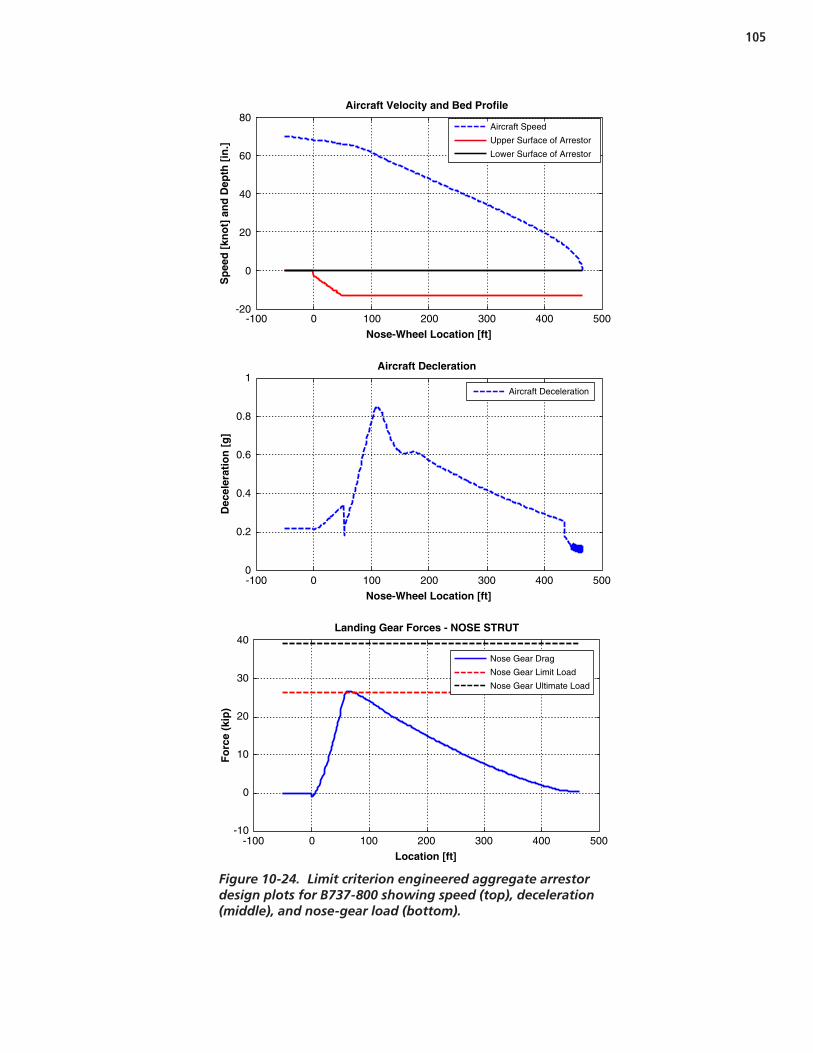
105
Figure 10-24. Limit criterion engineered aggregate arrestordesign plots for B737-800 showing speed (top), deceleration(middle), and nose-gear load (bottom).
-20
0
20
40
60
80
Sp
eed
[kn
ot]
an
d D
epth
[in
.]
Aircraft Velocity and Bed Profile
Aircraft Speed
Upper Surface of Arrestor
Lower Surface of Arrestor
-100 0 100 200 300 400 500 0
0.2
0.4
0.6
0.8
1
Nose-Wheel Location [ft]
-100 0 100 200 300 400 500
Nose-Wheel Location [ft]
-100 0 100 200 300 400 500
Location [ft]
Dec
eler
atio
n [
g]
Aircraft Decleration
Aircraft Deceleration
-10
0
10
20
30
40
Fo
rce
(kip
)
Landing Gear Forces - NOSE STRUT
Nose Gear Drag
Nose Gear Limit Load
Nose Gear Ultimate Load

106
Figure 10-25. Ultimate criterion engineered aggregatearrestor design plots for B737-800 showing speed (top), deceleration (middle), and nose-gear load (bottom).
-20
0
20
40
60
80
Sp
eed
[kn
ot]
an
d D
epth
[in
.]
Aircraft Velocity and Bed Profile
Aircraft Speed
Upper Surface of Arrestor
Lower Surface of Arrestor
0.2
0.4
0.6
0.8
1
1.2
Nose-Wheel Location [ft]
Nose-Wheel Location [ft]
Location [ft]
Dec
eler
atio
n [
g]
Aircraft Decleration
Aircraft Deceleration
-10
0
10
20
30
40
Fo
rce
(kip
)
Landing Gear Forces - NOSE STRUT
Nose Gear Drag
Nose Gear Limit Load
Nose Gear Ultimate Load
-50 400 0 50 100 150 200 250 300 350
-50 4000 50 100 150 200 250 300 350
-50 4000 50 100 150 200 250 300 350

speed the installation process. However, turf preparationand placement would be additional tasks not required forthe current EMAS design.
10.6.2. Cost to Establish System
A preliminary estimate was made for the cost to establish anengineered aggregate arrestor system. It must be noted thatthe cost estimate from this section is only a basic approxima-tion for the purposes of comparing the different arrestor alter-natives. The cost estimate is based on a mixture of informationfrom the manufacturer, the airport survey, and FAA Order5200.9. To develop a more accurate estimate of the costs toinstall such a system, it is recommended that a detailed costquote be sought from a firm qualified to undertake an instal-lation effort. Where possible, the methodologies used wereconsistent with the prior survey information collected regard-ing the existing EMAS (Section 3.5).
The costs may be broken into two major categories: sitepreparation and installation. The site preparation costs wereestimated for two cases. The engineered aggregate arrestorwould use a basin for the arresting materials rather than a flatrunway-type surface as is used for the current EMAS. The bot-tom of the basin could either be paved or earthen. Drainage,excavation, and leveling would be required for either option.Assuming that a full-paved surface is not provided under thebed, the cost for site preparation was assumed to be reducedby half; this value was used for the lower-bound cost estimatefor the system. If a full-paved surface is provided, identical tothat of an EMAS, then the preparatory costs were assumed tobe the same as for an EMAS; this provided the upper-boundcost estimate.
The installation cost estimate was separated into specificmaterials and general installation labor needs. Because thesecosts were specific to the engineered aggregate arrestor con-cept, they do not have a direct connection to any prior EMASdata. Discussions with the manufacturer produced cost esti-mates for the engineered aggregate, reinforced turf coverlayer, and geo-textile/geo-plastic layers. Where applicable,materials included freight costs for trans-Atlantic shipping.The labor costs were based on estimates from the manufac-turer established from similar installation efforts.
Finally, the site preparation and estimated EMAS costswere computed in two ways: (1) assuming average surveycosts from this research, and (2) assuming FAA Order 5200.9costs. The final cost estimates for both options are given inTable 10-7 and Table 10-8, respectively.
Using the survey cost assumptions of Table 10-7, a 300-ftarrestor bed would cost between 30% and 43% less than thecurrent EMAS. If the Order 5200.9 costs are assumed, the costadvantage drops to between 5% and 12% (Table 10-8).
In addition to the tables in this section, longer-term life-cycleissues could also be considered. FAA Order 5200.9 includes astandard 10-year replacement interval for an EMAS, whichtranslates into present-value life-cycle costs. Such a replace-ment could arguably be unnecessary for this arrestor concept(Section 10.6.4). Eliminating the assumed 10-year replacementcould effectively trim about $2.6M off present-value life-cyclecosts (based on the EMAS replacement cost estimates of thesurvey).
10.6.3. Maintenance
Maintenance for the engineered aggregate concept would berelatively simple, and should be limited to standard grounds-keeping measures for the protective turf layer. Drainage of thearea to prevent standing water is required and periodic inspec-tions would be advisable to ensure that no issues arise due toseasonal weather changes. Due to the lack of joints, blocks, anddegradable materials, many protective measures used in cur-rent EMAS construction would not be necessary. Therefore,the predicted maintenance needs are lower than for that of theexisting EMAS.
107
Engineered Aggregate System
Cost Category
Lower Bound
UpperBound
Current EMAS
Site Preparation $ 1.08 $ 2.16 $ 2.17
Installation $ 3.61 $ 3.61 $ 6.03
Cost to Establish $ 4.69 $ 5.77 $ 8.19
Percent of EMAS 57% 70%
Table 10-7. Estimated costs to establish engineered aggregate arrestor, 150 x 300 ft,assuming survey average costs for currentEMAS, units of millions USD.
Engineered Aggregate System
Cost Category
Lower Bound
UpperBound
Current EMAS
Site Preparation $ 0.34 $ 0.68 $ 0.68
Installation $ 3.61 $ 3.61 $ 3.83
Cost to Establish $ 3.95 $ 4.29 $ 4.50
Percent of EMAS 88% 95%
Table 10-8. Estimated costs to establish engineered aggregate arrestor, 150 x 300 ft,assuming Order 5200.9 costs for currentEMAS, units of millions USD.

Compared with crushable materials, there are no materialbreakdown concerns regarding freeze–thaw exposure. How-ever, it is presently unknown how substantially ice may affectthe inter-particle friction of the aggregate; changes to the fric-tion could alter the dynamic arresting response. Additionally,dirt entrainment over time could solidify the bed if the drainageapproach is used for handling precipitation. Therefore, thewaterproofed option is recommended to minimize the mainte-nance and performance impacts of water, soil, and ice.
10.6.4. Replacement
All materials included in the engineered aggregate conceptare expected to last for the 20-year life cycle prescribed in theEMAS Advisory Circular, if not longer. It is not anticipatedthat replacement of the bed would be required after 10 years,as anticipated for an EMAS in FAA Order 5200.9.
10.6.5. Repair
After an overrun event, the rut areas would require repair.The aggregate remaining in the ruts would be reusable, andfresh aggregate would likely need to be added to bring the bedsback to level condition. The damaged cover layer, if used,would need to be removed from the rut areas and replaced withfresh material. If the cover layer is turf, it is possible thatreplacement turf could be planted at another area of the facil-ity on initial installation of the system. When replacementneeds arise, this turf could be harvested for immediate use toprevent delays that would accompany growing fresh turf.
10.7. Transition to Fielded System
In order to transition the engineered aggregate concept toa fielded system, the following additional development stepsmay be advisable.
10.7.1. Cover-Layer Design
Several cover-layer design concepts are possible:
1. Thin sealant,2. Asphalt skim coat,3. Reinforced turf layer,4. Reinforced turf with geo-textile fabric, and5. Turf/geo-textile/plastic composite cover layer.
Only concept three was modeled during the research effort.Additional testing and modeling would be required forwhichever method is selected since the membrane behaviorof a cover layer will impact the dynamic mechanical perfor-mance of the arrestor bed. The cover layer performance shouldbe further characterized under frozen conditions because it
will be exposed to such conditions even where the aggregatelayer of the system is waterproofed.
10.7.2. Bottoming and Braking Dynamics
The research performed has identified that tire bottomingand braking in the aggregate material require further study.The current modeling method of the APC makes simplifyingassumptions regarding both phenomena sufficient for a concept-level evaluation. However, to ensure accuracy ofdesign predictions, some additional tests would be required.One method could involve using a one-wheel bogy apparatusfitted with brakes and a load measurement system that istowed through the material.
10.7.3. Aggregate Ingestion
While the presence of a cover layer appears to offer mitiga-tion of aggregate spray, it is unclear as to the level of residualhazard remaining. The spraying gravel from the nose-wheelmay or may not pose an ingestion hazard for the aircraftengines. If an ingestion hazard is present, it is unclear what prac-tical risk this presents with regard to engine damage, potentialfire, and so on. A limited test series using a one-wheel bogyapparatus may be able to answer the issue of ingestion likeli-hood. Discussions with aircraft manufacturers or other FAAsafety personnel should provide insight into the practical risksin the event that ingestion occurred.
10.7.4. Requirements and Standards
Due to the speed dependence issues, development of a prac-tical design criterion for the design exit speed may be advisableto ensure a factor of safety for the landing gear.
10.7.5. Full-Scale Testing
A full-scale aircraft overrun test of an engineered aggregatearrestor bed is advisable because this concept represents asubstantial departure from the current EMAS design in termsof mechanical loading and the materials used.
10.8. Summary
Of the candidate systems evaluated, the engineered aggregatearrestor concept is most dissimilar to the current EMAS tech-nology. It uses a hard spherical aggregate that primarily under-goes displacement rather than the compaction that occurs withcrushable foams like cellular cement. The arresting bed wouldbe constructed with a shallow basin of the material topped witha reinforced turf cover layer.
Since the engineered aggregate material is not a porous foam,it is durable against moisture and other environmental factors,
108

including water immersion. However, while the material itselfdoes not degrade with such exposures, the mechanical responsechanges, exhibiting an increase in arresting loads when wet. Tomaintain predictable arresting performance, the material wouldrequire the use of protective plastic geo-membranes and typicaldrainage provisions. The material characteristics indicate thatlong service life is possible, potentially eliminating the standard10-year replacement interval assumed in FAA Order 5200.9.
Installation of the system would likely be simpler and lessexpensive than for the current EMAS since placement ofblocks and sealing joints is unnecessary. Heavy equipmentwould place the material in the bed basin and top it with pre-grown reinforced turf segments. Geo-membrane and geo-textile layers, as applicable, would be placed and joined man-ually. The arrestor basin could be constructed with or withoutpaving, which could result in preparatory cost reduction.
The cost to establish such a system would be nominally57% to 70% of the survey cost of the existing EMAS. Life-cycle costs could be reduced due to longer bed life. Mainte-nance needs appear to be simplified, requiring standardgrounds-keeping measures, but no block or joint repairs.
The APC predictions for the engineered aggregate arrestorshow that the deceleration varies throughout the arrestmentprocess, exhibiting a strong dependence on aircraft speed.This is not a preferable characteristic; however, functional
arrestor designs are still feasible. Arrestor bed lengths forindividual aircraft were nominally 15% longer than for thecurrent EMAS technology due to the speed-dependent prop-erties of the arrestor. Additionally, the multi-aircraft designcase for the concept showed the weakest performance amongthe three candidate systems. Bed designs that were safe for thesmallest aircraft did not exert a strong deceleration load onthe largest aircraft.
The speed dependence of the engineered aggregate bedwould require development of a new design criterion. Over-runs exceeding the rated exit speed or short landings into thebed could result in overloads to the landing gear if the speeddependence is not considered in the design process. Arrestordesigns that include provisions for these events would neces-sarily have gentler decelerations and longer arrestment dis-tances than the design cases cited in this research.
Transition to a fielded system would require finalizing acomposite turf cover-layer design and calibrating a predictivemodel to match the response. Characterization would beadvisable for the soil layer under various freezing conditionsto assess the impact on arresting dynamics. Additionally,investigation should be made regarding the basin geometryto determine whether above- or below-grade construction ispreferable. Full-scale testing is advisable for evaluation of thecomplete system.
109

110
11.1. Concept Description
11.1.1. System Overview
An aggregate foam arrestor concept has been proposed. Thearrestor would use rough-broken foam aggregate made fromrecycled glass (Figure 11-1). The foamed, or aerated, glassmaterial has nominally 80% void space by volume. Its closed-cell microstructure makes it resistant to water absorptionand degradation. The aggregate comes in a variety of gra-dations and is currently used in different civil engineeringapplications for light fill construction, insulation, and frostprotection of road foundations and terraces (43). For the eval-uation effort, fragments were graded to fall between 0.4 and2.4 in., with a loose fill density of 11.2 pcf (Figure 11-2).
An arrestor using the aggregate foam would be constructedby creating a basin and filling it with the material (Figure 11-3).An engineered turf would serve as a top cover layer for thebed, which can serve several purposes:
1. Prevent material dispersion due to jet blast;2. Mitigate material spraying during overrun by an aircraft
tire, thus limiting engine ingestion hazard;3. Regulate water drainage and potential ice crust formation
in winter; and4. Act as a structural component to prevent lightweight land
vehicles from penetrating the arrestor bed.
This simple fill-and-cover construction would likely pro-duce lower manufacturing and installation costs than the blockconstruction methods used at present. This potential advan-tage is offset by the possibility that the material could settle overtime and result in altered arresting performance; potentialmechanisms of settling could include:
1. Consolidation, and2. Mechanical/chemical degradation and shrinkage/break-
ing of aggregate pieces.
Because the aggregate foam material has a closed-cell micro-structure, it has an inherent resistance to moisture. However,the presence of water during freeze–thaw cycling could presenta more aggressive erosion hazard for the material. Two poten-tial methods have been identified to handle precipitation (Fig-ure 11-4).
1. Drainage Approach. This approach would allow waterdrainage downward through the bed. The bed would bedesigned to prevent standing water within it using normalcivil engineering design practices.
2. Waterproof Approach. In this approach, layers of geo-plastic and geo-textile materials would be employed at thetop and bottom of the bed. The upper and lower plasticlayers would be sealed at the edges to produce a watertightenvelope around the fill material (a practice currently inuse at some landfills). Precipitation in this design wouldrun off to the perimeter of the arrestor bed.
11.1.2. Performance Considerations
Mechanically, each piece of material is composed of crush-able glass foam, which has fairly conventional properties.However, when acting as a continuum, many irregular andloose-fitting pieces would exhibit flowing aggregate behav-ior. While the material would have compressive and shearstrength properties, the loose aggregate would not exhibittensile strength because nothing binds the loose pieces together.Overall, the aggregate foam concept falls somewhere in betweena conventional foam block system and a conventional hardaggregate system.
Falling between these two different material categories,the aggregate foam concept presented multiple issues forevaluation:
• Overall dynamic response characteristics,• Required density/strength for effective arresting,
C H A P T E R 1 1
Aggregate Foam Arrestor Concept

111
• Effect of aggregate size,• Rate dependence of the material, and• Durability to freeze–thaw exposure.
11.2. Testing and Modeling Approach
11.2.1. Overview
The goal for the performance evaluation was to undertaketesting that would allow calibration of high-accuracy com-puter models of the aggregate foam concept. The testingapproach evaluated several characteristics of the material,
which was sufficient for a concept-level evaluation. The sub-sequent modeling approach for the aggregate foam materialwas comprehensive in nature, and the outcome was a cali-brated numerical model for predicting arrestment loads.
The testing and modeling approach for the aggregate foamconcept is illustrated by Figure 11-5. Five major stages areillustrated by the larger process bubbles of the chart:
1. Arrestor Material Testing and Modeling. Laboratorytesting generated test data, and computer models of thematerial were calibrated to match it.
2. Tire Modeling. Aircraft tire models for the three test air-craft were built and calibrated to match manufacturerperformance specifications.
3. Aircraft Modeling. A generalized aircraft model was devel-oped to predict the suspension response of the plane andits deceleration during a ground roll. This model was thenincorporated into an APC for determining stopping dis-tances and landing gear loads when an aircraft is driventhrough an arrestor bed. A library of aircraft definitionswas created to represent the three test aircraft.
4. Metamodeling. The arrestor material and tire models werecombined to produce an overrun model for determin-ing the loads exerted on the different aircraft tires by thearrestor bed. Large data sets were generated using simula-tion batches for each tire and arrestor combination. Thesedata sets were then accessible by the arrestor predictioncode (next step).
5. Performance Predictions. The preceding four develop-ment stages culminated in the final, bottom-most process
Figure 11-1. Aggregate foam material: pile of aggregate (left) and close-up of microstructure (right) (43).
Figure 11-2. Typical aggregate foam fragments.
Figure 11-3. Aggregate foam arrestor concept.
Aggregate Foam Bed
Cover Layer of Engineered Turf
Arrestor Basin

on the figure. The APC was used to predict arresting dis-tances, landing gear loads, and ideal arrestor bed designsfor the different aircraft.
The subsequent sections of this chapter will focus on areas(1), (4), and (5). Special attention will be given to the aggregatefoam material testing that was conducted and the calibrationof the computer models to match the tests. The developmentof the tire models (2) and aircraft model (3) will be reserved forAppendix F and Appendix G, respectively.
112
Figure 11-4. Aggregate bed methods forhandling precipitation and drainage.
Drainage Approach Waterproof Approach
Precipitation DrainsThrough Bed
Layers of Plastic KeepAggregate Dry
(5) Performance Predictions
Predict Arresting Performance forTest Aircraft (APC/MATLAB)
(2) Tire Modeling
Manufacturer TireData
Build Tire Model(LS-DYNA)
Calibrate Tire Modelto Match Data
(LS-OPT)
Final Tire Models
(1) Arrestor MaterialTesting/Modeling
Conduct MaterialTests
Build ModelsReplicating Tests
(LS-DYNA)
Calibrate Model toMatch Test Data
(LS-OPT)
Final Material Model
Test Data
(3) Aircraft Modeling
Develop ArrestorPrediction Code(APC) (MATLAB)
Manufacturer AircraftData
Develop EstimatedAircraft Parameters
Aircraft Library
(4) Metamodeling
Build CombinedTire/Arrestor Models
(LS-DYNA)
Batch Simulations forTire/Arrestor Combinations
(LS-OPT)
Metamodel Data
Figure 11-5. Testing and modeling process for aggregate foam arrestorevaluation.

113
11.2.2. Special Considerations
Overall, testing the aggregate foam proved challenging forthree reasons:
1. The combined crushable and aggregate properties of thematerial did not readily fit into standardized test methods.
2. The large size of the foam pieces required large test fixturesto capture continuum-type properties of the loose fill; thisprecluded the use of some desirable tests.
3. The dual-mode material behavior did not allow compre-hensive definition by the material models of the availablemodeling software.
11.3. Testing Effort
The testing effort for the aggregate foam material involvedseveral mechanical and environmental tests. Table 11-1 depicts
the overall test matrix for the aggregate foam material. Allcylinder dimensions specify diameter followed by height.
11.3.1. Density and DimensionMeasurements
The original, as-received aggregate foam material hadpieces graded to between 0.4 and 2.4 in., with a loose fill den-sity of 11.2 pcf. For a small sample of pieces measured, theaverage size was 1.9 in.
As previously discussed (Section 11.2.2), the as-receivedaggregate size precluded some testing that might otherwisehave been conducted. For other tests, the aggregate was bro-ken down into smaller pieces and sifted through a 1-in. grid,giving it a gradation of 0.4 to 1.0 inches.
All tests, therefore, were conducted on either the original2.4-in. material, or on the reduced 1.0-in. material.
Table 11-1. Test matrix for aggregate foam material.
Test Properties Characterized
Detail Number of Tests
Laboratory Tests
Hydrostatic TriaxialCompression Test
• Compressive strength (σu)
• Shear strength (τu)• Effects of confining
pressure on strength
• Per ASTM D2850 • 6 x 10.5” cylinder • Reduced aggregate size • Pieces graded for 0.4” to 1.0”
0.24%/min compression rate • Maximum compression of 15 to 25% • Confining pressures of 5, 10, 20, 60,
and 100 psi
5 psi
10 psi
20 psi
60 psi
100 psi
Total:
1
2
2
2
2
9
• Version 1: Original Aggregate Size • Non-standard • Pieces graded for 0.4” to 2.4” • 12.375 x 9.5” confining cylinder • 3 in./min compression rate • Maximum compression of 75%
2 Confined Cylinder Compression Test
• Compressive strength (σu)
• Compressive stress–strain curve
• Extrapolated: volumetric energy capacity • Version 2: Reduced Aggregate Size
• Non-standard • Pieces graded for 0.4” to 1.0” • 12.375 x 7.5” confining cylinder • 3 in./min compression rate • Maximum compression of 45%
Fresh
Conditioned
1
2
• Version 1: Per ATSM C 666/C 666M-03 (modified)
• Trays of material, 10 gallons total • 50 freeze–thaw cycles • Material compression tested
thereafter
2Environmental Chamber Tests
• Durability to freeze–thaw cycles in fully immersed conditions
• Version 2: Per AASHTO T 103 • Particles separated by gradation into
different sieve sizes • Particle size distribution changes
measured • 50 freeze–thaw cycles
2

11.3.2. Confined Cylinder Compression Tests
Confined cylinder compression tests were performed onboth the original and the reduced size aggregate foam. Thetests were conducted by pressing a 12-in. diameter platen intoa 12.375-in. diameter cylinder at a fixed rate of 3 in./min (Fig-ure 11-6). The 12-in. diameter was chosen as being greaterthan six times the characteristic dimension of the material,which as a rule of thumb helps to ensure continuum materialbehavior. The material was poured loosely into the cylinderwithout packing. Due to the irregular nature of the aggregate,initial depth measurements were approximate.
The load data for replicate tests was remarkably consis-tent, despite the random nature of the selected aggregatepieces for each test. However, the gradation size of the aggre-gate appeared to have a substantial effect on the loading and theenergy absorption.
Figure 11-7 illustrates the load history for both gradations.The general load curve shape followed an exponential form; asa result, the energy absorption also followed an exponentialtrend (Figure 11-8). As shown, the reduced gradation materialonly obtained a compression of about 45%, whereas the orig-inal larger gradation reached 75% at the same load. This led
114
Figure 11-6. Confined cylinder test for aggregate foam showing the test fixture(left), pre-test specimen (top) and post-test specimen (bottom).
Figure 11-7. Confined cylinder test average loadhistories for aggregate foam material.
Compressive Strain (in./in.)
Str
ess
(psi
)
0 0.1 0.2 0.3 0.4 0.5 0.6 0.7 0.80
20
40
60
80
100
120
140
160
180
Original Gradation - LoadingReduced Gradation - Loading

115
to a 39% decrease in energy absorption for the reduced grada-tion material.
The gradation effect may be due to two geometric differ-ences between the specimens. First, in the larger gradationmaterial, the particles may simply have more size variation.If the reduced gradation sizing was more uniform (smallersize range), then the packing ratio may have been higher,leading to less empty space between the particles. Second,some of the larger pieces had concave surface features thatmay have bolstered the void percentage of the original gra-dation material. Once broken into smaller 1-in. pieces, theparticles may have become rounder, which would, again,reduce the empty space between the particles. In either case,or in a combined case, a reduction in the void space betweenpieces would lead to earlier compaction of the material andless energy absorption.
It is clear from these tests that the aggregate foam gradationwould need to be chosen carefully for an arrestor application.Further, the intended gradation would need to be protectedduring the installation process and over the life of the bed.Repetitive vehicle overruns, jet blast, or other physical loads thatmight induce compaction or fragmentation of the pieces wouldneed to be avoided. If gradation shifts occurred over time, thebed properties could change and lead to unanticipated mechan-ical performance.
Another important observation from the confined cylindertests is that the material would, in effect, act as a depth-varyingcompressible material. Deeper tire penetrations would lead toan increase in vertical load, not simply because a larger surface
area comes into contact with the material, but because thematerial continually hardens as the compression increases. Thistrend is dissimilar from a typical block of crushable foam, whichreaches a fairly constant plateau strength for the majority ofthe compression range. The energy absorption for a crushableblock increases linearly with compression; for the aggregatefoam, the increase is exponential. This depth-varying propertyposed an interesting alternative for arrestor applications.
11.3.3. Hydrostatic Triaxial Tests
The hydrostatic triaxial tests evaluated the aggregate foamperformance at different confining pressures to determine ifany strength increase or bulking deformation took place. Dueto the aggregate mode of behavior, lateral bulging of the spec-imens was anticipated.
The largest practical specimen size for testing was a 6-in.diameter cylinder. The reduced gradation material was devel-oped to satisfy the rule of thumb for six times the nominalparticle dimension across this width. All hydrostatic triaxialspecimens used the 1-in. graded material.
The specimens were cylinders (6 × 10.5-in.) placed betweenplatens using Sorbothane caps at the top and bottom (Fig-ure 11-9, left). The specimens were fitted with flexible mem-brane sleeves before immersion in a pressurized vessel ofwater. While at this hydrostatic pressure, the specimens werecompressed axially until reaching 15 to 25% compression. Asshown on the right in Figure 11-9, the specimens bulked lat-erally as anticipated.
A wide range of hydrostatic pressures was explored in orderto determine the overall effects on the material. The upperrange was chosen as 100 psi because little was observed in theway of new trends by that pressure. Because the hydrostaticspecimen data had more scatter than the confined cylinderdata, a total of nine tests were conducted.
Figure 11-10 compares the hydrostatic triaxial data for thethree main material candidates: glass foam block, aggregateglass foam, and hard engineered aggregate. The data points inthe figure represent the top center for the Mohr’s circles at thedifferent confining pressure conditions. Of the three materi-als, the only material exhibiting a change in behavior is theaggregate foam, which has a distinct transition occurring atcompressive stress of 20 psi. This 20-psi stress value wouldoccur for a test specimen at a confinement pressure of about15 psi.
Prior to the transition point, the trend-line fit to the aggre-gate foam has a steep slope and a very low initial value (nearzero); these characteristics are analogous to the hard aggregatematerial. As the compressive stress drops to zero, so does theshear strength of the material. This is consistent with intuitiveobservations since lower confinement pressures allow thematerial pieces to roll and flow past one another more readily.
Compressive Strain (in./in.)
Str
ess
(psi
)
En
erg
y A
bso
rpti
on
(p
si)
0 0.1 0.2 0.3 0.4 0.5 0.6 0.7 0.80 0
20 6
40 12
60 18
80 24
100 30
120 36
140 42
160 48
180 54
Original Gradation - LoadingOriginal Gradation - Energy Absorption
Figure 11-8. Confined cylinder test stress andenergy absorption for original gradationaggregate foam material.
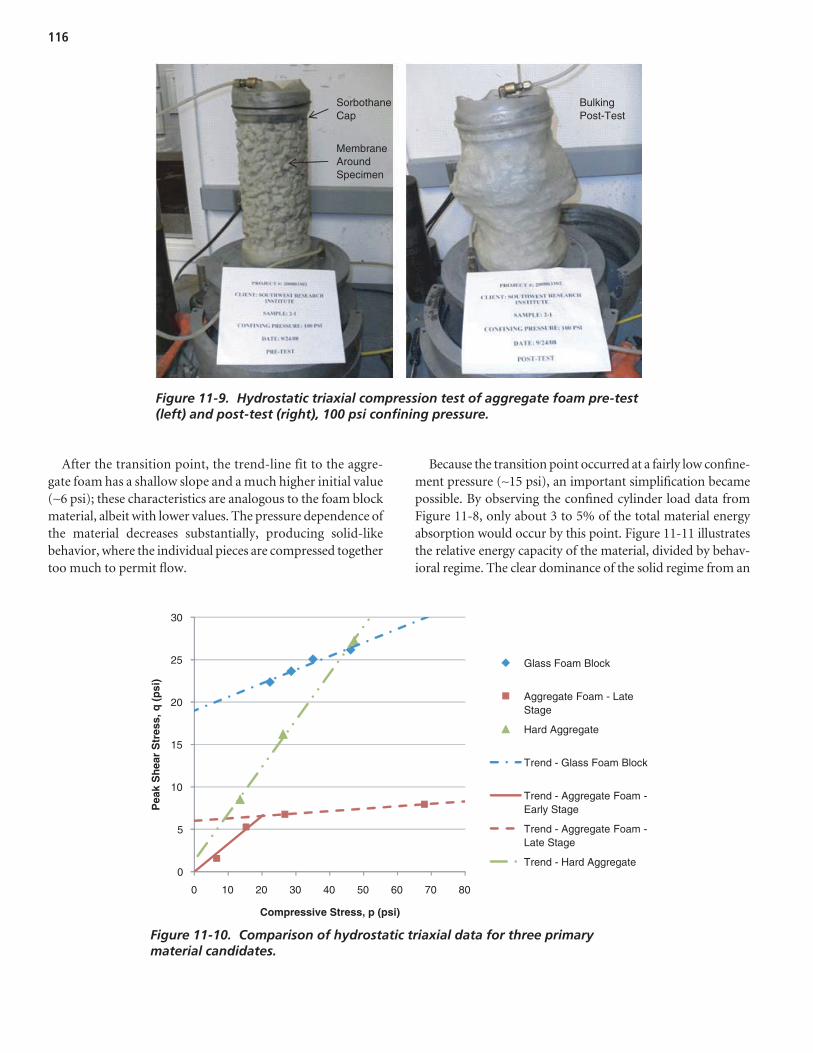
After the transition point, the trend-line fit to the aggre-gate foam has a shallow slope and a much higher initial value(∼6 psi); these characteristics are analogous to the foam blockmaterial, albeit with lower values. The pressure dependence ofthe material decreases substantially, producing solid-likebehavior, where the individual pieces are compressed togethertoo much to permit flow.
Because the transition point occurred at a fairly low confine-ment pressure (∼15 psi), an important simplification becamepossible. By observing the confined cylinder load data fromFigure 11-8, only about 3 to 5% of the total material energyabsorption would occur by this point. Figure 11-11 illustratesthe relative energy capacity of the material, divided by behav-ioral regime. The clear dominance of the solid regime from an
116
Figure 11-9. Hydrostatic triaxial compression test of aggregate foam pre-test(left) and post-test (right), 100 psi confining pressure.
Figure 11-10. Comparison of hydrostatic triaxial data for three primarymaterial candidates.
SorbothaneCap
Membrane Around Specimen
Bulking Post-Test
0
5
10
15
20
25
30
0 10 20 30 40 50 60 70 80
Pea
k S
hea
r S
tres
s, q
(p
si)
Compressive Stress, p (psi)
Glass Foam Block
Aggregate Foam - LateStage
Hard Aggregate
Trend - Glass Foam Block
Trend - Aggregate Foam -Early Stage
Trend - Aggregate Foam -Late Stage
Trend - Hard Aggregate
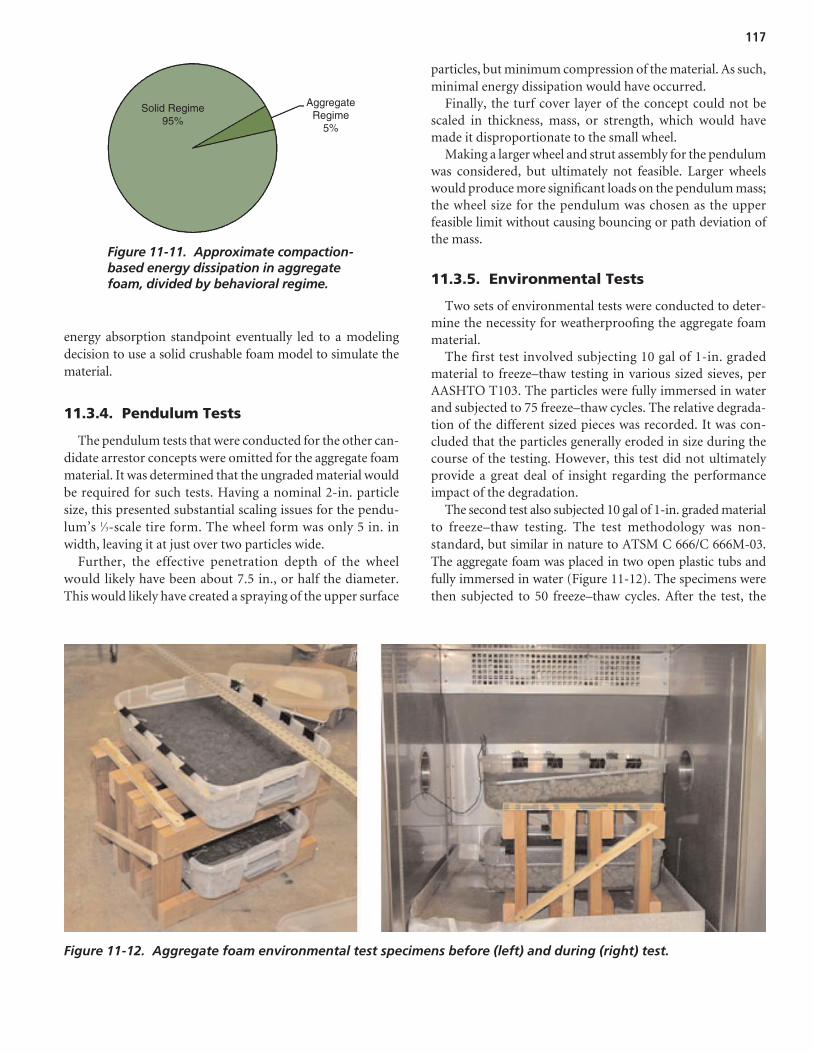
117
energy absorption standpoint eventually led to a modelingdecision to use a solid crushable foam model to simulate thematerial.
11.3.4. Pendulum Tests
The pendulum tests that were conducted for the other can-didate arrestor concepts were omitted for the aggregate foammaterial. It was determined that the ungraded material wouldbe required for such tests. Having a nominal 2-in. particlesize, this presented substantial scaling issues for the pendu-lum’s 1⁄3-scale tire form. The wheel form was only 5 in. inwidth, leaving it at just over two particles wide.
Further, the effective penetration depth of the wheelwould likely have been about 7.5 in., or half the diameter.This would likely have created a spraying of the upper surface
particles, but minimum compression of the material. As such,minimal energy dissipation would have occurred.
Finally, the turf cover layer of the concept could not bescaled in thickness, mass, or strength, which would havemade it disproportionate to the small wheel.
Making a larger wheel and strut assembly for the pendulumwas considered, but ultimately not feasible. Larger wheelswould produce more significant loads on the pendulum mass;the wheel size for the pendulum was chosen as the upperfeasible limit without causing bouncing or path deviation ofthe mass.
11.3.5. Environmental Tests
Two sets of environmental tests were conducted to deter-mine the necessity for weatherproofing the aggregate foammaterial.
The first test involved subjecting 10 gal of 1-in. gradedmaterial to freeze–thaw testing in various sized sieves, perAASHTO T103. The particles were fully immersed in waterand subjected to 75 freeze–thaw cycles. The relative degrada-tion of the different sized pieces was recorded. It was con-cluded that the particles generally eroded in size during thecourse of the testing. However, this test did not ultimatelyprovide a great deal of insight regarding the performanceimpact of the degradation.
The second test also subjected 10 gal of 1-in. graded materialto freeze–thaw testing. The test methodology was non-standard, but similar in nature to ATSM C 666/C 666M-03.The aggregate foam was placed in two open plastic tubs andfully immersed in water (Figure 11-12). The specimens werethen subjected to 50 freeze–thaw cycles. After the test, the
Solid Regime95%
AggregateRegime
5%
Figure 11-11. Approximate compaction-based energy dissipation in aggregatefoam, divided by behavioral regime.
Figure 11-12. Aggregate foam environmental test specimens before (left) and during (right) test.

specimens were oven dried to eliminate the absorbed watermass (Figure 11-13).
Following the environmental tests, the specimens were sub-jected to a confined cylinder compression test (Figure 11-14)to determine the performance degradation. When comparedwith the fresh material, the samples exhibited a 47% decreasein energy absorption capacity.
Mechanically, the closed-cell microstructure of the foamlimits water absorption such that water penetrates only theouter-most open pores of the foam. Upon freezing, the expand-ing water cracks the cells, permitting progressively deeper pen-etration into the specimen as the cyclical testing proceeds. Thedegradation observed is, therefore, not surprising.
These environmental tests represent the most severe ofcircumstances, where the specimens were fully immersed inwater, without normal countermeasures of drainage or a pro-tective plastic envelope. Information provided by the manu-facturer indicates that cyclical temperature and humidityalone do not degrade the material over time. The presence of
water immersion, therefore, is the cause for the observeddegradation.
Overall, these tests indicate that the aggregate foam mat-erial should be protected from immersion conditions causedby standing water. Additional testing could be conducted tocharacterize durability in non-immersion scenarios wherea drainage bed approach is used. For the waterproof bedapproach using a fully sealed plastic envelope, degradationover time is not anticipated.
11.4. Modeling Effort
The modeling effort involved several stages, as shown previ-ously in the flowchart of Figure 11-5. A high-fidelity model forthe aggregate foam material was calibrated to match the testdata (Figure 11-5, block 1). Using this material model, anarrestor bed model was constructed and coupled with tiremodels for the different aircraft (Figure 11-5, block 4). Finally,large batches of simulations were conducted using these pairedmodels, which generated volumes of data for use by the APC(also block 4).
This section will discuss the arrestor model developmentand batch simulation process. Performance predictions forthe aggregate foam arrestor concept are reserved for the fol-lowing section (Section 11.5).
11.4.1. Selection of Modeling Approach
Of the three candidate systems evaluated, the aggregatefoam concept was the most difficult to represent with a robusthigh-fidelity computer model. Because it had both looseaggregate and crushable foam properties, it did not readily fitinto existing material models.
Two modeling code choices were available:
1. LS-DYNA is a general purpose FEM code that supportsmultiple numerical methods. LS-DYNA could readily sup-
118
Figure 11-13. Aggregate foam material environmental test specimens pre-test (left) and post-test (right).
Figure 11-14. Confined cylinder testing of aggregatefoam environmental test specimen (post-test).

port crushable material models. However, loose aggregatescould only be represented by defining many separate piecesof material and allowing them to interact on the basis ofdefined contacts between the pieces. This approach repre-sented a computationally expensive path that would haverequired infeasible simulation times.
2. EDEM is a DEM code that supports the modeling of hardaggregates. EDEM could readily model massive beds ofaggregate pieces while maintaining efficient simulationtimes. However, EDEM did not support crushable materialmodeling of any kind.
In light of these considerations, some simplifying assump-tions were made, and LS-DYNA was selected to model thematerial using a crushable foam model. The model representedthe aggregate foam as a continuum of material (Lagrangian),rather than representing individual pieces of crushable foam.Because the material definition did not discretely represent theseparate pieces of the material, the aggregate mode of behaviorwas not captured by the model. This was deemed an acceptableloss in fidelity based on several assumptions:
1. Dominant Mode of Energy Absorption. As the hydrostaticcompression tests showed, the majority of the energyabsorption for the material takes place in the solid regime ofbehavior, rather than the aggregate regime (Section 11.3.3).About 95% of the energy absorption capacity of the materialexists when the material behaves in a solid-like fashion.
2. Cover Layer Effect. In arrestor applications, the aggregate-type behavior would appear in the uppermost portion ofthe arrestor bed, where the confinement pressures are lowand the pieces are allowed to flow past and roll over oneanother. This upper portion of the aggregate would likelyspray forward and away from the tire, as with solid aggre-gate arrestor beds. Material projected away from the tirewould not participate significantly in the arresting process,decreasing the effective thickness of the arrestor bed.However, the design concept includes a cover layer thatwould attenuate or prevent this spray from occurring. Theaggregate at the top would presumably be held in placeuntil overrun by the tire and preserve the effective bedthickness.
3. Material Density. Unlike a hard aggregate arrestor bed,the foam aggregate has a low density (11 pcf). This leadsto minimal mass-based momentum transfer effects, whichcan occur when an aggregate is projected, or sprayed, athigh speed. Because the material is light, the momentumeffects would be much less significant than the energyabsorbed by material compaction.
4. SPH Formulation. Within LS-DYNA, the material was rep-resented using an SPH formulation. While this formula-tion does not represent aggregate particles, it does represent
solids in a way that allows large dislocations, permitting thematerial to move over and past itself. The SPH methodologyenhanced the continuum representation of the material.Additionally, because the material acted as a continuum, thiswas assumed to at least partially represent the turf layer’smild confinement effects on the bed.
11.4.2. Smoothed Particle HydrodynamicsFormulation
The aggregate foam arrestor models were developed in LS-DYNA, a general-purpose finite element modeling code.Within LS-DYNA, a number of formulations exist for repre-senting solids and fluids. Due to the high compressibility ofthe aggregate foam material and its loose fill properties, anSPH mesh-free formulation was employed. SPH offered theability to represent high-dislocation solids with accuracywhile maintaining time-efficient simulations.
Because SPH uses particles instead of the more typicalfinite elements, the illustrations in this section depict thematerial as a collection of small spheres. Although it would bedesirable given the nature of the aggregate foam material,these particles do not represent disjointed pieces of aggregate.Rather, they are mathematically interconnected to representa continuous solid material (Lagrangian formulation).
11.4.3. Calibration to Physical Tests
11.4.3.1. Constitutive Model
LS-DYNA currently offers about 200 constitutive models; ofthese, about 18 are applicable to various foams. Based on priorexperience and on a review of the LS-DYNA keyword manual,several candidates were singled out for evaluation. After someexperimentation, *MAT_CRUSHABLE_FOAM was selectedas the best overall choice. This material model has parametersas given by Table 11-2. The calibration process required defin-ing these material parameters such that the model performancematched that of the physical material tests.
119
Parameter Symbol Description
MID Material ID number
RO ρ Density
E E Young’s modulus
PR ν Poisson’s ratio
LCID Load curve ID for nominal stress versus strain
TSC Tensile stress cutoff
DAMP Rate sensitivity via damping coefficient
Table 11-2. Parameters for *MAT_063 or*MAT_CRUSHABLE_FOAM.

The constitutive model assumes a normal homogeneouscrushable foam material. In a typical foam, the compressibil-ity derives from the presence of voids within the cells of thefoam microstructure. However, the aggregate foam includesnot only these microstructure void spaces (in each aggregatepiece) but also larger voids between the aggregate pieces.
The approach taken for applying this material model wasto match the overall net behavior of the material. The loadcurve definition (LCID) was therefore defined per the con-fined cylinder test data, with an exponential shape. In testing,this shape was produced by the sum of the microstructurecompression and inter-particle void space compaction.Using this material model, the same summed behavior wasassumed.
11.4.3.2. Material Calibration Model
A confined cylinder calibration model (Figure 11-15) wasdeveloped to determine the best-fit properties for the consti-tutive model. The material parameters of the model wereoptimized using LS-OPT, an optimization software packagedeveloped by LSTC, the makers of LS-DYNA. LS-OPT ran thesimulations in batches iteratively. After each iteration, it nar-rowed the region of interest, effectively zooming in closer tothe predicted optimum calibration point. After 5 iterations of18 simulations each, the design was optimized for a best-fit setof material parameters.
Table 11-3 gives a summary of the calibration process,including the final accuracy of the calibrated model.
Attempts were made to calibrate the model to also match thehydrostatic triaxial specimens. These specimens were somewhatdifficult to model due to a nuance of the SPH formulation,which proved challenging to fit with a hydrostatic membraneload. Application of high confinement pressures led to instabil-ities due to the low initial slope of the material compressioncurve. Since the aggregate foam material exhibited minimalpressure dependence for the higher confinement pressures (Fig-ure 11-10), this was deemed a low-priority calibration point.
11.4.4. Tire and Arrestor Simulations
Using the calibrated aggregate foam material model previ-ously described (Section 11.4.3), a large-scale arrestor modelwas created in LS-DYNA to simulate overruns by aircrafttires. Figure 11-16 illustrates the model with a 36-in. depthand a B737-800 main-gear tire (Goodyear H44.5x16.5) at50% penetration depth.
No turf cover layer for the bed was included in the model.Several possible turf layer designs were feasible, each withdifferent thicknesses and material properties. It was assumedthat, while a turf layer would confine the top layer of aggre-gate foam to prevent spraying, it would optimally not affectthe mechanical response substantially. Because the sprayingbehavior was inherently mitigated by the continuum repre-sentation of the material, a discrete top layer was not neces-sary to determine the characteristic arrestor response.
As Figure 11-17 shows, the compressed material area extendedall the way to the bottom of the arrestor bed, which was in con-
120
Figure 11-15. confined cylinder model for aggregate foammaterial calibration.
Test to Replicate Error of Calibration
Confined Cylinder Compression Test
Description
• 12.375 x 9.5-in cylinder
• Match stress–strain load curve with RMSE to 75%compression
<2.0%
Table 11-3. Specifications for aggregate foam material calibration.

trast to the localized compression region for the solid foamblock candidate (Section 9.4.3). Waviness in the rut sidewallsand a longer compression region in front of the tire were alsomanifest. Figure 11-17 shows that under a static downwardload, the material exhibited a pyramid-shaped compression
zone. These behaviors are consistent with the anticipatedmechanical response of the aggregate foam material.
11.4.4.1. Arrestor Bed Models
The arrestor bed models were constructed using half-symmetry to reduce computation time. They varied in sizedepending on the aircraft tire being used. The bed length wasdetermined by the distance required for the tire to make acertain number of rotations, such that the loading settled toa steady-state condition. The bed width was determined bythe tire width, such that artificial boundary effects were min-imal and the response approximated that of a wide bed of thematerial. The smallest bed, used for the 18-in. nose tire of theCRJ-200, was 120 in. long and 9 in. wide. The largest bed,used for the 49-in. main tire of the B747-400, was 300 in. longand 36 in. wide.
All beds were constructed with a 36-in. depth. However,the effective depth of the bed was adjusted by use of a mov-able rigid plane (Figure 11-18). Only the upper part of thematerial, above the rigid plane, was involved in the overruncompression. This approach enabled various depths to berapidly configured within a single arrestor bed model.
121
Arrestor and TireModel Uses Half-
Symmetry
Small Pieces of Aggregate Foam Fragment Off of Bed
Material Compressed by Tire
Tire PenetratesVertically to a
Prescribed Depth
Deformable FiniteElement Aircraft
Tire Model
SPH Arrestor Bed
Figure 11-16. Model of combined tire and aggregate foam arrestor system.
Pyramid-Shaped Compression Zone
Figure 11-17. Compression zone under tire withoutforward motion.

SPH particle sizes were chosen based on the tire size. An errorestimation process was undertaken to determine the requiredparticle size to maintain an acceptably low discretization error.For the larger tires, a 2-in. particle size was found to have lessthan a 4% error for the predicted drag and vertical loads. Forsmaller tires, the particle size was reduced to 1 in. to maintainsimilar size proportionality. Based on the particle and bed sizevariations, a typical bed model had nominally 45K particles.
11.4.4.2. Tire Models
The tire models were fully deformable FEM, as discussedin Appendix F. Table 11-4 summarizes the tire models devel-oped. Each tire model was calibrated to match the actual tire’sload-deflection performance up to 80% of the maximumbottoming load. This 80% load became a limit criterion dur-ing the batch simulations.
The deformable nature of the tires produced an accuraterepresentation of the interface between the tire and the arrestormaterial. As the load on the tire increased due to deeper bedpenetration, the contact area became flatter with an increasedsurface area. This shape change created a correspondingincrease in the load on the tire.
11.4.4.3. Sequencing of Simulations
Because the tires in the LS-DYNA simulations were deform-able and were allowed to spin freely, a sequencing method was
required to create stable, fast-running simulations. These twofactors were additional complications that were not present inthe EDEM aggregate simulations. However, the inclusion ofthese factors led to higher-fidelity results.
From a mechanical standpoint, as the axle of the wheelpenetrated the bed vertically, both the tire and the arrestormaterial underwent compression. The interplay of the tireand arrestor compression created oscillations in the mea-sured loads. This oscillating behavior was further amplifiedby the free-spinning nature of the tire. Eventually the tirewould settle to a constant rate of rotation, which proved tobe a function of the forward speed, depth, and interfacefriction. It was found that a minimum forward travel dis-tance was required for the loads and rotation to reachsteady-state conditions before load measurements could be made.
Sequencing options included several factors:
• Prescribed vertical penetrations versus prescribed verticalloads;
• Applying the vertical penetration/load before or afterbeginning the forward motion; and
• Applying the forward motion before or after making con-tact with the bed
Depending on the sequencing method used to acceleratethe tire and set the penetration depth, the initial oscillationscould be more or less severe. This in turn could require longeror shorter simulation times, and longer or shorter arrestorbeds. Because the arrestor–tire models were to be run repeat-edly in large batches, it was important to develop a sequenc-ing methodology that would produce efficient simulationrun times.
Multiple methods were attempted through experimentationbefore settling on the approach illustrated by Figure 11-19. Thetire was first pressed downward into the material to a pre-scribed depth. Then the tire was accelerated to the desired for-ward speed and spun-up to an initial rotation speed (typicallyabout one-third of the ideal rotation rate expected on hardpavement). The prescribed spin rate was then released, allow-
122
36-inch Deep Bed
Rigid Plane at 18-inch Depth
Only Upper Part of MaterialInvolved in Compression
Figure 11-18. Adjustable height of aggregate foam arrestor bed.
Aircraft Landing Gear Tire Designation
Main Gear H29x9.0-15 CRJ-200
Nose Gear R18x4.4
Main Gear H44.5x16.5-21 B737-800
Nose Gear H27x7.7-15
Main Gear H49x19-22 B747-400
Nose Gear H49x19-22
Table 11-4. FEM tire library foraggregate foam arrestor models.
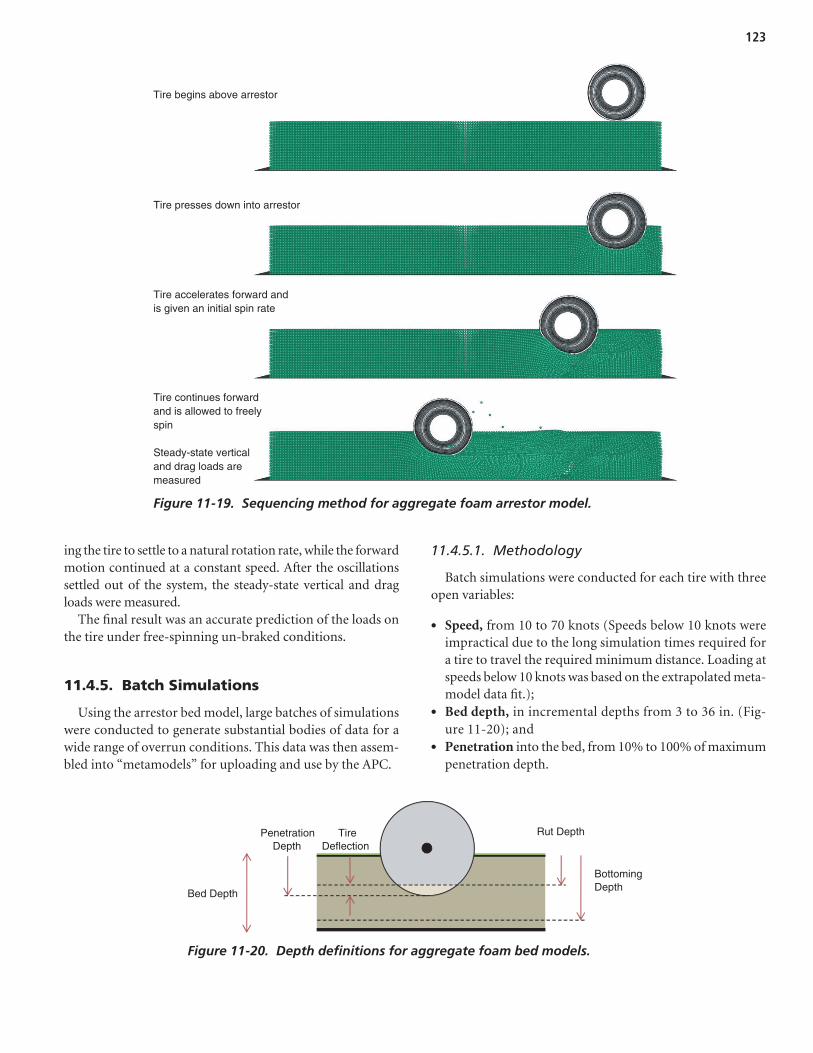
ing the tire to settle to a natural rotation rate, while the forwardmotion continued at a constant speed. After the oscillationssettled out of the system, the steady-state vertical and dragloads were measured.
The final result was an accurate prediction of the loads onthe tire under free-spinning un-braked conditions.
11.4.5. Batch Simulations
Using the arrestor bed model, large batches of simulationswere conducted to generate substantial bodies of data for awide range of overrun conditions. This data was then assem-bled into “metamodels” for uploading and use by the APC.
11.4.5.1. Methodology
Batch simulations were conducted for each tire with threeopen variables:
• Speed, from 10 to 70 knots (Speeds below 10 knots wereimpractical due to the long simulation times required fora tire to travel the required minimum distance. Loading atspeeds below 10 knots was based on the extrapolated meta-model data fit.);
• Bed depth, in incremental depths from 3 to 36 in. (Fig-ure 11-20); and
• Penetration into the bed, from 10% to 100% of maximumpenetration depth.
123
Tire presses down into arrestor
Tire accelerates forward and is given an initial spin rate
Tire continues forward and is allowed to freely spin
Steady-state vertical and drag loads are measured
Tire begins above arrestor
Figure 11-19. Sequencing method for aggregate foam arrestor model.
Bed Depth
Bottoming Depth
Rut DepthPenetration Depth
Tire Deflection
Figure 11-20. Depth definitions for aggregate foam bed models.

Due to the two sources of compression (arrestor materialand tire), the definition for penetration depth was more com-plex than for the rigid tire approach used for the aggregatearrestor models. Two conditions defined the maximum pen-etration depth:
1. The maximum penetration depth was considered to be85% of the bed depth (fully compressed material) plus thedeflection of the tire at 80% of the bottoming load. Beyondthis degree of penetration, the tire models were no longeraccurate.
2. For small tires in deep beds, the maximum penetrationwas further limited to be no greater than the tire diameter.At depths beyond this, the simulations often did not settleto steady-state conditions.
The large batch simulations were conducted using LS-OPT. Based on the initial model files, LS-OPT generatedpermutations with various speeds, bed depths, and penetra-tion levels. It sequentially executed the simulations andextracted the load data from them. Generally, the batcheswere conducted in multiple iterations of 10 simulationseach. Additional iterations were added to improve accuracyas needed.
11.4.5.2. Summary Tables of Metamodels
The output from the batch simulations was extracted andassembled automatically by LS-OPT, where metamodelswere constructed for the drag and vertical load forces. Meta-modeling is analogous to fitting a curve through experi-mental data, except it is applied to multi-dimensional datasets. These data sets were four-dimensional, including speed,depth, penetration, and load (either vertical or drag). The
metamodels were RBF networks, which can effectively capturenon-linear behaviors including multiple concavity changesacross the data set.
Table 11-5 summarizes the fit quality for the metamodels.The RMS error showed the highest variation among the threecandidates simulated, which was typically below 7%, but hadthree instances of higher values for the 29-in. and 18-in. tires.The R-squared value was typically above 0.97, but againdropped below 0.95 for the 18-in. tire. Typically, these prob-lems would be resolved by adding additional simulation points.In this case, however, the scatter in the data persisted evenwhen more simulations were conducted.
A closer examination of the batch simulation output revealsthat the cases most responsible for the scatter involve deeperarrestor beds. Because the material essentially has a depth-varying quality to it, with an exponentially shaped load curve,it tended to exhibit slip–stick behavior under the tire. Thematerial would compact into a clump until enough forcewas built up for a section to break free, forming a fissure. Twopotential solutions to this data scatter would have involved(1) longer rolling distances in the simulations with corre-spondingly increased run times, and (2) revisions to the con-stitutive model for the aggregate foam material. Project timeand budget constraints prohibited further pursuit of improve-ments, so the existing metamodels were used.
As the table shows, the points used in the metamodels wereoften less than the total number of simulations conducted.This discrepancy was caused by simulations that failed priorto termination due to tire overloading, or simulations thathad not adequately settled to steady-state conditions foraccurate load measurement. The smaller tires experienced agreater percentage of omitted runs than the larger tires due tothe relative loading severity and greater proportional pene-tration depths.
124
Tire SimulationsConducted
PointsUsed Response RMS Error R2
Drag 7.10% 0.995 H49 50 50
Vertical 5.96% 0.994
Drag 3.57% 0.999 H44 60 58
Vertical 3.05% 0.998
Drag 16.70% 0.971 H29 60 47
Vertical 7.70% 0.986
Drag 3.39% 0.998 R27 40 40
Vertical 3.78% 0.997
Drag 23.80% 0.948 H18 80 73
Vertical 21.40% 0.943
Table 11-5. Metamodel accuracy summary for aggregate foamarrestor bed.

11.4.5.3. Parameter Sensitivities
Using the metamodels, it is possible to review how sensi-tive the landing gear loads are to the different variables ofspeed, bed depth, and penetration percentage. Figure 11-21shows a surface plot for the 44.5-in. main-gear tire of theB737 in an 18-in. deep aggregate foam arrestor bed.
Stronger drag loads (shown as the lower, more negative val-ues) occur when the penetration ratio increases, up to the max-imum of 1.0 (or 100%). The loading is, therefore, stronglydependent on the depth of penetration into the bed, as wouldbe expected. However, unlike with crushable block foam, theincrease is non-linear, as shown by the downward concavity ofthe surface.
By contrast, the variation with speed shows very little changebetween 10 and 70 knots. The loading is fairly insensitive tospeed, reflecting the low rate-sensitivity that would be expectedfrom crushable glass foam. Practically speaking, this meansthat the aggregate foam system will exert nearly the same decel-eration load on an aircraft travelling at high or low speed. Thisbehavior is desirable for an arrestor and is consistent with thegeneral behavior of the current cellular cement material.
While overall rate insensitivity is expected for a glass foammaterial, the aggregate foam glass presents an additional layerof complexity. The inter-particle void compaction may not
be a rate-independent process, and that could affect the over-all rate sensitivity of the medium. This trait requires confir-mation through larger-scale testing.
11.4.5.4. Data Transformation
The final metamodel data for each tire was converted foruse by the APC. LS-OPT was used to extract nominally 9,000data points from each metamodel and export it into tabularform. A MATLAB conversion program was written to mapthis data into multi-dimensional matrix form that could bequickly accessed by the APC.
11.5. Arrestor PerformancePredictions
11.5.1. Scope of Simulations
Using the APC, a separate optimal arrestor was designedfor each of the three trial aircraft: CRJ-200, B737-800, andB747-400. Subsequently, an optimal mixed-fleet arrestor wasdesigned as a compromise best-fit for all three aircraft.
All arrestment predictions assumed the following:
• 50-ft setback distance;• 50-ft gradual decline to the maximum bed depth;
125
Dra
g F
orc
e (l
bf)
Speed (knots) PenetrationRatio
Figure 11-21. Metamodel drag load surface plot for 44.5-in. tire in an 18-in.deep aggregate foam bed.
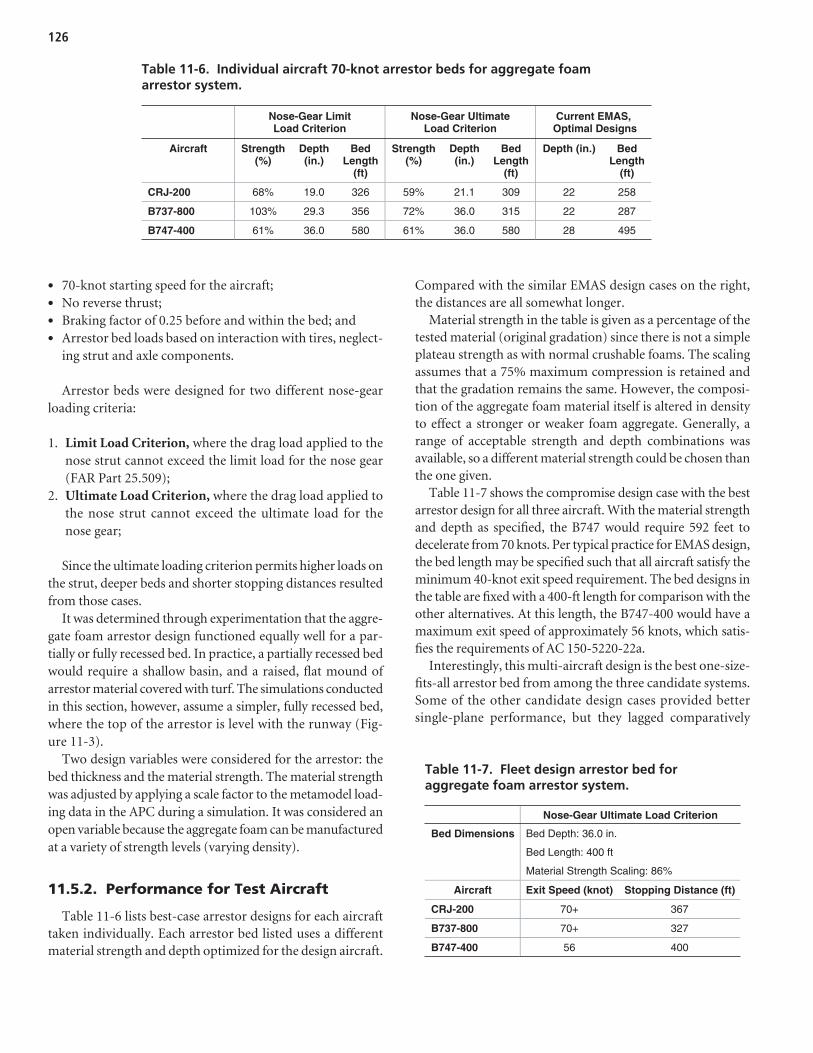
• 70-knot starting speed for the aircraft;• No reverse thrust;• Braking factor of 0.25 before and within the bed; and• Arrestor bed loads based on interaction with tires, neglect-
ing strut and axle components.
Arrestor beds were designed for two different nose-gearloading criteria:
1. Limit Load Criterion, where the drag load applied to thenose strut cannot exceed the limit load for the nose gear(FAR Part 25.509);
2. Ultimate Load Criterion, where the drag load applied tothe nose strut cannot exceed the ultimate load for thenose gear;
Since the ultimate loading criterion permits higher loads onthe strut, deeper beds and shorter stopping distances resultedfrom those cases.
It was determined through experimentation that the aggre-gate foam arrestor design functioned equally well for a par-tially or fully recessed bed. In practice, a partially recessed bedwould require a shallow basin, and a raised, flat mound ofarrestor material covered with turf. The simulations conductedin this section, however, assume a simpler, fully recessed bed,where the top of the arrestor is level with the runway (Fig-ure 11-3).
Two design variables were considered for the arrestor: thebed thickness and the material strength. The material strengthwas adjusted by applying a scale factor to the metamodel load-ing data in the APC during a simulation. It was considered anopen variable because the aggregate foam can be manufacturedat a variety of strength levels (varying density).
11.5.2. Performance for Test Aircraft
Table 11-6 lists best-case arrestor designs for each aircrafttaken individually. Each arrestor bed listed uses a differentmaterial strength and depth optimized for the design aircraft.
Compared with the similar EMAS design cases on the right,the distances are all somewhat longer.
Material strength in the table is given as a percentage of thetested material (original gradation) since there is not a simpleplateau strength as with normal crushable foams. The scalingassumes that a 75% maximum compression is retained andthat the gradation remains the same. However, the composi-tion of the aggregate foam material itself is altered in densityto effect a stronger or weaker foam aggregate. Generally, arange of acceptable strength and depth combinations wasavailable, so a different material strength could be chosen thanthe one given.
Table 11-7 shows the compromise design case with the bestarrestor design for all three aircraft. With the material strengthand depth as specified, the B747 would require 592 feet todecelerate from 70 knots. Per typical practice for EMAS design,the bed length may be specified such that all aircraft satisfy theminimum 40-knot exit speed requirement. The bed designs inthe table are fixed with a 400-ft length for comparison with theother alternatives. At this length, the B747-400 would have amaximum exit speed of approximately 56 knots, which satis-fies the requirements of AC 150-5220-22a.
Interestingly, this multi-aircraft design is the best one-size-fits-all arrestor bed from among the three candidate systems.Some of the other candidate design cases provided bettersingle-plane performance, but they lagged comparatively
126
Nose-Gear Limit Load Criterion
Nose-Gear Ultimate Load Criterion
Current EMAS, Optimal Designs
Aircraft Strength (%)
Depth (in.)
BedLength
(ft)
Strength(%)
Depth (in.)
BedLength
(ft)
Depth (in.) Bed Length
(ft)
CRJ-200 68% 19.0 326 59% 21.1 309 22 258
B737-800 103% 29.3 356 72% 36.0 315 22 287
B747-400 61% 36.0 580 61% 36.0 580 28 495
Table 11-6. Individual aircraft 70-knot arrestor beds for aggregate foamarrestor system.
Nose-Gear Ultimate Load Criterion
Bed Dimensions Bed Depth: 36.0 in.
Bed Length: 400 ft
Material Strength Scaling: 86%
Aircraft Exit Speed (knot) Stopping Distance (ft)
CRJ-200 70+ 367
B737-800 70+ 327
B747-400 56 400
Table 11-7. Fleet design arrestor bed foraggregate foam arrestor system.

with respect to the multi-plane case. The reason for the supe-rior performance appears to be the depth-varying nature ofthe material. Deeper beds were feasible for the aggregatefoam, which performed better in arresting the B747, with itslarge-diameter tires. Yet, because of the depth-varying prop-erties, the smaller aircraft each found their own equilibriumrut depths without being overloaded. The equilibrium deptheffect is further discussed in Section 11.5.3.2.
11.5.3. General Observations
11.5.3.1. Deceleration and Nose-Gear Loading
The overall deceleration and loading trends on the three air-craft showed several common characteristics. Figure 11-22 andFigure 11-23 illustrate sample deceleration and nose-gear loadplots generated by the APC for the B737 aircraft. Figure 11-22represents the arrestor bed using the limit load design criterion,while Figure 11-23 is based on the ultimate load criterion. Theoverall bed lengths and depths reflect the values of Table 11-6.
The upper plot in each figure shows the aircraft speeddecrease relative to the nose wheel location in the arrestorbed. The lower surface line of the arrestor is depressed by thebed thickness, as discussed in Section 11.5.1.
The middle plot in each figure shows the deceleration of theaircraft in g’s. The deceleration first increases when the nosewheel penetrates the bed at zero feet, while the main-gear tiresare still on pavement. The deceleration then increases stronglywhen the main-gear tires enter the arrestor, at a nose-wheellocation of 50 to 100 ft. After the initial transition, the deceler-ation oscillates in both cases, at about 0.65 g for the limit designand about 0.8 g for the ultimate design. The oscillations aresubstantially more severe in the ultimate design case due tothe combined effects of the deeper bed and the depth-varyingmaterial properties. Among the three arrestor candidates, thisoscillatory tendency is unique to the foam aggregate concept.The reason for the oscillations becomes clearer when analyzingthe wheel rut characteristics in the next section.
The lower plot in each figure shows the nose-wheel dragloading, which proved to be the limiting load for the arrestorbed design. The loading is highest between 100 and 120 ft,which is after the main-gear tires have entered the bed. Whenthe main-gear tires enter, the deceleration increases sub-stantially, and this causes the aircraft to pitch forward andpresses the nose wheel deeper into the material. The deeperpenetrations lead to higher drag loads on the nose wheel.
11.5.3.2. Rut Depth Effects
Figure 11-24 gives the corresponding main and nose-wheelrut depths for the limit case of Figure 11-22. As shown by thelower dashed line in each figure, the rut is only about 10 to
12 in. deep in the material. For a normal crushable blockfoam system, the rut would tend to cut near the bottom of thebed at the bottoming compression depth of the material. Inthis case, however, the depth-varying properties of the foamaggregate (exponential curve of Figure 11-7) allow the tires tofind their own natural equilibrium depth in the material,which is at a much shallower penetration. The tires are, in asense, floating atop a layer of partially compacted material.Because the material has not been fully compressed, oscilla-tions can result as the tire bounces above and below the equi-librium rut depth.
Because of the rut depth effect, large oscillations wereobserved in a number of design cases attempted. New designpractices were required to stabilize the ruts. In general, twomain principles emerged:
1. Oscillations are more likely for beds that are deep relativeto the tire diameter, and
2. Oscillations are more likely where the decline distance isnot substantially longer than the wheel base of the aircraft(discussed further in the next section).
The B747 was not observed to form any lasting oscillationsin any design case. Any bouncing quickly settled to a steady-state condition. It was determined that this was because alltires on the B747 are 49-in. diameter, which is substantiallylarger than the maximum 36-in. bed depth.
11.5.3.3. Decline Distance Effects
The decline distance is the length of the depth-taperingregion of the arrestor bed. For the two other candidate sys-tems, a 50-ft decline distance was sufficient to produce stablearrestors. However, it was found that a 100-ft decline wasconsiderably more stable for the aggregate foam concept dueto its relative size with respect to the aircraft wheelbase.
A shorter 50-ft decline produced sometimes drastic oscil-lations, as shown in Figure 11-25 and Figure 11-26. Thisdesign case for the B737 is identical to that of Figure 11-22except for the decline distance, which was 100 ft. The causeof the oscillations appears to be the initial pitch rate causedby the sudden drop of the nose wheel, which set up a “por-poising” behavior in the aircraft. Since the rut bottom wasfloating, rather than bottomed, the motion damped outslowly.
11.5.4. Braking Effects
In the APC simulations, braking loads for the main-geartires while in the arrestor bed were added to the drag loads ofthe tire–arrestor metamodel. Thus, the net drag load on themain-gear tires was due to the braking plus the arrestor
127

128
-40
-20
0
20
40
60
80
Sp
eed
[kn
ot]
an
d D
epth
[in
.]
Aircraft Velocity and Bed Profile
Aircraft Speed
Upper Surface of Arrestor
Lower Surface of Arrestor
-50 0 50 100 150 200 300250 350 4000.2
0.3
0.4
0.5
0.6
0.7
0.9
0.8
Nose-Wheel Location [ft]
-50 0 50 100 150 200 300250 350 400
Nose-Wheel Location [ft]
-50 0 50 100 150 200 300250 350 400
Location [ft]
Dec
eler
atio
n [
g]
Aircraft Deceleration
Aircraft Deceleration
0
5
10
15
20
25
30
35
40
Fo
rce
(kip
)
Landing Gear Forces - NOSE STRUT
Nose Gear Drag
Nose Gear Limit Load
Nose Gear Ultimate Load
Figure 11-22. Limit criterion aggregate foam arrestor designplots for B737-800 showing speed (top), deceleration (middle)and nose-gear drag load (bottom).

129
-40
-20
0
20
40
60
80
Sp
eed
[kn
ot]
an
d D
epth
[in
.]
Aircraft Velocity and Bed Profile
Aircraft Speed
Upper Surface of Arrestor
Lower Surface of Arrestor
-50 0 50 100 150 200 300250 3500.2
0.3
0.4
0.5
0.6
0.7
1
0.9
0.8
Nose-Wheel Location [ft]
-50 0 50 100 150 200 300250 350
Nose-Wheel Location [ft]
-50 0 50 100 150 200 300250 350
Location [ft]
Dec
eler
atio
n [
g]
Aircraft Deceleration
Aircraft Deceleration
0
5
10
15
20
25
30
35
40
Fo
rce
(kip
)
Landing Gear Forces - NOSE STRUT
Nose Gear Drag
Nose Gear Limit Load
Nose Gear Ultimate Load
Figure 11-23. Ultimate criterion aggregate foam arrestordesign plots for B737-800 showing speed (top), deceleration(middle) and nose-gear drag load (bottom).

resistance. As an approximate solution, this approach workedwell and was appropriate.
However, a small side study conducted during the metamod-eling process indicated that braking applied to the main-geartires could cause the penetration depth to increase. Since thearrestor metamodel loads assumed a non-braked free-spinningwheel, this depth change was not captured in the predictions.
For a bottomed tire, little depth change is feasible and thiseffect would likely not occur. For a non-bottomed tire, how-ever, the tendency to penetrate deeper would lead to higherarrestor drag loads on the tire. Since this effect would onlyapply to the braked wheels of the main gear, it would benefitthe deceleration process while not affecting the nose gear.Stopping distances could be somewhat reduced by this effect,though it is unclear by what amount or in what limited sub-set of arrestor design cases.
Additionally, the sudden application of, or increase in, air-craft braking could induce a porpoising behavior similar to theshort decline distance effects of Section 11.5.3.3. This brake-induced oscillatory behavior could be studied using the APC,but such an investigation fell outside the scope of the currenteffort. In actual practice, it seems doubtful that pilots in over-run situations would release and re-apply the brakes of the air-craft. It may prove most useful to characterize the torsionalforces associated with a fully applied brake and assume thoseloads throughout the simulations.
11.5.5. Short Landings
Short landings involving an aircraft touch down inside thearrestor bed were not simulated. However, the potential forshort landings presents two possible issues.
130
-150 -100 -50 0 50 100 150 200 250 300 350
Location [ft]
Location [ft]
Dis
pla
cem
ent
[in
.]
Vertical Displacements - MAIN STRUT
Axle Displacement
Rut Depth
Lower Bound of Bed
Upper Bound of Bed
-50 0 50 100 150 200 250 300 350 400-30
-20
-10
0
10
20
Dis
pla
cem
ent
[in
.]
-30
-20
-10
0
10
20
Vertical Displacements - NOSE STRUT
Axle Displacement
Rut Depth
Lower Bound of Bed
Upper Bound of Bed
Figure 11-24. Limit criterion aggregate foam arrestor design plotsfor B737-800 showing axle and rut depth for the main strut (top)and nose strut (bottom).

131
Aircraft Speed
Upper Surface of Arrestor
Lower Surface of Arrestor
Aircraft Deceleration
Nose Gear Drag
Nose Gear Limit Load
Nose Gear Ultimate Load
-40
-20
0
20
40
60
80
Sp
eed
[kn
ot]
an
d D
epth
[in
.]
Aircraft Velocity and Bed Profile
-50 0 50 100 150 200 300250 350
1.2
0.2
0.4
0.6
0.8
1
Nose-Wheel Location [ft]
-50 0 50 100 150 200 300250 350
Nose-Wheel Location [ft]
-50 0 50 100 150 200 300250 350
Location [ft]
Dec
eler
atio
n [
g]
Aircraft Deceleration
0
5
10
15
20
25
30
35
40
Fo
rce
(kip
)
Landing Gear Forces - NOSE STRUT
Figure 11-25. Limit criterion aggregate foam arrestor—50-ftramp—design plots for B737-800 showing speed (top),deceleration (middle) and nose-gear drag load (bottom).

132
0
20
40
60
80
100
Fo
rce
(kip
)
Landing Gear Forces - MAIN STRUT
Main Gear Drag
Main Gear Limit Load
Main Gear Ultimate Load
-150 -100 -50 0 50 100 150 200 250 300
Location [ft]
-150 -100 -50 0 50 100 150 200 250 300
Location [ft]
Vertical Displacements - MAIN STRUT
Axle Displacement
Rut Depth
Lower Bound of Bed
Upper Bound of Bed
Dis
pla
cem
ent
[in
.]
-30
-20
-10
0
10
20
Figure 11-26. Limit criterion aggregate foam arrestor—50-ft ramp—design plots for B737-800 showing main-gear strut loading (top) and main strut axle and rut depth (bottom).
First, the aggregate foam arrestor exhibits a depth-varyingstrength property that is advantageous for arresting variedaircraft fleets. However, during a landing in an arrestor, theinitial downward loads would be high, and this could cause adeep penetration and a corresponding drag-force overload tothe landing gear.
Second, the basin geometry of the arrestor concept wouldforce the aircraft to roll up the decline slope in the reversedirection from normal, acting as a ramp that would cause astrong load to the landing gear. This issue could be eliminatedby only partially recessing the bed, as in the ideal EMASdesign cases. Mechanical performance was found to be nearlyequivalent with either version. However, the turf covering ofthe arrestor would be above grade in such cases, presentingsome construction and aesthetic complications.
11.6. Estimated System Cost and Upkeep
11.6.1. Installation Process
The loose aggregate solution offers the advantage of construct-in-place simplicity, which could produce instal-lation cost savings over a traditional EMAS. It reduces sitepreparation and eliminates block manufacturing, placement,and joint sealing. However, turf preparation and placementwould be additional tasks not required for the current EMAS.
The foam aggregate concept would require excavation ofan arrestor bed basin with a depth nominally equivalent tothat of an EMAS bed. This basin may or may not requirepaving before being filled with foam aggregate. However, thebelow-grade nature of the basin would require drainage from

the bed to be included in the design using standard roadwayengineering practices.
The basin would be filled with foam aggregate using earth-moving equipment. Due to the crushability of the material andthe importance of maintaining the original gradation and den-sity (Section 11.3.2), the foam aggregate would require careduring installation. Bulldozers, or an equivalent, would reversefill the bed starting from the distal end and working backwards,such that they did not overrun previously deposited material.Only vehicles with low ground pressure would be permissibleon top of the bed material, such that the material was not com-pacted beyond design specifications. If a roller was to be usedfor creating a level surface on top of the bed before applyingthe turf cover layer, a prescribed degree of compaction wouldneed to be pre-defined (Figure 11-27). However, grading thebed could require a fairly manual process to obtain the desiredresults.
Depending on the design of the reinforced turf layer, itcould be grown in place, or it could be grown in advance, thencut into segments and placed atop the bed. The latter alterna-tive would require the use of a front-end loader equipped toprovide low ground pressure.
Once completed, the bed would permit normal trafficfrom grounds keeping vehicles and pedestrians. Vehicles withhigh tire pressures, such as emergency vehicles and aircraft,would be restricted from driving on top of the bed.
11.6.2. Cost to Establish System
A preliminary estimate was made for the cost to establishan aggregate foam arrestor system. It must be noted that thecost estimate from this section is only a basic approximationfor the purposes of comparing the different arrestor alterna-tives. The cost estimate is based on a mixture of informationfrom the manufacturer, the airport survey, and FAA Order5200.9. To develop a more accurate estimate of the costs to
install such a system, it is recommended that a detailed costquote be sought from a firm qualified to undertake an instal-lation effort. Where possible, the methodologies used wereconsistent with the prior survey information collected regard-ing the existing EMAS (Section 3.5).
The costs may be broken into two major categories: sitepreparation and installation. The site preparation costs wereestimated for two cases. The aggregate foam arrestor woulduse a basin for the arresting materials rather than a flatrunway-type surface as is used for the current EMAS design.The bottom of the basin could either be paved or earthen.Drainage, excavation, and leveling would be required foreither option. Assuming that a full paved surface is not pro-vided under the bed, the cost for site preparation wasassumed to be reduced by half; this value was used for thelower-bound cost estimate for the system. If a full paved sur-face is provided, then the preparatory costs were assumed tobe the same as for the current EMAS; this provided the upper-bound cost estimate.
The installation cost estimate was separated into specificmaterials and general installation labor needs. Because thesecosts were specific to the aggregate foam arrestor concept, theydo not have a direct connection to any prior EMAS data.Discussions with the manufacturer produced cost estimates forthe aggregate foam, reinforced turf cover layer, and geo-textile/geo-plastic layers. Where applicable, materials included freightcosts for trans-Atlantic shipping. The labor costs were based onestimates from the manufacturer established from similarinstallation efforts.
Finally, the site preparation and estimated EMAS costswere computed in two ways: (1) assuming average surveycosts from this research, and (2) assuming FAA Order 5200.9costs. The final cost estimates for both options are given inTable 11-8 and Table 11-9, respectively.
Using the survey cost assumptions of Table 11-8, a 300-ftarrestor bed would cost between 47% and 60% less than thecurrent EMAS. If the Order 5200.9 costs are assumed, the costadvantage drops to between 37% and 44% (Table 11-9).
133
Figure 11-27. Roller compaction of aggregate foammaterial during typical installation (43).
Aggregate Foam System
Cost Category
Lower Bound
UpperBound
Current EMAS
Site Preparation $ 1.08 $ 2.17 $ 2.17
Installation $ 2.16 $ 2.16 $ 6.03
Cost to Establish $ 3.24 $ 4.32 $ 8.19
Percent of EMAS 40% 53%
Table 11-8. Estimated costs to establishaggregate foam arrestor, 150 x 300 ft, assuming survey average costs for currentEMAS, units of millions USD.

In addition to the tables in this section, longer-term life-cycle issues could also be considered. FAA Order 5200.9includes a standard 10-year replacement interval for anEMAS, which translates into present-value life-cycle costs.Such a replacement could arguably be unnecessary for thisarrestor concept (Section 11.6.4). Eliminating the assumed10-year replacement could effectively trim about $2.6M ofpresent-value life-cycle costs (based on the EMAS replace-ment cost estimates of the survey).
11.6.3. Maintenance
Maintenance for the aggregate foam concept would be rel-atively simple, and should be limited to standard grounds-keeping measures for the protective turf layer. Drainage ofthe area to prevent standing water is required, and periodicinspections would be advisable to ensure that no issues arisedue to seasonal weather changes. Due to the lack of joints andblocks, many protective measures used in current EMAS con-struction would not be necessary.
The aggregate foam material is expected to have a superiordurability when compared with cellular cement. Aggregatefoam does not exhibit the tendency to crumble during han-dling as occurs with cellular cement, nor does it exhibit overtsensitivity to moisture due to its closed cell microstructure.Many industrial applications of glass foam materials indicatelong service life is possible with little degradation, as long asmild protective measures are taken.
However, the aggregate foam carries some maintenanceissues not present for solid foam block material. The looseaggregate could settle over time, or the aggregate pieces couldeventually break down into smaller pieces, changing thegradation of the material. These are both issues to addressthrough inspections. Plate-shaped dimensional markerscould be inserted below the turf layer and checked periodi-cally using surveying equipment for changes in height, andaggregate samples could be tested periodically (discussed fur-ther in the next section).
11.6.4. Replacement and Overhaul
FAA Order 5200.9 plans a full replacement for an EMASafter 10 years. Following this schedule for replacement maybe required for the drainage version of the concept, but thiswould probably not be required for the sealed watertightbed. Given the minimal cost increase, adding the watertightmembrane around the foam aggregate would likely affordconsiderable long-term savings. Eliminating the 10-yearreplacement could effectively trim about $3.5M of present-value life-cycle costs, based on the replacement cost esti-mates of the survey.
Rather than a scheduled replacement, periodic bed materialsampling could be undertaken, perhaps in 3- to 5-year inter-vals. Small areas of the cover layer could be removed, and asample of the aggregate foam could be extracted and tested.The removal area would then require refilling and repair ofthe top layer. These periodic small-scale tests would provideassurance that the bed has not degraded and still meets per-formance specifications.
11.6.5. Repair
After an overrun event, the rut areas would require repair.The foam aggregate remaining in the ruts would requireremoval and replacement. The damaged cover layer would alsorequire removal from the rut areas and subsequent replace-ment. Geo-textile and geo-plastic layers would also requirerepair and fusing with the existing material to ensure contin-ued waterproofing, as applicable.
11.7. Transition to a Fielded System
In order to transition the aggregate foam concept to afielded system, the following additional development stepsmay be advisable.
11.7.1. Material Density and Compaction Calibration
As shown in the example arrestor beds of Table 11-6 andTable 11-7, the compressive strengths for optimal designsranged from 59% to 103% of the tested material. To estimatethe needed strength in the arrestment predictions, the meta-model data was simply scaled, which was an appropriatesimplification.
However, in migrating to a fielded system, several standarddensities and gradations would probably be selected to pro-vide flexibility during the design of actual arrestors. For eachdensity and gradation, some testing would be required togenerate calibration data.
134
Table 11-9. Estimated costs to establishaggregate foam arrestor, 150 x 300 ft,assuming Order 5200.9 costs for currentEMAS, units of millions USD.
Aggregate Foam System
Cost Category
Lower Bound
UpperBound
Current EMAS
Site Preparation $ 0.34 $ 0.68 $ 0.68
Installation $ 2.16 $ 2.16 $ 3.83
Cost to Establish $ 2.50 $ 2.84 $ 4.50
Percent of EMAS 56% 63%
The installation process will likely affect the performanceproperties of the material because compaction by construc-tion equipment and foot traffic will take place. Since thisprocess is inevitable, it would be advisable to create severallarger-scale testbeds using the anticipated installation processand equipment. Tests could then be conducted on these smallbeds using larger test apparatuses than those of the currentresearch. From the results, a revised material model could becalibrated, and the arresting performance reassessed. In thismanner, a calibrated prediction capability would exist for theas-installed material. Thereafter, installation of actual arrestorbeds could proceed per the developed methodology with highconfidence of the final system performance.
Such tests could be conducted in conjunction with thecover layer design (next section).
11.7.2. Cover Layer Design
The cover layer options that have been discussed includereinforced turf with or without additional geo-textile/geo-plastic layers. Additional testing and modeling wouldbe required for whichever method is selected since themembrane behavior of a cover layer will affect the dynamicmechanical performance of the arrestor bed. The coverlayer performance should be further characterized underfrozen conditions since it will be exposed to such condi-tions even where the foam aggregate layer of the system iswaterproofed.
11.7.3. Braking Dynamics
The research performed has identified that braking in theaggregate foam material may require further study. Of thethree major concepts evaluated, braking dynamics appearlikely to affect the aggregate foam concept the most. Becausethe depth-varying properties of the material have demon-strated tire “flotation” at mid-depth bed penetrations, thereis room for potential depth shifts of the tires due to braking.If they occurred, such shifts could lead to excessive landinggear loads.
The current modeling method of the APC makes simplify-ing assumptions regarding this phenomenon that are suffi-cient for a concept-level evaluation. However, to ensureaccuracy of design predictions, some additional tests wouldbe beneficial. One method would involve using a one-wheelbogy apparatus fitted with brakes and a load measurementsystem that is towed through the material.
11.7.4. Full-Scale Testing
A full-scale aircraft overrun test of a foam aggregatearrestor bed is advisable because this concept represents a
substantial departure from the current EMAS design in termsof mechanical loading and the materials used.
11.8. Summary
The aggregate foam arrestor concept was found to have amechanical response similar to a crushable foam material,except with depth-varying properties. It would absorb energyfrom the aircraft primarily though material compaction ratherthan through displacement. An aggregate foam arresting bedwould be constructed using a shallow basin of the materialtopped with a reinforced turf cover layer.
The material is closed-cell glass foam that provides inher-ent moisture and chemical resistance, and improved handlingdurability as compared with cellular cement. Manufacturerinformation indicates that long service life is possible, poten-tially eliminating the standard 10-year replacement assumedin FAA Order 5200.9. Water immersion must still be avoided,so the preferred design approach would use a sealed plasticgeo-membrane envelope coupled with standard drainageprovisions.
Installation of the system would likely be simpler and lessexpensive than the current EMAS since placement of blocksand sealing joints are both unnecessary. Heavy equipmentwould place the material in the bed basin and top it withreinforced turf. Geo-membrane and geo-textile layers, asapplicable, would be placed and joined manually. The arrestorbasin could be constructed with or without paving, whichcould provide for preparatory cost reduction. In order to pre-serve material gradation and prevent over-compaction dur-ing installation, an appropriate installation process would berequired.
The cost to establish such a system would be nominally40% to 53% of the survey cost of the existing EMAS, whichprovides the most substantial estimated cost reduction of thecandidates evaluated; much of the cost reduction is due to themarkedly less expensive aggregate foam material. Life-cyclecosts could be further reduced due to longer bed life. Main-tenance needs appear to be simplified, requiring standardgrounds-keeping measures, but no block or joint repairs.
The APC predictions for the aggregate foam arrestor showfairly constant deceleration throughout the arrestment withlittle speed dependence, which are desirable characteristics.The depth-varying material characteristic produced a unique“floating” rut depth that was not observed for the other mat-erials evaluated. This characteristic allowed each tire to settleto its own natural depth in the material, creating more evenload distribution among tires of different sizes.
Bed lengths on a per-plane basis were nominally 15% longerthan for the current EMAS. However, the multi-aircraftdesign case demonstrated the best one-size-fits-all perfor-mance from among the three candidate systems. A 400-ft
135

arrestor bed demonstrated 70+ knot exit speeds for the B737-400 and CRJ-200 and a 56-knot exit speed for the B747. Thereason for the superior performance appears to be the depth-varying nature of the material.
The floating rut characteristic also gave rise to oscillatingtendencies in which the plane could exhibit porpoising behav-ior. This was mitigated through appropriate bed geometrydesign. However, additional investigation would be requiredto establish the effects during short landings and in caseswhere the pilot applies intermittent braking.
Transition to a fielded system would require finalizing acomposite turf cover-layer design and calibrating a predic-
tive model to match the response. Characterization wouldbe advisable for the soil layer under various freezing condi-tions to assess the impact on arresting dynamics. Additionally,investigation should be made regarding the basin geometry todetermine whether above- or below-grade construction ispreferable. Because the material performance can be affectedby size gradation and compaction, development of a suit-able installation process would be required. This installa-tion process would be coupled with a predictive modelmatching the as-installed material characteristics. Finally,full-scale testing is advisable for evaluation of the completesystem.
136

137
As a companion effort to the ACRP research, additionalgraduate-level research was undertaken to explore a depth-varying foam material concept. A summary of that researchis given in this chapter. For an in-depth examination, theoriginal research document should be consulted (33).
The goal of the study was different from that of the fullsystem concept evaluations in Chapters 9 through 11. Theevaluation of the depth-varying concept did not includefull aircraft arrestment simulations. Instead, it was con-fined to a narrower study of the effects of the material ontwo different tires: the main-gear tires of the CRJ-200 andthe B737-800. While the likely arresting performance canbe inferred based on the results, APC simulations were notconducted.
12.1. Depth-Varying Foam Concept
By its nature, an arrestor bed installed at an airport is a sin-gle, static system. It must arrest any and all aircraft that couldoverrun the runway end, from large B747s down to smallregional jets. Problematically, these aircraft differ in ways thathave a significant effect on arresting efficiency; the arrestorslows some aircraft more quickly than others.
To improve the one-size-fits-all performance of an arrestorbed, a depth-varying foam arrestor material was investigated.The cellular cement used in existing EMAS arrestors is homo-geneous, having the same density and strength throughouteach block of material. Changing the density and strength tobecome harder at deeper levels could potentially achieve adegree of performance leveling between large and small air-craft (Figure 12-1).
This concept was evaluated using an idealized foammaterial model rather than a particular type of crushablefoam (cement, polymer, glass, etc.). Many crushable foamoptions exist, and depth-varying layups for many could beachieved.
12.2. Depth-Varying Profiles Considered
Multiple depth profiles for the material were possible. Fig-ure 12-2 illustrates three simple profile types that were con-sidered, as well as a depth-invariant material, which representsthe current homogeneous arrestors. The curves have beennormalized to compare overall trends.
Viewing the profiles shows that the linear and quadraticcases sit astride the exponential function, given the same start-ing and ending points. As such, the exponential case did notseem to offer novel content, and the evaluation was narrowedto include three profiles:
1. Constant (baseline),2. Linear profile, and3. Quadratic profile.
12.3. Modeling Approach
The modeling approach for the depth-varying material eval-uation was essentially the same as for the glass foam material(Section 9.4). Only points of contrast in the methods will bediscussed in this section.
12.3.1. Calibration of Material Model
Material calibration was not undertaken because the eval-uation involved idealized materials. All three material optionsassumed zero Poisson ratios, which is consistent with typicalcrushable foam behaviors. Figure 12-3 illustrates the idealizedcompression load curve for the material model.
12.3.2. Tire and Arrestor Simulations
As with the glass foam material evaluation, the arrestormodels were constructed in LS-DYNA using the deformableFEM tire models and SPH arrestor beds (Figure 12-4).
C H A P T E R 1 2
Depth-Varying Foam Material

A large-scale arrestor model was created in LS-DYNA tosimulate overruns by aircraft tires. No protective cover layerfor the bed was included in the model, and it assumed a con-tinuous material without seams.
12.3.2.1. Arrestor Bed Models
The arrestor bed models were constructed using half-symmetry to reduce computation time. They varied in sizedepending on the aircraft tire being used. The bed length wasdetermined by the distance required for the tire to make acertain number of rotations such that the loading settled to asteady-state condition. The bed width was determined by thetire width such that artificial boundary effects were minimaland the response approximated that of a wide bed of thematerial. The beds were 36 in. wide, 300 in. long, and 30 in.deep. However, the effective depth of the bed was adjusted byuse of a movable rigid plane.
For the 44.5-in. tire, the SPH particles were sized at 2 in.,but the smaller 29-in. tire used a bed with 1.5-in. particles tomaintain a low discretization error.
The depth-varying arrestor bed featured a division of theSPH material into several parts, forming stratified layers.
Each part/layer had its own material definition based on itsdepth. Experiments showed that each layer required at leasttwo rows of SPH particles in order to initialize properly. The30-in. deep arrestor, with 2-in. particles, had eight separatelayers (Figure 12-5).
12.3.2.2. Tire Models
The tire models were fully deformable FEM, as discussedin Appendix F. However, for this limited study, only themain-gear tires for the B737 and CRJ-200 were used. The goalwas to observe the behavioral trends, from which likelyarresting performance was inferred. Table 12-1 summarizesthe tires that were used in the evaluation.
12.3.2.3. Sequencing of Simulations
The sequencing method for this evaluation differed fromthat of the foam glass evaluation. Because a full metamodel ofthe design space was not required, the simulations were con-ducted using a constant vertical load rather than a prescribedvertical penetration depth. The load for each tire was chosenas the static vertical load when the aircraft was decelerating at10 ft/s2. Because the load was prescribed, the tire penetratedto a steady-state depth that varied depending on the arrestorbed material properties.
After experimenting with several methods, the sequenceillustrated by Figure 12-6 proved superior on the basis of pro-viding the most consistent results with the shortest settlingtime. The settling time refers to the second time stage, lead-ing up to the steady-state rolling behavior when the loadmeasurements on the tire are recorded.
Motion damping became one of the main problems withthe combined model, tending to control how long the simu-lation had to run before the model approached steady-state.Two types of motion required damping: (1) oscillations in the
138
MaterialBecomes
Harder
Figure 12-1. Depth-varying material concept.
Figure 12-2. Depth-varying profiles considered.
Compression Stress (σ)
CompressionStrain (ε)
Energy Absorbed inCompression
Plateau Slope
Figure 12-3. Idealized crushable foamstress–strain compression curve.

tire itself as it rebounded outward and inward from the axleline, and (2) vertical oscillation of the axle. Properly imple-mented damping prevented over- and under-damping thesolution, leading to the shortest available run time while notaltering the overall response of the system.
The final method involved a vertical damping value thatproduced slight overshoot behavior. Using this approachensured that the full depth had been reached, while keeping
simulation times short. Depending on the strength of thearrestor material, the simulation time required for settlingcould still vary considerably.
12.3.3. Batch Simulations
Using the arrestor bed model, large batches of simulationswere conducted to generate metamodels for studying theeffects of depth-varying material properties. For each tire, therun sets had three open variables:
• Bed depth, in incremental depths from 18 to 30 in.;• Material Initial Strength, which defined the compressive
strength at the surface of the bed; and• Material Strength Gradient, which defined how rapidly the
strength of the material increased with depth (the quadraticor linear coefficient of the material profile curve).
The large batch simulations were conducted using LS-OPT. Based on the initial model files, LS-OPT generated
139
30 in.
36 in.
8 Layers2-In. Particles
Top-Most Layer
Figure 12-5. Sectional view of eight-layer arrestor bed model.
SPH Arrestor Bed Constructed with Stratified Layering
Deeper Material Becomes Harder
Deformable FEM Main Gear Tiresfor B737-800 and CRJ-200
Models Constructed Using Half-Symmetry
Figure 12-4. Depth-varying arrestor and tire model.
Aircraft Landing Gear Tire Designation Included in Evaluation
Main Gear H29x9.0-15 Included CRJ-200
Nose Gear R18x4.4 -
Main Gear H44.5x16.5-21 Included B737-800
Nose Gear H27x7.7-15 -
Main Gear H49x19-22 - B747-400
Nose Gear H49x19-22 -
Table 12-1. FEM tire library for glass foam arrestor models.

permutations with various bed depths, strengths, and strengthgradients. It sequentially executed the simulations and extractedthe load data from them. Generally, the batches were conductedwith one iteration of 50 simulations.
12.4. Metamodel Analysis
12.4.1. Metamodel Method
The output from the batch simulations was extracted andassembled automatically by LS-OPT, where metamodels wereconstructed for the drag and vertical load forces. Metamodel-ing is analogous to fitting a curve through experimental dataexcept that it is applied to multi-dimensional data sets. Thesedata sets were four-dimensional, including depth, strength,strength gradient, and load (either vertical or drag). The meta-models were RBF networks, which can effectively capturenon-linear behaviors including multiple concavity changesacross the data set.
12.4.2. Optimization Criteria and Constraints
The LS-OPT simulation sought to maximize the decelera-tion for both aircraft simultaneously, assuming that the maingear were responsible for the deceleration. Therefore, thedrag load on both tires was maximized.
Landing gear loading limits constrained the optimization.From the tire drag load, multiplied by two tires per strut, theoverall rearward strut loading was calculated. This loadingwas then limited to be no greater than acceptable horizontalloadings as defined by the FAR.
The loading requirements of the FAR define two types ofcriteria: (1) limit, which the gear should withstand withoutsuffering damage, and (2) ultimate, which the gear shouldwithstand without collapsing. For the evaluation, the limitstrength criterion was used. FAR Section 25.493 requires hor-izontal main-gear strength equivalent to a 0.8 braking factor,applied to the maximum taxi weight on the strut. Therefore,
the 0.8 factor became the optimization criterion; an optimaldesign would achieve a main-gear drag loading factor of 0.8for both aircraft.
All nose-wheel loading was neglected, although in practiceit typically limits the arrestor bed design. Since the results ofthe analysis would not be integrated with the APC, it was fea-sible to make this simplification.
12.4.3. Metamodel Interpretation
A visual review of the metamodel proved informative forcomparing the material performance. Because this optimiza-tion study had two simultaneous constraints, one for eachtire, the surface plots show two constraint curves and threeshaded regions. As a key for understanding the other plots inthis section, Figure 12-7 gives an example of such a surface.
Two curves are drawn across the surface as boundaries tothe shaded regions. One curve indicates the constraintboundary for the 29.0-in. tire. The other curve indicates theconstraint boundary for the 44.5-in. tire. For each case, thecurve indicates the ideal case of a 0.8 strut load factor.
The darkest region violates the constraints for both tires(strut overload). The two medium-shaded regions violate theconstraints for one tire or the other. The light-shaded regionis acceptable for both constraints.
Where the region boundary curves intersect, a dual-caseoptimum occurs, providing an ideal load for both aircraftstruts. The strut load factor would be 0.8 for both aircraft inthis case. If the material was designed with the depth, strength,and strength gradient from this intersection point, the strutswould be ideally loaded for maximum deceleration.
12.4.4. Linear and Quadratic Profile Comparison
For either the linear or quadratic depth-varying material,the performance for the 29.0-in. tire improved. In the homo-geneous material, drastic overloading could occur if the bed
140
Acceleration/Spin-UpConstant Vertical Load
Constant Forward VelocitySettled Steady-State:Take Measurements
Figure 12-6. Sequencing method for depth-varying simulations.
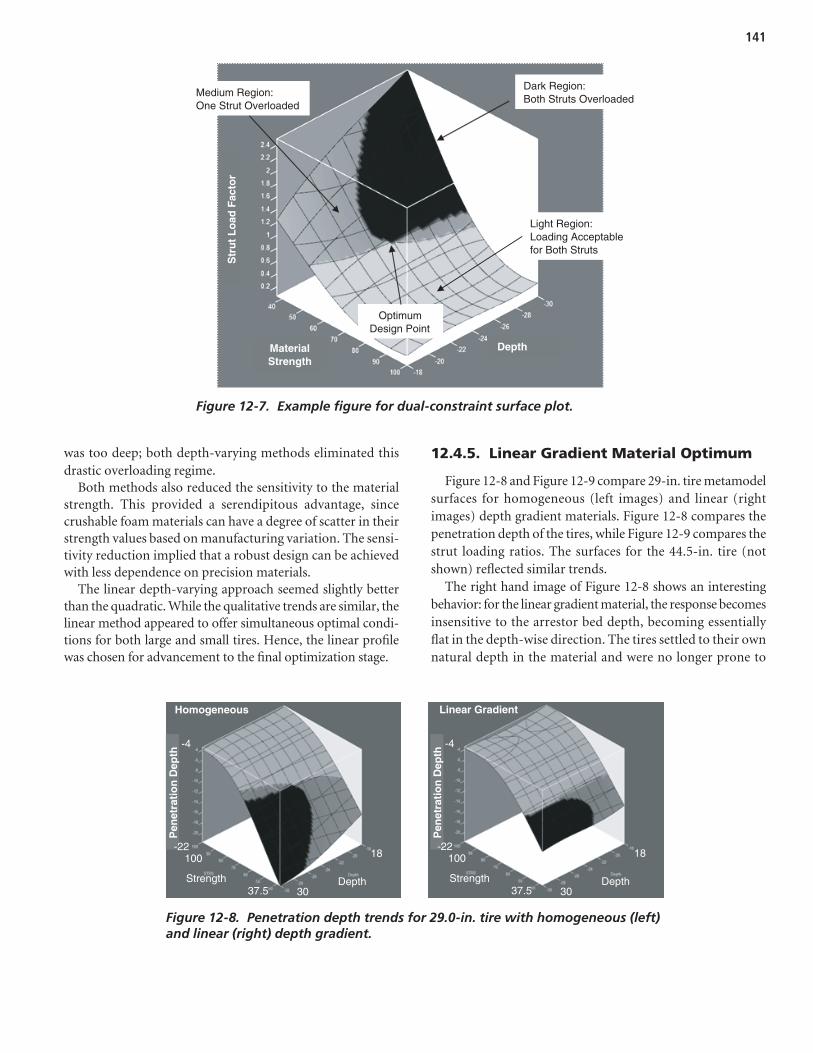
was too deep; both depth-varying methods eliminated thisdrastic overloading regime.
Both methods also reduced the sensitivity to the materialstrength. This provided a serendipitous advantage, sincecrushable foam materials can have a degree of scatter in theirstrength values based on manufacturing variation. The sensi-tivity reduction implied that a robust design can be achievedwith less dependence on precision materials.
The linear depth-varying approach seemed slightly betterthan the quadratic. While the qualitative trends are similar, thelinear method appeared to offer simultaneous optimal condi-tions for both large and small tires. Hence, the linear profilewas chosen for advancement to the final optimization stage.
12.4.5. Linear Gradient Material Optimum
Figure 12-8 and Figure 12-9 compare 29-in. tire metamodelsurfaces for homogeneous (left images) and linear (rightimages) depth gradient materials. Figure 12-8 compares thepenetration depth of the tires, while Figure 12-9 compares thestrut loading ratios. The surfaces for the 44.5-in. tire (notshown) reflected similar trends.
The right hand image of Figure 12-8 shows an interestingbehavior: for the linear gradient material, the response becomesinsensitive to the arrestor bed depth, becoming essentiallyflat in the depth-wise direction. The tires settled to their ownnatural depth in the material and were no longer prone to
141
Dark Region: Both Struts Overloaded
Medium Region: One Strut Overloaded
Light Region: Loading Acceptable for Both Struts
DepthMaterial Strength
Str
ut
Lo
ad F
acto
r
Optimum Design Point
Figure 12-7. Example figure for dual-constraint surface plot.
Homogeneous
Strength Depth
Pen
etra
tio
n D
epth
100
37.5 30
18
Linear Gradient
Strength Depth
Pen
etra
tio
n D
epth
100
37.5 30
18
-4
-22
-4
-22
Figure 12-8. Penetration depth trends for 29.0-in. tire with homogeneous (left)and linear (right) depth gradient.

over-penetration and the resulting overload behavior. Thistrend was not true for the homogeneous material shown onthe left. This contrast implies a superior geometric couplingof the depth-varying material with the tire size and load.
The strut loading plot on the right side of Figure 12-9shows a long, dual-tire optimal region where the boundarycurves overlap one another at between 24 and 30 in. of beddepth. In that region, both aircraft struts are ideally loaded ata factor of 0.8.
This long overlap is superior to the crisscross intersectionof the homogeneous material plot on the left. It implies thatadditional tires, either larger or smaller than the two subjecttires, could also find optimal responses with such a design.After all, a larger tire would generally require a deeper bed;such a bed would not disturb the response of either existingtire, since neither feels the effects of the additional depth. Thetires would tend to settle to their own equilibrium levels. Thisbehavior contrasts with the homogeneous material, wherethe only dual-tire optimum point was a chance intersectionof the two tire curves. The likelihood of a third tire happen-ing to intersect those two curves at the same junction point isminimal.
Therefore, three behaviors emerge in the optimal designregion of the linear depth gradient material:
1. Each tire ignores unneeded depth, and “sees” the bed astailor-fit to its dimensions;
2. The strength sensitivity of the smaller tire is reduced, mov-ing closer to that of the larger tire; and
3. The behavior suggests the feasibility of multi-tire simulta-neous optimization due to the depth insensitivity.
12.4.6. Summary of Metamodel Analysis
The metamodel analysis explored linear, quadratic, andexponential depth-varying material profiles using stratified
arrestor bed models. These profiles were compared with oneanother and with the currently used homogeneous materialapproach.
An initial down-selection eliminated the exponential pro-file from consideration; subsequent analysis eliminated thequadratic profile. The final analysis compared the linear pro-file material with the homogeneous approach.
A dual-tire optimum design can be obtained with eitherhomogeneous or linear depth-varying arrestor beds. However,the optimum designs for each differ in several substantial ways:
• The homogeneous material strut-loading metamodels forthe two tires had different shapes and magnitudes; the depth-varying material did much to bridge the response chasm,resulting in similar surfaces for the two tires.
• The optimal design for the homogeneous material exhibitedhigh sensitivity to changes in the arrestor material strengthfor the smaller tire; the depth-varying system reduced thesensitivity difference between the tires by 50%.
• The homogeneous material did not lend itself to multiplesimultaneous aircraft optimizations; the depth-varying sys-tem offered a dual-tire optimized region rather than a singleintersection point, and likely could support multiple simul-taneous aircraft optimizations.
• With the depth-varying material, each tire ignored unneededbed depth, settling to its own natural equilibrium depth.
12.5. Transition to Fielded System
12.5.1. Comparison with Other Candidate Evaluations
The depth-varying foam material was assessed as part of aparallel study to the overall research effort. The focal point ofthe investigation differed from that of the other candidatearrestor concepts, and the final evaluation is less mature.
142
2.5
0
Strength Depth
Str
ut
Lo
adin
g C
rite
rio
n
37.5
100 18
300
Strength Depth
Str
ut
Lo
adin
g C
rite
rio
n
37.5
100 18
30
2.5
Homogeneous Linear Gradient
Figure 12-9. Strut loading trends for 29.0-in. tire with homogeneous (left) andlinear (right) depth gradient.
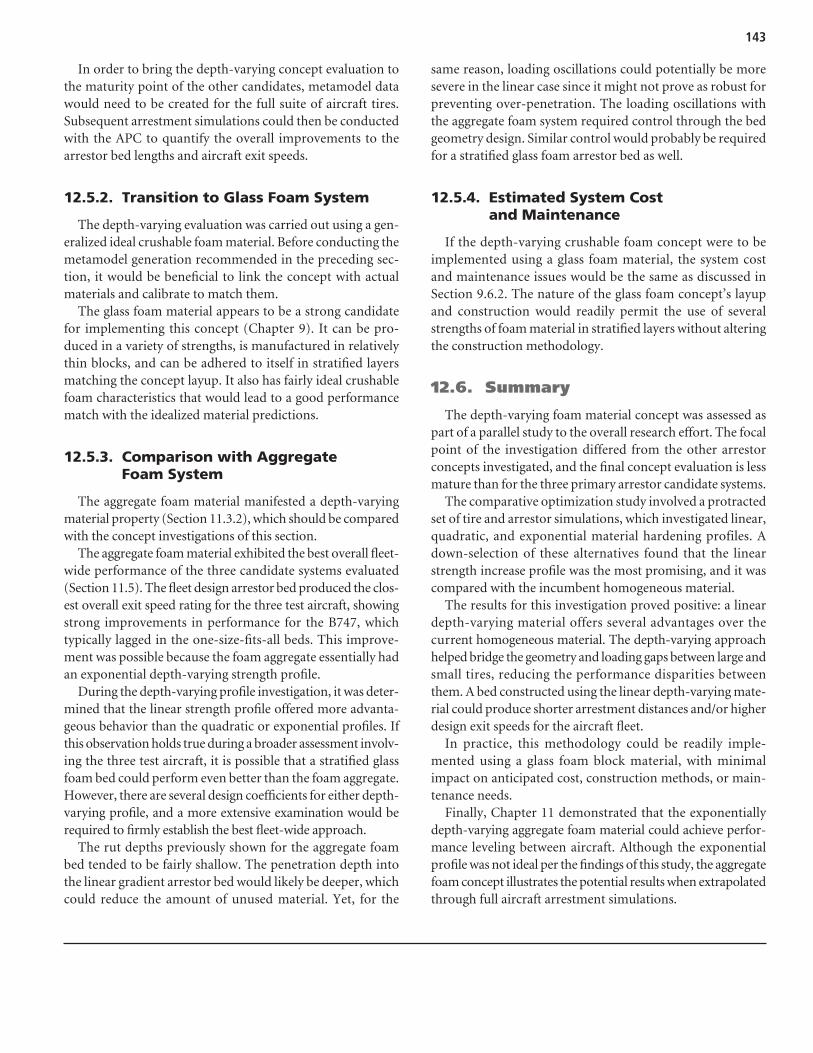
In order to bring the depth-varying concept evaluation tothe maturity point of the other candidates, metamodel datawould need to be created for the full suite of aircraft tires.Subsequent arrestment simulations could then be conductedwith the APC to quantify the overall improvements to thearrestor bed lengths and aircraft exit speeds.
12.5.2. Transition to Glass Foam System
The depth-varying evaluation was carried out using a gen-eralized ideal crushable foam material. Before conducting themetamodel generation recommended in the preceding sec-tion, it would be beneficial to link the concept with actualmaterials and calibrate to match them.
The glass foam material appears to be a strong candidatefor implementing this concept (Chapter 9). It can be pro-duced in a variety of strengths, is manufactured in relativelythin blocks, and can be adhered to itself in stratified layersmatching the concept layup. It also has fairly ideal crushablefoam characteristics that would lead to a good performancematch with the idealized material predictions.
12.5.3. Comparison with Aggregate Foam System
The aggregate foam material manifested a depth-varyingmaterial property (Section 11.3.2), which should be comparedwith the concept investigations of this section.
The aggregate foam material exhibited the best overall fleet-wide performance of the three candidate systems evaluated(Section 11.5). The fleet design arrestor bed produced the clos-est overall exit speed rating for the three test aircraft, showingstrong improvements in performance for the B747, whichtypically lagged in the one-size-fits-all beds. This improve-ment was possible because the foam aggregate essentially hadan exponential depth-varying strength profile.
During the depth-varying profile investigation, it was deter-mined that the linear strength profile offered more advanta-geous behavior than the quadratic or exponential profiles. Ifthis observation holds true during a broader assessment involv-ing the three test aircraft, it is possible that a stratified glassfoam bed could perform even better than the foam aggregate.However, there are several design coefficients for either depth-varying profile, and a more extensive examination would berequired to firmly establish the best fleet-wide approach.
The rut depths previously shown for the aggregate foambed tended to be fairly shallow. The penetration depth intothe linear gradient arrestor bed would likely be deeper, whichcould reduce the amount of unused material. Yet, for the
same reason, loading oscillations could potentially be moresevere in the linear case since it might not prove as robust forpreventing over-penetration. The loading oscillations withthe aggregate foam system required control through the bedgeometry design. Similar control would probably be requiredfor a stratified glass foam arrestor bed as well.
12.5.4. Estimated System Cost and Maintenance
If the depth-varying crushable foam concept were to beimplemented using a glass foam material, the system costand maintenance issues would be the same as discussed inSection 9.6.2. The nature of the glass foam concept’s layupand construction would readily permit the use of severalstrengths of foam material in stratified layers without alteringthe construction methodology.
12.6. Summary
The depth-varying foam material concept was assessed aspart of a parallel study to the overall research effort. The focalpoint of the investigation differed from the other arrestorconcepts investigated, and the final concept evaluation is lessmature than for the three primary arrestor candidate systems.
The comparative optimization study involved a protractedset of tire and arrestor simulations, which investigated linear,quadratic, and exponential material hardening profiles. Adown-selection of these alternatives found that the linearstrength increase profile was the most promising, and it wascompared with the incumbent homogeneous material.
The results for this investigation proved positive: a lineardepth-varying material offers several advantages over thecurrent homogeneous material. The depth-varying approachhelped bridge the geometry and loading gaps between large andsmall tires, reducing the performance disparities betweenthem. A bed constructed using the linear depth-varying mate-rial could produce shorter arrestment distances and/or higherdesign exit speeds for the aircraft fleet.
In practice, this methodology could be readily imple-mented using a glass foam block material, with minimalimpact on anticipated cost, construction methods, or main-tenance needs.
Finally, Chapter 11 demonstrated that the exponentiallydepth-varying aggregate foam material could achieve perfor-mance leveling between aircraft. Although the exponentialprofile was not ideal per the findings of this study, the aggregatefoam concept illustrates the potential results when extrapolatedthrough full aircraft arrestment simulations.
143

144
Chapters 9 through 12 examined the passive system candi-dates on an individual basis. This brief chapter summarizeskey findings for performance and cost on a side-by-side basis.
13.1. Overview
The experimentation phase evaluated three passive arrestorcandidate systems:
1. Glass foam arrestor2. Aggregate foam arrestor3. Engineered aggregate arrestor
Each demonstrated relative strengths and weaknesses. Allthree options provide concepts with increased material dura-bility over cellular cement, which would likely result in longerlife cycles and decreased maintenance requirements.
13.2. Performance Comparison
The performance of the different candidates can be com-pared in two primary ways: based on (1) single-plane or (2) multi-aircraft bed designs. When comparing single-aircraft bed designs, the thickness of each bed and its mate-rial properties are optimized for the plane of interest. How-ever, the bed designs for the different aircraft may not becompatible with one another. For example, a best-case designfor the B747-400 was typically found to overload the landinggear of the CRJ-200.
When comparing multi-aircraft bed designs, a single bed isdesigned for best-case performance with all three of the subjectaircraft simultaneously. A single bed thickness and materialproperty are determined such that the overall performance isoptimized for all three aircraft.
The single-aircraft comparisons always produce the short-est feasible stopping distances. However, the multi-aircraftcomparisons are more relevant to actual applications at air-
ports, in which arrestor beds are designed as a compromisebetween the different aircraft serviced.
Figure 13-1 compares the best single-aircraft bed designsfor the three alternatives and compares them to the currentEMAS technology. The four sets of bars show very similartrends in terms of relative stopping lengths for the differentaircraft. The glass foam stopping distances are slightly shorterthan those of the current EMAS, while the other two conceptswould require slightly longer beds. The performance simi-larity of glass foam and the current EMAS is not surprisingbecause both designs use crushable foam block materialwith similar mechanical behavior. However, this compari-son of single-aircraft performance is ultimately less relevantto real applications than the multi-aircraft comparisons thatfollow.
Figure 13-2 compares the best multi-aircraft arrestor beddesigns for the three alternatives. In each case, the B747-400required the longest bed for arrestment from a 70-knot exitspeed. It should be noted that performance predictions for theexisting EMAS have not been included in the figure becausethe design cases did not apply to multi-aircraft bed designs. Ingeneral, the material could be assumed to follow a similartrend to glass foam, owing to the mechanical similarities justdiscussed.
In comparing Figure 13-1 with Figure 13-2, the trend forleading and trailing concepts shifts considerably. The differ-ences illustrate how substantially the multi-aircraft perfor-mance deviates from aircraft considered individually. For themulti-aircraft case, bars of similar height indicate improvedequality in the treatment of the three aircraft. Of the threeconcepts, the aggregate foam shows the most consistent per-formance, with dramatic reduction in the stopping distance forthe B747-400.
As an example, for a bed with a practical 400-ft length, theexit speeds for each aircraft are as shown in Table 13-1. The400-ft bed would obtain a full 70-knot exit speed rating forthe CRJ-200 with all arrestor concepts. Both the glass foam
C H A P T E R 1 3
Summary of Passive System Candidates
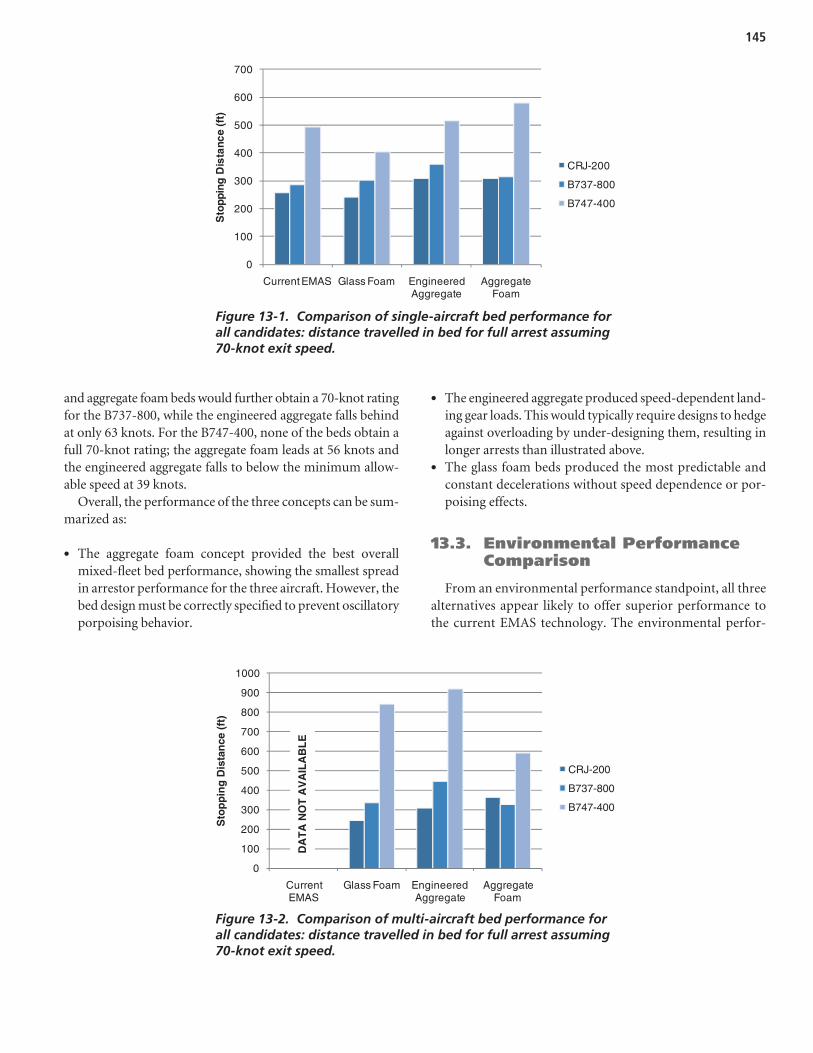
145
and aggregate foam beds would further obtain a 70-knot ratingfor the B737-800, while the engineered aggregate falls behindat only 63 knots. For the B747-400, none of the beds obtain afull 70-knot rating; the aggregate foam leads at 56 knots andthe engineered aggregate falls to below the minimum allow-able speed at 39 knots.
Overall, the performance of the three concepts can be sum-marized as:
• The aggregate foam concept provided the best overallmixed-fleet bed performance, showing the smallest spreadin arrestor performance for the three aircraft. However, thebed design must be correctly specified to prevent oscillatoryporpoising behavior.
• The engineered aggregate produced speed-dependent land-ing gear loads. This would typically require designs to hedgeagainst overloading by under-designing them, resulting inlonger arrests than illustrated above.
• The glass foam beds produced the most predictable andconstant decelerations without speed dependence or por-poising effects.
13.3. Environmental PerformanceComparison
From an environmental performance standpoint, all threealternatives appear likely to offer superior performance to the current EMAS technology. The environmental perfor-
0
100
200
300
400
500
600
700
Current EMAS Glass Foam Engineered Aggregate
Aggregate Foam
Sto
ppin
g D
ista
nce
(ft)
CRJ-200
B737-800
B747-400
Figure 13-1. Comparison of single-aircraft bed performance forall candidates: distance travelled in bed for full arrest assuming70-knot exit speed.
0
100
200
300
400
500
600
700
800
900
1000
Current EMAS
Glass Foam Engineered Aggregate
Aggregate Foam
Sto
pp
ing
Dis
tan
ce (
ft)
CRJ-200
B737-800
B747-400
DA
TA
NO
T A
VA
ILA
BL
E
Figure 13-2. Comparison of multi-aircraft bed performance forall candidates: distance travelled in bed for full arrest assuming70-knot exit speed.

146
mance estimates are based on some test data, historical use ofthe materials, and engineering judgment. An exhaustive envi-ronmental test program has not been undertaken as part of thisprogram.
Life-cycle performance has been assumed to result from acombination of the core materials used and the protectivemeasures taken to shield those materials from the elements.
From a materials standpoint, the glass foam and aggre-gate foam concepts both use closed-cell glass foams thatinherently resist water penetration. The engineered aggre-gate is composed of hard spherical pellets. All three of thesematerials appear to offer superior inherent resistance to gen-eral handling and moisture/chemical exposure when com-pared to cellular cement.
Of the three, the engineered aggregate is the most durablematerial because it is not a crushable low-density foam. How-ever, the arresting properties of engineered aggregate can beaffected by the dampness of the material in a manner that isunlikely to affect the glass and aggregate foams.
The glass and aggregate foam materials showed degrada-tion if subjected to fully immersed freeze–thaw cycling con-ditions. Protection from standing water conditions would berequired in all three cases, which is feasible using the pro-posed protective measures. Where such measures are taken,the materials have demonstrated a long service life.
With regard to protective measures, methods for coveringand sealing the three candidate materials against moisture,standing water, jet blast, and freezing conditions have beenexamined (see respective chapters). For the aggregate foamand engineered aggregate approaches, the use of geo-plasticsand geo-textiles could render the beds essentially isolatedfrom water entrainment and freeze–thaw damage. The glassfoam material could be packaged in a manner similar to thatof the current EMAS cellular cement or equipped with analternative monolithic sealed top layer.
Both the aggregate foam and engineered aggregate conceptspropose using a turf layer atop the beds, which is novel forarrestor beds. While modeling predictions indicate that this isfeasible, additional testing in wet and freezing conditions wouldbe required to characterize that facet of environmental per-formance. Alternative cover layers are possible in the event ofadverse performance.
In all three cases, the proposed designs offer life-cycle poten-tial beyond the 10-year bed replacement interval that isassumed necessary for the current EMAS technology (29).
13.4. Cost Comparison
The relative costs for the current EMAS and the candi-date systems are compared in Figure 13-3 and Figure 13-4using survey cost assumptions and estimates from FAAOrder 5200.9, respectively. The general trends appear similar in either case, with the aggregate foam concept pro-viding the least expensive alternative, and the glass foam
Aircraft Glass Foam Engineered Aggregate
Aggregate Foam
CRJ-200 70+ 70+ 70+
B737-800 70+ 63 70+
B747-400 46 39 56
Table 13-1. Comparison of multi-aircraft bed per-formance: exit speeds for full arrest in 400-ft bed.
$-
$1
$2
$3
$4
$5
$6
$7
$8
$9
Co
st t
o E
stab
lish
($M
)
Installation
Site Preparation
Figure 13-3. Relative estimated cost comparisonassuming survey costs (150 ft x 300 ft bed).
$-
$1
$2
$3
$4
$5
$6
$7
Co
st t
o E
stab
lish
($M
)
Installation
Site Preparation
Figure 13-4. Relative estimated cost comparisonassuming FAA Order 5200.9 costs (150 ft x 300 ft bed).

147
providing the most expensive alternative. The costs in thefigures denote the total cost to establish such a system anddo not include life-cycle costs of bed replacement andmaintenance.
13.5. Summary Comparison
Glass foam provided equivalent dynamic behavior to thecurrently approved EMAS system. Its performance, cost, andconstruction are also similar to the current EMAS. However,use of glass foam with a monolithic construction offers reducedmaintenance and a longer service life. Additionally, glass foamcould be constructed using a stratified depth-varying layup,
which would likely improve multi-aircraft bed performance(Chapter 12).
Aggregate foam provided a novel approach that featuredexcellent multi-aircraft bed performance due to its depth-varying crushable material; this would effectively lead to shorterarrestor beds. Its cost was the lowest of the alternatives, combin-ing an inexpensive material with a simple installation process.
Engineered aggregate features the most durable candidatearrestor material, much of which could be reused after an arrest-ing event. It has a cost that falls between the other concepts. Itsspeed-dependent nature produces weaker multi-aircraft per-formance, which would require longer arrestor beds to obtain thesame exit speed ratings.

148
The main-gear engagement active arresting system con-cept was evaluated in two major respects. First, a loadingmodel was developed to determine the decelerations possi-ble and the load effects on the landing gear. This modelassumed that a cable-based arrestor system had successfullyengaged the main-gear struts of the aircraft. The secondpart of the evaluation assessed the performance require-ments to successfully engage the landing gear of a fast-movingaircraft.
14.1. Overview of Active System Deployment
Three issues complicate the deployment of a cable-basedarrestor: aircraft identification, overrun event detection,and timing of deployment. First, the type of aircraft mustbe determined prior to the arrest. Civil aircraft in service at U.S. airports have a variety of main landing gear ge-ometries. Therefore, the type of aircraft would have to beknown prior to deployment. This issue could be resolvedwith a dedicated transponder or a video-based recognitionsystem.
Second, unlike an EMAS, which passively arrests aircraft,the net or cable that engages the main gear must be acti-vated to be erected in the event of an overrun. Under nor-mal circumstances, the net or cable will be retracted andlevel with the runway. Activation depends on detection ofan overrun. This issue could be addressed by locating sen-sors at or near the threshold of a runway. When the aircraftcrosses the threshold, the system could automatically armitself. With the correct detection sensors, the need for aground operator to manually activate the system could beeliminated.
The third issue is the timing of deployment. Erecting anengagement device to capture the main gear must be donewhile avoiding contact with the aircraft engines. As shownin Figure 14-1, the main landing gear and the engines are
in similar longitudinal positions on the aircraft. Conse-quently, any device that would propel the arresting cable up to engage the main landing gear would have to be timedto activate after the nose gear and engine nacelles hadpassed by.
14.2. Prediction of Arresting Loads
14.2.1. Predictive Tool
An analytical spreadsheet model was developed to calcu-late a time-marching aircraft deceleration. The mechanicalinput variables and output responses included in the modelare shown in Table 14-1.
The predictive tool assumed the geometry shown in Fig-ure 14-1. Figure 14-2 is a detail of the main landing gearengaged by the cable with tension. As shown, the initial decel-eration tension in the cables, which the brake units create,produces a secondary tension between the main-gear struts.
The primary and secondary cable tensions produce a rear-ward deceleration load on the struts and an inward lateralload. The lateral load depends on the coefficient of frictionbetween the cable and the strut. As the plane rolls further pastthe arresting engines, the angle θ decreases, which increasesthe lateral load on the struts.
The limiting lateral and longitudinal loads were determinedfrom FAR part 25 for a Boeing 737-800.
14.2.2. Arrestment Simulations
Arrestment simulations were made for a B737-800 that wasinitially travelling at 70 knots. The aircraft was assumed tohave a 0.25 braking coefficient during the arrest.
During the simulation, the cable tension was set to maxi-mize the deceleration without exceeding the main-gear limitloads. The total load on the strut due to the cable force andthe braking force summed to equal the longitudinal limitload. Due to the angle change for the cable, the tension was
C H A P T E R 1 4
Main-Gear Engagement Active System Concept

149
continually adjusted to maintain the total overall load. Thiswas done dynamically during an arrest to simulate an activefeedback control for the arrestor system.
Because the deceleration was designed to maximize thedrag loading on the main gear, a fairly low coefficient offriction (μ = 0.3) was used between the main strut and thecable. With this configuration, the strut loads were calcu-lated to be as shown in Figure 14-4. The struts are loadedmaximally in the longitudinal (drag) direction, and the lat-eral strut loads climb steadily until the end of the arrest-ment. If the friction between the strut and the cable ishigher, the lateral load becomes the limiting factor, and thecable tension must be reduced, lengthening the stoppingprocess.
For the B737-800, the cable tensions are given by Figure 14-5.For the 140 kip tension shown, the cable would need to becomposed of high-strength steel with a diameter of 1.4 in. ormore, depending on strength. This cable size presents compli-cations, especially when dealing with large and small aircraft.Strong decelerations of a large aircraft will require a thick,heavy cable. When a small aircraft is arrested by such a system,the weight of the cable itself could be sufficient to cause dam-age to the landing gear.
The aircraft speed and deceleration are shown in Figure 14-6and Figure 14-7, respectively. This deceleration essentiallyrepresents a best-case solution for the aircraft, assuming thelongitudinal FAR limit load criterion for the main gear. As
Figure 14-7 shows, the system concept is capable of providingideal constant decelerations.
14.2.3. Additional Friction Study
Simulations were conducted to determine whether, for a typical arrest case, the lateral load on the landing gearwould reach a limiting value. Preliminary simulationsshowed that if the maximum tension in the cable were keptbelow a critical value, the lateral load on the landing gearremained below the limiting lateral load implied by FARSection 25.485.
For a braking coefficient of 0.25 and no reverse thrust, sim-ulations were run for a B737-800 in which the strut-cablecoefficient of friction was varied and the maximum lateralload on the landing gear was recorded. These maximum lateralloads were normalized by the limiting lateral load. As shown inFigure 14-8, the maximum lateral load nearly reached 90%
Figure 14-1. B737-800 main landing gear and aircraftengine (42).
Input Variables Output Responses
Geometry
• Distance between brake units
• Slack in cable
Maximum tension in cable
Coefficient of friction between strut and cable
Aircraft type (B737-800)
• Limiting lateral load
• Limiting longitudinal load
Aircraft braking condition
• Braking
• Free-rolling
Stopping distance
Max lateral load
Max longitudinal load
Table 14-1. Cable-based arrestor model parameters.
PrimaryTension
PrimaryTension
Landing Gear
BrakingUnit
BrakingUnit
Figure 14-2. Cable-based aircraft arrestment.

150
14.3. Landing Gear Engagement
Arguably the most challenging aspect of the main-gearengagement active arrestor concept is “catching” the aircraftand establishing a solid connection with the landing gear. Ifthe cable or net system misses the landing gear strut, orbounces off and is overrun by the plane, the braking deviceswill not be able to stop the aircraft.
14.3.1. Deployment Path
Assuming that the netting or cable system starts from an initially flat configuration, flush with the runway sur-face, it would require rapid vertical deployment to catch the strut above the top of the tires. For an aircraft with low-slung engines, the cable/net would have to elevate after theengine nacelles have passed by but in time to catch the strut(Figure 14-9).
PrimaryTension
SecondaryTension
Figure 14-3. Detailof cable tensions atmain-gear strut.
-0.2
0.0
0.2
0.4
0.6
0.8
1.0
1.2
1.4
0 50 100 150 200 250 300 350
Fo
rce
Rat
io
Nose Gear Travel [ft]
Drag Load Ratio
Lateral Load Ratio
Figure 14-4. Main-gear strut loads during active systemarrestment for B737-800, normalized by FAR strut limit values.
0 50 100 150 200 250 300 350
Nose Gear Travel [ft]
0
20
40
60
80
100
120
140
160
Cab
le T
ensi
on
(ki
p)
Primary Tension
Secondary Tension
Figure 14-5. Cable loads during active system arrestment forB737-800.
of the limiting lateral load for a strut-cable coefficient offriction of approximately 0.7. Therefore, on the basis of pre-liminary investigation, if the maximum tension in the cableis limited to the critical value, lateral collapse of the landing gearcan be prevented.

151
0
10
20
30
40
50
60
70
80
Air
craf
t S
pee
d (
kno
ts)
Aircraft Speed
0 50 100 150 200 250 300 350Nose Gear Travel [ft]
Figure 14-6. Aircraft speed during active system arrestmentfor B737-800.
-0.2
0.0
0.2
0.4
0.6
0.8
1.0
0 50 100 150 200 250 300 350
Dec
eler
atio
n (
g)
Nose Gear Travel [ft]
Deceleration
Figure 14-7. Deceleration during active system arrestment for B737-800.
0.0
0.1
0.2
0.3
0.4
0.5
0.6
0.7
0.8
0.9
1.0
0.0 0.1 0.2 0.3 0.4 0.5 0.6 0.7 0.8 0.9 1.0
Nor
mal
ized
Lat
eral
Loa
d
Strut-Cable Coefficient of Friction
Braking Coefficient = 0.25R/T = 0
Figure 14-8. Dependence of lateral load on strut-cable coefficient of friction.

152
Assuming that the aircraft would be rolling forward at 70 knots, the necessary deployment timing was calculated.Because the aircraft’s lateral location with respect to the run-way centerline could vary, it was assumed that the cable forthe system would be elevated uniformly across the entire run-way width.
The test aircraft in this case was a B737-800. Using manufac-turer-published dimensions, the required cable path is given inFigure 14-10. The illustration gives an upper and lower bound-ary to the cable path, as well as an optimal path. The pathappears sloped because the aircraft is moving forward relativeto the cable location. However, the calculations assume that thecable moves directly upward from its location on the runway.
14.3.2. Deployment Timing
Table 14-2 summarizes the timing and speed requirementsfor the deployment. The time to launch is essentially the delay
in deployment after the nose wheel passes the arrestor cable.The tolerance shows that the initialization of the deploy-ment must take place within about 8 milliseconds of the tar-geted time.
Overall, the velocities and timing tolerances in this exampleare feasible for a mechanical design. For each aircraft, thesevalues would be different, which would require that a deploy-ment system be capable of identifying the aircraft type. Itwould then need to make a timing determination based on adatabase of aircraft information.
One important feature of these calculations is the upwardvelocity, which would be nominally 40 ft/sec (27 mph) on ini-tialization, and nearly that fast on contact with the strut. Thismeans that the cable would still be moving upward. Depend-ing on the nature of the mechanical deployment system, slackin the cable combined with the upward motion could causeit to slap against the bottom of the aircraft and the landinggear bay doors.
Location of ArrestorCable/Net at InitialDeployment
Target Point:On Strut AboveTire
By the Time of Main StrutArrival, Cable/Net has MovedVertically to Target Point
Figure 14-9. Cable deployment concept (42).
0
5
10
15
20
25
30
35
40
45
50
-100 -80 -60 -40 -20 0
Horizontal Distance (in)
Lower Bound
Optimal Launch
Upper Bound
Plane Bottom
Vertical D
istance (in
)
Figure 14-10. Path calculation plot for active system B737 landing gear capture.

153
14.3.3. Landing Gear Features
One of the more problematic issues with this concept isthe varied nature of main landing gear features for differentaircraft. On the main struts of many passenger aircraft, avariety of smaller hydraulic, electrical, and mechanical com-ponents are exposed on the front and outboard sides of thestruts. If the struts of these aircraft were engaged with acable or net and subjected to substantial load, these compo-nents would likely be damaged. In the case of some aircraft,such as the A380, which has a secondary strut forward of themain-gear strut, cable engagement could result in structuralfailure of the main-gear assembly. Although it is possiblethat engagement geometries could be developed that reducethe risk of structural damage to the landing gear, somedegree of damage to the gear is likely under any arrestingconditions.
14.3.4. Infeasible Aircraft
During the investigation, it became apparent that someaircraft would not have a deployment path solution as thatdiscussed in Section 14.3.1. Figure 14-11 shows that theshorter B737-200 has engine locations that preclude engag-ing the target point on the strut. Although a broad survey ofinfeasible aircraft was not undertaken, this case illustrates that
there would be at least some aircraft for which this arrestorconcept would not work.
14.4. Summary
The main-gear engagement active system concept offeredmultiple advantages not available in surface-based arrestorbeds. Feedback control offered the potential for ideal decel-eration of aircraft. The friction brakes could adjust auto-matically to apply less load on a small plane than a largeone, enabling one arrestor to treat all aircraft equally. Theoverall effect of these advantages would be shorter arrest-ing distances for the entire design fleet of aircraft.
The load calculations undertaken confirm that the essen-tial mechanics for the arrestor system would function asanticipated. Tension regulation in the cable would be essen-tial to prevent lateral overloading of the landing gear towardthe end of the arrestment.
Despite these promising features, a number of complicat-ing issues remain for the active system concept:
• Aircraft identification and speed calculation would berequired for the system to function correctly. Systems to accomplish both could likely be developed, althoughresearch of such facets has not yet been undertaken.
• Cable sizes are of concern because the thicker cables requiredfor rapidly arresting large planes could be heavy enough todamage smaller ones.
• The cable engagement process would likely result in dam-age to landing gear doors, actuators, wiring, and hydraulicfeatures on the front side of the main struts.
• The window of time for deploying the system could be nar-row when the aircraft has low-slung engines because thevertical path of the cable or net must miss the enginenacelles yet engage the main strut above the tires.
• Due to the longitudinal overlap of the engines and mainstruts, some aircraft would not have a feasible solution
Lower Bound Optimal Launch Upper Bound
Time to Launch 50 ms 80 ms 110 ms
Tolerance ±4.78 ms ±7.80 ms ±11.03 ms
Initial Velocity 67.73 ft/s 42.33 ft/s 31.36 ft/s
Tolerance ±3.08 ft/s ±2.71 ft/s ±2.22 ft/s
Terminal Velocity 66.12 ft/s 39.75 ft/s 27.82 ft/s
Table 14-2. Path calculation data for active systemB737-800 landing gear capture.
Infeasible Geometry: Target Point Blocked by Engine
Figure 14-11. Infeasible geometry for landing gear engagement:B737-200.

154
path for cable deployment. These aircraft could not beengaged and arrested by a main-gear cable/net system.
For these reasons, the active system approach is feasible forstopping aircraft, but the main-gear engagement conceptshould perhaps be eliminated from consideration. Barrier netsystems have been developed in the past, and they may still
offer the best overall engagement approach. Past activationissues for the nets could be resolved using automation con-cepts as discussed, thereby eliminating the need for directtriggering by airport personnel. However, potential obstruc-tion of aircraft exits and damage to the aircraft continue toremain obstacles to implementation.

155
The first research phase engaged in multiple studies of dif-ferent topics relevant to developing arrestor alternatives. Afteridentifying promising alternatives, several candidate conceptswere selected for detailed evaluation in the second experimen-tation phase. In the second phase, testing and modeling wereused to evaluate the performance of the candidates. This chap-ter summarizes important conclusions from both phases ofresearch.
15.1. Study Phase
The survey of U.S. airport operators revealed that actualEMAS costs appear to exceed the predicted values con-tained in FAA Order 5200.9 in terms of preparatory paving,installation, and maintenance (Chapter 3). While the surveyincluded more airports than the original data set used to createOrder 5200.9, it did not include all EMAS systems installed atU.S. airports. It is possible that the average costs could shiftonce the remaining airports were included. However, sincethe survey data for the CTEE was 1.8 times higher than thepredicted value, an update to the guidance document maybe advisable.
A review of aircraft overrun data led to a revised probabil-ity curve for aircraft overrun exit speeds (Chapter 5). Thisrevised curve indicated that 90% of aircraft overruns may nolonger take place at or below an exit speed of 70 knots. Thenew curve suggests that the 90% threshold may have shiftedto just above 80 knots. This could impact the design speedsfor aircraft arrestors if a 90% criterion is to be maintained.Additional investigation may be warranted regarding theaccuracy of the reported data that was used in the assessment.
The sensitivity analysis showed that the relative length ofan arrestor bed will tend to vary with the aircraft exit speedsquared (Chapter 5). Increasing the 70-knot standard exitspeed or the 40-knot minimum exit speed requirements would
have a notable impact on the size and cost of arrestor systems,irrespective of which passive arrestor technology is used.
The FAA EMAS design requirements currently prohibitdamage to the aircraft, which typically results in arrestor beddesigns constrained by the rearward nose-gear loads. Moreaggressive decelerations would be possible if the designs werepermitted to collapse the nose gear as long as the main gearremained intact. Prior EMAS testing suggests that this maypose minimal hazards to aircraft occupants. However, aircraftwith low-slung engines could potentially be damaged and/oringest arrestor material in such cases, and the risks of theseeffects have not been quantified. Additional concerns wouldapply to turbo-prop aircraft, where propeller damage couldpresent additional hazards. It may be advantageous to revisitthe requirements regarding landing gear loading in order todetermine if case-by-case exceptions may be permissible. Insome circumstances, the benefits of aggressive arrestor per-formance may outweigh the risks of failing to stop an overrun.
The approval and commercialization study determinedthat the current lack of a general predictive software tool pre-sents a barrier for new entrants to the arrestor system field(Chapter 6). Development of such a tool, or an update of theolder ARRESTOR code, could be considered as part of anynew approval process.
Although based on anecdotal experience, the researchershave noted a seeming lack of awareness regarding the exis-tence, usage, and function of EMAS among airline pilots. Thislack of awareness has been observed in both newer and sea-soned pilots. It is unclear whether awareness is greater amongpilots that typically land at airports with EMAS. Unfortu-nately, response from the pilot community was limited dur-ing the survey process. Nevertheless, it may be beneficial toconsider pursuit of an educational effort to increase aware-ness of the existence and function of EMAS within the pilotcommunity.
C H A P T E R 1 5
Conclusions
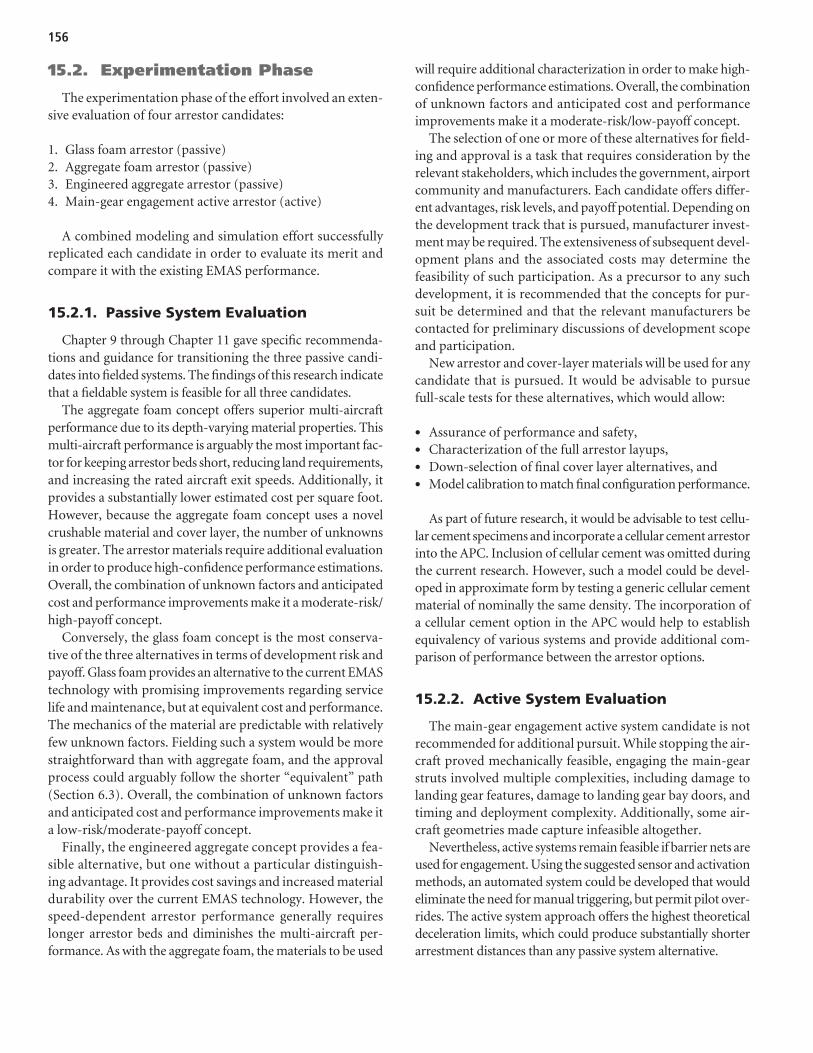
15.2. Experimentation Phase
The experimentation phase of the effort involved an exten-sive evaluation of four arrestor candidates:
1. Glass foam arrestor (passive)2. Aggregate foam arrestor (passive)3. Engineered aggregate arrestor (passive)4. Main-gear engagement active arrestor (active)
A combined modeling and simulation effort successfullyreplicated each candidate in order to evaluate its merit andcompare it with the existing EMAS performance.
15.2.1. Passive System Evaluation
Chapter 9 through Chapter 11 gave specific recommenda-tions and guidance for transitioning the three passive candi-dates into fielded systems. The findings of this research indicatethat a fieldable system is feasible for all three candidates.
The aggregate foam concept offers superior multi-aircraftperformance due to its depth-varying material properties. Thismulti-aircraft performance is arguably the most important fac-tor for keeping arrestor beds short, reducing land requirements,and increasing the rated aircraft exit speeds. Additionally, itprovides a substantially lower estimated cost per square foot.However, because the aggregate foam concept uses a novelcrushable material and cover layer, the number of unknownsis greater. The arrestor materials require additional evaluationin order to produce high-confidence performance estimations.Overall, the combination of unknown factors and anticipatedcost and performance improvements make it a moderate-risk/high-payoff concept.
Conversely, the glass foam concept is the most conserva-tive of the three alternatives in terms of development risk andpayoff. Glass foam provides an alternative to the current EMAStechnology with promising improvements regarding servicelife and maintenance, but at equivalent cost and performance.The mechanics of the material are predictable with relativelyfew unknown factors. Fielding such a system would be morestraightforward than with aggregate foam, and the approvalprocess could arguably follow the shorter “equivalent” path(Section 6.3). Overall, the combination of unknown factorsand anticipated cost and performance improvements make ita low-risk/moderate-payoff concept.
Finally, the engineered aggregate concept provides a fea-sible alternative, but one without a particular distinguish-ing advantage. It provides cost savings and increased materialdurability over the current EMAS technology. However, thespeed-dependent arrestor performance generally requireslonger arrestor beds and diminishes the multi-aircraft per-formance. As with the aggregate foam, the materials to be used
will require additional characterization in order to make high-confidence performance estimations. Overall, the combinationof unknown factors and anticipated cost and performanceimprovements make it a moderate-risk/low-payoff concept.
The selection of one or more of these alternatives for field-ing and approval is a task that requires consideration by therelevant stakeholders, which includes the government, airportcommunity and manufacturers. Each candidate offers differ-ent advantages, risk levels, and payoff potential. Depending onthe development track that is pursued, manufacturer invest-ment may be required. The extensiveness of subsequent devel-opment plans and the associated costs may determine thefeasibility of such participation. As a precursor to any suchdevelopment, it is recommended that the concepts for pur-suit be determined and that the relevant manufacturers becontacted for preliminary discussions of development scopeand participation.
New arrestor and cover-layer materials will be used for anycandidate that is pursued. It would be advisable to pursuefull-scale tests for these alternatives, which would allow:
• Assurance of performance and safety,• Characterization of the full arrestor layups,• Down-selection of final cover layer alternatives, and• Model calibration to match final configuration performance.
As part of future research, it would be advisable to test cellu-lar cement specimens and incorporate a cellular cement arrestorinto the APC. Inclusion of cellular cement was omitted duringthe current research. However, such a model could be devel-oped in approximate form by testing a generic cellular cementmaterial of nominally the same density. The incorporation ofa cellular cement option in the APC would help to establishequivalency of various systems and provide additional com-parison of performance between the arrestor options.
15.2.2. Active System Evaluation
The main-gear engagement active system candidate is notrecommended for additional pursuit. While stopping the air-craft proved mechanically feasible, engaging the main-gearstruts involved multiple complexities, including damage tolanding gear features, damage to landing gear bay doors, andtiming and deployment complexity. Additionally, some air-craft geometries made capture infeasible altogether.
Nevertheless, active systems remain feasible if barrier nets areused for engagement. Using the suggested sensor and activationmethods, an automated system could be developed that wouldeliminate the need for manual triggering, but permit pilot over-rides. The active system approach offers the highest theoreticaldeceleration limits, which could produce substantially shorterarrestment distances than any passive system alternative.
156

The survey findings indicate that endeavors to implement anactive civil aircraft arresting system would meet with resistanceby the aviation community. If pursued, it is recommended thatan educational component be included to increase awarenessand reduce misconceptions regarding such systems.
15.3. Final Conclusions
The research effort achieved its stated objective, which wasto advance the development of alternative civil aircraft arrest-ing systems. The research evaluated four alternatives to the
current cellular cement EMAS technology, and successfullyidentified options that can provide improved performance,lower cost, and/or higher durability.
Pursuing full development and testing of one or more ofthese candidate systems would be the next step toward obtain-ing requisite FAA approval. Once fielded, the new arrestor sys-tem would provide additional options to airport operatorsfor achieving RSA compliance. Increasing the choices avail-able would allow decision makers to select the arrestor optionthat best fits with the budgetary, climate, and space constraintsof the facility.
157

158
1. FAA. Engineered Materials Arresting Systems (EMAS) for AircraftOverruns. Washington, D.C.: Federal Aviation Administration,2005. AC 150-5220-22a.
2. Cook, R. F. Soft-Ground Aircraft Arresting Systems, Final Report.Washington, D.C.: Federal Aviation Administration, 1987. FAA/PM-87-27.
3. Cook, R. F. Evaluation of a Foam Arrestor Bed for Aircraft SafetyOverrun Areas. Dayton: University of Dayton Research Institute,1988. UDR-TR-88-07.
4. Bade, E., C. Eng, and E. M. Minter. Soft Ground Arresting of CivilAircraft: Scaled Model VC 10 Tests in Gravel and Sintered Fuel AshPellets. Farnborough, UK: Royal Aircraft Establishment, 1971. RAETechnical Report 71015.
5. White, J. C. and S. K. Agrawal. Soft Ground Arresting System for Air-ports, Final Report. Washington, D.C.: Federal Aviation Adminis-tration, 1993. CT-93-80.
6. Dole, G. R. “A Review of Computer Simulations for Aircraft-SurfaceDynamics.” Journal of Aircraft, Vol. 23, No. 4, 1986, pp. 257–265.
7. Cook, R., C. A. Teubert, and G. Hayhoe. Soft Ground Arrestor De-sign Program. Washington, D.C.: Federal Aviation Administration,1995. DOT/FAA/CT-95.
8. Heymsfield, E., W. M. Hale, and T. L. Halsey. A Parametric Sensi-tivity Analysis of Soft Ground Arrestor Systems. American Society ofCivil Engineers, 2007.
9. Stouffer, S. A Study of the Pressure and Moisture in the ESCO Ar-restor Bed at Minneapolis–St. Paul Airport. Dayton, OH: Universityof Dayton Research Institute, 2000.
10. Stehly, R. Report of Concrete Testing, Project: Engineered MaterialArresting System Minneapolis–St. Paul Airport. American Engineer-ing Testing, Inc., 2007.
11. Zodiac ESCO. EMAS MAX: Preliminary Design Report for EMASSystems at the Runway 14 and 32 Departure Ends at St. Paul Down-town Airport in St. Paul, Minnesota, Revision B 8-7-07. LoganTownship, NJ: Zodiac ESCO, 2007. Revision B 8-7-07.
12. Minneapolis–St. Paul Airport. Minneapolis–St. Paul InternationalAirport Certification Manual. Minneapolis–St. Paul, MN: 2004. pp. Section 11, 139.309 Safety Areas:11-1-11-5.
13. Rogers, C. Aggregate for Truck Arrestor Beds. Downsview, Ontario:Ministry of Transportation of Ontario, 2006.
14. Currey, N. Aircraft Landing Gear Design: Principles and Practices.Washington, D.C.: American Institute of Aeronautics and Astro-nautics, Inc., 1988.
15. Pritchard, J. “Overview of Landing Gear Dynamics.” Journal of Air-craft, Vol. 38, No. 1, 2001, pp. 130–137.
16. Chester, D. H. “Aircraft Landing Impact Parametric Study withEmphasis on Nose Gear Landing Conditions.” Journal of Aircraft,Vol. 39, No. 3, 2002, pp. 394–403.
17. Micklos, R. P. and T. Defiore. Methods for Experimentally Deter-mining Commercial Jet Aircraft Landing Parameters From VideoImage Data, Final Report. Washington, D.C.: Federal Aviation Administration, U.S. Department of Transportation, 1993. DOT-FAA-CT-93-7.
18. Tipps, D. O. et al. Side Load Factor Statistics From Commercial Aircraft Ground Operations. Washington, D.C.: Federal AviationAdministration, U.S. Department of Transportation, 2003. DOT/FAA/AR-02/129.
19. FAA. Objects Affecting Navigable Airspace. Washington, D.C.: Fed-eral Aviation Administration, 1993. CFR 14 Part 77.
20. FAA. Certification and Operations: Land Airports Serving Certain AirCarriers. Washington, D.C.: Federal Aviation Administration,1996. CFR 14 Part 139.
21. FAA. Runway Safety Area Program. Washington, D.C.: Federal Aviation Administration, 1999. Order 5200.8.
22. FAA. Runway Safety Area Status Database. Washington, D.C.: Federal Aviation Administration, 2007.
23. David, R. E. Location of Commercial Aircraft Accidents/IncidentsRelative to Runways. Washington, D.C.: Federal Aviation Admin-istration, 1990. DOT/FAA/AOV 90-1.
24. Hall, J., M. Ayres, Jr., D. Wong, A. Appleyard, M. Eddowes, H. Shi-razi, R. Speir, D. Pitfield, R. Caves, O. Selezneva, and T. Puzin.ACRP Report 3: Analysis of Aircraft Overruns and Undershoots forRunway Safety Areas. Washington, D.C.: TRB, National ResearchCouncil, 2008.
25. FAA. Introduction to Safety Management Systems (SMS) for AirportOperators. Washington, D.C.: Federal Aviation Administration,2007. AC 150/5200-37.
26. NTSB. Report ATL06IA108. Washington, D.C.: National Trans-portation Safety Board, 2006.
27. NTSB. Report NYC03IA117. Washington, D.C.: National Trans-portation Safety Board, 2003.
28. NTSB. Report NYC99FA110. Washington, D.C.: National Trans-portation Safety Board, 2000.
29. Aeronautical Information Services. Find an Airport. AirportIQ 5010:Airport Master Records and Reports. http://www.gcr1.com/5010web/.
30. FAA. Financial Feasibility and Equivalency of Runway Safety AreaImprovements and Engineered Material Arresting Systems. Washing-ton, D.C.: Federal Aviation Administration, 2004. Order 5200.9.
References

31. San Filippo, W. K. and H. DeLong. Engineered Materials ArrestingSystem (EMAS): An Alternative Solution to Runway Overruns.American Society of Civil Engineers, 2004.
32. Rastegar, J. S. and J. G. Qiaode. Roadway for Decelerating and/orAccelerating a Vehicle Including an Aircraft. U.S. Patent 6,969,213,2005.
33. Barsotti, M. A. Optimization of a Passive Aircraft Arrestor with aDepth-Varying Crushable Material Using a Smoothed Particle Hydrodynamics (SPH) Model. Graduate Thesis, University of Texasat San Antonio, 2008.
34. Angley, R. D. et al. Arresting Material Test Apparatus and Meth-ods. U.S. Patent 5,789,681, August 4, 1998.
35. Zodiac ESCO. EMAS: Design Report for Fort Lauderdale–HollywoodAirport R/W 9L. Logan Township, NJ: Zodiac ESCO, 2005.
36. Pittsburgh Corning. Brochure: FOAMGLAS Insulation. PittsburghCorning, 2005. Number FG-3 20M. Rev 11/05.
37. Norsk Glassgjenvinning AS. Brochure: Glasopor, Konstruksjonspel-lets for framtiden, Produktinfo. Norsk Glassgjenvinning AS, 2006.
38. Norsk Glassgjenvinning AS. Glasopor Product Specification. 180107.Norsk Glassgjenvinning AS, n.d.
39. Bell, N., Y. Yu, and P. J. Mucha. Particle-Based Simulation of Gran-ular Materials. Eurographics/ACM SIGGRAPH Symposium onComputer Animation, 2005.
40. Zodiac ESCO. Energy Absorbers. Zodiac ESCO. http://www.esco.zodiac.com/index.cfm/navid-30. Accessed July 1, 2009.
41. Zodiac ESCO. Barrier Nets. Zodiac ESCO. http://www.esco.zodiac.com/index.cfm/navid-98. Accessed July 1, 2009.
42. Boeing. 737 Airplane Characteristics for Airport Planning. Renton,WA: The Boeing Company, 2005.
43. Norsk Glassgjenvinning AS. Glasopor. http://www.glasopor.no.44. FAA. Airworthiness Standards: Transport Category Airplanes. Wash-
ington, D.C.: Federal Aviation Administration, 1997. CFR 14 Part 25.45. Stapp, J. P. “Human Tolerance to Deceleration.” American Journal
of Surgery, 93(4), April 1957, pp. 734–40.46. Latham, F. “Linear Deceleration Studies and Human Tolerance.”
Clin. Sci. (Lond.), 17(1), February 1958, pp. 121–35.47. Lewis, S. T. and J. P. Stapp. “Human Tolerance to Aircraft Seat Belt
Restraint.” J. Aviat. Med., 29(3), March 1958, pp. 187–96.
48. Hendler, E. “Linear Acceleration as a Survivable Hazard in Avia-tion.” J. Aviat. Med., 27(6), December 1956, pp. 495–501.
49. DeWeese, R. L. and D. M. Moorcraft. Evaluation of a Head InjuryCriteria Component Test Device. Washington, D.C.: Office of Aero-space Medicine, 2004. DOT/FAA/AM-04/18.
50. Moseley, H. G. and A. F. Zeller. “Relation of Injury to Forces andDirection of Deceleration in Aircraft Accidents.” J. Aviat. Med.,2(10), October 1958, pp. 739–49.
51. NHTSA. Federal Motor Vehicle Safety Standards: Occupant CrashProtection. Washington, D.C.: National Highway TransportationSafety Administration, Undated. 49 CFR Part 571.208.
52. FAA. Federal Aviation Regulation, Airworthiness Standards: Trans-port Category Airplanes. Washington, D.C.: Federal Aviation Ad-ministration, Undated. CFR 14 Section 25.662.
53. Zuidema, G. D. et al. “Human Tolerance to Prolonged Accelera-tion.” J. Aviat. Med., 27(6), December 1956, pp. 469–481.
54. U.S. National Library of Medicine. Ventricular Tachycardia. MedlinePlus. http://www.nlm.nih.gov/medlineplus/ency/article/000187.htm.
55. Stapp, J. P. “Human Tolerance to Deceleration: Summary of 166Runs.” J. Aviat. Med., 22(1), February 1951, pp. 42–5.
56. Stapp, J. P. “Effects of Mechanical Force on Living Tissue.” J. Aviat.Med., 26(4), August 1955, pp. 268–88.
57. Krishnamurthy, A. Current Concepts in Acceleration Physiology.India Society of Aerospace Medicine. www.isam-india.org.
58. Preston-Thomas, H. et al. “Human Tolerance to Multistage RocketAcceleration Curves.” J. Aviat. Med., 26(5), October 1955, pp. 390–98.
59. Zuidema, G. D. et al. “Human Tolerance to Prolonged Acceleration.”J. Aviat. Med., 27(6), December 1956, pp. 469–481.
60. Goodyear. Aircraft Tire Data Book. Akron, OH: Goodyear Tire &Rubber Company, 2007.
61. Brockman, R. A. and W. R. Braisted. “Critical Speed Estimation forAircraft Tires.” Tire Science and Technology, Vol. 22, No. 2, 1994,pp. 121–144.
62. Stander, N. and W. Roux. LS-OPT Training Class, Optimizationand Robust Design Using LS-OPT and LS-DYNA. Detroit, MI:Livermore Software Technology Corporation, 2008.
63. Cook, R., C. A. Teubert, and G. Hayhoe. Soft Ground Arrestor DesignProgram. Washington, D.C.: Federal Aviation Administration, 1995.
159

160
A.1. Accidents and IncidentsDavid, R. E. Location of Commercial Aircraft Accidents/Incidents Relative
to Runways. Washington, D.C.: Federal Aviation Administration,1990. DOT/FAA/AOV 90-1.
Hall, J., M. Ayres, Jr., D. Wong, A. Appleyard, M. Eddowes, H. Shirazi,R. Speir, D. Pitfield, R. Caves, O. Selezneva, and T. Puzin. ACRPReport 3: Analysis of Aircraft Overruns and Undershoots for RunwaySafety Areas. Washington, D.C.: TRB, National Research Council,2008.
NTSB. Hard Landing, Gear Collapse Federal Express Flight 647 BoeingMd-10-10f, N364fe Memphis, Tennessee, December 18, 2003: NationalTransportation Safety Board, 2003.
A.2. AircraftBoeing. 737 Airplane Characteristics for Airport Planning. Renton, WA:
The Boeing Company, 2005.Boeing. Minimizing the Impact of Runway Arresting Systems on Com-
mercial Airplane Operations., ed. Brad Bachtel: Renton, WA: TheBoeing Company.
Bruhn, E. F. Analysis and Design of Flight Vehicle Structures. ed. R. J. H.Bollard, L. E. Hackman, G. Lianis, W. F. McCombs, A. F. Schmitt,C. R. Smith, and J. A. Wolf: S. R. Jacobs & Associates, Inc., 1973.
Spieck, M. Simulation of Aircraft Landing Impact Under Considerationof Aerodynamic Forces on the Flexible Structure. Paper presented at the10th AIAA/ISSMO Multidisciplinary Analysis and OptimizationConference, Albany, New York 2004.
A.3. ArrestorsCook, R. F. Soft-Ground Aircraft Arresting Systems, Final Report.
Washington, D.C.: Federal Aviation Administration, 1987. FAA/PM-87-27.
Cook, R. F. Evaluation of a Foam Arrestor Bed for Aircraft Safety Over-run Areas. Dayton: University of Dayton Research Institute, 1988.UDR-TR-88-07.
Heymsfield, E., W. M. Hale. and T. L. Halsey. A Parametric SensitivityAnalysis of Soft Ground Arrestor Systems. 2007.
Rogers, C. Aggregate for Truck Arrestor Beds. Downsview, Ontario:Ministry of Transportation of Ontario, 2006. ISBN 1424959152.
San Filippo, W. K. and H. DeLong. Engineered Materials ArrestingSystem (EMAS): An Alternative Solution to Runway Overruns. 2004,ASCE/Air Transport.
White, J. C. and S. K. Agrawal. Soft Ground Arresting System for Airports,Final Report. Washington, D.C.: Federal Aviation Administration,1993. CT-93-80.
A.4. FAA DocumentsAircraft Arresting Systems on Civil Airports. Washington, D.C.: Federal
Aviation Administration, 2006. AC 150/5220-9a.Engineered Materials Arresting Systems (EMAS) for Aircraft Overruns.
Washington, D.C.: Federal Aviation Administration, 2005. AC150-5220-22a.
Financial Feasibility and Equivalency of Runway Safety Area Improvementsand Engineered Material Arresting Systems. Washington, D.C.:Federal Aviation Administration, 2004. Order 5200.9.
Runway Safety Area Program. Washington, D.C.: Federal AviationAdministration, 1999. Order 5200.8.
Certification and Operations: Land Airports Serving Certain Air Carriers:Washington, D.C.: Federal Aviation Administration, 1996. CFR 14Part 139.
Objects Affecting Navigable Airspace: Washington, D.C.: Federal AviationAdministration, 1993. CFR 14 Part 77.
Airport Design: Washington, D.C.: Federal Aviation Administration,1989. AC 150/5300-13.
Introduction to Safety Management Systems (SMS) for Airport Operators.Washington, D.C.: Federal Aviation Administration, 2007. AC 150/5200-37.
Runway Safety Area Status Database. Washington, D.C.: Federal AviationAdministration, 2007.
A.5. Human InjuryDeWeese, R. L. and D. M. Moorcraft. Evaluation of a Head Injury Criteria
Component Test Device. Washington, D.C.: Office of AerospaceMedicine, 2004. DOT/FAA/AM-04/18.
Hendler, E. Linear Acceleration as a Survivable Hazard in Aviation.27(6), December 1956, J. Aviat. Med., pp. 495–501.
Latham, F. Linear Deceleration Studies and Human Tolerance. 17(1),Feb 1958, Clin Sci (Lond), pp. 121–35.
Lewis, S. T. and J. P. Stapp. Human Tolerance to Aircraft Seat BeltRestraint. 29(3), March 1958, J. Aviat. Med., pp. 187–96.
Moseley, H. G. and A. F. Zeller. Relation of Injury to Forces and Direc-tion of Deceleration in Aircraft Accidents. 2(10), Oct 1958, J. Aviat.Med., pp. 739–49.
A P P E N D I X A
Bibliography

161
Preston-Thomas, H. et al. Human Tolerance to Multistage RocketAcceleration Curves. 26(5), October 1955, J. Aviat. Med., pp. 390–98.
Stapp, J. P. Human Tolerance to Deceleration. 93(4), April 1957,American Journal of Surgery, pp. 734–40.
Stapp, J. P. Human Tolerance to Deceleration: Summary of 166 Runs.22(1), February 1951, J. Aviat. Med., pp. 42–5.
Stapp, J. P. Effects of Mechanical Force on Living Tissue. 26(4), August1955, J. Aviat. Med., pp. 268–88.
Zuidema, G. D. et al. Human Tolerance to Prolonged Acceleration.27(6), December 1956, J. Aviat. Med., pp. 469–481.
Zuidema, G. D. et al. Human Tolerance to Prolonged Acceleration.27(6), December 1956, J. Aviat. Med., pp. 469–481.
A.6. Landing GearBatill, S. M., and J. M. Bacarro. Modeling and Identification of Nonlinear
Dynamic Systems With Application to Aircraft Landing Gear. AIAA(1988).
Chester, D. H. Aircraft Landing Impact Parametric Study With Emphasison Nose Gear Landing Conditions. Journal of Aircraft 39, no. 3 (2002):394–403.
Collins, R. L. Theories on the Mechanics of Tires and Their Applicationsto Shimmy Analysis. Journal of Aircraft 8, no. 4 (1971): 271–277.
Currey, N. S. Aircraft Landing Gear Design: Principles and Practice AIAAEducation Series. ed. J. S. Przemieniecki: American Institute ofAeronautics and Astronautics, 1988.
Holzapfel, F., R. Leitner and G. Sachs. High Fidelity Landing GearModeling for Real-Time Simulation. Paper presented at the AIAAModeling and Simulation Technologies Conference and Exhibit,Keystone, Colorado 2006.
Kilner, J. R. Pneumatic Tire Model for Aircraft Simulation. Journal ofAircraft 19, no. 10 (1982): 851–857.
Lee, C. R., J.-W. Kim, J. O. Hallquist, Y. Zhang, and A. D. Farahani.Validation of a FEA Tire Model for Vehicle Dynamic Analysis andFull Vehicle Real Time Proving Ground Simulations. SAE PaperNumber 971100 (2005).
Pacejka, H. B. Tire and Vehicle Dynamics. 2nd ed.: Society of AutomotiveEngineers, 2006.
Pritchard, J. Overview of Landing Gear Dynamics. Journal of Aircraft 38,no. 1 (2001): 130–37.
Wahi, M. K. Oleopneumatic Shock Strut Dynamic Analysis and Its Real-Time Simulation. Journal of Aircraft 13, no. 4 (1976): 303–8.
Wong, J. Y. Theory of Ground Vehicles. 3rd ed. New York, NY: JohnWiley and Sons, Inc., 2001.
York, B. W. and O. Alaverdi. A Physically Representative Aircraft Land-ing Gear Model for Real-Time Simulation A96-35001 09-01. Paperpresented at the AIAA Flight Simulation Technologies Conference,San Diego, CA 1996.
A.7. Material ScienceStehly, R. D. Report of Concrete Testing, Project: Engineered Material
Arresting System Minneapolis/St. Paul Airport.: American EngineeringTesting, Inc., 2007, 05-03306.
Stouffer, S. A Study of the Pressure and Moisture in the ESCO ArrestorBed at Minneapolis–St. Paul Airport on June 22, 2000; Interim DataReport.: University of Dayton Research Institute, 2000.
A.8. Modeling and Simulation
Bell, N., Y. Yu and P. J. Mucha. Particle-Based Simulation of GranularMaterials. Paper presented at the Eurographics/ACM SIGGRAPHSymposium on Computer Animation, 2005.
Cook, R., C. A. Teubert, and G. Hayhoe. Soft Ground Arrestor DesignProgram: FAA, U.S. Department of Transportation, 1995.
Dole, G. R., Jr. A Review of Computer Simulations for Aircraft-SurfaceDynamics. Journal of Aircraft 23, no. 4 (1986): 257–265.
Nezami, E. G., Y. M. A. Hashash, D. Zhao, and J. Ghaboussi. Simulationof Front End Loader Bucket–soil Interaction Using Discrete ElementMethod. International Journal for Numerical and Analytical Methodsin Geomechanics, no. 31 (2007): 1147–62.
Pi, W. S. Dynamic Tire/soil Contact Surface Interaction Model forAircraft Ground Operations. Journal of Aircraft 25, no. 11 (1987):1038–44.
A.9. Patents
Allen, G., R. D. Angley, J. L. Gordon, P. T. Mahal, and S. C. Valentini.Jet Blast Resistant Vehicle Arresting Blocks, Beds and Methods.United States Patent 6,971,817, 2005.
Angley, R. D., M. S. Ciesielski, C. T. Dial, P. T. Mahal, and R. F. Cook.Vehicle Arresting Bed Systems. United States Patent 6,726,400, 2004.
Angley, R. D., M. S. Ciesielski, C. T. Dial, P. T. Mahal, and R. F. Cook.Arresting Material Test Apparatus and Methods. United StatesPatent 5,789,681, 1998.
Cobb, L. C. and T. J. Hirsch. Roadway Barrier. United States Patent5,054,954, 1991.
Larratt, D. R. et al., Aircraft Arresting System, United States Patent5,193,764, 1993.
Ogden, D. H. Vehicle Deceleration Means, United States Patent3,967,704, 1976.
Rastegar, J. S. and J. Qiaode. Roadway for Decelerating and/or Acceler-ating a Vehicle Including an Aircraft. United States Patent6,969,213, 2005.
Schirtzinger, J. F. Method and Means for Decelerating Aircraft on Run-ways. United States Patent 3,066,896, 1962.

162
B.1. Survey of U.S. AirportOperators
A copy of the survey submitted to the sixteen airports thatparticipated in the Survey of U.S. Airport Operators, dis-cussed in Chapter 3, is provided in this section. Furthermore,the responses of the airports are given in summary form. Insome cases, the fields from the surveys contained sparse orunusable information. In other cases, fields included lengthy
verbal commentary that could not be included in the tabularform. In both cases, such fields were not included in the tablessummarizing the response of the airports. Cost informationwas omitted.
B.1.1. Copy of Survey
Given in pages following.
A P P E N D I X B
Survey Details

163
Airport Information
1. Facility name 2. Location ID
3. Facility Address (City, State, Zip)
4. ARFF Index A B C D E
5. Number of annual operations
6. Approach Precision Non-precision
7. Navaids (ILS)
CAT I CAT II and above
Point of Contact Information Point of Contact 1
1. Name: 2. Telephone: 3. Email: 4. What is your position/job title?
5. List the areas of airport management you are involved with:
Maintenance Airport operations Engineering General Management
6. How long have you worked in this position? (yr) (mo)
7. How long have you worked in this industry? (yr) (mo)
Point of Contact 2
1. Name: 2. Telephone: 3. Email: 4. What is your position/job title?
5. List the areas of airport management you are involved with:
Maintenance Airport operations Engineering General Management

164
6. How long have you worked in this position? (yr) (mo)
7. How long have you worked in this industry? (yr) (mo)
Point of Contact 3
1. Name: 2. Telephone: 3. Email: 4. What is your position/job title?
5. List the areas of airport management you are involved with:
Maintenance Airport operations Engineering General
Management
6. How long have you worked in this position? (yr) (mo)
7. How long have you worked in this industry? (yr) (mo)
Facility Questions 1. Is the airport land-locked by bodies of water, drop offs, highways,
railroads, or buildings, which would prevent extension of the runway safety areas to satisfy FAA RSA requirements?
Yes No
2. If yes to previous, how many runways ends are affected?
3. Does the airport have declared distances? Yes No
4. If yes to previous, which runways?

Questions for Facilities with EMAS ArrestorsGeneral
1. How many EMAS arrestors are at the facility?
2. What are the EMAS arrestors dimensions and performance levels? Runway
DesignationSet Back from Runway End
(ft)
BedDimensions
(ft)
Aircraft Exit Speed
EMASArrestor 1
Length:
Width:
EMASArrestor 2
Length:
Width:
EMASArrestor 3
Length:
Width:
70 knots (standard) Less than 70 knots
70 knots (standard) Less than 70 knots
70 knots (standard) Less than 70 knots
3. What is it about this facility that makes EMAS necessary?
4. Were alternatives to the EMAS arrestor considered? (Declared Distances, shortening runways, etc)
Yes No
5. If yes to previous, why was the EMAS approach chosen?
6. What are the negative traits of the EMAS arrestor?
7. What are the positive aspects of the EMAS arrestor?
8. If there were one thing that could be changed about the EMAS arrestor, what would it be?
165

166
Installation
1. What was the time and cost associated with installing each of the EMAS arrestors at your facility? (estimates are sufficient)
Year Installed
Per Runway End Cost ($M)
Preparatory Paving Cost
($M)
Time to Install (days)
EMAS Arrestor
1 $0.00 $0.00
EMAS Arrestor
2 $0.00 $0.00
EMAS Arrestor
3 $0.00 $0.00
2. Were there any special installation conditions (night-only, limited hours per day, etc)?
3. Installation inconvenience:
1 2 3 4 5 (None) (Severe)
Maintenance & Repair
Which of the following maintenance issues have the EMAS arrestors experienced and to what degree? 1. Peeling paint
1 2 3 4 5 (None) (Severe)
2. Leaching of the material (chalky white)
1 2 3 4 5 (None) (Severe)
3. Caulking failure
1 2 3 4 5 (None) (Severe)
4. Joint tape debonding
1 2 3 4 5 (None) (Severe)
5. Soft tops
1 2 3 4 5
(None) (Severe)

167
6. Drainage problems
1 2 3 4 5 (None) (Severe)
7. Has your facility undertaken substantial repairs beyond scheduled maintenance?
Replacement of blocks Substantial joint re-sealing/replacement Substantial repainting Other None
8. If yes to previous, have the repairs conducted been due to a deficiency in scheduled/expected maintenance?
Yes No
9. Has the EMAS arrestor been out of service (NOTAM) due to damage from an overrun by aircraft or ground vehicle?
Yes No
10. If yes to previous, how long did it take to repair the EMAS arrestor to service condition?
(mos)
11. What type of maintenance agreement/approach is the facility using for the EMAS arrestor?
Maintenance contract with ESCOUse of local contractors
Use of facility maintenance personnel
12. What do you estimate is the annual maintenance and repair cost for the EMAS arrestor (including maintenance agreement, if applicable)?
$0.00
Performance
1. Perception: do you believe your current EMAS arrestor will likely perform to original specifications if it arrested an aircraft today?
Yes No No Opinion
2. What aircraft type and speed is the EMAS arrestor system designed to arrest?
Aircraft 1 Speed (knots)
Aircraft 2 Speed (knots)
Aircraft 3 Speed (knots)
Aircraft 4 Speed (knots)

168
Questions for Facilities without EMAS Arrestors 1. Do all of your runways meet the FAA’s RSA requirements
(e.g., nominal 1000’ length and 500’ width)? Yes No
2. Is your facility planning to install an EMAS arrestor in the future?
Yes No
If yes, how soon? (mo) How many? (qty)
3. Is the cost of an EMAS arrestor ($2M to $5M per runway end) too high for your facility to reasonably afford to install arrestors?
Yes No N/A
4. What factors have prevented your facility from installing an EMAS arrestor? Cost Maintenance Other construction projects Lack of need Other
Questions for All Facilities 1. How would you rate the need of your facility for an
arrestor system: Low Moderate High
2. Has your facility experienced overruns in the past 5 years?
Low risk, slight overrun QTY:
High risk, substantial overrun QTY:
3. If a new system could be developed for the future, would lower cost or better stopping performance be more important to your facility?
Lower Cost Improved Performance Both Neither would matter
4. Does your facility use active arrestor systems for military aircraft?
Yes No
5. Would you feel comfortable with a net-based or cable-based arrestor system for civil aircraft?
Not Comfortable Low Moderate Highly Comfortable
6. If yes to question 4, what comments do you have regarding: Cost, Performance, Reliability, and Maintenance?
7. Do you consider the FAA requirements for airports regarding RSA dimensions too rigid?
Yes No No Opinion
8. Do you consider the FAA requirements for airports regarding arrestor bed performance too rigid?
Yes No No Opinion
9. If yes to previous, what changes should be made to existing requirements?
10. Do you have any other comments?

Airport Name
Anchorage International
Baton Rouge Metropolitan
Boston Logan International
Denver International
Minneapolis–St. Paul International
Nashville International
New York Kennedy International
New York La Guardia Airport
Pittsburgh International
Roanoke Regional
San Diego International
Seattle Tacoma International
Teterboro
Washington National
Location ID
ANC
BTR
BOS
DEN
MSP
BNA
JFK
LGA
PIT
ROA
SAN
SEA
TEB
DCA
City
Anchorage, AK
Baton Rouge, LA
East Boston, MA
Denver, CO
Minneapolis, MN
Nashville, TN
New York, NY
New York, NY
Pittsburgh, PA
Roanoke, VA
San Diego, CA
Seattle, WA
Teterboro, NJ
Washington, D.C.
ARFFIndex
E
C
E
E
E
C
E
D
D
B
D
E
E
C
Precision
Yes
Yes
No
Yes
Yes
Yes
Yes
Yes
Yes
Yes
Yes
Yes
Yes
Yes
Non-precision
Yes
No
No
No
No
No
No
No
No
Yes
Yes
No
No
No
AnnualOperations
289,472
94,852
409,066
586,151
475,000
215,830
411,145
404,990
237,696
86,091
220,485
340,058
250,000
278,151
Table B-1. Selected data from survey of U.S. airport operators.
169
(continued on next page)

170
Airport Name CAT I only
CAT II and
above
Land-locked
runways
No. land-lockedrunway
ends
Declared distances
Runways with
declareddistances
Anchorage International
Yes Yes No 0 No
Baton Rouge Metropolitan
Yes No Yes 4 Yes 4L-22R, 4R-22L,13-31
Boston Logan International
No No Yes 5 No
Denver International Yes Yes No 0 Yes 8, 34R, 25
Minneapolis–St. Paul International
No Yes Yes 8 Yes 12L
Nashville International Yes No Yes 2 Yes 1331
New York Kennedy International
Yes Yes Yes 3 No
New York La Guardia Airport
Yes No Yes 2 No
Pittsburgh International No Yes Yes 1 Yes 28R
Roanoke Regional Yes No Yes 3 Yes 24
San Diego International Yes No Yes 2 Yes 9, 27
Seattle Tacoma International
No Yes No 0 Yes All
Teterboro Yes No Yes 2 No
Washington National Yes No Yes 4 No
Table B-1. (Continued).
(continued)

171
Airport Name No. EMAS Arrestors
EMAS 1 R/W
Designation
EMAS 1 Set Back
[ft]
EMAS 1 Length
[ft]
EMAS 1 Width [ft]
EMAS 1 Standard 70 knots
Anchorage International
0
Baton Rouge Metropolitan
1 31 75 300 150 Yes
Boston Logan International
2 4L 5 190 170 No
Denver International 0
Minneapolis–St. Paul International
1 12R 630 160 216 Yes
Nashville International 0
New York Kennedy International
2 4R 35 392 200 No
New York La Guardia Airport
2 22 35 275 170 No
Pittsburgh International 0
Roanoke Regional 1 33 300 299 169 Yes
San Diego International 1 27 65 315 218 No
Seattle Tacoma International
0
Teterboro 1 24 35 251 170 No
Washington National 0
Table B-1. (Continued).
(continued on next page)

172
Airport Name EMAS 2 R/W Designation
EMAS 2 Setback [ft]
EMAS 2 Length [ft]
EMAS 2 Width [ft]
EMAS 2 Standard 70
knots?
Anchorage International
Baton Rouge Metropolitan
Boston Logan International
15R 15 158 170 No
Denver International
Minneapolis–St. Paul International
Nashville International
New York Kennedy International
22L 35 405 227 Yes
New York La Guardia Airport
13 41 327 170 No
Pittsburgh International
Roanoke Regional
San Diego International
Seattle Tacoma International
Teterboro
Washington National
Table B-1. Selected data from survey of U.S. airport operators.
(continued)

173
Table B-2. The comments of respondents were discussed inSection 3.8.2.
Organization No. people contacted Survey returned
A.A.A.E. 2 No
South Central A.A.A.E. 1 No
I.C.A.O. 3 Yes
A.C.I. 1 No
A.L.P.A. 2 No
A.O.P.A. 1 No
Flight Safety Foundation 2 Yes
Flag Air Carriers/Delta 1 No
U.S. Airways 3 No
Southwest Airlines 1 No
United Airlines 2 No
F.A.A./F.S.D.O. 3 No
Aviation consultant 1 Yes
Table B-2. Aviation organizations.
B.2. Other Aviation Organizations
The names of aviation organizations, number of individu-als contacted from each, and their survey status are shown in
174
Appendix C provides the technical details of calcula-tions supporting the EMAS sensitivity analysis discussed inChapter 5.
C.1. Data
The data for the EMAS performance calculations wereobtained from the manufacturer. Specifically, the manufac-turer conducted three simulations of an arrest using in-housesoftware. The three cases were distinguished by the type ofaircraft used. The three types of aircraft were a CRJ 200 ER,B737-800, and B747-400. For all cases, the exit speed was70 knots; the compressive strength of the material was 60 psi;the setback was 35 ft; there was no reverse thrust; and therewas a braking friction coefficient of 0.25. Given these initialconditions, the length of the bed was minimized. Plots of air-craft speed with respect to nose-gear travel were provided.
C.2. Calculations
C.2.1. Performance of an EMAS
In order to characterize the performance of aircraft withinthe EMAS bed, for each given design case, a total of 10 to 15 datapoints were extracted from the manufacturer plots once theaircraft had entered the bed. That is, the initial point in theplots was the point at which the aircraft entered the bed.
These extracted data points were plotted discretely and apolynomial trend line was fitted to the discrete data. The poly-nomial trend line was then used to generate points of aircraftspeed and aircraft travel in the bed for an arbitrary aircrafttravel step. Elementary kinematic relations were applied overeach travel step to obtain deceleration of the aircraft. The datawith a trend line and extracted deceleration profile for theB737-800 are shown in Figure C-1 (a) and (b) respectively.
Deceleration due to braking in the setback area and reversethrust during the arrest were added to the deceleration due to
the EMAS bed. Thus, it was possible to estimate the speedprofile for any setback, braking coefficient of friction, andreverse thrust. Reverse thrust in such cases was simply takenas a lumped deceleration value. This value was varied to observethe sensitivity of the response and to determine the criticalityof the assumed reverse thrust level. At 70 knots and lower, thereverse thrust contribution is generally minimal. Therefore, inall comparative calculations, the standard assumption of zeroreverse thrust was used.
A plot of exit speed with respect to stopping distance wasobtained from a plot of the absorbed energy. That is, the forceapplied to the aircraft by braking, reverse thrust, and EMASbed engagement was obtained from the resultant decelerationprofile of the aircraft and its MTOW. This profile was thennumerically integrated to obtain the energy absorbed duringthe arrest. For every quantity of absorbed energy there was acorresponding stopping distance. The absorbed energy wasset equal to the kinetic energy of the aircraft at its exit fromthe runway, as shown in Equation C-1. In order to extendthe domain of exit speed to 80 knots, the steady-state por-tion of the absorbed energy curve was linearly extended to anabsorbed energy corresponding with 80-knot exit speed. Theresultant absorbed energy profile for the B737-800 is shownin Figure C-2. Figure C-3 shows stopping distance with respectto exit speed for the three design aircraft.
m = mass of aircraftv = aircraft exit speed
F(x) = instantaneous force applied to the aircraft as func-tion of position
L = distance required to arrest the aircraft
For a given bed width and setback, the cost of an EMASwas calculated as a function of stopping distance, or, put
1
22
0
mv F x dxL
= ( )∫ (Equation C-1)
A P P E N D I X C
EMAS Calculations

175
Figure C-1. (a) Speed and (b) deceleration profile of B737-800 in EMAS bed.
Figure C-2. Energy vs. exit speed for B737-800.
Figure C-3. Stopping distance vs. exit speed for three aircraft.
0
20
40
60
80
100
120
140
0 50 100 150 200 250 300 350
Spe
ed [f
t/s]
Bed Nose Gear Travel [ft]
Data Poly. (Data)
0.0
0.2
0.4
0.6
0.8
1.0
0
5
10
15
20
25
30
0 50 100 150 200 250 300 350
Dec
eler
atio
n [g
's]
Dec
eler
atio
n [ft
/s^2
]
Bed Nose Gear Travel [ft]
(a) (b)
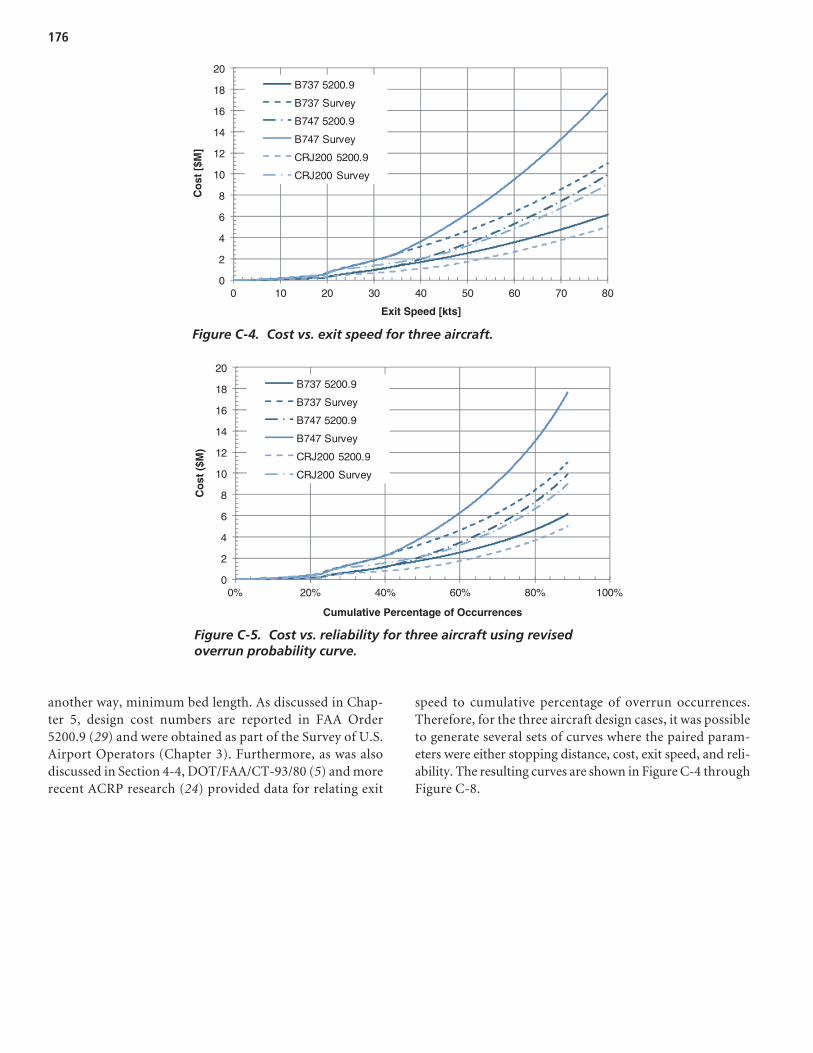
176
another way, minimum bed length. As discussed in Chap-ter 5, design cost numbers are reported in FAA Order5200.9 (29) and were obtained as part of the Survey of U.S.Airport Operators (Chapter 3). Furthermore, as was alsodiscussed in Section 4-4, DOT/FAA/CT-93/80 (5) and morerecent ACRP research (24) provided data for relating exit
speed to cumulative percentage of overrun occurrences.Therefore, for the three aircraft design cases, it was possibleto generate several sets of curves where the paired param-eters were either stopping distance, cost, exit speed, and reli-ability. The resulting curves are shown in Figure C-4 throughFigure C-8.
Figure C-4. Cost vs. exit speed for three aircraft.
Figure C-5. Cost vs. reliability for three aircraft using revisedoverrun probability curve.
0
2
4
6
8
10
12
14
16
18
20
0 10 20 30 40 50 60 70 80
Co
st [
$M]
Exit Speed [kts]
B737 5200.9
B737 Survey
B747 5200.9
B747 Survey
CRJ200 5200.9
CRJ200 Survey
0
2
4
6
8
10
12
14
16
18
20
0% 20% 40% 60% 80% 100%
Co
st (
$M)
Cumulative Percentage of Occurrences
B737 5200.9
B737 Survey
B747 5200.9
B747 Survey
CRJ200 5200.9
CRJ200 Survey

Figure C-6. Cost vs. reliability for three aircraft using CT-93/80overrun probability curve.
Figure C-7. Stopping distance vs. reliability for three aircraft usingrevised overrun probability curve.
Figure C-8. Stopping distance vs. reliability for three aircraft usingCT-93/80 overrun probability curve.
0
2
4
6
8
10
12
14
16
18
20
0% 20% 40% 60% 80% 100%
Co
st (
$M)
Cumulative Percentage of Occurrences
B737 5200.9
B737 Survey
B747 5200.9
B747 Survey
CRJ200 5200.9
CRJ200 Survey
0
100
200
300
400
500
600
700
800
0% 20% 40% 60% 80% 100%
Sto
pp
ing
Dis
tan
ce (
ft)
Cumulative Percentage of Occurrences
B737
B747
CRJ200
0
100
200
300
400
500
600
700
800
0% 20% 40% 60% 80% 100%
Sto
pp
ing
Dis
tan
ce (
ft)
Cumulative Percentage of Occurrences
B737
B747
CRJ200
178
This appendix supplies the technical details supporting theassessment of the cable-based arrestor in Section 7.7.
D.1. Mechanical Parameters
The mechanical input parameters considered in the cable-based arrestor sensitivity analysis and associated output param-eters are shown in Table D-1. The geometry parameters—distance between the brake units and slack in the cable—influenced the loading on the main landing gear by changingthe angle θ. The limiting lateral and longitudinal loads weredetermined from FAR part 25 for a Boeing 737-800 (44).
D.2. Dynamics
Figure D-1 shows a cable-based arrest in which the tensionin the cable is Tc1. Figure D-2 is a detail of the main landing gearengaged by the cable with tension Tc1. The load in the cablebetween the main gear struts is Tc2. The lateral load on the land-ing gear strut is the transverse resultant of Tc1 and Tc2, and thetransverse resultant depends on the coefficient of frictionbetween the cable and the strut. As the distance from the arrest-ing engines increases, the angle θ decreases. As θ decreases, theprojection of Tc1 on the transverse axis decreases, causing moreof the load from Tc2 to be resisted only by the strut.
D.3. Calculation Methodology
The cable arresting simulations were performed usingMicrosoft Excel™, in a time-marching transient calculation.
After an assumed transient, linear increase in the tension ofthe arresting cable, the tension in the cable was determined bytaking the equilibrium of one of the struts (Figure D-2). Thelongitudinal load on the strut was assumed to be the FAR 25limiting load. The aircraft was stepped through the arrestlength in 0.5-ft increments, and the tension in the cable wasdetermined by equilibrium at each position. The tension in thecable decreased as the aircraft stepped through the arrest length
because θ decreased with each arrest length increment. Equi-librium of the entire aircraft provided the deceleration of theaircraft at each step. That deceleration was used to determinethe speed at each step. This iterative process was continueduntil the speed of the aircraft was zero.
This iterative process was performed for numerous cases ofthe inputs listed in Table D-1. Of particular interest was theeffect of the coefficient of friction between the cable and thestrut on the lateral load applied to the strut. The lateral load wasdetermined using the equilibrium of the strut and the bearingfriction equation.
D.4. Interface Friction Study
A simulation was developed to determine whether, for a typ-ical arrest case, the lateral load on the landing gear would reacha limiting value. Preliminary simulations showed that if themaximum tension in the cable were kept below a critical value,the lateral load on the landing gear remained below the limitinglateral load, implied by FAR part 25, regardless of the strut-cablecoefficient of friction (44). This fact is illustrated in Figure D-3.For a braking coefficient of 0.25 and no reverse thrust, simula-tions were run for a B737-800 in which the strut-cable coeffi-cient of friction was varied and the maximum lateral load onthe landing gear was recorded. These maximum lateral loadswere normalized by the limiting lateral load. As shown in Fig-ure D-3, the maximum lateral load nearly reached 90% of thelimiting lateral load for a strut-cable coefficient of friction ofapproximately 0.7. Therefore, on the basis of preliminaryinvestigation, if the maximum tension in the cable is limitedto the critical value, lateral collapse of the landing gear can beprevented.
D.5. Load and DecelerationHistories
For a given set of input parameters, the speed and deceler-ation profiles for the aircraft were determined in the follow-ing way. A limiting deceleration of the aircraft was assumed.
A P P E N D I X D
Active Arrestor Calculations

179
Table D-1. Cable-based arrestor sensitivity analysisparameters.
Input Parameters to Vary Output Parameters from Models
Exit speed – arbitrary
Geometry
• Distance between brake units
• Slack in cable
Maximum tension in cable
Strut-cable coefficient of friction
Aircraft type – B737-800
• Limiting lateral load
• Limiting longitudinal load
Aircraft braking condition
• Braking
• Skidding
• Free-rolling
Reverse thrust – arbitrary
Stopping distance
Max lateral load
Max longitudinal load
Primary Tension
Primary Tension
Landing Gear
BrakingUnit
BrakingUnit
Figure D-1. Cable-based arrest of aircraft with tension in cable Tc1.
Tc1
Tc2
Figure D-2. Detailof cable and lateralloads on main gearstrut.
Two sources of limiting deceleration were the commonlyassumed 1-g deceleration to prevent occupant injury and thelimiting longitudinal load on the main gear, caused by boththe engaged cable and braking. Preliminary investigationrevealed that the limiting longitudinal load controlled. Oncea limiting deceleration was inferred, dynamic equilibriumwas imposed on the aircraft, and the tension in the cable wasdetermined. A reasonable limit was then imposed on themaximum tension in the cable. Linear interpolation from atension of zero at the runway exit point to the point of max-imum tension was used to generate a resultant tension in thecable. The resultant curve for tension in the cable is shown inFigure D-4 (a). All forces in the plots were normalized by

180
the MTOW of the aircraft. Thus, the primary vertical axis islabeled “Force Ratio.”
Figure D-4 (b) shows the normalized forces of Tc2, the ten-sion in the cable between the main gear landing struts as illus-trated in Figure D-2, and the lateral and longitudinal loadingon the main gear. Tc2 was obtained from Tc1 using the bearing
friction equation. The lateral and longitudinal loads wereobtained by taking the equilibrium of the strut. The forceratios shown in Figure D-4 (b) were obtained using a strut-cable coefficient of friction of 0.40 to illustrate force ratiotrends. Furthermore, the braking coefficient was 0.25 with noreverse thrust.
0.0
0.1
0.2
0.3
0.4
0.5
0.6
0.7
0.8
0.9
1.0
0.0 0.1 0.2 0.3 0.4 0.5 0.6 0.7 0.8 0.9 1.0
Nor
mal
ized
Lat
eral
Loa
d
Strut-Cable Coefficient of Friction
Braking Coefficient = 0.25R/T = 0
0
10
20
30
40
50
60
70
80
-0.2
0.0
0.2
0.4
0.6
0.8
1.0
0 50 100 150 200 250 300 350
Spe
ed [k
ts]
For
ce R
atio
Nose Gear Travel [ft]
Tc1 ResultantTc2LateralLongitudinalSpeed
0
10
20
30
40
50
60
70
80
0.0
0.4
0.8
1.2
1.6
2.0
0 50 100 150 200 250 300 350
Spe
ed [k
ts]
For
ce R
atio
Nose Gear Travel [ft]
(b)(a)
Tc1 EquilibriumLinearTc1 ResultantSpeed
Figure D-4. (a) Resultant tension Tc1 in the cable (b) lateral and longitudinal loads.
Figure D-3. Dependence of lateral load on strut-cable coefficientof friction.

181
A previous study (31) investigating the effectiveness ofarresting systems for civil aircraft suggested a decelerationlimit of 1 g for this type of analysis but provided no referencefor this design requirement. To establish a design require-ment for the airplane with a medical basis, literature from thedevelopment of ejection seats, high-g maneuvers, and air-plane crash reconstructions were reviewed. From this review,human injuries were related to the deceleration of the fixturevolunteers were riding. This appendix is a summary of the lit-erature review. It provides insight into the human toleranceto deceleration for a wide range of durations and suggestsdeceleration limits for the evaluation of arrestor systems.
E.1. Range of Human Tolerance to Deceleration
To obtain an evaluation criterion based on human toler-ance levels, reports from ejection seat tests, airplane deceler-ation tests, and aeronautical accident reconstructions werereviewed. The range of decelerations reviewed was from 2 gto 220 g, with durations from 0.002 seconds up to 115 sec-onds. This encompasses the range of decelerations withinwhich aircraft arrestor systems will most likely stop an air-plane. From the literature reviewed, this deceleration rangehas been broken down, based on the duration of the deceler-ation pulse, into three broad categories as shown in Table E-1:(1) less than 0.2 seconds, (2) 0.2 to 3 seconds and (3) greaterthan 3 seconds (45). Each category is also graphically repre-sented in Figure E-1 to illustrate the trends in the data. Thefollowing sections describe in more detail the types of injuriesobserved within each category.
E.1.1. Deceleration Durations Less Than 0.2 Seconds
For decelerations less than 0.2 seconds (200 ms) in dura-tion (Figure E-1 – Region 1) and when the body is sufficiently
restrained (i.e., the body does not come in contact with anyobjects inside the cabin), the risk of injuries has been attrib-uted to the rapid displacement of body fluids. The rate ofdisplacement, and therefore the human tolerance to thedeceleration forces, is primarily determined by the rate ofapplication of force acting on the fluids. The rate of applica-tion of force is the third derivative of motion, called “Jerk,”with the units of g-per-second (g/sec). The literature docu-ments that, in this category, the point of reversible incapaci-tation is 38 g when the rate of application is 1350 g/sec andincreases to 50 g when the rate of application is reduced to500 g/sec or less (46). Reversible incapacitation is defined asmomentary lack of awareness of an individual that can limittheir ability to extricate themselves from the airplane if necessary. These symptoms can range from disorientation toblackout and last for just a few seconds to several days. Thelower bound for these effects begins within the human bodyat 10 g (45).
In addition to the displacement of body fluids, injuries canbe also induced by the interaction of the body with therestraining device or the motion of unrestrained body regionssuch as the head and limbs. These injuries are similar to thoseobserved in automotive crashes. These injuries include bruis-ing (46, 47), muscle strains, muscle tears, concussions (mildtraumatic brain injuries) (45), and fractures when the bodyimpacts the seatbelt with force (48) or strikes an object insidethe cabin. In an exercise examining the injury threshold forthe occurrence of traumatic brain injuries (TBI) based onidealized deceleration curves, the results suggested thatinjuries to the brain can be induced by deceleration startingat 10 g for impact durations of 0.2 sec. These findings arebased on the response of the average male occupant. Theresponse can vary slightly based on the gender and age of theoccupant. This difference is illustrated by the upper and lowerbounds in addition to age and gender. Simple items such asfoam pads on the back of the seat can also significantly changethe peak deceleration and the impact duration (49); there-
A P P E N D I X E
Human Injury Study

fore, great care should be exercised when using an aircraftdeceleration of 10 g as an injury criterion by itself.
In a review of aircraft accidents, Moseley (50) observedthat although the aircraft’s deceleration was within humantolerance limits (<10 g), injuries were still sustained. In theMoseley report, many of the injuries sustained were due tounrestrained body regions striking objects in front of them(50). One possible reason for the higher rate of injury, asreported by the Committee for Aeronautics, is that the accel-erations measured in the instrumented AnthropomorphicTest Device’s (ATD) chest were 1.2 to 1.5 times the peakacceleration measured at the floor (48). Therefore, a sleddeceleration of 40 g approaches the injury threshold for thechest as specified by the 3 ms clip criterion. The 3 ms clip cri-terion is an automotive injury criterion that specifies that anacceleration of the chest greater than 60 g can cause seriousinjuries (51).
182
R egion 1 R egion 2 R egion 3
Figure E-1. Decelerations with documented humanresponse.
Decel (g) Ave t (sec) Reported Injury Cited
220 0.060 Lethal in Anesthetized Hogs (45)
125 0.060 Reversible Injury in Anesthetized Hogs (45)
70 0.130 Lung Injury in Chimp Similar to Blast Lung (45)
50 0.200 Reversible Loss of Consciousness (500 g/sec) (45)
45 0.050 Concussion (45)
38 0.200 Reversible Loss of Consciousness (1350 g/sec) (45),(55),(56)
26 0.002 Back Muscle Soreness (47)
18 0.100 Upper Limit Head and Limb Motion Can be Braked by Musculature
(57)
17 0.300 Sudden Pressure to the Epigastrium and Rib Margin (55)
16 0.090 FAA Std for Peak Floor Deceleration (52)
15 — Suggested Human Tolerance Limit (57)
14 >0.200 Lumbar Fx if Max Torso Flexion is Attained (45)
13 >0.200 Abdominal Strain (47)
12 >0.200 Where Seat Belt Rides Up (46)
10 0.002 Bruising (46), (47)
10 0.200 Hydrostatic Pressure Effects Begin (45),(56)
9 — FAA Std for Seat Decal Limit (52)
8 0.310 Neck Muscle Soreness (46)
8 60.0 150% Loss in Respiratory Capacity (57)
6 3.0 Pilot Can Still Maneuver Plane (58)
6 60.0 15% Loss in Respiratory Capacity (57)
4 2.0 Eye and Sinus Hemorrhages (46)
4 80.0 Dimming of Vision (59)
2 115.0 Flatting of T-Wave (Serious Arrhythmia) (59)
Table E-1. Summary of the human response to deceleration from the literature reviewed.

For emergency crash landings for which the decelerationduration is typically very short, the FAA has set standards forairplane safety. The FAA standard stipulates that the peakfloor deceleration of the plane must not exceed 16 g, or havea rate of application (jerk) greater than 178 g/sec (52). Thestructures within the aircraft must be able to withstand theforces generated by this deceleration pulse for at least 3 sec-onds. From this deceleration pulse, the standard also requiresthat the peak deceleration experienced by the occupant mustnot exceed 9 g (52).
E.1.2. Deceleration Durations from 0.2 to 3 Seconds
If the duration of the deceleration pulse is lengthened tobetween 0.2 and 3 seconds (Figure E-1 – Region 2), a greatertransfer of energy to the fluid systems of the body can beexpected (46). In this range, injuries reported for rapid dis-placement of body fluids at 10 g now begin at 4 g due to thelonger deceleration duration (45). In this interval, the heartand circulatory system has time to react, and is working atmaximum output to counteract the effects of the decelera-tion. This increased cardiac output, in some individualstested, led to an irregular, rapid, and inefficient heartbeat(tachycardia) (53). If not corrected, extreme tachycardiacases can be life threatening (54). In addition to circulatoryproblems, the deceleration forces can force fluids to pool inbody regions, exceeding the elasticity of tissues and causingblood vessel rupturing (45). These injuries can be observed asruptures of the blood vessels in the eyes and skin. In the eval-uation of pilots’ responses it was determined that pilots stillhad the cognitive facilities to control the plane if exposed toaccelerations of 6 g for up to 3 seconds. We hypothesize thatpassengers of an aircraft could extricate themselves from thecabin after a similar experience.
E.1.3. Deceleration Durations Greater Than 3 Seconds
When the duration of the deceleration exposure is 3 sec-onds or greater (Figure E-1 – Region 3), the observed injuriesare primarily determined by the hypoxic effects (45). Thehypoxia is caused by a combination of poor blood circulationand poor respiratory output. Since the deceleration occursover a period of time up to 120 seconds, the onset of symp-toms will be more gradual. The initially reported symptom isdimming of vision (53), then loss of breath, dizziness andultimately, for long duration deceleration, loss of conscious-ness (55). The injury threshold for these long duration decel-eration pulses is between 2 and 8 g.
E.2. Injury-Based Criteria forEvaluating Arrestor Systems
To define the human tolerance to deceleration and suggesta human tolerance limit for use in the analysis of existing andfuture arresting systems, literature was reviewed and an exer-cise examining the injury threshold for the occurrence of TBIwas undertaken. The results of the literature review indicatethat a single injury criterion is not applicable for the full rangeof deceleration durations anticipated in the evaluation of thearresting systems. Therefore, a three-tiered deceleration limitfor the evaluation is proposed (Figure E-1). The first is fordecelerations with durations under one second, the second fordecelerations with durations between one and three seconds,and the third for deceleration durations over three seconds.
For deceleration durations less than 1 second, the datareviewed indicates that 9 g is a reasonable limit. For this tier, therisk of incapacitation or injury due to rapid displacement ofbody fluids is minimized. In addition to a lower risk of incapac-itation, there is a reduced risk of bodily injury. For these shortdecelerations below 9 g, the airplane cabin will remain intactand is within the design limit for the seat anchors. By remain-ing within the design limits of the airplane structure, the poten-tial of injury from the body striking objects inside the cabin isreduced. If the head comes into contact with the structuresinside the cabin, the potential for injury is estimated to be low.
For the analysis of airplane deceleration between one andthree seconds, the peak acceptable deceleration must bereduced to 6 g. By limiting the peak deceleration to 6 g, the lit-erature suggests that the forces placed on the body by the longerdeceleration will not affect the passengers’ cognitive ability toextricate themselves from the cabin.
When the duration of the deceleration exposure is 3 secondsor greater, it is proposed that the criterion be further reducedto 4 g. The reduction should minimize the occurrence ofreported symptoms such as dimming of vision, loss of breath,dizziness, and ultimately, for long duration deceleration, lossof consciousness. All these symptoms could contribute to thepassenger’s ability to exit the airplane after an incident.
The results of this effort indicate that a tiered approach isrequired for the analysis of airplane arresting systems. Fordeceleration durations less than 1 second, the proposed injurythreshold is 9 g to reduce the risk of incapacitation or injurydue to rapid displacement of body fluids and head impacts tointerior structures within the cabin, respectively. For the analy-sis of airplane deceleration between one and three seconds, thepeak acceptable deceleration proposed is 6 g. When the dura-tion of the deceleration exposure is 3 seconds or greater, it isproposed the criterion be further reduced to 4 g. By maintain-ing the deceleration to these limits, passengers should have thephysical and cognitive ability to safely exit the plane.
183

184
In order to predict landing gear loads effectively, computermodels were required for both the arrestor materials and thetires of the three subject aircraft. This appendix discusses thetire model development, while Chapters 9 through 12 discussthe modeling of the candidate arrestor systems.
F.1. Subject Tires Modeled
Manufacturer references give the tire sizes, pressures, andload limits for the three aircraft of interest (60). Table F-1 liststhe main- and nose-gear tires for each aircraft, and Table F-2provides specifications for the tires. The tire designations givethree numbers, referring to the diameter, width, and ply rat-ing, respectively. The leading “H” appearing in some tiresindicates a bias-ply tire designed for high deformations.
Goodyear supplied load-deflection curves for the tires listed,which were used for later tire calibration and validation.
F.2. Tire Modeling Approach
Tire modeling can be a highly detailed process, involvingdiscrete representation of the treads, carcass material, reinforc-ing fiber layers, the tire–rim interface, inflation pressures, andso on. Modeling these facets is required for accurate predictionof stresses within the tire, oscillatory behavior, tread wear, andso on. However, for arrestor bed modeling, such detail did notnecessarily offer added value. A number of these facets wouldconstitute higher order (and lower importance) effects whenapplied to the simulation of crushable material interactions.
A tire model was needed that could produce a realistic rutthrough an arrestor bed. A realistic rut would feature the cor-rect penetration depth and cross-sectional shape. Since theenergy dissipation is largely based on the crushed volume ofmaterial, a rut of the correct dimensions would tend to pro-duce the correct energy dissipation and hence the correctdrag load. Under a static vertical load with steady forwardmotion, this means that the tire would deform and settle to a
steady-state depth in the material, producing a rut of the cor-rect depth and width for that loading condition.
For a tire model to create such a rut, it would have to repli-cate two critical behaviors:
1. Correct deformation shape under loading, and2. Correct interface loading (ground pressure) against the
arrestor material.
After a review of available tire modeling methods andmechanical phenomena, the tire model priorities were set perTable F-3.
F.2.1. Tire Dimensions
The tire models needed to accurately represent the grossdimensions of the actual aircraft tires. Ensuring such a matchwas actually more complicated than it appeared. During infla-tion, the tire model stretched, which altered its original grossdimensions. Therefore, the dimensional criterion applied tothe match of the inflated model tire with the inflated actual tire.
F.2.2. Ground Pressure
The ground pressure that the tire produced stronglydepended on its inflation pressure and governed the penetra-tion of the tire into the arrestor material. Provided that the grossdimensions were correct and the load-deflection performancematched, the model would produce a ground pressure thatwould be sufficiently accurate for the soft-ground interaction.
F.2.3. Load-Deflection Performance
Goodyear provided load versus deflection curves, both inquasi-static and dynamic loading regimes. The load-deflectionperformance is analogous to a spring deflection curve. Typi-cal efficiencies for a tire are slightly less than an ideal spring,
A P P E N D I X F
Tire Models
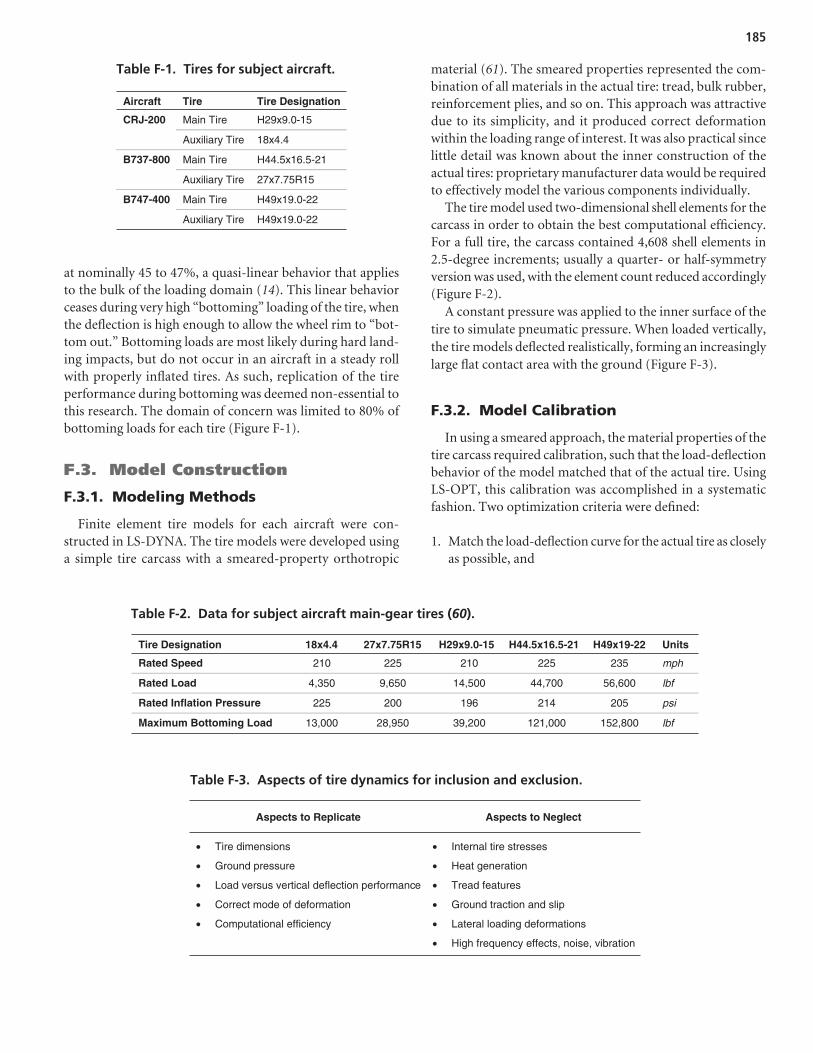
at nominally 45 to 47%, a quasi-linear behavior that appliesto the bulk of the loading domain (14). This linear behaviorceases during very high “bottoming” loading of the tire, whenthe deflection is high enough to allow the wheel rim to “bot-tom out.” Bottoming loads are most likely during hard land-ing impacts, but do not occur in an aircraft in a steady rollwith properly inflated tires. As such, replication of the tireperformance during bottoming was deemed non-essential tothis research. The domain of concern was limited to 80% ofbottoming loads for each tire (Figure F-1).
F.3. Model Construction
F.3.1. Modeling Methods
Finite element tire models for each aircraft were con-structed in LS-DYNA. The tire models were developed usinga simple tire carcass with a smeared-property orthotropic
material (61). The smeared properties represented the com-bination of all materials in the actual tire: tread, bulk rubber,reinforcement plies, and so on. This approach was attractivedue to its simplicity, and it produced correct deformationwithin the loading range of interest. It was also practical sincelittle detail was known about the inner construction of theactual tires: proprietary manufacturer data would be requiredto effectively model the various components individually.
The tire model used two-dimensional shell elements for thecarcass in order to obtain the best computational efficiency.For a full tire, the carcass contained 4,608 shell elements in2.5-degree increments; usually a quarter- or half-symmetryversion was used, with the element count reduced accordingly(Figure F-2).
A constant pressure was applied to the inner surface of thetire to simulate pneumatic pressure. When loaded vertically,the tire models deflected realistically, forming an increasinglylarge flat contact area with the ground (Figure F-3).
F.3.2. Model Calibration
In using a smeared approach, the material properties of thetire carcass required calibration, such that the load-deflectionbehavior of the model matched that of the actual tire. UsingLS-OPT, this calibration was accomplished in a systematicfashion. Two optimization criteria were defined:
1. Match the load-deflection curve for the actual tire as closelyas possible, and
185
Aircraft Tire Tire Designation
Main Tire H29x9.0-15 CRJ-200
Auxiliary Tire 18x4.4
Main Tire H44.5x16.5-21 B737-800
Auxiliary Tire 27x7.75R15
Main Tire H49x19.0-22 B747-400
Auxiliary Tire H49x19.0-22
Table F-1. Tires for subject aircraft.
Tire Designation 18x4.4 27x7.75R15 H29x9.0-15 H44.5x16.5-21 H49x19-22 Units
Rated Speed 210 225 210 225 235 mph
Rated Load 4,350 9,650 14,500 44,700 56,600 lbf
Rated Inflation Pressure 225 200 196 214 205 psi
Maximum Bottoming Load 13,000 28,950 39,200 121,000 152,800 lbf
Table F-2. Data for subject aircraft main-gear tires (60).
Aspects to Replicate Aspects to Neglect
• Tire dimensions
• Ground pressure
• Load versus vertical deflection performance
• Correct mode of deformation
• Computational efficiency
• Internal tire stresses
• Heat generation
• Tread features
• Ground traction and slip
• Lateral loading deformations
• High frequency effects, noise, vibration
Table F-3. Aspects of tire dynamics for inclusion and exclusion.
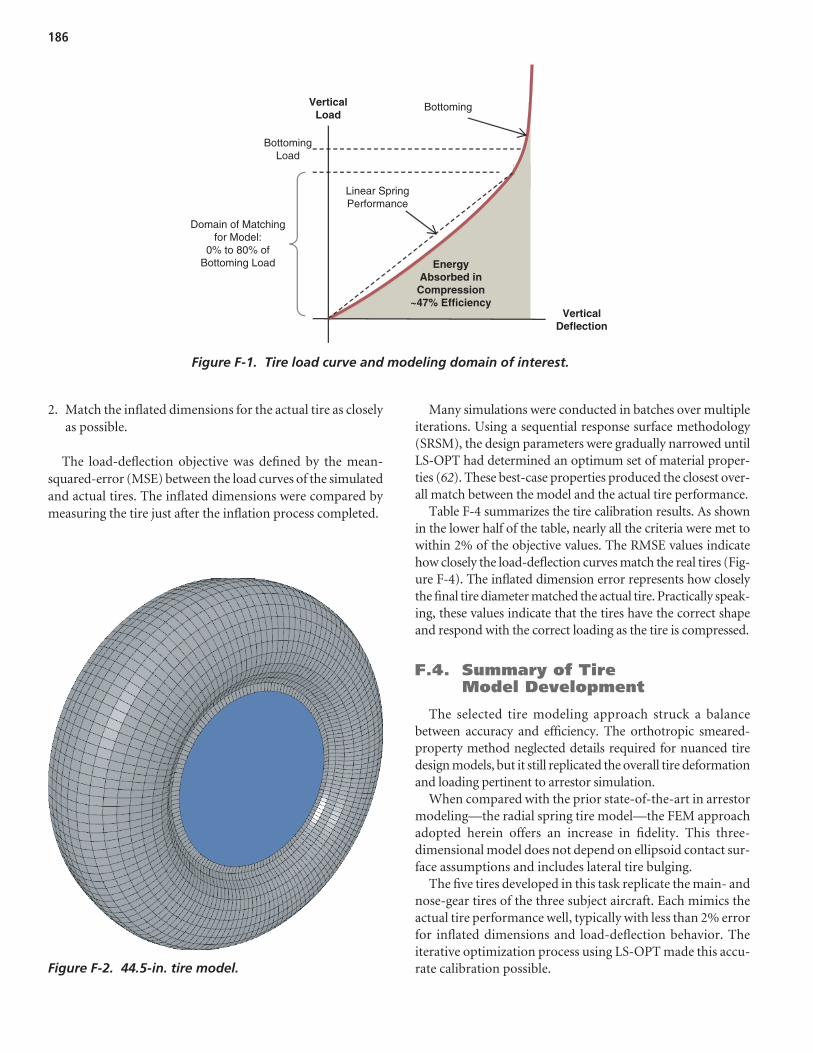
Many simulations were conducted in batches over multipleiterations. Using a sequential response surface methodology(SRSM), the design parameters were gradually narrowed untilLS-OPT had determined an optimum set of material proper-ties (62). These best-case properties produced the closest over-all match between the model and the actual tire performance.
Table F-4 summarizes the tire calibration results. As shownin the lower half of the table, nearly all the criteria were met towithin 2% of the objective values. The RMSE values indicatehow closely the load-deflection curves match the real tires (Fig-ure F-4). The inflated dimension error represents how closelythe final tire diameter matched the actual tire. Practically speak-ing, these values indicate that the tires have the correct shapeand respond with the correct loading as the tire is compressed.
F.4. Summary of Tire Model Development
The selected tire modeling approach struck a balancebetween accuracy and efficiency. The orthotropic smeared-property method neglected details required for nuanced tiredesign models, but it still replicated the overall tire deformationand loading pertinent to arrestor simulation.
When compared with the prior state-of-the-art in arrestormodeling—the radial spring tire model—the FEM approachadopted herein offers an increase in fidelity. This three-dimensional model does not depend on ellipsoid contact sur-face assumptions and includes lateral tire bulging.
The five tires developed in this task replicate the main- andnose-gear tires of the three subject aircraft. Each mimics theactual tire performance well, typically with less than 2% errorfor inflated dimensions and load-deflection behavior. Theiterative optimization process using LS-OPT made this accu-rate calibration possible.
186
VerticalLoad
VerticalDeflection
EnergyAbsorbed inCompression
~47% Efficiency
Linear SpringPerformance
Bottoming
Domain of Matchingfor Model:
0% to 80% ofBottoming Load
BottomingLoad
Figure F-1. Tire load curve and modeling domain of interest.
Figure F-2. 44.5-in. tire model.
2. Match the inflated dimensions for the actual tire as closelyas possible.
The load-deflection objective was defined by the mean-squared-error (MSE) between the load curves of the simulatedand actual tires. The inflated dimensions were compared bymeasuring the tire just after the inflation process completed.

187
Figure F-3. Quarter symmetry 44.5-in. tire model undergoing verticaldeflection.
Tire 18x4.4 27x7.75R15 H29x9-15
H44.5x16.5-21
H49x19-22
RSM Type Quadratic Quadratic Quadratic Linear Linear
Open Variables 3 3 2 3 3
Simulations Per Iteration 16 16 10 7 7
Number of Iterations (Pre Final) 10 20 4 5 7
Simulation Parameters
Total Simulations 161 321 41 36 50
RMSE for Load-Deflection Curve Match
1.6% 7.4% 2.0% 2.0% 1.7% Quality of OptimizedDesign
Error for Targeted Inflation Dimensions
2.65% 1.1% 2.2% 1.9% 0.08%
Table F-4. Summary of tire calibration.
Normalized Vertical Deflection
A
A
A
A
B
B
B
B
B
A Target (TireLCF)
History comparison for MSE (Experiment 8.1)
B Computed (Force_Dist)
No
rmal
ized
Lo
ad
Figure F-4. Sample load-deflection curve comparison to 80% ofbottoming load (units omitted).

188
G.1. APC Overview
The APC was developed to simulate aircraft arrestments forthe different arrestor concepts. The APC allows experimenta-tion with different aircraft, arrestor geometries, and materialstrengths. Built with a generalized framework, essentially anyarrestor bed concept could be simulated with the APC.
Figure G-1 shows that the APC has four principal inputs:
1. Metamodel data, which defines the aircraft landing gearinteraction with the arrestor bed;
2. Tire load-deflection data, which defines the landing gearinteraction with solid surfaces;
3. Aircraft library, which defines the aircraft dimensions,weights, and other properties; and
4. Arrestor design definitions, which define the bed dimen-sions and aircraft conditions for a given scenario.
Using these four inputs, the APC runs a time-marchingsimulation to predict the dynamic loads on the aircraft, thearresting distance, and so on. A typical APC simulation for anaircraft arrest takes 1.5 to 2 minutes to run. After completionof the simulation, the APC provides graphical plots and tab-ular data output.
The APC was written in MATLAB, a scientific programminglanguage and coding environment. Overall, the APC has ninemodules (m-files) with nominally 1,500 lines of code.
G.2. FAA ARRESTOR Code
The FAA previously developed the ARRESTOR code,which performed similar predictions as the APC. It featuredthree aircraft (B707, B727, and B747) and could be used tomodel different foam arresting bed geometries. Initially,modification of the ARRESTOR code was considered in lieuof developing a new predictive tool. If the evaluation hadbeen restricted to crushable foam materials only, this couldhave proven advantageous. However, the ARRESTOR code
was not inherently capable of simulating the aggregate andaggregate foam systems, which do not behave as an analog toeither crushable foams or soils. The APC was, therefore, moregeneralized than ARRESTOR and could simulate a broadervariety of system concepts.
G.3. Suspension Model
G.3.1. Concept Description
At the core of APC is an aircraft suspension model that cal-culates the dynamic loads and motion of an aircraft as it rollsthrough an arrestor bed. The arrestor bed exerts loads on boththe nose and main gear, and the aircraft responds by pitchingforward, bouncing, sinking into the bed, and decelerating toan eventual stop. The upper portion of Figure G-2 illustratesthe loads on the aircraft during such an event.
The dynamic behavior of the aircraft was representedmathematically using the component model illustrated inthe lower portion of Figure G-2. The component model iscomposed of lumped masses, springs, and damper elementsin order to approximate the aircraft fuselage, wings, andlanding gear. Although an effective wing mass, spring, anddamper were included, this was done as a placeholder provi-sion within the mathematical framework of the model. Inpractice, the wing motion was neglected by using null valuesfor those parameters.
G.3.2. Scope of Capabilities
The APC was developed specifically to simulate aircraftarresting scenarios. Consequently, its intended capabilitiesand limitations were defined a priori. General performanceobjectives for the suspension model include:
• Allowing the modeling of general arrestor beds of variousgeometries,
A P P E N D I X G
Arrestor Prediction Code

189
Figure G-1. Simplified diagram of the APC.
Figure G-2. Aircraft dynamics transformed into suspension model.
Arrestor Prediction Code (APC) (MATLAB)
Metamodel Data
Performance Predictions
Tire Load-Deflection Data Aircraft Library
Arrestor Design Definition
x
z Direction of Travel
FV,MG
FD,MG FD,NG
FV,NG
Main Gear Wheel/Axle
Fuselage
Nose Gear Wheel/Axle
Strut Strut
Tire/ArrestorInterface
Tire/Arrestor Interface
Wing Mass
Main Gear Rut Nose Gear Rut
u1u2 u3
u4 u5
u6
x
θ(2) (3)
(4) (5)
(6)
(1)
DNG
VNGVMG
DMG

• Modeling of material response accomplished throughmetamodels,
• Prediction of gross loading on landing-gear struts for dam-age estimation,
• Prediction of stopping distance for arrestor concepts,• Prediction of porpoising effect with transient load spikes,• Prediction of arrestor efficiency compared with idealized
deceleration, and• Prediction of fleet-wide performance (versatility) of an
arrestor.
General limitations for the suspension model include:
• No steerage (yawing) or other lateral motion effects,• No tire slippage or heat generation effects,• No lateral load prediction on gear struts, and• No higher order effects or frequency analysis.
G.3.3. Simplifying Assumptions
In light of the APC scope of capabilities, the mathematicalsuspension model involves several simplifying assumptions:
• The fuselage only pitches at relatively small angles, lessthan +/–10 degrees;
• The motion is two-dimensional with no yawing;• The airframe remains effectively rigid; and• The landing-gear struts can be approximated with con-
stant stiffness and damping factors.
These assumptions were appropriate because the simula-tions assume an aircraft in a ground rolling state. Non-linearstrut spring and damping factors were considered, but ulti-mately were not necessary due to the relatively low loadingrates and minimal strut travel.
Given these assumptions, the model has seven degrees offreedom. Since the two rut-depth degrees of freedom areimplicitly defined by the metamodel data, only five degrees of
freedom are included in the governing equations. This pro-duced a system stiffness matrix that was 10 x 10.
Additionally, linear approximations were made for theangle (θ) and the angular velocity (ω) that were accurate towithin less than one percent for the angle range specified.
G.3.4. User-Defined Problems
The APC permits the user to define arrestor scenarios usingmany parameters, as summarized in Table G-1.
G.4. Aircraft Parameter Definition
The aircraft library indicated in Figure G-1 was developed toprovide input parameters required by the suspension modelfor the three test aircraft: the CRJ-200, B737-800, and B747-400. These properties included aircraft weights, landinggear configuration, design strengths of the struts, and overalldimensions. In all, 36 parameters were required to defineeach plane. These properties were obtained from publishedmanufacturer data, a generalized aircraft model, and the FARrequirements for passenger aircraft.
G.4.1. Published Manufacturer Data
Published aircraft data generally included informationregarding aircraft weight, gross dimensions, landing gearstrut configurations, and the types of tires used. This infor-mation was acquired through open-source websites and air-port guidance documents published by the manufacturers(42, 60). Goodyear also provided load curve data for the tiresused by the three subject aircraft.
Aircraft manufacturers were approached directly for addi-tional information regarding strut properties and landing geardesign strengths. However, these requests were ultimately un-fruitful due to the proprietary nature of the specifications.
190
Table G-1. User-defined parameters for simulations.
Aircraft Arrestor Simulation Controls
• Type
• Initial speed
• Braking conditions inside and outside of the bed
• Type
• Bed length and depth
• Depth at which the bed is recessed vertically
• Setback distance
• Tapering length for bed thickness
• Increase or decrease arrestor material strength
• Time step for computations and data output intervals
• Plotting and tabular data saving options

G.4.2. Generalized Aircraft Model
In the absence of the remaining properties, which wereneeded to complete the aircraft definitions, alternative meanswere sought to develop reasonable estimates. Sources foundduring the literature review provided the means to calculateapproximate values.
Chester outlines a modeling approach for a generalizedaircraft of arbitrary size, with a focus on landing geardynamics and overall airframe response (16). Based on thismethod, properties such as strut stiffness, the pitchingmoment of inertia, and various unspecified dimensionswere estimated.
Currey provided excellent guidance with regard to landinggear mechanics (14). Non-linear strut compression curveswere developed based on oleo-pneumatic strut design prin-ciples. Ultimately, however, constant spring stiffnesses wereused for simplicity. Statistical information in this referenceregarding typical landing gear weights was used to estimatethe travelling mass for the wheel assemblies of each strut.
The strut damping coefficients were estimated as a per-centage of critical damping, assuming the estimated strutstiffness and a mass equivalent to the vertical static load onthe strut. Generally, damping factors less than 1.0 (under-damped) produced oscillatory behavior, noise, and instabil-ity. After experimentation, it was determined that a simplefactor of 1.0 (critically damped) would suffice for the simu-lations. Aside from basic system stability, the damping factor was not found to have a substantial effect on the predictions.
G.4.3. Federal Aviation Regulations
The load limits for the landing gear were among the mostcritical properties to define for each aircraft. Such values werenot available from published data or the aircraft manufactur-ers. Discussions with the manufacturers and the FAA pro-duced a straightforward alternative: the limit and ultimatelanding-gear loads as specified by the FAR were taken asdesign strengths for the aircraft.
The limit/ultimate loads were calculated for the nose andmain gear from multiple criteria in FAR Part 25. Vertical loadlimits were not of high importance since the rolling arrestmentsdid not substantially affect them. The rearward drag load limitswere critical, however, particularly for the nose gear.
For the nose gear, the highest drag loads resulted fromSection 25.509, “Towing Loads,” conditions 1 and 2. For themain gear, the highest drag loads resulted from Section 25.493,“Braked Roll Conditions.” Values for drag-direction limitand ultimate loads based on these two criteria were employedin the APC as performance thresholds.
G.4.4. Summary of Aircraft Parameters
Based on the preceding discussion, the different aircraftparameters and related data sources can be summarized asin Table G-2.
For inline wheel sets, “shadowed wheels” were those behindthe leading wheel. The leading wheel was responsible for pro-ducing the drag load when interacting with the arrestor bed,while the shadowed wheels were assumed not to contributedrag load.
G.5. Arrestor and Tire Interface
G.5.1. Contrast of APC and ARRESTOR
The APC uses a different premise than ARRESTOR forcalculating the landing-gear loads. The ARRESTOR methodcalculated the loads on the tire based on the geometry ofinterface and the foam compression strength (radial springtire assumptions) (63). These loads were calculated in real-time,during the course of the simulation. This quasi-analyticalmethod proved sufficient for crushable foam arrestors (cellu-lar cement, polymer foam, etc.). However, the approach isnot as well-suited to more chaotic and non-linear arrestormaterials (aggregates, foam aggregates, etc.).
The APC method uses high-fidelity numerical models of thetire/arrestor interface to build a large database of loads for abroad range of conditions, which are defined in the metamod-els discussed in Table G-4. Because high-fidelity models areused for the load calculations a priori, the load predictions havehigher accuracy than using a simplified analytical model. Fur-ther, there is no inherent limitation on the arrestor beds thatcan be assessed; a suitable numerical code can be chosen forwhatever system is desired (LS-DYNA, EDEM, others). Thecontrasts of the APC and ARRESTOR methods are summa-rized in Table G-3.
G.5.2. Metamodel Interface with Suspension Model
During each simulation, the loads on a tire are determinedbased on the penetration depth of the tire into the arrestor, thespeed of travel, and the arrestor bed depth. Given these condi-tions, the APC queries the correct metamodel for the verticaland drag loads on the tire. This process is essentially a databaselookup except that the database is a multi-dimensional meta-model. When the tire was on a hard surface, rather than in anarrestor bed, tire load-deflection data was used in place of themetamodel data.
Figure G-3 illustrates the transformation of the tire/arrestorinterface into a virtual spring/roller assembly in the suspen-sion model (refer to Figure G-2).
191

192
ARRESTOR APC
Tire Model Radial spring analytical model Numerical model, dependent on software choice
• LS-DYNA: finite element tire model
• EDEM: rigid tire form, with deflection adjustment
Arrestor Material Model
Simplified quasi-analytical crushable foam model
Numerical model using appropriate method
• Crushable: LS-DYNA smooth particle hydrodynamics (SPH) formulation
• Aggregate: EDEM discrete element (DEM) formulation
Load Calculation Method
Analytical calculation based on area of tire/arrestor interface
Batch simulations utilizing numerical model
• Many simulations to create data set
• Metamodel for loading created as a fit to the data set
Timing of Load Calculation
Real-time, during simulation A priori, using high-fidelity models to create metamodels.
Metamodels referenced in real-time during simulation.
Table G-3. Contrast of ARRESTOR and APC methods for landing-gear load calculations.
Table G-2. Summary of aircraft parameters.
Group Parameter Source
Weight (maximum take-off) Published data Mass
Pitching moment of inertia Generalized model
Wheel base
Distances from center of gravity (CG) to nose and main gear
Overall Aircraft
Dimensions
Height to CG
Published data
Supplemented using generalized model
Number of struts
Wheels per strut
Configuration
Number of shadowed wheels
Published data
Mass Travelling weight Generalized model
Stiffness Strut
Damping Generalized model
Diameter
Static deflection
Static load
Maximum deflection
Tire
Maximum load
Published data
Drag limit load
Main & Nose Gear
Load limits
Drag ultimate load FAR Part 25
Mass Weight
Stiffness
Wings
Springproperties
Damping
Not used

G.5.3. Metamodel Dimensions
The metamodels generated for each arrestor type had threeindependent variables: speed, bed depth, and depth of pene-tration into the bed. For each condition set, two responsevalues were available: the drag and vertical loads (Table G-4).Considered from the standpoint of the suspension model,there were additional parameters that could have beenincluded as additional variables, such as wheel spin, verticaltranslation velocity, braking torque, and so on. For simplic-ity, these variables were neglected in the current analysis.Therefore, the current metamodels were four-dimensional,having three independent variables and one response variableeach. Ultimately, metamodels could be seven-dimensional ifthe additional independent variables were included.
The primary limitation of the metamodel data used in thesesimulations is the lack of vertical speed as an independentvariable. Without vertical wheel velocity information, highfrequency response predictions, such as small bumps andnoise, could be realistically simulated. The overall assump-tion for the metamodel data was that steady-state loading atvarious penetration depths was sufficiently accurate for therequired predictions. Overall, transient vertical loads were not
of significant interest when compared with the overall dragloads. Given the soft nature of the arrestor materials, thisassumption was reasonable.
Additional metamodel data could be generated to includevertical speed and could be implemented with little alterationof the software. However, this additional complexity wasdeemed unnecessary for the current effort.
G.6. Overall Program Function
The overall process followed by the APC is illustrated byFigure G-4. Starting from the initial conditions specified bythe user (upper left), the program calculates a steady-staterolling solution for the aircraft, including initial strut and tiredeflections, weight distribution for the aircraft, and so on.
The program then enters the main loop, which computesthe time-marching dynamic behavior of the aircraft andarrestor bed. The loop calculates the current load state basedon the component locations and velocities. Using the coresuspension model stiffness matrix (gray box), the systemvelocity matrix is determined. Numerical time integrationproduces new displacements from the velocity matrix. Afterupdating the stiffness matrix constants, the loop begins a newiteration. This process continues until the aircraft comes torest. At that point, data files and plots are output per userspecifications.
G.7. Conclusions
The APC effectively simulated aircraft arrestments acrossa wide range of aircraft and for a set of dissimilar arrestormediums. Because it was not dependent on simplified analyt-ical tire or arrestor material models, it provided a generalizedframework suitable for simulating nearly any arrestor design.
193
Figure G-3. Arrestor interface dynamics transformed into suspension model.
Table G-4. Metamodel variables and responses.
FV
FD
Main Gear Wheel/Axle
Strv
Tire/Arrestor Interface
RutArrestor Bed
x
z Direction of Travel
Wheel/Tire Mass
Variables Responses
Included in Metamodels Forward speed
Bed depth
Penetration depth of tire
Vertical load
Drag load
Neglected in Metamodels Vertical speed
Spin rate
Braking torque
Torque on tire

194
Input Initial Conditionsfor Case
(Aircraft Parameters,Arresting MaterialParameters, etc)
Calculate Initial Steady-State Solution
Calculate Forces forTire/Ground/Arrestor
Interface(Tire Load Curves or
Metamodel Data)
Calculate Velocities &Accelerations
(Suspension Model MatrixSolution for u-dot matrix)
Update Suspension ModelConstants
(Non-Linear Coefficients)
Integrate Over Time Step& Calculate
Displacements
Output Data & Plot Files
Simulation Complete
Figure G-4. Simplified process diagram for the arrestor predictioncode.

195
A C R O N Y M S A N D A B B R E V I A T I O N S
AASHTO American Association of State Highway and Transportation Officials
AC Advisory Circular
ACRP Airport Cooperative Research Program
APC Arrestor Prediction Code
ARFF Aircraft Rescue and Fire Fighting index
ASTM American Society for Testing and Materials
ATD Anthropomorphic Test Device
CG Center of Gravity
CFR Code of Federal Regulations
CRDA Cooperative Research and Development Agreement
CTEE Cost to Establish EMAS
DOT Department of Transportation
DEM Discrete Element Modeling (numerical method)
EDEM Discrete Element Modeling Software Available Through DEM Solutions
EMAS Engineered Material Arresting System
ERAS Engineered Root-zone Arresting System
ESCO Engineered Arresting Systems Corporation
FAA Federal Aviation Administration
FAR Federal Aviation Regulations
FEM Finite Element Method (numerical method)
JFK John F. Kennedy International Airport
LGA LaGuardia Airport
LS-DYNA Numerical Modeling Software Available Through LSTC
LS-OPT Optimization Software Available Through LSTC
LSTC Livermore Software Technology Corporation
MATLAB Matrix Laboratory software
MG Main Gear
MSP Minneapolis–St. Paul Airport
MTOW Maximum Takeoff Weight
MTW Maximum Taxi Weight
NG Nose Gear
NTSB National Transportation Safety Board
RBF Radial Basis Function network
RMS(E) Root-Mean-Squared Error
RSA Runway Safety Area
RSM Response Surface Methodology
196
SPH Smoothed Particle Hydrodynamics (numerical method)
SRSM Sequential Response Surface Methodology
TBI Traumatic Brain Injury
TRB Transportation Research Board
UK United Kingdom
U.S. United States

Abbreviations and acronyms used without definitions in TRB publications:
AAAE American Association of Airport ExecutivesAASHO American Association of State Highway OfficialsAASHTO American Association of State Highway and Transportation OfficialsACI–NA Airports Council International–North AmericaACRP Airport Cooperative Research ProgramADA Americans with Disabilities ActAPTA American Public Transportation AssociationASCE American Society of Civil EngineersASME American Society of Mechanical EngineersASTM American Society for Testing and MaterialsATA Air Transport AssociationATA American Trucking AssociationsCTAA Community Transportation Association of AmericaCTBSSP Commercial Truck and Bus Safety Synthesis ProgramDHS Department of Homeland SecurityDOE Department of EnergyEPA Environmental Protection AgencyFAA Federal Aviation AdministrationFHWA Federal Highway AdministrationFMCSA Federal Motor Carrier Safety AdministrationFRA Federal Railroad AdministrationFTA Federal Transit AdministrationIEEE Institute of Electrical and Electronics EngineersISTEA Intermodal Surface Transportation Efficiency Act of 1991ITE Institute of Transportation EngineersNASA National Aeronautics and Space AdministrationNASAO National Association of State Aviation OfficialsNCFRP National Cooperative Freight Research ProgramNCHRP National Cooperative Highway Research ProgramNHTSA National Highway Traffic Safety AdministrationNTSB National Transportation Safety BoardSAE Society of Automotive EngineersSAFETEA-LU Safe, Accountable, Flexible, Efficient Transportation Equity Act: A Legacy for Users (2005)TCRP Transit Cooperative Research ProgramTEA-21 Transportation Equity Act for the 21st Century (1998)TRB Transportation Research BoardTSA Transportation Security AdministrationU.S.DOT United States Department of Transportation