Embed Size (px)
Citation preview

Developing a Questionnaire with the Intent of Measuring User Experience in Test
Trials of Low-Cost Virtual Reality
by Andrew McUne
A THESIS
submitted to
Oregon State University
Honors College
in partial fulfillment of the requirements for the
degree of
Honors Baccalaureate of Arts in Digital Communication Arts (Honors Associate)
Presented August 23, 2017 Commencement June 2017

1
2
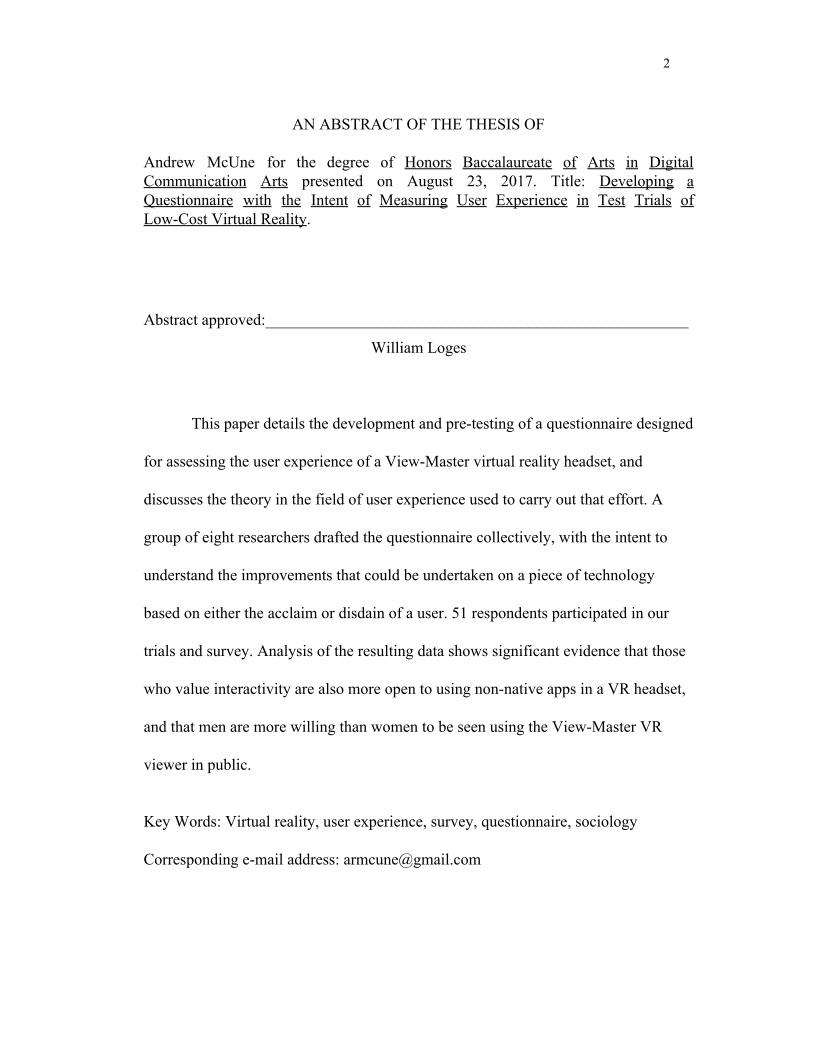
AN ABSTRACT OF THE THESIS OF
Andrew McUne for the degree of Honors Baccalaureate of Arts in Digital Communication Arts presented on August 23, 2017. Title: Developing a Questionnaire with the Intent of Measuring User Experience in Test Trials of Low-Cost Virtual Reality.
Abstract approved:_____________________________________________________
William Loges
This paper details the development and pre-testing of a questionnaire designed
for assessing the user experience of a View-Master virtual reality headset, and
discusses the theory in the field of user experience used to carry out that effort. A
group of eight researchers drafted the questionnaire collectively, with the intent to
understand the improvements that could be undertaken on a piece of technology
based on either the acclaim or disdain of a user. 51 respondents participated in our
trials and survey. Analysis of the resulting data shows significant evidence that those
who value interactivity are also more open to using non-native apps in a VR headset,
and that men are more willing than women to be seen using the View-Master VR
viewer in public.
Key Words: Virtual reality, user experience, survey, questionnaire, sociology Corresponding e-mail address: [email protected]

3
©Copyright by Andrew McUne August 23, 2017
All Rights Reserved

4
Developing a Questionnaire with the Intent of Measuring User Experience in Test Trials of Low-Cost Virtual Reality
by Andrew McUne
A THESIS
submitted to
Oregon State University
Honors College
in partial fulfillment of the requirements for the
degree of
Honors Baccalaureate of Arts in Digital Communication Arts (Honors Associate)
Presented August 23, 2017 Commencement June 2017

5
Honors Baccalaureate of Arts in Digital Communication Arts project of Andrew McUne presented on August 23, 2017. APPROVED: _____________________________________________________________________ William Loges, Mentor, representing Digital Communication Arts _____________________________________________________________________ Daniel Faltesek, Committee Member, representing Digital Communication Arts _____________________________________________________________________ Colleen Bee, Committee Member, representing Marketing _____________________________________________________________________ Toni Doolen, Dean, Oregon State University Honors College I understand that my project will become part of the permanent collection of Oregon State University, Honors College. My signature below authorizes release of my project to any reader upon request. _____________________________________________________________________
Andrew McUne, Author

6

7
TABLE of CONTENTS
❖ Abstract………………………………………………………………………..2
❖ Signatures……………………………………………………………………...5
❖ Thesis Statement…………………………………………………..…………..9
❖ Introduction……………………………………………………..……………..9
❖ Theory and Precedents
➢ Defining User Experience…………………………………………....10
➢ Virtual Reality…………………………………..……………………15
➢ Drafting a Questionnaire………...…………………………………...19
❖ Discussion of the Project
➢ Framework/Beginning of the Class………………………………….25
➢ Methods………………………………………………………………36
❖ Results………………………...……………………………………………...39
❖ Analysis of Project’s Level of Success
➢ Effectiveness in Addressing Questionnaire Values………………….43
➢ Analysis of Questionnaire’s Reliability and Validity………………..48
➢ What went particularly well?……………………….………………..50
➢ What were some problems?………………………………………….51
❖ Conclusion…………………………………………………………………...53
❖ Appendix A: Survey…………………………………………………………55
❖ Appendix B: Codebook………………………………………………………61

8
❖ Appendix C: Original Report………………………………………………...69
❖ Works Cited….………………………………………………………....……92
❖ Acknowledgements………………………………………..………..………..99
9
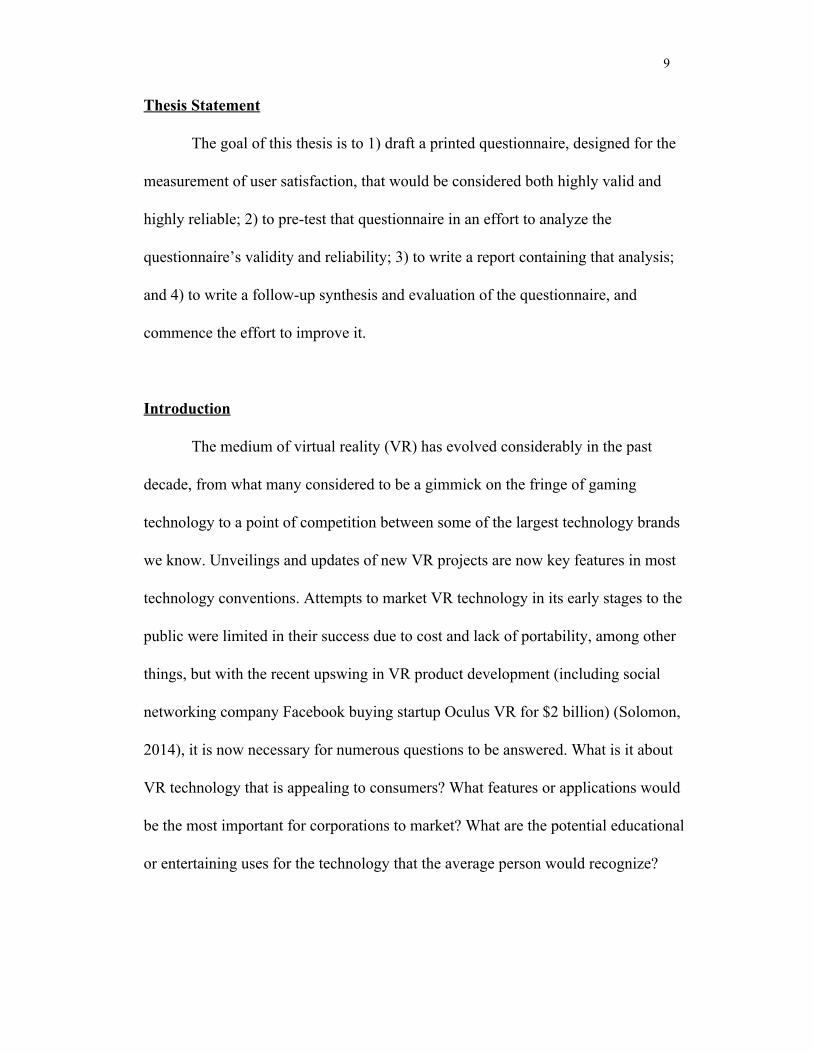
Thesis Statement
The goal of this thesis is to 1) draft a printed questionnaire, designed for the
measurement of user satisfaction, that would be considered both highly valid and
highly reliable; 2) to pre-test that questionnaire in an effort to analyze the
questionnaire’s validity and reliability; 3) to write a report containing that analysis;
and 4) to write a follow-up synthesis and evaluation of the questionnaire, and
commence the effort to improve it.
Introduction
The medium of virtual reality (VR) has evolved considerably in the past
decade, from what many considered to be a gimmick on the fringe of gaming
technology to a point of competition between some of the largest technology brands
we know. Unveilings and updates of new VR projects are now key features in most
technology conventions. Attempts to market VR technology in its early stages to the
public were limited in their success due to cost and lack of portability, among other
things, but with the recent upswing in VR product development (including social
networking company Facebook buying startup Oculus VR for $2 billion) (Solomon,
2014), it is now necessary for numerous questions to be answered. What is it about
VR technology that is appealing to consumers? What features or applications would
be the most important for corporations to market? What are the potential educational
or entertaining uses for the technology that the average person would recognize?

10
What aspects of a VR experience would some consider to be uncomfortable or
awkward? A valid and reliable questionnaire that asks respondents about their
experience with VR would be valuable.
This paper details the effort to create that questionnaire, which was
undertaken by eight undergraduate researchers under the direction of William E.
Loges, PhD. It reviews research standards in drafting questionnaires, descriptions of
the intentions of the researchers, the process by which core concepts were decided
upon and then defined, the methodology and the materials used in the project, the
pre-testing of the questionnaire model, the points of the questionnaire which were
considered to be particularly successful and particularly unsuccessful, respectively,
and potential improvements and future research. The original project report is also
attached to the latter end of this paper, as Appendix C.
Theory and Precedents
Defining User Experience
The evaluation of user experience is essential to successful commerce, and has
been since the beginning of the public marketplace. At the most basic level of
business, the action of willfully entering into a transaction implies that there is some
kind of measurable benefit to be accrued by each party that is involved. If a vendor
wishes for such profitable transactions to continue, or for more transactions with
other customers to be initiated through the initial customer’s referrals, some amount

11
of satisfaction on the part of the buyer would have to be ensured. However, there is
more to selling or marketing a product successfully than can be done by measuring
reactive statistics or testimonials. Preliminary investigation into the desires of a
potential consumer can answer many questions that follow-up assessment cannot,
including some questions or ideas that follow-up assessment or isolated research and
development may not even raise. User experience, as discussed by Marc Hassenzahl
and Noam Tractinsky (2006), has been considered difficult to define due to its
inconspicuousness in academic journals and the general absence of empirical research
on the subject. However, in their aggregation of available research, they define user
experience as “a user’s internal state…, the characteristics of the designed system…
and the context within which the interaction occurs” (p. 95). Hassenzahl, in another
paper (2011), states that he focuses on experiences as “meaningful, personally
encountered events,” events that gain significance as they are recalled from memory
(www.interaction-design.org). That memory should be instructive. What does the
user consider to be positive about the experience, and what does he consider not to
be? What was enjoyed? What about the experience was unique, that would bring a
user back?
Difference in cultural background is one of the variables in one’s reception of
an object or event, as described by Aaron Marcus in his publication of
“Cross-Cultural User-Experience Design” (2006). The way that one perceives details,
such as uses of color and script in product design, is greatly influenced by the trends

12
of the community or country in which one lives. The common connotations of those
design colors in a user’s home country, for example, may positively or negatively
affect a potential user’s intent to participate. For example, in a commercial setting, a
potential user from Great Britain may choose to purchase a piece of clothing for its
purple design, due to the color purple’s local association with royalty and great
wealth (Melina, 2011). However, another potential user from Thailand might turn
away from that same item, due to purple being a color that most Thai citizens don
when mourning the loss of a loved one (Girard, 2016). Marcus, basing much of his
analysis on the theoretical model of Geert Hofstede (1997), also details other
circumstances that have effects on the way that potential users from certain cultures
perceive an object or event. These include family makeup, fluidity or rigidity of
gender roles, local tendency to avoid uncertainty, and even a country’s centralization
of power.
An effort to come to a consensus among experts on the definition of user
experience was detailed by Effie Law et al. (2008), involving an electronic
questionnaire that was administered to participants of a conference. They note one of
the most basic problems with finding the correct definition–that user experience is a
concept in many different fields, most of them with very little in common. It is also
related to a large list of widely varying qualities, “including emotional, affective,
experiential, hedonic, and aesthetic variables,” some of which are always either
deemphasized or ignored in any study focusing on a specific subject (p. 2396).

13
Various models of theory also exist, which can conflict with each other on basic
levels; this was something that Marcus also acknowledged in his treatment of the
work of Hofstede. Therein lies much of the issue.
Notably, the government of the United States of America hosts a website that
details the importance of investigating usability (www.usability.gov, 2014). Relating
the theory presented by Peter Morville (Morville, 2016), an emphasis is placed on
what the creator of content can do to make positive reception more likely, or to
convince a consumer that an object or event is valuable. Morville provides six
criteria; a creator must make the content “useful,” “usable,” “desirable,” “findable,”
“accessible,” and “credible” (Morville). These six points were integral to the design
of our project. The usability.gov website also lists a number of professional
disciplines that have been either adapted to or born from user experience in
human-computer interaction, such as information architecture, user interface design,
web analytics, and accessibility for the disabled.
In particular, the importance of a user’s experience to creators in new media
technology has been paramount throughout the past century. Whether the content is
visual or aural, analog or digital, creators have been considering the potential
reception of their offerings with more intensity in every generation. Building a
potential experience for a future user of a technology is so important that John
McCarthy and Peter Wright argue in their paper “Technology as Experience” that
technology should actually be considered as experience itself, and not just as a

14
catalyst or an instigator (2004). They posit that an experience is woven together from
four “threads”; the compositional, the sensual, the emotional, and the spatio-temporal.
The compositional thread comprises concepts like structure, narrative, and
consequence, and considers how “the elements of an experience fit together to form a
coherent whole” (p. 42). The sensual thread is concerned with design, texture,
temperature, and other things that are seen or felt at first contact. The emotional
thread entails the user’s potential span of judgment of value, as well as prioritization
of future experiences. Finally, the spatio-temporal thread is concerned with the user’s
perception of space and time while immersed in the experience.
McCarthy and Wright (2004) have also set forth a written series of processes
that users engage in each time they encounter an experience, which is additionally
useful in drafting a method of user experience investigation. Those six processes
include “anticipating” the experience, “connecting” to an experience with initial
impressions of it, “interpreting” what is happening mid-experience, “reflecting” on
questions and emotions that the experience invokes, “appropriating” how this
experience will fit into one’s world view, and “recounting” that experience to oneself
or to others at a future time (p. 43). Considering these processes in the mind of a user
would be nothing less than intuitive when investigating experience with a technology
as visceral as VR, and these themes were present throughout our research.
15
Virtual Reality
Defining Virtual Reality
VR, at its most basic level, is an immersive artificial environment. It involves
placing a user in an illustrated or digitally manipulated space, in a manner that is
heavily interactive and typically involves the use of several different media, for both
the user’s reception and the user’s input. The methods of input in each VR experience
differ slightly depending on the creator of the system, but a VR headset that
completely occupies the user’s visual field is a constant throughout the VR market.
Thus, a user is not generally able to focus on the objects immediately around him or
her in actual reality, because his or her eyesight is being occupied by an
encompassing curated environment that commands his or her attention. This
distinguishes VR from a similar headset-based technology, called augmented reality
(AR), which does not establish a completely artificial environment, but instead
integrates digital elements and opportunities into the user’s actual reality. Today, VR
is universally digital, but mechanical forerunners of VR and VR head-mounted
displays have existed since the days of penny arcades.
As a doctoral student at Stanford University in 1992, Jonathan Steuer made
the case against VR being another “medium,” as the radio or the television are often
characterized. He argues that VR is not a singularity in technology but rather “a
collection of machines” (Steuer, 1992, p. 73). He also points out that creating a strict
16
technological definition of VR would imply VR systems to be more standardized in
their aggregation of input methods and capabilities for interactivity than they are.
Thus, he considers the definition of VR to be “a real or simulated environment in
which a perceiver experiences telepresence” (pp. 76-77). He defines telepresence to
be “the experience of presence in an environment by means of a communication
medium” (p. 76). (It can be inferred that these definitions were written before the
distinction between VR and AR was made.)
Use in Entertainment
The motivation to develop VR technology in recent years can largely be
attributed to the entertainment industry. The Oculus Rift headset system, one of the
leaders in the recent VR upswing and currently one of the more popular models in the
industry, marketed their product specifically to video game developers in their
original crowdfund-related press release. A quote in the press release attributed to
Palmer Lucky, then the CEO of Oculus VR, reads: “The Oculus Rift is a true game
changer that will help make VR the standard for gameplay in the very near future,”
and later, “We know the gaming community will be as excited as we all are when
they get their hands on it” (Schumacher and Redner, 2012). The Sony PlayStation VR
was designed to cater to the same demographic of software developers, as was the
HTC Vive. However, the connection between virtual reality and entertainment is not
a new one; just a few of the electronic game companies competing to develop their
17
own VR headset projects as early as 1993 include Nintendo, Sega and VictorMaxx
(Edwards, 2017; Hill, 2014; Worley and Chamberlain, 1994).
Use in Education
Much like notebook and tablet computers, VR headsets are also being
considered for educational use in schools. For young children, virtual field trips are
an increasingly popular draw (edu.google.com), allowing them to see world
landmarks, marine wildlife, and even bodies of the solar system up close (Krause,
2017). Interactive adaptations of popular children’s literature are also possible, as are
workspaces for creating digital art projects. Students in some classrooms have been
given the freedom to build and structure their own study tools in a virtual setting, and
reports from their teachers have indicated great enthusiasm for the exercise (Krause,
2016). One study in Romania tested the use of augmented reality in the teaching of
chemistry to children, and the authors described the children as considering the
system to be “attractive, stimulating, and exciting” (Pribeanu and Iordache, 2008).
Other Uses
Use of VR technology is also being documented in other fields. Architects
have been able to use virtual reality to communicate their designs with a much
smaller amount of error than is possible with other media (Corke, 2017). Medical
professionals can train others and themselves be trained in a simulated hospital setting

18
(Powell, 2017). Stroke victims who have taken part in VR-based treatment have been
shown in one study to have better improved upper limb motor function compared to
those who took part in treatment without VR elements (Turolla et al., 2013). Military
exercises are simulated in detail, including combat jumps visualized in headsets and
felt with body harnesses built to evoke the same physical stresses expected from real
jumps (Nye, 2017). The Institute for Creative Technologies at the University of
Southern California has been operating a VR project dedicated to treating
post-traumatic stress, guided by professionals, since the year 2005, which is available
to any licensed clinicians who wish to use it (Rizzo and Hartholt, 2005). These are
just some of the uses that VR has already been put to.
High-End VR vs Accessible VR
Some of the most popular VR systems have already been mentioned in this
paper; the HTC Vive, the Sony PlayStation VR and the Oculus Rift are some of the
best-selling systems in the industry, in addition to Samsung Gear VR. However, these
systems all run their own operating systems, whether they operate alone or attached to
another piece of hardware, which means that there is a level of exclusivity to the
wares that are available for each system. In addition, popular VR systems are often
expensive, with some headset-and-computer combinations approaching the four-digit
price range (Leswing, 2017). To provide an alternative to consumers, other
technology companies have created VR systems, typically working in tandem with a

19
smartphone, that cost less money up front. Google Cardboard is one of the most
popular kinds of inexpensive VR software. It requires a smartphone to operate, but
variants of the headset that would house the smartphone can be purchased for less
than $20, and instructions can also be found online for users to craft their own
headsets from cardboard and other spare parts. The View-Master Virtual Reality
Viewer is an example of a viewer that was built to be compatible with Google
Cardboard VR, in addition to its own smartphone applications, and was chosen for
this project specifically because it is a type of VR headset that would be easily
accessible to a majority of potential respondents.
Drafting a Questionnaire
What Researchers Must Remember
All elements of a survey should relate to its purpose for being conducted.
Arlene Fink, in the Survey Kit manual How to Ask Survey Questions, says that “a
survey’s purpose, surveyors, and respondents… must be fully understood before you
begin to write questions,” and that a researcher should identify the questionnaire’s
specific purposes to the respondent first, before any other objective is achieved (Fink,
1995, page 6). Fink also advises researchers to standardize both the surveyor and the
response format. For our research team, we had expected since the beginning to
undertake individual trials of the VR headset with respondents, with researchers
attending to trials in pairs or small groups; that meant it was necessary to plan our
20
method of conducting trials in a detailed manner, for fear of respondents receiving
different instructions from different researchers and having our findings spoiled. The
instruction about standardization is in accord with many other instructions from Fink,
including avoiding slang and jargon, biasing words, two-edged questions, and
negative questions; using complete sentences and avoiding abbreviations; and
remembering that “questions are asked in a social, cultural, and economic context”
(Fink, p. 17).
Laugwitz, Held, and Schrepp (2008), in “Construction and Evaluation of a
User Experience Questionnaire,” opine that disseminating questionnaires is a method
of research that is used over other methods because of its efficiency, and as such, they
emphasize the importance of maintaining that efficiency in questionnaire design.
They said:
The user should be enabled to give his rating about the product
as immediately and spontaneously as possible. A deeper rational
analysis should be avoided. The questionnaire should not force the
user to make abstract statements about the interaction experience or
remember details that are likely to be forgotten or had been overlooked
in the first place. An explicit evaluation demanded by the user
retrospectively is not always reliable… This is supported by results
where differently colored UIs affected users’ feelings differently (e.g.
21
as measured with a mood questionnaire), while this difference was not
reflected by users’ answers on questions regarding the UI quality.
Experts are able to evaluate user interfaces in detail…. A user
questionnaire can lay its emphasis on criteria which are accessible
immediately: the user’s subjective perception of product features and
their immediate impact on the user him/herself. (p. 65)
On the very first written page of another manual from The Survey Kit, How to
Design Surveys, Arlene Fink described what features made for a successful and direct
questionnaire: “Specific, measurable objectives, sound research design (the design of
the survey environment), sound choice of population or sample, reliable (consistent)
and valid (accurate) instruments, appropriate analysis, and accurate reporting of
survey results” (Fink, 1995, p. 1) She subsequently took some pages to describe, as
many researchers do, the values of reliability and validity, and their places in
developing research surveys. Both of these values are crucial to the success of a
survey, and warrant some basic description before our project is discussed.
Reliability and Validity
Edward G. Carmines and Richard A. Zeller define reliability as the “tendency
toward consistency found in repeated measurements of the same phenomenon”
(Carmines and Zeller, 2008). They note that human measurement completely devoid

22
of error is nonexistent in science, so they consider reliability not to be a dichotomous
attribute describing an experiment’s perfection or lack thereof, but rather as a value
that allows for variance. Experiments can have high reliability or low reliability–the
greater the consistency of the results of repeated trials, the higher the reliability.
There are various types of reliability measures that researchers can undertake
in designing their experiments, and Mark S. Litwin describes them in his Survey Kit
manual How to Measure Survey Reliability and Validity. The first method, test-retest
reliability, is measured by testing the same experiment with the same group of
respondents at two different times, after which the responses are compared against
each other and the correlation coefficients are calculated. Second, alternate-form
reliability is the practice of drafting two differently-worded questions that are
intended to produce the same answer, or organizing already-existing questions in a
different manner, and then applying the two versions of the prompt(s) in separate tests
of a questionnaire to ascertain whether the response would still be the same. The third
method is called internal consistency reliability, and it involves including multiple
items in a questionnaire that measure the same variable and provide a scale of data
about that variable; an example might be a series of eight questions about which
foods a respondent prefers to eat, rather than a simpler single question that asks
whether the responded feels that his or her food preferences are healthy. Finally,
interobserver reliability is the practice of multiple trial conductors measuring the

23
same variable from the same respondent. Litwin asserts this to be common in
inquiries such as patient examinations by radiologists and other doctors.
Validity is the measure of how successfully an experiment measures a
variable. It is equally as important as reliability. “Once you document that a scale is
reliable over time and in alternate forms,” Litwin says, “you must then make sure that
it is reliably measuring the truth” (p. 33). Carmines and Zeller (2008) also wrote that
“strictly speaking, one does not assess the validity of an indicator but rather the use to
which it is being put” (p. 12). Validity is not a value in which a certain question or
item on a survey will always be considered appropriate in any situation. Items that are
intended to determine a certain kind of variable may work when concerning one type
of topic, and may not work when concerning another. Validity also is not
dichotomous; like reliability, an item’s measure of validity can vary greatly.
Litwin makes mention of several methods used to measure the validity of
surveying tools in How to Measure Survey Reliability and Validity. The first of these
is face validity, which involves soliciting basic opinions on the potential effectiveness
of a questionnaire from persons who are not necessarily professional, and is described
by Litwin as “much more casual” (p. 35). Second is content validity, which is
measured by persons who possess quantifiable knowledge on a survey’s topic, and
consists of their judgments as to whether it is sufficient in its efforts to treat the topic
or is in some way incomplete. Concurrent criterion validity consists of comparing one
surveying tool to another surveying tool, such as an index or test, which is

24
well-known and has already been accredited and validated by the research community
for investigating the same question. Concurrent predictive validity is the measure of
success that a survey instrument has in being able to “forecast” future behaviors,
events, or outcomes. (p. 40.) Convergent construct validity, which as Litwin
acknowledges is closely related to alternate-form reliability, is validity based in
multiple kinds of research processes or inquiries being able to obtain the same
information, generally over a long span of time. Lastly, divergent construct validity,
which is also demonstrated over a long period of time, is present in surveying tools
which show data that is distinctly different from data found through using similar yet
different surveying tools.
This concludes the theory and precedents portion of this paper. This
description of other works and writings concerning user experience, VR, and drafting
questionnaires has been intended to frame the description of our research team’s
project below, and to assist in judging its merits and success. As researchers, much
time was spent in evaluating potential subjects of research, and the study of VR was
selected because we perceive it to be meaningful, and do not expect problems or
misunderstandings associated with it to go away. We also elected to host the trials of
a VR headset with respondents in person, because it is not reasonable to expect
people to accurately answer specific questions about this in their home. Researchers
need to be present, and the trials need to be controlled.

25
Discussion of the Project
Framework/Beginning of the Class
The setting for this research was a course at the undergraduate level at Oregon
State University, for students receiving a degree in Digital Communication Arts. The
course was created to facilitate student development of a collaborative capstone
project, and while the type of research project has varied depending on the professor
that leads it, the research project for any incarnation of the class must be decided
upon, designed, carried out, and reported on within a ten-week time frame.
Participation of a certain amount of students is also necessary, in order to have
enough researchers to accomplish the tasks required in the ten weeks. Eight students
participated in the class, which was less than desirable, but sufficient for a
manageable distribution of responsibilities. The idea to develop a questionnaire to
determine the user experience of an object or event was presented by Dr. Loges at the
beginning of the ten-week term, and then it was given to the students to create the
project.
Decision to Work on Mattel’s View-Master
The decision to write a survey concerning user experience with Mattel’s
View-Master Virtual Reality Viewer came quickly. We knew as a research team that
if we were able to pretest the questionnaire we would design within the short time we
had available, we would have to draw upon the local student population as a source of
26
respondents. This meant that the technology the survey inquired about would have to
be readily available to such a population, and its diversity in geographic and financial
background. In addition, the technology would ideally have large potential for future
innovation, and by dedicating our project to such an object or event, we would
maximize the usefulness of the project. Studying virtual reality was agreed upon, and
upon further discussion of accessible variants of virtual reality, we decided to
investigate Mattel’s View-Master Virtual Reality Viewer. Mattel’s VR viewer was
new on the market, having been released in the last quarter of 2015, and at its time of
release, the viewer hardware could be purchased by a smartphone owner for the price
of $30 (Limer, 2015). Notably, by the time our research commenced (a little more
than a year after the release date), the price of the viewer hardware had actually been
lowered to $20, which if anything would increase its accessibility.
Description of the View-Master
The introductory pages of the original research report that our research team
released contains a substantive description of the View-Master Virtual Reality Viewer
and its hardware, as well as the brand View-Master and what it has meant to the
public up to the present point. Each of these are important to understand when
investigating user perception of a technology, and our report sought to describe them
as clearly as possible. Herein, I will quote from the report at length.

27
The View-Master Virtual Reality Viewer is a
smartphone-enabled virtual reality (VR) headset, currently sold by the
toy manufacturing company Mattel. When used in conjunction with a
properly equipped smartphone, it allows for the participation of the
user in immersive 3D viewing of VR. The headset is made of hard
plastic with a wide tinted visor on the front and hard rubber protruding
from the back surrounding the two convex lenses in order to
accommodate face shape (See Fig. 1). Sound from the smartphone is
able to filter out from the unit via the small slats at the bottom corners
of the face of the unit that contains the eyepieces. A clasp on the top
unlatches to allow the viewer to swing open, revealing the other side
of the lenses, a dedicated three-prong clamp for the user’s smartphone,
and an additional plastic brace to fit into the clamp if the smartphone
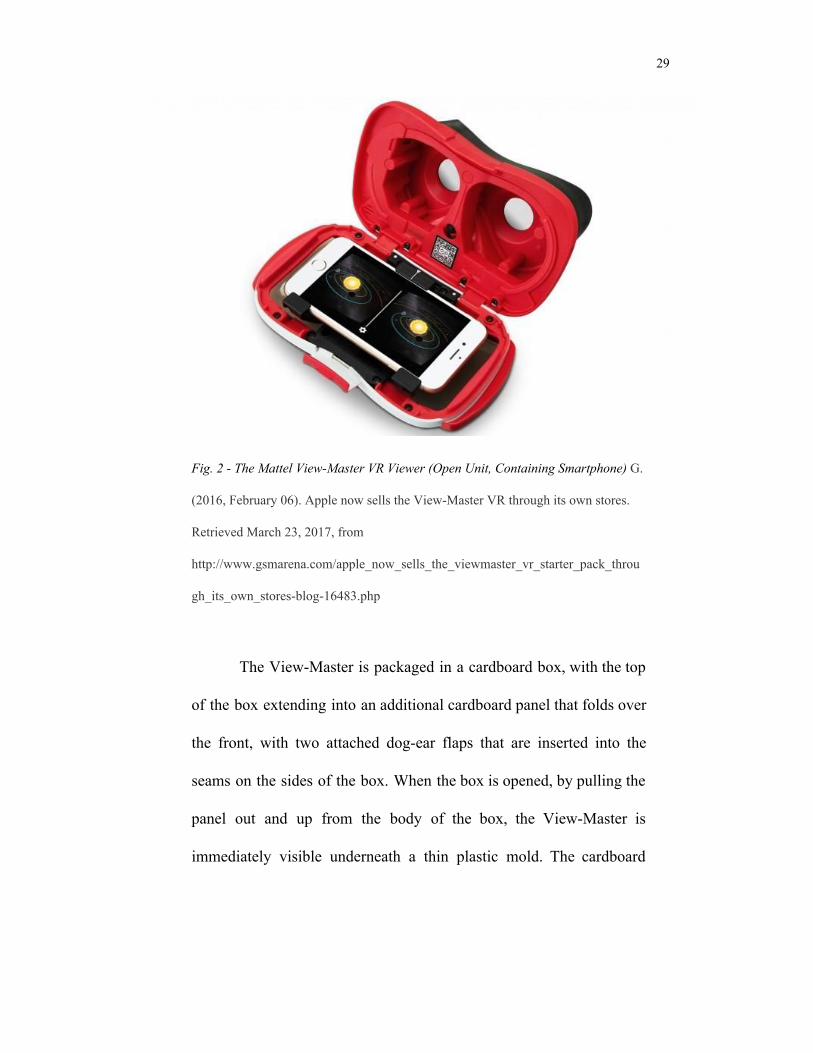
has a smaller body (See Fig. 2). The body of the headset is red, and
when closed, only features one point of input to manipulate the
smartphone inside: a large, orange trigger, which protrudes from unit
near the right side of the user’s face. A wrist strap is also attached to
the unit, on the bottom, near the sound slats.

28
Fig. 1 - The Mattel View-Master VR Viewer (Closed Unit) Sridhar, S. (2016, March
1). Google Store starts selling View-Master and C1-Glass Cardboard VR Viewers.
Retrieved March 23, 2017, from
http://www.fonearena.com/blog/176707/google-store-starts-selling-view-master-and-
c1-glass-cardboard-vr-viewers.html
29
Fig. 2 - The Mattel View-Master VR Viewer (Open Unit, Containing Smartphone) G.
(2016, February 06). Apple now sells the View-Master VR through its own stores.
Retrieved March 23, 2017, from
http://www.gsmarena.com/apple_now_sells_the_viewmaster_vr_starter_pack_throu
gh_its_own_stores-blog-16483.php
The View-Master is packaged in a cardboard box, with the top
of the box extending into an additional cardboard panel that folds over
the front, with two attached dog-ear flaps that are inserted into the
seams on the sides of the box. When the box is opened, by pulling the
panel out and up from the body of the box, the View-Master is
immediately visible underneath a thin plastic mold. The cardboard
30
panel that was also immediately above the View-Master, before it was
lifted away, features a graphic that instructs the consumer concerning
the enabling of the View-Master’s use with a smartphone. When the
first plastic mold is discarded and the View-Master unit is removed, a
booklet of instructions can be found pressed against the back of the
box by remaining plastic. The box also contains a separate object
called the Preview Reel, which is a plastic disc with fourteen spaces on
its face. This object is intended to be placed on a flat surface near the
user of the headset, and then to be a visual reference point for that
headset during use; the person using the View-Master can look directly
at the Preview Reel laying flat on a table nearby, and the disc will
prompt an appropriate menu for the user to navigate, depending on the
nature of his current use. (...).
Some consumers are likely to know the name of View-Master
from stereoscopic viewers that have been sold in the past, by Mattel
and by others. Since the 1930s, View-Master has been the trademarked
name of successive models of handheld stereoscopic dual-lens film
strip viewers. These viewers accepted native film strips into the main
unit via a slot in front of the eyepieces. These film strips being
distributed in the form of circular pieces of paperboard containing
seven two-panel sets of negatives. These paperboard circles were

31
called “reels”, and the Preview Reel pays very obvious homage to
these reels in both its shape and size.
Description of Software
The VR that is enabled through the View-Master is comprised
of both artificial environments made from computer-generated
imagery and edited footage of actual environments, the latter of which
is more often known as augmented reality. The most heavily
advertised uses of the viewer involve dedicated smartphone apps
published by Mattel; one app houses a National Geographic-branded
environment featuring Earth in the time of dinosaurs, and another app
contains an underwater exhibition of sharks and other sea creatures,
courtesy of Discovery. More official View-Master apps have been
released since the headset’s initial public release, including one
sponsored by the Smithsonian Museum, and others of a more
immediately fictitious nature, such as Batman and Mattel’s own
Masters of the Universe.
The device is not limited to the use of native apps developed by
Mattel. The View-Master VR Viewer was created as a joint
collaboration between Mattel and the technology company of Google
as an implement for Google Cardboard, the company’s virtual reality

32
platform. As such, any Cardboard-based applications available in
online smartphone markets can be freely used with the viewer, as well
as standard smartphone applications that contain Cardboard-dedicated
content, such as YouTube.
Values Used to Build the Survey
To compartmentalize the questions in our survey, we set out to define a set of
values as an initial guide for writing, and also to organize data when we collected it.
Each and every one of these values needed to be meaningful to the user of the
View-Master in a distinct and describable way. Most of them do have ties to other
values, however, as user experience is itself an interplay among many different
sensations and feelings. After reflecting on the twenty values of usability put forth by
the usability.gov website (2014), eight distinct values were chosen, either directly
from the government list or as an amalgamation of several. These values are:
portability, durability, comfort, simplicity, interactivity, desirability, versatility, and
emotion. Full definitions were written or cited by the research team in the report, and
they can be found on pages 68–72 of Appendix C, but I will also summarize them
here.
Portability is a value that has been considered in the development of most
handheld electronic games or media. If it is easy or convenient to transport this object
from point A to point B, and still be able to use it at point B for what is intended, then
33
one would consider the device to be portable. That value would also increase if the
object could be conveniently used in the very transit between the two points; for
example, parents wishing to keep their children occupied during a long car ride would
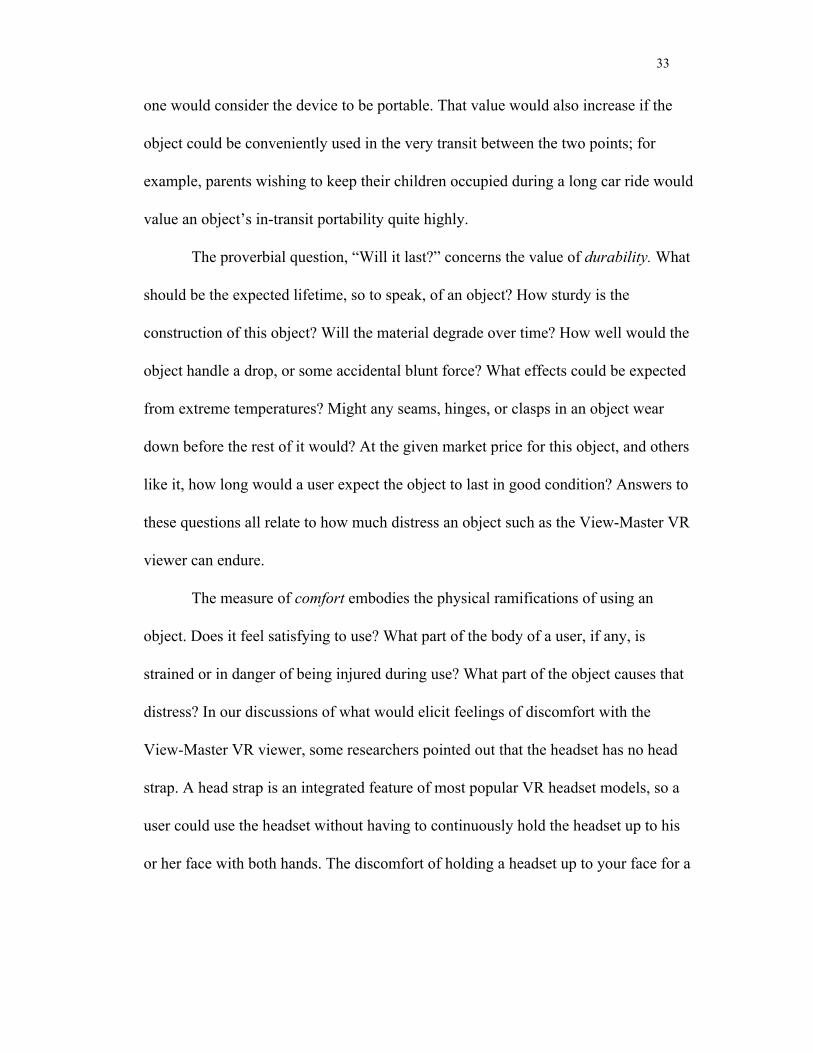
value an object’s in-transit portability quite highly.
The proverbial question, “Will it last?” concerns the value of durability. What
should be the expected lifetime, so to speak, of an object? How sturdy is the
construction of this object? Will the material degrade over time? How well would the
object handle a drop, or some accidental blunt force? What effects could be expected
from extreme temperatures? Might any seams, hinges, or clasps in an object wear
down before the rest of it would? At the given market price for this object, and others
like it, how long would a user expect the object to last in good condition? Answers to
these questions all relate to how much distress an object such as the View-Master VR
viewer can endure.
The measure of comfort embodies the physical ramifications of using an
object. Does it feel satisfying to use? What part of the body of a user, if any, is
strained or in danger of being injured during use? What part of the object causes that
distress? In our discussions of what would elicit feelings of discomfort with the
View-Master VR viewer, some researchers pointed out that the headset has no head
strap. A head strap is an integrated feature of most popular VR headset models, so a
user could use the headset without having to continuously hold the headset up to his
or her face with both hands. The discomfort of holding a headset up to your face for a
34
long period of time may be a detractor from using the technology for some
respondents, and our research team made note of this early in our drafting sessions.
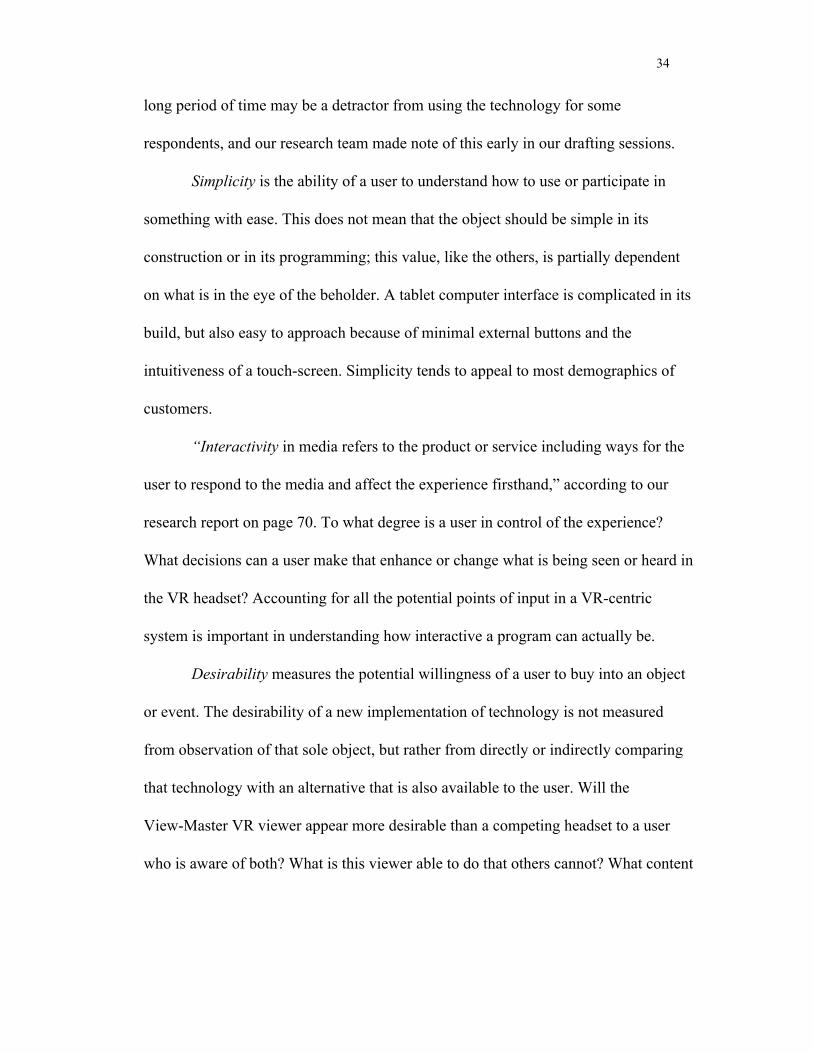
Simplicity is the ability of a user to understand how to use or participate in
something with ease. This does not mean that the object should be simple in its
construction or in its programming; this value, like the others, is partially dependent
on what is in the eye of the beholder. A tablet computer interface is complicated in its
build, but also easy to approach because of minimal external buttons and the
intuitiveness of a touch-screen. Simplicity tends to appeal to most demographics of
customers.
“Interactivity in media refers to the product or service including ways for the
user to respond to the media and affect the experience firsthand,” according to our
research report on page 70. To what degree is a user in control of the experience?
What decisions can a user make that enhance or change what is being seen or heard in
the VR headset? Accounting for all the potential points of input in a VR-centric
system is important in understanding how interactive a program can actually be.
Desirability measures the potential willingness of a user to buy into an object
or event. The desirability of a new implementation of technology is not measured
from observation of that sole object, but rather from directly or indirectly comparing
that technology with an alternative that is also available to the user. Will the
View-Master VR viewer appear more desirable than a competing headset to a user
who is aware of both? What is this viewer able to do that others cannot? What content
35
can be used exclusively on it, or used most effectively on it? Financially, how would
a user feel about spending the necessary money on this headset instead of a
potentially different amount of money for a different headset?
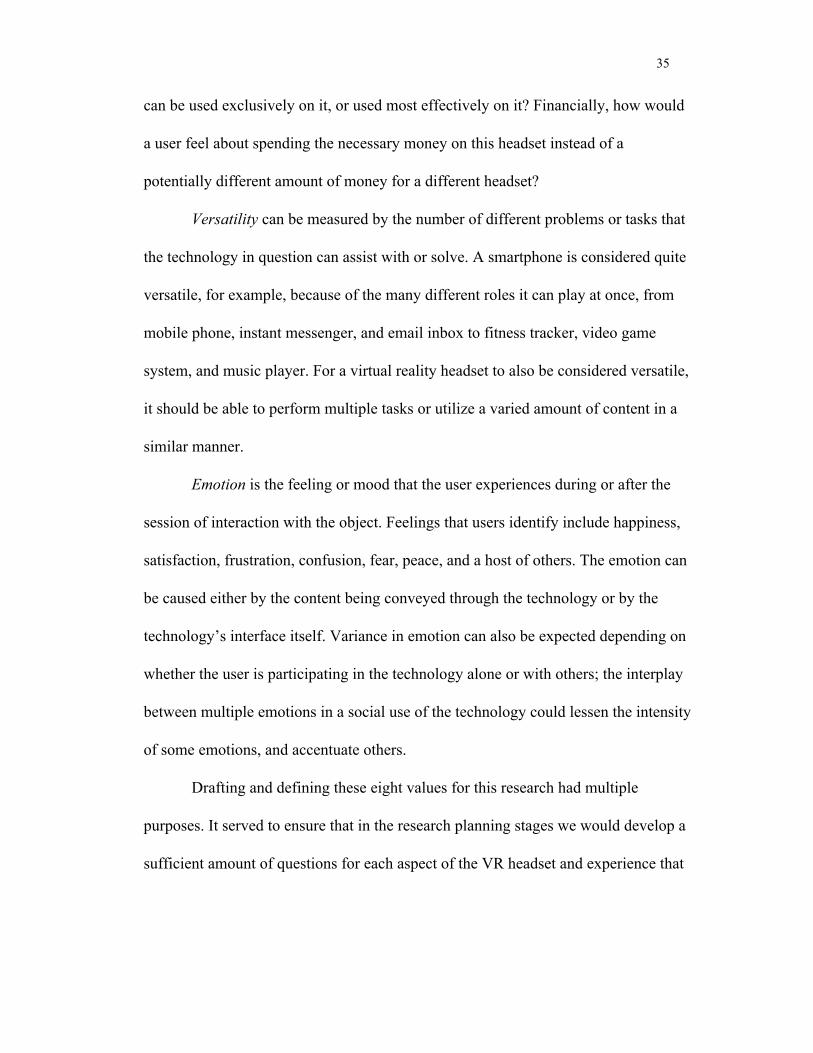
Versatility can be measured by the number of different problems or tasks that
the technology in question can assist with or solve. A smartphone is considered quite
versatile, for example, because of the many different roles it can play at once, from
mobile phone, instant messenger, and email inbox to fitness tracker, video game
system, and music player. For a virtual reality headset to also be considered versatile,
it should be able to perform multiple tasks or utilize a varied amount of content in a
similar manner.
Emotion is the feeling or mood that the user experiences during or after the
session of interaction with the object. Feelings that users identify include happiness,
satisfaction, frustration, confusion, fear, peace, and a host of others. The emotion can
be caused either by the content being conveyed through the technology or by the
technology’s interface itself. Variance in emotion can also be expected depending on
whether the user is participating in the technology alone or with others; the interplay
between multiple emotions in a social use of the technology could lessen the intensity
of some emotions, and accentuate others.
Drafting and defining these eight values for this research had multiple
purposes. It served to ensure that in the research planning stages we would develop a
sufficient amount of questions for each aspect of the VR headset and experience that

36
we wanted to analyze, and that nothing integral would be left out. It also provided a
method to organize the data that was collected from the responses to the
questionnaires. The resulting codebook can be seen in Appendix B of this paper.
Methods
Respondents were drawn from a class of students in a New Media
Communication course at Oregon State University, taught by Daniel Faltesek, PhD.
Two of our researchers were allowed to enter the classroom and announced the
pending research to the students, at which point a schedule of available trial times (in
blocks of 30 minutes) was passed to each student in the room. Students were told that
participating in this research would be allowed by the professor as an alternative
project to one that would be assigned in class. Those who wished to participate were
instructed to sign their name to a spot on the schedule, and told to appear at the
appropriate location.
Questions on the survey were organized according to their response type.
Questions 1 through 10 are nominal and dichotomous, with the only possible answers
to them being “Yes” and “No.” Question 11 is an interval question, with five possible
answers. Questions 12 through 24 are also interval questions, which are arranged in a
table with their potential responses organized into a five-point Likert scale (McLeod,
2008). Questions 25 through 29 had varying numbers of potential responses, with
instructions that tell the respondent to “check all that apply.” Each potential response

37
for each item was coded as a dichotomous point of data, which amounted to 25 points
of data in total from those five questions. Questions 30 through 34 were nominal and
dichotomous. Question 35 was open, but coded as dichotomous. Questions 36, 37,
and 38 are each nominal, with a varying amount of potential responses. Finally, two
additional points of data were entered for each respondent’s survey; whether the
participant was male or female, and whether the participant was wearing glasses or
not.
At the trial location, two researchers sat at one table, and a respondent would
be instructed to sit at another table. At the respondent’s table, all of the components
of a packaged View-Master Virtual Reality Viewer could be found, including the
packaging itself. A compatible smartphone owned by one of the researchers would be
inserted in the VR viewer, with a free demo version of the View-Master® Discovery
Underwater app already loaded on-screen. The respondent would be told to use the
application, and to stop either when he or she did not feel inclined to continue or
when the demo ended. After indicating that he or she was finished, a researcher
would give the respondent a copy of the survey and allow him or her to complete it at
the table. Upon finishing the survey, the researcher would receive it from the
respondent and give the respondent a final sheet of paper containing a list of prompts
for his or her class assignment, from that respondent’s professor. The trial would then
be considered over, and no further contact would be made with the respondent. The
only personal information kept by the researchers about the respondents was a list of

38
their student ID numbers, to document to their professor that they had indeed
completed the task. That list was destroyed upon completion of the research. 20
potential respondents who had signed for trials failed to attend them, but several
others who missed their trials contacted us and successfully rescheduled. The data
from those rescheduled trials have been included with the data from the rest of the
trials.
Data was entered into an online-hosted spreadsheet. The rows of the
spreadsheet represented the respondents (respondent 1 through 51), and the columns
represented each point of data that could be garnered from the questionnaire. This
spreadsheet was then downloaded and imported into SPSS Statistics for data analysis.
The choice to use SPSS was made by Dr. Loges; it has been a long-standing program
in statistics, and it is the program in which he has experience. SPSS is a predecessor
to PASW Statistics 18. It was not a software choice that was made for fear that other
statistics software would somehow draw any alternate conclusions from our data. The
calculations that were also made in this data analysis were simple, and there should
not have been any differences between analyses based in SPSS or analyses from any
other statistics calculations program.

39
Results
1. Hypothesis: Students who have a higher class standing, and have been in
media studies longer, are more open to additional uses of the View-Master.
a. VER MoreApps v. Class Standing: Not statistically significant. Class
standing of respondents was found irrelevant when considering their
visualization of the View-Master being used for more apps than
demonstrated.
b. VER TeachMath, TeachEnglish: Statistically significant.
Upperclassmen are more open. Of the 49 respondents who indicated
their answers appropriately, 12 of 27 upperclassmen said that the
View-Master could be used to teach mathematics (X2 = 3.8, d.f. = 1, p.
= .05), and 11 of 27 upperclassmen said that it could be used to teach
English (X2 = 4.4, d.f. = 1, p < .05). In contrast, only 4 of 22
lowerclassmen said that the View-Master could be utilized to teach
math, and 3 of 22 lowerclassmen said that it could be used to teach
English. It should be noted, however, that all of these respondents who
indicated that the View-Master could teach math or English are in the
minority of their respective groups. (See Fig. 3.)
c. VER TeachScience: Not statistically significant.
d. VER TeachHistory: Not statistically significant.
e. VER TeachArt: Not statistically significant.
40
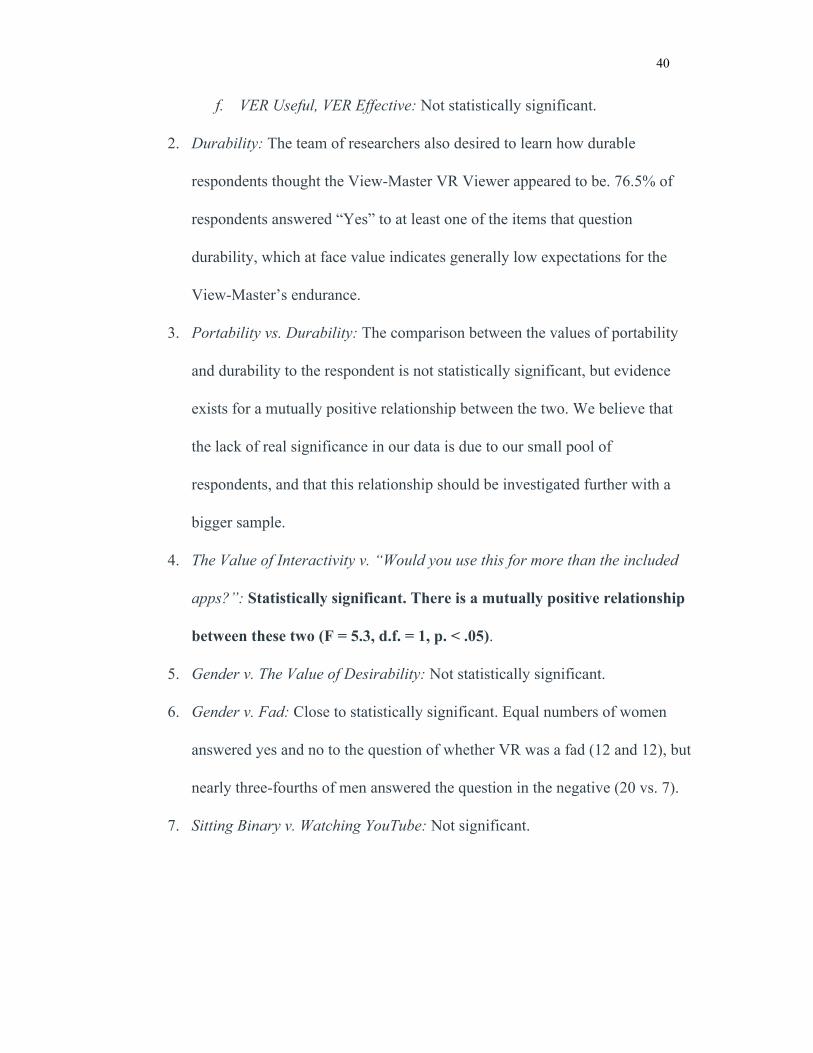
f. VER Useful, VER Effective: Not statistically significant.
2. Durability: The team of researchers also desired to learn how durable
respondents thought the View-Master VR Viewer appeared to be. 76.5% of
respondents answered “Yes” to at least one of the items that question
durability, which at face value indicates generally low expectations for the
View-Master’s endurance.
3. Portability vs. Durability: The comparison between the values of portability
and durability to the respondent is not statistically significant, but evidence
exists for a mutually positive relationship between the two. We believe that
the lack of real significance in our data is due to our small pool of
respondents, and that this relationship should be investigated further with a
bigger sample.
4. The Value of Interactivity v. “Would you use this for more than the included
apps?”: Statistically significant. There is a mutually positive relationship
between these two (F = 5.3, d.f. = 1, p. < .05).
5. Gender v. The Value of Desirability: Not statistically significant.
6. Gender v. Fad: Close to statistically significant. Equal numbers of women
answered yes and no to the question of whether VR was a fad (12 and 12), but
nearly three-fourths of men answered the question in the negative (20 vs. 7).
7. Sitting Binary v. Watching YouTube: Not significant.

41
8. Sitting Binary v. Watching TV: Statistically significant. Those who said that
they could sit for longer periods of time also said that they would not use
the View-Master to watch TV (X2 = 4.8, d.f. = 1, p. < .05). 29 of the 35
respondents who indicated that they would use the View-Master for at least 15
minutes at a time also said that they would not use it to watch television. By
contrast, 8 of the 15 respondents who would only use the View-Master for
bouts smaller than 15 minutes indicated that they would not watch TV on it.
This seems to mean that, when considering the 13 respondents who would
watch an episode of television on a View-Master, half of them would only
watch a fraction of a desired episode before turning the system off. (See figs.
4-5.)
“How long would you use the View-Master in one sitting?” Fig. 4.

42
“Would you watch TV on this device?” Fig. 5.
9. Sitting Binary v. Watching a Movie: Not statistically significant, but trends in
the same way as the comparison between sitting and TV.
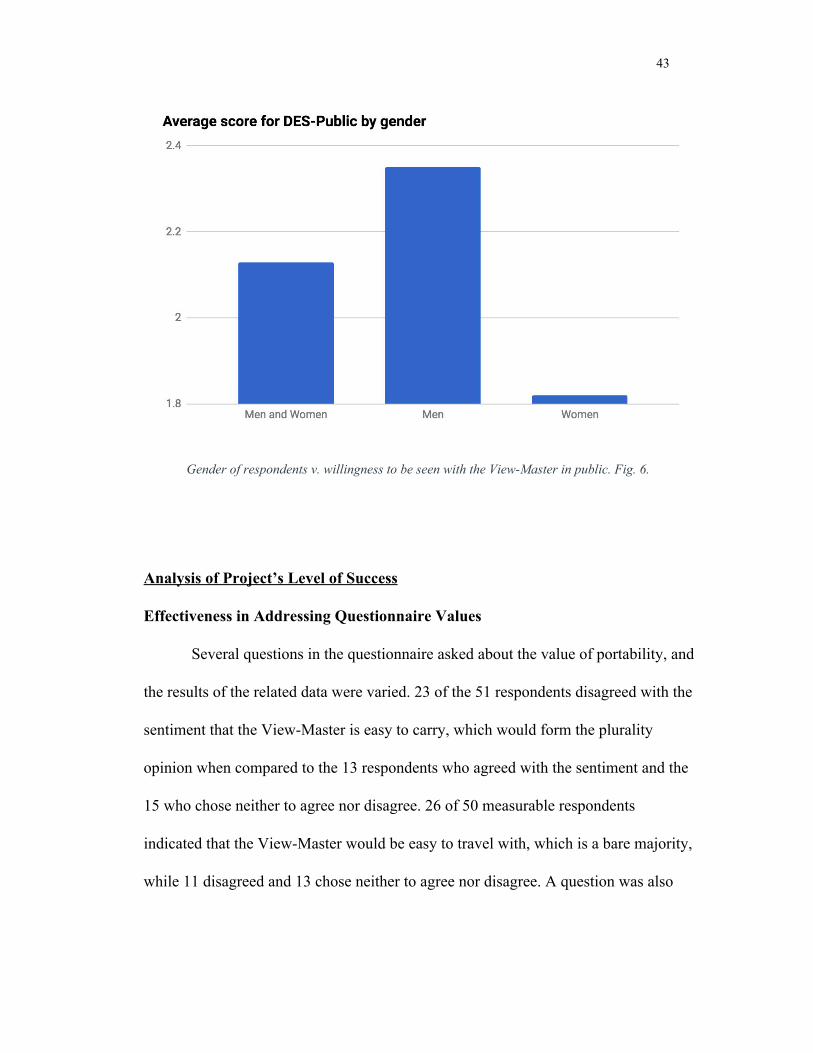
10. DES-Public v. Gender: Statistically significant. Men are more willing to be
seen with this in public than women (F = 4.7, d.f. = 1, p. < .05). (See Fig.
6.)
43
Gender of respondents v. willingness to be seen with the View-Master in public. Fig. 6.
Analysis of Project’s Level of Success
Effectiveness in Addressing Questionnaire Values
Several questions in the questionnaire asked about the value of portability, and
the results of the related data were varied. 23 of the 51 respondents disagreed with the
sentiment that the View-Master is easy to carry, which would form the plurality
opinion when compared to the 13 respondents who agreed with the sentiment and the
15 who chose neither to agree nor disagree. 26 of 50 measurable respondents
indicated that the View-Master would be easy to travel with, which is a bare majority,
while 11 disagreed and 13 chose neither to agree nor disagree. A question was also

44
asked of the respondents as to where they would be willing to take the View-Master.
Of 49 respondents, 57% said they would bring it on a road trip and nearly 80% said
they would bring it to a friend’s house, but only 16% of respondents would bring it to
work, 8% would take it to the park, and 6% would bring it to school. 10% of
respondents would not take the View-Master anywhere. The results provide an
instructive picture of what sorts of places a user would be inclined to use the headset,
and by extension, what kind of a social perception they expect peers in those
locations to have of their View-Master use.
Many points of data from the trials contribute to our understanding of users’
perception of the View-Master’s durability. That perception is mixed to negative.
Less than 4% thought that the smartphone used with the View-Master was loose
inside the headset, but 70% of respondents thought that the headset would break if
dropped, and 26% of respondents worried about packing the headset in luggage when
traveling. 43% of respondents thought that it was a sturdy unit, with 20% disagreeing
and 37% expressing no opinion. However, only 10 of the 51 respondents indicated
that either the latch, the interaction, or the smartphone mount were not secure. These
durability-related questions provided information that was useful, but also rather
basic. Different questions that could be pursued include those about how a user feels
the View-Master would handle a specific kind of physical distress, such as excessive
or concentrated heat.
Our comfort questions provided the information that was being sought. We

45
wanted to learn the amount of time for which a user would be willing to use the
device, and that was accomplished. We also learned much of the physical strain that
can be felt while using the View-Master VR viewer, some of which we did not expect
to be as prevalent among users as it was; 26% of the respondents reported feeling
dizzy while using the View-Master, and 48% indicated that they had experienced eye
strain. With such a high rate of eye strain, especially given that the respondents were
using the View-Master for a five-minute timed demonstration, this would be another
phenomenon to investigate further, and one for development teams and engineers to
address in their designs of future hardware and software as well.
With regards to simplicity, it was asked in the survey whether the user
required the instruction manual to successfully use the device, how easy the app(s)
were to use, and how confident the user felt in his or her use of the device. Only 8%
of users required the manual, and only 6% disagreed with the sentiment of the app(s)
being easy to use, compared to the 82% of respondents who agreed. Through these
findings, it is evident that navigating the software is not an issue for college students.
Testing use of the View-Master with a younger audience would be an ideal next step
in the continued research of virtual reality development, especially considering the
View-Master’s intended demographic of children at an elementary school age.
Levels of response to the questions with a basis in the value of interactivity
were positive. Two-thirds of respondents stated that they felt in control of the
experience, and 86% agreed or strongly agreed with the statement, “The View-Master

46
tracked my head movements perfectly.” 56% of respondents also found the
View-Master Preview Reel helpful in their use of the headset, which is notable for an
item which, as far as the demonstration was concerned, was used primarily for menu
functions. The trial itself, however, was limited in exploring the potential interactivity
available in the View-Master and in Cardboard-native software. Conducting a
longer-lasting trial with a deeper application experience, perhaps one oriented in
gaming, may provide added perspective for respondents and enrich their feedback to
future researchers.
The data concerning the desirability of the View-Master as found from our
trials may not be of great import to the company that created it, for the same reason
that our measure of simplicity was limited–this product was designed for a different
age demographic. Objects of desire that elementary schoolers and undergraduate
college students have in common are few and far between. It should be of interest that
65% of respondents indicated that they liked the way the View-Master headset
looked, and only 14% indicated that they did not. However, 57% of respondents said
that they would not use the View-Master in public. One theory for this is that the
respondents for these trials were practically all students of digital communications,
and that they would consider this technology to appeal to them more than it would to
those in different fields of study. Further investigation of desirability, and of these
two figures, would be benefited by a larger sample of respondents who are not all of a
discipline relating to digital communications.

47
Respondents were asked about the versatility of the View-Master specifically
because we researchers were seeking their feedback concerning the headset’s
potential use in education. The mixed responses from our trial participants are
reflected in the previous results section. In general, the data from the versatility
questions imply that, to our respondents, the idea of using the View-Master to teach
students works with some academic subjects, but not with others. 78% of respondents
said that the View-Master could be used to teach history, for example, but only 29%
said that it could be used to teach mathematics. Our research team foreseeing this
kind of opinion is why the specific response options were drafted. An ideal
continuation of this value’s investigation would involve inquiring about other subjects
or more specific subject disciplines, such as microbiology or Greek history.
The number of survey questions that dealt with the value of emotion were
minimal in retrospect. Only three questions were asked, all of them were
dichotomous, and two of them dealt with nostalgia, which means that the scope of our
understanding of a user’s emotions that are experienced while using the View-Master
may be incomplete. Indeed, nothing was directly asked about the emotions being felt
by the user. To address this in a future incarnation of the survey, one might choose to
draft an appropriate multi-optional question about the user’s emotional experience
while using VR (“How did you feel during this experience?” Happy, sad, confused,
annoyed, etc.).

48
Analysis of Questionnaire’s Reliability and Validity
In order to test the reliability of the responses provided by those who
participated in our research, questions were asked at different points in the
questionnaire that should have elicited similar responses, in an effort to demonstrate
alternate-form reliability. An example of this is the relationship between questions 13
and 27.
13. I would use the View-Master in public. (choose one)
❏ 1 (Strongly Disagree) ❏ 2 (Disagree) ❏ 3 (Neither Agree Nor Disagree) ❏ 4 (Agree) ❏ 5 (Strongly Agree)
27. Where would you take this device? (choose all that apply)
❏ Road trip ❏ Friend’s house ❏ Work Break ❏ School ❏ Park ❏ Nowhere
These two items are both framed differently–one is a statement, and the other
is a question. Their response options also contrast. Possible responses to the statement
in item 13 are offered in a Likert scale and are limited to one choice, while response
options to item 27 include unique answers to a direct question and feature the ability
to choose multiple answers. However, there still should be some consistency found in
the responses to these two items. Someone who strongly disagrees with the statement
49
in item 13 should likely answer “None” for item 27, or perhaps pick only one of the
several responses. Someone who strongly agrees with the statement in item 13 should
also choose multiple responses in item 27, to manifest which places in public that
user would indeed be willing to go to with the View-Master. When referencing the
data, this designed relationship between the two questions seems to hold up; all five
of the respondents who chose “None” for item 27 indicated that they either disagreed
or strongly disagreed with the statement in item 13. This is not the only example of
reliability testing in this questionnaire–items 10 and 15 also have an alternate-form
reliability relationship with each other.
As implied by the name, face validity of the questionnaire is taken at face
value. Does it seem to address what it intends to? Is the questionnaire coherent? Are
there any basic errors? Are the items in the questionnaire good ones? In the case of
this questionnaire, there were a few basic errors that could have distracted
respondents, and those errors are described in the “What were some problems?”
section below. The items which featured these errors should be classified as less valid
than they could have been. Generally, however, we received very few questions about
the structure of the survey from our respondents, which was good. Few or no
questions about a survey which one is given with no preparation and a few sentences
of instruction is a positive note for the survey’s validity.
50
What went particularly well?
Participation was a standout success in this research. 71 students accepted the
invitation to participate and were scheduled for individual trials, while the most we
had expected to volunteer was around 30. 19 of the 71 who signed up for a trial failed
to arrive and failed to reschedule, which meant that 51 total respondents participated
in the survey and provided data for analysis. As a team of researchers, we agreed on
why we believe this happened; participation in the survey was incentivized by Daniel
Faltesek, PhD., for his students. He offered students in his course two choices for an
assignment–participate in the survey and then submit a response to a series of
questions about it directly to him, or develop and complete a unique and original
project. Many of the students likely perceived participation in the survey as less work,
and volunteered themselves accordingly. Incentivization such as this is a key element
in many successful surveys. Eleanor Singer and Cong Ye aggregated information
from many studies in their paper “The Use and Effects of Incentives in Surveys,” and
they posit that, among other things, incentives have an effect on nearly every kind of
survey, whether it be carried out in person, by mail, or by phone. It should be noted,
however, that most studies of incentive success typically concern incentives that are
fiscal.

51
What were some problems?
Upon review of the survey itself, one glaring error was noticed; potential
responses to Question 11 were written incorrectly. The question reads:
11. How long could you use this in one sitting? (Please select only one option) ❏ Less than 15 min. ❏ 15 to 30 min. ❏ 30 to 45 min. ❏ 45 to 60 min. ❏ Greater than 60 min.
The central three responses overlap each other. This likely did not provide a
difficulty for every respondent, but it was still not appropriate. If a respondent, for
example, felt that she could use the View-Master for exactly 30 minutes, which
response would she choose? She would be at an impasse between the second and
third response options. Even if she elected to choose one of them to be her response,
it still would not be taken by the researchers exactly as it would have been intended.
Too much time was scheduled for each interaction. We estimated that it would
take an average respondent at least five minutes to use the View-Master VR viewer,
and about ten minutes to fill in the survey. This was incorrect; most respondents
stopped using the View-Master within two minutes, and filled out the survey in less
than five. In nearly every trial, the researchers present were left with over two-thirds
of their scheduled time to do next to nothing.
Use of time over the ten-week period that we had available could also have
been better utilized. Due to an initial lack of researchers and a consequent uncertainty

52
about whether or not the project and its course would even continue, not much in the
way of planning was accomplished during the first two weeks, let alone researching
or drafting. Several of the researchers were also unavailable for varying amounts of
time throughout the period, which made coordination and in-person discussions
difficult and sometimes close to impossible. The final report written by the team
ended up being rushed in order to publish on time, and still could have been formatted
more before it was printed. As mentioned by Kelley et al., “researchers must prepare
to spend substantial time on the data analysis phase of a survey (and this should be
built into the project plan). When analysis is rushed, often important aspects of the
data are missed and sometimes the wrong analyses are conducted, leading to both
inaccurate results and misleading conclusions” (p. 265). Kelley et al. also note,
however, that those conducting research “must not engage in data dredging, a practice
that can arise especially in studies in which large numbers of dependent variables can
be related to large numbers of independent variables (outcomes)” (p. 265). There is a
plethora of ways to spend either too little or too much time on data collection and
analysis, and researchers should be careful with time spent in each project they
pursue. When considering the use of time with trials, needing to conduct the
administration of the survey in person also took much longer than it would have taken
to conduct a similarly written survey by mail, email, or potentially even over the
phone, although it still took less time than a face-to-face interview with no written
survey would have required. Data analysis was not very deep, as a result. However, as
53
the test was a pre-test, it should not be said that the exercise and analysis was
incomplete; it should be considered appropriate for what the project was intended to
be. These issues with time constraints are common in similarly structured research.
Other difficulties were encountered. We had one View-Master VR viewer to
use for the entire project. This was sufficient during product development, with only
nine research participants, but when more than two researchers would have been
available to conduct trials at one time, it would have been beneficial to use more than
one View-Master VR viewer and more than one smartphone. A related problem: the
trial was also a lonely one. Each respondent was required to use the View-Master VR
viewer by himself or herself, in a practically non-social setting. Testing the one
person’s use of a View-Master in the midst of a social gathering or testing the use of
multiple View-Masters being used by friends in the same room are both paths of
research that may yield different results than those found here. This desire to
understand how the View-Master is perceived in social settings may lead market
research in the direction of other types of investigation, such as utilizing focus
groups.
Conclusion
This project was meant to be an execution of typical preliminary research that
one would find in studying user experience. It should not be considered a complete
research project. Continuing this research would involve editing the questionnaire,

54
drawing out a larger sample, amassing more stock View-Master VR viewers, and
testing user experience with virtual reality on a much larger scale, with several finite
hypotheses to drive the editing and testing. Time management is even more necessary
in a project of that size than it was in this one. This project does, however, provide
adequate direction for further investigation into the phenomena considered significant
in our data analysis. Men being more willing to be seen in public using the
View-Master, people being willing to use VR for long periods of time but not for
watching television, and people who rate the View-Master highly for interactivity
also happening to be more open to other applications of VR are all intriguing findings
that should be explored.

55
Appendix A: Survey

56
Appendix A: Survey
In this survey we will be asking your thoughts on the View-Master that you had the opportunity to use. The survey will take approximately 10 minutes to complete with 38
questions.
1. I remember using something similar this when I was younger.
❏ Yes ❏ No
2. Have you ever seen a product like this before?
❏ Yes ❏ No
3. Is virtual reality a fad?
❏ Yes ❏ No
4. Reading the instruction manual was required for me to understand this device.
❏ Yes ❏ No
5. I felt in control of the experience.
❏ Yes ❏ No
6. One button was enough to operate the View-Master.
❏ Yes ❏ No
7. The View-Master needs a head strap.
❏ Yes ❏ No
8. The phone was loose in the device.
❏ Yes ❏ No
9. The device will break if I drop it.
❏ Yes ❏ No
10. I would worry about packing this in my things when traveling.
❏ Yes ❏ No

57
11. How long could you use this in one sitting? (Please select only one option)
❏ Less than 15 min. ❏ 15 to 30 min. ❏ 30 to 45 min. ❏ 45 to 60 min. ❏ Greater than 60 min.
For the next section rate the following statements by circling a number between
1 to 5. With 1 being Strongly Disagree and 5 being Strongly Agree.
Questions Strongly Disagree Disagree Neither Agree
or disagree Agree Strongly Agree
12. I like how the View-Master looks.
1 2 3 4 5
13. I would use the View-Master in public.
1 2 3 4 5
14.The device is convenient to carry around.
1 2 3 4 5
15. This device is easy to travel with.
1 2 3 4 5
16. The View-Master is sturdy. 1 2 3 4 5
17. The Preview Reel is easy to lose.
1 2 3 4 5
18. The View-Master tracked my head movements perfectly.
1 2 3 4 5
19. The apps were easy to use. 1 2 3 4 5

58
20. The Preview Reel was helpful in the use of the app.
1 2 3 4 5
21. This device lets me do things I would not normally do.
1 2 3 4 5
22. This is more useful for Entertainment than Education.
1 2 3 4 5
23. I felt very confident using the device.
1 2 3 4 5
24. This device enhances the effectiveness of education.
1 2 3 4 5
In the next section select all the options that apply
25. How many of the following did you experience using the View-Master? ❏ Eye Strain ❏ Tired arms ❏ Sore neck ❏ Dizziness ❏ I didn’t experience anything listed
26. I felt the View-Master’s ______ was not secure.
❏ Latch ❏ Interaction button ❏ Cell phone mount ❏ None

59
27. Where would you take this device? ❏ Road trip ❏ Friend’s house ❏ Work Break ❏ School ❏ Park ❏ Nowhere
28. I would watch the following on this device:
❏ A YouTube video ❏ A TV Episode ❏ A movie ❏ None of the above
29. The apps in this device could be used to teach…
❏ Math ❏ English ❏ Science ❏ History ❏ Art ❏ None
For the final questions select one response per question. 30. Do you see this being used for more than the predetermined apps?
❏ Yes ❏ No
31. Do you think VR is more capable of communicating emotions than traditional forms of media?
❏ Yes

60
❏ No 32. Could you teach my parents how to use this?
❏ Yes ❏ No
33. Would you recommend the View-Master to a friend?
❏ Yes ❏ No
34. I know someone that I would give the View-Master to as a gift.
❏ Yes ❏ No
Demographic Questions
35. What is your current major at Oregon State University? ___________________________ 36. What is your current class standing?
❏ Frosh ❏ Sophomore ❏ Junior ❏ Senior
37. Are you a full-time (greater than 12 credits) or part-time student (less than 12 credits)?
❏ Full-time ❏ Part-time
38. Are you Currently Employed?
❏ Full-Time ❏ Part-Time ❏ No

61
Appendix B: Codebook

62
Appendix B: Codebook
View-Master Usability Study Survey Codebook In this survey we will be asking your thoughts on the View-Master that you had the
opportunity to use. The survey will take approximately 10 minutes to complete with 38 questions.
For Questions 1-10:
No 0
Yes 1
Missing 9
1. I remember using something similar this when I was younger. EMO - Younger ❏ Yes ❏ No
2. Have you ever seen a product like this before? EMO - SeenBefore
❏ Yes ❏ No
3. Is virtual reality a fad? DES - Fad
❏ Yes ❏ No
4. Reading the instruction manual was required for me to understand this device. SIM - Manual
❏ Yes ❏ No
5. I felt in control of the experience. INT - Control
❏ Yes ❏ No
6. One button was enough to operate the View-Master. DES - Button
❏ Yes ❏ No
7. The View-Master needs a head strap. COMF - Strap
❏ Yes ❏ No

63
8. The phone was loose in the device. DUR - LoosePhone ❏ Yes ❏ No
9. The device will break if I drop it. DUR - Drop
❏ Yes ❏ No
10. I would worry about packing this in my things when traveling. DUR - Packing
❏ Yes ❏ No
For Question 11:
Less than 15 1
15-30 2
30-45 3
45-60 4
Greater than 60 5
Missing 9
11. How long could you use this in one sitting? (Please select only one option) COMF - Sitting
❏ Less than 15 min. ❏ 15 to 30 min. ❏ 30 to 45 min. ❏ 45 to 60 min. ❏ Greater than 60 min.
For 12-24 (NOTE “NEITHER AGREE/DISAGREE” IS 8):
Strongly Disagree 1
Disagree 2
Neither Agree/Disagree 8
Agree 3

64
Strongly Agree 4
Missing 9
For the next section rate the following statements by circling a number between
1 to 5. With 1 being Strongly Disagree and 5 being Strongly Agree.
Questions Strongly Disagree Disagree Neither Agree
or disagree Agree Strongly Agree
12. I like how the View-Master looks. DES - Looks
1 2 3 4 5
13. I would use the View-Master in public. DES - Public
1 2 3 4 5
14.The device is convenient to carry around. PORT - Carry
1 2 3 4 5
15. This device is easy to travel with. PORT - Travel
1 2 3 4 5
16. The View-Master is sturdy. DUR - Sturdy 1 2 3 4 5
17. The Preview Reel is easy to lose. PORT - ReelLoss
1 2 3 4 5
18. The View-Master tracked my head movements perfectly. INT - Tracking
1 2 3 4 5
19. The apps were easy to use. SIM - AppEasy 1 2 3 4 5
20. The Preview Reel was helpful in the use of the app. 1 2 3 4 5

65
INT - ReelUse
21. This device lets me do things I would not normally do. INT - Normally
1 2 3 4 5
22. This is more useful for Entertainment than Education. VER - Useful
1 2 3 4 5
23. I felt very confident using the device. SIM - Confident
1 2 3 4 5
24. This device enhances the effectiveness of education. VER - Effective
1 2 3 4 5
In the next section select all the options that apply For 25-29
No 0
Yes 1
Ambiguous 8
Missing 9
25. How many of the following did you experience using the View-Master? ❏ Eye Strain COMF - PainEyes ❏ Tired arms COMF - PainArms ❏ Sore neck COMF - PainNeck ❏ Dizziness COMF - PainDizzy
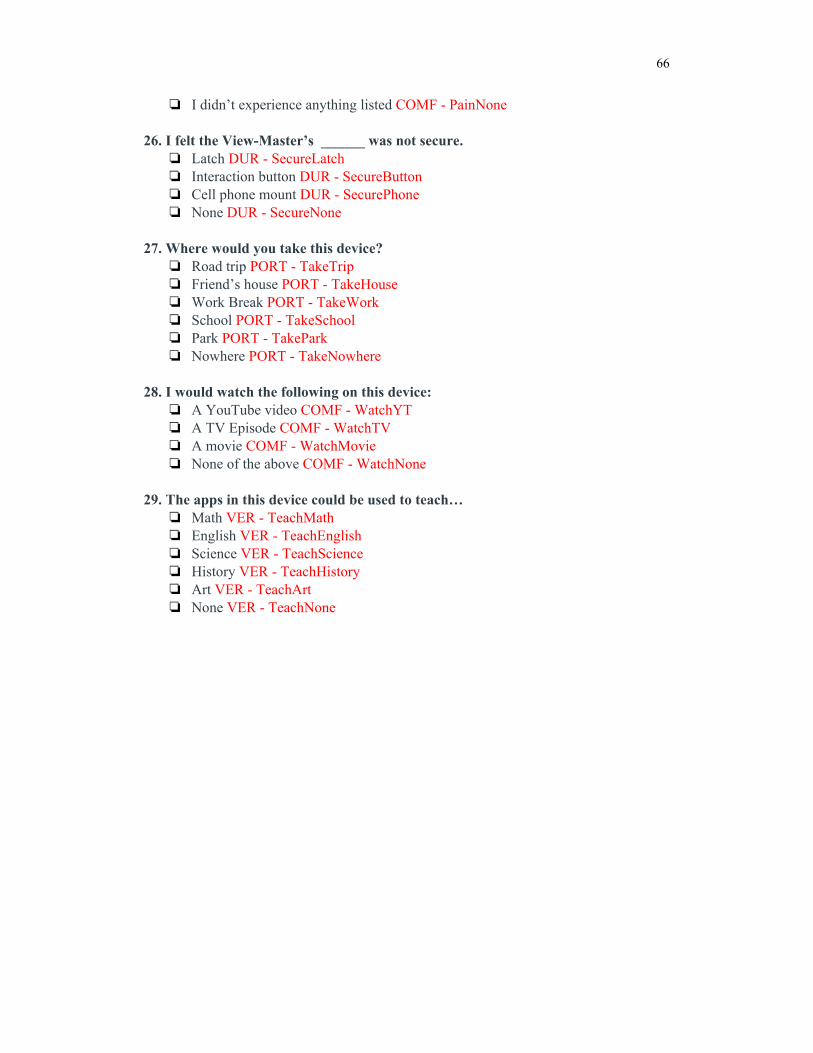
66
❏ I didn’t experience anything listed COMF - PainNone 26. I felt the View-Master’s ______ was not secure.
❏ Latch DUR - SecureLatch ❏ Interaction button DUR - SecureButton ❏ Cell phone mount DUR - SecurePhone ❏ None DUR - SecureNone
27. Where would you take this device?
❏ Road trip PORT - TakeTrip ❏ Friend’s house PORT - TakeHouse ❏ Work Break PORT - TakeWork ❏ School PORT - TakeSchool ❏ Park PORT - TakePark ❏ Nowhere PORT - TakeNowhere
28. I would watch the following on this device:
❏ A YouTube video COMF - WatchYT ❏ A TV Episode COMF - WatchTV ❏ A movie COMF - WatchMovie ❏ None of the above COMF - WatchNone
29. The apps in this device could be used to teach…
❏ Math VER - TeachMath ❏ English VER - TeachEnglish ❏ Science VER - TeachScience ❏ History VER - TeachHistory ❏ Art VER - TeachArt ❏ None VER - TeachNone
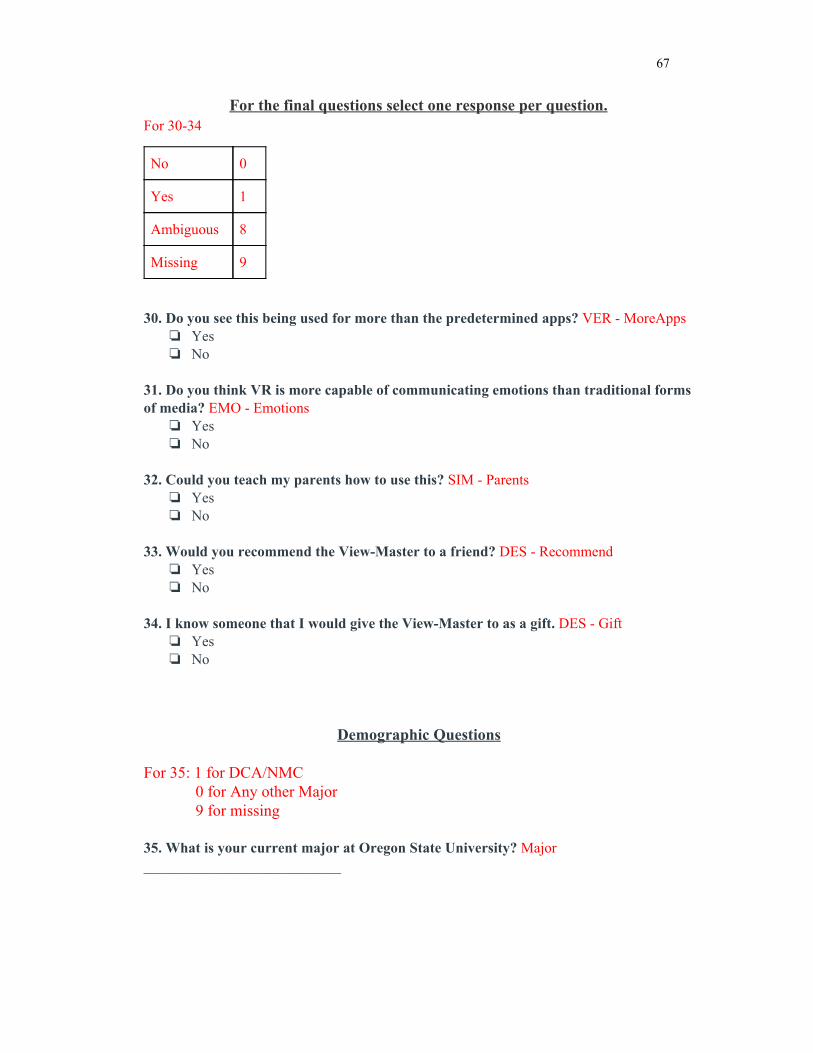
67
For the final questions select one response per question. For 30-34
No 0
Yes 1
Ambiguous 8
Missing 9
30. Do you see this being used for more than the predetermined apps? VER - MoreApps ❏ Yes ❏ No
31. Do you think VR is more capable of communicating emotions than traditional forms of media? EMO - Emotions
❏ Yes ❏ No
32. Could you teach my parents how to use this? SIM - Parents
❏ Yes ❏ No
33. Would you recommend the View-Master to a friend? DES - Recommend
❏ Yes ❏ No
34. I know someone that I would give the View-Master to as a gift. DES - Gift
❏ Yes ❏ No
Demographic Questions For 35: 1 for DCA/NMC 0 for Any other Major 9 for missing 35. What is your current major at Oregon State University? Major ___________________________
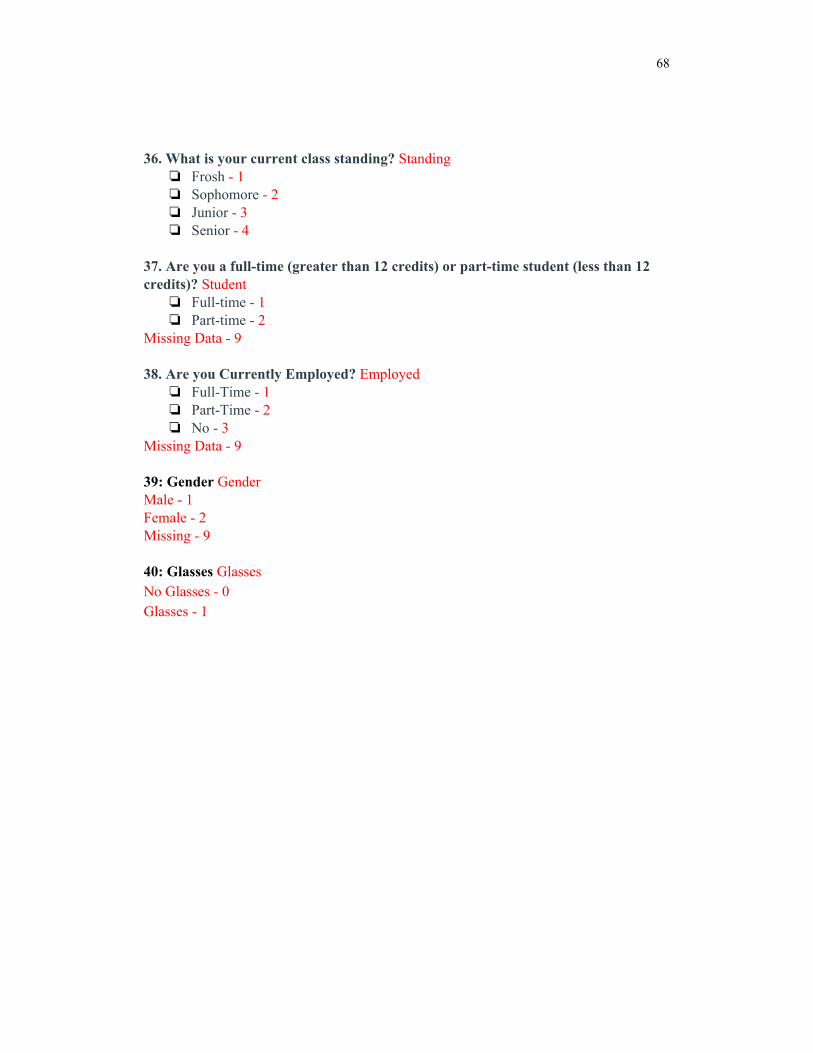
68
36. What is your current class standing? Standing
❏ Frosh - 1 ❏ Sophomore - 2 ❏ Junior - 3 ❏ Senior - 4
37. Are you a full-time (greater than 12 credits) or part-time student (less than 12 credits)? Student
❏ Full-time - 1 ❏ Part-time - 2
Missing Data - 9
38. Are you Currently Employed? Employed ❏ Full-Time - 1 ❏ Part-Time - 2 ❏ No - 3
Missing Data - 9 39: Gender Gender Male - 1 Female - 2 Missing - 9 40: Glasses Glasses No Glasses - 0 Glasses - 1

69
Appendix C: Original Report

70
Questionnaire Design and Evaluation of
the View-Master VR Viewer
Performed by William E. Loges, Ph.D. and:
Tim Andrade
Makenzie Bittinger
Kevin Connelly
Andrew McUne
Aaron Meche
Brandon Olsen
Cassidy Wood
Josh Worden
Oregon State University, 2017
71
Executive Summary
What do today’s college students think about virtual reality (VR)? As to its
nature and longevity, do they consider it to be a passing fad? Or do they, the next
generation of educators and entrepreneurs, consider it to be a potential vehicle for
education? And what of preference based upon sex? Does one’s gender seem to
implicate a difference in deciding what one would use this device for? These are
some of the questions that were answered in this demonstration of a questionnaire
concerning VR usability.
The experiment began by first finding a proper VR headset to use for our
observations. Considering that limited financial resources were available, it was
ultimately decided to use one of the more simple VR headsets, known as the
View-Master. The View-Master headset works by using a View-Master app on a
smartphone. While the app is open, the smartphone is placed inside the View-Master
headset, and a user can look through the headset to reveal a 3-dimensional world. We
used our personal smartphones for this experiment; and in order to make the
experience relatively similar for every participant, we had each individual use the
same app - which was an underwater experience. Next, it was necessary to find a test
group that would be able to participate in the experiment. Dan Faltesek’s New Media
Futures class ultimately became that test group; and from that group, 51 total
participants were obtained for our working sample. After that, a 38-question survey
was created. We started creating these items through usability concepts that can be

72
found on usability.gov. We began with about 20 concepts, then narrowed it down to
eight: portability, durability, comfort, simplicity, interactivity, desirability, versatility,
and emotion; and each of these eight concepts will be described in more detail, later
in the report. We created roughly 5 items per concept, and from there, edited the
questionnaire down to 38 total items that accurately test the usability of this device.
Finally, our testing began. One student came into the gamelab at a time, every
30 minutes, to be tested. They were asked to sit down, then were handed the
View-Master and were left on their own for the next 5 minutes to have an authentic
experience. Because there were in-app purchases for the View-Master, we were
limited to only using one demo video for testing. However, that 5 minute trial video
was enough for a participant to have an accurate virtual reality experience.
After completing the video on the View-Master, each participant was asked to
answer the questionnaire. It took roughly ten minutes to complete, and each student
was given class credit for agreeing to participate in our experiment. Once all 51
participants were tested, we gathered the data and began our analysis. Many different
variables and relationships between the data points were gathered and tested, and we
found a few that were statistically significant. Men tested significantly higher than
women in overall desirability. Also, notably more men had seen the device before,
where women had not. More men tested that virtual reality is not a fad, where
women were split evenly between thinking it is and isn’t. Surprisingly, although we
had the students test the View-Master using a science-related app, we ended up with

73
results stating that VR would be better for teaching the subjects of Math and English
than Science and History.
Introduction
The View-Master Virtual Reality Viewer is a smartphone-enabled virtual
reality (VR) headset, currently sold by the toy manufacturing company Mattel. When
used in conjunction with a properly equipped smartphone, it allows for the
participation of the user in immersive 3D viewing of VR. The headset is made of hard
plastic with a wide tinted visor on the front and hard rubber protruding from the back
surrounding the two convex lenses in order to accommodate face shape. (See Fig. 1.)
Sound from the smartphone is able to filter out from the unit via the small slats at the
bottom corners of the face of the unit that contains the eyepieces. A clasp on the top
unlatches to allow the viewer to swing open, revealing the other side of the lenses, a
dedicated three-prong clamp for the user’s smartphone, and an additional plastic
brace to fit into the clamp if the smartphone has a smaller body. (See Fig. 2.) The
body of the headset is red, and when closed, only features one point of input to
manipulate the smartphone inside: a large, orange trigger, which protrudes from unit
near the right side of the user’s face. A wrist strap is also attached to the unit, on the
bottom, near the sound slats.

74
Fig. 1 - The Mattel View-Master VR Viewer (Closed Unit) 1
1Sridhar, S. (2016, March 1). Google Store starts selling View-Master and C1-Glass Cardboard VR Viewers. Retrieved March 23, 2017, from http://www.fonearena.com/blog/176707/google-store-starts-selling-view-master-and-c1-glass-cardboard-vr-viewers.html

75
Fig. 2 - The Mattel View-Master VR Viewer (Open Unit, Containing Smartphone) 2
The View-Master is packaged in a cardboard box, with the top of the box
extending into an additional cardboard panel that folds over the front, with two
attached dog-ear flaps that are inserted into the seams on the sides of the box. When
the box is opened, by pulling the panel out and up from the body of the box, the
View-Master is immediately visible underneath a thin plastic mold. The cardboard
panel that was also immediately above the View-Master, before it was lifted away,
features a graphic that instructs the consumer concerning the enabling of the
View-Master’s use with a smartphone. When the first plastic mold is discarded and
the View-Master unit is removed, a booklet of instructions can be found pressed
against the back of the box by remaining plastic. The box also contains a separate
object called the Preview Reel, which is a plastic disc with fourteen spaces on its
face. This object is intended to be placed on a flat surface near the user of the headset,
and then to be a visual reference point for that headset during use; the person using
the View-Master can look directly at the Preview Reel laying flat on a table nearby,
and the disc will prompt an appropriate menu for the user to navigate, depending on
the nature of his current use.
2G. (2016, February 06). Apple now sells the View-Master VR through its own stores. Retrieved March 23, 2017, from http://www.gsmarena.com/apple_now_sells_the_viewmaster_vr_starter_pack_through_its_own_stores-blog-16483.php

76
The VR that is enabled through the View-Master is comprised of both
artificial environments made from computer-generated imagery and edited footage of
actual environments, the latter of which is more often known as augmented reality.
The most heavily advertised uses of the viewer involve dedicated smartphone apps
published by Mattel; one app houses a National Geographic-branded environment
featuring Earth in the time of dinosaurs, and another app contains an underwater
exhibition of sharks and other sea creatures, courtesy of Discovery. More official
View-Master apps have been released since the headset’s initial public release,
including one sponsored by the Smithsonian Museum, and others of a more
immediately fictitious nature, such as Batman and Mattel’s own Masters of the
Universe.
The device is not limited to the use of native apps developed by Mattel. The
View-Master VR Viewer was created as a joint collaboration between Mattel and the
technology company of Google as an implement for Google Cardboard, the
company’s virtual reality platform. As such, any Cardboard-based applications
available in online smartphone markets can be freely used with the viewer, as well as
standard smartphone applications that contain Cardboard-dedicated content, such as
YouTube.
Some consumers are likely to know the name of View-Master from
stereoscopic viewers that have been sold in the past, by Mattel and by others. Since
the 1930s, View-Master has been the trademarked name of successive models of
77
handheld stereoscopic dual-lens film strip viewers. These viewers accepted native
film strips into the main unit via a slot in front of the eyepieces. These film strips
being distributed in the form of circular pieces of paperboard containing seven
two-panel sets of negatives. These paperboard circles were called “reels”, and the
Preview Reel pays very obvious homage to these reels in both its shape and size. No
mention of these previous iterations of the View-Master is made in the questionnaire,
but incidentally, the value of nostalgia that this fosters is addressed within the
questionnaire.
Concepts and Definitions
Twenty values were found on the usability.gov website, and from these
values, eight individual concepts were derived that then served as the organizational
values for the tabulation of our research data. The eight concepts that were found to
be most appropriate for evaluating this experiment are portability, durability, comfort,
desirability, simplicity, versatility, emotion, and interactivity. The concepts are
defined herein.
Portability:
Portability in media products is based on a product’s capability of being
transportable and still being generally capable of accomplishing the same tasks in
different environments. Is a product easy to move from one location to another, and

78
does it remain effective in that new environment? Then, by definition, it’s portable.
There is such a thing as software portability, such as if an app can be used on
different devices or operating systems with the same effectiveness. For the purposes
of this project, we primarily are concerned with hardware portability, which refers to
how portable a media product is physically. For instance, a laptop computer should be
more physically portable than a desktop computer since its hardware is lighter,
slimmer and has a battery.
Related concepts include durability (more durable products will be more
capable of being transported and in transitioning environments), desirability, and
versatility.
Durability:
Durability is essentially the assurance that a media product will be able to
sustain a relatively long, continuous and useful life without an inordinate amount of
repairs or maintenance. Basically, a media product is durable if it can be used often
while consistently providing the expected result or service over an extended lifetime.
How long this “lifetime” is would depend on the product — the life of headphones
would likely be measured in months, while a desktop computer would be in years.
Regardless, the relative durability of a media product is how well it can withstand
wear and tear over time with normal usage amounts.
79
Related concepts include portability (durable products could withstand being
transported more easily if designed for it) and desirability (durable products would
require less maintenance and thus more desirability).
Comfort:
Media products are defined as comfortable if they do not cause the user undue
or excessive pain due to normal usage of the media product, and if the product allows
a certain element of ease or relaxation during usage. Just like a misshapen chair
would be uncomfortable to sit in, a pair of awkwardly shaped headphones would
cause ear pain and thus wouldn’t be a comfortable media product. Comfortable media
products are designed ergonomically so that normal usage will be easy to perform,
both because the product is physically designed for efficient usage but also the
software is comfortable — the interface is understandable, instructions are clear,
input methods are coherent, etc.
Related concepts include desirability, emotion, and simplicity.
Simplicity:
While complexity is easy, simplicity is hard. Simplicity in media consists of
many components working together in an easy to use and understandable way.
Though simplicity can be measured through user experience (how the user interacts
or feels), it also can be measured through user interface (what the user sees). In order

80
to understand the user’s interaction with the View-Master’s simplicity, we must
gather information in which the experience was clear, understandable, and useable in
direction and design.
Related concepts include usability, interactivity, and emotion.
Interactivity:
Interactivity in media refers to the product or service including ways for the
user to respond to the media and affect the experience firsthand. In other words, the
output from the media is affected by the input of the users. Does the user have any
control over what’s happening, like playing a videogame with a controller, or does
the user simply observe, like watching a movie?
Related concepts include desirability (users could possibly want a media
product that allows them to influence the content) or versatility (a truly interactive
product provides as many different experiences as the user creates themselves,
whereas a movie has only one narrative or experience).
Desirability:
Desirability puts emphasis on the quality of technology and if it’s worth
having. Today’s society allows for the ability of choice between similar products at
similar costs, so what makes a consumer buy the View-Master over another similar
product? In order to be a leader in the media world, products must be desirable; this
81
means how high the product ranks is in brand recognition, usability, and
essentialness. The higher the product ranks, the more likely of product success.
Related concepts include usability, comfort, portability, and durability.
Versatility:
Media versatility is essentially one product's ability to adapt to and allow for
different functions to perform at the same time. Modern media allows multiple
functions to be completed through one item which allows the ability to do more with
less. How much versatility does the View-Master have? How many different tasks
can be completed? Do you need multiple apps to be considered versatile or can that
be achieved through one app?
Related concepts include interactivity and desirability.
Emotion:
Emotion is the state of consciousness in which joy, sorrow, fear, or any other
feelings are experienced. How are they feeling about this? Does this make them feel
happy? Does this make them feel frustrated? The essential question is, how does this
product make you feel?
Related concepts include desirability, interactivity, comfort, and simplicity.

82
Methods and Administration
The survey was announced solely to Dan Faltesek’s New Media Futures Class
and signups were passed around in class, with 71 students enlisting to partake in the
usability study. Due to students who signed up but never actually showed, 51 students
ultimately took part in the survey. Students who participated in the study were able to
receive participation points for their class project after completing a one-page
reflection.
Once the questionnaire design was finished and the signups were completed,
the tests were conducted over a 10-day period in 30-minute slots for each subject.
Two test administrators were present in the previously determined time slots in the
Game Lab in Snell Hall, where the study took place.
Once the subject arrived, the introduction was brief. The subject was shown
the View-Master, informed they would use the product for a short time and take a
roughly 10-minute questionnaire afterwards. The administrators put their personal
phone in the View-Master with the application loaded, handed over the View-Master
and let the subject know they could use it standing up or sitting down. The
administrators didn’t explain what the demo actually was about or what the subject
should do, in order to make the experience more like a real world situation when
administrators wouldn’t be present. The administrators did, however, make sure the
subject was able to start using the View-Master without problems so they could at
least experience the app. Also, the administrators generally refrained from answering

83
questions during the subject’s use of the product unless they were unable to continue
by themselves. For instance, one subject had some problems with the app and got
stuck on a screen without being able to move forward. The administrators helped fix
the problem briefly and returned the View-Master to the subject. Other than that, the
administrators let the participants experience the app and View-Master without
interruption.
The app used in the test experience was a demo of the View-Master Discovery
Underwater app. The demo immersed the user in a 5-minute sequence of underwater
visuals, which automatically ended the demo after that period. Once the subject was
finished, they were given the questionnaire and told to complete it in the same room,
being told it would take about 10 minutes. Similar to during the usage of the
View-Master, the administrators refrained from answering questions about the survey
in order that someone who asked a question about the survey wouldn’t get a different
or additional explanation about an item that someone who didn’t ask a question
would get. Once the subject was done with the questionnaire, they returned it to the
administrators and no more contact was made between the two parties afterwards.
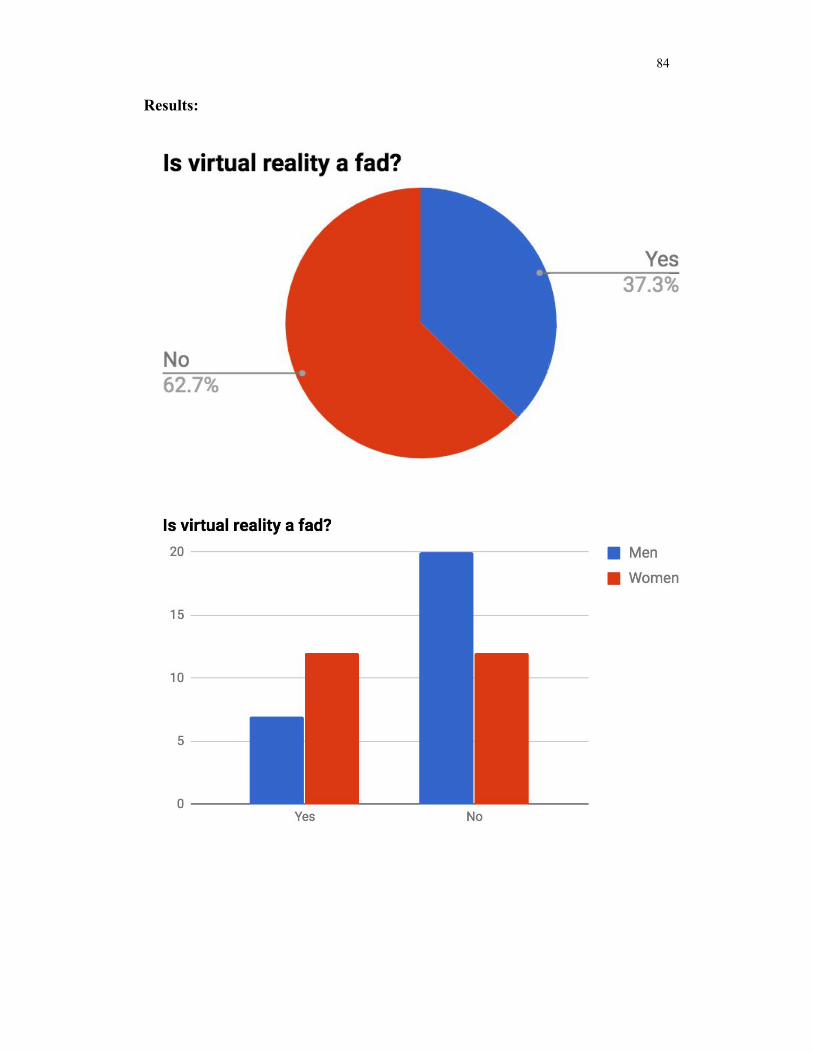
84
Results:

85

86

87

88
Relationships Between Data
Overall we didn’t have a high variance between our data, and a significant
part of this was a result of the low number of participants in the surveying process.
Despite these drawbacks, we were able to ascertain a few relationships between our
data. One such relationship is that women were more likely than men to think of
virtual reality as being a fad. There were three times as many men who believed it
wasn’t a fad than those who thought of it as one. Seventy-three percent of participants
would not like to be seen using this device in public. Of the people that were willing
to use the device in a public place more men chose they would use the device in
public than women. A naturally occurring hypothesis was upperclassmen, those who

89
are media majors, would find more purposes to use this device; their responses
reflected it could be used for Math and English, but Science and Art was not as
significant.
Several of the data points provided results that were contrary to our initial
hypothesis. One unexpected data point came from individuals who experienced
discomfort whether it be eyestrain, sore arms, dizziness, and/or sore neck, in relation
to whether they would recommend the View-Master to a friend. Our initial hypothesis
suggested these items to have direct correlation though our data provided the
opposite. Another result that had no correlation was between how long respondents
would use the View-Master and what they would use it for. Individuals who said they
were willing to use the device for a limited amount of time, five to ten minutes, also
claimed they were willing to watch an episode of tv or a movie.
The questionnaire was constructed with four desirability questions which were
meant to separate positive and negative attitudes toward the product. Using this we
were able to see how our participants felt about the desirability of the View-Master.
We found that sixty-five percent of respondents had a mostly favorable attitude
toward the View-Master, twenty-four percent had a slightly negative or neutral view,
and ten percent had a purely negative view.

90
Conclusion and Future Research
The final results of this test study suggest a definitive need to follow up with a
larger study. Several data points had a slight statistical significance that would be
solidly affirmed either way with a larger population. This study appealed to a single
New Media Communications (NMC) class of approximately 150 students. 71
students showed initial interest in participating and 51 students arrived to participate
in the study. This gives the study a 70% response rate. Therefore, there is reasonable
expectation that future studies will have an excellent response rate. The next iteration
of the study will have to expand its reach to more than just a single NMC class on
campus to ensure a larger pool of respondents. To support an increase in population
size for the study, the time allocated to each participant’s experience should be
revised as well. Due to unfamiliarity with the product, a large block of time was
allocated to the subject for each participant. The application came with a set
appointment time and the survey was simple and easy for the participant to fill out.
After several meetings it was determined that instead of a 30 minute block a ten
minute block would have been all that was necessary for each meeting time.
To increase the validity of the survey experience and accommodate new
questions, the study would benefit from the inclusion of more variety and also other
types of VR and AR experiences, e.g, 360 video. The eight concepts used were very
successful in obtaining insight into perceptions and opinions of the View-Master; and
we found that other user research surveys used similar concepts.
91
Other virtual reality headsets are also available for evaluation, at varying
levels of cost and accessibility to the common consumer. Some headsets that are
considered to have higher price ranges and run on their own respective native
softwares include the Oculus Rift, the HTC Vive, Sony’s PlayStation VR, and
Samsung Gear VR. Many other headsets with a lower cost use Google Cardboard
software as their operating system, and these viewers, besides the View-Master VR
viewer, include dozens of iterations, with some produced by Google and other
licensed companies literally being made of cardboard, in order to maximize
accessibility. These options would provide many vehicles for additional
questionnaires and general research, especially when concerning questions detailing
the influence of cost and market.
Overall, discovering some of the relationships that were found was surprising.
We think this experiment could be improved with a bigger sample size and more
variety in apps and hardware.
92
Works Cited
Carmines, E. G., & Zeller, R. A. (2008). Reliability and validity assessment.
Newbury Park, Calif.: Sage Publ. p. 12.
Corke, G. (2017, February 16). Virtual Reality for architecture: a beginner's
guide. Retrieved from
http://www.aecmag.com/59-features/1166-virtual-reality-for-architecture-a-beginner-
s-guide
Edwards, B. (2017, February 02). Unraveling The Enigma Of Nintendo's
Virtual Boy, 20 Years Later. Retrieved from
https://www.fastcompany.com/3050016/unraveling-the-enigma-of-nintendos-virtual-
boy-20-years-later
Fielder, E. P., Oishi, S. M., Litwin, M. S., Bourque, L. B., & Fink, A. (1995).
The survey kit. How to ask survey questions (Vol. 2). Thousand Oaks, CA: SAGE
Publications, Inc.
Fielder, E. P., Oishi, S. M., Litwin, M. S., Bourque, L. B., & Fink, A. (1995).
The survey kit. How to design surveys (Vol. 5). Thousand Oaks, CA: SAGE
Publications, Inc.
Fielder, E. P., Oishi, S. M., Litwin, M. S., Bourque, L. B., & Fink, A. (1995).
The survey kit. How to measure survey reliability and validity. (Vol. 9). Thousand
Oaks, CA: SAGE Publications, Inc.

93
G. (2016, February 06). Apple now sells the View-Master VR through its own
stores. Retrieved from
http://www.gsmarena.com/apple_now_sells_the_viewmaster_vr_starter_pack_throug
h_its_own_stores-blog-16483.php
Girard, J. (2016, July 12). Visual Color Symbolism Chart by Culture.
Retrieved from
https://www.thoughtco.com/visual-color-symbolism-chart-by-culture-4062177.
Hassenzahl, M. (2011, January). User Experience and Experience Design.
Web. Retrieved from
https://www.interaction-design.org/literature/book/the-encyclopedia-of-human-comp
uter-interaction-2nd-ed/user-experience-and-experience-design.
Hassenzahl, M. and Tractinsky, N. (2006). User experience - a research
agenda. Behaviour & Information Technology 25(2), 91-97.
Hill, M. (2014, November 21). The Sega VR Headset That Never Was.
Retrieved from
http://www.gizmodo.co.uk/2014/11/the-sega-vr-headset-that-never-was/
Hofstede, G. (1997). Cultures and Organizations: Software of the Mind. New
York: McGraw-Hill.
Kelley, K., Clark, B., Brown, V., and Sitzia, J. (2003, May 1.) Good practice
in the conduct and reporting of survey research, International Journal for Quality in
Health Care, 15(3), pp. 261–266. https://doi.org/10.1093/intqhc/mzg031

94
Krause, S. (2017, January 22). VR in Education: What's Already Happening
in the Classroom. Retrieved from
http://www.arvrmagazine.com/vr-in-education-whats-already-happening-in-the-classr
oom/
Krause, S. (2016, October 28). Learning vocabulary in VR – Making VR
child's play. Retrieved from
https://blog.cospaces.io/learning-vocabulary-in-vr-10670f75f66d
Laugwitz, B., Held, T., & Schrepp, M. (2008). Construction and Evaluation of
a User Experience Questionnaire. USAB 2008, LNCS 5298, pp. 63-76.
Law, E. et al., (2008). Towards a Shared Definition of User Experience. CHI
‘08 Extended Abstracts on Human Factors in Computing Systems. pp. 2395-2398.
Leswing, K. (2017, June 04). Here are the top 5 most popular VR headsets -
and what they cost. Retrieved from
http://www.businessinsider.com/vr-headsets-comparison-popularity-price-features-de
tails-2017-6/#tcl-alcatel-vr-headset-5
Limer, E. (2015, February 13). Google's Helping Turn the View-Master Into a
Virtual Reality Headset. Retrieved from
http://gizmodo.com/the-view-master-is-back-and-now-its-for-virtual-reality-1685630
204
95
Marcus A. (2006) Cross-Cultural User-Experience Design. Barker-Plummer
D., Cox R., Swoboda N. (eds) Diagrammatic Representation and Inference. Diagrams
2006. Lecture Notes in Computer Science. 4045. Springer, Berlin, Heidelberg.
McCarthy, J. and Wright, P. (2004). Technology as Experience. Interactions;
11(5). pp. 42-43.
McLeod, S. (2008). Likert Scale. Retrieved from
https://www.simplypsychology.org/likert-scale.html
Melina, R. (2011, June 03). Why Is the Color Purple Associated With
Royalty? Retrieved from https://www.livescience.com/33324-purple-royal-color.html
Morville, P. (2016, October 11). User Experience Design. Retrieved from
http://semanticstudios.com/user_experience_design/
Nye, L. (2017, May 19). The US military is using VR to simulate combat
jumps. Retrieved from
http://www.businessinsider.com/us-military-using-new-virtual-reality-trainer-simulat
e-combat-jumps-2017-5
Powell, W. (2017, June 21). Five ways virtual reality is improving healthcare.
Retrieved from https://phys.org/news/2017-06-ways-virtual-reality-healthcare.html
Pribeanu, C. and Iordache, D. (2008). Evaluating the Motivational Value of an
Augmented Reality System for Learning Chemistry. USAB 2008, LNCS 5298. pp.
31–42.

96
Rizzo, A., and Hartholt, A. 2005. Bravemind: Virtual Reality Exposure
Therapy. Retrieved from http://ict.usc.edu/prototypes/pts/
Schumacher, E., and Redner, J. (2012, August 1). New Virtual Reality
Gaming Headset From Oculus VR™ Gets Kickstarted. Retrieved from
https://www1.oculus.com/press/new-virtual-reality-gaming-headset-from-oculus-gets
-kickstarted/
Singer, E. and Cong, Y. (2013, January). The Use and Effects of Incentives in
Surveys. The Annals of the American Academy of Political and Social Science, 645:
The Nonresponse Challenge to Surveys and Statistics. pp. 112-141.
Solomon, Brian. (15 Apr 2014). Facebook Buys Oculus, Virtual Reality
Gaming Startup, For $2 Billion. Forbes. Forbes Magazine. Retrieved from
https://www.forbes.com/sites/briansolomon/2014/03/25/facebook-buys-oculus-virtual
-reality-gaming-startup-for-2-billion/#2a0df1662498.
Sridhar, S. (2016, March 1). Google Store starts selling View-Master
and C1-Glass Cardboard VR Viewers. Retrieved from
http://www.fonearena.com/blog/176707/google-store-starts-selling-view-mast
er-and-c1-glass-cardboard-vr-viewers.html
Steuer, J. (1992, Autumn). Defining Virtual Reality: Dimensions Determining
Telepresence. Journal of Communication, 42(4). p. 73
Turolla, A., Dam, M., Ventura, L., Tonin, P., Agostini, M., Zucconi, C., . . .
Piron, L. (2013). Virtual reality for the rehabilitation of the upper limb motor function

97
after stroke: a prospective controlled trial. Journal of NeuroEngineering and
Rehabilitation, 10(1), 85. doi:10.1186/1743-0003-10-85
Worley, J., & Chamberlain, R. (1994, January). The Ten Top Stories of 1993
and What They Mean to Gamers. Electronic Games.
Google Expeditions. (n.d.). Retrieved from
https://edu.google.com/expeditions/#about
(2014, February 19). User Experience Basics. Retrieved from
https://www.usability.gov/what-and-why/user-experience.html.

98
99
Acknowledgements
I humbly assert the impossibility of this thesis having been written without the
help of many others. I express my gratitude to my mentor, William E. Loges, PhD.,
for his guidance, support, and critical advice, as well as for his leadership of the very
project itself. I am also grateful to Daniel C. Faltesek, PhD., for his instruction and
assistance in the research, and to Colleen C. Bee, PhD., for her support. Thank you all
for participating in this Thesis Defense Committee.
I must recognize the other members of the research team who participated in
the original planning, drafting, and analysis of the survey, including Tim Andrade,
Makenzie Bittinger, Kevin Connelly, Aaron Meche, Brandon Olsen, Cassidy Wood,
and Josh Worden. Thank you all for helping me to laugh at inconveniences and keep
trying. I am also thankful to Kassena Hillman, Leanna Dillon, and Rebekah Lancelin,
and their moral support and guidance. I would still be on page one if it were not for
them.
I am so grateful for my family. They mean everything to me. Thank you so
much to my parents, who had nothing but confidence in me through all of these
studies. This is for you. To my sisters and brother: know that you are all capable of
surpassing me by miles, and that if you really put your mind to something, I know
you’ll be able to do it.
Finally, I save the greatest for last – I thank my God, for guiding me through
this and through so much more.

100

101

102