Embed Size (px)
Citation preview
© Authors. Terms and conditions of Creative Commons Attribution 4.0 International (CC BY 4.0) apply.
[email protected] (*Correspondence) [email protected]
OPEN ACCESS
EURASIA Journal of Mathematics, Science and Technology Education ISSN: 1305-8223 (online) 1305-8215 (print) 2018 14(4):1197-1219 DOI: 10.29333/ejmste/81868
Developing an Instructional Design for the Design of Infographics and the Evaluation of Infographic Usage in Teaching Based on
Teacher and Student Opinions Fezile Ozdamli 1*, Hasan Ozdal 1
1 Computer Education and Instructional Technology, Near East University, Nicosia, TURKEY
Received 11 July 2017 ▪ Revised 15 December 2017 ▪ Accepted 19 December 2017
ABSTRACT Infographics have been frequently used in recent years with the purpose of the visual presentation of information. It is a visualisation method which aims at presenting any content with a visual composition, combining such elements as shapes, symbols, graphics, photographs, illustrations, and texts for the target audience. The purpose of this research is to develop an instructional design based on the ADDIE (Analysis, Design, Development, Implementation, Evaluation) model of infographic design as well as the determination of student and teacher opinions on the usage of infographics in teaching. The study group of the research consists of 43 teachers and 51 elementary school students from elementary schools in Cyprus who participated in the research process voluntarily. The implementation process of the study consisted of 52 hours of education in face-to-face and online learning environments with the participation of 43 elementary school teachers. The purpose of this education activity was to develop knowledge and skills in the theoretical and applied dimensions required for the design of infographics. The data collection tools used in the research were the “self-efficacy scale for the design and usage of infographics”, the “opinion survey for the usage of infographics in teaching environments”, a “semi-structured interview form for the design of infographics for teachers and their usage in teaching environments” and a “semi-structured interview form for elementary school students for the usage of infographics in education”. According to the results of the study, the opinions of elementary school teachers on the usage of infographics and their self-efficacy for infographic design shows a significant and positive difference before and after training. Interviews were held on the usage of infographics in learning environments with the 43 elementary school teachers and 51 elementary school students after the completion of the training process. Teachers used the infographics that they had developed according to the course contents for eight weeks in their courses after the training was completed and observed the impact of infographics in terms of different dimensions. At the end of the implementation, it was found that both teachers and students had positive opinions on the usage of infographics in learning environments.
Keywords: infographic, infographic design, infographics in education
INTRODUCTION The increasing popularity of infographics as a visual representation of information in social media, advertisement, promotion and academic fields in recent years has partial reflections on scientific studies; however, it is seen that there are a limited number of studies on the usage of infographics in education environments. In particular, no study has been identified on the design and usage of infographics at the elementary educational level. It is believed that using infographics as a teaching tool at the elementary level with its explained aspects and exciting structural features would help to create a rich learning environment for both teachers and students. Additionally, when the
Ozdamli & Ozdal / Infographics in Education
1198
literature was examined, it was concluded that infographics were handled as an effective class and visual communication material and contributed in areas such as motivation, class participation, understanding, interpretation, evaluation, persuasion and guidance.
At present, there are several web applications (Piktochart, Canva, Thinglink, etc…) and graphic editors (Adobe Photoshop, CorelDRAW, Illustrator, etc…) which allow for the design of infographics, along with other visual teaching materials. By using these applications and software, the infographics design process requires individuals to possess some knowledge and skills; it also reveals the need for developing teaching systems for the design process of infographics. At this point, instructional designs holds importance in terms of meeting the existing educational needs. Fer (2011) stated that instructional designs act as guides that show the methods, approaches, tools and media to be used in individual teaching situations.
The purpose of this research can be grouped under two titles: 1. Development, implementation and evaluation of an instructional design for the design and usage in of
infographics in teaching: a) To identify any significant differences between the opinions of elementary school teachers about the
usage of infographics before and after training b) To identify any significant differences between the self-efficacy of elementary school teachers for the
design of infographics before and after training 2. Evaluation of the infographic-related opinions of teachers and students at the elementary school level:
a) The opinions of the elementary school teachers participating in the training in regard to the design and usage of infographics and student approaches to infographics
b) The opinions of elementary school students in regard to the usage of infographics in education
THEORETICAL BACKGROUND
Visual Literacy Visual communication and literacy are the basic skills that have had vital importance since the emergence of
humans. As understood from symbolic languages such as ISOTYPE, Semantografi, LoCoS*, which serve different purposes and are produced with different features, pictures drawn on the walls of the caves adopted different visualisation methods of people for centuries in terms of education, health, artistic activities as well as for communication and the presentation of knowledge in other areas.
It is known that the first recorded definition on visual literacy was made by John Debes in 1969. Debes (1969) defined visual literacy as a seeing skill that people can develop by seeing and integrating with other experiences in the emotional dimension. Debes also stated that a visually literate person distinguishes natural and artificial actions, objects and symbols that he/she encounters and that people can communicate with others by using these skills creatively, understand the works of visual communication and enjoy it. From John Debes’ first definition to today, several definitions and expressions have been proposed for visual literacy.
Lundy and Stephens (2015) defined visual literacy as the talent for understanding and interpreting the actions, objects and situations in the environment. They handled visual literacy from the point of education environments and evaluated it as one of the skills with vital importance, both for learners and teachers. Likewise, Aisami (2015) defined visual literacy as a group of skills learned to visually interpret and constitute messages. Hattwig, Bussert, Medaille and Burgess (2013) emphasised that visuals are important tools starting from young ages, so that all people can express themselves, communicate with other people and obtain information, and stated that people widely use visual materials in all their activities. Additionally, they claimed that in the 21st century, individuals must have sufficient visual literacy skills to be able to interact effectively with visuals.
Little, Felten and Berry (2010) and Palmer and Matthews (2015) defined visual literacy as a critical skill of the 21st century. Related skills claim an important place in the literature. Estrada and Davis (2015) and the Association of College & Research Libraries (2011) explained visual literacy skills in the following terms:
• The skill of determining the size and nature of a visual material • The skill for effectively finding, developing and accessing visual materials
Contribution of this paper to the literature
• This paper illustrates a strategic review on infographics in education. • It highlights the needs of teachers related to the design and using infographics in education. • Infographics can be used as an important material in education.
EURASIA J Math Sci and Tech Ed
1199
• The skill for interpreting and analysing the meaning of visual elements • The skill for evaluating and criticizing the power of visual elements • The skill for effectively using visual media • The skill for designing and creating unique, meaningful visual media • The skill for evaluating the ethical, social and economic aspects in creating / using visual media and
materials The importance of visual literacy in terms of the modern world is reflected in the field of education among
others. For this reason, in time, the usage of several visual teaching materials with different structures and characteristics in learning and teaching environments came to the forefront. Stationary or moving visual teaching materials such as educative posters, concept maps, visual presentations, animations, videos and graphics are frequently used and it is reported that they offer several advantages to both teachers and learners in terms of concretizing the abstract knowledge, attracting the attention of students, making learned information permanent, ensuring active participation in classes, as well increasing the economy of time and words (Castelyn & Mottart, 2012; Smaldino, Lowther & Russell, 2007; Yeh & Cheng, 2010).
Technological motion and innovations in the world have led to the adaptation of new approaches in terms of communication facilities and presentation methods of knowledge. In recent years, infographics that are used as visual presentations of information, are among the leading new visualisation tools. Considerable information can be found in the literature on the definition, features and usage areas of infographics.
Definition and Characteristics of Infographics Developing technology and the increasing body of knowledge has resulted in the adoption of new approaches
in terms of information sharing today. During this process, infographics, which offer users complex information in an attractive and aesthetic visual manner, have gained importance.
Locoro, Cabitza, Actis-Grosso and Batini (2017) defined infographics as visualisation tools used with the purpose of informing users in general. Additionally, perceived as a new skill area for teachers, infographics are becoming popular in both printed materials and digital media and are used for the visualisation of data (Islamoglu, Ay, Ilic, Mercimek, Donmez, Kuzu & Odabasi, 2015). Another purpose of infographics is the capability to visualise contents with detailed and complex structures in a manner that they can easily and rapidly be perceived and interpreted by viewers (Dunlap & Lowenthal, 2016; Smiciklas, 2012). As an extremely useful medium in the transfer of knowledge, infographics contribute to the presentation of information presented in complex and long texts by simplifying the data in a more easily comprehendible size. Consequently, they can be used not only in education but also in academic fields and social media (Ozdamli, Kocakoyun, Sahin & Akdag, 2016; Tugrul, 2017; Uygarer & Uzunboylu, 2017). As a unique way of presenting synthesised information visually, infographics have an intriguing effect (Bradshaw & Porter, 2017).
Lankow, Ritchie and Crooks (2012) stated that, unlike other visualisation methods, infographics are effective in the understanding and learning processes of intense and sometimes complex information with a plain typography and page order. In similar words, Lankow, Ritchie and Crooks (2012) said that infographics that are created by using graphic elements (colour, typography) consisting of a combination of content-related design elements (maps, schemes, tables, etc.) are essential tools for learning and teaching processes with the comprehensive graphic and design elements that they provide. Dur (2014) and Li, Carberry, Fang, McCoy and Peterson (2014) claimed that infographics aim at presenting intense and complex information on a certain topic to the receiver in a more understandable and visual manner. Additionally, they state that infographics have several features that enable more understandable and “catchy” information through visual transfer and, if they are well designed in terms of visuality, content and usefulness, they could be essential tools in persuading, guiding and mobilizing people. Toth (2013) defined infographics as a combination of words and visuals and stated that they rapidly convey both qualitative and quantitative data to viewers. Lapum and St-Amant (2016) explained that infographics, which they understood as a visual translation of data organized and presented to receivers’ texts in a visual discipline, tell a story or support a story with a visual language.
It is known that the elements used in the design of infographics are actually not completely new. Several elements used in the design of an infographic, such as pictures, shapes, symbols, graphics, and text, are used individually or in combination with the purpose of transferring information. From this perspective, it can be claimed that the innovation brought by infographics in the transfer of information is the way these elements are utilised and the building of the content (Dick, 2013). Tuncali (2016) asserted that infographics transform information, resources and data into a graphic format and that sophisticated information in the graphic is transferred in a simple, explanatory visual narration. In addition to the definitions and characteristic explanations
Ozdamli & Ozdal / Infographics in Education
1200
of infographics, Rajamanickam (2005) stated that the following basic principles should be observed in a well-designed infographic:
• Organization of information • Creation of content • Simplification • Addition of multiple emphasis • Display of cause and effect relationship • Creation of integrated graphics Krum (2013) added that, along with these characteristics, an infographic includes an introduction, key message
and conclusion parts, which coincide with the story format. Parallel to this information, Davis and Quinn (2013) stated that factors such as determining the purpose, deciding on the elements to be used in the relevant infographic, determination of the type of infographic, and the presentation of information in a manner that viewers will understand are important aspects in designing an effective infographic.
Due to their popularity in such fields as information sharing, communication, education, advertising and promotion, infographics have also been subject to scientific research. The number of studies on the design and usage of infographics in the literature is increasing.
In the study conducted by Vanichvasin (2013), the views of university students on the usage of infographics as a tool of visual communication were investigated. Additionally, according to the results obtained, it was determined that using infographics as a visual communication tool was effective on evaluation, understanding and permanence.
One study conducted by Yildirim, Yildirim, Celik and Aydin (2014) evaluated the opinions of teacher candidates on the infographic formation process. The study concluded that participants had positive opinions on infographics, and that they accepted infographics as effective tools, as they presented information in an integrated and organized manner, included high visuality, and proved to be attractive learning tools. One negative opinion stated by the participants was the fact that they had difficulties with organizing the information to be used in the design of an infographic, which was related to the necessity of being knowledgeable in teaching content preparation at an expert level.
Another study conducted by Ru and Ming (2014) aimed at exploring the relationship between infographics and design education. In this study, it was reported that the usage of infographics made a positive contribution to design education and the usage of infographics was recommended for improving this fields, which is currently faced with many challenges.
Uyan’s study (2014) examined the development process of data visualisation and infographics in the information age. The research concluded that infographics are powerful tools in systematically presenting information, revealing hidden patterns, and creating a persuasive and guiding impact.
Rezaei and Sayadian (2015) studied the effectiveness of infographic usage in grammar education. In this study, which was constructed using an experimental pattern, courses were delivered with infographics in a test group, whereas traditional methods were used in a control group. According to the results of the study, it was found that infographic usage had a positive effect on grammar learning.
In Kibar’s study (2016), which aimed at modelling the infographic creation process as a learning strategy. Designers must have “knowledge of content”, “knowledge and skill of visual design” and “knowledge and skill of using digital design implementation” in order to design infographics effectively according to these three elements.
Yildirim (2016) evaluated the opinions of teacher candidates from education faculties on infographic usage from different perspectives. According to the opinions of the teacher candidates, infographics have a more didactic structure compared to textual contents, and therefore they could be an effective alternative to the visual elements and plain text materials in books; it was also concluded that, in the teacher candidates’ opinion, they were the most recommended tools among other visual teaching materials.
Tuncali (2016) conducted a study on the examination of infographics designed for environmental matters and concluded that infographics are useful tools in creating awareness in terms of environmental affairs and conveying this message to people through such channels as social media.
Alshehri and Ebaid (2016) examined the effectiveness of interactive infographic usage in an elementary school mathematics classes. In the study, significant differences were detected in favour of the experimental group in which the infographic usage was realised. Accordingly, the achievement grades of students in the experimental group where interactive infographics were used were higher compared to the students in the control group.
The conclusions of a study conducted for identifying the impact of infographic usage in foreign language education showed that infographics had a positive impact on foreign language teaching and education technologies
EURASIA J Math Sci and Tech Ed
1201
based on the fact that infographics were found to be more interesting and useful by the students (Pisarenko & Bondarev, 2016).
Another study conducted by Bradshaw and Porter (2017) examined the usage of infographics as a new and up-to-date tool in nursing education. It was reported that nursing educators should understand the fundamentals of infographic development and should use them during classes in order to present synthesised data. Another conclusion was that infographics could also be used in patient education.
One study conducted by Al-Mohammadi (2017) was aimed at the examination of the impact of infographics as an approach for teaching programming in order to improve the analytic thinking abilities of high school students. This study was based on a semi-experimental pattern and concluded that the usage of infographics as an approach had a positive impact on the teaching of fundamentals of programming for improving their analytical thinking abilities (academic achievement levels of high school students).
METHOD Quantitative studies try to determine the results in a generalizable manner based on numerical data in regard
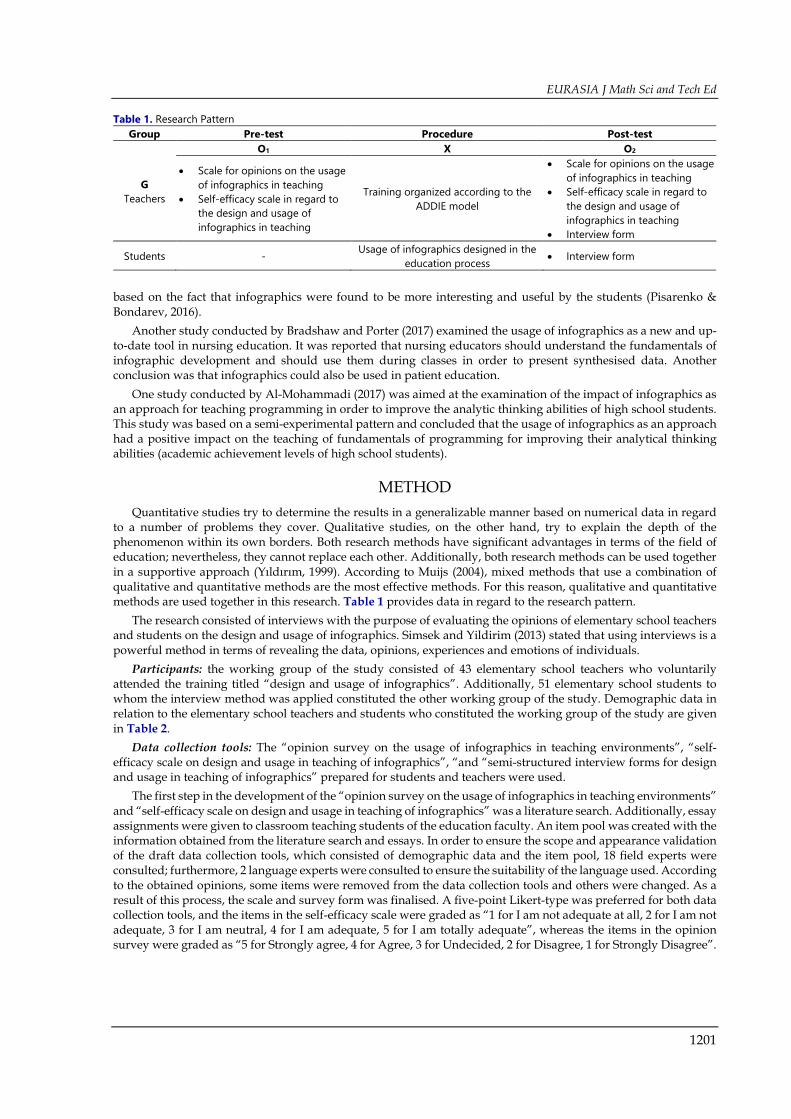
to a number of problems they cover. Qualitative studies, on the other hand, try to explain the depth of the phenomenon within its own borders. Both research methods have significant advantages in terms of the field of education; nevertheless, they cannot replace each other. Additionally, both research methods can be used together in a supportive approach (Yıldırım, 1999). According to Muijs (2004), mixed methods that use a combination of qualitative and quantitative methods are the most effective methods. For this reason, qualitative and quantitative methods are used together in this research. Table 1 provides data in regard to the research pattern.
The research consisted of interviews with the purpose of evaluating the opinions of elementary school teachers and students on the design and usage of infographics. Simsek and Yildirim (2013) stated that using interviews is a powerful method in terms of revealing the data, opinions, experiences and emotions of individuals.
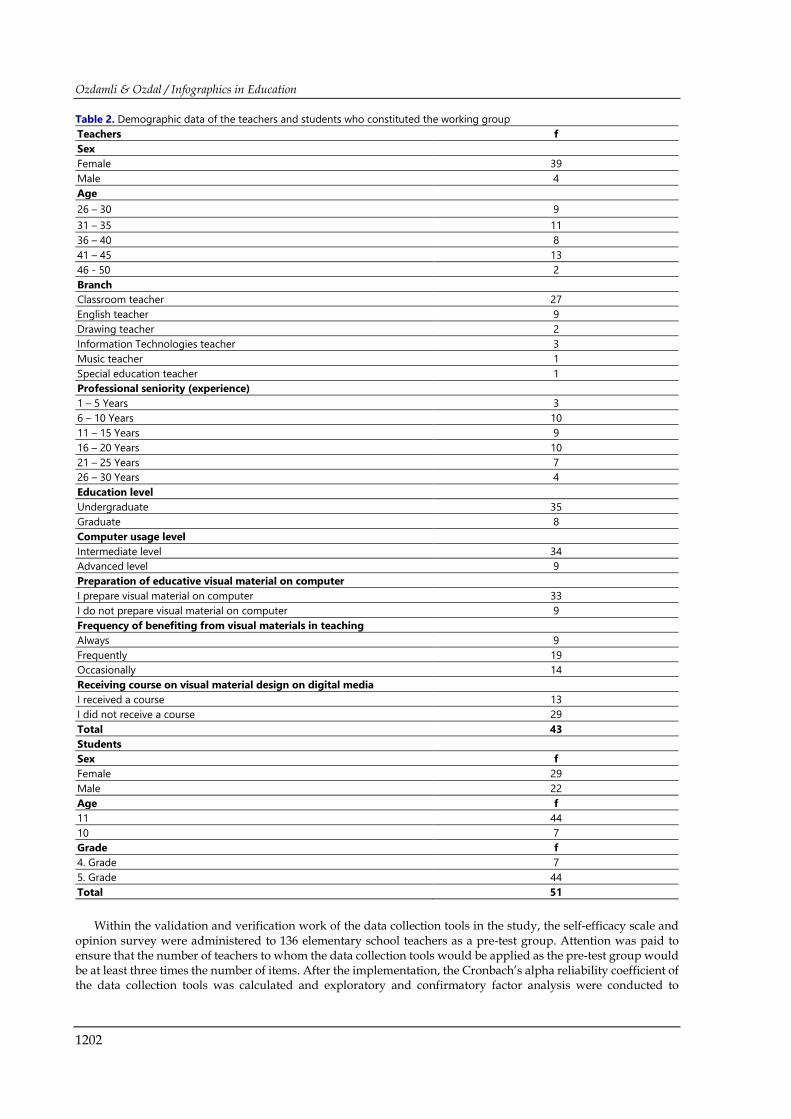
Participants: the working group of the study consisted of 43 elementary school teachers who voluntarily attended the training titled “design and usage of infographics”. Additionally, 51 elementary school students to whom the interview method was applied constituted the other working group of the study. Demographic data in relation to the elementary school teachers and students who constituted the working group of the study are given in Table 2.
Data collection tools: The “opinion survey on the usage of infographics in teaching environments”, “self-efficacy scale on design and usage in teaching of infographics”, “and “semi-structured interview forms for design and usage in teaching of infographics” prepared for students and teachers were used.
The first step in the development of the “opinion survey on the usage of infographics in teaching environments” and “self-efficacy scale on design and usage in teaching of infographics” was a literature search. Additionally, essay assignments were given to classroom teaching students of the education faculty. An item pool was created with the information obtained from the literature search and essays. In order to ensure the scope and appearance validation of the draft data collection tools, which consisted of demographic data and the item pool, 18 field experts were consulted; furthermore, 2 language experts were consulted to ensure the suitability of the language used. According to the obtained opinions, some items were removed from the data collection tools and others were changed. As a result of this process, the scale and survey form was finalised. A five-point Likert-type was preferred for both data collection tools, and the items in the self-efficacy scale were graded as “1 for I am not adequate at all, 2 for I am not adequate, 3 for I am neutral, 4 for I am adequate, 5 for I am totally adequate”, whereas the items in the opinion survey were graded as “5 for Strongly agree, 4 for Agree, 3 for Undecided, 2 for Disagree, 1 for Strongly Disagree”.
Table 1. Research Pattern Group Pre-test Procedure Post-test
G Teachers
O1 X O2
• Scale for opinions on the usage of infographics in teaching
• Self-efficacy scale in regard to the design and usage of infographics in teaching
Training organized according to the ADDIE model
• Scale for opinions on the usage of infographics in teaching
• Self-efficacy scale in regard to the design and usage of infographics in teaching
• Interview form
Students - Usage of infographics designed in the education process • Interview form
Ozdamli & Ozdal / Infographics in Education
1202
Within the validation and verification work of the data collection tools in the study, the self-efficacy scale and opinion survey were administered to 136 elementary school teachers as a pre-test group. Attention was paid to ensure that the number of teachers to whom the data collection tools would be applied as the pre-test group would be at least three times the number of items. After the implementation, the Cronbach’s alpha reliability coefficient of the data collection tools was calculated and exploratory and confirmatory factor analysis were conducted to
Table 2. Demographic data of the teachers and students who constituted the working group Teachers f Sex Female 39 Male 4 Age 26 – 30 9 31 – 35 11 36 – 40 8 41 – 45 13 46 - 50 2 Branch Classroom teacher 27 English teacher 9 Drawing teacher 2 Information Technologies teacher 3 Music teacher 1 Special education teacher 1 Professional seniority (experience) 1 – 5 Years 3 6 – 10 Years 10 11 – 15 Years 9 16 – 20 Years 10 21 – 25 Years 7 26 – 30 Years 4 Education level Undergraduate 35 Graduate 8 Computer usage level Intermediate level 34 Advanced level 9 Preparation of educative visual material on computer I prepare visual material on computer 33 I do not prepare visual material on computer 9 Frequency of benefiting from visual materials in teaching Always 9 Frequently 19 Occasionally 14 Receiving course on visual material design on digital media I received a course 13 I did not receive a course 29 Total 43 Students Sex f Female 29 Male 22 Age f 11 44 10 7 Grade f 4. Grade 7 5. Grade 44 Total 51
EURASIA J Math Sci and Tech Ed
1203
validate the structure. As a result of the analysis, the reliability coefficient of the self-efficacy scale and opinion survey were calculated as .986 and .951, respectively. The exploratory and confirmatory factor analysis showed that the opinion scale was constructed with a single factor and the self-efficacy scale was constructed with three factors. The items grouped under the three factors in the self-efficacy scale were titled as “competences for design of infographics in digital media (.976)”, “competences for design of infographics according to principles and elements of graphic design (.952)” and “competences for the design of infographics according to compliance with target group and content (.990)”.
In the research, semi-structured interview forms developed by researchers with the purpose of evaluating the opinions of elementary school teachers and students on infographics were used. The first step in developing the two interview forms for teachers and students was a literature search. Subsequently, 20 randomly selected elementary school teachers were asked to write an essay on infographics. Interview forms were prepared based on the data obtained from the literature search and the essays written by teachers. In order to ensure the structure and appearance of the prepared interview forms, 18 field experts were consulted and necessary adjustments were made to the forms based on the obtained opinions. At the last stage involving the validity and reliability tests of the interview forms, a pilot study was conducted with 15 elementary school teachers and 12 students. In the pilot study, two questions that were answered by the teachers and students with difficulty were eliminated and the interview forms were finalised. The interview form developed for elementary school teachers consisted of three dimensions, namely “general opinions on infographics”, “opinions on the design of infographics” and “opinions of the approach of students on infographics”. The interview form developed for the elementary school students has only one dimension, namely “general opinions on the usage of infographics in education environments”.
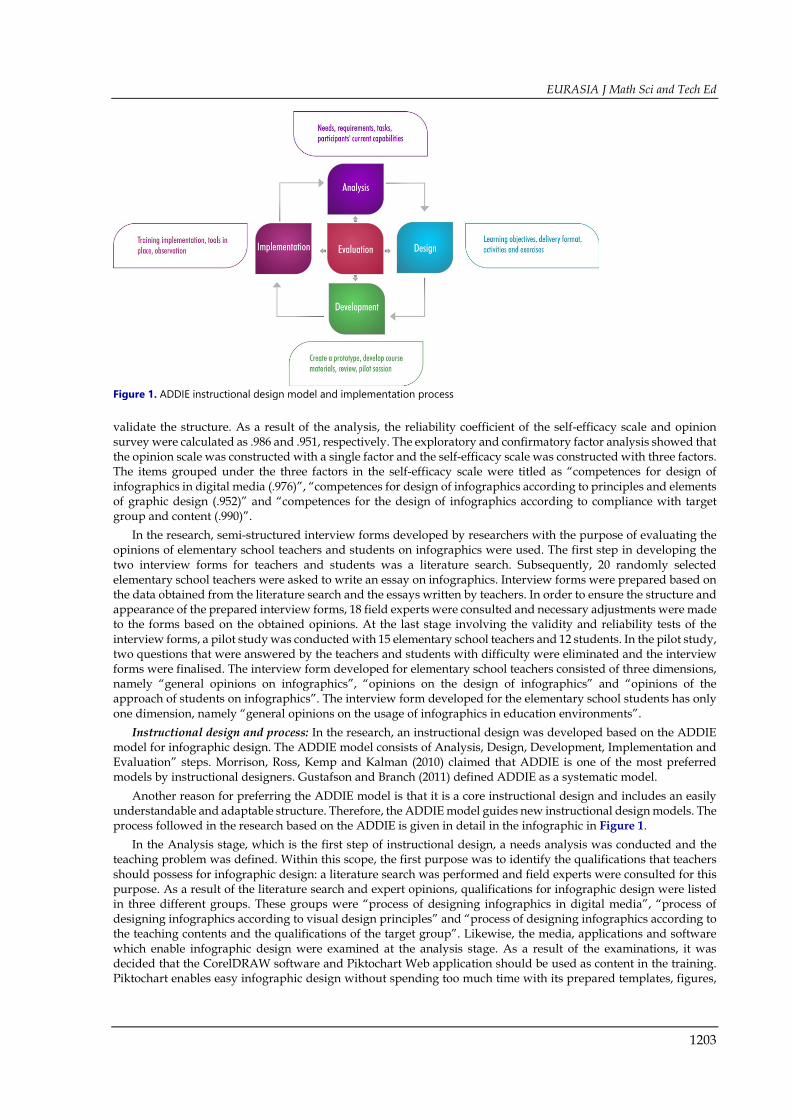
Instructional design and process: In the research, an instructional design was developed based on the ADDIE model for infographic design. The ADDIE model consists of Analysis, Design, Development, Implementation and Evaluation” steps. Morrison, Ross, Kemp and Kalman (2010) claimed that ADDIE is one of the most preferred models by instructional designers. Gustafson and Branch (2011) defined ADDIE as a systematic model.
Another reason for preferring the ADDIE model is that it is a core instructional design and includes an easily understandable and adaptable structure. Therefore, the ADDIE model guides new instructional design models. The process followed in the research based on the ADDIE is given in detail in the infographic in Figure 1.
In the Analysis stage, which is the first step of instructional design, a needs analysis was conducted and the teaching problem was defined. Within this scope, the first purpose was to identify the qualifications that teachers should possess for infographic design: a literature search was performed and field experts were consulted for this purpose. As a result of the literature search and expert opinions, qualifications for infographic design were listed in three different groups. These groups were “process of designing infographics in digital media”, “process of designing infographics according to visual design principles” and “process of designing infographics according to the teaching contents and the qualifications of the target group”. Likewise, the media, applications and software which enable infographic design were examined at the analysis stage. As a result of the examinations, it was decided that the CorelDRAW software and Piktochart Web application should be used as content in the training. Piktochart enables easy infographic design without spending too much time with its prepared templates, figures,
Figure 1. ADDIE instructional design model and implementation process
Ozdamli & Ozdal / Infographics in Education
1204
illustrations, backgrounds and textual backgrounds in its content along with its easy-to-use features, whereas CorelDRAW allows users to develop unique designs with its wide and detailed design techniques.
The features of the target group were examined in the second dimension of the analysis step. After necessary permissions were obtained from the Elementary Education Office of the Ministry of Education, the training and relevant information were announced to the elementary schools by fax and e-mail. Teachers who wished to attend the training completed the information form and e-mailed it to the researchers. Information such as gender, age, professional seniority, branch, level of education, computer usage level, visual material preparation status in the computer environment, and frequency of benefiting from visual materials in teaching were used to determine the qualifications of the target group.
In another dimension of the analysis stage, a needs analysis was conducted in regard to the teaching environment. As a result of the evaluation, it was decided that a computer laboratory where training could be delivered and a web media environment would be used. In this stage, evaluations were made in regard to the technology and materials that are required in the relevant laboratory and the components which should be added to the web environment. Subsequently, a “time “evaluation was made based on the data obtained from the needs analysis and the features of the target group and it was determined that the training would would be conducted for 52 hours. At the end of the analysis stage, the budget and its limitations were evaluated.
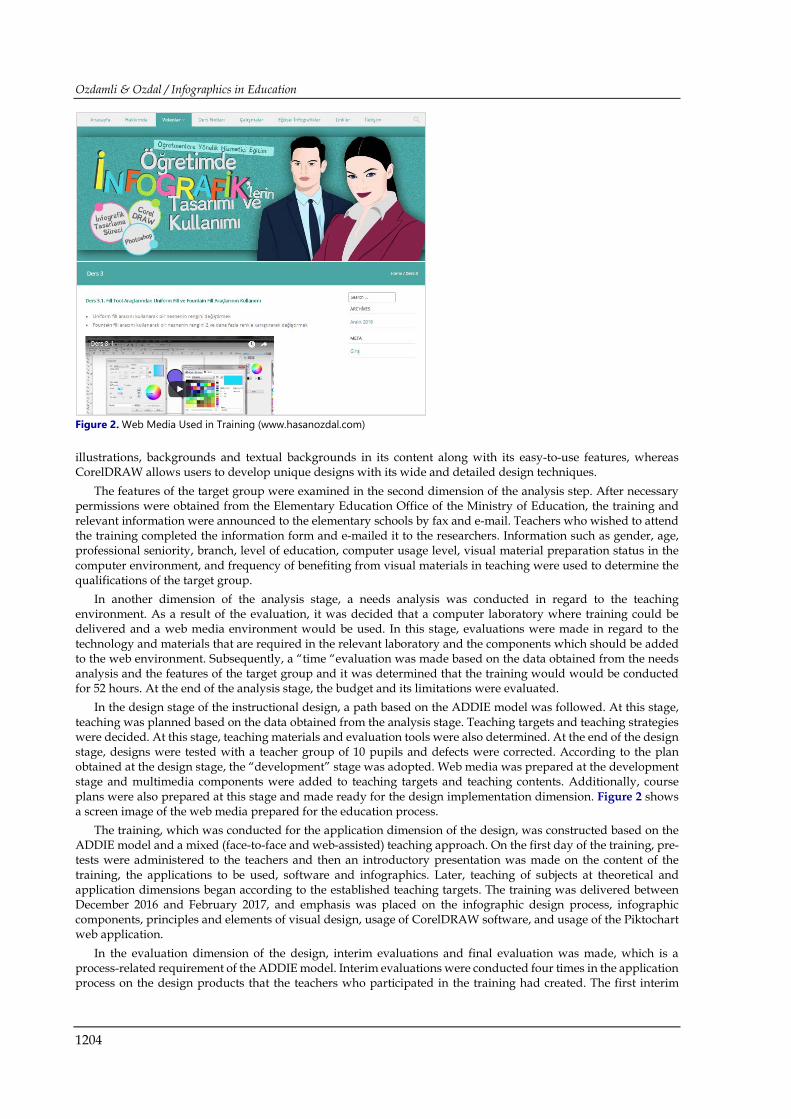
In the design stage of the instructional design, a path based on the ADDIE model was followed. At this stage, teaching was planned based on the data obtained from the analysis stage. Teaching targets and teaching strategies were decided. At this stage, teaching materials and evaluation tools were also determined. At the end of the design stage, designs were tested with a teacher group of 10 pupils and defects were corrected. According to the plan obtained at the design stage, the “development” stage was adopted. Web media was prepared at the development stage and multimedia components were added to teaching targets and teaching contents. Additionally, course plans were also prepared at this stage and made ready for the design implementation dimension. Figure 2 shows a screen image of the web media prepared for the education process.
The training, which was conducted for the application dimension of the design, was constructed based on the ADDIE model and a mixed (face-to-face and web-assisted) teaching approach. On the first day of the training, pre-tests were administered to the teachers and then an introductory presentation was made on the content of the training, the applications to be used, software and infographics. Later, teaching of subjects at theoretical and application dimensions began according to the established teaching targets. The training was delivered between December 2016 and February 2017, and emphasis was placed on the infographic design process, infographic components, principles and elements of visual design, usage of CorelDRAW software, and usage of the Piktochart web application.
In the evaluation dimension of the design, interim evaluations and final evaluation was made, which is a process-related requirement of the ADDIE model. Interim evaluations were conducted four times in the application process on the design products that the teachers who participated in the training had created. The first interim
Figure 2. Web Media Used in Training (www.hasanozdal.com)
EURASIA J Math Sci and Tech Ed
1205
evaluation was conducted after the first 15 hours of the application process. For this purpose, teachers were asked to design business cards using the command and design techniques they had learned up to that stage in the training. The business cards designed by the teachers were evaluated based on the technical dimension as well as on the principles and elements of visual design. With the same evaluation approach, the second interim evaluation was conducted after 30 hours of training was completed. Teachers were asked to design illustrations using the information they had had learned. The third interim evaluation was conducted after the completion of 45 hours. The teachers were asked to prepare visual teaching materials related to any course content using the commands and design techniques they had learned on the CorelDRAW program. The visual materials prepared by the teachers were evaluated with the same evaluation approach from the perspective of the principles and elements of visual design in the technical dimension. The three interim evaluations conducted to this point were aimed at determining the level of teachers in relation to the teaching targets present on the usage of the CorelDRAW program. The fourth interim evaluation was conducted after the completion of 50 hours with the purpose of identifying the level of teachers in relation to the teaching targets related to the Piktochart application. For this purpose, teachers were asked to design an infographic related to their course contents using Piktochart. Infographics prepared by teachers were evaluated from technical, visual and content aspects. At the end of the interim evaluations, necessary corrections were made in the instructional design and defects were corrected.
In the research, evaluation on the results was made based on the assessment of the performance of teachers who attended the training in terms of reaching the targets of the training as well as interpreting the value of the developed instructional design. At the end of the training, two infographics were prepared by each teacher about their course contents, which were evaluated according to expert opinions from the perspective of technique, visual design and content. Seven experts from the computer and teaching technologies field took part in the process of evaluating the infographics developed by the teachers. The expert evaluation process was realised in three titles, namely technique, visual design and content and the criteria under each title were scored as “very good (5) – good (4) – mediocre (3) – bad (2) – very bad (1)”.
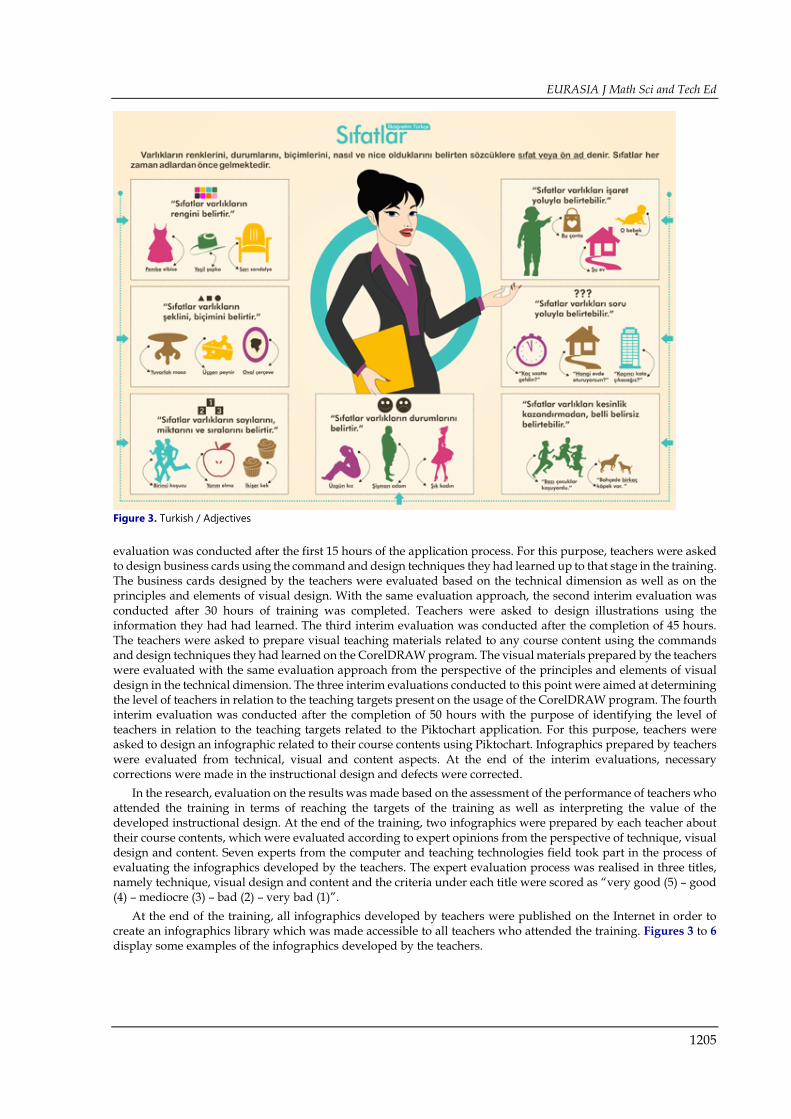
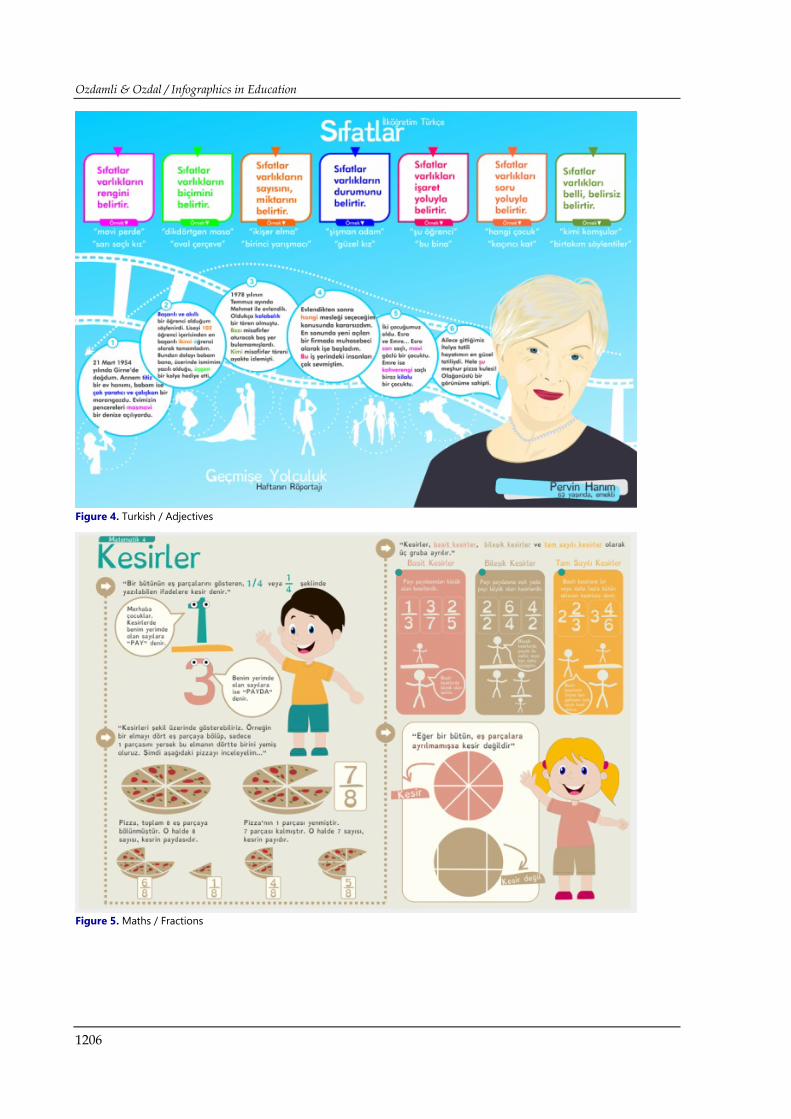
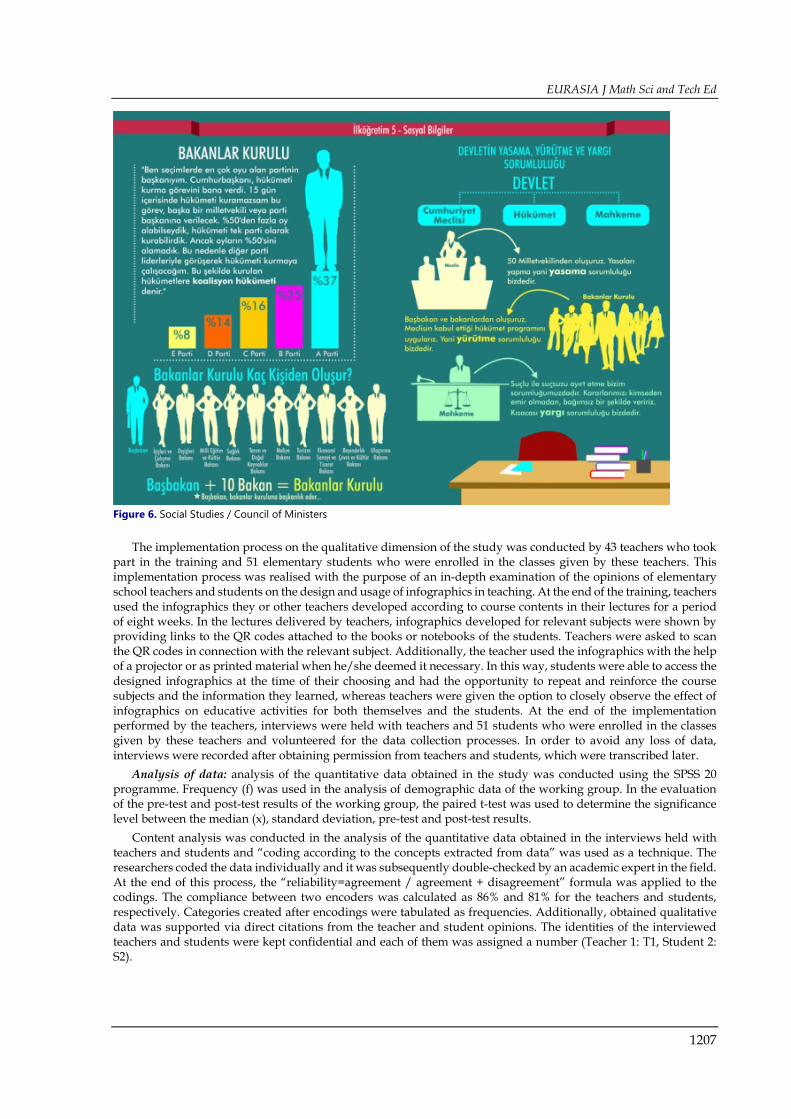
At the end of the training, all infographics developed by teachers were published on the Internet in order to create an infographics library which was made accessible to all teachers who attended the training. Figures 3 to 6 display some examples of the infographics developed by the teachers.
Figure 3. Turkish / Adjectives
Ozdamli & Ozdal / Infographics in Education
1206
Figure 4. Turkish / Adjectives
Figure 5. Maths / Fractions
EURASIA J Math Sci and Tech Ed
1207
The implementation process on the qualitative dimension of the study was conducted by 43 teachers who took part in the training and 51 elementary students who were enrolled in the classes given by these teachers. This implementation process was realised with the purpose of an in-depth examination of the opinions of elementary school teachers and students on the design and usage of infographics in teaching. At the end of the training, teachers used the infographics they or other teachers developed according to course contents in their lectures for a period of eight weeks. In the lectures delivered by teachers, infographics developed for relevant subjects were shown by providing links to the QR codes attached to the books or notebooks of the students. Teachers were asked to scan the QR codes in connection with the relevant subject. Additionally, the teacher used the infographics with the help of a projector or as printed material when he/she deemed it necessary. In this way, students were able to access the designed infographics at the time of their choosing and had the opportunity to repeat and reinforce the course subjects and the information they learned, whereas teachers were given the option to closely observe the effect of infographics on educative activities for both themselves and the students. At the end of the implementation performed by the teachers, interviews were held with teachers and 51 students who were enrolled in the classes given by these teachers and volunteered for the data collection processes. In order to avoid any loss of data, interviews were recorded after obtaining permission from teachers and students, which were transcribed later.
Analysis of data: analysis of the quantitative data obtained in the study was conducted using the SPSS 20 programme. Frequency (f) was used in the analysis of demographic data of the working group. In the evaluation of the pre-test and post-test results of the working group, the paired t-test was used to determine the significance level between the median (x), standard deviation, pre-test and post-test results.
Content analysis was conducted in the analysis of the quantitative data obtained in the interviews held with teachers and students and “coding according to the concepts extracted from data” was used as a technique. The researchers coded the data individually and it was subsequently double-checked by an academic expert in the field. At the end of this process, the “reliability=agreement / agreement + disagreement” formula was applied to the codings. The compliance between two encoders was calculated as 86% and 81% for the teachers and students, respectively. Categories created after encodings were tabulated as frequencies. Additionally, obtained qualitative data was supported via direct citations from the teacher and student opinions. The identities of the interviewed teachers and students were kept confidential and each of them was assigned a number (Teacher 1: T1, Student 2: S2).
Figure 6. Social Studies / Council of Ministers
Ozdamli & Ozdal / Infographics in Education
1208
FINDINGS The findings obtained for each sub-purpose are presented below.
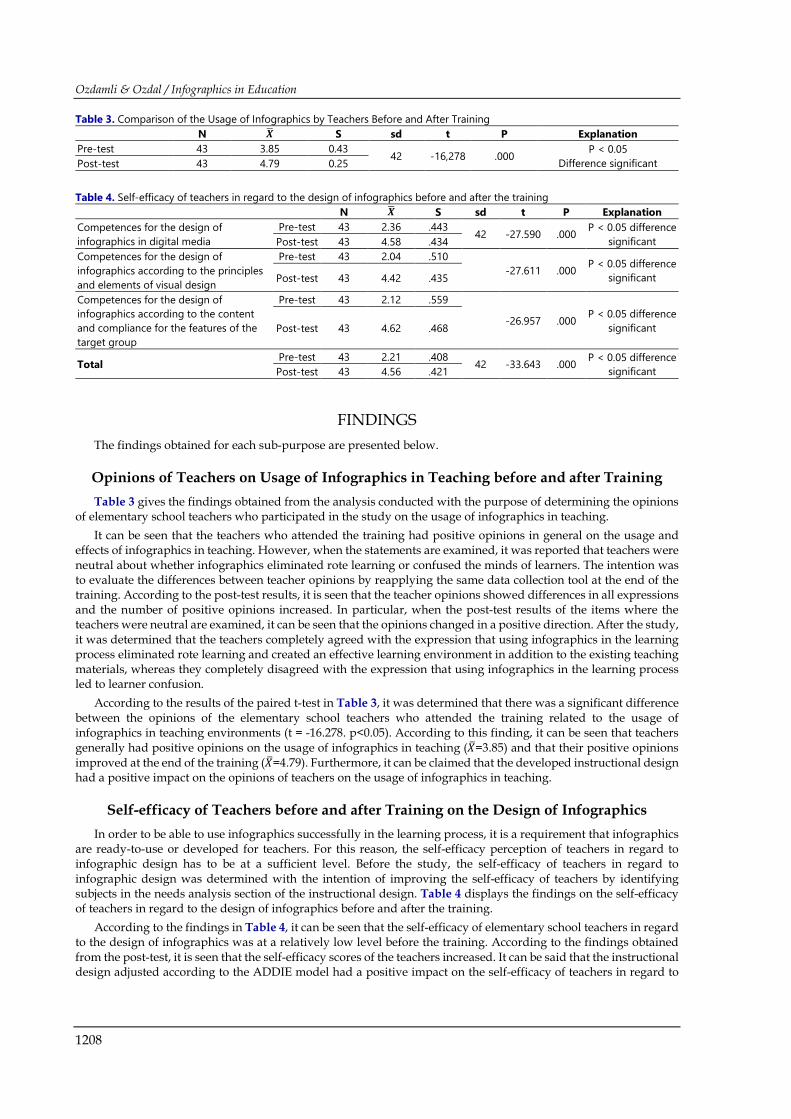
Opinions of Teachers on Usage of Infographics in Teaching before and after Training Table 3 gives the findings obtained from the analysis conducted with the purpose of determining the opinions
of elementary school teachers who participated in the study on the usage of infographics in teaching. It can be seen that the teachers who attended the training had positive opinions in general on the usage and
effects of infographics in teaching. However, when the statements are examined, it was reported that teachers were neutral about whether infographics eliminated rote learning or confused the minds of learners. The intention was to evaluate the differences between teacher opinions by reapplying the same data collection tool at the end of the training. According to the post-test results, it is seen that the teacher opinions showed differences in all expressions and the number of positive opinions increased. In particular, when the post-test results of the items where the teachers were neutral are examined, it can be seen that the opinions changed in a positive direction. After the study, it was determined that the teachers completely agreed with the expression that using infographics in the learning process eliminated rote learning and created an effective learning environment in addition to the existing teaching materials, whereas they completely disagreed with the expression that using infographics in the learning process led to learner confusion.
According to the results of the paired t-test in Table 3, it was determined that there was a significant difference between the opinions of the elementary school teachers who attended the training related to the usage of infographics in teaching environments (t = -16.278. p<0.05). According to this finding, it can be seen that teachers generally had positive opinions on the usage of infographics in teaching (𝑋𝑋�=3.85) and that their positive opinions improved at the end of the training (𝑋𝑋�=4.79). Furthermore, it can be claimed that the developed instructional design had a positive impact on the opinions of teachers on the usage of infographics in teaching.
Self-efficacy of Teachers before and after Training on the Design of Infographics In order to be able to use infographics successfully in the learning process, it is a requirement that infographics
are ready-to-use or developed for teachers. For this reason, the self-efficacy perception of teachers in regard to infographic design has to be at a sufficient level. Before the study, the self-efficacy of teachers in regard to infographic design was determined with the intention of improving the self-efficacy of teachers by identifying subjects in the needs analysis section of the instructional design. Table 4 displays the findings on the self-efficacy of teachers in regard to the design of infographics before and after the training.
According to the findings in Table 4, it can be seen that the self-efficacy of elementary school teachers in regard to the design of infographics was at a relatively low level before the training. According to the findings obtained from the post-test, it is seen that the self-efficacy scores of the teachers increased. It can be said that the instructional design adjusted according to the ADDIE model had a positive impact on the self-efficacy of teachers in regard to
Table 3. Comparison of the Usage of Infographics by Teachers Before and After Training N 𝑿𝑿� S sd t P Explanation
Pre-test 43 3.85 0.43 42 -16,278 .000 P < 0.05
Difference significant Post-test 43 4.79 0.25
Table 4. Self-efficacy of teachers in regard to the design of infographics before and after the training N 𝑿𝑿� S sd t P Explanation
Competences for the design of infographics in digital media
Pre-test 43 2.36 .443 42 -27.590 .000 P < 0.05 difference significant Post-test 43 4.58 .434
Competences for the design of infographics according to the principles and elements of visual design
Pre-test 43 2.04 .510 -27.611 .000 P < 0.05 difference
significant Post-test 43 4.42 .435
Competences for the design of infographics according to the content and compliance for the features of the target group
Pre-test 43 2.12 .559
-26.957 .000 P < 0.05 difference significant Post-test 43 4.62 .468
Total Pre-test 43 2.21 .408 42 -33.643 .000 P < 0.05 difference significant Post-test 43 4.56 .421
EURASIA J Math Sci and Tech Ed
1209
the infographic design. Paired t-test analysis was performed in order to investigate whether there was a significant difference between the self-efficacy of teachers before and after the training.
According to the findings in Table 4, the qualifications of the teachers before the training were calculated as follows: efficacy for design of infographics in digital media - 𝑋𝑋�=2.36; efficacy for design of infographics according to the principles and elements of digital design - 𝑋𝑋�= 2.04; efficacy for design of infographics according to content and compliance with the features of the target group - 𝑋𝑋�= 2.12; and general total - 𝑋𝑋�= 2.21. At the end of the implementation: the efficacy of the teachers for design of infographics in digital media - 𝑋𝑋�=4.58; efficacy for design of infographics according to the principles and elements of digital design - 𝑋𝑋�= 4.42; efficacy for design of infographics according to content and compliance with the features of target group - 𝑋𝑋�= 4.62; and general total - 𝑋𝑋�= 4.56. It can thus be claimed that the self-efficacy of teachers for designing and developing infographics changed in a positive direction. According to this finding, it can be stated that the targets identified for infographic design were reached by teachers and that the instructional design had a positive impact.
Opinions of Elementary School Teachers on the Design and Usage in Teaching of Infographics
At the end of the training, interviews were conducted with teachers on the general structure, characteristics and usage in the teaching of infographics, their design process, and the approaches of students in their classes on infographics. Table 5 provides the opinions of teachers on infographics and their design processes.
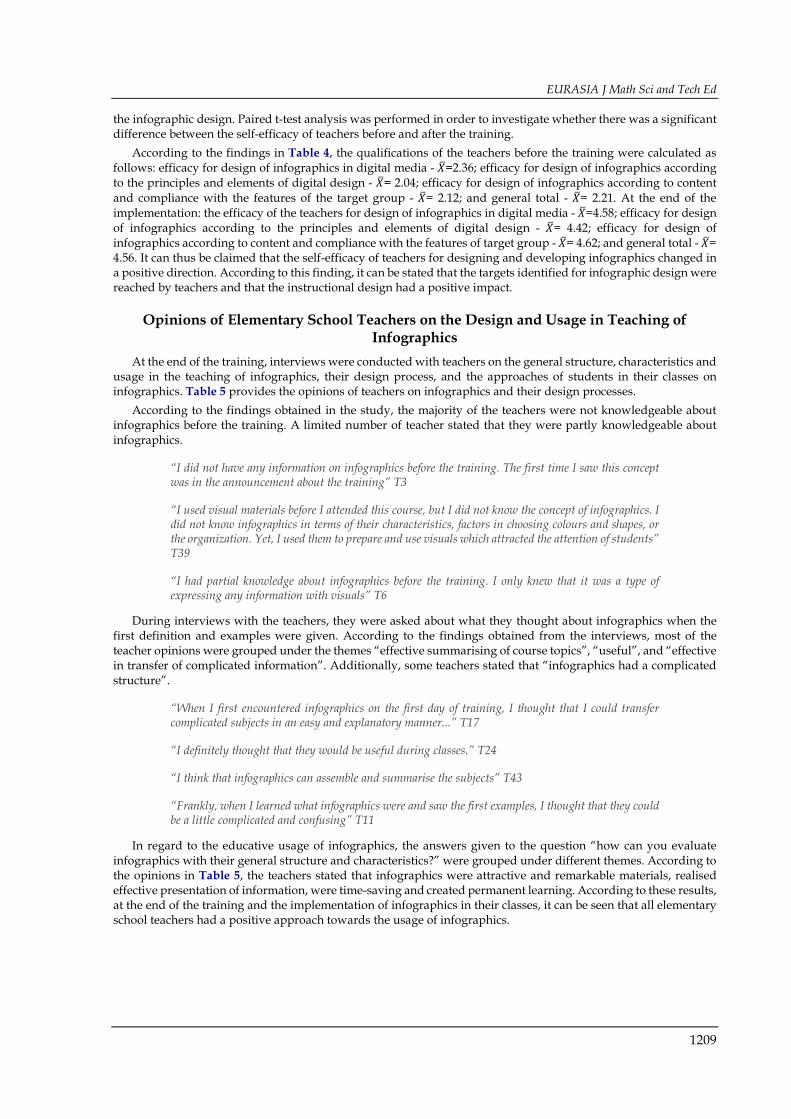
According to the findings obtained in the study, the majority of the teachers were not knowledgeable about infographics before the training. A limited number of teacher stated that they were partly knowledgeable about infographics.
“I did not have any information on infographics before the training. The first time I saw this concept was in the announcement about the training” T3
“I used visual materials before I attended this course, but I did not know the concept of infographics. I did not know infographics in terms of their characteristics, factors in choosing colours and shapes, or the organization. Yet, I used them to prepare and use visuals which attracted the attention of students” T39
“I had partial knowledge about infographics before the training. I only knew that it was a type of expressing any information with visuals” T6
During interviews with the teachers, they were asked about what they thought about infographics when the first definition and examples were given. According to the findings obtained from the interviews, most of the teacher opinions were grouped under the themes “effective summarising of course topics”, “useful”, and “effective in transfer of complicated information”. Additionally, some teachers stated that “infographics had a complicated structure”.
“When I first encountered infographics on the first day of training, I thought that I could transfer complicated subjects in an easy and explanatory manner...” T17
“I definitely thought that they would be useful during classes.” T24
“I think that infographics can assemble and summarise the subjects” T43
“Frankly, when I learned what infographics were and saw the first examples, I thought that they could be a little complicated and confusing” T11
In regard to the educative usage of infographics, the answers given to the question “how can you evaluate infographics with their general structure and characteristics?” were grouped under different themes. According to the opinions in Table 5, the teachers stated that infographics were attractive and remarkable materials, realised effective presentation of information, were time-saving and created permanent learning. According to these results, at the end of the training and the implementation of infographics in their classes, it can be seen that all elementary school teachers had a positive approach towards the usage of infographics.
Ozdamli & Ozdal / Infographics in Education
1210
“As an educator, I think that infographics are more effective compared to other visual materials, and they provide an effective transfer of information along with their superior visual characteristics. My students were looking forward to scanning the QR codes stuck on their books and to see the relevant infographic.” T4
Table 5. General structure, characteristics and usage in teaching of infographics according to teacher opinions Category Theme f Knowledgeability on infographics before training
None 39 Partly 4
First opinions when the definition and examples of infographics were given on the first day of training
Effective summarizing 33 Useful 21 Effective in the transfer of complicated information 18 Fun 15 Complicated 9 Neutral 5
Defining and evaluating infographics with their general structure and characteristics from the viewpoint of an educator
Attractive and remarkable 39 Impressive presentation of information 28 Time-saving 26 Catchy 21 A good alternative 16 Presentation with visual components 12 Narration 8 Combined usage of several components 5 Visualization of digital data 1
Advantages of infographics according to teacher opinions
Repetition and reinforcement 37 Keeping attention constant during class 34 Simplification of complicated and intense information 34 Transfer of concrete information in a short period of time 26 Ensuring permanent learning 21 Summarizing 20 Making subject content attractive 17 Creating a fun learning environment 15 Removing boring elements 7 Improving visual literacy level 2
Disadvantages and limitations of infographics according to teacher opinions
Ineffectiveness of unsuitable design 41 Extra time 19 More workload 11
Differences of infographics from other visual teaching materials according to teacher opinions
Design structure 43 Narration 41 Multiple elements 36 Attractive 27 Does not require preliminary knowledge 16 Easily understandable 13 Openness 11 Interpretation 6 Scenario-based 3 Persuasive 1
Usefulness of infographics in elementary school classes according to teacher opinions
They can be used in all classes 42 They can be used especially in social studies classes 28 They can be used especially in science and technology classes 28 They can be used especially in maths classes 11 They can be used especially in English classes 5 They can be used especially in Turkish classes 4 They can be used in information and communication technologies classes for theoretical subjects 2
You may not be able to design infographic for all subject contents 2 They can be used for teaching concepts in special education 1
EURASIA J Math Sci and Tech Ed
1211
“In addition to making the content concrete, which is very important for children, it makes a serious contribution in terms of summarising the discussed subject and increasing interest by attracting attention to critical points” T6
“I think that it is a visualisation method which will attract the attention of students, ensuring that they better understand the subject and ensuring that the learned topics are catchier” T22
In the interviews held with teachers, attempts were made to obtain information about the advantages and limitations of infographics. The opinions of teachers on the advantages of infographics were grouped under the themes “keeping attention constant”, “providing for repetition and reinforcement”, “simplification of complicated and intense information”, “transferring more information in a shorter period of time” “summarising the subject in an effective and meaningful way”, and “making the content more attractive”.
“During an education and teaching process, students learn information by hearing, seeing and touching. We, teachers, tend to use audio learning due to restricted class hours, which can present difficulties for students who favour learning by seeing or touching. By using infographics, we can use different ways of learning at the same time and increase the permanence of learning” T6
“As a result of using infographics in my class, I observed that they are more easily understandable, useful for attracting the attention of students to the class, effective in learning and catchy. Students do not forget the information easily as visual expressions are used” Ö23
Besides these opinions, it was also stated that infographics could have some limitations in learning environments. The opinions of teachers on the limitations of infographics were grouped under the themes “infographics which are not suitable for the design principles and content having negative effect on learning”, “extra time required by design process”, and “more workload for teachers”. According to these results, the teachers believed that using infographics that are not well prepared in terms of design and content could cause problems and lead to the design process requiring extra workload and time.
“I did not have any problems in the implementation process, but one limitation can be that it requires more workload and spending more time” T14
“When they are not prepared appropriately for the subject or according to the ages and preparedness of the students, the learning process can be affected negatively. In short, disadvantages can occur as regards the way of preparation of infographics. However, if the training we received is offered to all teachers, these limitations can be turned into advantages and infographics can be used successfully in education” T6
“I think that infographics can create problems when they are not prepared in accordance with the levels of students and course content. As we learned in the training, the main purpose of infographics is the visualisation of data. Using unnecessary text-based content, failure to include a construct and not paying attention to design principles will definitely cause problems” T21
In the interviews held with teachers, the differences of infographics compared with other visual materials were also discussed. The opinions of teachers in regard to this subject were usually grouped under the themes “design structure”, “telling a story”, “using more components in combination”, “being more attractive”, and “not requiring preliminary knowledge by the target group”.
“I think that explaining subjects with infographics is much more attractive compared to other visual materials. I think that telling a story is what distinguishes them from others” T16
“As a result of my observations, I think that infographics are more effective compared to other visual materials. They are more attractive and effective. They are fun and they easily present information to the learner.” Ö8
In the interviews held with teachers, the courses in which infographics could be used were also discussed. All teachers thought that infographics could be used effectively in all courses.
“I think that infographics can be used effectively in all courses. Maths, life sciences, Turkish…” T21
“I believe that they can be used in all course contents. They are perfect tools, especially for science and technology classes.” T17
Ozdamli & Ozdal / Infographics in Education
1212
“As a classroom teacher, I am offering 4 courses; Turkish, maths, social studies, science and technology. In all these courses, I believe that infographics can be prepared for all chapters.” T5
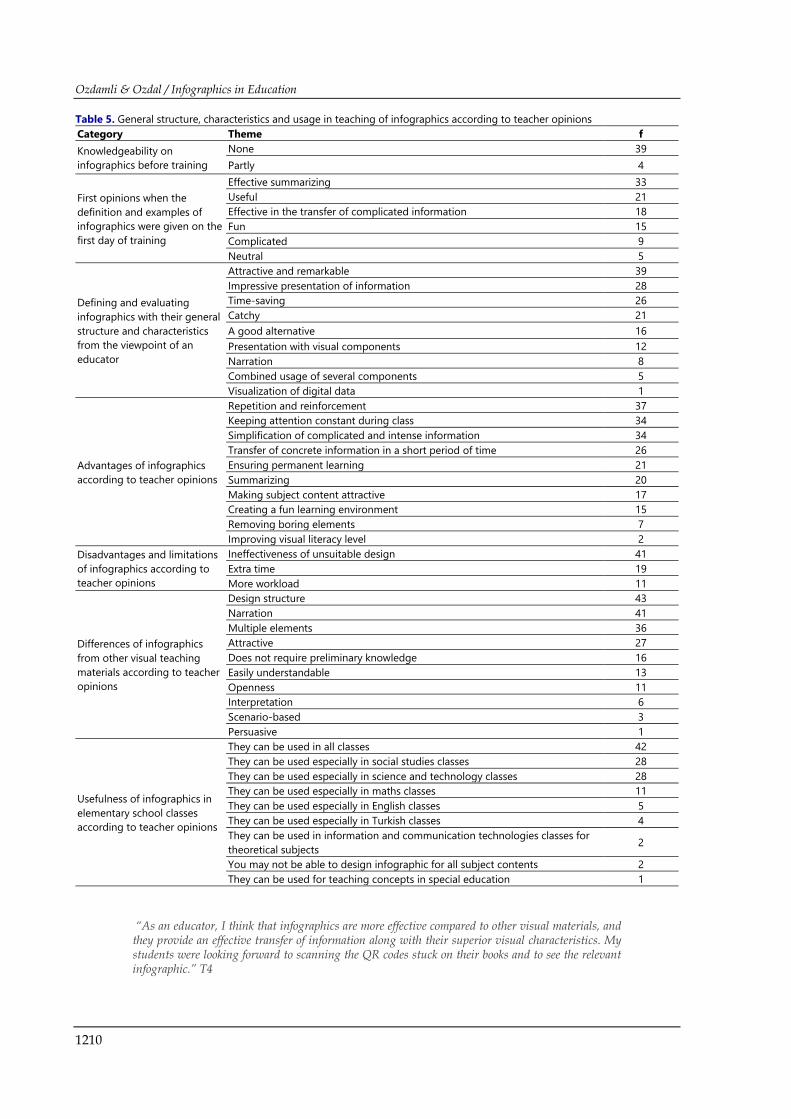
According to the opinions of the elementary school teachers, attempts were made to explain the advantages and limitations of using infographics in teaching with an infographic. In the infographic in Figure 7, the advantages and limitations of infographics are summarised.
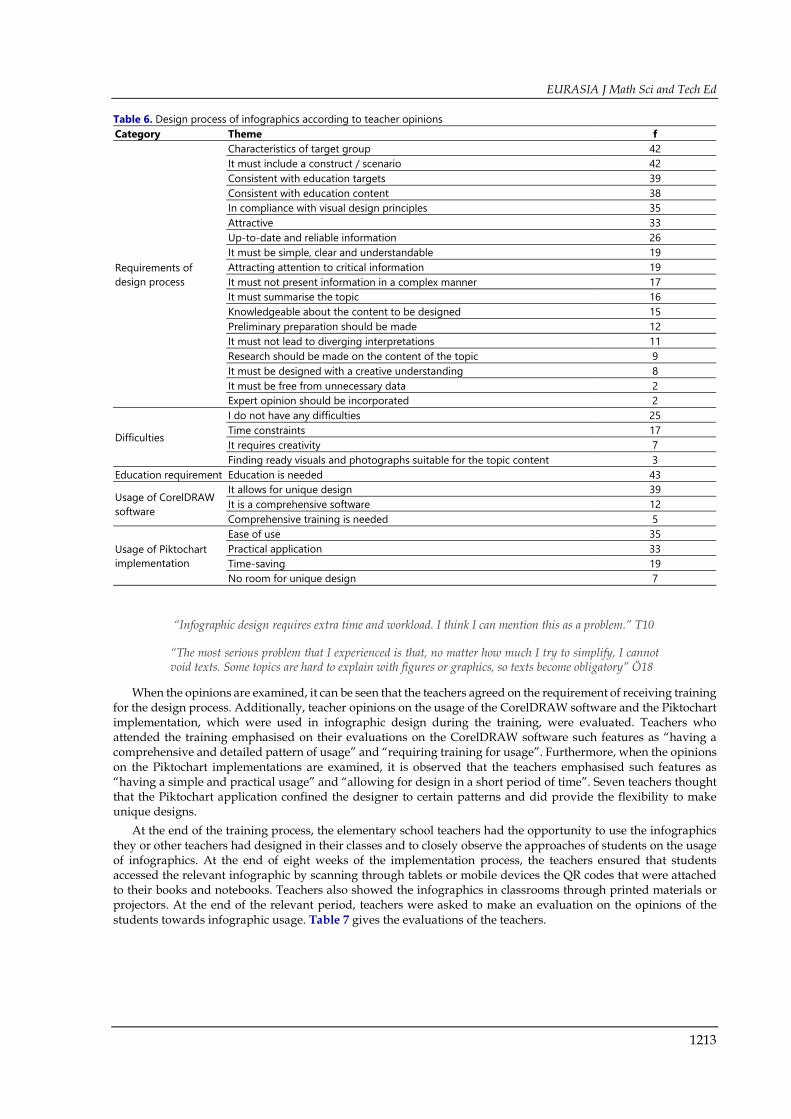
One aim of the study was to identify the opinions on the design processes in addition to the structural characteristics of infographics and their usage in teaching. Table 6 presents the opinions of teachers on the design process of infographics.
During the interviews held with teachers, answers were sought to the questions “What are the points that deserve attention in designing an infographic?” and “What does the infographic process require?” The answers given by the teachers to this question were largely grouped under the themes “suitability for the characteristics of target group”, “creating a construct / scenario”, “consistency with the targets of education and topic content”, “compliance with visual design principles”, “being up-to-date”, “being simple, clear and understandable”, and “being attractive”.
“In this process, in addition to the general features of preparing infographics, attention must be paid to ensure that they are suitable for the students. Infographics must be prepared taking into consideration the preparedness, lifestyles and individual characteristics of the students” T35
“Once I decide on which content to prepare, the first thing I must have is a scenario. According to the scenario I wrote, and paying attention to the principles of visual design, I am organizing the components (photograph, illustration, text, figure etc.) in a visual order and designing the infographics.” T42
“As an educator, I think that some elements deserve attention in the design process of infographics. First of all, the individual characteristics of students must be considered; in addition, the infographic to be prepared must be suitable for the content of and acquisitions from the topic. Otherwise, learning can be affected negatively.” T1
In the interviews held with teachers, evaluations were made on the difficulties that they experienced during the infographic design process. Teacher opinions on the problems faced during the infographic design process were generally grouped under the themes “time problem”, “difficulty in transforming some contents into infographic”, and “finding photographs suitable for the topic content”. Twenty-five teachers stated that they did not have any difficulties in the infographic design process.
Figure 7. Advantages and limitations of infographics according to teacher opinions
EURASIA J Math Sci and Tech Ed
1213
“Infographic design requires extra time and workload. I think I can mention this as a problem.” T10
“The most serious problem that I experienced is that, no matter how much I try to simplify, I cannot void texts. Some topics are hard to explain with figures or graphics, so texts become obligatory” Ö18
When the opinions are examined, it can be seen that the teachers agreed on the requirement of receiving training for the design process. Additionally, teacher opinions on the usage of the CorelDRAW software and the Piktochart implementation, which were used in infographic design during the training, were evaluated. Teachers who attended the training emphasised on their evaluations on the CorelDRAW software such features as “having a comprehensive and detailed pattern of usage” and “requiring training for usage”. Furthermore, when the opinions on the Piktochart implementations are examined, it is observed that the teachers emphasised such features as “having a simple and practical usage” and “allowing for design in a short period of time”. Seven teachers thought that the Piktochart application confined the designer to certain patterns and did provide the flexibility to make unique designs.
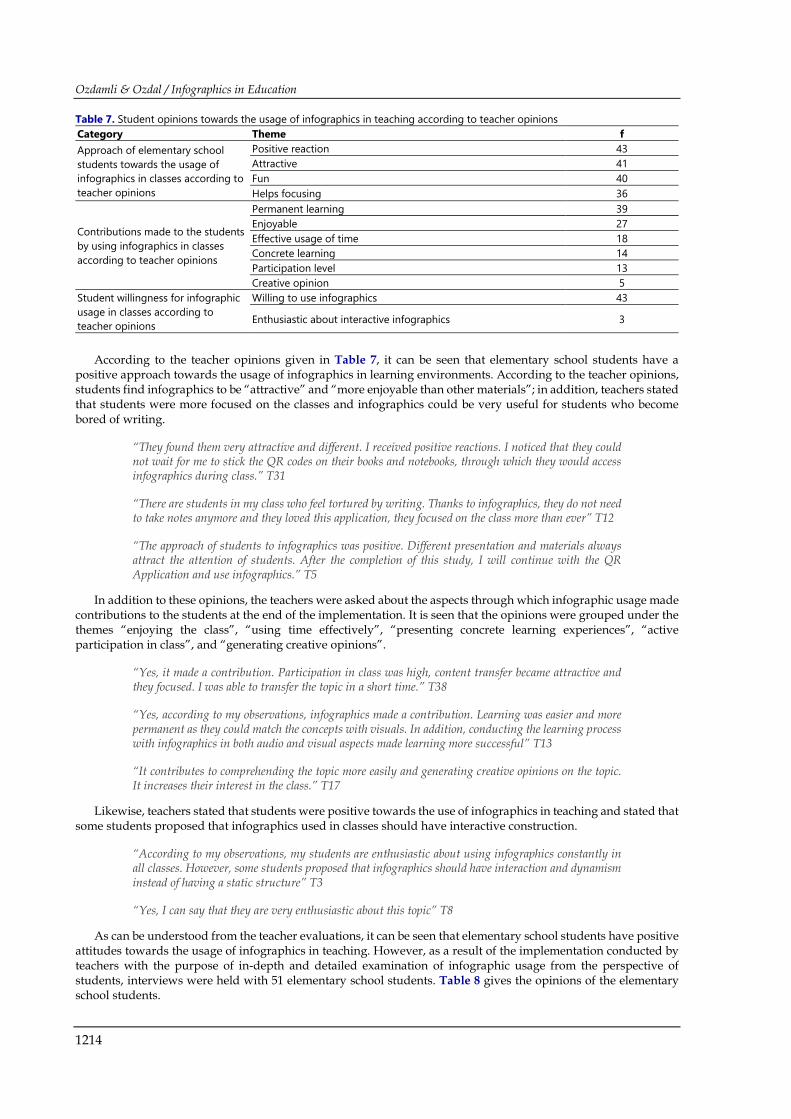
At the end of the training process, the elementary school teachers had the opportunity to use the infographics they or other teachers had designed in their classes and to closely observe the approaches of students on the usage of infographics. At the end of eight weeks of the implementation process, the teachers ensured that students accessed the relevant infographic by scanning through tablets or mobile devices the QR codes that were attached to their books and notebooks. Teachers also showed the infographics in classrooms through printed materials or projectors. At the end of the relevant period, teachers were asked to make an evaluation on the opinions of the students towards infographic usage. Table 7 gives the evaluations of the teachers.
Table 6. Design process of infographics according to teacher opinions Category Theme f
Requirements of design process
Characteristics of target group 42 It must include a construct / scenario 42 Consistent with education targets 39 Consistent with education content 38 In compliance with visual design principles 35 Attractive 33 Up-to-date and reliable information 26 It must be simple, clear and understandable 19 Attracting attention to critical information 19 It must not present information in a complex manner 17 It must summarise the topic 16 Knowledgeable about the content to be designed 15 Preliminary preparation should be made 12 It must not lead to diverging interpretations 11 Research should be made on the content of the topic 9 It must be designed with a creative understanding 8 It must be free from unnecessary data 2 Expert opinion should be incorporated 2
Difficulties
I do not have any difficulties 25 Time constraints 17 It requires creativity 7 Finding ready visuals and photographs suitable for the topic content 3
Education requirement Education is needed 43
Usage of CorelDRAW software
It allows for unique design 39 It is a comprehensive software 12 Comprehensive training is needed 5
Usage of Piktochart implementation
Ease of use 35 Practical application 33 Time-saving 19 No room for unique design 7
Ozdamli & Ozdal / Infographics in Education
1214
According to the teacher opinions given in Table 7, it can be seen that elementary school students have a positive approach towards the usage of infographics in learning environments. According to the teacher opinions, students find infographics to be “attractive” and “more enjoyable than other materials”; in addition, teachers stated that students were more focused on the classes and infographics could be very useful for students who become bored of writing.
“They found them very attractive and different. I received positive reactions. I noticed that they could not wait for me to stick the QR codes on their books and notebooks, through which they would access infographics during class.” T31
“There are students in my class who feel tortured by writing. Thanks to infographics, they do not need to take notes anymore and they loved this application, they focused on the class more than ever” T12
“The approach of students to infographics was positive. Different presentation and materials always attract the attention of students. After the completion of this study, I will continue with the QR Application and use infographics.” T5
In addition to these opinions, the teachers were asked about the aspects through which infographic usage made contributions to the students at the end of the implementation. It is seen that the opinions were grouped under the themes “enjoying the class”, “using time effectively”, “presenting concrete learning experiences”, “active participation in class”, and “generating creative opinions”.
“Yes, it made a contribution. Participation in class was high, content transfer became attractive and they focused. I was able to transfer the topic in a short time.” T38
“Yes, according to my observations, infographics made a contribution. Learning was easier and more permanent as they could match the concepts with visuals. In addition, conducting the learning process with infographics in both audio and visual aspects made learning more successful” T13
“It contributes to comprehending the topic more easily and generating creative opinions on the topic. It increases their interest in the class.” T17
Likewise, teachers stated that students were positive towards the use of infographics in teaching and stated that some students proposed that infographics used in classes should have interactive construction.
“According to my observations, my students are enthusiastic about using infographics constantly in all classes. However, some students proposed that infographics should have interaction and dynamism instead of having a static structure” T3
“Yes, I can say that they are very enthusiastic about this topic” T8
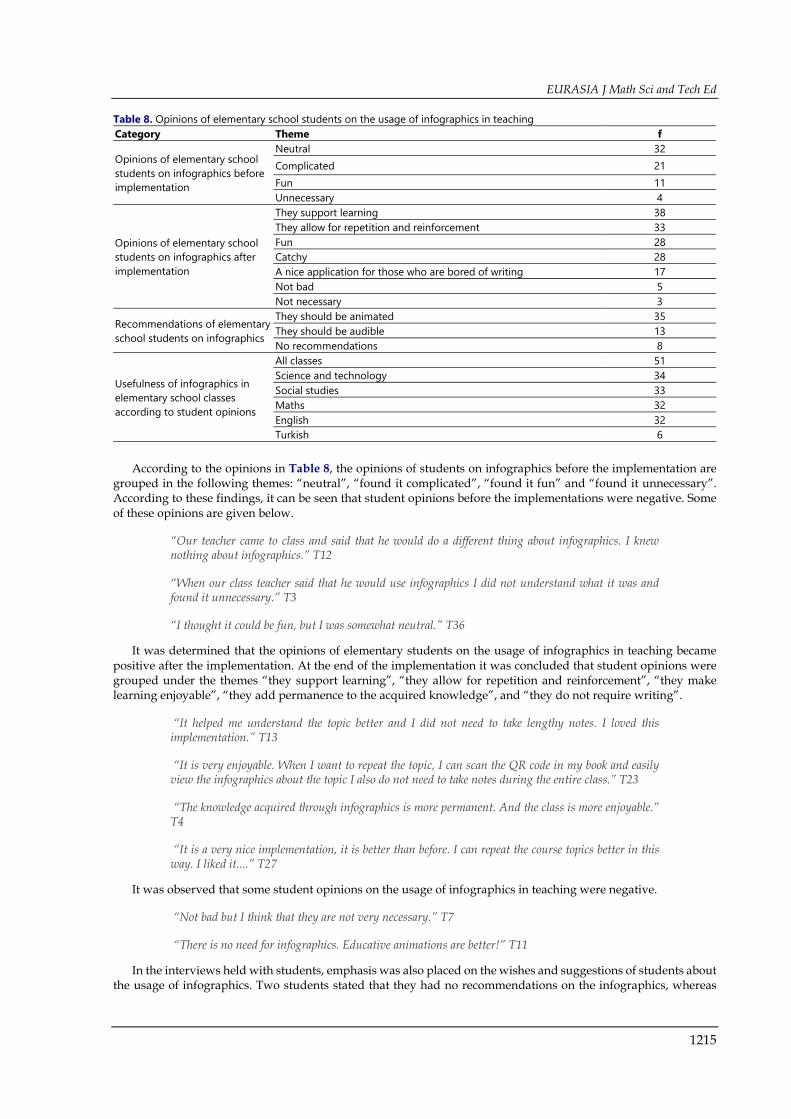
As can be understood from the teacher evaluations, it can be seen that elementary school students have positive attitudes towards the usage of infographics in teaching. However, as a result of the implementation conducted by teachers with the purpose of in-depth and detailed examination of infographic usage from the perspective of students, interviews were held with 51 elementary school students. Table 8 gives the opinions of the elementary school students.
Table 7. Student opinions towards the usage of infographics in teaching according to teacher opinions Category Theme f Approach of elementary school students towards the usage of infographics in classes according to teacher opinions
Positive reaction 43 Attractive 41 Fun 40 Helps focusing 36
Contributions made to the students by using infographics in classes according to teacher opinions
Permanent learning 39 Enjoyable 27 Effective usage of time 18 Concrete learning 14 Participation level 13 Creative opinion 5
Student willingness for infographic usage in classes according to teacher opinions
Willing to use infographics 43
Enthusiastic about interactive infographics 3
EURASIA J Math Sci and Tech Ed
1215
According to the opinions in Table 8, the opinions of students on infographics before the implementation are grouped in the following themes: “neutral”, “found it complicated”, “found it fun” and “found it unnecessary”. According to these findings, it can be seen that student opinions before the implementations were negative. Some of these opinions are given below.
“Our teacher came to class and said that he would do a different thing about infographics. I knew nothing about infographics.” T12
“When our class teacher said that he would use infographics I did not understand what it was and found it unnecessary.” T3
“I thought it could be fun, but I was somewhat neutral.” T36
It was determined that the opinions of elementary students on the usage of infographics in teaching became positive after the implementation. At the end of the implementation it was concluded that student opinions were grouped under the themes “they support learning”, “they allow for repetition and reinforcement”, “they make learning enjoyable”, “they add permanence to the acquired knowledge”, and “they do not require writing”.
“It helped me understand the topic better and I did not need to take lengthy notes. I loved this implementation.” T13
“It is very enjoyable. When I want to repeat the topic, I can scan the QR code in my book and easily view the infographics about the topic I also do not need to take notes during the entire class.” T23
“The knowledge acquired through infographics is more permanent. And the class is more enjoyable.” T4
“It is a very nice implementation, it is better than before. I can repeat the course topics better in this way. I liked it....” T27
It was observed that some student opinions on the usage of infographics in teaching were negative.
“Not bad but I think that they are not very necessary.” T7
“There is no need for infographics. Educative animations are better!” T11
In the interviews held with students, emphasis was also placed on the wishes and suggestions of students about the usage of infographics. Two students stated that they had no recommendations on the infographics, whereas
Table 8. Opinions of elementary school students on the usage of infographics in teaching Category Theme f
Opinions of elementary school students on infographics before implementation
Neutral 32 Complicated 21 Fun 11 Unnecessary 4
Opinions of elementary school students on infographics after implementation
They support learning 38 They allow for repetition and reinforcement 33 Fun 28 Catchy 28 A nice application for those who are bored of writing 17 Not bad 5 Not necessary 3
Recommendations of elementary school students on infographics
They should be animated 35 They should be audible 13 No recommendations 8
Usefulness of infographics in elementary school classes according to student opinions
All classes 51 Science and technology 34 Social studies 33 Maths 32 English 32 Turkish 6
Ozdamli & Ozdal / Infographics in Education
1216
other students suggested that infographics should be dynamic and audible. Most students expressed in the interviews that infographics could be used in all classes.
CONCLUSION, DISCUSSION AND RECOMMENDATIONS In this study, a teaching construct for the design of infographics was developed with the purpose of determining
the impact of this design on the self-efficacy and opinions of elementary school teachers for the design and usage of infographics. Additionally, opinions of elementary school teachers and students on the usage of infographics in teaching were evaluated. Diverse conclusions were reached in the study, which was conducted within the framework of these basic purposes.
According to the conclusions reached in the study, a significant difference was not detected in terms of the opinions of elementary school teachers on the usage of infographics in teaching before and after training. Before training, it was seen that teachers generally had a positive attitude towards the usage of infographics in teaching environments; however, it was determined that they were neutral as to the impact of infographics on eliminating rote learning, leading to confusion in students, as well as the effectiveness of infographics compared to existing teaching materials. After the completion of the training, the opinion survey was re-administered and it was found that the opinions of teachers on the usage of infographics in teaching became generally positive, including those who previously were undecided. According to this result, it can be seen that the delivered training created differences in terms of the opinions of teachers and created more positive viewpoints.
According to another finding reached in the study, there is a significant difference between the self-efficacy level of teachers for infographic design before and after training. The evaluations made before training indicated that teachers suffered from very low self-efficacy in terms of the “design of infographics in digital media”, “design of infographics according to the principles and elements of visual design”, and “design of infographics based on the compliance with the content and characteristics of target group”. It can be commented that this was due to the fact that infographics are new tools for visualisation, that they are not known widely enough and that they are not sufficiently popular in the field of education. After the training was completed, teachers were allowed to make self-evaluation through the same self-efficacy scale. The evaluation showed that in all three areas, the self-efficacy of teachers improved positively and significantly, which proves that the developed instructional design and training process served its purpose.
After the completion of the training process, elementary school teachers used the infographics they developed according to class contents as teaching tools in their classes and observed the effects of infographics in learning environments from different perspectives. Each teacher ensured that students accessed the infographics related to the topic with their tablets or mobile devices through the QR codes that they had attached to their notebooks or textbooks. In addition, teachers assisted class discussions by using projectors to show students examples of infographics in classroom environments. After the completion of the process, interviews were held with both teachers and students in order to evaluate in detail the usage of infographics in teaching from certain perspectives.
According to the conclusions reached in the interviews, it was found that teachers were not knowledgeable about infographics before training, and that their opinions were shaped in a positive way after the first definitions and examples on infographics were given. When the first evaluations of teachers on infographics were examined, it can be seen that they generally believed that infographics would ensure effective summarising of course topics, and could act as a useful and enjoyable visualisation method for transferring complicated data. In a similar vein, it was found that the teachers thought that infographics created such advantages as repetition and reinforcement, keeping interest in the class constant, simplifying complicated and intense data, and transferring more concrete and intense information in a shorter period of time. They also stated that infographics that are not suitable for the design principles, topic content and individual characteristics of students could have a negative impact on the learning processes. Similar to this finding, a study conducted by Nudin, Jing, Daud, Abdullah and Harun (2015) reported that weakly designed and non-structured infographics would fail in transferring ideas and information and would prevent accurate perception by students of the images during the visual communication process.
It was concluded that teachers found infographics to be different from other teaching materials, due to their design structure, narrating nature, the integration of more visual elements and as they are more attractive. Generally, it was found that they thought that infographics could be used in all types of classes. Similar to these findings, another study conducted by Vanichvasin (2013) stated that infographics had a positive impact on evaluation, comprehension and permanence. Another research by Yildirim, Yildirim, Celik and Aydin (2014) emphasised that infographics were attractive and effective visualisation tools.
According to the results of interviews on the design process of using infographics, it is was stressed that teachers think that infographics have to be compliant with and suitable to the characteristics of the target group, content and acquisitions, as well as visual design principles, that they should include a construct / scenario, transfer up-to-date and reliable data, have a simple and understandable structure, attract attention to critical data, and avoid
EURASIA J Math Sci and Tech Ed
1217
information chaos. Similar to these findings, a study conducted by Yildirim (2016) suggested that the visuals that best reflected the content should be used in the design of infographics, which efforts should be made to transfer knowledge effectively and avoid giving unnecessary information. Also the content of the relevant course should be analysed at the highest level, that message design principles should be taken into consideration and that the infographic should consist of up-to-date information. Likewise, a study conducted by Siricharoen and Siricharoen (2015) emphasised that mental effort is needed in the design of infographics to determine how the purpose and data could be best transferred to the target group and that the elements in infographics should support the information process. The research found that all elements in the infographic (lines, colours, etc.) have a meaning and function and the evaluation was important in terms of generating a good graphic and ensured that people more easily understood the central topic in the infographic.
When the results in regard to the difficulties experienced in the design of infographics are examined, it can be seen that some teachers mentioned “time problems” and “difficulties in converting the contents of every topic into an infographic”. Diverging from this finding, the study conducted by Yildirim, Yildirim, Celik and Aydin (2014) emphasised that expert-level knowledge is required for preparing didactic content in infographic design. Additionally, it was found out that teachers agreed that they should receive training on the infographic design process.
The results of the application infographics by teachers in their classes revealed that elementary school students had positive reactions towards infographics. According to the teacher opinions, it was concluded that students found infographic usage in classes attractive and entertaining, and were more focused on the classes. In addition, when the evaluation of the teachers in regard to the contribution of infographics for the students in the implementation process was examined, it was found that they stressed “permanence of acquired knowledge”, “class participation and interest”, “effective usage of time”, “making course content more concrete”, and “generating creative ideas on the subject”. In the same vein, it may be concluded that students were enthusiastic about the usage of infographics in classes. Parallel to this finding, a study conducted by Islamoglu, Ay, Ilic, Mercimek, Donmez, Kuzu and Odabasi (2015) identified that using infographics in teaching environments activated the visual and verbal processing channels of students and reinforced meaningful learning.
In this study, the opinions of elementary school students on the usage of infographics in teaching were evaluated. In the first stage, it was seen that most students were in a neutral position in regard to the usage of infographics and evaluated infographics under the themes such as “unnecessary”, “fun” and “complicated”. After the implementation of infographics in classes, it was determined that student opinions changed positively. After the implementation process, students stated that infographics supported learning in the teaching process, allowed for repetition and reinforcement, had an enjoyable structure, and was a beneficial for those who became bored of writing. From this perspective, it was concluded that student opinions were parallel to the teachers’ opinions. In addition, it was found that, similar to the teachers, students agreed that infographics could be used in all classes and they suggested that infographics should consist of audio elements and interaction.
Based on the results found in this research and its advantages, it can be defined as a new and innovative visualisation tool. It can be suggested that infographics should be used in learning environments starting from the elementary level. For this effect, it is recommended that infographics developed according to different course contents should be published in the web environment and an infographic web base should be created so as to ensure easy access by teachers and students to these infographics.
In the research, it was concluded that teachers at elementary school level emphasised the need for training on the infographic design process. For this reason, it can be recommended that in-service training programs should be developed for teaching materials in general and infographic design processes in particular in order to meet the training needs in this area.
This research was conducted in Northern Cyprus with teachers and students at the elementary school level. Similar studies in the future can include secondary and higher education levels so that infographic usage at these education levels can be evaluated in a multi-faceted manner. Repeating this research on different groups (scholars, managers, teacher candidates, student parents, etc.) can be suggested in terms of evaluating infographics from different perspectives.
Studies that will be conducted in the future can consist of experimental studies so as to determine the effectiveness of infographics on different courses and factors. Thus, the impact of infographics can be examined on the basis of individual courses.
Ozdamli & Ozdal / Infographics in Education
1218
REFERENCES Aisami, S. R. (2015). Learning styles and visual literacy for learning and performance. Procedia - Social and Behavioral
Sciences, 176, 538- 545. doi:10.1016/j.sbspro.2015.01.508 Al-Mohammadi, N. (2017). Effectiveness of using infographics as an approach for teaching programming
fundamentals on developing analytical thinking skills for high school students in the city of Makkah in Saudi Arabia. Global Journal of Educational Studies, 3(1), 22-42. doi:10.5296/gjes.v3i1.10854
Alshehri, A. M., & Ebaid, M. (2016). The effectiveness of using interactive infographic at teaching Mathematics in elementary school. British Journal of Education, 4(3), 1-8.
Association of College & Research Libraries (2011). ACRL visual literacy competency standards for higher education. Visual literacy defined. Retrived on 1 May 2017 from http://www.ala.org/acrl/standards/visualliteracy
Bradshaw, J. M., & Porter, S. (2017). Infographics: A new tool for the nursing classroom. Nurse Educator, 42(2), 57-59. doi:10.1097/NNE.0000000000000316
Buyukozturk, S., Cakmak, K. E., Akgun, E. O., & Demirel, F. (2008). Scientific Research Methods (4th Ed.), Ankara Turkey: Pegem Academy Publishing.
Castelyn, J., & Mottart, A. (2012). Presenting material via graphic organizers in science classes in secondary education. Procedia - Social and Behavioral Sciences, 69, 458-466. doi:10.1016/j.sbspro.2012.11.434
Davis, M., & Quinn, D. (2014). Visualizing Text: The new literacy of infographics. Reading Today, 31(3), 16. Debes, J. (1969). The loom of visual literacy: An overview. Audiovisual Instruction, 14(8), 25-27. Dick, M. (2013). Interactive infographics and news values. Digital Journalism, (ahead-of-print), 1-17. Dunlap, C. J., & Lowenthal, R. P. (2016). Getting graphic about infographics: Design lessons learned from popular
infographics. Journal of Visual Literacy, 35(1), 42-59. doi:10.1080/1051144X.2016.1205832 Estrada, R. C. F., & Davis, S. L. (2015). Improving visual communication of science through the incorporation of
graphic design theories and practices into science communication. Science Communication, 37(1), 140-148. doi:10.1177/1075547014562914
Fer, S. (2011). Öğretim Tasarımı (2th Edition). Ankara, Turkey: Anı Yayıncılık. Gustafson, K. L., & Branch, R.M. (2011). What is instructional design? In R.A. Reiser & J.V. Dempsey (Eds.), Trends
and issues in instructional design and technology (3rd Edition). Boston, MA: Pearson. Hattwig, D., Bussert, K., Medaille, A., & Burgess, J. (2013). Visual literacy standards in higher education: New
opportunities for libraries and student learning. Portal: Libraries and the Academy, 13(1), 61–89. doi:10.1353/pla.2013.0008
Islamoglu, H., Ay, O., Ilic, U., Mercimek, B., Donmez, P., Kuzu, A. & Odabasi, F. (2015). Infographics: A new competency area for teacher candidates. Cypriot Journal of Educational Sciences, 10(1), 32-39.
Kibar, N. P. (2016). Modelling infographic generation process as a learning strategy. Unpublished Doctorate Thesis, Hacettepe University, Institute of Educational Sciences, Ankara.
Krum, R. (2013). Cool infographics: Effective communication with data visualization and design. Indianapolis, IN: John Wiley & Sons, Inc.
Lankow, J., Ritchie, J., & Crooks, R. (2012). Infographics the power of visual storytelling. Hoboken NJ, United States: John Wiley & Sons, Inc.
Lapum J. L., & St-Amant, O. (2016) Visual images in undergraduate nursing education. Nurse Education, 41(3), 112-114. doi:10.1097/NNE.0000000000000214
Li, Z., Carberry, S., Fang, H., McCoy, F. K., & Peterson, K. (2014). Infographics retrieval: A new methodology, 19th International Conference on Applications of Natural Language to Information Systems, L’Université de Montpellier, 18 – 20 June 2014, Montpellier.
Little, D., Felten, P., & Berry, C. (2010). Liberal education in a visual world. Liberal Education, 96(2), 44-49. Locoro, A., Cabitza, F., Actis-Grosso, R., & Batini, C. (2017). Static and interactive infographics in daily tasks: A
value-in-use and quality of interaction user study. Computers in Human Behavior, 71, 240-257. doi:10.1016/j.chb.2017.01.032
Lundy, A. D., & Stephens, A. E. (2015). Beyond the literal: Teaching visual literacy in the 21st century classroom. Procedia - Social and Behavioral Sciences 174, 1057-1060. doi:10.1016/j.sbspro.2015.01.794
Morrison, G. R., Ross, S. M., Kemp, J. E., & Kalman, H. (2010). Designing effective instruction (6th Edition.). Columbus, Ohio: John Wiley & Sons.
EURASIA J Math Sci and Tech Ed
1219
Muijs, D. (2004). Doing quantitative research in education with SPSS. London: Sage Publications. doi:10.4135/9781849209014
Noh, M. A. M., Shamsudin, W. N. K., Nudin, A. L. A., Jing, H. F., Daud, S. M., Abdullah, N. N. N., & Harun, M. F. (2015). The Use of infographics as a tool for facilitating learning. In International Colloquium of Art and Design Education Research (i-CADER 2014) (pp. 559-567). Singapore: Springer. doi:10.1007/978-981-287-332-3_57
Ozdamli, F., Kocakoyun, S., Sahin, T., & Akdag, S. (2016). Statistical reasoning of impact of infographics on education. Procedia Computer Science, 102, 370–377. doi:10.1016/j.procs.2016.09.414
Palmer, S. M., & Matthews, T. (2015). Learning to see the infinite: Measuring visual literacy skills in a 1st-year seminar course. Journal of the Scholarship of Teaching and Learning, 5(1), 1-9.
Pisarenko, V., & Bondarew, M. (2016). Infographics use in teaching foreign languages for specific purposes. Recent Patents on Computer Science, 9(2), 124-132. doi:10.2174/2213275908666151006000223
Rajamanickam, V. (2005). Infographics seminar handout. Ahmedabad. Retrived on 4 May 2017 from http://www.schrockguide.net/uploads/3/9/2/2/392267/infographic_handout.pdf
Rezaei, N., & Sayadian, S. (2015). The impact of infographics on iranian EFL learners’ grammar learning. Journal of Applied Linguistics and Language Research, 2(1), 78-85.
Ru, G., & Ming, Y. C. (2014). Infographics applied in design education. Workshop on Advanced Research and Technology in Industry Applications (WARTIA), Ottawa Convention Centre, Ottawa, ON, Canada, 29-30 September 2014.
Simsek, H., & Yildirim, A. (2013). Qualitative research methods in the social sciences (9th Edition), Ankara, Turkey: Seckin Publishing.
Siricharoen, V. W., & Siricharoen, N. (2015). How infographic should be evaluated? The 7th International Conference on Information Technology, Al Zaytoonah University of Jordan, 12-15 May 2015, Jordan. doi:10.15849/icit.2015.0100
Smaldino, E. S., Lowther, L. D., & Russell, D. J. (2011). Instructional technology and media for learning. Boston, MA: Allyn & Bacon.
Smiciklas, M. (2012). The power of infographics. Using pictures to communicate and connect with your audiences. Indianapolis, IN: Pearson Education Inc.
Toth, C. (2013). Revisiting a genre: Teaching infographics in business and professional communication courses. Business Communication Quarterly, 76(4), 446-457. doi:10.1177/1080569913506253
Tugrul, T. (2017). Perceived learning effectiveness of a course Facebook page: teacher-led versus student-led approach. World Journal on Educational Technology: Current Issues, 9(1), 35-39. doi:10.18844/wjet.v9i1.1029
Tuncali, E. (2016). The Infographics which are designed for environmental issues. Global Journal on Humanites & Social Sciences, 3, 14-19.
Uyan, D. B. I. (2014). Data visualization and infographics in visual communication design education at the age of information. Journal of Arts and Humanities, 3(5), 39–50.
Uygarer, R. & Uzunboylu, H. (2017). An investigation of the digital teaching book compared to traditional books in distance education of teacher education programs. EURASIA Journal of Mathematics Science and Technology Education, 13(9), 5201-5213. doi:10.12973/eurasia.2017.00830a
Vanichvasin, P. (2013). Enhancing the quality of learning through the use of infographics as visual communication tool and learning tool. International Conference on QA Culture: Cooperation or Competition, Bangkok International Trade & Exhibition Centre, 7-8 November 2013, Bangkok.
Yeh, H., & Cheng, Y. (2010). The influence of the instruction of visual design principles on improving pre-service teachers’ visual literacy. Computers and Education, 54(1), 244-252. doi:10.1016/j.compedu.2009.08.008
Yıldırım, A. (1999). Qualitative research methods. Education and Science, 23(112), 7-17. Yildirim, S. (2016). Infographics for educational purposes: Their structure, properties and reader approaches.
TOJET: The Turkish Online Journal of Educational Technology, 15(3), 98-110. Yildirim, S., Yildirim, G., Celik, E., & Aydin, M. (2014). Student opinions about infographics design process. Journal
of Research in Education and Teaching, 3(4), 247-255.
http://www.ejmste.com


![[Guitar.VN]Manha de Carnaval_Nguyen The An.pdf](https://img.pdfslide.us/doc/110x75/55cf8e9c550346703b93e016/guitarvnmanha-de-carnavalnguyen-the-anpdf.jpg)