Embed Size (px)
Citation preview

Developing a “Probabilistic Sampling Toolkit” to supplement judgmental sampling approaches
used during initial assessment sampling following a terrorism incident
M. Gillen1, W. K. Sieber1, J.S. Bennett1, S. Shulman1,L. Sego2, B.Matzke2, B. Pulsipher2, J. Wilson2
1National Institute for Occupational Safety and Health, Cincinnati, Ohio
2Pacific Northwest National Laboratory, Richland, Wash.

Presentation Overview• Background and scenarios• Approach – Incorporating judgmental sampling
into a probabilistic sample plan • Using software to aid field investigator• Status and Future Plans • Secondary benefits?
Goal: Provide orientation about ongoing project(Minimal discussion of statistics)

Background – 2001 Investigations
Oct 12: New York City
Oct 15: Washington, DC
Oct 17: Trenton, NJ
Oct 5: Palm Beach County
Nov 16: Hartford CT
Nov 4: Kansas City, MO
NIOSH investigators successfully used professional judgment to quickly identify the presence of Bacillus anthracis contamination during the 2001 bioterrorism incidents

Background – NIOSH role in initial responseInputs for targeted sampling strategy during initial response
Incident details
Epidemiological findings
IH expertise

Sampling Location Number of Number andSamples Proportion Positive
Mail sorting devices 435 151 (34.7%)Other postal machines 288 59 (20.5%)Office furniture 49 20 (40.8%)Office equipment 32 8 (25.0%)Ventilation system 26 10 (38.5%)Windows 24 11 (45.8%)Mailbag/pouch/box 16 13 (81.3%)Wall/wall boxes 14 2 (14.3%)Floor 5 2 (40.0%) * Surface samples taken by NIOSH investigators
Anthrax Environmental Sampling Results By Location at Postal Processing and Distribution Facilities*

Bioterrorism Scenarios -- Three major types 1: Discovery of physical evidence (e.g. suspicious
package)
2: Report of medical symptoms or illness with suspicion that it is not due to a natural outbreak
3: Detection of agent by an environmental sampling surveillance system (e.g. BioWatch or BDS)

Pros–Rapid response–Efficient when limited lab capability for
analysis of samples–Allows general inferences (but non-statistical)
Cons–Dependent on availability and quality of
incident details–Does not allow statistical inferences
Judgmental (or targeted) sampling for initial assessment

Pros–Allows statistical inferences
Cons–Takes longer to implement–Requires large number of samples–Locations of interest not given any higher
chance of inclusion in sample plan
Random sampling (e.g. using systematic grid) for initial assessment

The ProblemWhat if incident details are lacking or uncertain?
If your judgmental results are negative, what confidence canyou then have that they truly correspond to an absence ofdetectable contamination?
Using probabilistic methods can supplement a judgmentalapproach and allow statistical inferences about thelikelihood of contamination being present

Other sampling challenges
Need limit of detection and collectionefficiency data
Validation studies still underwayNeed to use default values for statistical sampling
No lower limit or standard dictating publichealth response
Limited health-based criteriaBinary responses (positive or negative)

Government Accountability Office (GAO) Reports on Anthrax incidentsGAO review grew out of results related to Wallingford,Connecticut sampling
“…strategies that include probability sampling need to be developed inorder to provide statistical confidence in negative results. Further, even ifinformation on all the performance characteristics of methods is not yetavailable, a probability sampling strategy could be developed fromassumptions about the efficiency of some of the methods…This wouldenable agencies and the public to have greater confidence in negative testresults than was associated with the sampling strategy used in 2001.(p26)
Anthrax Detection: Agencies Need to Validate Sampling Activities In Order to Increase Confidence in Negative Results. GAO-05-251, March 31.2005

NIOSH developing Toolkit approach in response
TargetSamples
ProbabilisticSamples
Rapid and responsive when reliable details;
Does not quantify confidence
Provides Quantifiable confidence;Requires more time and samples;
Combined approach
for greater efficiency
andconfidence
Develop as suite of tools to assist investigator in the field

Use Bayesian statistics to combine Judgmental and Probabilistic approaches
“Unlike conventional statistical methods applied to exposure data,Bayesian statistical techniques can be adapted to explicitly take intoaccount professional judgment or other sources of information”[Hewett et al, 2006]
Bayesian approaches allow the user to include some prior knowledge aboutthe chances that the judgment samples will come back contaminated , andabout the relative chances that judgment samples are contaminated relativeto non-judgment samples.
In addition to the judgment samples, how many probabilistic samples (allnegative) are needed to obtain a given level of confidence of no detectablecontamination? (or a specified level of cleanliness)

Use software support for probabilistic sampling
Using Visual Sample Plandeveloped by Pacific Northwest National Lab (PNNL) withSponsorship from DHS, DOE, EPA, DoD, UK, CDC
Planning Software designed for the Non-Statistician Visual, Graphical, DQO (Data Quality Objective) basedIn public domain – Free VSP Download at http://dqo.pnl.gov/vsp

Visual Sample Plan features • Performs Statistical and Graphical
Tests of Distribution Assumptions. Designs/Displays Sampling Schemes
• Allows Quick Tradeoff or “What-if”evaluations to see the effect of changing requirements
• Visual Features with Sampling Locations Displayed on Maps
Area 5

Visual Sample Plan features • Both Normal and Non-Normal Distribution Methods • Automatic Report Generator • Technical support system via online help, user’s manual,
technical basis documents, training • Input building plans as as AutoCAD or ArcView GIS files
(also contains a drawing feature)
About > 5000 VSP users world-wide – being used
to focus on Buildings/Rooms, Surfaces, Sediment/Soil
Layers, Unexploded Ordinance contamination

Overview of approach Assess Incident detailsDevelop Judgmental sampling planPerform sampling
If results negative – have probabilistic optionInputs include judgmental results, other inputsGenerate probabilistic sample plan options
Proceed with probabilistic sampling

Judgmental/targeted sampling steps
1 Evaluate circumstances of event via interview and observation
2 Identify all plausible contamination pathways (e.g. process, foot traffic, air movement, maintenance or other pathways)
3 Develop a sampling plan to target locations for each plausible pathway that are “most likely to be contaminated”
4 Classify overall site into one of 4 zones5 Collect surface samples

Classifying contamination zones using judgmental approach
Zone 1: Definitely contaminated(e.g. the immediate location where evidence was found to be positive)
Zone 2: High Likelihood of contamination(e.g. initial assessment suggests location is part of plausible pathway)
Zone 3: Low likelihood of contamination(e.g. borders a zone 2 location)
Zone 4: Unlikely to be contaminated(e.g. not contiguous or linked to areas bordering zone 2 location )

Estimating overall confidence in judgmental sampling plan
Incident detail information
Not knownNot RecoveredLOW
Not knownRecoveredMEDIUM
Both are knownRecoveredHIGH
Contamination path and timeframe?
Contamination vehicle? (e.g. letter or device)
Pre-sampling confidence and expectations

Judgmental outputs are used as inputs for combined “Toolkit” approachEXAMPLE-Discovery of physical evidence (Scenario 1) with positive on evidence. -Question you want to answer: Is contamination present in other
locations? (Zone 2 or 3 locations)
STEPS• Judgmental samples are collected ---found to be “negative”• Decision made to supplement with probabilistic sampling• Location site plans are loaded into Visual Sample Plan (VSP) software
on laptop• Judgmental results and locations are entered into VSP plan • VSP overlays surface sample sized grid (100 cm2) over floor plan

Toolkit approach cont.Software walks investigator through a series of questionsbased on
Level of confidence in incident details and judgmental plan (forinformative prior distribution)Specify how much more likely contamination is in the judgment area samples than in the non-judgment area samplesUser must specify the level of cleanliness required Desired statistical design objectives for probabilistic plan (e.g. 90 vs 95% confidence)
Investigator can review options prior to deciding on design
VSP then randomly selects locations and number of samplesneeded and facilitates “gridding out” the location
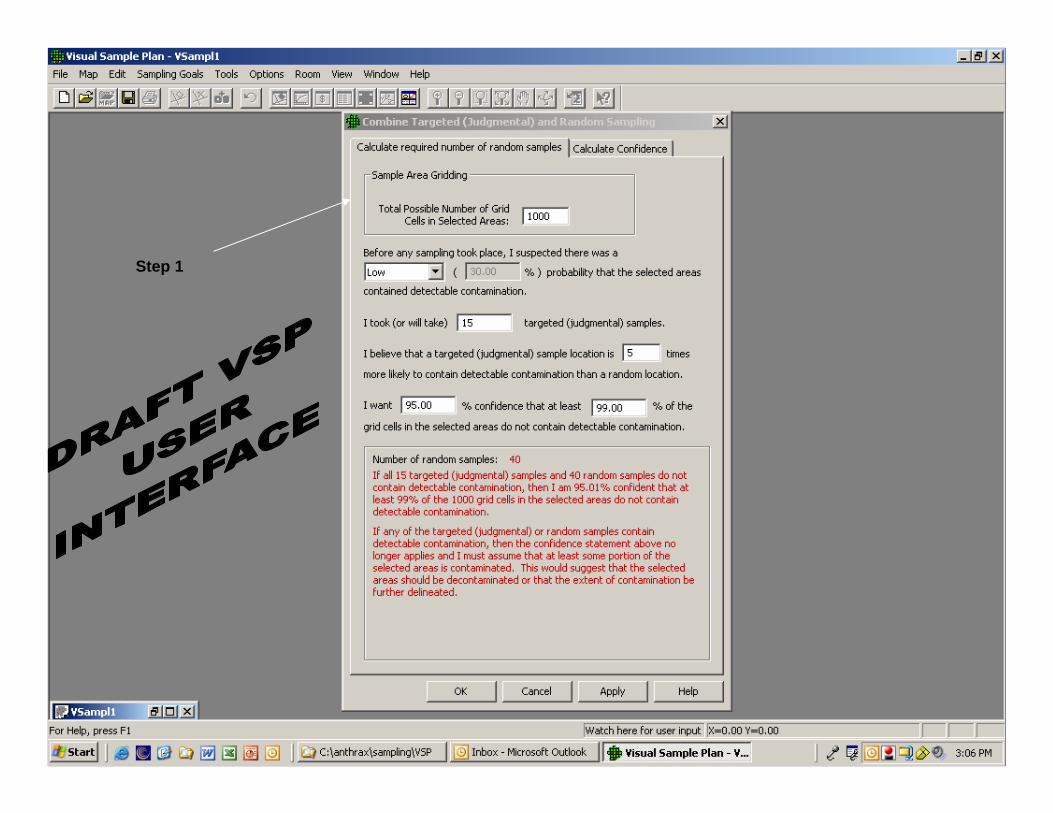
Step 1

Application concept (8x8x8 ft office example)
Prior to sampling,the chances that all judgment samples will be negative is 70%
Judgment sample locations are 3times more likely to be contaminated than random locations
25 negative judgment samples
50 negative random samples required
95% Confident that at least 99%of the surface area in the office does not contain detectable contamination
Prior Information + Data = Statistical Inference (using Bayesian Posterior distribution)
Information from Prior Assumptions & Negative Judgment samples is used reduce the number of random samples required to obtain the desired confidence
Parameters controlled by the investigator are highlighted in yellow

Scenario 1 example
Scenario 1:• Contaminated letter delivered to mail station• Letter carried to desk and opened there• Suspicious dust falls out • Dust noticed right away• 2 co-workers and guard visit to help

Contaminated Letter Opened
Mai
l R
ecei
ved
Scenario 1: Zones of Contamination
Confirmed Contamination
PossibleContamination
Potential Contamination
Zone 1 (Confirmed Contamination)
Zone 2 (PossibleContamination)
Zone 3 (Potential Contamination)

Scenario 1: Judgmental Samples for adjacent Zone 2 room
suspicious spot on wall
computer monitor
ventbelow vent
doorway
light switch
wall
wall
wall wallfloor ceiling

Scenario 1: Probabilistic Samples• 20 judgmental samples taken
•All judgmental samples negative
•Judgment samples are considered 5 times more likely to show contamination than probabilistic samples
95% confidence that 99% of unsampled area of room will give negative samples
56 probabilistic samples (all negative) needed

Future Work• Software implementation • Evaluation of approach using simulations and
field exercise• Develop enhancements to account for
furniture and surfaces within a room• Guidance document for field use
Thanks to NIOSH and PNNL colleagues for input and suggestions!

Secondary benefits?• EPA and others can develop further for
application to characterization and clearance sampling
• Use for related surface sampling scenarios – e.g. PCBs, lead ?
• Increasing interest in use of Bayesian methods for other aspects of IH practice ?
• Increasing use of software tools?

Questions?Statistical questions?
Karl Sieber – lead NIOSH statistical contact• 513.841.4231 [email protected]
Brent Pulsipher – lead PNNL contact at • 509-375-3989 [email protected]
VSP info at http://dqo.pnl.gov/vsp/
The findings and conclusions in this presentation have not been formally disseminated by the National Institute for Occupational Safety and Health and should not be construed to represent any agency determination or policy.

References
GAO Report at http://www.gao.gov/cgi-bin/getrpt?GAO-05-251Anthrax Detection: Agencies Need to Validate Sampling Activities In Order to IncreaseConfidence in Negative Results. GAO-05-251, March 31.2005
Hewett, P, Logan P, Mulhausen J, Ramachandran G: Rating Exposure Control Using Bayesian Decision Analysis. JOEH, 3:568-581
Wilson A, Wilson G, Olwell D (editors): Statistical Methods in Counterterrorism: GameTheory, Syndromic Surveillance, and Biometric Authentication. Springer Science andBusiness Media, New York (2006).
Leidel NA, Busch KA, Lynch JR: Occupational Exposure Sampling Strategy Manual.Publication 77-173, U.S. National Institute for Occupational Safety and Health,Cincinnati, Ohio (1977).
Hassig, NL, JE Wilson, RO Gilbert, BA Pulsipher, LL Nuffer, 2005 “Visual Sample Plan Version4.0 User's Guide.” PNNL-15247. Pacific Northwest National Laboratory, Richland, Washington..
![[3989] – 102 - Savitribai Phule Pune University, One of ... · [3989] – 102 P.G.D.C.M. (Semester – I) Examination, ... Columns property of listbox. 2) ... Write a code which](https://img.pdfslide.us/doc/110x75/5ba297ff09d3f221368c3f75/3989-102-savitribai-phule-pune-university-one-of-3989-102.jpg)