Embed Size (px)
Citation preview

An-Najah National University
Faculty of Graduate Studies
Developing A Business Performance Management Model For
Paltel Group - Palestine
By
Ahmad Hasan Maharma
Supervisor
Dr. Yahya Saleh
This Thesis is Submitted in Partial Fulfillment of the Requirements for
the Degree of Master in Engineering Management, Faculty of
Graduate Studies, An-Najah National University, Nablus-Palestine
2014

iii
Acknowledgement
First and foremost I offer my sincere gratitude to my supervisor, Dr. Yahya
Saleh, who has supported me throughout my thesis with his patience and
knowledge. I attribute the level of my Master degree to his encouragement
and without him this thesis would not have been completed or written.
I would like to thank the thesis examiner committee members: Dr. Yahya
Saleh, Dr. Abdelbaset Rabaiah, and Dr. Sameh Atout, for their time,
insightful comments, and valuable questions which highly contribute thesis
quality.
Also, I would like to thank the faculty at An-Najah National University in
general and department of Engineering Management in specific for the full
support and facilities I have needed to produce and complete my thesis. My
greatest appreciation goes to Paltel Group for the outstanding support and
amenities to accomplish this research.
The success of this study required the help of various individuals. Without
them, the researcher might not be able to meet their objectives in this study.
The researcher want to give gratitude to the following people for their
invaluable help and support, my father and mother, brothers Mohammad,
Khaled, Belal, my sisters, and my friends. I gratefully acknowledge Mais as
she inspires me and bright my world.
Most importantly, thank Almighty God for granting me the wisdom, health
and strength to undertake this research task and enabling me to complete it.
Respectfully,
Ahmad Maharma
iv
الإقرار
:مقدم الرسالة التي تحمل العنوانأنا الموقع أدناه
Developing A Business Performance Management Model
For Paltel Group - Palestine
.
Declaration
The work provided in this thesis, unless otherwise referenced, is the
researcher’s own work, and has not been submitted elsewhere for any
other degree or qualification.
Student Name: ............................................................................ :اسم الطالب
Signature: ......................................................................................... :التوقيع
Date: ................................................................................................. :التاريخ

v
Table of Contents
No. Content Page
Acknowledgement iii
Declaration iv
List of Tables vi
List of Figures viii
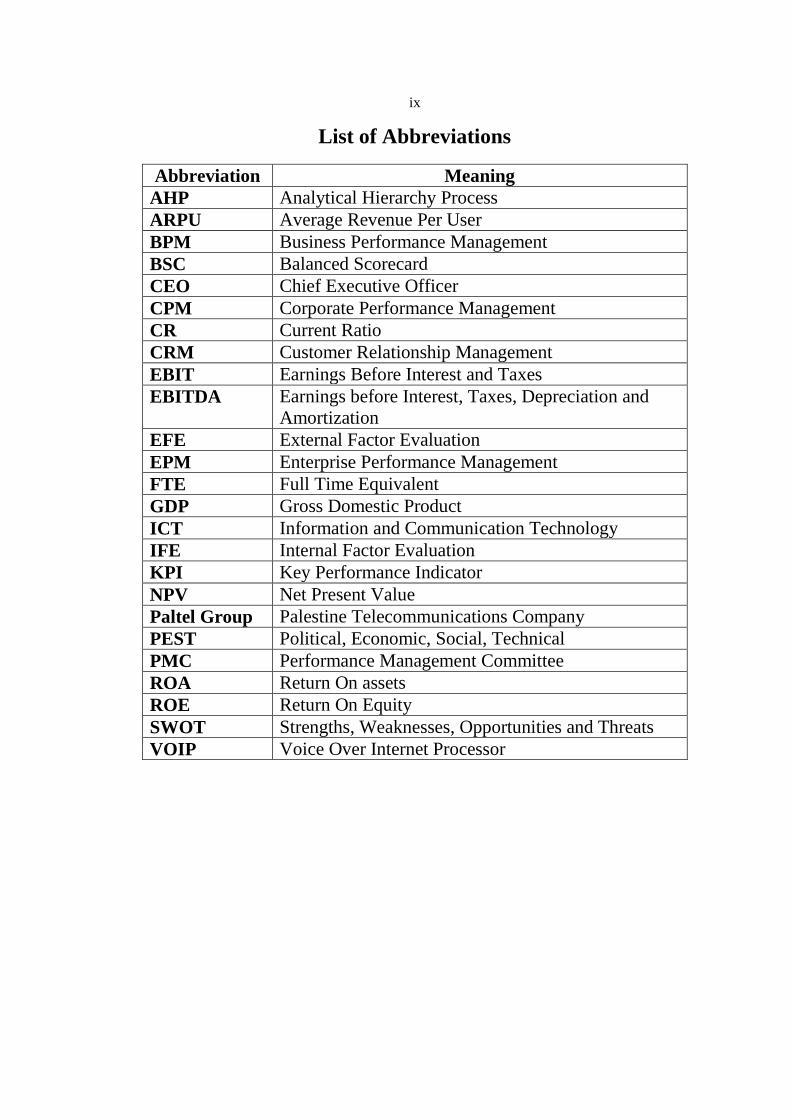
List of Abbreviations ix
Abstract x
Chapter 1: Introduction 1
1.1 Overview 1
1.2 Paltel Group 3
1.3 Problem Statement 4
1.4 Research Objectives 5
1.5 Research Limitations 6
1.6 Research Impact 6
1.7 Research Assumptions 7
1.8 Thesis Structure 9
Chapter 2: Literature Review 11
2.1 Telecommunication 11
2.2 Defining Performance 12
2.3 Performance Management 12
2.4 Business Performance Management 13
2.5 Advantages and Disadvantages of BPM 15
2.6 Performance Measurement 18
2.7 Performance Measurement Systems in Practice 22
2.8 The Analytic Hierarchy Process and its Foundation 27
Chapter 3: Strategy Formulation 37
3.1 Paltel Group Current Situation 37
3.2 Current Performance Management in Paltel Group 40
3.3 Strategic Analysis for External and Internal Factors 41
3.3.1 External Environment 41
3.3.2 Internal Environment 49
3.4 Paltel Group Strategy Formulation 63
Chapter 4: Balance Scorecard and Strategy Mapping 69
4.1 Balance Scorecard 69
4.2 Balance Scorecard in Paltel Group 70
4.2.1 Finance Perspective 72
4.2.2 Customer Perspective 75
4.2.3 Internal Process Perspective 77
vi
4.2.4 Learning and Growth Perspective 80
4.3 Strategy Mapping 86
4.3.1 Principles of Strategy Map 87
4.3.2 Design Strategy Map 89
Chapter 5: Methodology 92
5.1 Research Methodology 92
5.1.1 Data Collection 92
5.1.2 Data Analysis 94
5.2 AHP Implementation 95
5.3 Business Performance Management Dashboard 112
Chapter 6: Corrective Actions and Conclusion 115
6.1 Corrective Actions 115
6.2 Conclusion 116
6.3 Suggestion for Future Research 119
References 121
Appendices 125
ب الملخص
vii
List of Tables
Table Description Page
(2-1) AHP Fundamental Scale 35
(3-1) External Factors Evaluation (EFE) Matrix 49
(3-2) Consolidated Revenue, EBITDA, EPIT and Net
Income
50
(3-3) Consolidated Total assets, Total Liabilities and
Shareholder’s Equity
58
(3-4) Consolidated Cash Flow 60
(3-5) Internal Factor Evaluation (IFE) Matrix 63
(3-6) The Strengths-Weaknesses-Opportunities-
Threats (SWOT) Matrix for Paltel Group
65
(4-1) Proposed BSC for Paltel Group 84
(5-1) BSC Perspectives and KPI’s 96
(5-2) Scale for pairwise comparisons 99
(5-3) Pairwise Comparisons Example 100
(5-4) Consolidated Pairwise Comparison for Balance
Scorecard
101
(5-5) Consolidated Pairwise Comparison for
Financial Perspective KPI’s
102
(5-6) Consolidated Pairwise Comparison for
customer Perspective KPI’s
102
(5-7) Consolidated Pairwise Comparison for Internal
Process Perspective KPI’s
103
(5-8) Consolidated Pairwise Comparison for
Learning and Growth Perspective KPI’s
103
(5-9) Consolidated Eigenvalue Balance scorecard 105
(5-10) Consolidated Eigenvalue Finance Perspective 106
(5-11) Consolidated Eigenvalue Customer Perspective 106
(5-12) Consolidated Eigenvalue Internal Process
Perspective
106
(5-13) Consolidated Eigenvalue Learning and Growth
Perspective
107
(5-14) Random Consistency Index 109
(5-15) Consistency Ratio Balance Scorecard and
Perspectives
110
(5-16) Priorities BSC Perspectives and KPI’s Based on
AHP
111
(5-17) Business Performance Management Dashboard
for Paltel Group
114

viii
List of Figures
Figure Description Page
(2-1) Business Performance Management
Framework
17
(2-2) The Balance Scorecard 25
(2-3) AHP hierarchy Levels 32
(3-1) External Environment assessment 42
(3-2) Consolidated Revenue, EBITDA, EPIT and
Net Income
56
(3-3) Consolidated Total assets, Total Liabilities and
Shareholder’s Equity
59
(4-1) Paltel Group Proposed Strategy Map 91
(5-1) AHP levels for Paltel Group 98
ix
List of Abbreviations
Abbreviation Meaning
AHP Analytical Hierarchy Process
ARPU Average Revenue Per User
BPM Business Performance Management
BSC Balanced Scorecard
CEO Chief Executive Officer
CPM Corporate Performance Management
CR Current Ratio
CRM Customer Relationship Management
EBIT Earnings Before Interest and Taxes
EBITDA Earnings before Interest, Taxes, Depreciation and
Amortization
EFE External Factor Evaluation
EPM Enterprise Performance Management
FTE Full Time Equivalent
GDP Gross Domestic Product
ICT Information and Communication Technology
IFE Internal Factor Evaluation
KPI Key Performance Indicator
NPV Net Present Value
Paltel Group Palestine Telecommunications Company
PEST Political, Economic, Social, Technical
PMC Performance Management Committee
ROA Return On assets
ROE Return On Equity
SWOT Strengths, Weaknesses, Opportunities and Threats
VOIP Voice Over Internet Processor

x
Developing A Business Performance Management Model
For Paltel Group - Palestine
By
Ahmad Hasan Maharma
Supervisor
Dr. Yahya Saleh
Abstract
Dynamic environment of telecommunication industry, high-level of
competition and increased customers' expectations have made necessity of
getting awareness of attaining a comprehensive performance management
model, confident, trustable and flexible.
Business Performance Management (BPM) is an incredible method as it
helps organizations to plan, monitor, analyze, and manage business more
effectively by providing a comprehensive view for enterprise.
This research contributes to providing decision makers with a systematic
approach for establishing a visual strategy map with a consideration of the
involved causal relationships among Key Performance Indicators (KPI’s).
Performance Management Committee (PMC) from Paltel Group in
cooperation with the researchers reviewed and formulated Paltel Group
strategy to identify business strategy and construct Balance Scorecard
(BSC), also, build strategy map to measure financial and non-financial
indicators.
A proposed framework in this research would be a useful and valuable
reference to measure actual performance against target values, and

xi
facilitate review and divide results to understand the post actions taken
resulting in the current position.
This research proposes a model based on the Analytical Hierarchy Process
(AHP) and BSC for evaluating the performance of Paltel Group. The
analytic hierarchy is structured by the four major perspectives of the BSC
including financial, customer, internal process, and learning and growth,
followed by performance indicators.

1
Chapter 1
Introduction
1.1 Overview.
Business performance management (BPM) is a set of management and
analytic processes, supported by technology, that enable businesses to
define strategic goals, manage and measure performance towards
achievement of those goals. Core BPM processes include financial and
operational planning, consolidation and reporting, business modeling,
analysis, and monitoring of key performance indicators (KPI’s) linked to
strategy. BPM include strategic planning, budgeting, forecasting, reporting,
modeling, scenario planning, profitability analysis, KPI’s monitoring, and
consolidation. Both operational and financial performances are addressed
by BPM to include the process of collecting the data and performing
analysis and reporting in a collaborative way for executives, managers, and
staff across all management levels of the organization. (Business
Performance Management, Meets Business Intelligence July, 2005).
BPM is primarily practiced by the Chief Executive Officer (CEO), Chief
Financial Officer (CFO), and other senior executives and managers in the
organization. This part of performance management is about setting
strategic objectives for the various entities that make up an organization
(business units, departments, and product lines), measuring the entities
against objectives and targets, reporting results, and using information to
2
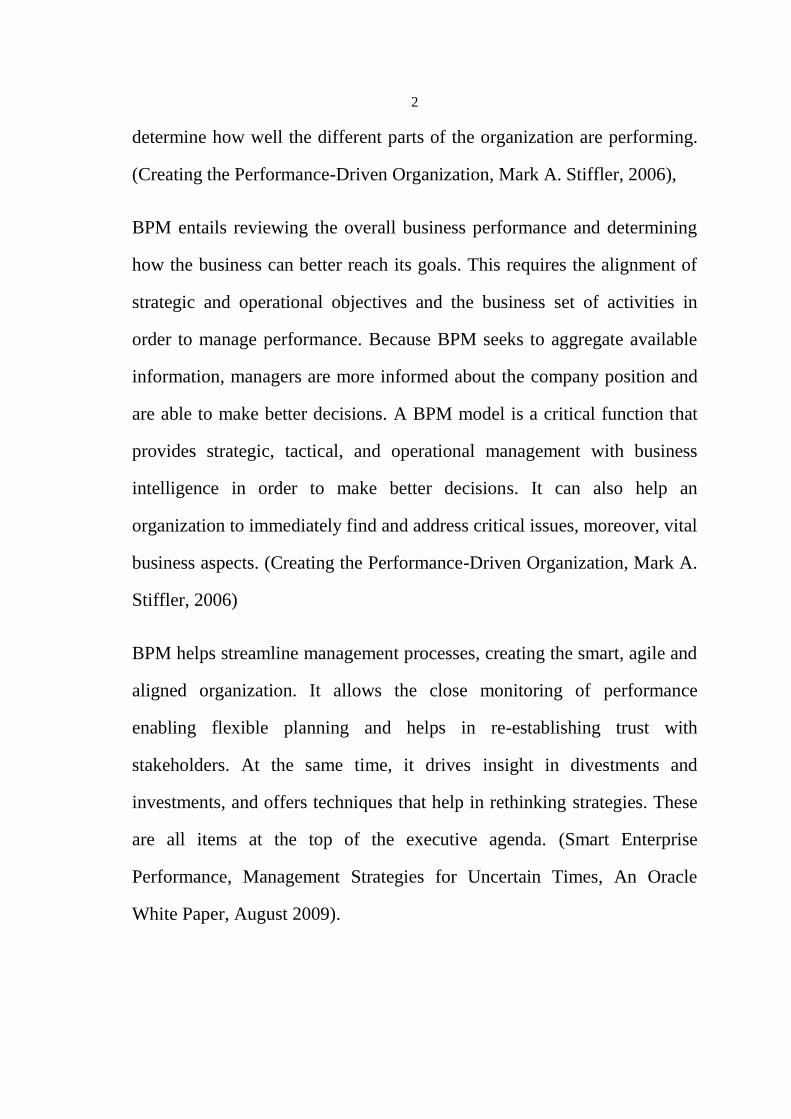
determine how well the different parts of the organization are performing.
(Creating the Performance-Driven Organization, Mark A. Stiffler, 2006),
BPM entails reviewing the overall business performance and determining
how the business can better reach its goals. This requires the alignment of
strategic and operational objectives and the business set of activities in
order to manage performance. Because BPM seeks to aggregate available
information, managers are more informed about the company position and
are able to make better decisions. A BPM model is a critical function that
provides strategic, tactical, and operational management with business
intelligence in order to make better decisions. It can also help an
organization to immediately find and address critical issues, moreover, vital
business aspects. (Creating the Performance-Driven Organization, Mark A.
Stiffler, 2006)
BPM helps streamline management processes, creating the smart, agile and
aligned organization. It allows the close monitoring of performance
enabling flexible planning and helps in re-establishing trust with
stakeholders. At the same time, it drives insight in divestments and
investments, and offers techniques that help in rethinking strategies. These
are all items at the top of the executive agenda. (Smart Enterprise
Performance, Management Strategies for Uncertain Times, An Oracle
White Paper, August 2009).
3
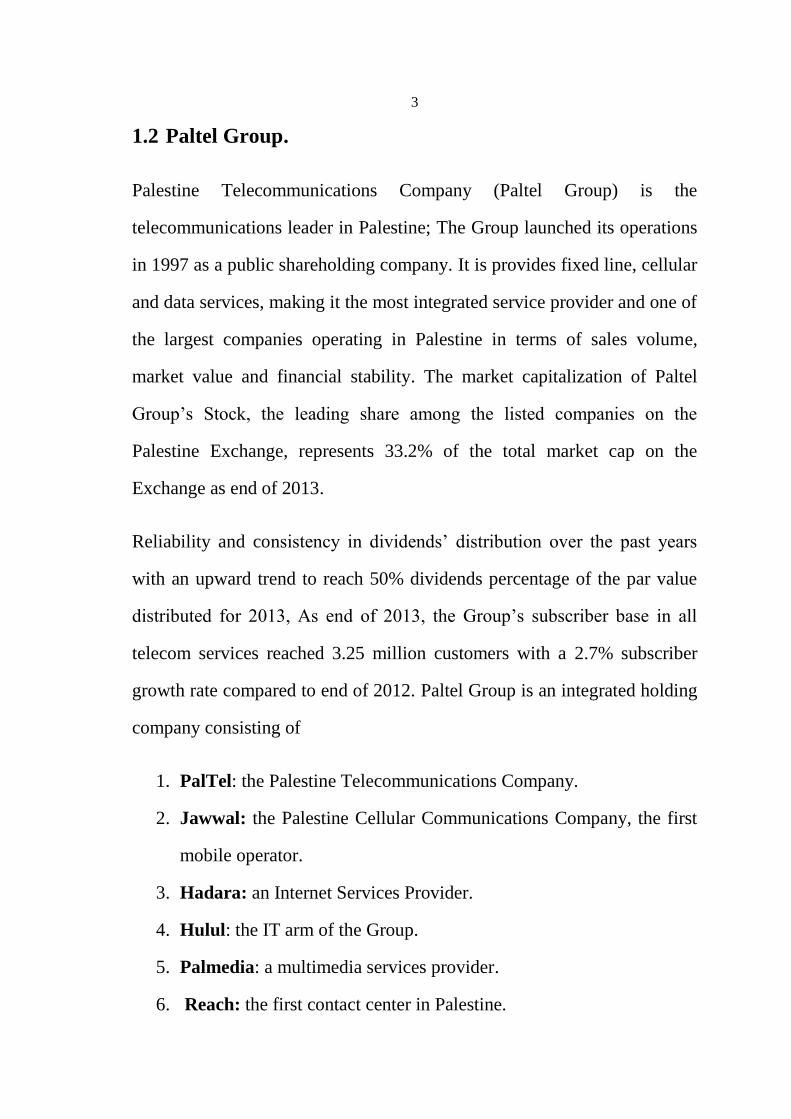
1.2 Paltel Group.
Palestine Telecommunications Company (Paltel Group) is the
telecommunications leader in Palestine; The Group launched its operations
in 1997 as a public shareholding company. It is provides fixed line, cellular
and data services, making it the most integrated service provider and one of
the largest companies operating in Palestine in terms of sales volume,
market value and financial stability. The market capitalization of Paltel
Group’s Stock, the leading share among the listed companies on the
Palestine Exchange, represents 33.2% of the total market cap on the
Exchange as end of 2013.
Reliability and consistency in dividends’ distribution over the past years
with an upward trend to reach 50% dividends percentage of the par value
distributed for 2013, As end of 2013, the Group’s subscriber base in all
telecom services reached 3.25 million customers with a 2.7% subscriber
growth rate compared to end of 2012. Paltel Group is an integrated holding
company consisting of
1. PalTel: the Palestine Telecommunications Company.
2. Jawwal: the Palestine Cellular Communications Company, the first
mobile operator.
3. Hadara: an Internet Services Provider.
4. Hulul: the IT arm of the Group.
5. Palmedia: a multimedia services provider.
6. Reach: the first contact center in Palestine.

4
Since day one of operation, the company’s mobile operator unit; Jawwal,
faced fierce competition from 4 large scale Israeli mobile operators. The
company was able to grow and further develop despite early competition,
gaining market recognition for operating in highly adverse conditions and
difficult business environment. As of March 2014, Jawwal has roughly
2.63 million subscribers; Paltel has 403,000 subscribers and 213,000 ADSL
subscribers. (PALTEL annual report, 2008-2013).
1.3 Problem Statement.
Over the last few decades, the telecommunication industry has proven itself
not only as an emerging economic sector but as a rapidly growing sector
with a huge chain of economic and social impact.
As a result, several telecommunications companies were introduced and
started to compete within this current market. Such competition presents
challenges that affect the business performance of the various
telecommunication industries.
The lack of strategic and communication mechanisms among the company
vertically and horizontally, excluding staff members from the decision-
making processes, poor coordination among business units and functional
groups, and an evident gap between strategy and execution, have put Paltel
Group under pressure from shareholders, stakeholders, executives, and
staff, to achieve standards of corporate governance.
5
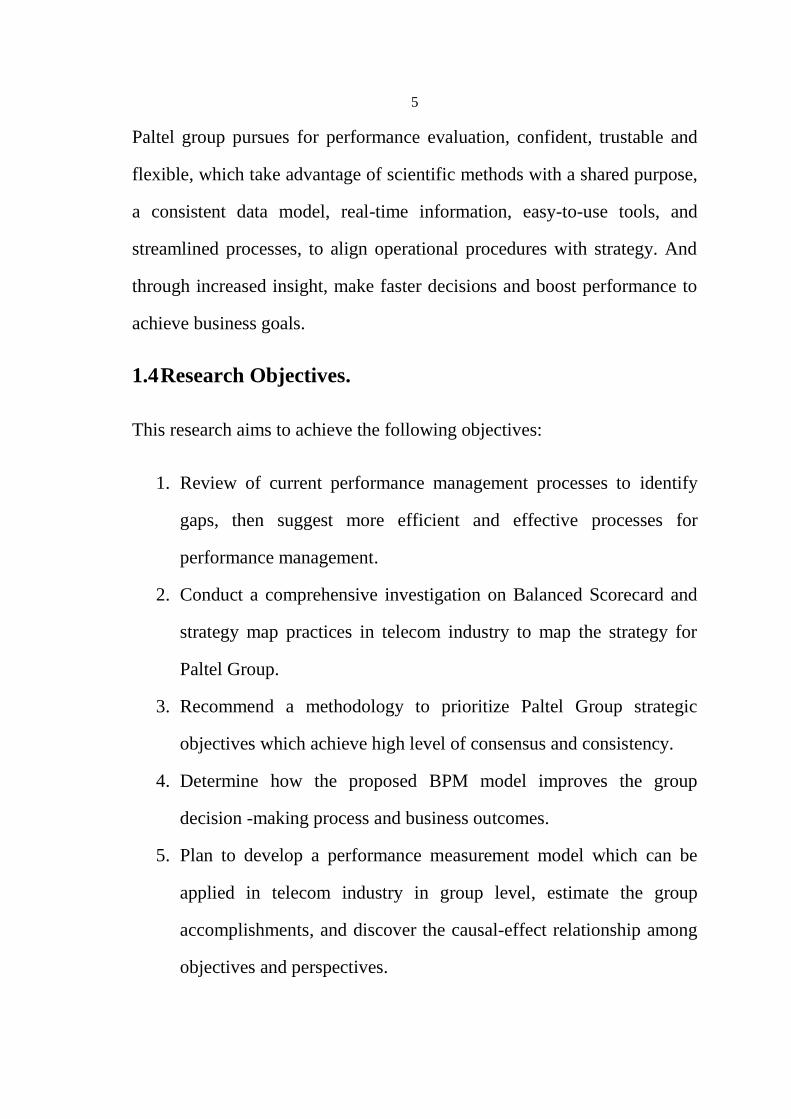
Paltel group pursues for performance evaluation, confident, trustable and
flexible, which take advantage of scientific methods with a shared purpose,
a consistent data model, real-time information, easy-to-use tools, and
streamlined processes, to align operational procedures with strategy. And
through increased insight, make faster decisions and boost performance to
achieve business goals.
1.4 Research Objectives.
This research aims to achieve the following objectives:
1. Review of current performance management processes to identify
gaps, then suggest more efficient and effective processes for
performance management.
2. Conduct a comprehensive investigation on Balanced Scorecard and
strategy map practices in telecom industry to map the strategy for
Paltel Group.
3. Recommend a methodology to prioritize Paltel Group strategic
objectives which achieve high level of consensus and consistency.
4. Determine how the proposed BPM model improves the group
decision -making process and business outcomes.
5. Plan to develop a performance measurement model which can be
applied in telecom industry in group level, estimate the group
accomplishments, and discover the causal-effect relationship among
objectives and perspectives.

6
1.5 Research Limitations.
The main limitations for this research can be summarized by the following
points:
Sample size: Statistical tests normally require a larger sample size to
ensure a fairly complete representation of a population.
Lack of available and/or reliable data: lack of data or of reliable data
will likely restrict this research.
Access: as the proposed research may contain confidential data, the
access is denied or otherwise limited. It will be complicated to gain data
from stakeholders, Paltel Group, or access to documents.
1.6 Research Impact.
This study will bridge the existing gaps between strategy and then
execution that impair achieving strategic goals, by having a structured
business performance model. This model is endeavoring to achieve the
following:
· Improved Communication by providing executives an effective
mechanism for communicating strategy and expectations to managers
and staff at all levels of the organization via planning models and
performance metrics joined to corporate goals and objectives.
· Improved Collaboration and exchange of ideas and information,
both vertically between levels within an organization and horizontally
among departments and groups which manage a shared activity.
7
· Improved Control by enabling staff to continuously adjust plans
and fix or improve operations in a timely manner by providing them with
up-to-date information about market conditions and the status of
operational processes.
· Improved Coordination among business units and functional
groups that otherwise might act as independent segments, conflicting
rather than sharing resources and information.
Furthermore, this research has contributed to providing decision makers
with a systematic approach for establishing a visual strategy map with a
consideration of the involved causal relationships among KPIs. The BSC
strategy map construction framework proposed in this research would be a
useful and valuable reference for other organizations, as BSC vary from
organization to organization. Strategic analysis is performed to create
logical links between the KPIs based on the content of the BSC evaluation
criteria that are most appropriate for telecom industry performance.
1.7 Research Assumptions.
In this research, we assume the following assumptions for the current
system:
The sum total of good individual performance does not produce high
organizational performance.

8
‘Best practice’ performance management systems do not tap into the
culture of the organization, and are often incompatible with the way
things are done.
Performance systems are very complicated, very technical, and are
not clear about how individual performance helps deliver corporate
goals.
Many ‘Performance Management’ systems focus on process and
form-filling, not on delivering results that drive the organizations
performance forward.
In accordance with the above, the proposed research must answer the
following questions:
What are the expected changes if a company implements business
performance management (BPM)?
How does BPM help organizations to align strategy with execution?
How to identify and document the strategic KPIs, which ultimately
determine the success of Paltel Group?
Does Balance scorecard proper method to align measure financial
and non-financial performance.

9
1.8 Thesis Structure.
The thesis is organized on follows:
Chapter One is an introduction to the thesis. This will in having a
background of the study, problem statement, research questions, objectives,
and limitations.
Chapter Two reviews literature of relevant studies to provide a theoretical
background for the research. The review presents and discusses issues on,
Business Performance Management, Telecommunication, strategy
management, and performance measurement models.
Chapter Three reviews Paltel Group vision, mission, challenges, analysis of
the current situation, analyzing internal and external factors to formulate
suitable strategies that drive Group’s to shield them as a market leader in
Palestine.
Chapter Four provides implementation for Balance Scorecard by describing
four perspectives, involved in Key Performance Indicators, and proposed
strategy map to link Paltel Group’s BSC to its strategy.
Chapter Five presents the application of the AHP method in ranking the
overall performance management and provides performance index for the
group.
Chapter Six covers the final reflections of this thesis. The final result of the
thesis analysis presented with respect to the data collected from the

10
company and proposed corrective actions. Also, conclusions and
recommendations included in this chapter.

11
Chapter 2
Literature Review
This chapter reviews literature of relevant studies to provide a theoretical
background for the research. The review presents and discusses issues on,
Business Performance Management, Telecommunication, strategy
management, and performance measurement models.
2.1 Telecommunication.
Telecommunication refers to the specific services that support the exchange
of information over significant distances by electronic means. It includes
the activities of providing telecommunications and related service activities
(i.e. transmitting voice, data, text, sound and video). The transmission
facilities that carry out these activities may be based on a single technology
or a combination of technologies (International Telecommunication Union,
2010).
The term telecommunications was first used for wired telephony. Today,
telecommunications are one of the most important contemporary
Information and Communication Technology (ICT). They include wired
and wireless telephony; different mobile services, such as cellular
telephones and paging; voice and data transmission; and Integrated
Services Digital Networks (ISDN), which provide a very high quality of
voice as well as high data communication rates.
12
2.2 Defining Performance.
Maila (2006) defined performance is the actual work that is done to ensure
that an organization achieves its mission. In summary, performance cover
inputs, conditions, processes elements, outputs, consequences and
feedback. According to Maila (2006), the end product of performance
should be measured against four elements which are: quantity, quality, cost
or risk factors and time. The idea of measuring the end product is fully
supported as it can be argued that a product can be in any form that is good
or bad, hence the need to have it measured.
While the researcher acknowledges the above definition, they argue that
application of the definitions should be treated with a provision that the
output of that action is positive to the organization.
2.3 Performance Management.
The aim of performance management is to achieve high performance by an
organization and its people. High performance means that the organization
reaches and exceeds its targets for productivity, quality, customer service,
growth, profits and shareholder value. In other words, it means to do the
superior share understanding about what is to be achieved, develop the
capacity of people to achieve it, provide the required support and guidance
to the people to help them to deliver high performance and achieve their
full potential to benefit themselves and the organization as well,
(Armstrong and Baron, 2005). Advanced performance management

13
systems are nowadays used as strategic weapons in order to achieve
competitive advantages, (Dressler, 2004).
The concept of performance management is still young and has emerged in
the last two decades (Sharif, 2002). Literature review showed that
traditional systems, based on transparent financial measures, cannot
integrate all factors that are affecting performance of enterprises and
organizations (Freeman and Beale, 1992). Performance management is just
part of a larger system of business improvement. For an effective system,
managers need a balanced set of performance indicators (Kaplan and
Norton, 2001). Performance indicators are compilations of information that
are used to measure and assess performance (Edwards and Thomas, 2005).
Moreover, they indicate the final mark of a company’s efficiency and
effectiveness. Key Performance Indicators (KPIs) represent the basis for
measuring business and project success. Their purpose is to enable the
measurement of performance within companies and the industry, and to
initiate benchmarking. Besides direct advantages, KPIs are used as means
of communication within stakeholders to inform them about constant
improvement endeavors (Vukomanovic et al., 2010).
2.4 Business Performance Management.
Business Performance Management (BPM), coincides with the concept of
Corporate Performance Management (CPM) and Enterprise Performance
Management (EPM). These concepts provide a system perspective for

14
optimizing the execution of business strategy, (Ballard, White, McDonald,
Myllymaki, McDowell, Goerlich, and Neroda, 2005; Clark, Jones, and
Amstrong, 2007). The concept of BPM was introduced to business in the
1990s by information technology research firms and software vendors
(Cokins, 2009; Pritchard, 2008). BPM is misunderstood by many
companies as being a new category to describe multiple applications
including planning, budgeting, financial consolidation and reporting,
forecasting and scenario modeling, score carding or dashboards, business
intelligence, and key performance indicators (KPIs) reports. Eckerson
(2004) argues that BPM is a common strategic and technical framework
that pulls these applications together in a cohesive and concerted manner
with a view to drive the whole organization toward achievement of
strategic goals. Therefore, BPM is a much broader and bigger concept than
planning, budgeting, forecasting, reporting, score carding, or business
intelligence. These latter concepts are all tools underlying the business
performance management concept.
BPM defines and refines strategies, and manages them in order to enhance
performance. It bridges the gap between strategy and execution by means
of improved communication, collaboration, control, and coordination
(Eckerson, 2004; Ballard et al., 2005). BPM enables organizations to
enhance the capabilities of business intelligence systems for better
monitoring, measurement, and management of business performance
(Clark et al., 2007). Eckerson posits that BPM improves (1) communication
of strategy and expectations to all levels of the organization through

15
planning models and performance metrics that are tied to strategic goals,
(2) collaboration across organization through two‐way exchange of ideas
and information, (3) control to continuously adjust plans and improve
operations through dissemination of up‐to‐date information about market
conditions and operational processes, and (4) coordination among business
units and functional groups. Eckerson also suggests that BPM helps
organizations better exploit opportunities as well as detect and rectify
operational problems before they grow out of control.
2.5 Advantages and Disadvantages of BPM.
The following are main advantages and disadvantages of BPM. (Ballard et
al., 2005:24-25).
Advantages:
BPM gives the business the ability to reduce costs, increase revenue
and ultimately provides a competitive advantage.
Recognizes proactive monitoring, measuring and attaining
performance targets.
Creates the opportunity to improve and manage processes.
Business performance can compare, monitor and align business
strategies, goals and objectives when integration with business
intelligence is done.

16
Disadvantages.
A common threat is information availability for business
performance management.
Feed storage effect of decentralized information hubs within the
business.
Lack of transparency on enterprise level, only departmental or
functional area views are available.
Timely activities in aggregating information for higher levels within
the business.
To enhance the understanding of BPM, the framework will be exploded.
Figure (2-1) depicts the framework which covers the four phases.

17
Figure (2-1): Business Performance Management Framework
Source: Adapted from Frolick and Ariyachandra, (2006:43)
Strategize: defining the way to identify business strategy, the discovery of
key value drivers to accomplish strategy and create metrics to monitor the
performance, (Ariyachandra and Frolick, 2008:114). To be competitive,
one needs to stay competitive. This is accomplished to challenge the
boundaries of performance. To strategize, owners or executive
management of the business, review the past performance of the business
and decide on future intent or direction for the business. This is also
supported by a SWOT analysis.
Plan: defining a road map that is followed with specific projects, budgets
and activities to fulfill the strategy. Planning to build a bridge from the
current status of the business to the to-be state. If the goals were defined as
part of the strategy process, planning will include the formulation of
required key indicators to measure the progress towards the goals.
Identification of gaps on measuring points is normally done in this process.
Strategize
Plan
Monitor and Analysis
Take corrective
action
18
Monitor and analyze: actual performance against target values are
reviewed and divided to understand the post actions taken resulting in the
current position. Monitoring is continuously measuring how we are moving
towards the target. Think of the GPS in your car, continuously tracking
your move on the road, any deviations, you’ll get the word. The same with
businesses, progress need tracking and alerts to indicate to decision makers
the course taken is not delivering the required results or we are on track.
Take corrective actions: by understanding the status, modification with
identifiable reactions to re-align the actions to achieve the desired
performance levels. Adjusting the driving direction will result in reaching
your destination. Available information will give insight to what happened.
Part of corrective actions is also tracking the status of the action.
2.6 Performance Measurement .
To achieve desired performance goals in an organization, the ability to
measure this performance is so important (Harbour, 1997). Harbour (2009)
emphasizes the importance of performance measurement as “You can’t
understand, manage, or improve what you don’t measure”. According to
Harbour (1997) most companies collect performance measures, but many
of these companies rarely or never use these measures. The key in
performance measurement is to collect only those measures that can and
will actually be used. Furthermore, Harbour (1997) mentions it as “Don’t
measure what you can’t or won’t use”. The concept of performance
measurement, according to Franceschini (2007), is formulated as “you get
19
what you measure, and you cannot manage a system unless you measure
it”. Performance measures are tools to understand, manage and improve
organizations activities, (Franceschini et al., 2007).
There are different methods for the measuring business performance. The
first method is through objective (quantify) and subjective (judgmental)
methods, the second method is through criteria such as financial (e.g.
profit, sales) and operational (e.g. customer satisfaction, quality), and the
third one is through primary (from organization) and secondary (from
databases), (Venkatraman and Ramanujam, 1986; Sang, 2004). In objective
measurement, quantitative data (i.e. absolute performance data) is
measured while in subjective method what is measured is perceptive
opinions about performance according to the competitors or company
expectations (Dess and Robinson, 1984). The same performance criteria are
measured both objectively and subjectively. What matters is to determine
those criteria. Your criteria can be qualitative (e.g. customer satisfaction,
overall business performance) or quantitative (e.g. profit, sales).
The quantitative criteria are measured with an objective or subjective
measurement but the qualitative criteria can be measured subjectively
(Venkatraman and Ramanujam,1986).
The fact that the objective criteria in the financial statements of a business
can be defective, the lack of relevant objective data, and the difficulty in
reaching objective data to measure the performance of businesses make it
necessary to rely on subjective data obtained from the participators (Zehir

20
and Acar,2005). It is usually difficult to get information about objective
performance data because the companies generally do not wish to release
such information. In an effort to measure qualitative and quantitative
performance, a subjective measurement method is used by asking to what
extent the managers of businesses find their companies successful
compared with other businesses in the sector in the context of varied
performance criteria (Alpkan et al., 2005). Putting forward the view that
subjective (perceptive) measurement may change depending on the
different personality traits or various organizational position and such a
measurement would cause confusion and worries in drawing comparison
with competitors. (Lin et al, 2009).
Dess and Robinson (1984) indicated the relation between the objective and
subjective data about business performance, and showed that subjective
performance data (assets-return and sales growth) could be used in place of
objective data in cases where it is not possible to get relevant objective
performance data. Particularly, subjective business performance can be
fruitful in performance evaluation by making comparisons with similar
businesses in an industrial branch. However, Chakravarty (1986) showed
that a measurement of a business performance is not enough just by
examining financial indicators such as investment return, profitability and
productivity, that financial performance is short-term. Business
performance was measured in the study conducted by Singh (1986) both by
the personal evaluations of high level managers about business

21
performance (subjective) and by accounting-based criteria (objective).
After-tax total assets return was used as a criterion based on accounting.
There are seven reasons why performance measurement is used in the
management world: the changing nature of work; increasing competition;
specific improvement initiatives; national and international quality awards;
changing organizational roles; changing external demands; and the power
of information technology (Neely,1998). Other reasons –under the
umbrella of aligning business activities to the strategy of the organization
performance against strategic goals, are: increase focus on strategy and
results, measure what matters and improve performance, align strategy with
what human resource can do, improve communication, and put in priority
projects. (Maskel,1991) suggests that performance measurement systems
must have the following characteristics:
1) They are directly linked to overall business strategy and the
company’s critical success factors.
2) They combine both financial and non-financial measures.
3) They use different measurements for different areas of the company.
4) They are changed over time to reflect changes in strategy and
operation.
5) They are simple and easy to use.
6) They give fast feedback to operators and managers.
7) They are intended to teach rather than monitor and control.

22
8) They use benchmarking to set target characteristics of performance
measurement systems found in world class companies.
2.7 Performance Measurement Systems in Practice.
During the performance measurement revolution, many performance
measurement systems have been developed to overcome the weaknesses of
traditional performance measurements systems, according to Frigo and
Krumwiede (1999), survey data suggest that between 40 and 60 percent of
companies significantly changed their measurement systems between 1995
and 2000. In this research, we review five influential Performance
Management Systems: the Balanced Scorecard (Kaplan, Norton, 1992), the
Tableau de Bord (a French approach developed in the 1930s), the
Performance Prism (Neely, Adams, 2000), the Performance Pyramid
(Lynch, Cross, 1991), and the Productivity Measurement and Enhancement
System (Pritchard, 1990).
The Balanced Scorecard (BSC) .
The best known performance measurement system is undoubtedly the
balanced scorecard (BSC), developed by Kaplan and Norton (1992; 1996a;
1996b). Kaplan and Norton (1996b) define the BSC as “a multidimensional
framework for describing, implementing and managing strategy at all
levels of an enterprise by linking, through a logical structure, objectives,
initiatives, and measures to an organization’s strategy”. The BSC provides
an enterprise view of an organization’s overall performance: it
23
complements the traditional financial performance measures with key
performance indicators (KPIs). The four building blocks of the BSC are
financial perspective, customer perspective, internal processes, and
learning and growth.
Having these four perspectives in mind, managers can translate strategies
into specific measures that can monitor the overall impact of the strategy
on the enterprise. The four perspectives also help in avoiding focusing on
short-term financial results. If an enterprise execution was short term
biased, the BSC will show week performance in other perspectives such as
internal processes and/ or learning and growth perspective.
Kaplan and Norton (1992) outline the following advantages of following
the balanced scorecard approach:
1. Provides a comprehensive picture of the enterprise’s performance at a
glance. A single report includes multiple measures that are tied to
desired core competencies such as cycle time, return on investment
and customer satisfaction.
2. The balanced score card protects from local optimization. Since
managers can view all important aspects of the business, the tendency
of improving one area at the expense of the other is minimized.
Balancing the objective promotes positive improvement in processes,
e.g. improving set up times by reducing process set up rather than
increasing batch size. The balanced score card provides insight
24
whether an improvement is based on actual process improvement or
by reducing the performance of other processes.
3. Helps avoiding information overload by keeping only measures that
are tied to strategy.
At the center of the balanced scorecard is the enterprise vision and strategy.
Each perspective includes the following components:
1. Objectives: Niven (2005) describes objectives as the link between
measures and strategy. Describes what aspects and activities must be
performed well in order to execute strategy. Therefore, objectives are
more detailed than the vision and mission statements; however, they
are more abstract than specific measures and key performance
indicators (KPI)
2. Measures: Measures are the means to assess the execution of
objectives.
3. Targets: Targets are numerical values that represent the effectiveness
of achieving the specified objective.
4. Initiatives: Initiatives are strategic level programs that are introduced
to achieve the target objectives within the specified perspective.

25
Figure (2-2): The Balance Scorecard
Source: Adopted from Kaplan and Norton 1996
The Tableau de Bord (TdB).
The Tableau de Bord (TdB) has gained widespread acceptance throughout
the French business community. The TdB was introduced in France in the
1930s and was described as “being similar to a “dashboard” (i.e. the literal
translation of “tableau de bord”) used by “pilots” (i.e. managers) to guide
organizations to their destinations” (Bessire, Baker, 2004). It was first
developed by process engineers who were looking for ways to improve
their production process by better understanding cause-and-effect
relationships (the relationships between actions and process performance).
The same principle was then applied at the top management level, to give
senior managers a set of indicators allowing them to monitor the progress

26
of business, compare it to the goals that had been set, and take corrective
actions.
The Performance Prism (PPR).
The Performance Prism (PPR), developed by Neely and Adams (2000), is a
PMS organized around five distinct but linked perspectives of performance:
stakeholder satisfaction, strategies, processes, capabilities, and stakeholder
contributions.
Performance Pyramid System (PPS).
The Performance Pyramid System (PPS) was one of the first “new” PMSs,
developed by Lynch and Cross (1991) during the performance
measurement revolution. In short, it is an interrelated system of different
performance variables, which are controlled at different organizational
levels. Strategic objectives flow down through the organization with a
reverse flow of information flowing upwards. Lynch and Cross use a
pyramid-shaped “map” for understanding and defining the relevant
objectives and measures for each level of the business organization. The
four levels of the PPS embody the corporate vision, accountability of the
business units, competitive dimensions for business operating systems, and
specific operational criteria.

27
Productivity Measurement and Enhancement System (ProMES).
The productivity measurement and enhancement system (ProMES) was
originally developed by Pritchard (1990). ProMES is a participative
development method for performance management systems, designed to be
a practical method of measuring organizational productivity. In essence,
ProMES is a formal, step-by-step process that identifies organizational
objectives, develops a measurement system to assess how well the unit is
meeting those objectives, and develops a feedback system which gives unit
personnel and managers information on how well the unit is performing
(Pritchard et al., 2002).
2.8 The Analytic Hierarchy Process and its Foundation.
The Analytic Hierarchy Process (AHP) is a methodology for structuring,
measurement and synthesis. The AHP has been applied to a wide range of
problem situations: selecting among competing alternatives in a multi-
objective environment, the allocation of scarce resources, and forecasting.
Although it has wide applicability, the axiomatic foundation of the AHP
carefully delimits the scope of the problem environment (Saaty 1986). It is
based on the well-defined mathematical structure of consistent matrices and
their associated right-eigenvector's ability to generate true or approximate
weights, Mirkin (1979), Saaty (1980, 1994).
The prime use of the AHP is the resolution of choice problems in a multi-
criteria environment. In that mode, its methodology includes comparisons

28
of objectives and alternatives in a natural, pairwise manner. The AHP
converts individual preferences into ratio-scale weights that are combined
into linear additive weights for the associated alternatives. These resultant
weights are used to rank the alternatives and, thus, assist the decision
maker (DM) in making a choice or forecasting an outcome. The AHP
employs three commonly agreed to decision making steps: (1) Given i = 1,
…, m objectives, determine their respective weights wi, (2) For each
objective i, compare the j = 1, …, n alternatives and determine their
weights wij with respect to objective i, and (3) Determine the final (global)
alternative weights (priorities) Wj with respect to all the objectives by Wj =
w1jw1 + w2jw2 + … + wmjwm. The alternatives are then ordered by the Wj,
with the most preferred alternative having the largest Wj. The various
decision methodologies (AHP, Electre, Multi-Attribute Utility Theory) are
differentiated by the way they determine the objective and alternative
weights, as prescribed by each one’s axiomatic or rule-based structure. The
general validity of the AHP, and the confidence placed in its ability to
resolve multi-objective decision situations, is based on the many thousands
of diverse applications in which the AHP results were accepted and used by
the cognizant decision makers, Saaty (1994b).
It is our belief that the real essence of the AHP is not generally understood.
The AHP is more than just a methodology for choice situations. It is not
just another analysis tool. The best way we can explain the AHP is to
describe its three basic functions: (1) structuring complexity, (2) measuring
on a ratio scale, and (3) synthesizing. We also discuss some of the

29
controversy about the AHP that has appeared in the academic literature.
Saaty (1980) and Forman and Selly (1999).
In the late 1960’s, Thomas L. Saaty, an operational research pioneer, was
directing research projects for the Arms Control and Disarmament Agency
at the U.S. Department of State. Saaty's research agenda, and very
generous budget, enabled him to recruit some of the world’s leading game
and utility theorists and economists. In spite of the talents of the people
recruited (three members of the team, Gerard Debreu, John Harsanyi, and
Reinhard Selten, have since won the Nobel Prize), Saaty was disappointed
in the results of the team's efforts. Saaty (1996).
Years later, while teaching at the Wharton School, Saaty was still troubled
by the apparent lack of a practical systematic approach for priority setting
and decision making. He was thus motivated to develop a simple way to
help DMs to make complex decisions. The result was the Analytic
Hierarchy Process. There is sample evidence that the power and simplicity
of the AHP has led to its widespread usage throughout the world. In
addition to the popular Expert Choice software, there have been several
other commercial implementations of the AHP.
The American Society for Testing and Materials (ASTM) has adopted the
AHP as standard practice for multi-attribute decision analysis of
investments related to buildings and building systems (ASTM Designation
E: 1765-95 “Standard Practice for Applying Analytical Hierarchy Process
(AHP) to Multi-attribute Decision Analysis of Investments Related to
30
Buildings and Building Systems). It is used extensively in organizations
that have carefully investigated the AHP’s theoretical underpinnings, such
as the Central Intelligence Agency.
An understanding of the AHP’s three primary functions, structuring
complexity, measurement, and synthesis -- helps one to understand why the
AHP should be considered as a general methodology that can be applied to
a wide variety of applications.
Structuring Complexity
Saaty sought a simple way to deal with complexity. He found one common
theme in the way humans deal with complexity, that is, the hierarchical
structuring of complexity into homogeneous clusters of factors. Others
have also observed the importance of hierarchical structuring.
AHP is a multi-criteria decision method that uses hierarchical structures to
solve complicated, unstructured decision problems, especially in situations
where there are important qualitative aspects that must be considered in
conjunction with various measurable quantitative factors. Applications of
AHP include:
1. Developing a business performance evaluation system (Lee, Kwak, and
Han 1995).
2. Making strategic decision about equipment replacement (Oeltjenbruns,
Lolarik, and Schandi-Kirschner 1995)
31
3. Choosing manufacturing plant layout (Abdul-Hamid, Kochhar , and
Khan 1999).
4. Making management decision about continuous improvement processes
(Labib and Shah, 2001).
5. Determining key capabilities of a firm (Hafeez, Zahng, and Malak
2002).
6. Selecting next-generation manufacturing (Alvi and Labib 2003).
7. Developing a design strategy for a re-configurable manufacturing
system (Abide and Labib 2003).
AHP has been demonstrated as a powerful and useful method for assisting
managers with complicated and difficult decisions. AHP is founded on the
following set of axioms for deriving a scale from fundamental
measurements and for hierarchical composition (Saaty 1986).
Axiom 1: Reciprocal
If element A is x times more important than element B, then element B is
1/x times as important then elements A.
Axiom 2: Homogeneity
Only comparable elements are compared. Homogeneity is essential for
comparing similar things, as errors in judgment become large when
comparing widely disparate elements.
32
Axiom 3: Independence
The relative importance of elements at any level does not depend on what
elements are included at a lower level.
Axiom 4: Expectation
The hierarchy must be complete and include all the criteria and alternatives
in the subject being studied. No criteria and alternatives are left out and no
excess criteria and alternatives are included.
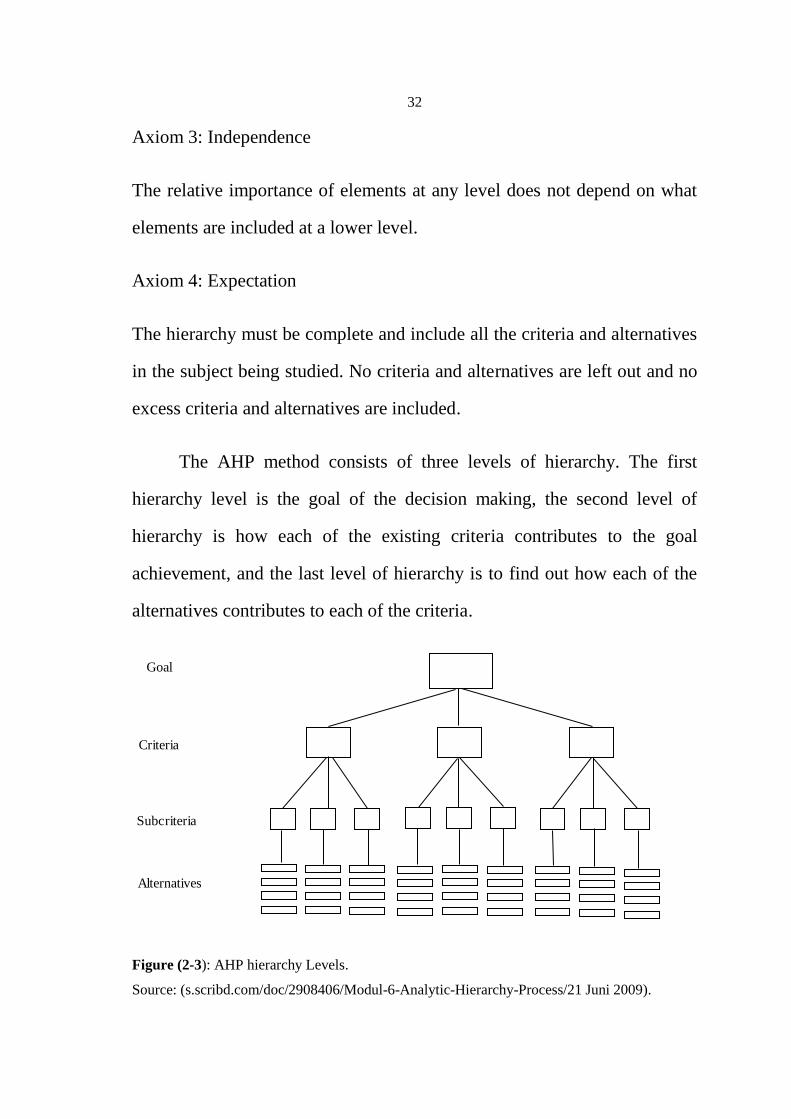
The AHP method consists of three levels of hierarchy. The first
hierarchy level is the goal of the decision making, the second level of
hierarchy is how each of the existing criteria contributes to the goal
achievement, and the last level of hierarchy is to find out how each of the
alternatives contributes to each of the criteria.
Figure (2-3): AHP hierarchy Levels.
Source: (s.scribd.com/doc/2908406/Modul-6-Analytic-Hierarchy-Process/21 Juni 2009).
Goal
Criteria
Subcriteria
Alternatives

33
Taylor (2002: 379) explains that the steps in decision making by using the
AHP method are as follows:
1) Establishing Pairwise Comparison Matrix for each decision alternative
to each criteria.
2) Synthesization.
3) Establishing Pairwise Comparison Matrix for each criteria.
4) Establishing the Normalized Matrix.
5) Establishing the Preference Vector.
6) Calculating overall value for each decision alternative
7) Determining the rank of alternatives according to the value acquired in
the previous step.
Measurement on a Ratio Scale
According to Stevens (1946), there are four scales of measurement. The
scales, ranging from lowest to highest in terms of properties, are nominal,
ordinal, interval, and ratio. Each scale has all of the properties (both
meaning and statistical) of the levels above, plus additional ones. For
example, a ratio measure has ratio, interval, ordinal and nominal properties.
An interval measure does not have ratio properties, but does have interval,
ordinal and nominal properties. Ratio measure is necessary to represent
proportion and is fundamental to physical measurement. This recognition,
34
plus a need to have a mathematically correct, axiomatic-based
methodology, caused Saaty to use paired comparisons of the hierarchical
factors to derive (rather than assign) ratio-scale measures that can be
interpreted as final ranking priorities (weights).
Any hierarchical-based methodology must use ratio-scale priorities for
elements above the lowest level of the hierarchy. This is necessary because
the priorities (or weights) of the elements at any level of the hierarchy are
determined by multiplying the priorities of the elements in that level by the
priorities of the parent element. Since the product of two interval-level
measures is mathematically meaningless, ratio scales are required for this
multiplication. Since, the AHP utilizes ratio scales for even the lowest
level of the hierarchy (the alternatives in a choice model), the resulting
priorities for alternatives in an AHP model will be ratio-scale measures.
This is particularly important if the priorities are to be used not only in
choice applications, but for other types of applications such as forecasting
and resource allocation.
The decision maker can express his preference between each pair of
elements verbally as equally important, moderately more important,
strongly more important, very strongly more important, and extremely
more important.
These descriptive preferences would then be translated into numerical
values 1,3,5,7,9 respectively with 2,4,6, and 8 as intermediate values for
comparisons between two successive qualitative judgments. Reciprocals of
35
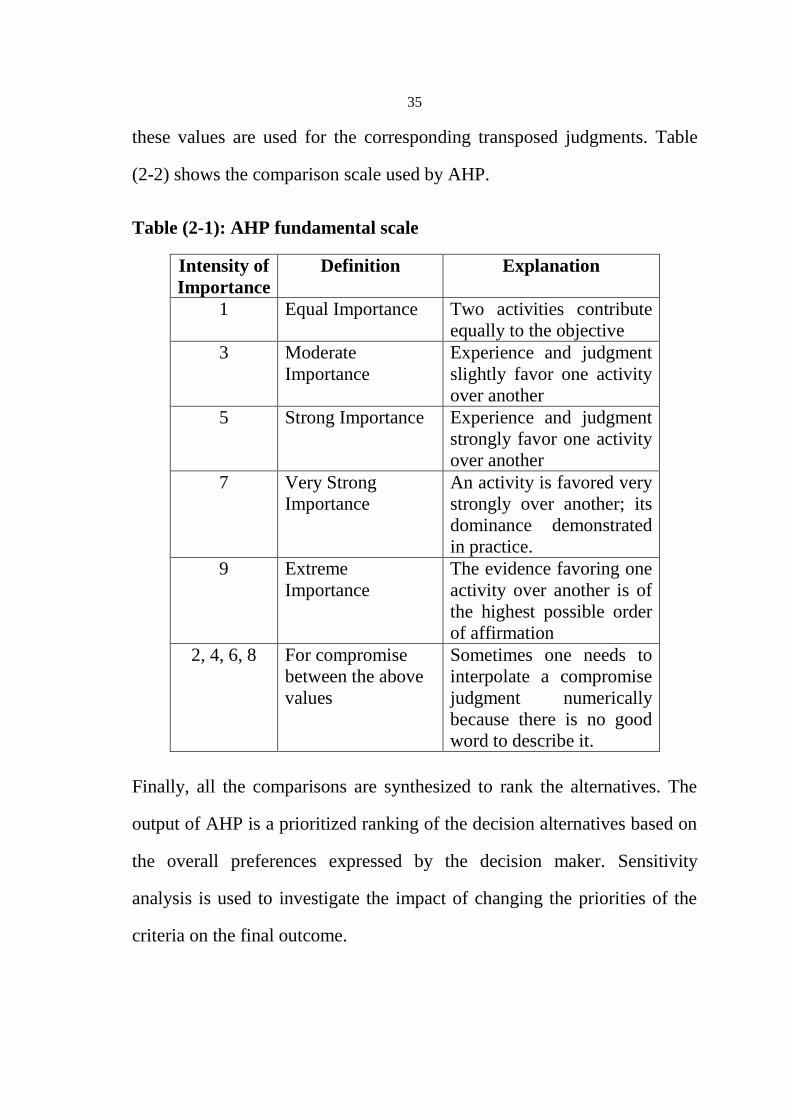
these values are used for the corresponding transposed judgments. Table
(2-2) shows the comparison scale used by AHP.
Table (2-1): AHP fundamental scale
Intensity of
Importance
Definition Explanation
1 Equal Importance Two activities contribute
equally to the objective
3 Moderate
Importance
Experience and judgment
slightly favor one activity
over another
5 Strong Importance Experience and judgment
strongly favor one activity
over another
7 Very Strong
Importance
An activity is favored very
strongly over another; its
dominance demonstrated
in practice.
9 Extreme
Importance
The evidence favoring one
activity over another is of
the highest possible order
of affirmation
2, 4, 6, 8 For compromise
between the above
values
Sometimes one needs to
interpolate a compromise
judgment numerically
because there is no good
word to describe it.
Finally, all the comparisons are synthesized to rank the alternatives. The
output of AHP is a prioritized ranking of the decision alternatives based on
the overall preferences expressed by the decision maker. Sensitivity
analysis is used to investigate the impact of changing the priorities of the
criteria on the final outcome.
36
Synthesis.
Analytic, the first word in AHP’s name, means separating a material or
abstract entity into its constituent elements. In contrast, synthesis involves
putting together or combining parts into a whole. Complex decisions or
forecasts or resource allocations often involve too many elements for humans
to synthesize intuitively. Needed is a way to synthesize over many
dimensions. Although the AHP’s hierarchical structure does facilitate
analysis, an equally important function is the AHP's ability to measure and
synthesize the multitude of factors in a hierarchy. We know of no other
methodology that facilitates synthesis as does the AHP.
Decision Making in Groups.
According to Taylor III (2002: 378), besides being able to be used for the
purpose of personal decision making, the AHP method can also be used or
group decision making. The first way to make group decision making is by
making consensually among the group members to acquire a single
agreement. The second way is by filling the questionnaire. The result of the
questionnaire is analysed by using the AHP method, and then the
Consistency Ratio is calculated in order to get the final result.

37
Chapter 3
Strategy Formulation
This chapter reviews Paltel Group vision, mission, challenges, analysis of
the current situation, analyzing internal and external factors to formulate
suitable strategies that drive Group’s to shield them as a market leader in
Palestine.
3.1 Paltel Group Current Situation.
Paltel Group started its operations in Palestine in 1997 with Paltel, the
public shareholding company. The group provides state of the art services
to the Palestinian end user. Its variety of services include: local and
international fixed telephony services, internet, data communications,
mobile services and next generation services. Paltel Group has proved
positive performance indicators all through its previous years of operation.
This reality has enabled the Group to implement its management plans and
operational guidelines in line with the best practices and industry trends
among its global peers, in an increasing competitive landscape such as the
Palestinian market. The accumulating positive operational results have
been accompanied by a significant reduction in operational expenses in
favor of an increase in operating profits and revenues. The consolidated net
revenues of Palestine Telecommunications Company (Paltel) have
increased by 2.6% to reach US$ 529 million during 2013 compared with
US$ 516 million the same period of last year. Additionally, gross profit
increased by 7.1% to reach US$ 428 million as end of 2013. Moreover, the

38
consolidated net profit reached US$ 129 million by the end of 2013
compared with US$ 116 million by the end of 2012, increasing by 11.8%.
Accordingly, earnings per share increased to reach US$ 0.98 by end of
2013 compared to US$ 0.88 end of 2012.
The consolidated operating income reached US$ 171 million by the end of
2013 compared with US$ 158 million by the end of 2012, increasing by
8.0%. Concerning the different operating segments, the Data and fixed
segments have recorded an increase in revenues by 41.1% and 7.9%,
respectively, compared to 2012; whereas the revenues generated by Mobile
and Media segments have decreased compared to 2012. Additionally,
Earnings before Interest, Tax, Depreciation & Amortization - EBITDA
increased by 7.1% compared to end of 2012 to reach US$ 231 million by
end of 2013. (PALTEL annual report, 2008-2013).
Group Companies.
• Palestine Telecommunications Company (Paltel) which provides
fixed line, internet access via BSA and other value-added services.
• Palestine Celluar Communications Company (Jawwal) the first
mobile operator in Palestine.
• Hadara Technology Investment Company the biggest internet service
provider in Palestine.
39
• Reach for Communications Services Company the first contact
center in Palestine.
• Palmedia for Multimedia Services Company the media arm of Paltel
Group.
• Hulul IT Company the IT arm of Paltel Group.
Paltel Group maintained its leadership among providers of
telecommunications and digital services in the Palestinian market, as
evidenced by the positive growth indicators across all service lines: Growth
of active Lines in the fixed line operations of Paltel to be 403 thousand at
the end of 2013 growing by 1.7%. This growth was induced by a series of
concerted and intensive commercial campaigns aimed at driving demand
for fixed line services. Average revenue per user (ARPU) decreased from
JOD13.6 at the end of 2012 to JOD13.4 at the end of 2013, as a result of
the intensive campaigns.
Growth in ADSL Lines in the data services grew from 185 thousand
customers at the end of 2012 to 213 thousand customers at the end of 2013
achieving a 14.9% growth rate in yet another competitive landscape.
Growth in the number of subscribers in mobile operator Jawwal from 2.58
M customers at the end of 2012 to 2.63 M customers at the end of 2013
achieving a 1.9% growth rate despite the illegal competition in the
Palestinian market. ARPU dropped from JD 9.2 per month at the end of
40
2012 to JD 8.8 at the end of 2013 due to the growth in subscribers’ base
and the socioeconomic pressures. (PALTEL annual report, 2008-2013).
3.2 Current Performance Management in Paltel Group.
Paltel Group has implemented business scorecard approach to manage both
financial and non-financial perspectives due to the increase in complexity
of systems and organizational structures and continuously changing
external factors while rapidly expanding its business globally through
acquisitions, joint-ventures, and partnerships. Its key four strategies are
clearly developed in line with the vision and its own environments, and
they are definitely decomposed into each of strategic objectives. Relevant
KPIs have been subsequently defined and reported both internally and
externally. However, most of measures are associated with the financial
perspective and also the absolute values and some other KPIs like ratios not
measure in appropriate way. In addition, most of strategic not
communicated and aligned with strategies and the absentees for monitoring
and controlling for the KPIs and set the suitable weight for each strategy
and KPI, Paltel Group does not define clearly the level of local stakeholder
involvement in the performance measurement. Moreover, Paltel Group has
many documents describing business processes and procedures on a
detailed level but processes are not centralized and distributed that affect
missing company-wide management of business processes that combined
with a structured approach for updates and continuous improvement is
missing.

41
3.3 Strategic Analysis for External and Internal Factors
Vision.
As a market leader in Palestine, we are committed to being the customers’
choice provider for state-of-the-art communication services while staying
true to our core values, adopting pioneering business practices, and
progressing towards becoming a distinguished player in the region.
Mission.
To enhance and inspire the innovative environment of our society by
building a modern digital Palestine connected to the World.
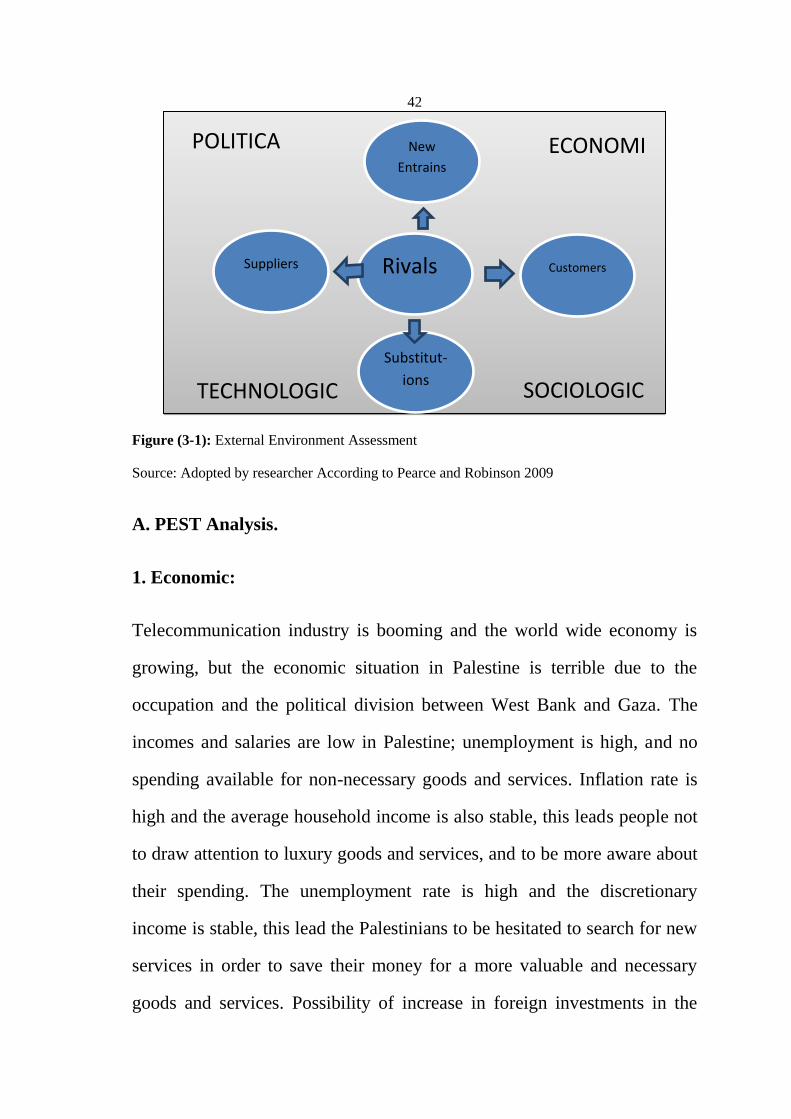
3.3.1 External Environment.
The external environments significantly have an impact on the company
strategic management model. According to Pearce and Robinson (2009),
the external environment is divided into Economical, Technological,
Social, Political (PEST) and Porter five forces model as shown in Figure
(3-1), Paltel Group is facing these factors as discussed in the following
discussion.
42
Figure (3-1): External Environment Assessment
Source: Adopted by researcher According to Pearce and Robinson 2009
A. PEST Analysis.
1. Economic:
Telecommunication industry is booming and the world wide economy is
growing, but the economic situation in Palestine is terrible due to the
occupation and the political division between West Bank and Gaza. The
incomes and salaries are low in Palestine; unemployment is high, and no
spending available for non-necessary goods and services. Inflation rate is
high and the average household income is also stable, this leads people not
to draw attention to luxury goods and services, and to be more aware about
their spending. The unemployment rate is high and the discretionary
income is stable, this lead the Palestinians to be hesitated to search for new
services in order to save their money for a more valuable and necessary
goods and services. Possibility of increase in foreign investments in the
POLITICAL
ECONOMIC
TECHNOLOGICAL
SOCIOLOGICAL
New
Entrains
Substitut-
ions
Rivals Customers Suppliers

43
Palestinian market is diminishing. The immigration of highly-skilled
employees and expertise out of Palestine increases. The obstacles of the
Israeli governments regarding importing new equipment and new
technologies licenses also worsen the economic situation in Palestine.
2. Technological:
There was no government spending for R&D in telecommunication filed.
Paltel Group uses and implements new technologies that guarantee safety
and high quality services for its customers. ERP systems were purchased
and implemented in the group such as integrated Billing/CRM solutions.
The group call center systems were expanded to satisfy customer's needs 24
hour a day with high security standards. Computer and communications
technologies enabled Paltel Group to compete effectively against larger
rivals (Israeli illegal companies), as well the new entrant to the Palestinian
mobile sector market. Telecommunication industry is essential and very
important in all fields in the Palestinian market. Frequencies for cellular
networks are highly-related to political and legal power. Improving and
supporting Paltel Group channels and quality control on services provided
through these channel network. Paltel Group is making huge investments in
systems and cellular network.
3. Political/Legal:
The political situation was and is still terrible and there was no stability for
the government. Lack of governmental power allows many Israeli

44
companies to operate in the Palestinian market illegally. Israeli forces
forbid Paltel Group from expanding its network in the areas out of
Palestinian National Authorities control such as C areas. This affects Paltel
Group’s capacity and quality of services out of C areas. But Paltel Group is
still struggling to do its best to satisfy customers’ needs where ever they
are. Israeli forces forbid the group from inserting BSCs and MSCs
(switches) to expand its network.
4. Socio-Cultural:
The lifestyle has been changed where it is a necessity for people to hold
cellular mobile to facilitate life, and to use mobile services to do their work
effectively and efficiently. The variety of services provided through mobile
network increases the importance of mobiles in the society. The strong
social relationships among the Palestinians expands the use of mobiles. The
Israeli occupation and the unsafe environment Palestinians in live increase
the use of mobile services. The increasing concern of health and
environmental issues from the government, NGO’s, communities, and
every citizen, makes it a vital goal for every company working in
telecommunication industry. Paltel Group like any other company believes
in societal responsibility worked and is still working to raise the awareness
of the Palestinian community concerning health hazards resulting from
wrong environmental practices. In this field, Paltel Group organize and
finance several campaigns, workshops, and TV programs.
45
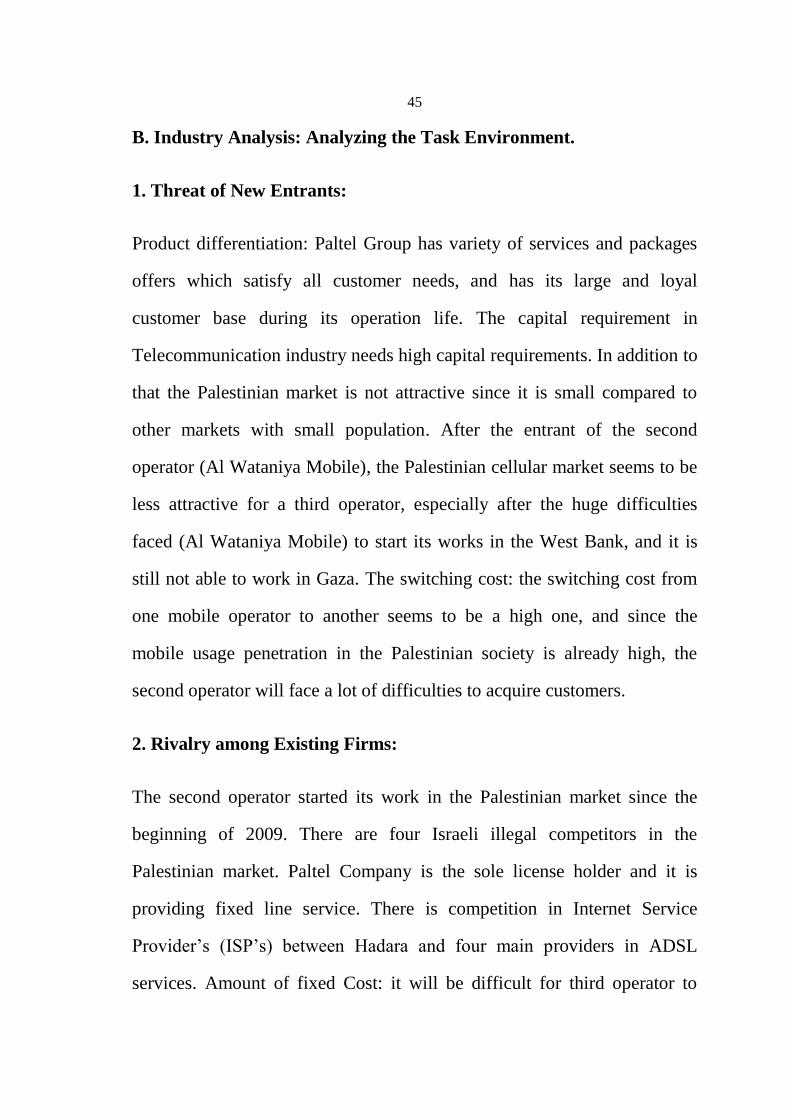
B. Industry Analysis: Analyzing the Task Environment.
1. Threat of New Entrants:
Product differentiation: Paltel Group has variety of services and packages
offers which satisfy all customer needs, and has its large and loyal
customer base during its operation life. The capital requirement in
Telecommunication industry needs high capital requirements. In addition to
that the Palestinian market is not attractive since it is small compared to
other markets with small population. After the entrant of the second
operator (Al Wataniya Mobile), the Palestinian cellular market seems to be
less attractive for a third operator, especially after the huge difficulties
faced (Al Wataniya Mobile) to start its works in the West Bank, and it is
still not able to work in Gaza. The switching cost: the switching cost from
one mobile operator to another seems to be a high one, and since the
mobile usage penetration in the Palestinian society is already high, the
second operator will face a lot of difficulties to acquire customers.
2. Rivalry among Existing Firms:
The second operator started its work in the Palestinian market since the
beginning of 2009. There are four Israeli illegal competitors in the
Palestinian market. Paltel Company is the sole license holder and it is
providing fixed line service. There is competition in Internet Service
Provider’s (ISP’s) between Hadara and four main providers in ADSL
services. Amount of fixed Cost: it will be difficult for third operator to
46
enter the market due to the large cost, and the existing competitor suffers
from high cost of license and fixed cost, and here is no encouragement
from the government for investment in ICT industry. The competition
between Jawwal and the competitor is fierce; the Wataniya mobile’s
market share in 2012 is 27%. Product and Service Characteristics: Paltel
Group is keeping a distance between its position and the competitor
position, through the marketing campaigns, the network infrastructure,
served area of Palestine which made its service a unique one.
3. Threat of Substitute Products:
The emergence of the smart phones makes it possible for customers to use
Voice over IP (VoIP) services to make national and international calls.
Customers may switch to Al Wataniya Mobile services if the later starts to
deliver superior services as Jawwal’s services in terms of quality or costs.
In a business like telecommunication industry, competitors have to
compete based on the service and prices they offer. The operation of the
WiFi companies in the West Bank like the Global Come Company affect
3G technology investment as it is expected to enter the Palestinian market
in the close future. Paltel Group tries to make long-term contracts and
commitments with its customers, especially with its corporate customers,
through strong promotions and loyalty programs and free handsets as well
as free air time promotions.

47
4. Bargaining Power of Buyers:
Most of Paltel Group customers are committed and loyal for Paltel Group
as a result of the promotion systems offers, and free services and handsets
related to customers different segmentations and packages. Paltel Group’s
prices are prospected to be lower than the competitor’s prices because of its
existing strong financial position which makes it hard for its customers to
switch to the other competitor. The number of customers of Paltel Group is
larger than any other existing competitors, they are estimated to 3,250,000
customers and this enabled them to conform a bargaining power.
5. Bargaining Power of Suppliers:
Paltel Group has its unique and committed chain of suppliers through long-
term agreements with them and deals with high-positioned national and
international suppliers. The telecommunication industry watches huge
competition between strong vendors, which gives Paltel Group the option
to choose from them. Since most of Paltel Group equipment and software
are provided by Ericsson, some of them are not compatible with other
company’s equipment and software, which gives Ericsson bargaining
power in some of the deals.
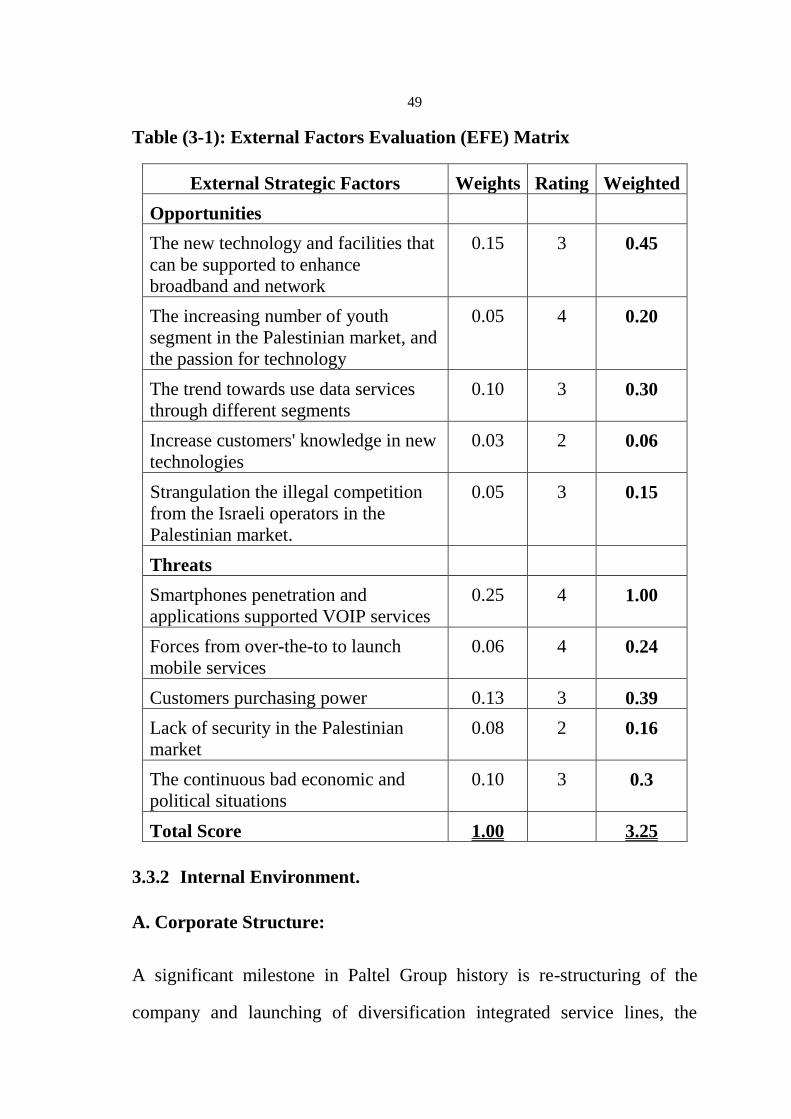
Table (3-1) shows External Factor Evaluation (EFE) Matrix which allows
researcher to summarize and evaluate economic, social, political,
technological, and competitive information. EFE results is done by
obtaining opinions from Performance Management committee (PMC) in
48
order to evaluate the opportunities and threats affecting Patel Group. We
gathered economic, social, political, technological, and competitive
information to develop our key external factors. These factors include 5
key external opportunities and 5 key external threats, all of which were
assigned a weight and rating in order to develop a weighted score which are
accumulated to determine Paltel Group external position in the industry. A
weight is given to indicate the relative importance of each factor to being
successful in the ICT industry. A rate is assigned to each factor to indicate
how effectively Paltel Group current strategies respond to the factor. The
rates are evaluated on scale of 1 through 4, where 4 = their response is
superior, 3 = their response is above average, 2 = their response is average,
1 = their response is poor. The rates are based by the company whereas the
weights are based on the industry. Strategic management: concepts and
cases / Fred R. David.—13th ed, (2011).
49
Table (3-1): External Factors Evaluation (EFE) Matrix
Weighted Rating Weights External Strategic Factors
Opportunities
0.45 3 0.15 The new technology and facilities that
can be supported to enhance
broadband and network
0.20 4 0.05 The increasing number of youth
segment in the Palestinian market, and
the passion for technology
0.30 3 0.10 The trend towards use data services
through different segments
0.06 2 0.03 Increase customers' knowledge in new
technologies
0.15 3 0.05 Strangulation the illegal competition
from the Israeli operators in the
Palestinian market.
Threats
1.00 4 0.25 Smartphones penetration and
applications supported VOIP services
0.24 4 0.06 Forces from over-the-to to launch
mobile services
0.39 3 0.13 Customers purchasing power
0.16 2 0.08 Lack of security in the Palestinian
market
0.3 3 0.10 The continuous bad economic and
political situations
3.25 1.00 Total Score
3.3.2 Internal Environment.
A. Corporate Structure:
A significant milestone in Paltel Group history is re-structuring of the
company and launching of diversification integrated service lines, the
50
company today is made up of three core business areas that cover, fixed
telephony mobile and data services. The goal is to create an economic
entity that would be competitive locally, regionally and internationally. In
its current situation Paltel Group leverages its strength in the sector of
communication and information technology in Palestine in partnership and
cooperation with other stakeholders in a sector that is regarded as one of
fastest growing sectors on the national scale. Paltel Group has taken upon
itself as part of community development to create incentive for companies
operating in the IT sector to encourage them to understand projects that are
important for sector growth.
B. Corporate Culture:
There is a well-defined or emerging culture composed of shared beliefs,
expectations, and values among Paltel Group environment and employees.
They are committed to ethical standards in operations. Inspired by the
value system of our society; constituting the basis for conducting work and
future direction. They strive to preserve trust between shareholders and
company by employing integrity and honesty in all operations, a reality that
helps them in supporting their business plans, while moving forward in
confidence to preserve shareholders value. Paltel Group has its own culture
and strategy toward society to make people consistent with its culture and
values so increasing customer's loyalty and commitment, for example,
Paltel Group employees maintain the formal dresses to show professional
picture in serving customers, however it keeps Thursday as a casual day.
51
Paltel Group has its organized work and planning process. Paltel Group’s
culture is seen from other companies in Palestine as a leader in the
Palestinian market. Paltel Group has an environmental culture towards
health and clean environment, at the environmental level, Jawwal attained
the ISO 14001 certificate, being the first in the Middle East and the fourth
in the world to attain such international certificate. This is an important
indicator of keen commitment to global environmental policies and
demonstrates that applies the best technical standards throughout its
operations. They always strive to learn, benefiting from local and
international experiences in order to provide high quality services, while
innovating creative solutions and services based on solid reading of the
future of technology around the globe. Work in earnest to develop the
internal stills of all employees in order to contribute collectively in their
efforts to build the future of technology in Palestine while servicing their
subscribers, shareholders and the community at large. They do this by
constantly investing in Palestinian youth.
C. Corporate Resources:
1. Marketing.
Current marketing objectives are: To increase customer base in fixed,
mobile and data using special bundles that achieve customer needs.
Bundling sales (multiple products and promotions at the same time).
Increase penetration rate to extend its sales to rural and upscale areas,
where Paltel Group coverage is not available. Retain customers using

52
customized programs, incentives to decrease churn rate. Enhance customer
segmentation methodology to attain all customer needs. Remain average
revenue per subscriber ARPU. Clear marketing analysis and feedback
about the results. The Paltel Group brand is perceived as one of the most
recognizable local telecommunications brands and the company has
capitalized on the brand recognition to enter into new markets. Intensive
and continuous marketing campaigns to increase the subscribers base to
exceed the 3,250,000.
2. Finance.
Paltel Group’s financial performances are analyzed by utilizing the
liquidity, profitability and debt management ratios for the last six years
(2008-2013), compared to the industry standard and benchmarking with
telecommunication industry in the region.
Consolidated Revenue.
The consolidated net revenues of the Group has growth by 2.6% to reach
JOD 375.3 million for the year of 2013 compared with JOD 365.9 million
the same period of last year. In 2010, consolidated operational revenues for
Paltel Group increased by 7.88% to reach JD 339.9 million by year end
2010 in comparison with JD 315.1 million in 2009. This comes as a direct
result of the company’s growth in operational revenues. In 2008, Net
revenue has grown by 28.7% to reach JOD291.1M compared with
JOD226.2M in 2007 which is greatly attributable to the growth in all

53
operating segments of business. Grown by 28.7% to reach JOD291.1M
compared with JOD226.2M in 2007 which is greatly attributable to the
growth in all operating segments of business. (PALTEL annual report,
2008-2013)
Consolidated EBITDA.
The consolidated EBITDA of the Company Increased by 7.1% reaching
JOD 163.9 million at the end of 2013 compared with JOD 153 million at
the end of 2012. EBITDA had increased by 6.08% reaching JD 143.3
million at the end of 2010 where it reached JD 135.1 million at the end of
2009. This increase is credited to improvements in operational performance
of the company triggered by the start of implementation of the new strategy
which is focused on consolidating the company’s various activities while
outsourcing secondary services to vendors.
The consolidated EBITDA of the Company grew by 5.36% to reach JD
135.11 million at the end of 2009 compared with JD 128.24 million at the
end of 2008. This growth is attributable to the growth rate in Company’s
consolidated revenues as well as the decrease in the operating expenses by
1.36%.(PALTEL annual report, 2008-2013).
Consolidated Operating Profit (EBIT).
The consolidated operating profit amounted to JOD 121 million by the end
of 2013 compared with JOD 112.1 million (31% operating profit margin)
by the end of 2012 compared with JOD 127.4 million (34% operating profit

54
margin) by the end of 2011. EBIT decreased by 12.1% mainly due to the
decline in operating revenues by 1.3% and the growth in operating
expenses by 6.6%. The latter was affected by the increase in depreciation,
advertising and Gaza generators’ fuel expenses.
Operational profits for the company reached value of JD 111.8 million by
year end 2010 in comparison with JD104.4 million at end of 2009 with an
increase of 7.09%. This increase comes as a result of the increase in gross
profit in an absolute value higher than the increase in operational and
administrative expenses; where gross income has increased by JD 21.8
million in comparison with an increase in expenses of JD 14.4 million.
(PALTEL annual report, 2008-2013).
Consolidated Net Income, EPS and Dividends.
The consolidated net income increased by 11.8% to stand at JOD 91.8
million at the end of 2013 compared with JOD 82.1 million at the end of
2012, compared with JOD 90.7 million at the end of 2011. The decline is
mainly attributable to the devaluation of the Israeli Shekel and as a direct
result to the company’s decision to postpone the 50% tax exemption for
two years; Paltel is entitled for this exemption as part of the Investment
Encouragement Law in Palestine. Consequently, the company started
paying 20% income tax this year compared to 7.5% the year before. More
on the latter, the tax authorities in Palestine have declared a new tax
schema and raised the corporate tax rate from 15% to 20% starting January
2012. Excluding tax rate/regime difference between the two periods, the
55
consolidated net income before tax increased by 4.6% which better reflects
the operational advancement and achievement of the Group.
The earnings per share increased by 7.4% to reach JOD 0.698 by the end of
2013 compared to JOD 0.624 by the end of 2012, also earnings per share
decreased to reach JOD 0.624 by the end of 2012 compared to JOD 0.689
by the end of 2011. In 2010, net profit has reached JD 86.3 million up by
22.75% compared to 2009, where it was JD70.3 million.
Net income witnessed a growth rate of 36% to reach JOD89.2m compared
with JOD65.5m in 2007. Owners’ equity grew by 20% to reach
JOD332.8m compared with JOD277.3m in 2007 as a result of impressive
operating performance, which reflected itself positively on the growing
asset base of the company, which grew by 9.5% to reach JOD461.9m
compared with JOD421.6m in 2007, at the same time total liabilities
decreased by 10% to reach JOD129.2m compared with JOD144.3m in
2007. (PALTEL annual report, 2008-2013).
Table (3-2) and Figure (3-2) shows Consolidated Revenue, EBITDA, EPIT
and Net Income in the period of 2008-2013.

56
Table (3-2): Consolidated Revenue, EBITDA, EPIT and Net Income
(JOD).
Consolidated 2008 2009 2010 2011 2012 2013
Revenue 299.06 315.09 339.9 370 365.9 375.3
EBITDA 128.24 135.11 143 164 153 163.9
EBIT 98.44 104.36 111.8 127.4 112.1 121
Net Income 89.2 70.34 86.3 90.7 82.1 91.8
Figure (3-2): Consolidated Revenue, EBITDA, EPIT and Net Income (JOD).
Total Assets.
Total assets of the Company grew by 7.4% from JOD 617 million at the
end of 2012 to JOD 666 million at the end of 2013, and grew by 7.3% from
JOD 575 million at the end of 2011 to JOD 617 million at the end of 2012.
The growth was driven by the increase in non-current assets balance by
0
50
100
150
200
250
300
350
400
2008 2009 2010 2011 2012 2013
Revenue EBITDA EBIT
57
13.6% reaching JOD 434 million by end of 2012 compared to JOD 382
million at the end of 2011. The growth in the noncurrent part of the assets
is mainly attributed to the increase in the balances of “Available for Sale
Investments” and “Other Financial Assets” accounts by a total of JOD 65.5
million during the year. On the other hand, current assets declined by 5.4%
to reach JOD 182 million. (PALTEL annual report, 2008-2013).
Total Liabilities.
The Company’s total liabilities grew by 3.4% as of end of 2013 reaching
JOD 163.5 million compared with JOD 158 million on December 31, 2012,
and grew by 8.1% as of end of 2012 reaching JOD 158 million compared
with JOD 146 million on December 31, 2011. This is attributed to the
increase of the short-term liabilities by JOD 23.0M (23.3% more than the
balance of 2011). This is influenced by the increase in “Accounts
Payables” and ”Other Current Liabilities” by a total of JOD 21.0 M, or an
increase of 25.2% compared to their balances as end of 2011. The increase
in accounts payables resulted from the increase in the license fees payables’
account as a result of the completion of the clearing process of the license
fees against the advance payments made to the Palestinian Authority in
previous periods. On the other hand, the company’s long-term liabilities
have declined by JOD 11.1 million; a decrease of 23.5% compared to end
of 2011 due to the decline of long-term loans by JOD 14.2 million at the
end of 2012. (PALTEL annual report, 2008-2013).
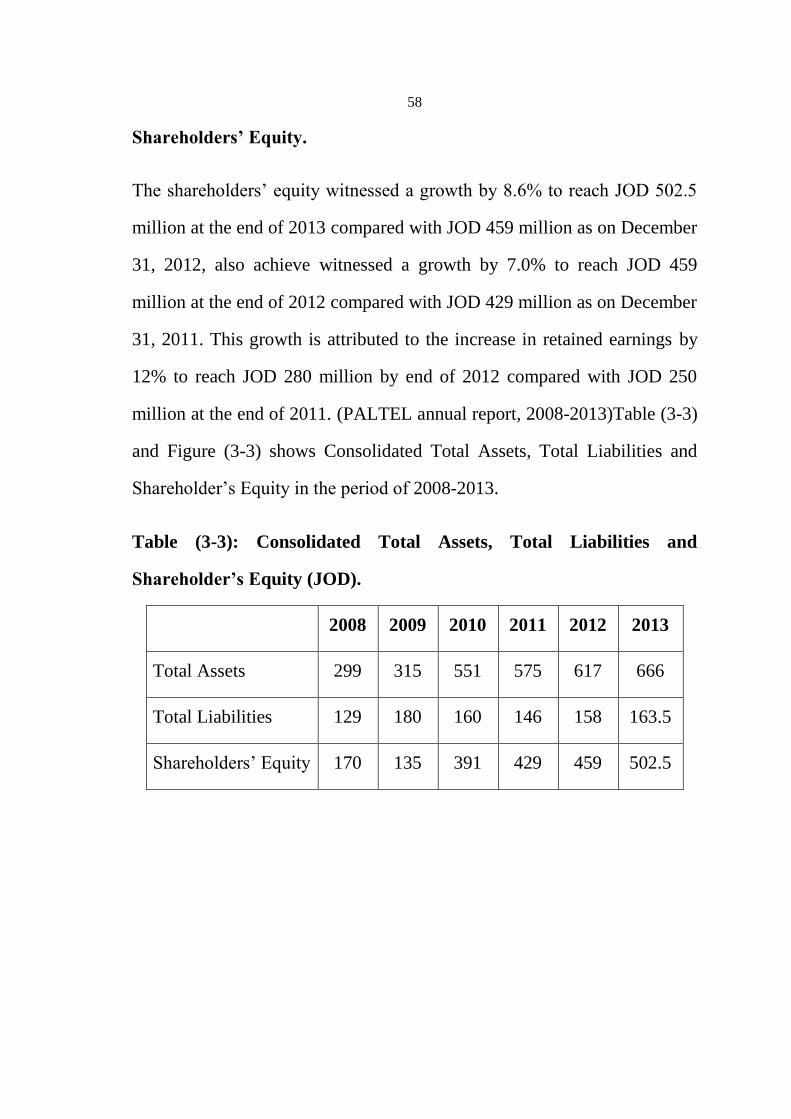
58
Shareholders’ Equity.
The shareholders’ equity witnessed a growth by 8.6% to reach JOD 502.5
million at the end of 2013 compared with JOD 459 million as on December
31, 2012, also achieve witnessed a growth by 7.0% to reach JOD 459
million at the end of 2012 compared with JOD 429 million as on December
31, 2011. This growth is attributed to the increase in retained earnings by
12% to reach JOD 280 million by end of 2012 compared with JOD 250
million at the end of 2011. (PALTEL annual report, 2008-2013)Table (3-3)
and Figure (3-3) shows Consolidated Total Assets, Total Liabilities and
Shareholder’s Equity in the period of 2008-2013.
Table (3-3): Consolidated Total Assets, Total Liabilities and
Shareholder’s Equity (JOD).
2008 2009 2010 2011 2012 2013
Total Assets 299 315 551 575 617 666
Total Liabilities 129 180 160 146 158 163.5
Shareholders’ Equity 170 135 391 429 459 502.5

59
Figure (3-3): Consolidated Total Assets, Total Liabilities and Shareholder’s Equity (JOD).
Cash Flow.
The net cash flows from operating activities increased by 13.2% for the
year of 2013 to reach JOD 171.6 million compared with JOD 149 million
the same period in 2012, also the net cash flows from operating activities
decreased by 11.2% for the year of 2012 to reach JOD 149 million
compared with JOD 168 million the same period in 2011. This decline is
attributed to the drop in operating revenues and profit as well as the
increase in the change in working capital, where the change was JOD 4.9
million in 2011, versus a change of JOD 16.6 million in the year 2012. It
should be noted that the change in tax policies had a major effect on this
item, as mentioned earlier. The net cash flows from investing activities
reached (JOD 101 million) in 2012 compared to (JOD 106 million) in
2011; this decrease is mainly attributed to the drop in the value of capital
expenditures “PPandE” and “Investments in Associates” by JOD 29.4
million and JOD 15.0 million respectively during the year of 2012 in
comparison with the previous year, besides lending associate companies a
0
100
200
300
400
2008 2009 2010 2011 2012 2013
Revenue EBITDA EBIT
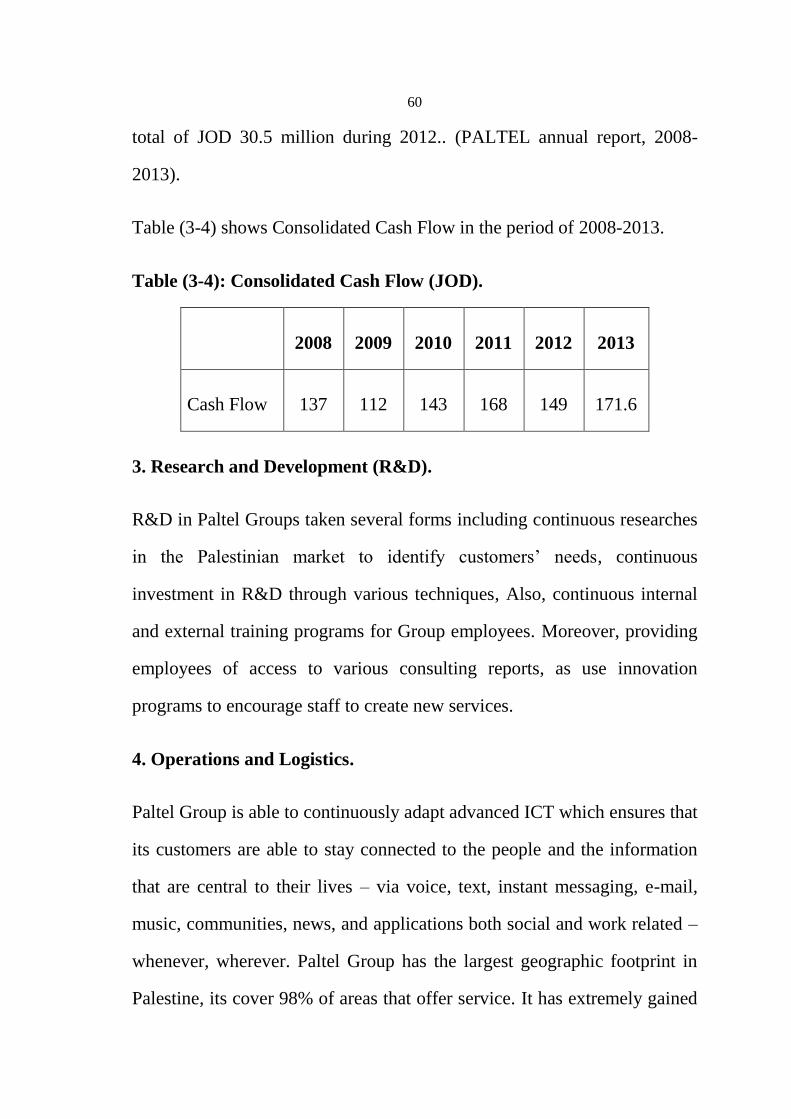
60
total of JOD 30.5 million during 2012.. (PALTEL annual report, 2008-
2013).
Table (3-4) shows Consolidated Cash Flow in the period of 2008-2013.
Table (3-4): Consolidated Cash Flow (JOD).
2008 2009 2010 2011 2012 2013
Cash Flow 137 112 143 168 149 171.6
3. Research and Development (R&D).
R&D in Paltel Groups taken several forms including continuous researches
in the Palestinian market to identify customers’ needs, continuous
investment in R&D through various techniques, Also, continuous internal
and external training programs for Group employees. Moreover, providing
employees of access to various consulting reports, as use innovation
programs to encourage staff to create new services.
4. Operations and Logistics.
Paltel Group is able to continuously adapt advanced ICT which ensures that
its customers are able to stay connected to the people and the information
that are central to their lives – via voice, text, instant messaging, e-mail,
music, communities, news, and applications both social and work related –
whenever, wherever. Paltel Group has the largest geographic footprint in
Palestine, its cover 98% of areas that offer service. It has extremely gained
61
economies of scale and scope to maximize cost efficiency and
effectiveness. In addition, it can diversify business risks in response to the
volatile and rapidly changing environments globally. Paltel Group working
on develop operational capabilities to be align with international standards,
identify outsourcing functions to enhance quality and effectiveness of
services, extends sales to rural and upscale outlets areas where Paltel Group
coverage is not available, manage and operate day to day activities
effectively, and contract with international consultancy firms to assure
cutting edge operation standards.
5. Human Resources Management (HRM).
Human Resources policies try to place the right men in the right place,
Paltel Group’s succeed to achieve high rates of employees’ satisfaction,
and use the advice of large specialized senior consultant companies in HR
fields to implement retention plans for employees. Also, Paltel Group’s
provides competitive annual bonus plans and rewards based on objectives
achievement.
6. Information System.
Paltel Group has driven the Group Technology initiative to achieve time-
to-market and maintain cost efficiency. The company has managed and
controlled group-wide projects to orchestrate the move toward significant
coordination and identify and disseminate best practices to focus on
expansion of service capacity while replicating business models across a

62
number of cities. The purpose of Group Technology will be to lead the
implementation of standardized architecture for business process,
information technology and network systems. The initiative has supported
the third generation (3G) network rollout.
Table (3-5) shows summary step in conducting an internal strategic-
management audit is to construct an Internal Factor Evaluation (IFE)
Matrix. This strategy-formulation tool summarizes and evaluates the major
strengths and weaknesses in the functional areas of Paltel Group, and it also
provides a basis for identifying and evaluating relationships among those
areas. A rate is assigned to each factor to indicate how effectively Paltel
Group current strategies respond to the factor. The rates are evaluated on
scale of 1 through 4, where 4 = their response is superior, 3 = their response
is above average, 2 = their response is average, 1 = their response is poor.
The rates are based by the company whereas the weights are based on the
industry. Strategic management: concepts and cases / Fred R. David.—
13th ed, (2011).
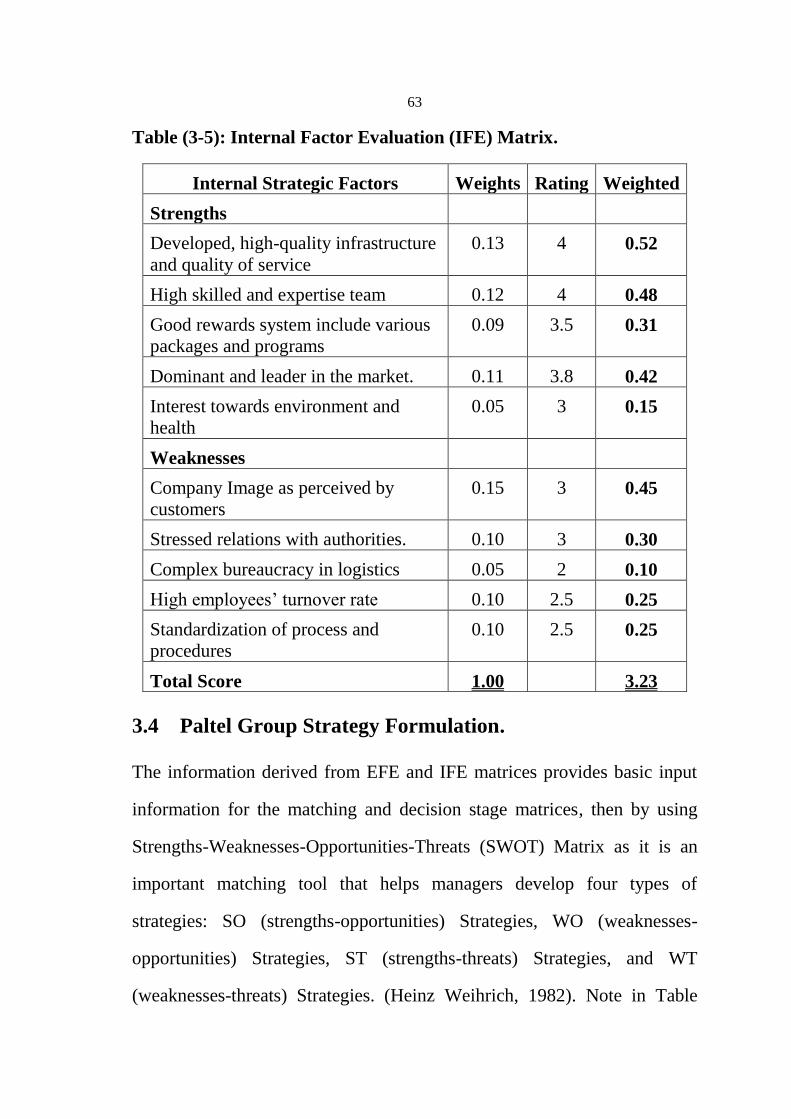
63
Table (3-5): Internal Factor Evaluation (IFE) Matrix.
Weighted Rating Weights Internal Strategic Factors
Strengths
0.52 4 0.13 Developed, high-quality infrastructure
and quality of service
0.48 4 0.12 High skilled and expertise team
0.31 3.5 0.09 Good rewards system include various
packages and programs
0.42 3.8 0.11 Dominant and leader in the market.
0.15 3 0.05 Interest towards environment and
health
Weaknesses
0.45 3 0.15 Company Image as perceived by
customers
0.30 3 0.10 Stressed relations with authorities.
0.10 2 0.05 Complex bureaucracy in logistics
0.25 2.5 0.10 High employees’ turnover rate
0.25 2.5 0.10 Standardization of process and
procedures
3.23 1.00 Total Score
3.4 Paltel Group Strategy Formulation.
The information derived from EFE and IFE matrices provides basic input
information for the matching and decision stage matrices, then by using
Strengths-Weaknesses-Opportunities-Threats (SWOT) Matrix as it is an
important matching tool that helps managers develop four types of
strategies: SO (strengths-opportunities) Strategies, WO (weaknesses-
opportunities) Strategies, ST (strengths-threats) Strategies, and WT
(weaknesses-threats) Strategies. (Heinz Weihrich, 1982). Note in Table

64
(3-6) that the first, second, third, and fourth strategies are SO, WO, ST, and
WT strategies, respectively.
SO Strategies use internal strengths to take advantage of external
opportunities. Also, WO Strategies aim at improving internal weaknesses
by taking advantage of external opportunities. Moreover, ST Strategies use
strengths to avoid or reduce the impact of external threats. Furthermore,
WT Strategies are defensive tactics directed at reducing internal weakness
and avoiding external threats.

65
Table (3-6): The Strengths-Weaknesses-Opportunities-Threats
(SWOT) Matrix for Paltel Group.
Internal
Factors
External
Factor
Strength (S)
S1 Developed, high-quality
infrastructure and quality of
service
S2 Experts employees
S3 Various packages and
programs
S4 Dominant and leader in
the market
S5 Interest towards
environment and health
Weaknesses (W)
W1 Company Image
as perceived by
customers
W2 Stressed relations
with authorities
W3 Complex
bureaucracy in
logistics
W4 High employees’
turnover rate
Opportunities (O)
SO Strategies
(S2 O1) Product
development
(S3 O4) Market
Penetration
(S4 O5) Capacity
expansion
WO Strategies
(W2 O5)Exploit
its available
resources, and
secure a niche in
the industry.
(W3 O1)
Maintain the
highest levels of
efficiency and
productivity
with optimum
utilization of
resources.
O1 The new
technology and
facilities that can
be supported
through mobiles
network
O2 The increasing
number of youth
segment in the
Palestinian market
O3 The trend
towards use
wireless and data
services through
mobiles
O4 Increase
customers'
knowledge in new
technologies
O5 Strangulation
the illegal
competition from
the Israeli
operators in the
Palestinian market.
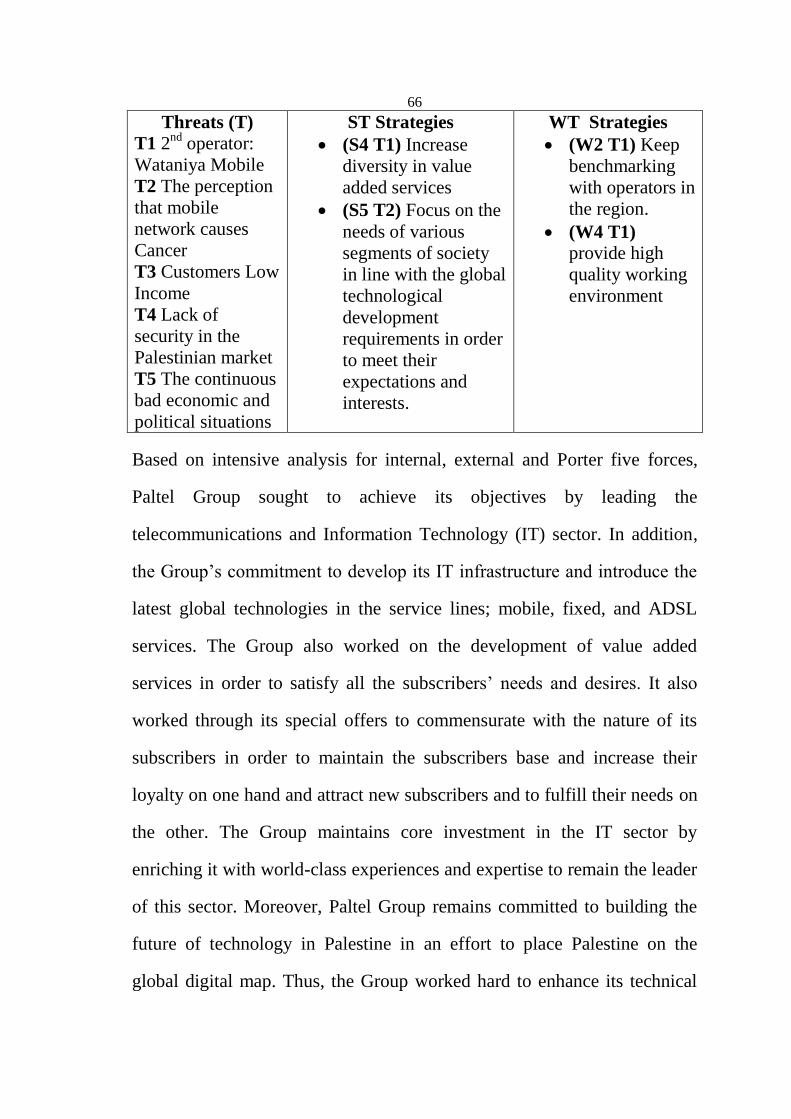
66
Threats (T)
T1 2nd
operator:
Wataniya Mobile
T2 The perception
that mobile
network causes
Cancer
T3 Customers Low
Income
T4 Lack of
security in the
Palestinian market
T5 The continuous
bad economic and
political situations
ST Strategies
(S4 T1) Increase
diversity in value
added services
(S5 T2) Focus on the
needs of various
segments of society
in line with the global
technological
development
requirements in order
to meet their
expectations and
interests.
WT Strategies
(W2 T1) Keep
benchmarking
with operators in
the region.
(W4 T1) provide high
quality working
environment
Based on intensive analysis for internal, external and Porter five forces,
Paltel Group sought to achieve its objectives by leading the
telecommunications and Information Technology (IT) sector. In addition,
the Group’s commitment to develop its IT infrastructure and introduce the
latest global technologies in the service lines; mobile, fixed, and ADSL
services. The Group also worked on the development of value added
services in order to satisfy all the subscribers’ needs and desires. It also
worked through its special offers to commensurate with the nature of its
subscribers in order to maintain the subscribers base and increase their
loyalty on one hand and attract new subscribers and to fulfill their needs on
the other. The Group maintains core investment in the IT sector by
enriching it with world-class experiences and expertise to remain the leader
of this sector. Moreover, Paltel Group remains committed to building the
future of technology in Palestine in an effort to place Palestine on the
global digital map. Thus, the Group worked hard to enhance its technical

67
performance and broadband services and to provide the latest applications
while maintaining the highest levels of security and privacy. In the same
context, the Group continued its devotion towards the community and
public sector by launching creative initiatives and sustainable development
programs ranging from more widespread environmental technology and
Internet access to computer literacy. In addition to its social responsibility,
the Group has empowered marginalized groups in an aim to have them
look ahead for a future filled with all the needed resources to sustain a
decent life.
Accordingly, we can formulate the following strategies goals for Paltel
Group:
Continue leading the market of telecommunications and technology
in Palestine, achieve growth in profitability and financial
performance.
Maintain the highest levels of efficiency and productivity with
optimum utilization of resources and capabilities to achieve
excellence in all services lines: Mobile, fixed, and internet/ADSL
services.
Increase diversity in value added services, keep up with the latest
technological applications as well as foster local innovations and
initiatives in the field of technology and its applications. Offer 3G
services when acquiring the necessary frequencies.

68
Focus on the needs of various segments of society in line with the
global technological development requirements in order to meet their
expectations and interests.
Continue to develop and modernize the network to provide modern
services and broadband services with the fastest and highest quality
of service.
Increase staff productivity and efficiency through attract and retain
employees and provide high quality working environment.
69
Chapter 4
Balance Scorecard and Strategy Mapping
This chapter provides implementation for Balance Scorecard by describing
four perspectives, involved in Key Performance Indicators, and proposed
strategy map to link Paltel Group’s BSC to its strategy.
4.1 Balance Scorecard.
Kaplan and Norton (1992) proposed the concept of the BSC. The BSC has
been widely adopted in the evaluation of organizational performance from
four perspectives: finance, customer, internal process, and learning and
growth. Respectively, the essential principle of the BSC is that standard
financial measures must be balanced with nonfinancial measures (Norton et
al., 1997). Since the introduction of the BSC by Kaplan and Norton, a
combination of financial and nonfinancial measures in a performance
measurement system has been favorable for both profit and nonprofit
organizations (Ballou, Heitger, and Tabor, 2003; Sinclair and Zairi, 2001).
Likewise, Telecommunication industry can save a vast amount of time and
money if they understand which measures are best suited to their needs
(Davis and Albright, 2004; Littler et al., 2000). Intangible, nonfinancial
measures can help lead organizations to administer performance effectively
and forecast their future profitability. Norton et al. (1997) classified the
advantages of the BSC into three aspects: communication and teamwork,
commitment, and feedback and learning. The BSC enables senior

70
management to clarify vision, develop strategy, foster teamwork, and foster
the commitment to a customer focus across the organization.
The benefits of using the BSC for telecommunication companies are as
follows: (1) it provides a framework to assess and develop strategy, (2) it
develops strategic objectives and performance measures to translate the
group strategies into actions, (3) it provides a way to measure and monitor
the performance of key performance drivers that can lead to the successful
execution for the strategies, and (4) it is an effective tool to ensure
continuous improvement in the systems and processes of the group (Frigo
et al., 2000).
In summary, the BSC has been employed by many businesses to assess
their performance across various aspects. It provides insight into business
performance not only for managers who seek ways to improve performance
but also for investors who want to gauge an organization’s ongoing
performance. However, studies of how to analyze causal relationships
between evaluation criteria, distinguish influential factors, and create an
effective mechanism for the establishment of a strategic implementation of
evaluation criteria are scarce (Malina et al., 2007; Nørreklit, 2000, 2003).
4.2 Balance Scorecard in Paltel Group.
Kaplan and Norton (1996) identified four steps in implementing a balanced
scorecard. These are 1) clarifying and translating the vision and strategy, 2)
communicating and linking, 3) planning and target setting, and 4) strategic

71
feedback and learning. The first step, clarifying and translating the vision
and strategy, is generally accomplished in Strategy Formulation Chapter by
analyze internal, external and porter five forces and proposed appropriate
strategies. Communicating and linking done through formulating
Performance Management Committee (PMC) to analyze four perspectives
and proposed proper KPI’s involved in each perspective and develop
strategic map that visualizes overall strategy and this is described in this
section. Strategic business unit determines measures for its own scorecard
as part of the communicating and linking step. Unit managers consider both
the overall group objectives and strategy and focus on the most important
ones. Care should be taken, however, not to reduce lower-level data into
meaningless ratios, all of these indictors submitted to PMC in order to set
targets for each KPI, then feedback process will be through measurement
system using Analytical Hierarchy Process (AHP) as illustrated in Chapter
Five.
Performance Management Committee (PMC) in cooperation with
consultancy firm and the researcher studied the current situation and select
significant KPI’s that affect overall performance and can be measured
through information system in the group, and distribute these KPI’s into
each perspective of BSC. The following section describes each perspective
and the KPI’s:

72
4.2.1 Finance Perspective.
Financial metrics are very effective and critical measures to monitor
business performance. It illustrates how the strategy, implementation and
execution contribute to the “bottom line”, it summarizes the results of
actions taken from the economic point of view. In our case, and based on
relative research, benchmarking and consultation from leading firms in this
field, we choose five main indicators that affect overall business
performance from financial perspective, Paltel Group has a preference of
the following performance measures over others:
Average Revenue Per User (ARPU).
ARPU is commonly calculated in standard mathematical fashion, by
dividing the aggregate amount of revenue by the total number of users who
provide that revenue. The group tracks ARPU to know its profit potential in
broad terms. However, mobile phone companies also track ARPU by
examining revenues brought in by customers’ incoming calls as compared
to revenues generated by monthly or annual fees.
The formula for ARPU:
ARPU =
Aggregate Amount of
Revenue (1)
Total Number of Subscribers

73
Return On assets (ROA).
An indicator of how profitable of a company is relative to its total assets.
ROA gives an idea as to how efficient management is at using its assets to
generate earnings. Calculated by dividing a company's annual earnings by
its total assets, ROA is displayed as a percentage. ROA tells PMC what
earnings were generated from invested capital (assets).
The formula for Return on Assets is:
ROA =
Net Income
(2) Total assets
Return On Equity (ROE).
The amount of net income returned as a percentage of shareholders equity.
ROE measures a corporation's profitability by revealing how much profit a
company generates with the money shareholders have invested.
Net income is for the full fiscal year (before dividends paid to common
stock holders but after dividends to preferred stock.) Shareholder's equity
does not include preferred shares.
ROE is expressed as a percentage and calculated as:
ROE =
Net Income
(3) Shareholder's Equity

74
Net Profit Margin (NPM).
The net profit margin formula looks at how much of a company's revenues
are kept as net income. The net profit margin is generally expressed as a
percentage. Both net income and revenues can be found on a company's
income statement.
The formula for Net Profit Margin is:
NPM =
Net Income
(4) Sales Revenue
Current Ratio (CR).
A liquidity ratio that measures a company's ability to pay short-term
obligations. The higher the current ratio, the more capable the company is
of paying its obligations. A ratio under 1 suggests that the company would
be unable to pay off its obligations if they came due at that point. While
this shows the company is not in good financial health, it does not
necessarily mean that it will go bankrupt - as there are many ways to access
financing - but it is definitely not a good sign. The current ratio can give a
sense of the efficiency of a company's operating cycle or its ability to turn
its product into cash. The Current Ratio formula is
CR =
Currents Assets
(5) Current Liabilities

75
4.2.2 Customer Perspective.
Since nowadays being customer oriented is becoming more and more
important for business success, the purpose of defining customer-related
KPIs is to get information about business performance from customers’
point of view in order to improve their business. From a well-formulated
and implemented strategy, the generic measures include customer
satisfaction, customer churn, number of subscribers, penetration rate and
minutes of use. These indicators are the most important to measure overall
customer perspective. Telecommunication industry has evolved and its
customers use their mobile phones not only to call but also to access the
internet, watch television, play music and take pictures. Paltel Group has
focused on customer value enhancement to maintain their loyalty and trust.
The following indicators are significant for Paltel Group’s customer
perspective:
Customers’ Churn Rate.
Churn rate is the proportion of customers that leaves the Group during a
certain period of time (usually one year). This indicates the ability of the
Group to retain the customers, and reflects the customer satisfaction to the
Group. Churn rate is an important consideration in the telecommunication
industry as several companies are competing for customers, making it easy
for people to transfer from one operator to another. The Customer Churn
formula is:

76
Customer Churn=
Number of Customers Leave
(6) Time (usually one year)
Customer Satisfaction Index .
This indicator indicates the overall satisfaction of the customers, measure
of how services supplied by Paltel Group meet or exceed customer
expectation. The number is acquired by either Paltel Group own market
investigation or surveys from a third party. The Customer Satisfaction
Index is:
Customer Satisfaction
Index =
Percentage of Total
Customers (7)
Services Parameters
Number of Subscribers.
Number of subscribers can not only show market share and growth in
market share, but also can show the customer satisfaction. Because
nowadays there are two telecommunication companies launched the service
in Palestine. If the customers do not satisfy the service which was offered
by the company, they can easily change to another. So in this way the
number of subscribers also shows the capability that the group can keep or
attract the customers by offering better products and services.
77
Penetration Rate.
Penetration rate is a measurement that indicates the company’s occupancy
of the market. The larger penetration rate, the larger company shares in the
market. However, from another point of view, it also indicates the market
development potential. The smaller penetration rate indicates the larger
development space in the market.
Average Minutes of Usage per User per Month (MOU).
MOU indicates the average length of time that the subscriber uses the voice
service. Voice service is the basic service that a telecom provides, and long
MOU indicates the high quality of voice service network, and subscriber’s
high satisfaction to the voice service. This indicator also indirectly shows
the loyalty of customers.
4.2.3 Internal Process Perspective.
Internal process enables Paltel Group to meet two objectives, deliver value
propositions of customers in targeted market segments and satisfy
stockholders expectations of excellent financial returns. The measures
should focus on critical processes to achieve customer satisfaction and
organizational financial objectives. Measures include cost per subscriber,
marketing expense per customer, time to market, service coverage and
complaint ratio as illustrated below:
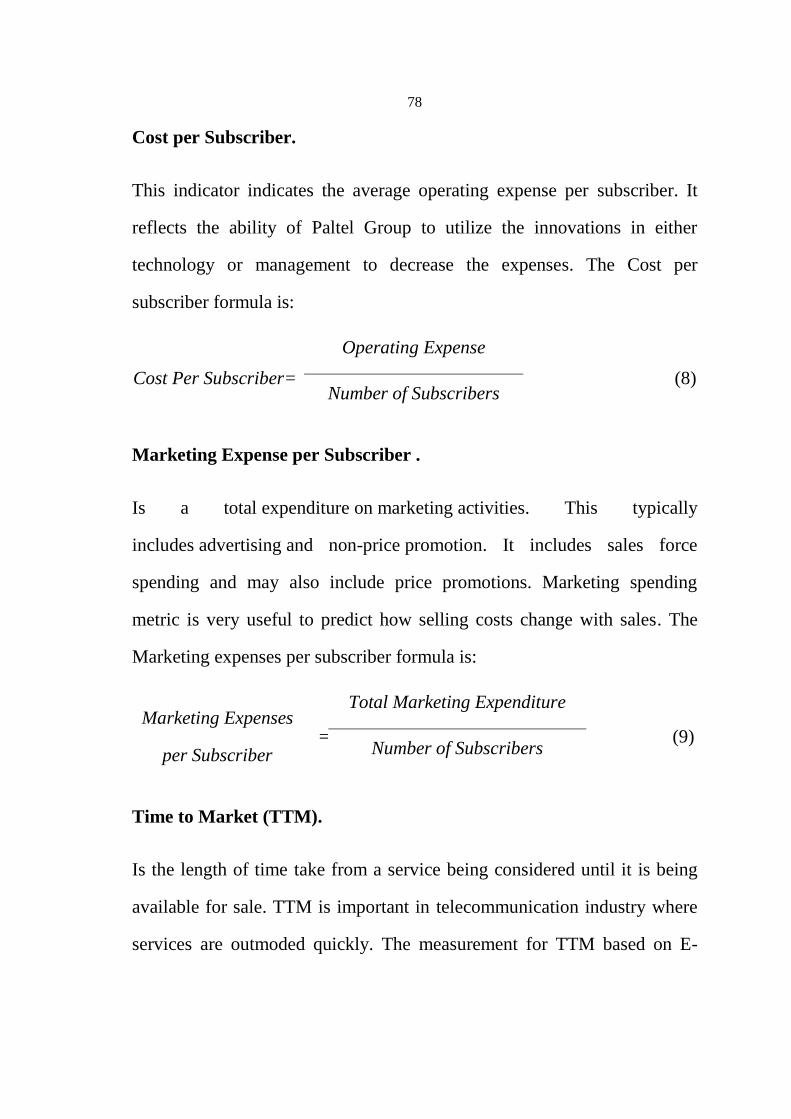
78
Cost per Subscriber.
This indicator indicates the average operating expense per subscriber. It
reflects the ability of Paltel Group to utilize the innovations in either
technology or management to decrease the expenses. The Cost per
subscriber formula is:
Cost Per Subscriber=
Operating Expense
(8) Number of Subscribers
Marketing Expense per Subscriber .
Is a total expenditure on marketing activities. This typically
includes advertising and non-price promotion. It includes sales force
spending and may also include price promotions. Marketing spending
metric is very useful to predict how selling costs change with sales. The
Marketing expenses per subscriber formula is:
Marketing Expenses
per Subscriber =
Total Marketing Expenditure
(9) Number of Subscribers
Time to Market (TTM).
Is the length of time take from a service being considered until it is being
available for sale. TTM is important in telecommunication industry where
services are outmoded quickly. The measurement for TTM based on E-
79
TOM standard from TM FORUM, which Paltel Group implements last
year to measure time for each process until reaching the market.
Service Coverage .
The coverage of a radio station is the geographic area where the station can
communicate. Coverage depends on several factors, such as orography (i.e.
mountains) and buildings, technology and radio frequency. Some
frequencies provide better regional coverage, while other frequencies
penetrate better through obstacles, such as buildings in cities. In the
Palestinian case there are difficulties in coverage as some areas are called
“C” that prevent Paltel Group from reaching these areas because of Israeli
occupation. The Service Coverage formula is:
Service Coverage =
Number of Sites
(10) Geographic Area
Subscriber’s Complaint Ratio.
It is an expression of dissatisfaction with a product or service, either orally
or in writing, from an internal or external customer. A customer may have a
genuine cause for complaint, although some complaints may be made as a
result of a misunderstanding or an unreasonable expectation of a product or
service. This will help Paltel Group improve the service quality according
to the complaints in different fields. The subscriber’s compliant ratio
formula is:

80
Subscriber’s
Compliant Ratio =
Number of Complaints
(11) Number of Subscribers
4.2.4 Learning and Growth Perspective.
This perspective is concerned with identifying the infrastructure that Paltel
Group needs for a long-term business improvement and growth, and to
achieve appropriate combination of skills and required tools for active
atmosphere for sustainable improvements to meet demands of customers
and attaining the desired financial efficiencies. Learning and growth is
aiming to fill the gap between the existing capabilities of people,
information systems and organizational procedures, and what will be
required to achieve the further objectives; the gap is identified through
financial, customer and business process perspectives. Therefore, the
measures are focused on the investment in people training, full time
equivalent, turnover, and employees rewards and compensation. The
following are the illustration of each indicator:
Training Expense per Employee.
The role of employee training and development is becoming more
important in Patel Group, by increasing relying on the knowledge, skills
and abilities of their human resources to drive firm performance. Since
training is a major component in enhancing employee competencies,
tracking the training-cost-per-employee metric helps determine the
investment in training at an individual level. This metric can be computed

81
by dividing the total training cost for an organization by its headcount. The
training expense per employee formula is:
Training Expense per
employee =
Total Training cost
(12) Headcount
Full Time Equivalent (FTE).
Full-time equivalent (FTE) is a unit that indicates the workload of
an employed person in a way that makes workloads comparable across
various contexts. FTE is often used to measure a worker's involvement in a
project, or to track cost reductions in an organization. An FTE of 1.0 means
that the person is equivalent to a full-time worker, while an FTE of 0.5
signals that the worker is only half-time. The ratio of the total number of
paid hours during a period (part time, full time, contracted) by the number
of working hours in that period. The ratio units are FTE units
or equivalent employees working full-time. In other words, one FTE is
equivalent to one employee working full-time. The Full-time
equivalent formula is:
FTE =
Total Number of Paid Hours
during a Period (13)
Number of Working Hours

82
Turnover Rate.
Turnover is an area heavily studied by all organizations to determine
movement out of an organization (separations). Turnover is further
categorized as either voluntary or involuntary. Voluntary turnover
(resignations) is most often studied, as voluntary turnover is typically
greater than involuntary turnover (discharges) and management’s desire to
reduce or maintain turnover at an acceptable level. Turnover is calculated
by dividing the number of terminated employees in a calendar, fiscal year
or other 12 month reporting period by the average number of employees
that calendar, fiscal year or other 12 month reporting period. The Full-
Turnover Rate formula is:
Turnover Rate =
Total Number of Employees who
terminated During the Period
(14) Number of Active Employees
during the Period
Reward per Employee.
Rewards serve many purposes in organization, build a better employment
deal, hold on good employees and to reduce turnover. The principal goal is
to increase people willingness to work in one’s company, to enhance their
productivity. There are two kinds of rewards: Extrinsic rewards: concrete
rewards that employee receive and Intrinsic rewards: tend to give personal
satisfaction to individual Intrinsic rewards makes the employee feel better
in the organization, while Extrinsic rewards focus on the performance and

83
activities of the employee in order to attain a certain outcome. The reward
per employee formula is:
Reward per employees =
Extrinsic Cost
(15) Number of employees
Table (4-1) shows proposed balance scorecard and KPI’s for each
perspective.

84
Table (4-1): Proposed BSC for Paltel Group.
BSC OBJECTIVES KPI’S
Finance
Perspective
Continue leading
the market of
telecommunications
and technology in
Palestine, achieve
growth in
profitability and
financial
performance.
Annual Revenue Per User
(ARPU)
Return On assets (ROA)
Return On Equity (ROE)
Net Profit Margin (NPM)
Current Ratio (CR)
Customer
Perspective
Increase diversity in
value added
services, keep up
with the latest
technological
applications as well
as foster local
innovations and
initiatives in the
field of technology
and its applications.
Offer 3G services
when acquiring the
necessary
frequencies
Focus on the needs
of various segments
of society in line
with the global
technological
development
requirements in
order to meet their
expectations and
interests.
Continue to develop
and modernize the
network to provide
modern services and
Customer Churn
Satisfied Customer Index
Minutes Of Usage
(MOU)
Penetration Rate
Number of subscribers

85
broadband services
with the fastest and
highest quality of
service.
Internal
Process
Perspective
Maintain the highest
levels of efficiency
and productivity
with optimum
utilization of
resources and
capabilities to
achieve excellence
in all services lines:
Mobile, fixed, and
internet/ADSL
services
Time to Market
Cost Per Customer
Marketing Expense Per
Customer
Service coverage
Customer Complaint
Ratio
Learning
and
Growth
Perspective
Increase staff
productivity and
efficiency through
attract and retain
employees and
provide high quality
working
environment.
Employees turnover
Full Time Equivalent
Training expense per
employee
rewards per employee

86
4.3 Strategy Mapping.
Kaplan and Norton (1992a, 1994b, 1996c) introduced three principles that
link an organization’s BSC to its strategy: (1) cause and effect
relationships, (2) performance drivers, and (3) linkage to financial goals.
Strategy maps express causal relationships in a sequence. The chains of
cause-and-effect connect all the factors (i.e., performance indicators)
through the four perspectives of BSC, which reflect dynamically the
change of strategies and indicate how an organization creates its value
(Kaplan and Norton, 2004a, 2004b). Strategy maps are built according to
the four perspectives of the BSC, and they interface between strategy and
the BSC. Strategy maps interpret all causal relationships so that effective
strategies can be developed and deployed and then fulfilled optimally over
time. Hence, strategy maps (the concrete expressions of the causal
relationships of an organization’s strategies) are employed to provide
organizations with ways to create value (Kaplan and Norton, 2004a).
Strategy maps provide a visual framework and a concise description of an
organization’s strategy, and they can convert intangible assets into tangible
outcomes (Banker et al., 2004).
Strategy maps can enhance the ability to define, evaluate, manage, and
implement the desired strategy. Strategic management is to manage and
maintain strategies by tracing execution and explanation of the strategies.
Therefore, a BSC must be adapted to strategy changes. A strategy map
proves that strategies are devised on the basis of dynamic changes over

87
time. Strategy maps are also models for articulating interconnected
strategies before and after strategy implementation.
4.3.1 Principles of Strategy Map.
The strategy map should be based on five principles:
1. Strategy balances contradictory forces. Long-term goals usually
conflict with some short-term goals. Short-term goals can always be
achieved by sacrificing long-term investments. The strategy has to
balance and articulate the short-term financial objectives like
reducing cost with the long-term goals like sustainable income.
2. Strategy is based on a differentiated customer value proposition.
Customers’ satisfaction is the source of sustainable value creation.
Strategy should be based on targeted customer. Strategy is required
to attract and retain targeted customers.
3. Value is created through internal business processes. Internal
processes were classified into clusters: Operations management:
producing and delivering products and services to customers.
Customer management: establishing and leveraging relationships
with customers Innovation: developing new products, services, and
relationships Regulatory and social: meeting or exceeding regulatory
and societal expectations, and building stronger communities. All of
targets in financial and customers perspective described in strategy
map were outcomes which the organization hopes to achieve:
improve productivity and revenue growth, increase shareholder

88
value; increase customers’ acquisition, satisfaction, loyalty, retention
and growth. Internal processes and learning and growth drive the
strategy, and they will facilitate organization to achieve its targets.
4. Strategy consists of simultaneous, complementary themes. Not all
clusters of internal processes deliver value in the same time, actually
every cluster has different points in time. For instance, cost reduction
or quality enhancement can result in improvements in operational
processes in a short time, but an enhanced customer relationship
influences the outcomes in about half year or one year after the
initial investment. The benefits from enhanced regulatory and social
processes come out even further in the future. Strategies should
incorporate one strategic theme with each of the four clusters, and
strategies should be balanced.
5. Strategic alignment determines the value of intangible assets. In a
strategy map, intangible assets are classified into three categories:
Human capital: generally it means people. As with any investment,
people are assets whose value can be enhanced by investment. The
availability of skills, talent, and know-how to perform activities can
contribute to organizations benefit, which also required by the
strategy. Information capital: information systems and knowledge
applications and infrastructure are required to support the strategy.
Organization capital: culture; leadership; alignment and teamwork.
(Kaplan and Norton, 2004, 11-13).
89
4.3.2 Design Strategy Map.
The first generation of BSC broken new ground by combining financial and
non-financial performance measures classified into four perspectives, but it
was not reliable or sufficient to design the organizations strategies due to
its limitations. The strategy map focuses on strategy and vision, and offers
managers an internal insight of organization. By a strategy map, managers
can easily know how to achieve organizations mission and goals by causal-
effect chains of continuous improvements.
Before we design a strategy map, we need to think about what is a good
strategy map. In another words, what are the criteria for a good strategy
map. Hereby, Nounou (2005) pointed out three elementary criteria for a
good strategy map.
Criteria One: right set of objectives. Objectives or KPIs should match
with selected strategy time frame, approved budget, and assigned set of
measures, the level which organization focuses on.
Criteria Two: primary cause and effect relationship should be
distinguished from second degree relationships. The strength of primary
cause-and-effect relationship can be validated during performance
monitoring.
Criteria Three: keep evolving. Cause-and-effect relationship should be
easily tracked and adjusted on time, which makes strategy maps dynamic
by validation and refinement.

90
Based on the factors above, and the analysis in the previous chapter, the
KPIs and their interactions can be visualized as the Figure (4-1).
In this map, we give a rather broad view instead of very detailed linkage for
instance learning and growth specific KPI like increase FTE has a direct
proportion with time to market in internal process and it is reflect directly
to MOU in customer perspective which is return to ARPU. This strategy
map developed by PMC through analyze business process and its
interactions.

91
Figure (4-1): Paltel Group Proposed Strategy Map
Attract and Retain the Right
People
Rewards Management
Employee Turnover
Marketing Expense Per Customer
Service Coverage
Number Of subscribers
Fin
an
cia
l
Pe
rsp
ective
Custo
me
r
Pe
rsp
ective
Inte
rna
l
Pe
rsp
ective
Le
arn
ing
an
d G
row
th
Pe
rsp
ective
Increase Shareholder
Value
Productivity Growth
Net Profit Margin
Return On Assists
Current Ratio
ARPU
Return On Equity
Customer satisfaction
Index
Customer Churn Penetration Rate
High Quality Work
EnvironmentFull Time
EquivalentTraining and Development
Paltel Group Strategy MapEnhance and inspire the innovative environment of our society by building a modern digital Palestine
connected to the World
Customer Complaint Ratio
Time To Market
Cost Per Customer
Minutes Of Usage

92
Chapter 5
Methodology
This chapter presents the application of the AHP method in ranking the
overall performance management and provides performance index for the
group.
5.1 Research Methodology.
5.1.1 Data Collection.
Considering the number of stakeholders in Paltel Group, performance
management committee was formulated heading by CEO, to analyze the
current situation and to cooperate with researcher to develop the proposed
model. The researcher worked with the committee to identify strategic
goals through BSC to measure the overall performance. The committee
consisted of 15 employees, three general managers, six directors, four
managers and two officers. The committee met to prioritize each
perspective of BSC, and KPI’s using AHP methodology.
The study makes an extensive use of both primary and secondary sources
of information from the committee of Paltel Group. The primary sources of
data include information which were gathered from the field. The
secondary sources of data include Paltel Group’s annual reports and
brochures. Data on the profile and operations of the Paltel Group, resource
base of the company, technological advancement as well as operational
challenges and administrative responses of the company were gathered
93
from management and staff of Paltel Group. The proposed methodological
framework for conducting the study could be summarized on follows:
Literature review.
The literature review consists of surveying literature from different types of
sources such as books, articles and journals. Books usually provide
compiled knowledge in a known area and present fully developed theories
and models (Patel and Davidson, 1994). Articles, reports and conference
papers, on the other hand, provide the latest information in an area, since it
takes a long time to publish a book (Patel and Davidson, 1994).
Data Collection Techniques.
This research use several data collection tools and techniques as illustrated
below:
a) Interviews.
Interviews discover information from stakeholders by talking with them
directly (i.e. CEO’s, Directors, Managers, and Key Staff). Interviews are
performed by asking prepared and natural questions and recording the
responses.
b) Observations .
Observations are collected in different ways and the versatility of
observation makes it a central method for collecting primary data and a
supplement for other data collection methods (Blumberg et al., 2005). An
94
observation, is systematically planned and executed with the use of proper
controls that provides a reliable and valid account of what happened
(Blumberg et al., 2005).
c) Focus groups.
Focus groups bring together key stakeholders and subject matter experts
which is consultant from international consultancy firm and researcher to
determine the BSC indicators of four perspectives and distribute KPI’s.
d) Empirical Survey (Questionnaires).
A questionnaire is designed with a conventional AHP questionnaire format
(nine-point scale and pairwise comparison) based on the hierarchy. Fifteen
questionnaires were distributed to performance management committee of
Paltel Group.
5.1.2 Data Analysis.
Analytical Hierarchy Process.
Data analysis was done by using AHP method using Excel sheet developed
by Klaus D. Goepel, http://bpmsg.com. The weight for calculation in AHP
method is attained from the questionnaires that have been filled by
respondents.
The procedures of AHP to measure business performance involve six
essential steps Cheng, 1999; Lee, Kang, and Wang, 2006; Lee, in press;
Murtaza, 2003; Zahedi, 1986):

95
Step1: Define the unstructured problem and state clearly the
objectives and outcomes.
Step2: Decompose the problem into a hierarchical structure with
decision elements (e.g., criteria and alternatives).
Step3: Employ pairwise comparisons among decision elements and
form comparison matrices.
Step4: Use the eigenvalue method to estimate the relative weights of
the decision elements.
Step5: Check the consistency property of matrices to ensure that the
judgments of decision makers are consistent.
Step6: Aggregate the relative weights of decision elements to obtain
an overall rating for the alternatives.
5.2 AHP Implementation.
Step1: Define the unstructured problem and state clearly the objectives
and outcomes.
The goal is to measure Paltel Group business performance. So, this goal is
placed at the top of the hierarchy. The hierarchy descends from the more
general criteria in the second level which are the four perspective of
balance scorecard which are finance, customer, internal process, and
learning. It is important to identify those criteria that are absolutely
necessary to adequately define all relevant and important aspects of the

96
goal. Then, we define KPI’s for each cluster based on its inherit
perspective, as described in the Table (5-1):
Table (5-1): BSC Perspectives and KPI’s.
Goal: Measure Paltel Group business performance
F Financial perspective F1 Annual Revenue Per User
(ARPU)
F2 Return On assets (ROA)
F3 Return On Equity (ROE)
F4 Net Profit Margin (NPM)
F5 Current Ratio (CR)
C Customer Perspective C1 Customer Churn
C2 Satisfied Customer Index
C3 Penetration Rate
C4 Minutes of Usage
C5 Number of Subscribers
P Internal Process Perspective P1 Time to Market
P2 Cost per customer
P3 Market expense per
customer
P4 Service coverage
P5 Customer complaint ratio
L Learning and Growth
Perspective
L1 Employees turnover
L2 Training expense per
employee
L3 Rewards expense per
employee
L4 Full Time Equivalent

97
Step2: Decompose the problem into a hierarchical structure with
decision elements (e.g., criteria and alternatives).
When relationships become too numerous or complex for the human mind
to intuitively grasp, it may become necessary to organize the relationships
into a graphical representation (Saaty, Thomas 2008). For these reasons,
construction of the hierarchy is the most critical aspect in the AHP.
With the hierarchy of the problem, appropriately decomposed into
actionable elements linked to the highest level goals, it is necessary to
gather information as to the impact of the relationships between the various
levels. This action performed by PMC through focus groups with the
researcher which aims of prioritization matrix which represent the
importance values of organization drivers and relationship matrix that gives
the mapping between the actionable items in different levels of the
decomposition hierarchy.
Figure (5-1) reflects the designed hierarchy process and the relation for
each other.
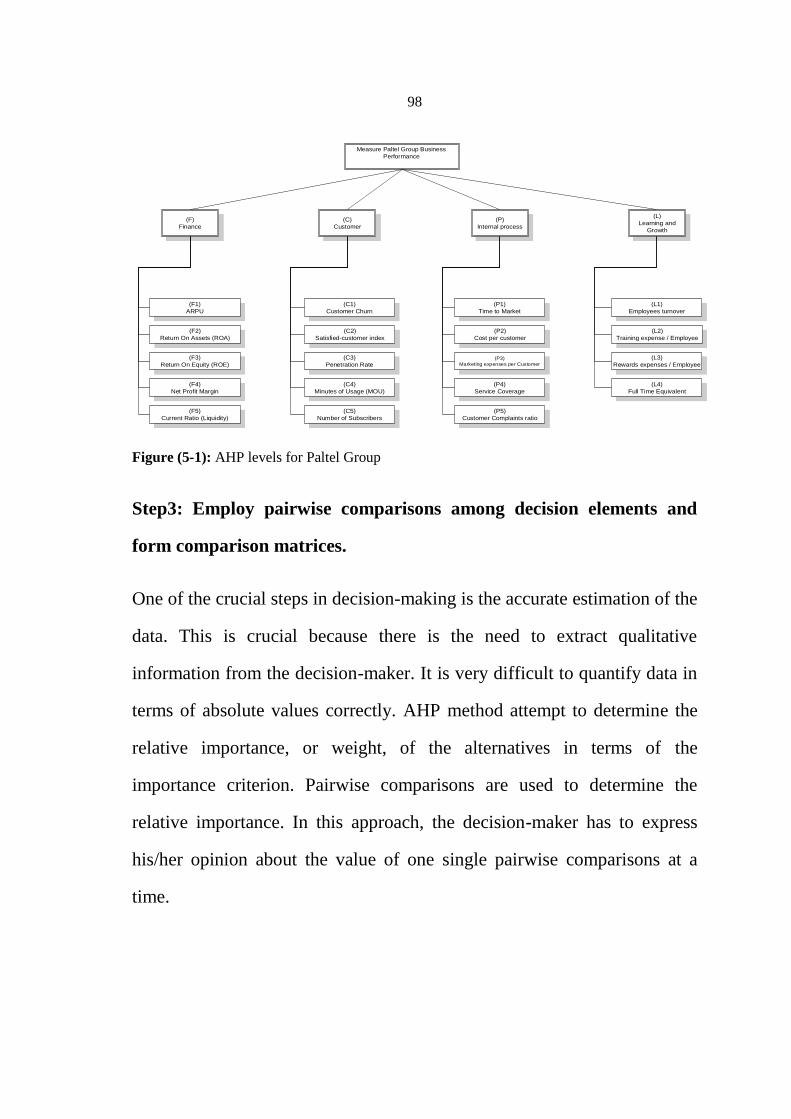
98
Figure (5-1): AHP levels for Paltel Group
Step3: Employ pairwise comparisons among decision elements and
form comparison matrices.
One of the crucial steps in decision-making is the accurate estimation of the
data. This is crucial because there is the need to extract qualitative
information from the decision-maker. It is very difficult to quantify data in
terms of absolute values correctly. AHP method attempt to determine the
relative importance, or weight, of the alternatives in terms of the
importance criterion. Pairwise comparisons are used to determine the
relative importance. In this approach, the decision-maker has to express
his/her opinion about the value of one single pairwise comparisons at a
time.
Measure Paltel Group Business
Performance
(F)
Finance
(C)
Customer
(P)
Internal process
(L)
Learning and
Growth
(F1)
ARPU
(F2)
Return On Assets (ROA)
(F3)
Return On Equity (ROE)
(F4)
Net Profit Margin
(F5)
Current Ratio (Liquidity)
(C1)
Customer Churn
(C2)
Satisfied-customer index
(C3)
Penetration Rate
(C4)
Minutes of Usage (MOU)
(C5)
Number of Subscribers
(P1)
Time to Market
(P2)
Cost per customer
(P3)
Marketing expenses per Customer
(P4)
Service Coverage
(L1)
Employees turnover
(L2)
Training expense / Employee
(L3)
Rewards expenses / Employee
(L4)
Full Time Equivalent
(P5)
Customer Complaints ratio

99
The judgement in AHP is to define which element is more important in
each pair of criteria. The committee using scale for pairwise comparisons
shown in Table (5-2).
For instance, comparing element A against element B, this is the
judgement: “How strongly important is element A than element B?”.
The ratio assessment is the activity conducted in the second stage, which is
done by acquiring opinions from PMC to compare each key performance
indicator that has been measured by giving the score 1–9, Table (5-2). The
result from respondents’ opinion is then analyse by using the AHP method.
Table (5-2): Scale for pairwise comparisons
Intensity of
Importance
Definition Explanation
1 Equal Importance Two activities contribute equally
to the objective
3 Moderate
Importance
Experience and judgment slightly
favor one activity over another
5 Strong
Importance
Experience and judgment strongly
favor one activity over another
7 Very Strong
Importance
An activity is favored very
strongly over another; its
dominance demonstrated in
practice.
9 Extreme
Importance
The evidence favoring one activity
over another is of the highest
possible order of affirmation
2, 4, 6, 8 For compromise
between the
above values
Sometimes one needs to
interpolate a compromise
judgment numerically because
there is no good word to describe
it.

100
The relative values are inserted in an (n x n) matrix, where n is the number
of the criteria. By convention, the comparison is always done with the
element in the column, on the left, against an element in the row, on top.
For instance, in Table (5-3), the comparisons are done as the pairs: Criteria.
1 with Criteria. 2, Criteria.1 with Criteria. 3, Criteria. 1 with Criteria. 4,
until the end of the first row. After that, the second row is evaluated and so
on. This is a recommendation to the execution of the comparisons to make
it easier and ordered. The number of comparisons is defined by:
⋅ (n
is the number of elements).
For instance, if there are 5 criteria to be compared:
= 10, which
means that 10 comparisons are necessary.
Table (5-3): Pairwise comparisons example.
Criteria
1
Criteria
2
Criteria
3
Criteria
4
Criteria
5
Criteria 1 3 3 5 1
Criteria 2 1/3 5 3 1/3
Criteria 3 1/3 1/5 3 1/3
Criteria 4 1/5 1/3 1/3 1/3
Criteria 5 1 3 3 3

101
Pairwise comparison for Balance Scorecard perspective:
The committee met to prioritize each perspective of BSC and KPI’s, and
the result were as shown in Table (5-4).
The consolidated decision matrix combines all k participants’ inputs to get
the aggregated group result. We use the weighted geometric mean of the
decision matrices elements aijk, using the individual decision maker’s
weight wk as given in equation (16):
(16)
Table (5-4): Consolidated Pairwise comparison for Balance scorecard
Finance Customer Internal
Process
Learning
and
Growth
1 2 3 4
Finance 1 1.09 1.4 1.69
Customer 2 0.91 1.14 1.81
Internal Process 3 0.72 0.88 1.6
Learning and Growth 4 0.59 0.55 0.63

102
Table (5-5): Consolidated Pairwise comparison for Financial
Perspective KPI’s.
ARPU Return
On
Assets
Return
On
Equity
Net
Profit
Margin
Current
Ratio
1 2 3 4 5
ARPU 1 1.24 0.71 1.25 1.73
Return On Assets 2 0.81 0.81 1.02 1.8
Return On Equity 3 1.41 1.24 1 1.53
Net Profit Margin 4 0.8 0.98 1 1.9
Current Ratio 5 0.58 0.56 0.65 0.53
Table (5-6): Consolidated Pairwise comparison for customer
Perspective KPI’s .
Customer
churn
Satisfied
Customer
Index
Penetration
Rate
Minutes
Of Usage
Number
of
Subscribers
1 2 3 4 5
Customer
churn 1 0.98 0.64 1.4 0.94
Satisfied
Customer
Index
2 1.02 1.02 1.89 1.09
Penetration
Rate 3 1.56 0.98 2.18 1.27
Minutes Of
Usage 4 0.71 0.53 0.46 0.73
Number of
Subscribers 5 1.06 0.92 0.79 1.37

103
Table (5-7): Consolidated Pairwise comparison for Internal Process
Perspective KPI’s.
Time
To
Market
Cost per
customer
Market
expense per
customer
Service
coverage
Customer
complaint
ratio
1 2 3 4 5
Time to
Market 1 1.2 1.77 1.7 1.17
Cost per
customer 2 0.83 1.14 1.12 1.39
Market
expense per
customer
3 0.57 0.88 1.28 1.15
Service
coverage 4 0.59 0.89 0.78 0.86
Customer
complaint
ratio
5 0.85 0.72 0.87 1.16
Table (5-8): Consolidated Pairwise comparison for Learning and
Growth Perspective KPI’s .
Employee
turnover
Training
expense per
employee
Rewards
expense per
employee
Full Time
Equivalent
1 2 3 4
Employee
turnover
1 0.92 0.68 0.81
Training expense
per employee
2 1.09 0.58 0.52
Rewards expense
per employee
3 1.47 1.71 1.27
Full Time
Equivalent
4 1.24 1.91 0.79

104
Step4: Use the eigenvalue method to estimate the relative weights of
the decision elements.
Pair wise comparisons among n elements in each level lead to an
approximation of each aij=wi/wj which is the ratio of the weight of element
i to element j. The estimated weight vector w is found by solving the
following eigenvector problem: Aw=λmaxw, where the matrix A consists of
aij’s, and λmax is the principal eigenvalue of A. If there is no inconsistency
between a pair of elements, then aij is equal to 1/ aij for any i and j. The
result is that λmax = n and we have, Aw=nw, where n is the number of
elements in each row. Written out more fully this matrix equation become
as follows:
A1 A2 - - - - An
W1
W2
A1
- - - -
W1
A2
- - - -
X =n W2
(17)
- - - - - - -
An
- - - -
Wn
Wn
Or
A1 A2 - - - - An
W1
W2
A1 a12 - - - - a1n
W1
A2
1 - - - - A2n X
=
λmax W2
- - - - - - -
An
- - - - 1
Wn
(18)
Wn
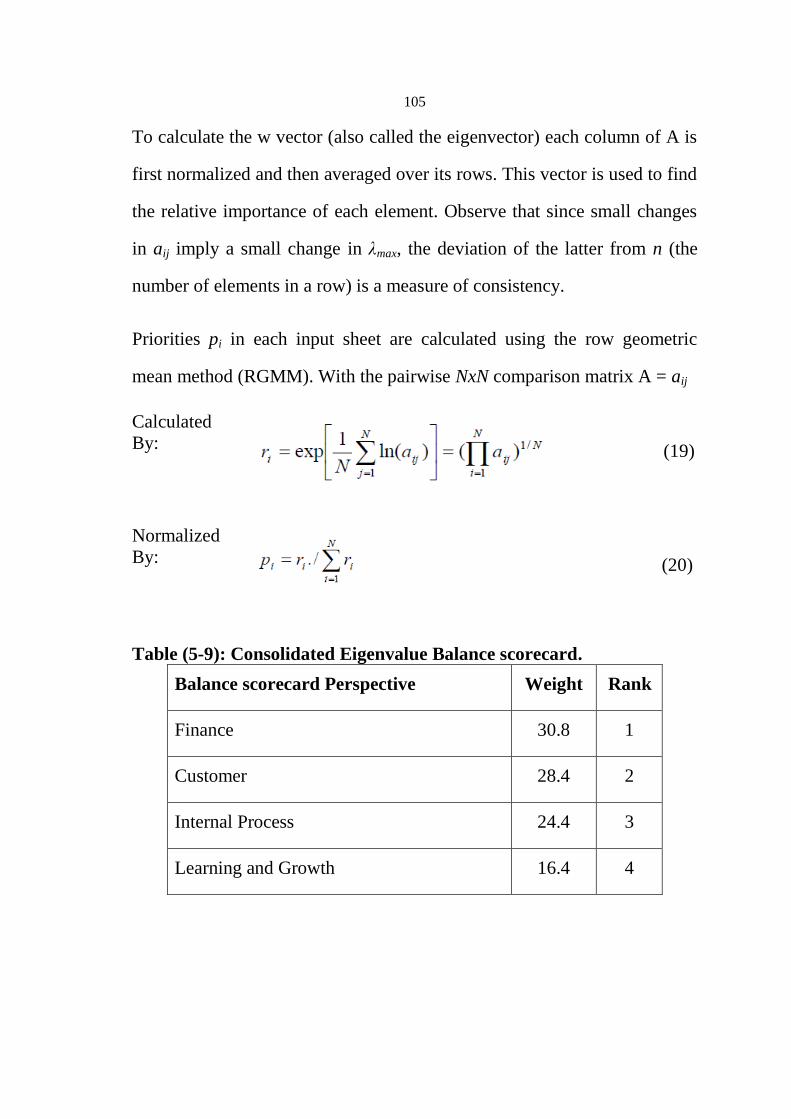
105
To calculate the w vector (also called the eigenvector) each column of A is
first normalized and then averaged over its rows. This vector is used to find
the relative importance of each element. Observe that since small changes
in aij imply a small change in λmax, the deviation of the latter from n (the
number of elements in a row) is a measure of consistency.
Priorities pi in each input sheet are calculated using the row geometric
mean method (RGMM). With the pairwise NxN comparison matrix A = aij
Calculated
By:
(19)
Normalized
By:
(20)
Table (5-9): Consolidated Eigenvalue Balance scorecard.
Balance scorecard Perspective Weight Rank
Finance 30.8 1
Customer 28.4 2
Internal Process 24.4 3
Learning and Growth 16.4 4
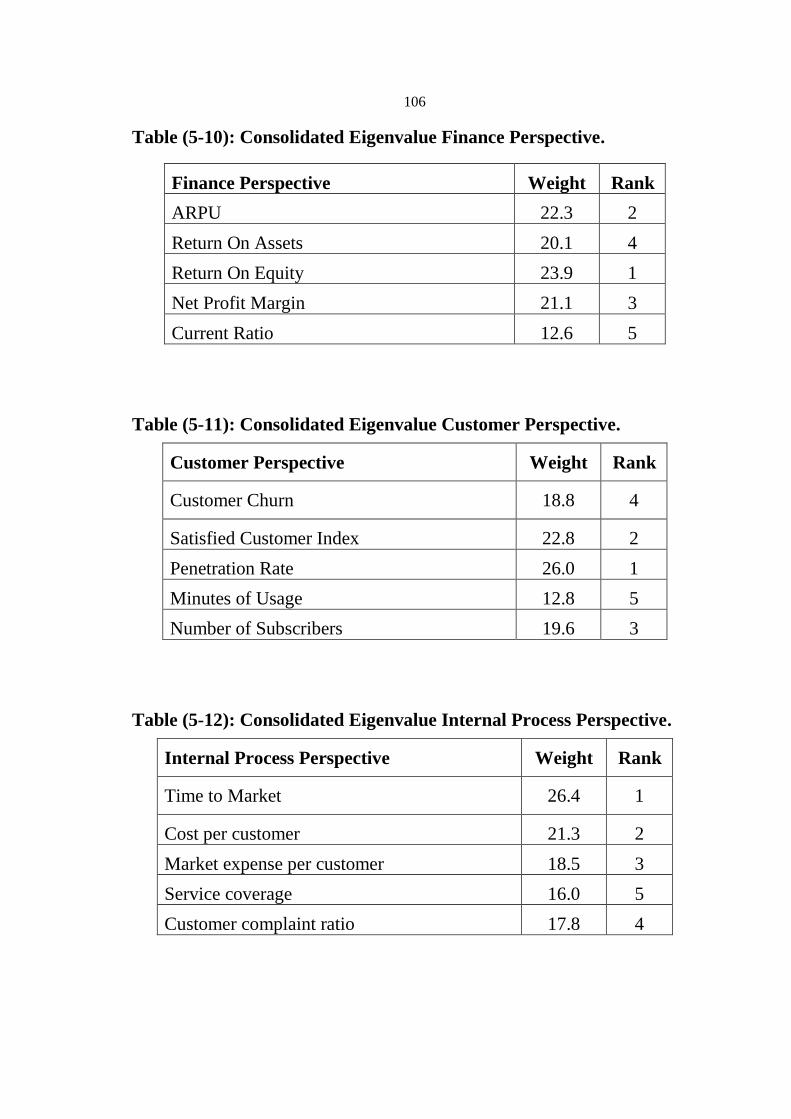
106
Table (5-10): Consolidated Eigenvalue Finance Perspective.
Finance Perspective Weight Rank
ARPU 22.3 2
Return On Assets 20.1 4
Return On Equity 23.9 1
Net Profit Margin 21.1 3
Current Ratio 12.6 5
Table (5-11): Consolidated Eigenvalue Customer Perspective.
Customer Perspective Weight Rank
Customer Churn 18.8 4
Satisfied Customer Index 22.8 2
Penetration Rate 26.0 1
Minutes of Usage 12.8 5
Number of Subscribers 19.6 3
Table (5-12): Consolidated Eigenvalue Internal Process Perspective.
Internal Process Perspective Weight Rank
Time to Market 26.4 1
Cost per customer 21.3 2
Market expense per customer 18.5 3
Service coverage 16.0 5
Customer complaint ratio 17.8 4

107
Table (5-13): Consolidated Eigenvalue Learning and growth
Perspective.
Learning and growth Perspective Weight Rank
Employee turnover 20.5 3
Training expense per employee 18.5 4
Reward expense per employee 32.4 1
Full Time Equivalent 28.6 2
Step5: Check the consistency property of matrices to ensure that the
judgments of decision makers are consistent.
The consistency of a set of pairwise comparisons considered before we
accept the weights generated by this process. Consider the situation
proposed earlier where the committee assessed factor one as four times as
important as factor two. If the decision maker considered factor two twice
as important as factor three, then factor one should be preferred eight times
over factor three. This is an example of perfect consistency with respect to
strength of preference, but perfect consistency is not guaranteed due to the
human aspect of the process.
According to Taylor III (2002:379), each human beings ideally wants
consistent decision. On the contrary, there are many cases in which the
decision makers cannot make perfectly consistent decisions.
The AHP method can tolerate the inconsistency by providing the
measurement of assessment inconsistency. This measurement is one of the
important elements in priority determination process according to pairwise

108
comparison. The higher consistency ratio, the more inconsistent assessment
result. The acceptable consistency ratio is less than or equal to 10 percent,
although in some cases the consistency ratio which is higher than 10
percent is still considered acceptable (Forman dan Selly, 2001: 70).
According to Taylor III (2002: 379), Consistency Index (CI) can be
calculated by using formula (21).
(21)
This is a suitable equation for measuring the accuracy for two reasons.
First, small changes to non-diagonal elements in a positive reciprocal
matrix will lead to only small changes in the eigenvalues. Second, the n
eigenvalues of an n × n matrix with diagonal entries of one will always sum
to n. Thus, the more consistent a matrix is, the less the aij entries will
deviate from their actual values and the closer will be to n. For different
values of n, Saaty and others have computed the Consistency Index for a
large number of matrices with random entries and averaged these results to
produce the Random Index (RI). Saaty defines the consistency ratio for a
matrix as equation (22).
(22) RI
CICR
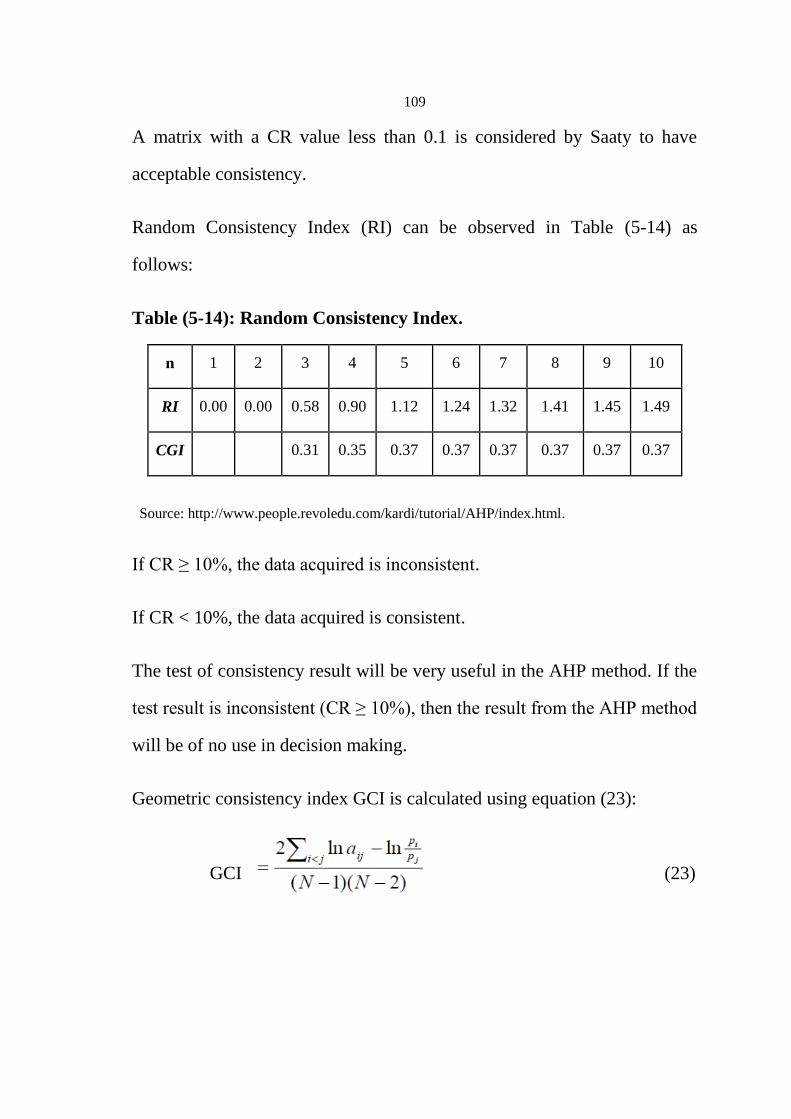
109
A matrix with a CR value less than 0.1 is considered by Saaty to have
acceptable consistency.
Random Consistency Index (RI) can be observed in Table (5-14) as
follows:
Table (5-14): Random Consistency Index.
n 1 2 3 4 5 6 7 8 9 10
RI 0.00 0.00 0.58 0.90 1.12 1.24 1.32 1.41 1.45 1.49
CGI 0.31 0.35 0.37 0.37 0.37 0.37 0.37 0.37
Source: http://www.people.revoledu.com/kardi/tutorial/AHP/index.html.
If CR ≥ 10%, the data acquired is inconsistent.
If CR < 10%, the data acquired is consistent.
The test of consistency result will be very useful in the AHP method. If the
test result is inconsistent (CR ≥ 10%), then the result from the AHP method
will be of no use in decision making.
Geometric consistency index GCI is calculated using equation (23):
GCI
(23)

110
Description:
n = Amount of items compared
wi = Weight
ci = Sum of column
CR = Consistency Ratio
CI = Consistency Index
RI = Random Consistency Index
GCI = Geometric consistency index
Table (5-15): Consistency ratio Balance scorecard and perspectives.
α Lambda GCI CR
Balance scorecard 0.1 4.007 0.01 0.3
Finance 0.1 5.043 0.04 1.0
Customer 0.1 5.019 0.02 0.4
Internal Process 0.1 5.036 0.03 0.8
Learning and Growth 0.1 4.028 0.04 1.0
Step6: Aggregate the relative weights of decision elements to obtain an
overall rating for the alternatives.

111
Table (5-16) shows Priorities BSC perspectives and KPI’s based on AHP. Goal: Measure Paltel Group business performance
Main
criteria
Global
Weight
Sign Sub criteria Local
Weight
Final
weight
Rank
F Financial
perspective
30.8% F1 Annual Revenue Per
User (ARPU) 0.223 6.87% 3
F2 Return On assets
(ROA) 0.201 6.19% 7
F3 Return On Equity
(ROE) 0.239 7.36% 2
F4 Net Profit Margin
(NPM) 0.211 6.50% 4
F5 Current Ratio (CR) 0.126 3.88% 16
Customer
Perspective
28.4% C1 Customer Churn 0.188 5.34% 9
C2 Satisfied Customer
Index 0.228 6.48% 5
C3 Penetration Rate 0.260 7.38% 1
C4 Minutes of Usage 0.128 3.64% 17
C5 Number of
Subscribers 0.196 5.57% 8
P Internal
Process
Perspective
24.4% P1 Time to Market 0.264 6.44% 6
P2 Cost per customer 0.213 5.20% 11
P3 Market expense per
customer 0.185 4.51% 13
P4 Service coverage 0.160 3.90% 15
P5 Customer complaint
ratio 0.178 4.34% 14
Learning
and Growth
Perspective
16.4% L1 Employees
turnover 0.205 3.36% 18
L2 Training expense
per employee 0.185 3.03% 19
L3 Reward expense
per employee 0.324 5.31% 10
L4 Full Time
Equivalent 0.286 4.69% 12
112
5.3 Business Performance Management Dashboard.
BPM dashboard designed to enable senior executives to execute strategy,
manage performance, and drive new or optimal behaviours across the
group. They are primarily designed to facilitate monthly strategic review or
operational planning sessions and help executives collaborate on ways to
fix problems or exploit opportunities. BPM dashboard focuses on helping
Paltel Group to chart a new strategic direction.
Performance targets have time frames, which affects how KPI’s are
calculated and displayed. Establish annual targets for key processes and
initiatives, to keep employees on track to achieve those long-term targets,
Paltel Group can divide time frames into intervals that are measured on a
more frequent basis. Targeted improvement each quarter affected by season
such as summer as number of visitors increased during this period, groups
may back-weight the targets toward the end of the year.
The goals associated with KPIs are known as targets because they specify a
measurable outcome rather than a conceptual destination. Ideally, through
AHP and collaboration with buy-in can attain more accurate targets.
Targets can also be set by a KPI team charged with translating strategic
objectives into a performance plan.
The proposed dashboards enables the Paltel group to evaluate performance
difference in each period separately. Since the measures used in the model
are in different kinds it is nearly impossible to evaluate the observe

113
performance with each other. But in the model, each observed value is
normalized according to the goals so that a performance score is calculated
which can be used to comparison. Observe the improvements that take
place between the measurement periods. Moreover, the capability to
calculate a single performance level which indicates the overall
performance.
Table (5-17): Business Performance Management dashboard for Paltel
Group.

114
Table (5-17) : Business Performancec Management dashboard for Paltel Group.
Goal: Measure Paltel Group business performance
Main criteria Global Weight Sign Sub criteria Local Weight Final weight Rank Target Actual Performance
Result
Achievemen
t
F Financial
perspective
30.8% F1 Annual Revenue Per User
(ARPU) 0.223 6.85% 3 100 94 6.46% 94.00%
F2 Return On assets (ROA) 0.201 6.17% 7 0.187 0.15 4.97% 80.21%
F3 Return On Equity (ROE) 0.239 7.34% 2 0.25 0.238 7.01% 95.20%
F4 Net Profit Margin (NPM) 0.211 6.48% 4 0.23 0.2204 6.23% 95.83%
F5 Current Ratio (CR) 0.126 3.87% 16 1.5 1.6 4.14% 106.67%
Finance performance Index is: 28.80% 93.50%
C Customer
Perspective
28.4% C1 Customer Churn 0.188 5.34% 9 0.29 0.34 4.55% 85.29%
C2 Satisfied Customer Index 0.228 6.48% 5 0.7 0.65 6.01% 92.86%
C3 Penetration Rate 0.260 7.38% 1 0.72 0.7 7.18% 97.22%
C4 Minutes of Usage 0.128 3.64% 17 0.8 0.64 2.91% 80.00%
C5 Number of Subscribers 0.196 5.57% 8 2.7 2.65 5.46% 98.15%
Customer performance Index is: 26.12% 91.96%
P Internal Process
Perspective
24.4% P1 Time to Market 0.264 6.44% 6 136 142 6.17% 95.77%
P2 Cost per customer 0.213 5.20% 11 99 124 4.15% 79.84%
P3 Market expense per customer 0.185 4.51% 13 41 52 3.56% 78.85%
P4 Service coverage 0.160 3.90% 15 0.95 0.95 3.90% 100.00%
P5 Customer complaint ratio 0.178 4.34% 14 0.072 0.0608 3.67% 84.44%
Internal Process performance Index is: 21.45% 87.91%
L Learning and
Growth
Perspective
16.4% L1 Employees turnover 0.205 3.38% 18 0.04 0.037 3.63% 108.11%
L2 Training expense per employee 0.185 3.05% 19 800 731 2.77% 91.38%
L3 Reward expense per employee 0.324 5.37% 10 20452 19650 5.53% 104.08%
L4 Full Time Equivalent 0.286 4.72% 12 210 324 3.04% 64.81%
Learning and Growth performance Index is: 14.98% 91.33%
Paltel Group business performance Index is: 91.34%
115
Chapter 6
Corrective Actions and Conclusion
This Chapter covers the final reflections of this thesis. The final result of
the thesis analysis presented with respect to the data collected from the
company and proposed corrective actions. Also, conclusions and
recommendations included in this chapter.
6.1 Corrective Actions.
The relative weights for each performance measure constructed in previous
Chapter facilitate the development of an index to track the Group’s
progress in execution its strategy. From the relative weight of each
performance measure to the Group’s overall goal, we can assess the
relative effect of the change in a performance measure from one period to
the next on the Group’s overall performance. By tracking each performance
measure individually, from period to period, and then collectively
quantifying the relative effect of the change in each performance measure,
we can construct an index to monitor the firm’s progress against its
mission.
The final weights and priorities obtained from the above application for the
selected indicators have been provided in the Table (5-17). In addition,
based on the obtained results from this research, the ranking of BSC
perspectives are presented in Table (5-17). The results of the main criteria
in BSC - ranking indicates the first rank for the “Finance perspective” with

116
30.8%, the second for “Customer perspective” with 28.4%, the third rank
for “Internal process perspective” with 24.4% and the fourth rank is
“Learning and growth perspective” with 16.4%.
It should be noted that after opinion poll with the Paltel Group’s committee
to prioritize KPI’s based on Table (5-17) using verbal scales of Cheng
Yung and Huwang (1999), each performance indicator is given a
quantitative value. Then for each criteria we determine the target and actual
performance value and multiply each KPI value with final weight, we then
aggregate all values for all indicators and perspectives to calculate the
overall performance value for Paltel Group and then the business
performance index is: 91.34%.
Therefore, by using the proposed model group, can identify the
achievements level for each perspective, in Table (5-17) Paltel Group’s
achieved in finance, customer, internal process and Learning and Growth
perspectives for each by order, 93.5%, 91.96%, 87.91%, and 91.33%
respectively.
6.2 Conclusion.
Dynamicity environment of telecommunication industry, high-level of
competition and increased customers' expectations has made necessity of
getting awareness of attaining a comprehensive performance evaluation,
confident, trustable and flexible. Paltel Group as a market leader in
Palestine, should take advantage of methods and patterns consecutively
117
with the aim of consecutive evaluation and improvement of their
performance.
This study found BPM incredible method as it is helps organizations to
plan, monitor, analyse, and manage business more effectively by providing
a comprehensive view for enterprise. With a shared purpose, a consistent
data model, real-time information, easy-to-use tools, and streamlined
processes, it’s much simpler to align operational procedures with strategy.
And through increased insight, make faster decisions and boost
performance to achieve business goals.
BPM can help an organization to focus on the key drivers of value as they
relate to corporate strategy and specific organizational processes. BPM
provides fact-based guidance for value-based decision making. Even more
important, it enables a consistent process and framework for evaluating
trade-offs related to investment by offering an integrated perspective of
past, present, and future performance. By linking planning and forecasting
to predictive and dynamic resource allocation, a company can deploy
resources more effectively. BPM is a key tool for ensuring that the work
employees do every day translates clearly into strategic value. In addition,
if a company has a reliable measure of its performance, its executives can
easily map that result against the performance of its competitors in the
marketplace and quickly and confidently respond.

118
This research has contributed to providing decision makers with a
systematic approach for establishing a visual strategy map with a
consideration of the involved causal relationships among KPIs. The BSC
strategy map construction framework proposed in this research would be a
useful and valuable reference for other organizations, as BSC vary from
organization to organization. Strategic analysis is performed to create
logical links between the KPIs based on the content of the BSC evaluation
criteria that are most appropriate for telecom industry performance.
Based on our research, we can see that strategy map which we built will
solve some problems which have been existing in Paltel Group. Therefore
we think BSC and strategy map should work together to help company to
achieve the strategy goals, and use them in a complementary way.
This research proposes an approach based on the AHP and BSC for
evaluating the performance of Paltel Group, The analytic hierarchy is
structured by the four major perspectives of the BSC including financial,
customer, internal business process, and learning and growth, followed by
performance indicators. Because human decision-making process usually
contains fuzziness and vagueness, the AHP is adopted to solve the problem.
A well-organized AHP information system is constructed to facilitate the
solving process. It is our belief that AHP has reached the compromise and
will be useful for many other cases as it has been in the past. In particular,
AHP has broken through the academic community to be widely used by
119
practitioners. This widespread use is certainly due to its ease of
applicability and the structure of AHP which follows the intuitive way in
which managers solve problems. The hierarchical modelling of the
problem, the possibility to adopt verbal judgements and the verification of
the consistency are its major assets.
In this research we recommend to establish Business Performance
Management Office, which actively guide Paltel Group of strategy
management or in organizing strategic planning activities, and in
developing plans, objectives and performance measures to ensure
execution. The main responsibility of this office is to prepare and animate
strategic planning workshops, accounting for and managing the
expectations of multiple stakeholders involved in the planning process,
while ensuring alignment of Paltel Group’s direction with business sector
and support unit priorities, identifying strategic objectives, key
performance indicators, targets, and developing performance dashboards,
Effectively monitoring the integrity of results reported, and Preparing and
presenting performance dashboards and other strategic performance
communications tools, both internally and externally.
6.3 Suggestion for Future Research.
As stated before, the purpose of this research is to develop business
performance management model and develop a Balanced Scorecard into a
Strategy map and prioritize perspectives and KPI’s using AHP

120
methodology. Future research on the adaptability of AHP method in
different types of organizations. Also, considers operational issues not only
from an upper-managements perspective, it would be important to evaluate
details of the operational issues. Moreover, investigations of performance
management crisis situation.

121
References
1. Abran, A., Buglione, L., 2003. A multidimensional performance
model for consolidating Balanced Scorecards. Advances in
Engineering Software.
2. Algera, J.A., De Haas, M., 2002. Performance management at
different organizational levels. In: Pritchard R.D., Holling H.,
Lammers F., Clark B.D. (Eds.), 2002. Improving organisational
performance with the productivity measurement and enhancement
system: an international collaboration, Nova Science, New York.
3. Amaratunga, D., Baldry, D., 2002. Moving from performance
measurement to performance management. Facilities.
4. Balanced Scorecards and Operational Dashboards with Microsoft
Excel by Ron Person (Dec 22, 2008).
5. Ballard, C. White, S. McDonald, J. Myllymaki, S. McDowell, O.
Goerlich, and A. Neroda. Business Performance Management...
Meets Business Intelligence, 2005.
6. Best Practices in Planning and Performance Management: Radically
Rethinking Management for a Volatile World (Wiley Best Practices) by
David A. J. Axson (Aug 2, 2010).

122
7. Beyond Performance Management: Why, When, and How to Use 40
Tools and Best Practices for Superior Business Performance by
Jeremy Hope and Steve Player (Feb 7, 2012).
8. Bititci, U.S, Turner, T., Begemann, C., 2000. Dynamics of
Performance Measurement Systems, International Journal of
Operations and Production Management.
9. Bourne, M., Mills, J., Wilcox, M., Neely, A.D., 2000. Designing,
Implementing and updating Performance Measurement Systems,
International Journal of Operations and Productions Management.
10. Bourne, M., Neely, A.D., 2003. Implementing Performance
Measurement Systems: a literature review. International Journal of
Business Performance Management.
11. Brodjonegoro, Bambang P.S (1992). Analytical Hierarchy Process,
Pusat Antar Universitas – Studi Ekonomi Universitas Indonesia
(unpublished).
12. Corporate Performance Management: How to build a better
organization through measurement-driven, strategic alignment
(Improving Human Performance) by David Wade and Ron Recardo
(Jun 29, 2001).

123
13. Damodaran, Aswath (2002). Investment Valuation: Tools and
Techniques for Determining the Value of Any Asset (Second
edition). New York: John Wiley and Sons, Inc.
14. Eckerson, W. (March 2004). Best practices in business performance
management: Business and technical strategies. TDWI The Data
Warehousing Institute Report Series, 1–31.
15. Five Key Principles of Corporate Performance Management by Bob
Paladino (Jan 22, 2007).
16. Harvard Business Essentials: Performance Management: Measure
and Improve the Effectiveness of Your Employees by Richard
Luecke (Apr 1, 2006) .
17. Investigating the relationship between the business performance
management framework and the Malcolm Baldrige National
Quality Award framework.
18. Jones. Charles P. et al (2009). Investment: Analysis and Management
(An Indonesian Adaptation). Singapore: John Wiley and Sons (Asia)
Pte. Ltd.
19. Keown, Arthur J. et al. (2005). Financial Management, (Tenth
Edition). New Jersey: Pearson Prentice-Hall, Inc.

124
20. Liedtka, Stephen L. (2005). The Analytic Hierarchy Process and
Multi-Criteria Performance Management Systems.
www.mdm.gwu.edu. 20 Juni 2009.
21. PALTEL annual report, 2008-2013 (www.paltelgroup.ps )
22. Performance Management (2nd Edition) by Herman Aguinis
(Jan 27, 2008) .
23. Performance Management: Integrating Strategy Execution,
Methodologies, Risk, and Analytics (Wiley and SAS Business) by
Gary Cokins (Apr 6, 2009) .
24. Performance, Creating the Performance-Driven Organization, Mark
A. Stiffler, 2006.
25. Seputro, Hery. (2008). (s.scribd.com/doc/2908406/Modul-6-Analytic-
Hierarchy-Process/ Download Date: 21 Juni 2009).
26. Smart Enterprise Performance, Management Strategies for
Uncertain Times, An Oracle White Paper, August 2009.
27. Strategic management: concepts and cases / Fred R. David.—13th ed,
2011.
28. Heinz Weihrich, “The TOWS Matrix: A Tool for Situational
Analysis,” Long Range Planning 15, no. 2 (April 1982): 61. Note:
Although Dr. Weihrich first modified SWOT analysis to form the
TOWS matrix, the acronym SWOT is much more widely used than
TOWS in practice.

125
Appendices
Appendices 1: Pairwise Comparison from Balance Scorecard
Perspective:
15 = k number of participants
Consolidated = Weighted geometric mean off participants
4 = n number of criteria
C Consolidated 1 Participant 1 1 1/0/1900
1 2 3 4 5 6 7 8 9 10
1 2 3 4 5 6 7 8 9 10
1 1.09 1.4 1.69 0 0 0 0 0 0 1 1 1 5 5 0 0 0 0 0 0
2 0.91 1.14 1.81 0 0 0 0 0 0 2 1 1 3 3 0 0 0 0 0 0
3 0.72 0.88 1.6 0 0 0 0 0 0 3 1/5 1/3 1 3 0 0 0 0 0 0
4 0.59 0.55 0.63 0 0 0 0 0 0 4 1/5 1/3 1/3 1 0 0 0 0 0 0
5 0 0 0 0 0 0 0 0 0 5 0 0 0 0 1 0 0 0 0 0
6 0 0 0 0 0 0 0 0 0 6 0 0 0 0 0 1 0 0 0 0
7 0 0 0 0 0 0 0 0 0 7 0 0 0 0 0 0 1 0 0 0
8 0 0 0 0 0 0 0 0 0 8 0 0 0 0 0 0 0 1 0 0
9 0 0 0 0 0 0 0 0 0 9 0 0 0 0 0 0 0 0 1 0
10 0 0 0 0 0 0 0 0 0 10 0 0 0 0 0 0 0 0 0 1
2 Participant 2 1 1/0/1900 3 Participant 3 1 1/0/1900
1 2 3 4 5 6 7 8 9 10
1 2 3 4 5 6 7 8 9 10
1 1 1/5 1/3 3 0 0 0 0 0 0
1 1 1/9 1/3
1/5 0 0 0 0 0 0
2 5 1 3 7 0 0 0 0 0 0 2 9 1 3 3 0 0 0 0 0 0
3 3 1/3 1 5 0 0 0 0 0 0 3 3 1/3 1 3 0 0 0 0 0 0
4 1/3 1/7 1/5 1 0 0 0 0 0 0 4 5 1/3 1/3 1 0 0 0 0 0 0
5 0 0 0 0 1 0 0 0 0 0 5 0 0 0 0 1 0 0 0 0 0
6 0 0 0 0 0 1 0 0 0 0 6 0 0 0 0 0 1 0 0 0 0
7 0 0 0 0 0 0 1 0 0 0 7 0 0 0 0 0 0 1 0 0 0
8 0 0 0 0 0 0 0 1 0 0 8 0 0 0 0 0 0 0 1 0 0
9 0 0 0 0 0 0 0 0 1 0 9 0 0 0 0 0 0 0 0 1 0
10 0 0 0 0 0 0 0 0 0 1 10 0 0 0 0 0 0 0 0 0 1
4 Participant 4 1 1/0/1900 5 Participant 5 1 1/0/1900
1 2 3 4 5 6 7 8 9 10
1 2 3 4 5 6 7 8 9 10
1 1 1/9 1/3 1/5 0 0 0 0 0 0 1 1 9 3 7 0 0 0 0 0 0
2 9 1 3 3 0 0 0 0 0 0
2 1/9 1 1/7
1/3 0 0 0 0 0 0
3 3 1/3 1 1/3 0 0 0 0 0 0 3 1/3 7 1 3 0 0 0 0 0 0
4 5 1/3 3 1 0 0 0 0 0 0 4 1/7 3 1/3 1 0 0 0 0 0 0
5 0 0 0 0 1 0 0 0 0 0 5 0 0 0 0 1 0 0 0 0 0
6 0 0 0 0 0 1 0 0 0 0 6 0 0 0 0 0 1 0 0 0 0
7 0 0 0 0 0 0 1 0 0 0 7 0 0 0 0 0 0 1 0 0 0
8 0 0 0 0 0 0 0 1 0 0 8 0 0 0 0 0 0 0 1 0 0
9 0 0 0 0 0 0 0 0 1 0 9 0 0 0 0 0 0 0 0 1 0
10 0 0 0 0 0 0 0 0 0 1 10 0 0 0 0 0 0 0 0 0 1

126
6 Participant 6 1 1/0/1900 7 Participant 7 1 1/0/1900
1 2 3 4 5 6 7 8 9 10
1 2 3 4 5 6 7 8 9 10
1 1 1/9 1/9 1/9 0 0 0 0 0 0 1 1 5 3 3 0 0 0 0 0 0
2 9 1 3 3 0 0 0 0 0 0
2 1/5 1 1/3
1/3 0 0 0 0 0 0
3 9 1/3 1 1 0 0 0 0 0 0 3 1/3 3 1 1 0 0 0 0 0 0
4 9 1/3 1 1 0 0 0 0 0 0 4 1/3 3 1 1 0 0 0 0 0 0
5 0 0 0 0 1 0 0 0 0 0 5 0 0 0 0 1 0 0 0 0 0
6 0 0 0 0 0 1 0 0 0 0 6 0 0 0 0 0 1 0 0 0 0
7 0 0 0 0 0 0 1 0 0 0 7 0 0 0 0 0 0 1 0 0 0
8 0 0 0 0 0 0 0 1 0 0 8 0 0 0 0 0 0 0 1 0 0
9 0 0 0 0 0 0 0 0 1 0 9 0 0 0 0 0 0 0 0 1 0
10 0 0 0 0 0 0 0 0 0 1 10 0 0 0 0 0 0 0 0 0 1
8 Participant 8 1 1/0/1900 9 Participant 9 1 1/0/1900
1 2 3 4 5 6 7 8 9 10
1 2 3 4 5 6 7 8 9 10
1 1 7 5 5 0 0 0 0 0 0 1 1 1/3 5 3 0 0 0 0 0 0
2 1/7 1 1 1 0 0 0 0 0 0 2 3 1 5 5 0 0 0 0 0 0
3 1/5 1 1 3 0 0 0 0 0 0
3 1/5 1/5 1
1/3 0 0 0 0 0 0
4 1/5 1 1/3 1 0 0 0 0 0 0 4 1/3 1/5 3 1 0 0 0 0 0 0
5 0 0 0 0 1 0 0 0 0 0 5 0 0 0 0 1 0 0 0 0 0
6 0 0 0 0 0 1 0 0 0 0 6 0 0 0 0 0 1 0 0 0 0
7 0 0 0 0 0 0 1 0 0 0 7 0 0 0 0 0 0 1 0 0 0
8 0 0 0 0 0 0 0 1 0 0 8 0 0 0 0 0 0 0 1 0 0
9 0 0 0 0 0 0 0 0 1 0 9 0 0 0 0 0 0 0 0 1 0
10 0 0 0 0 0 0 0 0 0 1 10 0 0 0 0 0 0 0 0 0 1
10 Participant 10 1 1/0/1900 11 Participant 11 1 1/0/1900
1 2 3 4 5 6 7 8 9 10
1 2 3 4 5 6 7 8 9 10
1 1 5 1/3 1/5 0 0 0 0 0 0 1 1 3 9 9 0 0 0 0 0 0
2 1/5 1 1/5 1/5 0 0 0 0 0 0 2 1/3 1 3 7 0 0 0 0 0 0
3 3 5 1 1 0 0 0 0 0 0 3 1/9 1/3 1 1 0 0 0 0 0 0
4 5 5 1 1 0 0 0 0 0 0 4 1/9 1/7 1 1 0 0 0 0 0 0
5 0 0 0 0 1 0 0 0 0 0 5 0 0 0 0 1 0 0 0 0 0
6 0 0 0 0 0 1 0 0 0 0 6 0 0 0 0 0 1 0 0 0 0
7 0 0 0 0 0 0 1 0 0 0 7 0 0 0 0 0 0 1 0 0 0
8 0 0 0 0 0 0 0 1 0 0 8 0 0 0 0 0 0 0 1 0 0
9 0 0 0 0 0 0 0 0 1 0 9 0 0 0 0 0 0 0 0 1 0
10 0 0 0 0 0 0 0 0 0 1 10 0 0 0 0 0 0 0 0 0 1
12 Participant 12 1 1/0/1900 13 Participant 13 1 1/0/1900
1 2 3 4 5 6 7 8 9 10
1 2 3 4 5 6 7 8 9 10
1 1 3 5 7 0 0 0 0 0 0 1 1 3 5 7 0 0 0 0 0 0
2 1/3 1 1 7 0 0 0 0 0 0 2 1/3 1 1 7 0 0 0 0 0 0
3 1/5 1 1 5 0 0 0 0 0 0 3 1/5 1 1 5 0 0 0 0 0 0
4 1/7 1/7 1/5 1 0 0 0 0 0 0 4 1/7 1/7 1/5 1 0 0 0 0 0 0
5 0 0 0 0 1 0 0 0 0 0 5 0 0 0 0 1 0 0 0 0 0
6 0 0 0 0 0 1 0 0 0 0 6 0 0 0 0 0 1 0 0 0 0
7 0 0 0 0 0 0 1 0 0 0 7 0 0 0 0 0 0 1 0 0 0
8 0 0 0 0 0 0 0 1 0 0 8 0 0 0 0 0 0 0 1 0 0
9 0 0 0 0 0 0 0 0 1 0 9 0 0 0 0 0 0 0 0 1 0
10 0 0 0 0 0 0 0 0 0 1 10 0 0 0 0 0 0 0 0 0 1

127
14 Participant 14 1 1/0/1900 15 Participant 15 1 1/0/1900
1 2 3 4 5 6 7 8 9 10
1 2 3 4 5 6 7 8 9 10
1 1 1/5 1/7 1/5 0 0 0 0 0 0 1 1 5 3 7 0 0 0 0 0 0
2 5 1 1 1/3 0 0 0 0 0 0 2 1/5 1 1/5 1 0 0 0 0 0 0
3 7 1 1 1 0 0 0 0 0 0 3 1/3 5 1 1 0 0 0 0 0 0
4 5 3 1 1 0 0 0 0 0 0 4 1/7 1 1 1 0 0 0 0 0 0
5 0 0 0 0 1 0 0 0 0 0 5 0 0 0 0 1 0 0 0 0 0
6 0 0 0 0 0 1 0 0 0 0 6 0 0 0 0 0 1 0 0 0 0
7 0 0 0 0 0 0 1 0 0 0 7 0 0 0 0 0 0 1 0 0 0
8 0 0 0 0 0 0 0 1 0 0 8 0 0 0 0 0 0 0 1 0 0
9 0 0 0 0 0 0 0 0 1 0 9 0 0 0 0 0 0 0 0 1 0
10 0 0 0 0 0 0 0 0 0 1 10 0 0 0 0 0 0 0 0 0 1
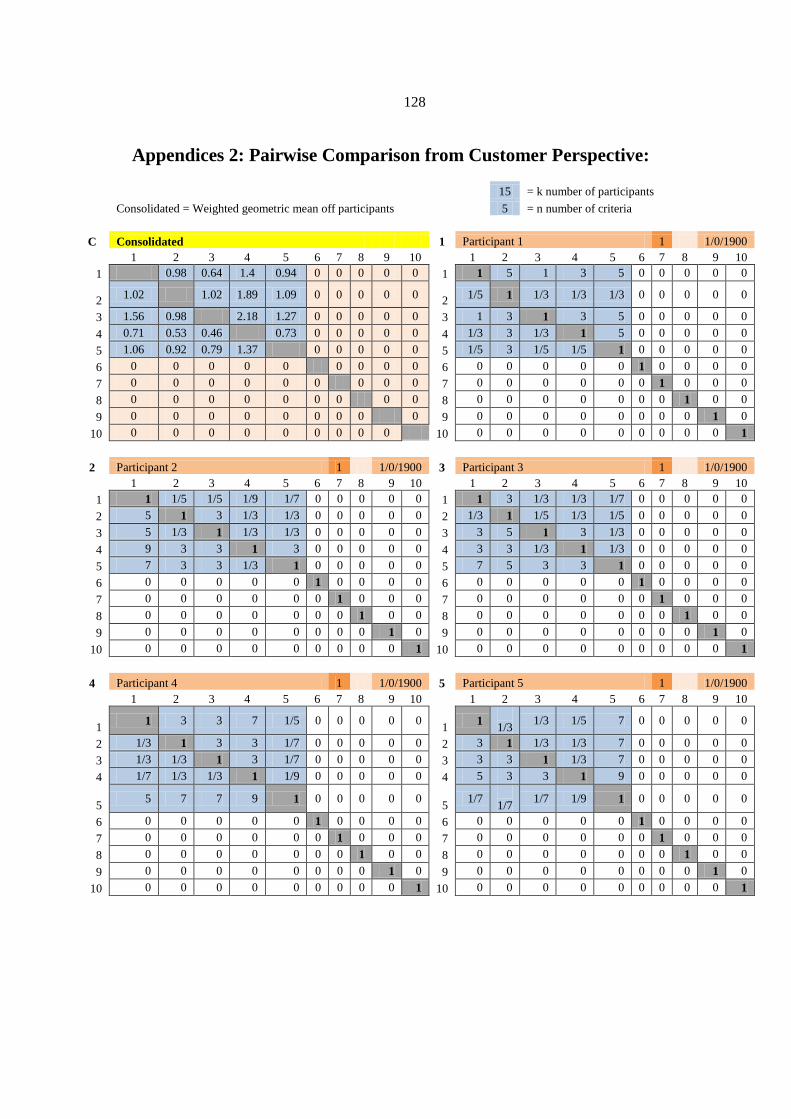
128
Appendices 2: Pairwise Comparison from Customer Perspective:
15 = k number of participants
Consolidated = Weighted geometric mean off participants
5 = n number of criteria
C Consolidated 1 Participant 1 1 1/0/1900
1 2 3 4 5 6 7 8 9 10
1 2 3 4 5 6 7 8 9 10
1 0.98 0.64 1.4 0.94 0 0 0 0 0 1 1 5 1 3 5 0 0 0 0 0
2 1.02 1.02 1.89 1.09 0 0 0 0 0
2 1/5 1 1/3 1/3 1/3 0 0 0 0 0
3 1.56 0.98 2.18 1.27 0 0 0 0 0 3 1 3 1 3 5 0 0 0 0 0
4 0.71 0.53 0.46 0.73 0 0 0 0 0 4 1/3 3 1/3 1 5 0 0 0 0 0
5 1.06 0.92 0.79 1.37 0 0 0 0 0 5 1/5 3 1/5 1/5 1 0 0 0 0 0
6 0 0 0 0 0 0 0 0 0 6 0 0 0 0 0 1 0 0 0 0
7 0 0 0 0 0 0 0 0 0 7 0 0 0 0 0 0 1 0 0 0
8 0 0 0 0 0 0 0 0 0 8 0 0 0 0 0 0 0 1 0 0
9 0 0 0 0 0 0 0 0 0 9 0 0 0 0 0 0 0 0 1 0
10 0 0 0 0 0 0 0 0 0 10 0 0 0 0 0 0 0 0 0 1
2 Participant 2 1 1/0/1900 3 Participant 3 1 1/0/1900
1 2 3 4 5 6 7 8 9 10
1 2 3 4 5 6 7 8 9 10
1 1 1/5 1/5 1/9 1/7 0 0 0 0 0 1 1 3 1/3 1/3 1/7 0 0 0 0 0
2 5 1 3 1/3 1/3 0 0 0 0 0 2 1/3 1 1/5 1/3 1/5 0 0 0 0 0
3 5 1/3 1 1/3 1/3 0 0 0 0 0 3 3 5 1 3 1/3 0 0 0 0 0
4 9 3 3 1 3 0 0 0 0 0 4 3 3 1/3 1 1/3 0 0 0 0 0
5 7 3 3 1/3 1 0 0 0 0 0 5 7 5 3 3 1 0 0 0 0 0
6 0 0 0 0 0 1 0 0 0 0 6 0 0 0 0 0 1 0 0 0 0
7 0 0 0 0 0 0 1 0 0 0 7 0 0 0 0 0 0 1 0 0 0
8 0 0 0 0 0 0 0 1 0 0 8 0 0 0 0 0 0 0 1 0 0
9 0 0 0 0 0 0 0 0 1 0 9 0 0 0 0 0 0 0 0 1 0
10 0 0 0 0 0 0 0 0 0 1 10 0 0 0 0 0 0 0 0 0 1
4 Participant 4 1 1/0/1900 5 Participant 5 1 1/0/1900
1 2 3 4 5 6 7 8 9 10
1 2 3 4 5 6 7 8 9 10
1 1 3 3 7 1/5 0 0 0 0 0
1 1
1/3 1/3 1/5 7 0 0 0 0 0
2 1/3 1 3 3 1/7 0 0 0 0 0 2 3 1 1/3 1/3 7 0 0 0 0 0
3 1/3 1/3 1 3 1/7 0 0 0 0 0 3 3 3 1 1/3 7 0 0 0 0 0
4 1/7 1/3 1/3 1 1/9 0 0 0 0 0 4 5 3 3 1 9 0 0 0 0 0
5 5 7 7 9 1 0 0 0 0 0
5 1/7
1/7 1/7 1/9 1 0 0 0 0 0
6 0 0 0 0 0 1 0 0 0 0 6 0 0 0 0 0 1 0 0 0 0
7 0 0 0 0 0 0 1 0 0 0 7 0 0 0 0 0 0 1 0 0 0
8 0 0 0 0 0 0 0 1 0 0 8 0 0 0 0 0 0 0 1 0 0
9 0 0 0 0 0 0 0 0 1 0 9 0 0 0 0 0 0 0 0 1 0
10 0 0 0 0 0 0 0 0 0 1 10 0 0 0 0 0 0 0 0 0 1

129
6 Participant 6 1 1/0/1900 7 Participant 7 1 1/0/1900
1 2 3 4 5 6 7 8 9 10
1 2 3 4 5 6 7 8 9 10
1 1 1/7 1/3 1 1 0 0 0 0 0
1 1
1/9 1/5 1/5 1 0 0 0 0 0
2 7 1 7 7 9 0 0 0 0 0 2 9 1 3 3 5 0 0 0 0 0
3 3 1/7 1 1 7 0 0 0 0 0
3 5
1/3 1 5 5 0 0 0 0 0
4 1 1/7 1 1 5 0 0 0 0 0
4 5
1/3 1/5 1 1 0 0 0 0 0
5 1 1/9 1/7 1/5 1 0 0 0 0 0
5 1
1/5 1/5 1 1 0 0 0 0 0
6 0 0 0 0 0 1 0 0 0 0 6 0 0 0 0 0 1 0 0 0 0
7 0 0 0 0 0 0 1 0 0 0 7 0 0 0 0 0 0 1 0 0 0
8 0 0 0 0 0 0 0 1 0 0 8 0 0 0 0 0 0 0 1 0 0
9 0 0 0 0 0 0 0 0 1 0 9 0 0 0 0 0 0 0 0 1 0
10 0 0 0 0 0 0 0 0 0 1 10 0 0 0 0 0 0 0 0 0 1
8 Participant 8 1 1/0/1900 9 Participant 9 1 1/0/1900
1 2 3 4 5 6 7 8 9 10
1 2 3 4 5 6 7 8 9 10
1 1 3 1/5 1/3 5 0 0 0 0 0 1 1 5 9 7 5 0 0 0 0 0
2 1/3 1 1/5 1/3 7 0 0 0 0 0 2 1/5 1 5 5 1 0 0 0 0 0
3 5 5 1 3 9 0 0 0 0 0
3 1/9
1/5 1 1 1/3 0 0 0 0 0
4 3 3 1/3 1 9 0 0 0 0 0
4 1/7
1/5 1 1 1/7 0 0 0 0 0
5 1/5 1/7 1/9 1/9 1 0 0 0 0 0 5 1/5 1 3 7 1 0 0 0 0 0
6 0 0 0 0 0 1 0 0 0 0 6 0 0 0 0 0 1 0 0 0 0
7 0 0 0 0 0 0 1 0 0 0 7 0 0 0 0 0 0 1 0 0 0
8 0 0 0 0 0 0 0 1 0 0 8 0 0 0 0 0 0 0 1 0 0
9 0 0 0 0 0 0 0 0 1 0 9 0 0 0 0 0 0 0 0 1 0
10 0 0 0 0 0 0 0 0 0 1 10 0 0 0 0 0 0 0 0 0 1
10 Participant 10 1 1/0/1900 11 Participant 11 1 1/0/1900
1 2 3 4 5 6 7 8 9 10
1 2 3 4 5 6 7 8 9 10
1 1 1/3 1/7 3 1 0 0 0 0 0 1 1 3 7 3 1 0 0 0 0 0
2 3 1 1 5 5 0 0 0 0 0 2 1/3 1 5 3 1 0 0 0 0 0
3 7 1 1 7 5 0 0 0 0 0
3 1/7
1/5 1 1 1/5 0 0 0 0 0
4 1/3 1/5 1/7 1 1/5 0 0 0 0 0
4 1/3
1/3 1 1 1/9 0 0 0 0 0
5 1 1/5 1/5 5 1 0 0 0 0 0 5 1 1 5 9 1 0 0 0 0 0
6 0 0 0 0 0 1 0 0 0 0 6 0 0 0 0 0 1 0 0 0 0
7 0 0 0 0 0 0 1 0 0 0 7 0 0 0 0 0 0 1 0 0 0
8 0 0 0 0 0 0 0 1 0 0 8 0 0 0 0 0 0 0 1 0 0
9 0 0 0 0 0 0 0 0 1 0 9 0 0 0 0 0 0 0 0 1 0
10 0 0 0 0 0 0 0 0 0 1 10 0 0 0 0 0 0 0 0 0 1
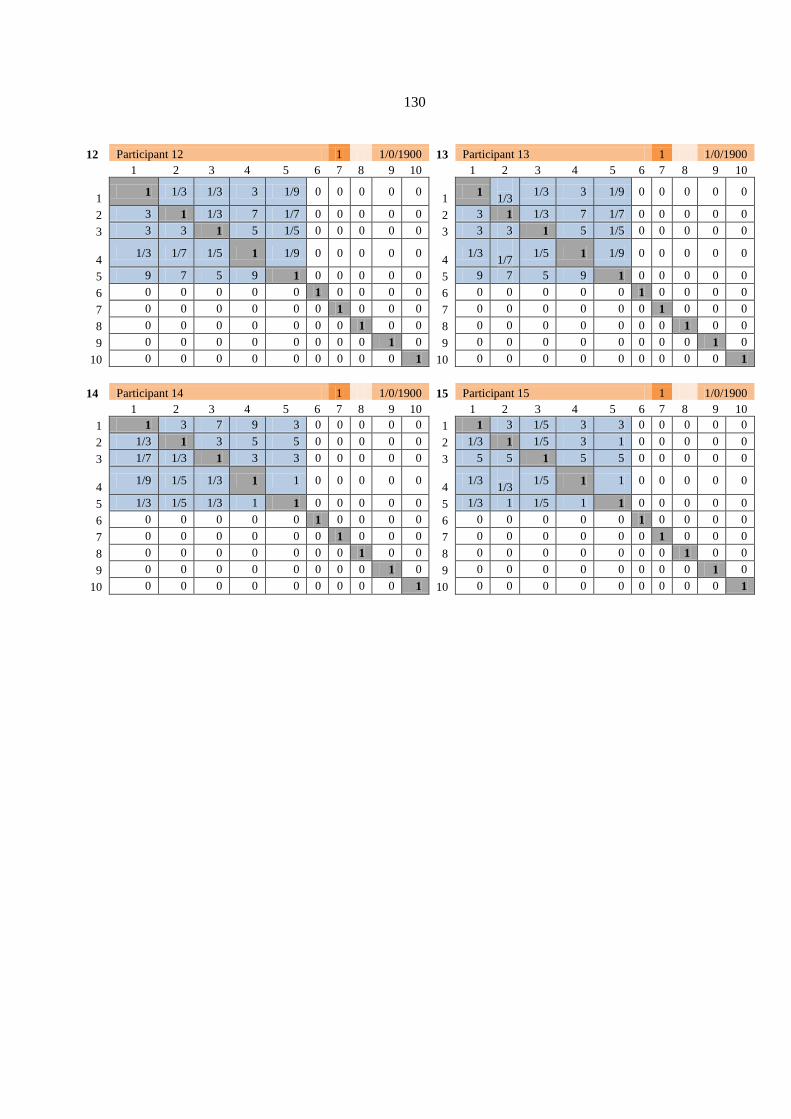
130
12 Participant 12 1 1/0/1900 13 Participant 13 1 1/0/1900
1 2 3 4 5 6 7 8 9 10
1 2 3 4 5 6 7 8 9 10
1 1 1/3 1/3 3 1/9 0 0 0 0 0
1 1
1/3 1/3 3 1/9 0 0 0 0 0
2 3 1 1/3 7 1/7 0 0 0 0 0 2 3 1 1/3 7 1/7 0 0 0 0 0
3 3 3 1 5 1/5 0 0 0 0 0 3 3 3 1 5 1/5 0 0 0 0 0
4 1/3 1/7 1/5 1 1/9 0 0 0 0 0
4 1/3
1/7 1/5 1 1/9 0 0 0 0 0
5 9 7 5 9 1 0 0 0 0 0 5 9 7 5 9 1 0 0 0 0 0
6 0 0 0 0 0 1 0 0 0 0 6 0 0 0 0 0 1 0 0 0 0
7 0 0 0 0 0 0 1 0 0 0 7 0 0 0 0 0 0 1 0 0 0
8 0 0 0 0 0 0 0 1 0 0 8 0 0 0 0 0 0 0 1 0 0
9 0 0 0 0 0 0 0 0 1 0 9 0 0 0 0 0 0 0 0 1 0
10 0 0 0 0 0 0 0 0 0 1 10 0 0 0 0 0 0 0 0 0 1
14 Participant 14 1 1/0/1900 15 Participant 15 1 1/0/1900
1 2 3 4 5 6 7 8 9 10
1 2 3 4 5 6 7 8 9 10
1 1 3 7 9 3 0 0 0 0 0 1 1 3 1/5 3 3 0 0 0 0 0
2 1/3 1 3 5 5 0 0 0 0 0 2 1/3 1 1/5 3 1 0 0 0 0 0
3 1/7 1/3 1 3 3 0 0 0 0 0 3 5 5 1 5 5 0 0 0 0 0
4 1/9 1/5 1/3 1 1 0 0 0 0 0
4 1/3
1/3 1/5 1 1 0 0 0 0 0
5 1/3 1/5 1/3 1 1 0 0 0 0 0 5 1/3 1 1/5 1 1 0 0 0 0 0
6 0 0 0 0 0 1 0 0 0 0 6 0 0 0 0 0 1 0 0 0 0
7 0 0 0 0 0 0 1 0 0 0 7 0 0 0 0 0 0 1 0 0 0
8 0 0 0 0 0 0 0 1 0 0 8 0 0 0 0 0 0 0 1 0 0
9 0 0 0 0 0 0 0 0 1 0 9 0 0 0 0 0 0 0 0 1 0
10 0 0 0 0 0 0 0 0 0 1 10 0 0 0 0 0 0 0 0 0 1
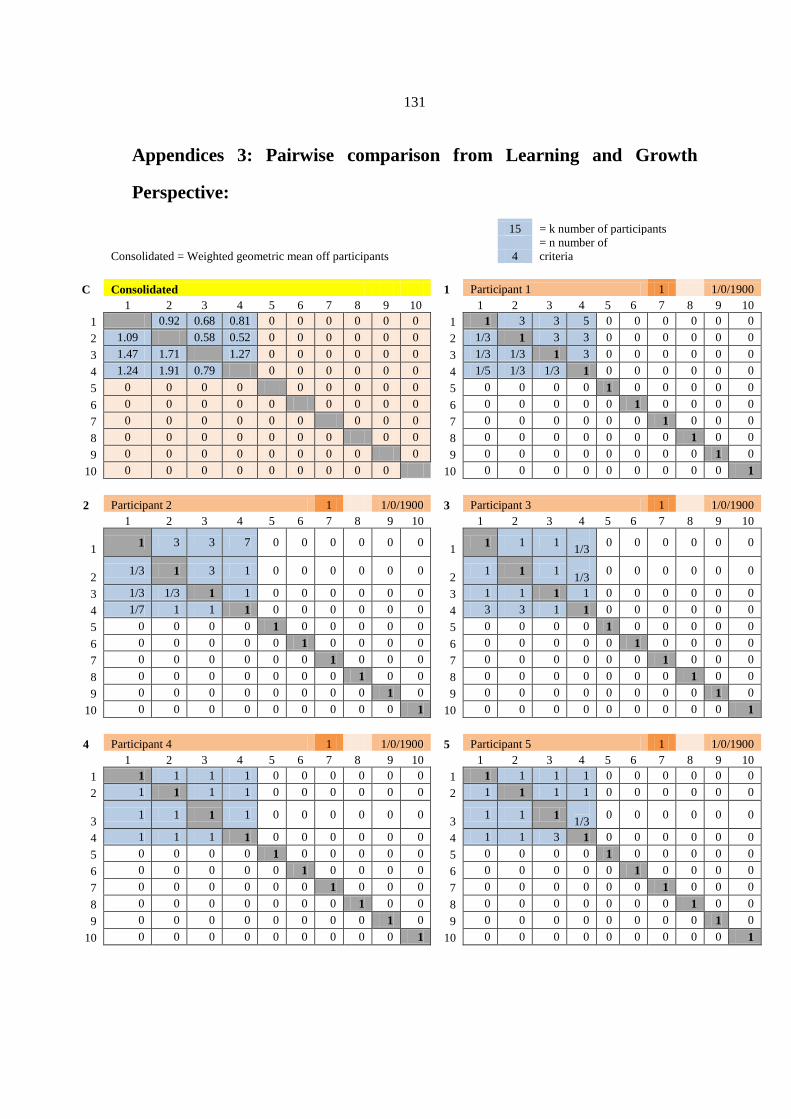
131
Appendices 3: Pairwise comparison from Learning and Growth
Perspective:
15 = k number of participants
Consolidated = Weighted geometric mean off participants
4
= n number of
criteria
C Consolidated 1 Participant 1 1 1/0/1900
1 2 3 4 5 6 7 8 9 10
1 2 3 4 5 6 7 8 9 10
1 0.92 0.68 0.81 0 0 0 0 0 0 1 1 3 3 5 0 0 0 0 0 0
2 1.09 0.58 0.52 0 0 0 0 0 0 2 1/3 1 3 3 0 0 0 0 0 0
3 1.47 1.71 1.27 0 0 0 0 0 0 3 1/3 1/3 1 3 0 0 0 0 0 0
4 1.24 1.91 0.79 0 0 0 0 0 0 4 1/5 1/3 1/3 1 0 0 0 0 0 0
5 0 0 0 0 0 0 0 0 0 5 0 0 0 0 1 0 0 0 0 0
6 0 0 0 0 0 0 0 0 0 6 0 0 0 0 0 1 0 0 0 0
7 0 0 0 0 0 0 0 0 0 7 0 0 0 0 0 0 1 0 0 0
8 0 0 0 0 0 0 0 0 0 8 0 0 0 0 0 0 0 1 0 0
9 0 0 0 0 0 0 0 0 0 9 0 0 0 0 0 0 0 0 1 0
10 0 0 0 0 0 0 0 0 0 10 0 0 0 0 0 0 0 0 0 1
2 Participant 2 1 1/0/1900 3 Participant 3 1 1/0/1900
1 2 3 4 5 6 7 8 9 10
1 2 3 4 5 6 7 8 9 10
1 1 3 3 7 0 0 0 0 0 0
1 1 1 1
1/3 0 0 0 0 0 0
2 1/3 1 3 1 0 0 0 0 0 0
2 1 1 1
1/3 0 0 0 0 0 0
3 1/3 1/3 1 1 0 0 0 0 0 0 3 1 1 1 1 0 0 0 0 0 0
4 1/7 1 1 1 0 0 0 0 0 0 4 3 3 1 1 0 0 0 0 0 0
5 0 0 0 0 1 0 0 0 0 0 5 0 0 0 0 1 0 0 0 0 0
6 0 0 0 0 0 1 0 0 0 0 6 0 0 0 0 0 1 0 0 0 0
7 0 0 0 0 0 0 1 0 0 0 7 0 0 0 0 0 0 1 0 0 0
8 0 0 0 0 0 0 0 1 0 0 8 0 0 0 0 0 0 0 1 0 0
9 0 0 0 0 0 0 0 0 1 0 9 0 0 0 0 0 0 0 0 1 0
10 0 0 0 0 0 0 0 0 0 1 10 0 0 0 0 0 0 0 0 0 1
4 Participant 4 1 1/0/1900 5 Participant 5 1 1/0/1900
1 2 3 4 5 6 7 8 9 10
1 2 3 4 5 6 7 8 9 10
1 1 1 1 1 0 0 0 0 0 0 1 1 1 1 1 0 0 0 0 0 0
2 1 1 1 1 0 0 0 0 0 0 2 1 1 1 1 0 0 0 0 0 0
3 1 1 1 1 0 0 0 0 0 0
3 1 1 1
1/3 0 0 0 0 0 0
4 1 1 1 1 0 0 0 0 0 0 4 1 1 3 1 0 0 0 0 0 0
5 0 0 0 0 1 0 0 0 0 0 5 0 0 0 0 1 0 0 0 0 0
6 0 0 0 0 0 1 0 0 0 0 6 0 0 0 0 0 1 0 0 0 0
7 0 0 0 0 0 0 1 0 0 0 7 0 0 0 0 0 0 1 0 0 0
8 0 0 0 0 0 0 0 1 0 0 8 0 0 0 0 0 0 0 1 0 0
9 0 0 0 0 0 0 0 0 1 0 9 0 0 0 0 0 0 0 0 1 0
10 0 0 0 0 0 0 0 0 0 1 10 0 0 0 0 0 0 0 0 0 1

132
6 Participant 6 1 1/0/1900 7 Participant 7 1 1/0/1900
1 2 3 4 5 6 7 8 9 10
1 2 3 4 5 6 7 8 9 10
1 1 1 1/3 1/5 0 0 0 0 0 0 1 1 9 1/3 3 0 0 0 0 0 0
2 1 1 1 1 0 0 0 0 0 0
2 1/9 1 1/9
1/3 0 0 0 0 0 0
3 3 1 1 1 0 0 0 0 0 0 3 3 9 1 7 0 0 0 0 0 0
4 5 1 1 1 0 0 0 0 0 0 4 1/3 3 1/7 1 0 0 0 0 0 0
5 0 0 0 0 1 0 0 0 0 0 5 0 0 0 0 1 0 0 0 0 0
6 0 0 0 0 0 1 0 0 0 0 6 0 0 0 0 0 1 0 0 0 0
7 0 0 0 0 0 0 1 0 0 0 7 0 0 0 0 0 0 1 0 0 0
8 0 0 0 0 0 0 0 1 0 0 8 0 0 0 0 0 0 0 1 0 0
9 0 0 0 0 0 0 0 0 1 0 9 0 0 0 0 0 0 0 0 1 0
10 0 0 0 0 0 0 0 0 0 1 10 0 0 0 0 0 0 0 0 0 1
8 Participant 8 1 1/0/1900 9 Participant 9 1 1/0/1900
1 2 3 4 5 6 7 8 9 10
1 2 3 4 5 6 7 8 9 10
1 1 1/5 1/9 1/3 0 0 0 0 0 0 1 1 7 7 7 0 0 0 0 0 0
2 5 1 1/5 1/3 0 0 0 0 0 0
2 1/7 1 1/3
1/3 0 0 0 0 0 0
3 9 5 1 5 0 0 0 0 0 0 3 1/7 3 1 1 0 0 0 0 0 0
4 3 3 1/5 1 0 0 0 0 0 0 4 1/7 3 1 1 0 0 0 0 0 0
5 0 0 0 0 1 0 0 0 0 0 5 0 0 0 0 1 0 0 0 0 0
6 0 0 0 0 0 1 0 0 0 0 6 0 0 0 0 0 1 0 0 0 0
7 0 0 0 0 0 0 1 0 0 0 7 0 0 0 0 0 0 1 0 0 0
8 0 0 0 0 0 0 0 1 0 0 8 0 0 0 0 0 0 0 1 0 0
9 0 0 0 0 0 0 0 0 1 0 9 0 0 0 0 0 0 0 0 1 0
10 0 0 0 0 0 0 0 0 0 1 10 0 0 0 0 0 0 0 0 0 1
10 Participant 10 1 1/0/1900 11 Participant 11 1 1/0/1900
1 2 3 4 5 6 7 8 9 10
1 2 3 4 5 6 7 8 9 10
1 1 1/5 1/3 1/5 0 0 0 0 0 0 1 1 1 1 1 0 0 0 0 0 0
2 5 1 1 1/3 0 0 0 0 0 0
2 1 1 1/5
1/5 0 0 0 0 0 0
3 3 1 1 1 0 0 0 0 0 0 3 1 5 1 1 0 0 0 0 0 0
4 5 3 1 1 0 0 0 0 0 0 4 1 5 1 1 0 0 0 0 0 0
5 0 0 0 0 1 0 0 0 0 0 5 0 0 0 0 1 0 0 0 0 0
6 0 0 0 0 0 1 0 0 0 0 6 0 0 0 0 0 1 0 0 0 0
7 0 0 0 0 0 0 1 0 0 0 7 0 0 0 0 0 0 1 0 0 0
8 0 0 0 0 0 0 0 1 0 0 8 0 0 0 0 0 0 0 1 0 0
9 0 0 0 0 0 0 0 0 1 0 9 0 0 0 0 0 0 0 0 1 0
10 0 0 0 0 0 0 0 0 0 1 10 0 0 0 0 0 0 0 0 0 1

133
12 Participant 12 1 1/0/1900 13 Participant 13 1 1/0/1900
1 2 3 4 5 6 7 8 9 10
1 2 3 4 5 6 7 8 9 10
1 1 1/9 1/9 1/9 0 0 0 0 0 0
1 1 1/9 1/9
1/9 0 0 0 0 0 0
2 9 1 1/5 1/5 0 0 0 0 0 0
2 9 1 1/5
1/5 0 0 0 0 0 0
3 9 5 1 1 0 0 0 0 0 0 3 9 5 1 1 0 0 0 0 0 0
4 9 5 1 1 0 0 0 0 0 0 4 9 5 1 1 0 0 0 0 0 0
5 0 0 0 0 1 0 0 0 0 0 5 0 0 0 0 1 0 0 0 0 0
6 0 0 0 0 0 1 0 0 0 0 6 0 0 0 0 0 1 0 0 0 0
7 0 0 0 0 0 0 1 0 0 0 7 0 0 0 0 0 0 1 0 0 0
8 0 0 0 0 0 0 0 1 0 0 8 0 0 0 0 0 0 0 1 0 0
9 0 0 0 0 0 0 0 0 1 0 9 0 0 0 0 0 0 0 0 1 0
10 0 0 0 0 0 0 0 0 0 1 10 0 0 0 0 0 0 0 0 0 1
14 Participant 14 1 1/0/1900 15 Participant 15 1 1/0/1900
1 2 3 4 5 6 7 8 9 10
1 2 3 4 5 6 7 8 9 10
1 1 1/7 1/7 1/7 0 0 0 0 0 0 1 1 7 7 7 0 0 0 0 0 0
2 7 1 1/5 1/5 0 0 0 0 0 0 2 1/7 1 3 3 0 0 0 0 0 0
3 7 5 1 1 0 0 0 0 0 0 3 1/7 1/3 1 1 0 0 0 0 0 0
4 7 5 1 1 0 0 0 0 0 0 4 1/7 1/3 1 1 0 0 0 0 0 0
5 0 0 0 0 1 0 0 0 0 0 5 0 0 0 0 1 0 0 0 0 0
6 0 0 0 0 0 1 0 0 0 0 6 0 0 0 0 0 1 0 0 0 0
7 0 0 0 0 0 0 1 0 0 0 7 0 0 0 0 0 0 1 0 0 0
8 0 0 0 0 0 0 0 1 0 0 8 0 0 0 0 0 0 0 1 0 0
9 0 0 0 0 0 0 0 0 1 0 9 0 0 0 0 0 0 0 0 1 0
10 0 0 0 0 0 0 0 0 0 1 10 0 0 0 0 0 0 0 0 0 1
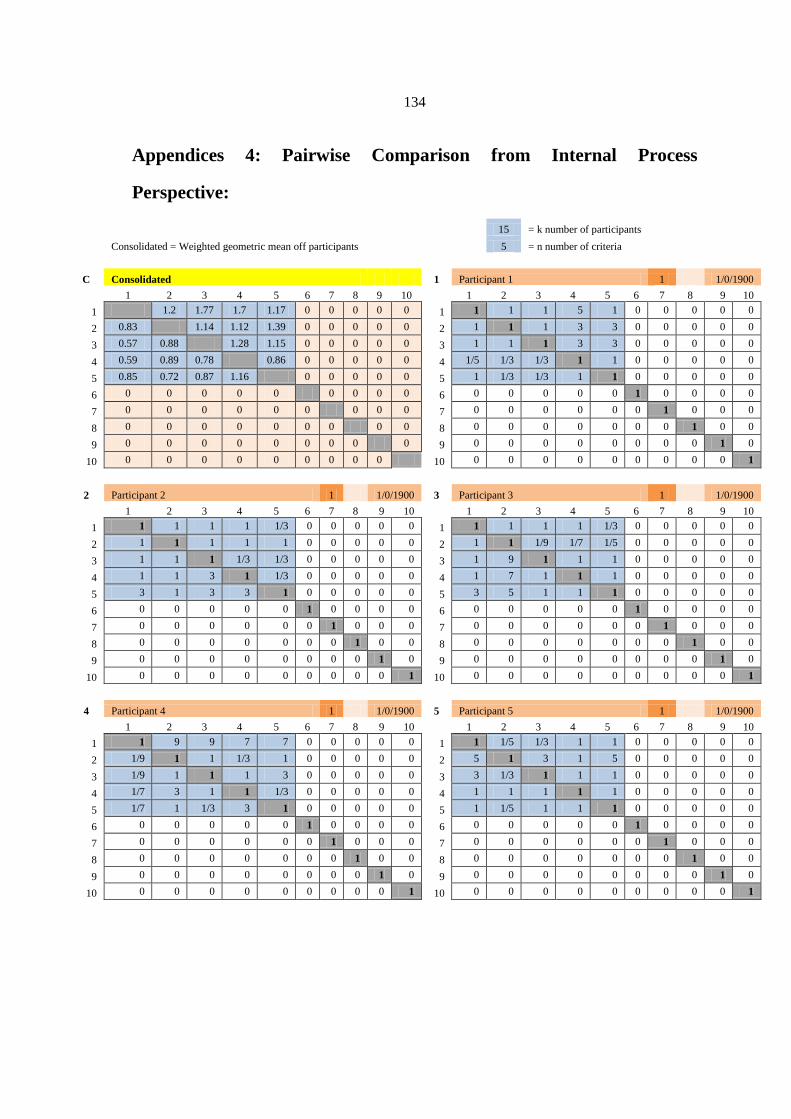
134
Appendices 4: Pairwise Comparison from Internal Process
Perspective:
15 = k number of participants
Consolidated = Weighted geometric mean off participants
5 = n number of criteria
C Consolidated 1 Participant 1 1 1/0/1900
1 2 3 4 5 6 7 8 9 10
1 2 3 4 5 6 7 8 9 10
1 1.2 1.77 1.7 1.17 0 0 0 0 0 1 1 1 1 5 1 0 0 0 0 0
2 0.83 1.14 1.12 1.39 0 0 0 0 0 2 1 1 1 3 3 0 0 0 0 0
3 0.57 0.88 1.28 1.15 0 0 0 0 0 3 1 1 1 3 3 0 0 0 0 0
4 0.59 0.89 0.78 0.86 0 0 0 0 0 4 1/5 1/3 1/3 1 1 0 0 0 0 0
5 0.85 0.72 0.87 1.16 0 0 0 0 0 5 1 1/3 1/3 1 1 0 0 0 0 0
6 0 0 0 0 0 0 0 0 0 6 0 0 0 0 0 1 0 0 0 0
7 0 0 0 0 0 0 0 0 0 7 0 0 0 0 0 0 1 0 0 0
8 0 0 0 0 0 0 0 0 0 8 0 0 0 0 0 0 0 1 0 0
9 0 0 0 0 0 0 0 0 0 9 0 0 0 0 0 0 0 0 1 0
10 0 0 0 0 0 0 0 0 0 10 0 0 0 0 0 0 0 0 0 1
2 Participant 2 1 1/0/1900 3 Participant 3 1 1/0/1900
1 2 3 4 5 6 7 8 9 10
1 2 3 4 5 6 7 8 9 10
1 1 1 1 1 1/3 0 0 0 0 0 1 1 1 1 1 1/3 0 0 0 0 0
2 1 1 1 1 1 0 0 0 0 0 2 1 1 1/9 1/7 1/5 0 0 0 0 0
3 1 1 1 1/3 1/3 0 0 0 0 0 3 1 9 1 1 1 0 0 0 0 0
4 1 1 3 1 1/3 0 0 0 0 0 4 1 7 1 1 1 0 0 0 0 0
5 3 1 3 3 1 0 0 0 0 0 5 3 5 1 1 1 0 0 0 0 0
6 0 0 0 0 0 1 0 0 0 0 6 0 0 0 0 0 1 0 0 0 0
7 0 0 0 0 0 0 1 0 0 0 7 0 0 0 0 0 0 1 0 0 0
8 0 0 0 0 0 0 0 1 0 0 8 0 0 0 0 0 0 0 1 0 0
9 0 0 0 0 0 0 0 0 1 0 9 0 0 0 0 0 0 0 0 1 0
10 0 0 0 0 0 0 0 0 0 1 10 0 0 0 0 0 0 0 0 0 1
4 Participant 4 1 1/0/1900 5 Participant 5 1 1/0/1900
1 2 3 4 5 6 7 8 9 10
1 2 3 4 5 6 7 8 9 10
1 1 9 9 7 7 0 0 0 0 0 1 1 1/5 1/3 1 1 0 0 0 0 0
2 1/9 1 1 1/3 1 0 0 0 0 0 2 5 1 3 1 5 0 0 0 0 0
3 1/9 1 1 1 3 0 0 0 0 0 3 3 1/3 1 1 1 0 0 0 0 0
4 1/7 3 1 1 1/3 0 0 0 0 0 4 1 1 1 1 1 0 0 0 0 0
5 1/7 1 1/3 3 1 0 0 0 0 0 5 1 1/5 1 1 1 0 0 0 0 0
6 0 0 0 0 0 1 0 0 0 0 6 0 0 0 0 0 1 0 0 0 0
7 0 0 0 0 0 0 1 0 0 0 7 0 0 0 0 0 0 1 0 0 0
8 0 0 0 0 0 0 0 1 0 0 8 0 0 0 0 0 0 0 1 0 0
9 0 0 0 0 0 0 0 0 1 0 9 0 0 0 0 0 0 0 0 1 0
10 0 0 0 0 0 0 0 0 0 1 10 0 0 0 0 0 0 0 0 0 1

135
6 Participant 6 1 1/0/1900 7 Participant 7 1 1/0/1900
1 2 3 4 5 6 7 8 9 10
1 2 3 4 5 6 7 8 9 10
1 1 1 1 1/3 1/3 0 0 0 0 0 1 1 1 5 1 1 0 0 0 0 0
2 1 1 1/5 1/5 1 0 0 0 0 0 2 1 1 3 5 3 0 0 0 0 0
3 1 5 1 1 1 0 0 0 0 0 3 1/5 1/3 1 1 1 0 0 0 0 0
4 3 5 1 1 1 0 0 0 0 0 4 1 1/5 1 1 1 0 0 0 0 0
5 3 1 1 1 1 0 0 0 0 0 5 1 1/3 1 1 1 0 0 0 0 0
6 0 0 0 0 0 1 0 0 0 0 6 0 0 0 0 0 1 0 0 0 0
7 0 0 0 0 0 0 1 0 0 0 7 0 0 0 0 0 0 1 0 0 0
8 0 0 0 0 0 0 0 1 0 0 8 0 0 0 0 0 0 0 1 0 0
9 0 0 0 0 0 0 0 0 1 0 9 0 0 0 0 0 0 0 0 1 0
10 0 0 0 0 0 0 0 0 0 1 10 0 0 0 0 0 0 0 0 0 1
8 Participant 8 1 1/0/1900 9 Participant 9 1 1/0/1900
1 2 3 4 5 6 7 8 9 10
1 2 3 4 5 6 7 8 9 10
1 1 1 1/3 1/5 1/7 0 0 0 0 0 1 1 9 7 5 3 0 0 0 0 0
2 1 1 1/9 1/9 1/9 0 0 0 0 0 2 1/9 1 1/5 1/5 1/5 0 0 0 0 0
3 3 9 1 1 1 0 0 0 0 0 3 1/7 5 1 3 1 0 0 0 0 0
4 5 9 1 1 1 0 0 0 0 0 4 1/5 5 1/3 1 1 0 0 0 0 0
5 7 9 1 1 1 0 0 0 0 0 5 1/3 5 1 1 1 0 0 0 0 0
6 0 0 0 0 0 1 0 0 0 0 6 0 0 0 0 0 1 0 0 0 0
7 0 0 0 0 0 0 1 0 0 0 7 0 0 0 0 0 0 1 0 0 0
8 0 0 0 0 0 0 0 1 0 0 8 0 0 0 0 0 0 0 1 0 0
9 0 0 0 0 0 0 0 0 1 0 9 0 0 0 0 0 0 0 0 1 0
10 0 0 0 0 0 0 0 0 0 1 10 0 0 0 0 0 0 0 0 0 1
10 Participant 10 1 1/0/1900 11 Participant 11 1 1/0/1900
1 2 3 4 5 6 7 8 9 10
1 2 3 4 5 6 7 8 9 10
1 1 1 3 5 7 0 0 0 0 0 1 1 1 1 1 1 0 0 0 0 0
2 1 1 7 7 3 0 0 0 0 0 2 1 1 1 5 5 0 0 0 0 0
3 1/3 1/7 1 1 1 0 0 0 0 0 3 1 1 1 5 5 0 0 0 0 0
4 1/5 1/7 1 1 1 0 0 0 0 0 4 1 1/5 1/5 1 1 0 0 0 0 0
5 1/7 1/3 1 1 1 0 0 0 0 0 5 1 1/5 1/5 1 1 0 0 0 0 0
6 0 0 0 0 0 1 0 0 0 0 6 0 0 0 0 0 1 0 0 0 0
7 0 0 0 0 0 0 1 0 0 0 7 0 0 0 0 0 0 1 0 0 0
8 0 0 0 0 0 0 0 1 0 0 8 0 0 0 0 0 0 0 1 0 0
9 0 0 0 0 0 0 0 0 1 0 9 0 0 0 0 0 0 0 0 1 0
10 0 0 0 0 0 0 0 0 0 1 10 0 0 0 0 0 0 0 0 0 1
12 Participant 12 1 1/0/1900 13 Participant 13 1 1/0/1900
1 2 3 4 5 6 7 8 9 10
1 2 3 4 5 6 7 8 9 10
1 1 1 7 7 5 0 0 0 0 0 1 1 1 7 7 5 0 0 0 0 0
2 1 1 5 7 7 0 0 0 0 0 2 1 1 5 7 7 0 0 0 0 0
3 1/7 1/5 1 5 1 0 0 0 0 0 3 1/7 1/5 1 5 1 0 0 0 0 0
4 1/7 1/7 1/5 1 1 0 0 0 0 0 4 1/7 1/7 1/5 1 1 0 0 0 0 0
5 1/5 1/7 1 1 1 0 0 0 0 0 5 1/5 1/7 1 1 1 0 0 0 0 0
6 0 0 0 0 0 1 0 0 0 0 6 0 0 0 0 0 1 0 0 0 0
7 0 0 0 0 0 0 1 0 0 0 7 0 0 0 0 0 0 1 0 0 0
8 0 0 0 0 0 0 0 1 0 0 8 0 0 0 0 0 0 0 1 0 0
9 0 0 0 0 0 0 0 0 1 0 9 0 0 0 0 0 0 0 0 1 0
10 0 0 0 0 0 0 0 0 0 1 10 0 0 0 0 0 0 0 0 0 1

136
14 Participant 14 1 1/0/1900 15 Participant 15 1 1/0/1900
1 2 3 4 5 6 7 8 9 10
1 2 3 4 5 6 7 8 9 10
1 1 1 1/9 1/9 1/9 0 0 0 0 0 1 1 1 9 9 5 0 0 0 0 0
2 1 1 1 1/9 1/9 0 0 0 0 0 2 1 1 9 9 9 0 0 0 0 0
3 9 1 1 1/9 1/9 0 0 0 0 0 3 1/9 1/9 1 1 5 0 0 0 0 0
4 9 9 9 1 1 0 0 0 0 0 4 1/9 1/9 1 1 1 0 0 0 0 0
5 9 9 9 1 1 0 0 0 0 0 5 1/5 1/9 1/5 1 1 0 0 0 0 0
6 0 0 0 0 0 1 0 0 0 0 6 0 0 0 0 0 1 0 0 0 0
7 0 0 0 0 0 0 1 0 0 0 7 0 0 0 0 0 0 1 0 0 0
8 0 0 0 0 0 0 0 1 0 0 8 0 0 0 0 0 0 0 1 0 0
9 0 0 0 0 0 0 0 0 1 0 9 0 0 0 0 0 0 0 0 1 0
10 0 0 0 0 0 0 0 0 0 1 10 0 0 0 0 0 0 0 0 0 1

137
Appendices 5: Pairwise Comparison from Finance Perspective:
15 = k number of participants
Consolidated = Weighted geometric mean off participants
5 = n number of criteria
C Consolidated 1 Participant 1 1 1/0/1900
1 2 3 4 5 6 7 8 9 10
1 2 3 4 5 6 7 8 9 10
1 1.24 0.71 1.25 1.73 0 0 0 0 0 1 1 3 3 5 1 0 0 0 0 0
2 0.81 0.81 1.02 1.8 0 0 0 0 0 2 1/3 1 1 3 1 0 0 0 0 0
3 1.41 1.24 1 1.53 0 0 0 0 0 3 1/3 1 1 3 1 0 0 0 0 0
4 0.8 0.98 1 1.9 0 0 0 0 0 4 1/5 1/3 1/3 1 1 0 0 0 0 0
5 0.58 0.56 0.65 0.53 0 0 0 0 0 5 1 1 1 1 1 0 0 0 0 0
6 0 0 0 0 0 0 0 0 0 6 0 0 0 0 0 1 0 0 0 0
7 0 0 0 0 0 0 0 0 0 7 0 0 0 0 0 0 1 0 0 0
8 0 0 0 0 0 0 0 0 0 8 0 0 0 0 0 0 0 1 0 0
9 0 0 0 0 0 0 0 0 0 9 0 0 0 0 0 0 0 0 1 0
10 0 0 0 0 0 0 0 0 0 10 0 0 0 0 0 0 0 0 0 1
2 Participant 2 1 1/0/1900 3 Participant 3 1 1/0/1900
1 2 3 4 5 6 7 8 9 10
1 2 3 4 5 6 7 8 9 10
1 1 1 1 1/3 1/3 0 0 0 0 0 1 1 1 3 5 7 0 0 0 0 0
2 1 1 1 1 1 0 0 0 0 0 2 1 1 9 9 9 0 0 0 0 0
3 1 1 1 1/5 1/5 0 0 0 0 0 3 1/3 1/9 1 1 1 0 0 0 0 0
4 3 1 5 1 1 0 0 0 0 0 4 1/5 1/9 1 1 1 0 0 0 0 0
5 3 1 5 1 1 0 0 0 0 0 5 1/7 1/9 1 1 1 0 0 0 0 0
6 0 0 0 0 0 1 0 0 0 0 6 0 0 0 0 0 1 0 0 0 0
7 0 0 0 0 0 0 1 0 0 0 7 0 0 0 0 0 0 1 0 0 0
8 0 0 0 0 0 0 0 1 0 0 8 0 0 0 0 0 0 0 1 0 0
9 0 0 0 0 0 0 0 0 1 0 9 0 0 0 0 0 0 0 0 1 0
10 0 0 0 0 0 0 0 0 0 1 10 0 0 0 0 0 0 0 0 0 1
4 Participant 4 1 1/0/1900 5 Participant 5 1 1/0/1900
1 2 3 4 5 6 7 8 9 10
1 2 3 4 5 6 7 8 9 10
1 1 5 5 5 1 0 0 0 0 0 1 1 1/7 1/7 1/7 1 0 0 0 0 0
2 1/5 1 1 1 1 0 0 0 0 0 2 7 1 1 1 3 0 0 0 0 0
3 1/5 1 1 1/3 1/3 0 0 0 0 0 3 7 1 1 1 1 0 0 0 0 0
4 1/5 1 3 1 1 0 0 0 0 0 4 7 1 1 1 3 0 0 0 0 0
5 1 1 3 1 1 0 0 0 0 0 5 1 1/3 1 1/3 1 0 0 0 0 0
6 0 0 0 0 0 1 0 0 0 0 6 0 0 0 0 0 1 0 0 0 0
7 0 0 0 0 0 0 1 0 0 0 7 0 0 0 0 0 0 1 0 0 0
8 0 0 0 0 0 0 0 1 0 0 8 0 0 0 0 0 0 0 1 0 0
9 0 0 0 0 0 0 0 0 1 0 9 0 0 0 0 0 0 0 0 1 0
10 0 0 0 0 0 0 0 0 0 1 10 0 0 0 0 0 0 0 0 0 1

138
6 Participant 6 1 1/0/1900 7 Participant 7 1 1/0/1900
1 2 3 4 5 6 7 8 9 10
1 2 3 4 5 6 7 8 9 10
1 1 1/9 1/7 1/5 1 0 0 0 0 0 1 1 5 3 9 7 0 0 0 0 0
2 9 1 1 1 1 0 0 0 0 0 2 1/5 1 3 3 3 0 0 0 0 0
3 7 1 1 1 1 0 0 0 0 0 3 1/3 1/3 1 3 3 0 0 0 0 0
4 5 1 1 1 1 0 0 0 0 0 4 1/9 1/3 1/3 1 3 0 0 0 0 0
5 1 1 1 1 1 0 0 0 0 0 5 1/7 1/3 1/3 1/3 1 0 0 0 0 0
6 0 0 0 0 0 1 0 0 0 0 6 0 0 0 0 0 1 0 0 0 0
7 0 0 0 0 0 0 1 0 0 0 7 0 0 0 0 0 0 1 0 0 0
8 0 0 0 0 0 0 0 1 0 0 8 0 0 0 0 0 0 0 1 0 0
9 0 0 0 0 0 0 0 0 1 0 9 0 0 0 0 0 0 0 0 1 0
10 0 0 0 0 0 0 0 0 0 1 10 0 0 0 0 0 0 0 0 0 1
8 Participant 8 1 1/0/1900 9 Participant 9 1 1/0/1900
1 2 3 4 5 6 7 8 9 10
1 2 3 4 5 6 7 8 9 10
1 1 1/5 1/7 1/9 1/3 0 0 0 0 0 1 1 7 9 3 5 0 0 0 0 0
2 5 1 1 1/9 1 0 0 0 0 0 2 1/7 1 1/5 1/5 1/5 0 0 0 0 0
3 7 1 1 1/9 1 0 0 0 0 0 3 1/9 5 1 1 1 0 0 0 0 0
4 9 9 9 1 9 0 0 0 0 0 4 1/3 5 1 1 1 0 0 0 0 0
5 3 1 1 1/9 1 0 0 0 0 0 5 1/5 5 1 1 1 0 0 0 0 0
6 0 0 0 0 0 1 0 0 0 0 6 0 0 0 0 0 1 0 0 0 0
7 0 0 0 0 0 0 1 0 0 0 7 0 0 0 0 0 0 1 0 0 0
8 0 0 0 0 0 0 0 1 0 0 8 0 0 0 0 0 0 0 1 0 0
9 0 0 0 0 0 0 0 0 1 0 9 0 0 0 0 0 0 0 0 1 0
10 0 0 0 0 0 0 0 0 0 1 10 0 0 0 0 0 0 0 0 0 1
10 Participant 10 1 1/0/1900 11 Participant 11 1 1/0/1900
1 2 3 4 5 6 7 8 9 10
1 2 3 4 5 6 7 8 9 10
1 1 1/3 1/3 1/9 1 0 0 0 0 0 1 1 5 1/3 1/7 5 0 0 0 0 0
2 3 1 5 1/5 5 0 0 0 0 0 2 1/5 1 1/3 1/7 1 0 0 0 0 0
3 3 1/5 1 1/9 1/3 0 0 0 0 0 3 3 3 1 1/3 7 0 0 0 0 0
4 9 5 9 1 9 0 0 0 0 0 4 7 7 3 1 7 0 0 0 0 0
5 1 1/5 3 1/9 1 0 0 0 0 0 5 1/5 1 1/7 1/7 1 0 0 0 0 0
6 0 0 0 0 0 1 0 0 0 0 6 0 0 0 0 0 1 0 0 0 0
7 0 0 0 0 0 0 1 0 0 0 7 0 0 0 0 0 0 1 0 0 0
8 0 0 0 0 0 0 0 1 0 0 8 0 0 0 0 0 0 0 1 0 0
9 0 0 0 0 0 0 0 0 1 0 9 0 0 0 0 0 0 0 0 1 0
10 0 0 0 0 0 0 0 0 0 1 10 0 0 0 0 0 0 0 0 0 1
12 Participant 12 1 1/0/1900 13 Participant 13 1 1/0/1900
1 2 3 4 5 6 7 8 9 10
1 2 3 4 5 6 7 8 9 10
1 1 1 1/7 5 3 0 0 0 0 0 1 1 1 1/7 5 3 0 0 0 0 0
2 1 1 1/5 5 7 0 0 0 0 0 2 1 1 1/5 5 7 0 0 0 0 0
3 7 5 1 9 7 0 0 0 0 0 3 7 5 1 9 7 0 0 0 0 0
4 1/5 1/5 1/9 1 1 0 0 0 0 0 4 1/5 1/5 1/9 1 1 0 0 0 0 0
5 1/3 1/7 1/7 1 1 0 0 0 0 0 5 1/3 1/7 1/7 1 1 0 0 0 0 0
6 0 0 0 0 0 1 0 0 0 0 6 0 0 0 0 0 1 0 0 0 0
7 0 0 0 0 0 0 1 0 0 0 7 0 0 0 0 0 0 1 0 0 0
8 0 0 0 0 0 0 0 1 0 0 8 0 0 0 0 0 0 0 1 0 0
9 0 0 0 0 0 0 0 0 1 0 9 0 0 0 0 0 0 0 0 1 0
10 0 0 0 0 0 0 0 0 0 1 10 0 0 0 0 0 0 0 0 0 1

139
14 Participant 14 1 1/0/1900 15 Participant 15 1 1/0/1900
1 2 3 4 5 6 7 8 9 10
1 2 3 4 5 6 7 8 9 10
1 1 3 1/7 3 1/3 0 0 0 0 0 1 1 3 5 7 9 0 0 0 0 0
2 1/3 1 1/9 1/3 1/3 0 0 0 0 0 2 1/3 1 1 3 5 0 0 0 0 0
3 7 9 1 5 5 0 0 0 0 0 3 1/5 1 1 1 5 0 0 0 0 0
4 1/3 3 1/5 1 1/3 0 0 0 0 0 4 1/7 1/3 1 1 9 0 0 0 0 0
5 3 3 1/5 3 1 0 0 0 0 0 5 1/9 1/5 1/5 1/9 1 0 0 0 0 0
6 0 0 0 0 0 1 0 0 0 0 6 0 0 0 0 0 1 0 0 0 0
7 0 0 0 0 0 0 1 0 0 0 7 0 0 0 0 0 0 1 0 0 0
8 0 0 0 0 0 0 0 1 0 0 8 0 0 0 0 0 0 0 1 0 0
9 0 0 0 0 0 0 0 0 1 0 9 0 0 0 0 0 0 0 0 1 0
10 0 0 0 0 0 0 0 0 0 1 10 0 0 0 0 0 0 0 0 0 1

.
0202

ب
.

ج