Embed Size (px)
Citation preview
Developer Documentation
© 2020 General Electric Company
Contents
Chapter 1: KPI Development (Java) 1Analytic Development in Java 2
Chapter 2: KPI Development (Python) 11Download and Explore Sample Python Spark Analytic 12
Chapter 3: Upload and Deploy a Forecasting Analytic 19
Chapter 4: Generate Analytic with Alerts 21
ii Developer Documentation
Copyright GE Digital© 2020 General Electric Company.
GE, the GE Monogram, and Predix are either registered trademarks or trademarks of General ElectricCompany. All other trademarks are the property of their respective owners.
This document may contain Confidential/Proprietary information of General Electric Company and/or itssuppliers or vendors. Distribution or reproduction is prohibited without permission.
THIS DOCUMENT AND ITS CONTENTS ARE PROVIDED "AS IS," WITH NO REPRESENTATION ORWARRANTIES OF ANY KIND, WHETHER EXPRESS OR IMPLIED, INCLUDING BUT NOT LIMITED TOWARRANTIES OF DESIGN, MERCHANTABILITY, OR FITNESS FOR A PARTICULAR PURPOSE. ALL OTHERLIABILITY ARISING FROM RELIANCE UPON ANY INFORMATION CONTAINED HEREIN IS EXPRESSLYDISCLAIMED.
Access to and use of the software described in this document is conditioned on acceptance of the EndUser License Agreement and compliance with its terms.
© 2020 General Electric Company iii

Chapter
1KPI Development (Java)Topics:
• Analytic Development in Java
© 2020 General Electric Company 1
Analytic Development in JavaUse the Operations Performance Management analytic management service to build your computationlogic and artifacts. It includes runtime services to deploy to the analytic framework.
As a analytic developer, you can create analytic definitions to read data coming from a specific input datasource and write the analytic calculations into a persistent data store. The default persistent data storefor the current analytic management services is the APM time series.
The computation artifact includes implementation logic for computing the key performance indicatorsusing data from defined input data sources.
Download and Explore Sample Java Spark AnalyticAs an analytic developer, you can use the analytics sample package to explore and understand a starterJava package containing sample analytic code. The following information will help you understand anddevelop your computation logic in Java.
Before You Begin
You have downloaded and set up your OPM Sandbox Docker or environment to enable the developmentof the analytic in Java.
Note: The OPM Sandbox Docker folder on Box is currently available to internal users only. If you do nothave view or download access the folder and would like to request access, contact the OPM developmentsupport team.
Procedure
1. Download the oo-analytics repository locally.
If you do not have access to the repo, contact the OPM development support team.
2. Extract the contents of the repo locally.
3. Navigate to the Andromeda_Simple_KPIs folder in the extracted.
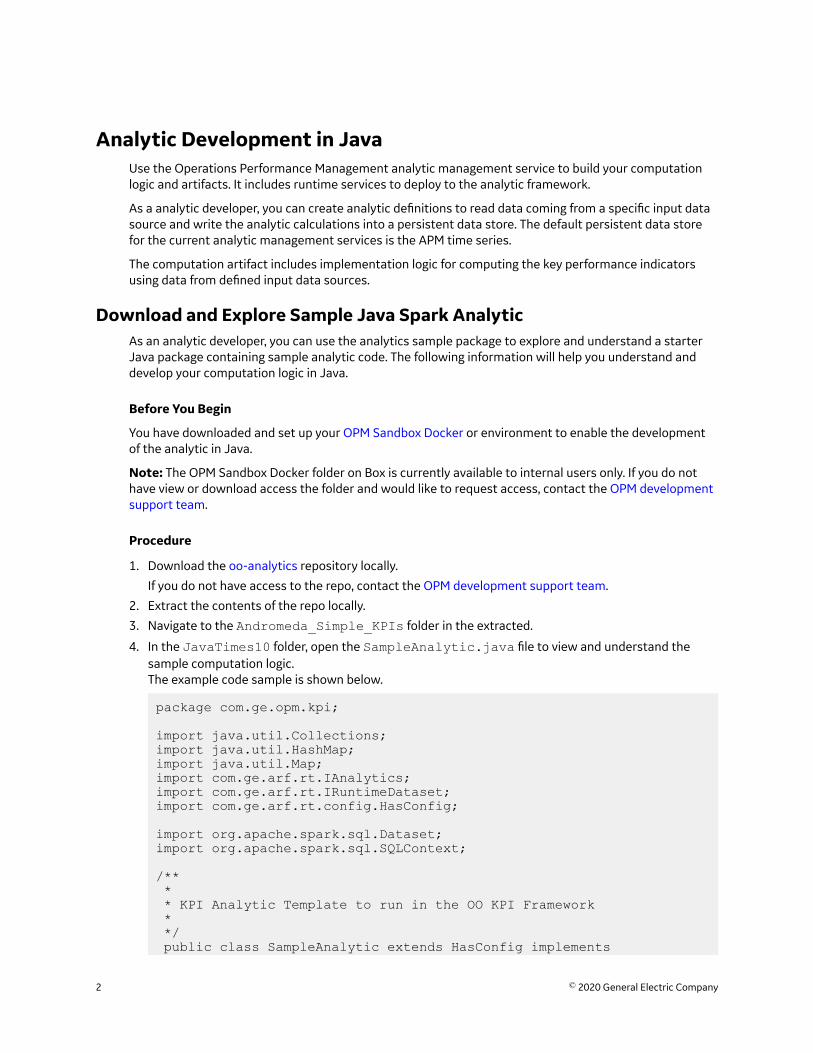
4. In the JavaTimes10 folder, open the SampleAnalytic.java file to view and understand thesample computation logic.The example code sample is shown below.
package com.ge.opm.kpi;
import java.util.Collections;import java.util.HashMap;import java.util.Map;import com.ge.arf.rt.IAnalytics;import com.ge.arf.rt.IRuntimeDataset;import com.ge.arf.rt.config.HasConfig;
import org.apache.spark.sql.Dataset;import org.apache.spark.sql.SQLContext;
/** * * KPI Analytic Template to run in the OO KPI Framework * */ public class SampleAnalytic extends HasConfig implements
2 © 2020 General Electric Company
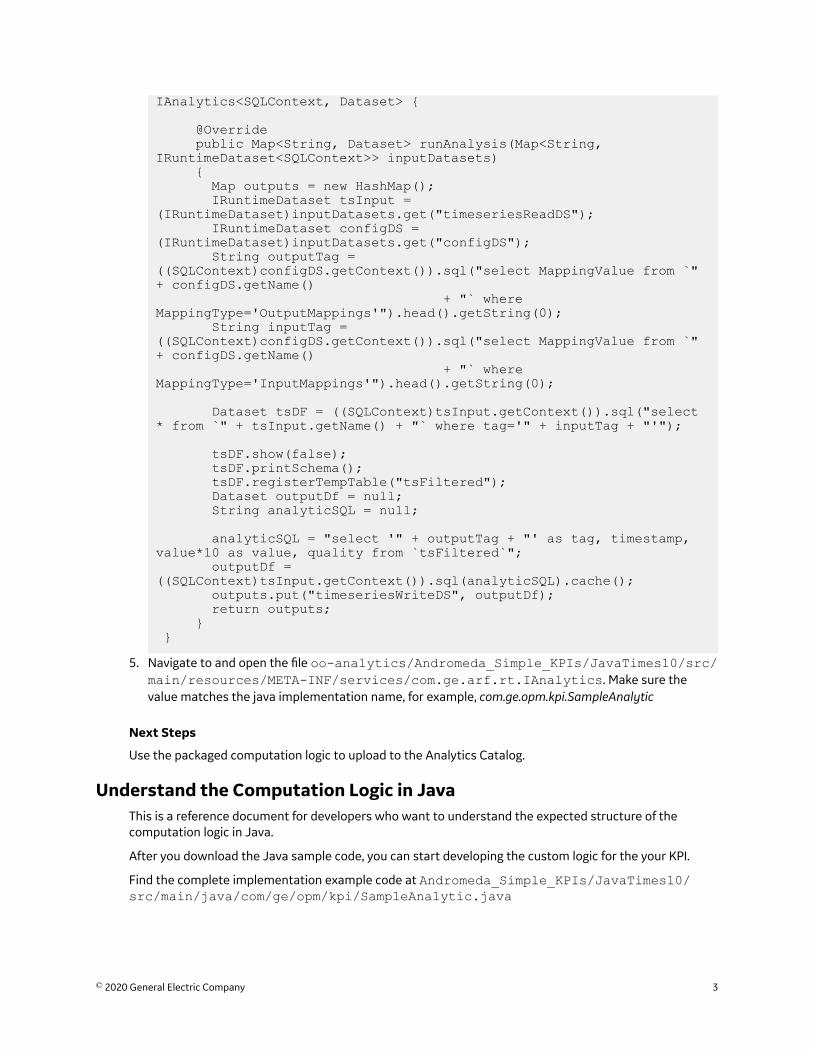
IAnalytics<SQLContext, Dataset> {
@Override public Map<String, Dataset> runAnalysis(Map<String, IRuntimeDataset<SQLContext>> inputDatasets) { Map outputs = new HashMap(); IRuntimeDataset tsInput = (IRuntimeDataset)inputDatasets.get("timeseriesReadDS"); IRuntimeDataset configDS = (IRuntimeDataset)inputDatasets.get("configDS"); String outputTag = ((SQLContext)configDS.getContext()).sql("select MappingValue from `" + configDS.getName() + "` where MappingType='OutputMappings'").head().getString(0); String inputTag = ((SQLContext)configDS.getContext()).sql("select MappingValue from `" + configDS.getName() + "` where MappingType='InputMappings'").head().getString(0);
Dataset tsDF = ((SQLContext)tsInput.getContext()).sql("select * from `" + tsInput.getName() + "` where tag='" + inputTag + "'");
tsDF.show(false); tsDF.printSchema(); tsDF.registerTempTable("tsFiltered"); Dataset outputDf = null; String analyticSQL = null;
analyticSQL = "select '" + outputTag + "' as tag, timestamp, value*10 as value, quality from `tsFiltered`"; outputDf = ((SQLContext)tsInput.getContext()).sql(analyticSQL).cache(); outputs.put("timeseriesWriteDS", outputDf); return outputs; } }
5. Navigate to and open the file oo-analytics/Andromeda_Simple_KPIs/JavaTimes10/src/main/resources/META-INF/services/com.ge.arf.rt.IAnalytics. Make sure thevalue matches the java implementation name, for example, com.ge.opm.kpi.SampleAnalytic
Next Steps
Use the packaged computation logic to upload to the Analytics Catalog.
Understand the Computation Logic in JavaThis is a reference document for developers who want to understand the expected structure of thecomputation logic in Java.
After you download the Java sample code, you can start developing the custom logic for the your KPI.
Find the complete implementation example code at Andromeda_Simple_KPIs/JavaTimes10/src/main/java/com/ge/opm/kpi/SampleAnalytic.java
© 2020 General Electric Company 3
OPM Data Providers
OPM data providers construct the incoming data into collections of data tables that you can manipulateusing filters and queries.
The following example code snippet shows retrieving the asset and time-series data sources.
IRuntimeDataset<SQLContext> assetDS = (IRuntimeDataset)inputDatasets.get("assetReadDS");IRuntimeDataset<SQLContext> timeseriesDS = inputDatasets.get("timeseriesReadDS");
In the above code assetReadDS and timeseriesReadDS are the input data source provider namesused in the KPI definition.
Getting specific input data into data frames
OPM data providers use data frames to construct the incoming and outgoing data. These data framesenable you to use simple query statements to get the required data for your computation. You can alsoperform simple join operations to filter for specific data to run the computation. The computed KPIs andtag data are produced as data frames to write back into the corresponding output data providers.
The following example code snippet shows setting your IRuntimeDataset objects.
IRuntimeDataset tsInput = (IRuntimeDataset)inputDatasets.get("timeseriesReadDS"); IRuntimeDataset configDS = (IRuntimeDataset)inputDatasets.get("configDS");
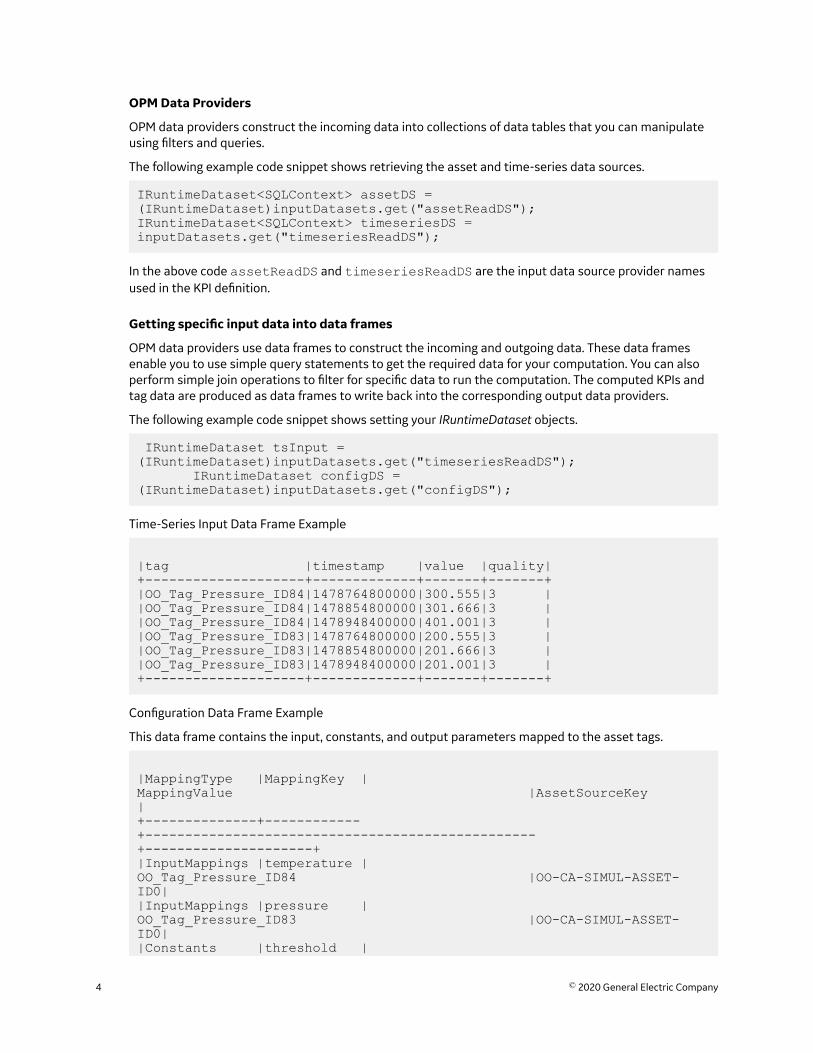
Time-Series Input Data Frame Example
|tag |timestamp |value |quality|+--------------------+-------------+-------+-------+|OO_Tag_Pressure_ID84|1478764800000|300.555|3 ||OO_Tag_Pressure_ID84|1478854800000|301.666|3 ||OO_Tag_Pressure_ID84|1478948400000|401.001|3 ||OO_Tag_Pressure_ID83|1478764800000|200.555|3 ||OO_Tag_Pressure_ID83|1478854800000|201.666|3 ||OO_Tag_Pressure_ID83|1478948400000|201.001|3 |+--------------------+-------------+-------+-------+
Configuration Data Frame Example
This data frame contains the input, constants, and output parameters mapped to the asset tags.
|MappingType |MappingKey |MappingValue |AssetSourceKey |+--------------+------------+-------------------------------------------------+---------------------+|InputMappings |temperature |OO_Tag_Pressure_ID84 |OO-CA-SIMUL-ASSET-ID0||InputMappings |pressure |OO_Tag_Pressure_ID83 |OO-CA-SIMUL-ASSET-ID0||Constants |threshold |
4 © 2020 General Electric Company
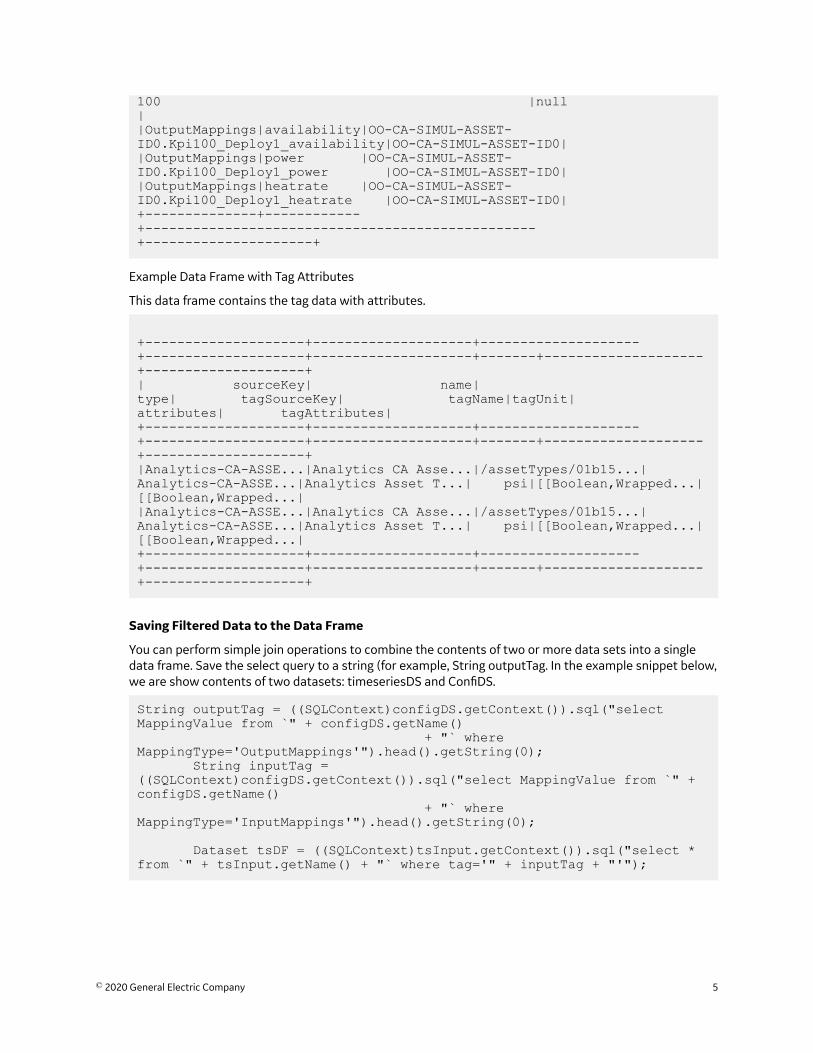
100 |null ||OutputMappings|availability|OO-CA-SIMUL-ASSET-ID0.Kpi100_Deploy1_availability|OO-CA-SIMUL-ASSET-ID0||OutputMappings|power |OO-CA-SIMUL-ASSET-ID0.Kpi100_Deploy1_power |OO-CA-SIMUL-ASSET-ID0||OutputMappings|heatrate |OO-CA-SIMUL-ASSET-ID0.Kpi100_Deploy1_heatrate |OO-CA-SIMUL-ASSET-ID0|+--------------+------------+-------------------------------------------------+---------------------+
Example Data Frame with Tag Attributes
This data frame contains the tag data with attributes.
+--------------------+--------------------+--------------------+--------------------+--------------------+-------+--------------------+--------------------+| sourceKey| name| type| tagSourceKey| tagName|tagUnit| attributes| tagAttributes|+--------------------+--------------------+--------------------+--------------------+--------------------+-------+--------------------+--------------------+|Analytics-CA-ASSE...|Analytics CA Asse...|/assetTypes/01b15...|Analytics-CA-ASSE...|Analytics Asset T...| psi|[[Boolean,Wrapped...|[[Boolean,Wrapped...||Analytics-CA-ASSE...|Analytics CA Asse...|/assetTypes/01b15...|Analytics-CA-ASSE...|Analytics Asset T...| psi|[[Boolean,Wrapped...|[[Boolean,Wrapped...|+--------------------+--------------------+--------------------+--------------------+--------------------+-------+--------------------+--------------------+
Saving Filtered Data to the Data Frame
You can perform simple join operations to combine the contents of two or more data sets into a singledata frame. Save the select query to a string (for example, String outputTag. In the example snippet below,we are show contents of two datasets: timeseriesDS and ConfiDS.
String outputTag = ((SQLContext)configDS.getContext()).sql("select MappingValue from `" + configDS.getName() + "` where MappingType='OutputMappings'").head().getString(0); String inputTag = ((SQLContext)configDS.getContext()).sql("select MappingValue from `" + configDS.getName() + "` where MappingType='InputMappings'").head().getString(0);
Dataset tsDF = ((SQLContext)tsInput.getContext()).sql("select * from `" + tsInput.getName() + "` where tag='" + inputTag + "'");
© 2020 General Electric Company 5
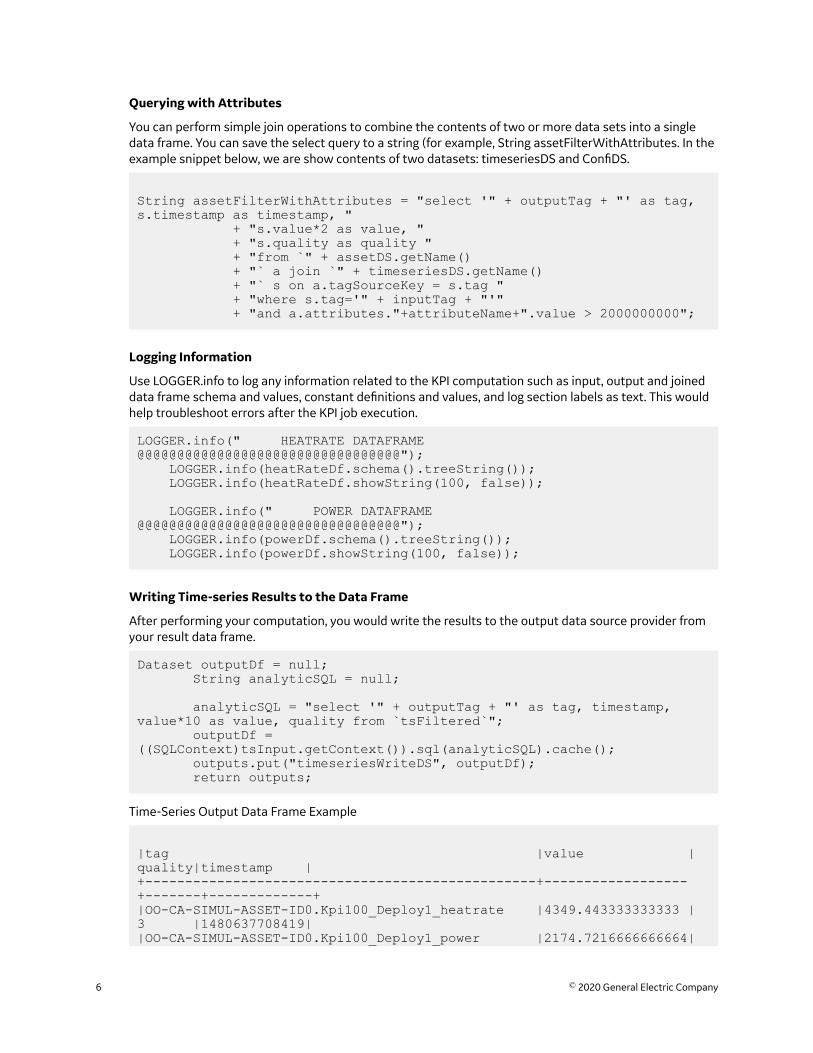
Querying with Attributes
You can perform simple join operations to combine the contents of two or more data sets into a singledata frame. You can save the select query to a string (for example, String assetFilterWithAttributes. In theexample snippet below, we are show contents of two datasets: timeseriesDS and ConfiDS.
String assetFilterWithAttributes = "select '" + outputTag + "' as tag, s.timestamp as timestamp, " + "s.value*2 as value, " + "s.quality as quality " + "from `" + assetDS.getName() + "` a join `" + timeseriesDS.getName() + "` s on a.tagSourceKey = s.tag " + "where s.tag='" + inputTag + "'" + "and a.attributes."+attributeName+".value > 2000000000";
Logging Information
Use LOGGER.info to log any information related to the KPI computation such as input, output and joineddata frame schema and values, constant definitions and values, and log section labels as text. This wouldhelp troubleshoot errors after the KPI job execution.
LOGGER.info(" HEATRATE DATAFRAME @@@@@@@@@@@@@@@@@@@@@@@@@@@@@@@@@"); LOGGER.info(heatRateDf.schema().treeString()); LOGGER.info(heatRateDf.showString(100, false)); LOGGER.info(" POWER DATAFRAME @@@@@@@@@@@@@@@@@@@@@@@@@@@@@@@@@"); LOGGER.info(powerDf.schema().treeString()); LOGGER.info(powerDf.showString(100, false));
Writing Time-series Results to the Data Frame
After performing your computation, you would write the results to the output data source provider fromyour result data frame.
Dataset outputDf = null; String analyticSQL = null;
analyticSQL = "select '" + outputTag + "' as tag, timestamp, value*10 as value, quality from `tsFiltered`"; outputDf = ((SQLContext)tsInput.getContext()).sql(analyticSQL).cache(); outputs.put("timeseriesWriteDS", outputDf); return outputs;
Time-Series Output Data Frame Example
|tag |value |quality|timestamp |+-------------------------------------------------+------------------+-------+-------------+|OO-CA-SIMUL-ASSET-ID0.Kpi100_Deploy1_heatrate |4349.443333333333 |3 |1480637708419||OO-CA-SIMUL-ASSET-ID0.Kpi100_Deploy1_power |2174.7216666666664|
6 © 2020 General Electric Company
3 |1480637708419||OO-CA-SIMUL-ASSET-ID0.Kpi100_Deploy1_availability|0.0 |3 |1480637708419|+-------------------------------------------------+------------------+-------+-------------+
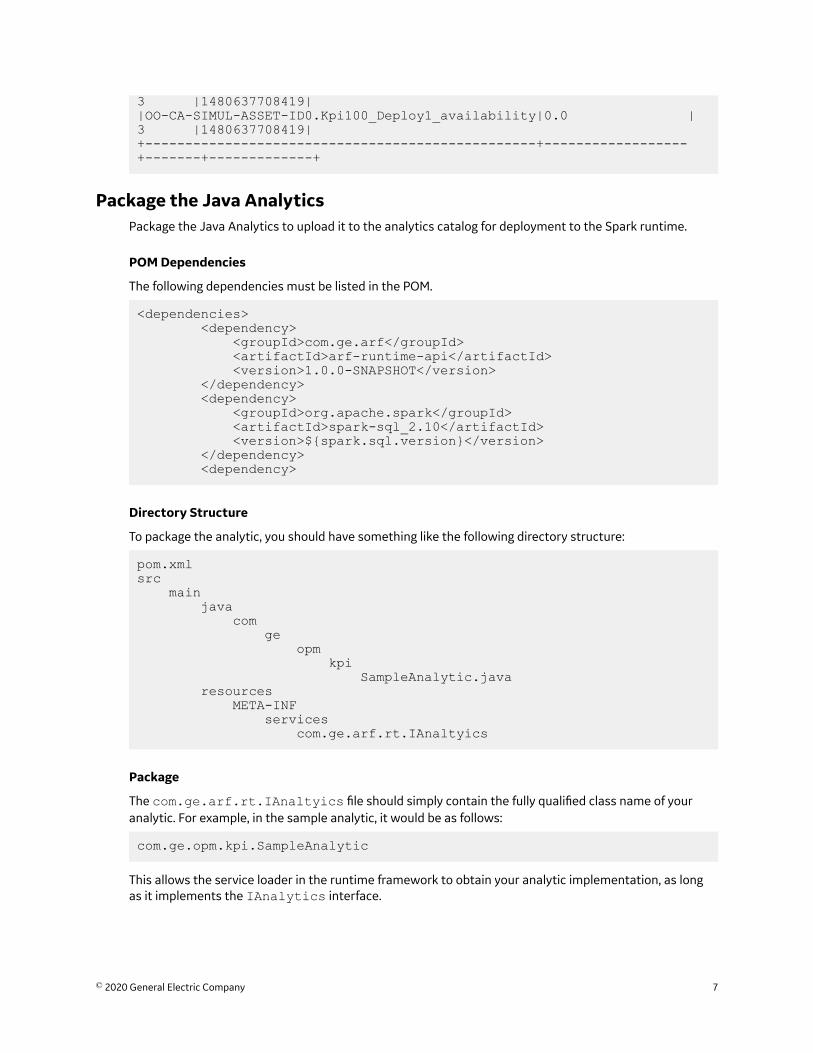
Package the Java AnalyticsPackage the Java Analytics to upload it to the analytics catalog for deployment to the Spark runtime.
POM Dependencies
The following dependencies must be listed in the POM.
<dependencies> <dependency> <groupId>com.ge.arf</groupId> <artifactId>arf-runtime-api</artifactId> <version>1.0.0-SNAPSHOT</version> </dependency> <dependency> <groupId>org.apache.spark</groupId> <artifactId>spark-sql_2.10</artifactId> <version>${spark.sql.version}</version> </dependency> <dependency>
Directory Structure
To package the analytic, you should have something like the following directory structure:
pom.xmlsrc main java com ge opm kpi SampleAnalytic.java resources META-INF services com.ge.arf.rt.IAnaltyics
Package
The com.ge.arf.rt.IAnaltyics file should simply contain the fully qualified class name of youranalytic. For example, in the sample analytic, it would be as follows:
com.ge.opm.kpi.SampleAnalytic
This allows the service loader in the runtime framework to obtain your analytic implementation, as longas it implements the IAnalytics interface.
© 2020 General Electric Company 7
Use the mvn clean install --settings mvnsettings.xml command to build your analytic .jar file. Make sure you point to the settings.xml in the sample analytic folder. The location of thesettings.xml is the same as the POM file location.
Zip the .jar file to complete the packaging process.
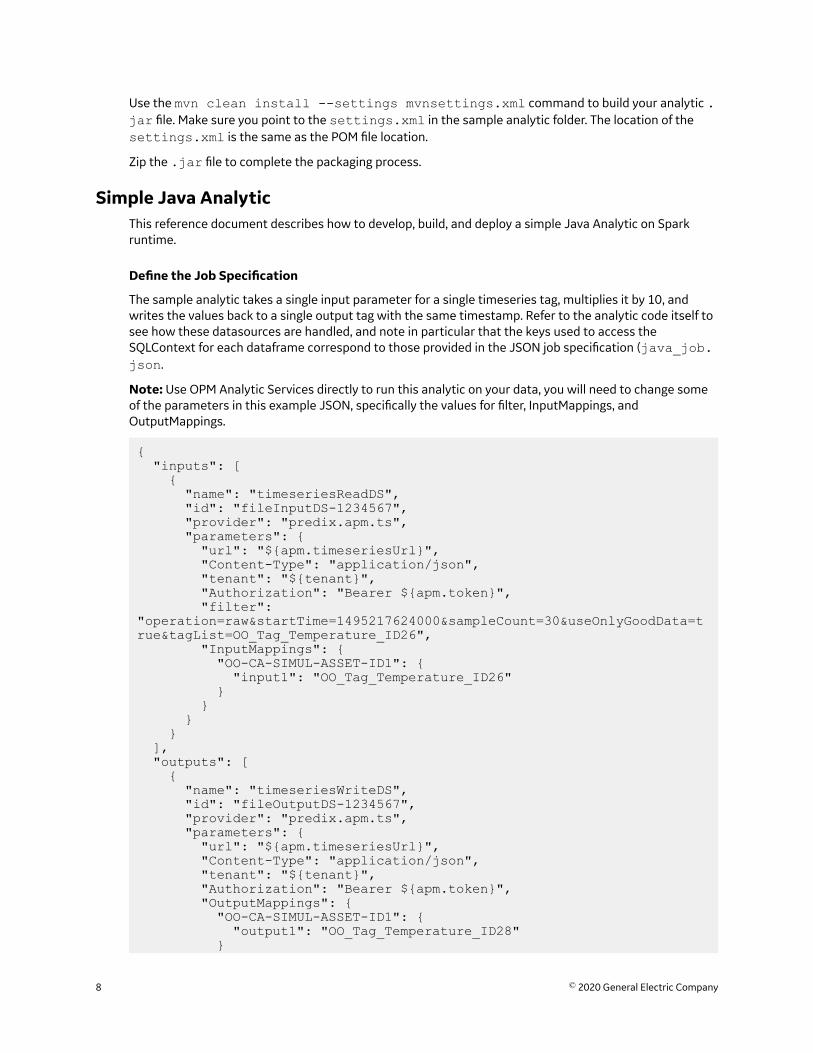
Simple Java AnalyticThis reference document describes how to develop, build, and deploy a simple Java Analytic on Sparkruntime.
Define the Job Specification
The sample analytic takes a single input parameter for a single timeseries tag, multiplies it by 10, andwrites the values back to a single output tag with the same timestamp. Refer to the analytic code itself tosee how these datasources are handled, and note in particular that the keys used to access theSQLContext for each dataframe correspond to those provided in the JSON job specification (java_job.json.
Note: Use OPM Analytic Services directly to run this analytic on your data, you will need to change someof the parameters in this example JSON, specifically the values for filter, InputMappings, andOutputMappings.
{ "inputs": [ { "name": "timeseriesReadDS", "id": "fileInputDS-1234567", "provider": "predix.apm.ts", "parameters": { "url": "${apm.timeseriesUrl}", "Content-Type": "application/json", "tenant": "${tenant}", "Authorization": "Bearer ${apm.token}", "filter": "operation=raw&startTime=1495217624000&sampleCount=30&useOnlyGoodData=true&tagList=OO_Tag_Temperature_ID26", "InputMappings": { "OO-CA-SIMUL-ASSET-ID1": { "input1": "OO_Tag_Temperature_ID26" } } } } ], "outputs": [ { "name": "timeseriesWriteDS", "id": "fileOutputDS-1234567", "provider": "predix.apm.ts", "parameters": { "url": "${apm.timeseriesUrl}", "Content-Type": "application/json", "tenant": "${tenant}", "Authorization": "Bearer ${apm.token}", "OutputMappings": { "OO-CA-SIMUL-ASSET-ID1": { "output1": "OO_Tag_Temperature_ID28" }
8 © 2020 General Electric Company
} }, "streaming": false, "schema": null } ], "language": "JAVA"}
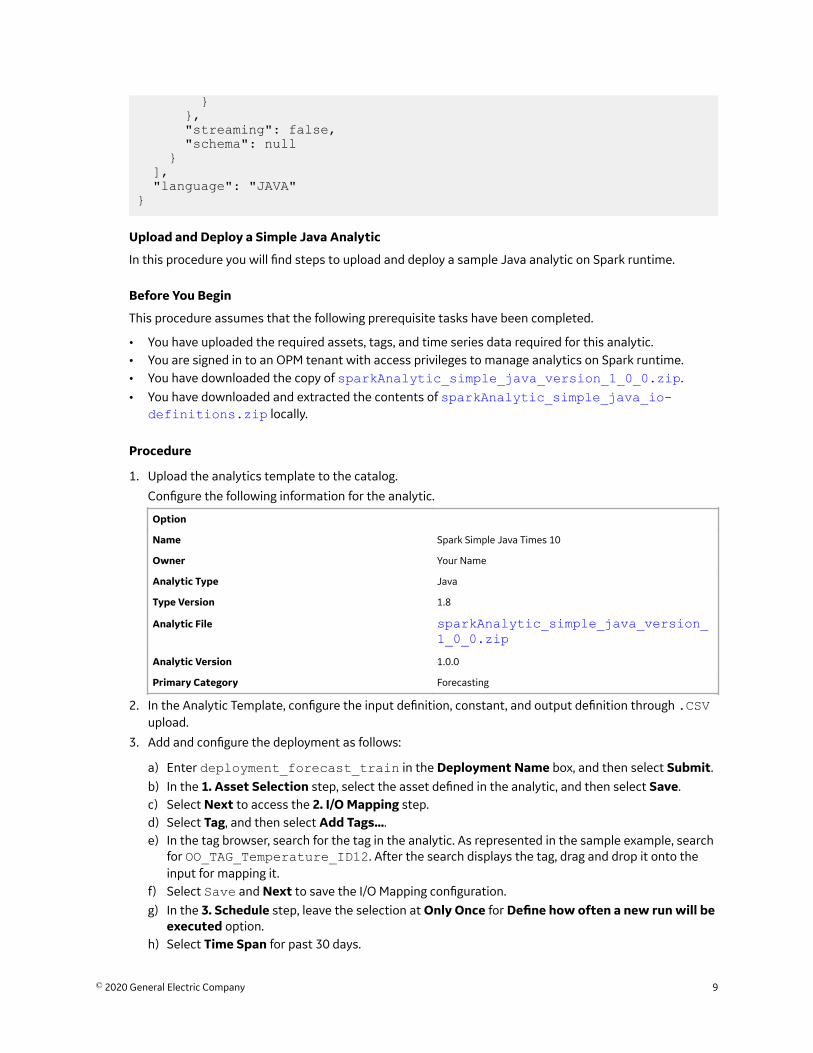
Upload and Deploy a Simple Java Analytic
In this procedure you will find steps to upload and deploy a sample Java analytic on Spark runtime.
Before You Begin
This procedure assumes that the following prerequisite tasks have been completed.
• You have uploaded the required assets, tags, and time series data required for this analytic.• You are signed in to an OPM tenant with access privileges to manage analytics on Spark runtime.• You have downloaded the copy of sparkAnalytic_simple_java_version_1_0_0.zip.• You have downloaded and extracted the contents of sparkAnalytic_simple_java_io-
definitions.zip locally.
Procedure
1. Upload the analytics template to the catalog.
Configure the following information for the analytic.
Option
Name Spark Simple Java Times 10
Owner Your Name
Analytic Type Java
Type Version 1.8
Analytic File sparkAnalytic_simple_java_version_1_0_0.zip
Analytic Version 1.0.0
Primary Category Forecasting
2. In the Analytic Template, configure the input definition, constant, and output definition through .CSVupload.
3. Add and configure the deployment as follows:
a) Enter deployment_forecast_train in the Deployment Name box, and then select Submit.b) In the 1. Asset Selection step, select the asset defined in the analytic, and then select Save.c) Select Next to access the 2. I/O Mapping step.d) Select Tag, and then select Add Tags....e) In the tag browser, search for the tag in the analytic. As represented in the sample example, search
for OO_TAG_Temperature_ID12. After the search displays the tag, drag and drop it onto theinput for mapping it.
f) Select Save and Next to save the I/O Mapping configuration.g) In the 3. Schedule step, leave the selection at Only Once for Define how often a new run will be
executed option.h) Select Time Span for past 30 days.
© 2020 General Electric Company 9

i) Leave the Sample Interval at the default value of 1 Minute.j) Select Save, and then select Deploy.
The deployment is saved to the Spark runtime. After successful deployment, the status updates toRun Once.
Next Steps
Visualize the analytic output tags using the Analysis app.
10 © 2020 General Electric Company
Chapter
2KPI Development (Python)Topics:
• Download and Explore SamplePython Spark Analytic
© 2020 General Electric Company 11
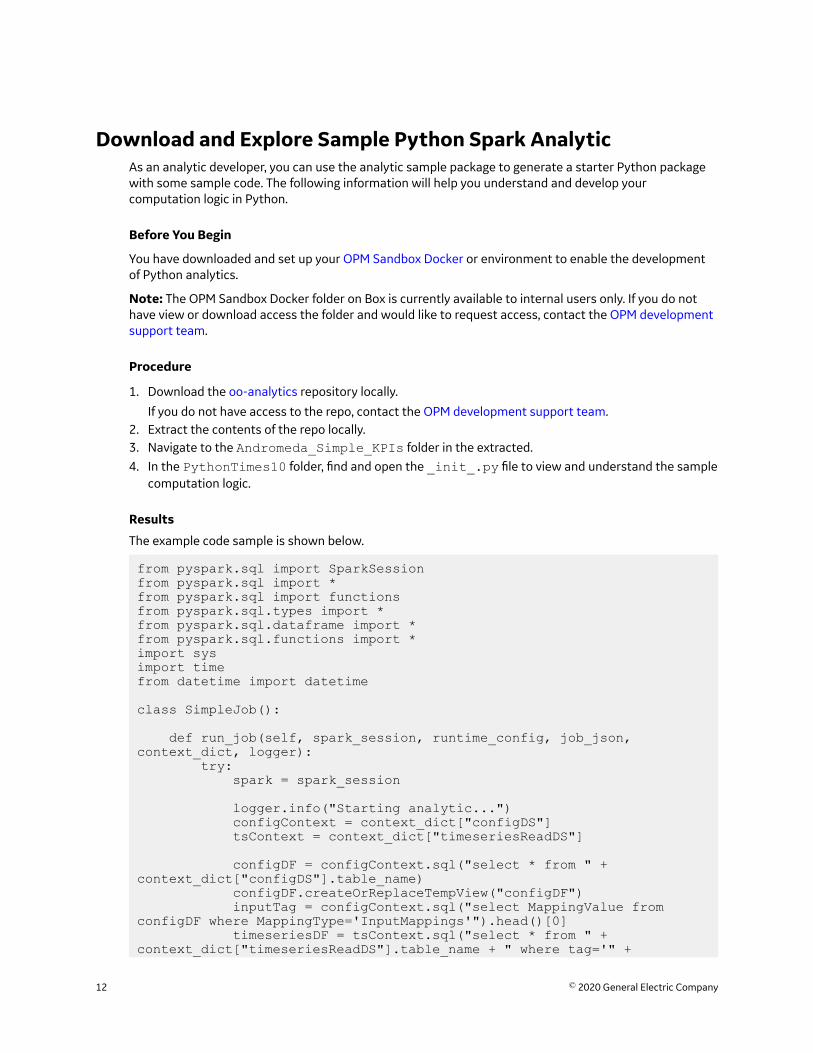
Download and Explore Sample Python Spark AnalyticAs an analytic developer, you can use the analytic sample package to generate a starter Python packagewith some sample code. The following information will help you understand and develop yourcomputation logic in Python.
Before You Begin
You have downloaded and set up your OPM Sandbox Docker or environment to enable the developmentof Python analytics.
Note: The OPM Sandbox Docker folder on Box is currently available to internal users only. If you do nothave view or download access the folder and would like to request access, contact the OPM developmentsupport team.
Procedure
1. Download the oo-analytics repository locally.
If you do not have access to the repo, contact the OPM development support team.2. Extract the contents of the repo locally.3. Navigate to the Andromeda_Simple_KPIs folder in the extracted.4. In the PythonTimes10 folder, find and open the _init_.py file to view and understand the sample
computation logic.
Results
The example code sample is shown below.
from pyspark.sql import SparkSessionfrom pyspark.sql import *from pyspark.sql import functionsfrom pyspark.sql.types import *from pyspark.sql.dataframe import *from pyspark.sql.functions import *import sysimport timefrom datetime import datetime
class SimpleJob():
def run_job(self, spark_session, runtime_config, job_json, context_dict, logger): try: spark = spark_session
logger.info("Starting analytic...") configContext = context_dict["configDS"] tsContext = context_dict["timeseriesReadDS"]
configDF = configContext.sql("select * from " + context_dict["configDS"].table_name) configDF.createOrReplaceTempView("configDF") inputTag = configContext.sql("select MappingValue from configDF where MappingType='InputMappings'").head()[0] timeseriesDF = tsContext.sql("select * from " + context_dict["timeseriesReadDS"].table_name + " where tag='" +
12 © 2020 General Electric Company
inputTag + "'") timeseriesDF.createOrReplaceTempView("timeseriesDF")
outputTag = configContext.sql("select MappingValue from configDF where MappingType='OutputMappings'").head()[0] resultDF = tsContext.sql("select '" + outputTag + "' as tag, timestamp as timestamp, 10*value as value, quality as quality from timeseriesDF")
logger.info("Returning result...") result = {"timeseriesWriteDS" : resultDF} return result except Exception as e: logger.info("Error: " + str(e)) exc_tb = sys.exc_info()[2] logger.info("Line number: " + str(exc_tb.tb_lineno))
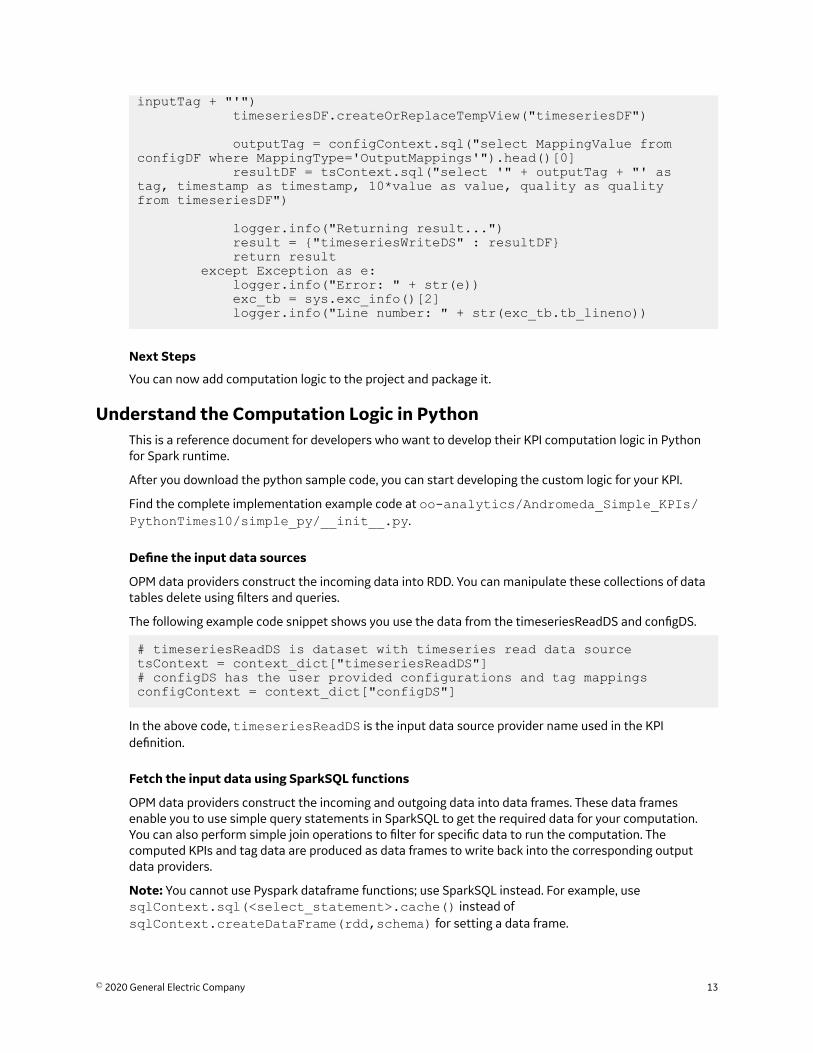
Next Steps
You can now add computation logic to the project and package it.
Understand the Computation Logic in PythonThis is a reference document for developers who want to develop their KPI computation logic in Pythonfor Spark runtime.
After you download the python sample code, you can start developing the custom logic for your KPI.
Find the complete implementation example code at oo-analytics/Andromeda_Simple_KPIs/PythonTimes10/simple_py/__init__.py.
Define the input data sources
OPM data providers construct the incoming data into RDD. You can manipulate these collections of datatables delete using filters and queries.
The following example code snippet shows you use the data from the timeseriesReadDS and configDS.
# timeseriesReadDS is dataset with timeseries read data sourcetsContext = context_dict["timeseriesReadDS"]# configDS has the user provided configurations and tag mappingsconfigContext = context_dict["configDS"]
In the above code, timeseriesReadDS is the input data source provider name used in the KPIdefinition.
Fetch the input data using SparkSQL functions
OPM data providers construct the incoming and outgoing data into data frames. These data framesenable you to use simple query statements in SparkSQL to get the required data for your computation.You can also perform simple join operations to filter for specific data to run the computation. Thecomputed KPIs and tag data are produced as data frames to write back into the corresponding outputdata providers.
Note: You cannot use Pyspark dataframe functions; use SparkSQL instead. For example, usesqlContext.sql(<select_statement>.cache() instead ofsqlContext.createDataFrame(rdd,schema) for setting a data frame.
© 2020 General Electric Company 13
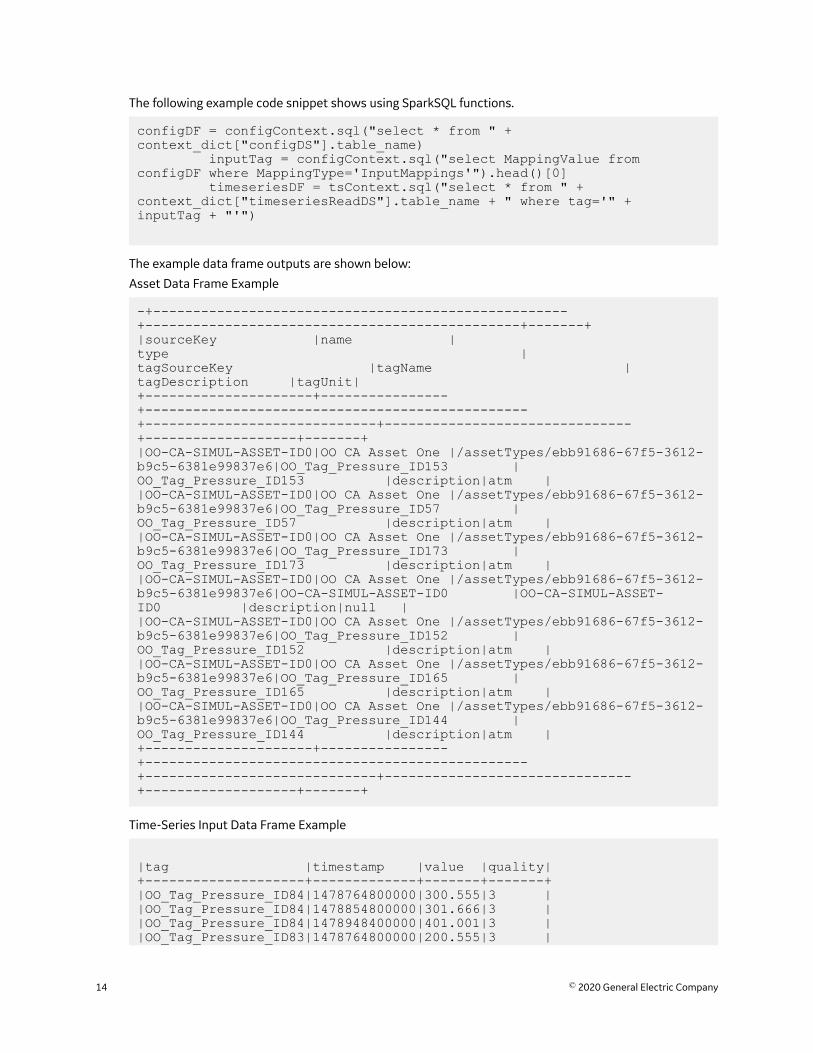
The following example code snippet shows using SparkSQL functions.
configDF = configContext.sql("select * from " + context_dict["configDS"].table_name) inputTag = configContext.sql("select MappingValue from configDF where MappingType='InputMappings'").head()[0] timeseriesDF = tsContext.sql("select * from " + context_dict["timeseriesReadDS"].table_name + " where tag='" + inputTag + "'")
The example data frame outputs are shown below:
Asset Data Frame Example
-+----------------------------------------------------+-----------------------------------------------+-------+|sourceKey |name |type |tagSourceKey |tagName |tagDescription |tagUnit|+---------------------+----------------+------------------------------------------------+-----------------------------+-------------------------------+-------------------+-------+|OO-CA-SIMUL-ASSET-ID0|OO CA Asset One |/assetTypes/ebb91686-67f5-3612-b9c5-6381e99837e6|OO_Tag_Pressure_ID153 |OO_Tag_Pressure_ID153 |description|atm ||OO-CA-SIMUL-ASSET-ID0|OO CA Asset One |/assetTypes/ebb91686-67f5-3612-b9c5-6381e99837e6|OO_Tag_Pressure_ID57 |OO_Tag_Pressure_ID57 |description|atm ||OO-CA-SIMUL-ASSET-ID0|OO CA Asset One |/assetTypes/ebb91686-67f5-3612-b9c5-6381e99837e6|OO_Tag_Pressure_ID173 |OO_Tag_Pressure_ID173 |description|atm ||OO-CA-SIMUL-ASSET-ID0|OO CA Asset One |/assetTypes/ebb91686-67f5-3612-b9c5-6381e99837e6|OO-CA-SIMUL-ASSET-ID0 |OO-CA-SIMUL-ASSET-ID0 |description|null ||OO-CA-SIMUL-ASSET-ID0|OO CA Asset One |/assetTypes/ebb91686-67f5-3612-b9c5-6381e99837e6|OO_Tag_Pressure_ID152 |OO_Tag_Pressure_ID152 |description|atm ||OO-CA-SIMUL-ASSET-ID0|OO CA Asset One |/assetTypes/ebb91686-67f5-3612-b9c5-6381e99837e6|OO_Tag_Pressure_ID165 |OO_Tag_Pressure_ID165 |description|atm ||OO-CA-SIMUL-ASSET-ID0|OO CA Asset One |/assetTypes/ebb91686-67f5-3612-b9c5-6381e99837e6|OO_Tag_Pressure_ID144 |OO_Tag_Pressure_ID144 |description|atm |+---------------------+----------------+------------------------------------------------+-----------------------------+-------------------------------+-------------------+-------+
Time-Series Input Data Frame Example
|tag |timestamp |value |quality|+--------------------+-------------+-------+-------+|OO_Tag_Pressure_ID84|1478764800000|300.555|3 ||OO_Tag_Pressure_ID84|1478854800000|301.666|3 ||OO_Tag_Pressure_ID84|1478948400000|401.001|3 ||OO_Tag_Pressure_ID83|1478764800000|200.555|3 |
14 © 2020 General Electric Company
|OO_Tag_Pressure_ID83|1478854800000|201.666|3 ||OO_Tag_Pressure_ID83|1478948400000|201.001|3 |+--------------------+-------------+-------+-------+
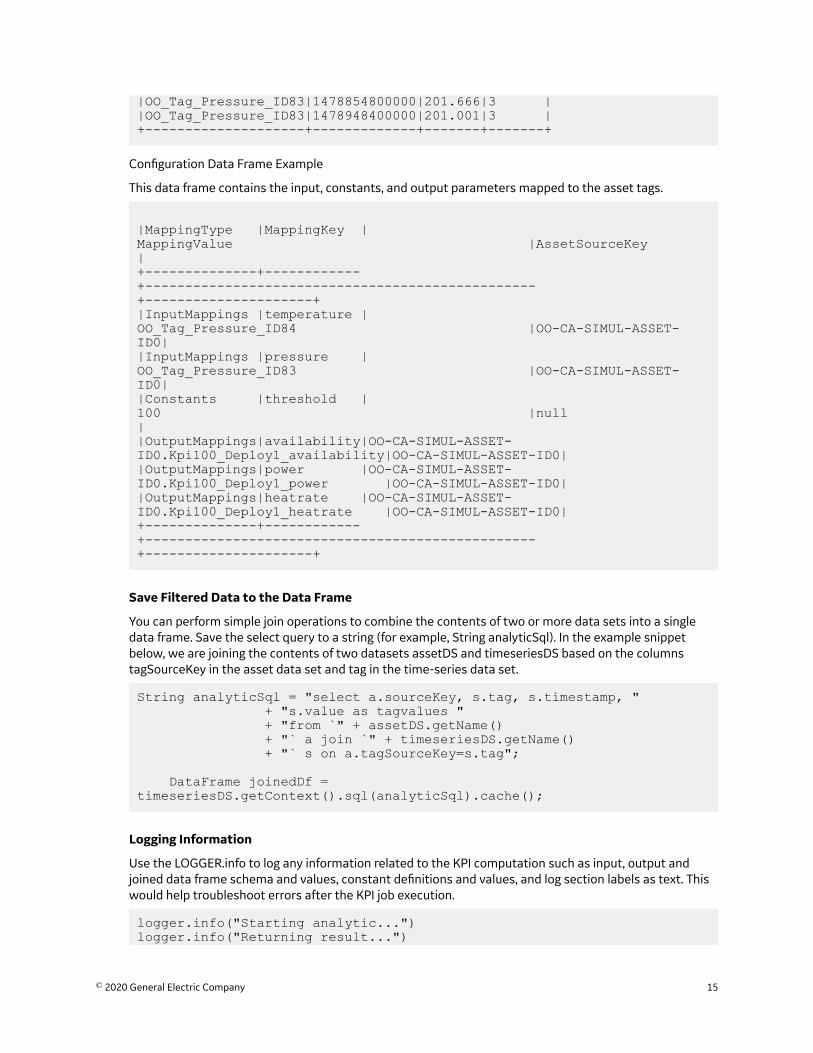
Configuration Data Frame Example
This data frame contains the input, constants, and output parameters mapped to the asset tags.
|MappingType |MappingKey |MappingValue |AssetSourceKey |+--------------+------------+-------------------------------------------------+---------------------+|InputMappings |temperature |OO_Tag_Pressure_ID84 |OO-CA-SIMUL-ASSET-ID0||InputMappings |pressure |OO_Tag_Pressure_ID83 |OO-CA-SIMUL-ASSET-ID0||Constants |threshold |100 |null ||OutputMappings|availability|OO-CA-SIMUL-ASSET-ID0.Kpi100_Deploy1_availability|OO-CA-SIMUL-ASSET-ID0||OutputMappings|power |OO-CA-SIMUL-ASSET-ID0.Kpi100_Deploy1_power |OO-CA-SIMUL-ASSET-ID0||OutputMappings|heatrate |OO-CA-SIMUL-ASSET-ID0.Kpi100_Deploy1_heatrate |OO-CA-SIMUL-ASSET-ID0|+--------------+------------+-------------------------------------------------+---------------------+
Save Filtered Data to the Data Frame
You can perform simple join operations to combine the contents of two or more data sets into a singledata frame. Save the select query to a string (for example, String analyticSql). In the example snippetbelow, we are joining the contents of two datasets assetDS and timeseriesDS based on the columnstagSourceKey in the asset data set and tag in the time-series data set.
String analyticSql = "select a.sourceKey, s.tag, s.timestamp, " + "s.value as tagvalues " + "from `" + assetDS.getName() + "` a join `" + timeseriesDS.getName() + "` s on a.tagSourceKey=s.tag";
DataFrame joinedDf = timeseriesDS.getContext().sql(analyticSql).cache();
Logging Information
Use the LOGGER.info to log any information related to the KPI computation such as input, output andjoined data frame schema and values, constant definitions and values, and log section labels as text. Thiswould help troubleshoot errors after the KPI job execution.
logger.info("Starting analytic...")logger.info("Returning result...")
© 2020 General Electric Company 15
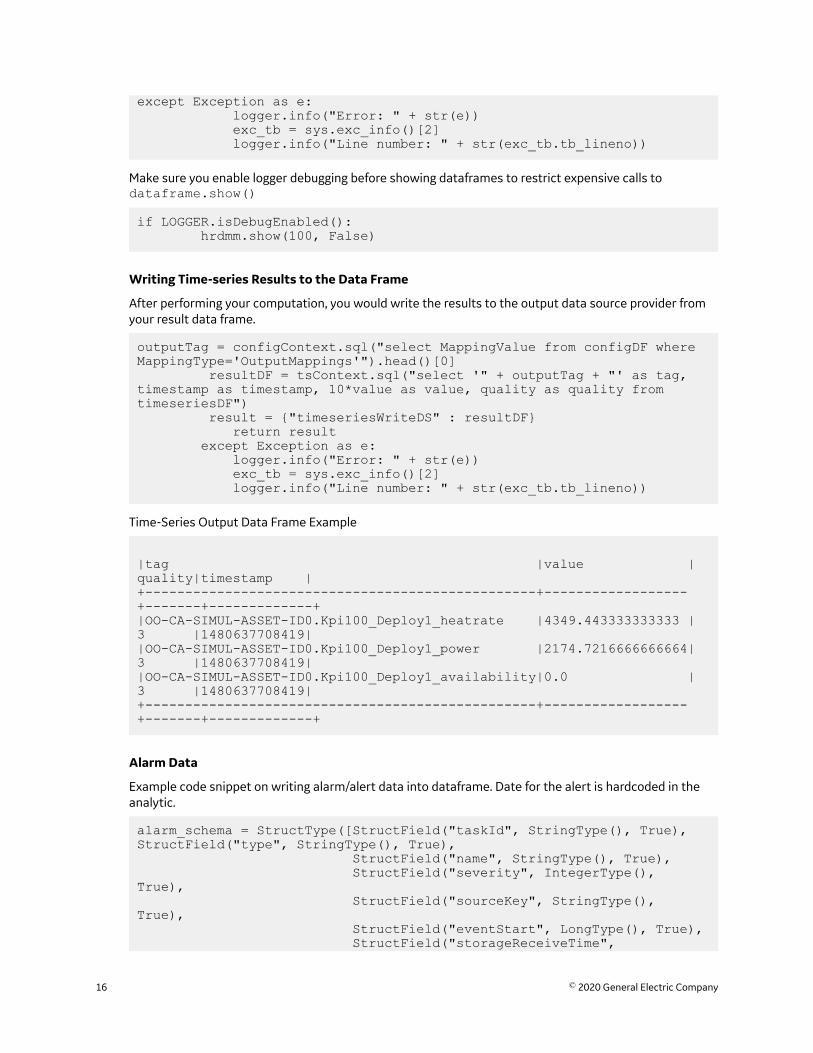
except Exception as e: logger.info("Error: " + str(e)) exc_tb = sys.exc_info()[2] logger.info("Line number: " + str(exc_tb.tb_lineno))
Make sure you enable logger debugging before showing dataframes to restrict expensive calls todataframe.show()
if LOGGER.isDebugEnabled(): hrdmm.show(100, False)
Writing Time-series Results to the Data Frame
After performing your computation, you would write the results to the output data source provider fromyour result data frame.
outputTag = configContext.sql("select MappingValue from configDF where MappingType='OutputMappings'").head()[0] resultDF = tsContext.sql("select '" + outputTag + "' as tag, timestamp as timestamp, 10*value as value, quality as quality from timeseriesDF") result = {"timeseriesWriteDS" : resultDF} return result except Exception as e: logger.info("Error: " + str(e)) exc_tb = sys.exc_info()[2] logger.info("Line number: " + str(exc_tb.tb_lineno))
Time-Series Output Data Frame Example
|tag |value |quality|timestamp |+-------------------------------------------------+------------------+-------+-------------+|OO-CA-SIMUL-ASSET-ID0.Kpi100_Deploy1_heatrate |4349.443333333333 |3 |1480637708419||OO-CA-SIMUL-ASSET-ID0.Kpi100_Deploy1_power |2174.7216666666664|3 |1480637708419||OO-CA-SIMUL-ASSET-ID0.Kpi100_Deploy1_availability|0.0 |3 |1480637708419|+-------------------------------------------------+------------------+-------+-------------+
Alarm Data
Example code snippet on writing alarm/alert data into dataframe. Date for the alert is hardcoded in theanalytic.
alarm_schema = StructType([StructField("taskId", StringType(), True), StructField("type", StringType(), True), StructField("name", StringType(), True), StructField("severity", IntegerType(), True), StructField("sourceKey", StringType(), True), StructField("eventStart", LongType(), True), StructField("storageReceiveTime",
16 © 2020 General Electric Company
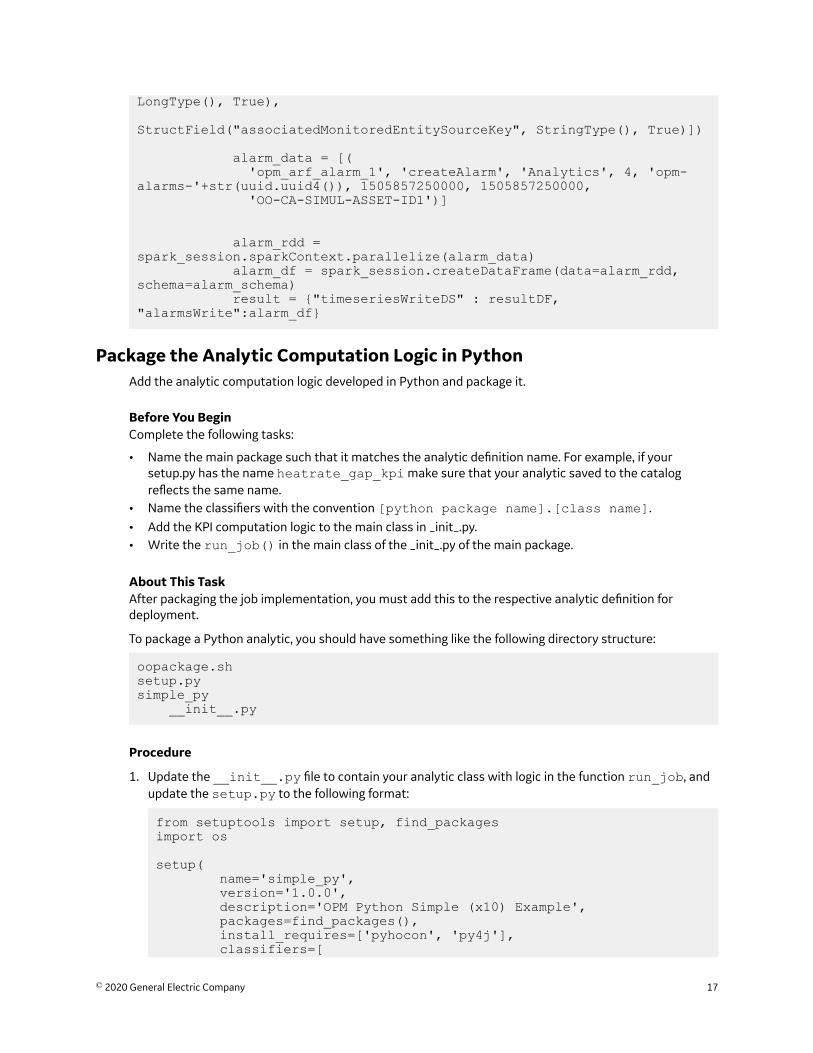
LongType(), True), StructField("associatedMonitoredEntitySourceKey", StringType(), True)])
alarm_data = [( 'opm_arf_alarm_1', 'createAlarm', 'Analytics', 4, 'opm-alarms-'+str(uuid.uuid4()), 1505857250000, 1505857250000, 'OO-CA-SIMUL-ASSET-ID1')]
alarm_rdd = spark_session.sparkContext.parallelize(alarm_data) alarm_df = spark_session.createDataFrame(data=alarm_rdd, schema=alarm_schema) result = {"timeseriesWriteDS" : resultDF, "alarmsWrite":alarm_df}
Package the Analytic Computation Logic in PythonAdd the analytic computation logic developed in Python and package it.
Before You BeginComplete the following tasks:
• Name the main package such that it matches the analytic definition name. For example, if yoursetup.py has the name heatrate_gap_kpi make sure that your analytic saved to the catalogreflects the same name.
• Name the classifiers with the convention [python package name].[class name].• Add the KPI computation logic to the main class in _init_.py.• Write the run_job() in the main class of the _init_.py of the main package.
About This TaskAfter packaging the job implementation, you must add this to the respective analytic definition fordeployment.
To package a Python analytic, you should have something like the following directory structure:
oopackage.shsetup.pysimple_py __init__.py
Procedure
1. Update the __init__.py file to contain your analytic class with logic in the function run_job, andupdate the setup.py to the following format:
from setuptools import setup, find_packagesimport os
setup( name='simple_py', version='1.0.0', description='OPM Python Simple (x10) Example', packages=find_packages(), install_requires=['pyhocon', 'py4j'], classifiers=[
© 2020 General Electric Company 17
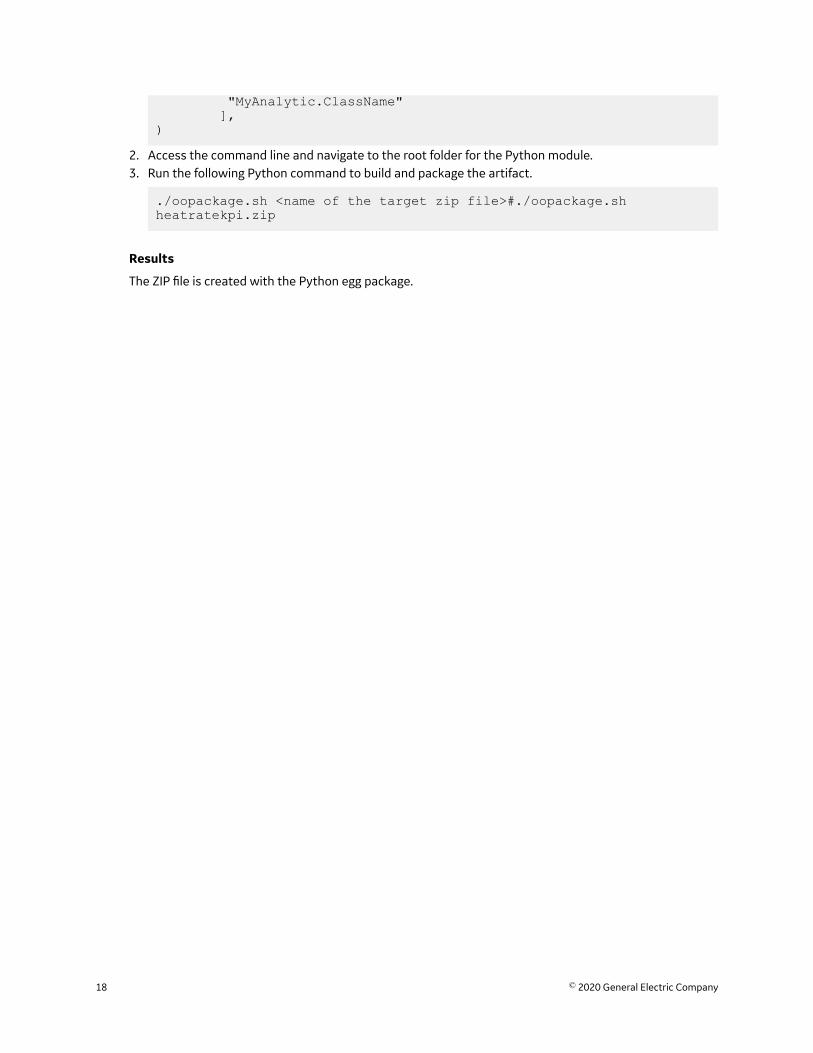
"MyAnalytic.ClassName" ],)
2. Access the command line and navigate to the root folder for the Python module.3. Run the following Python command to build and package the artifact.
./oopackage.sh <name of the target zip file>#./oopackage.sh heatratekpi.zip
Results
The ZIP file is created with the Python egg package.
18 © 2020 General Electric Company
Chapter
3Upload and Deploy a Forecasting Analytic
Steps to upload and deploy a sample Python forecasting analytic onSpark runtime.
Before You Begin
This procedure assumes that the following prerequisites tasks havebeen completed.
• You have uploaded the required assets, tags and time series datarequired for this analytic.
• Your tenant has been configured to stream to Predix timeseries.• You are signed into an OPM tenant with access privileges to
manage analytics on Spark runtime.• You have downloaded the copy of sparkAnalytic_
forecast_train_version_1_0_0.zip.• You have downloaded and extracted the contents of
sparkAnalytic_forecast_train_io-definitions.zip locally.
Procedure
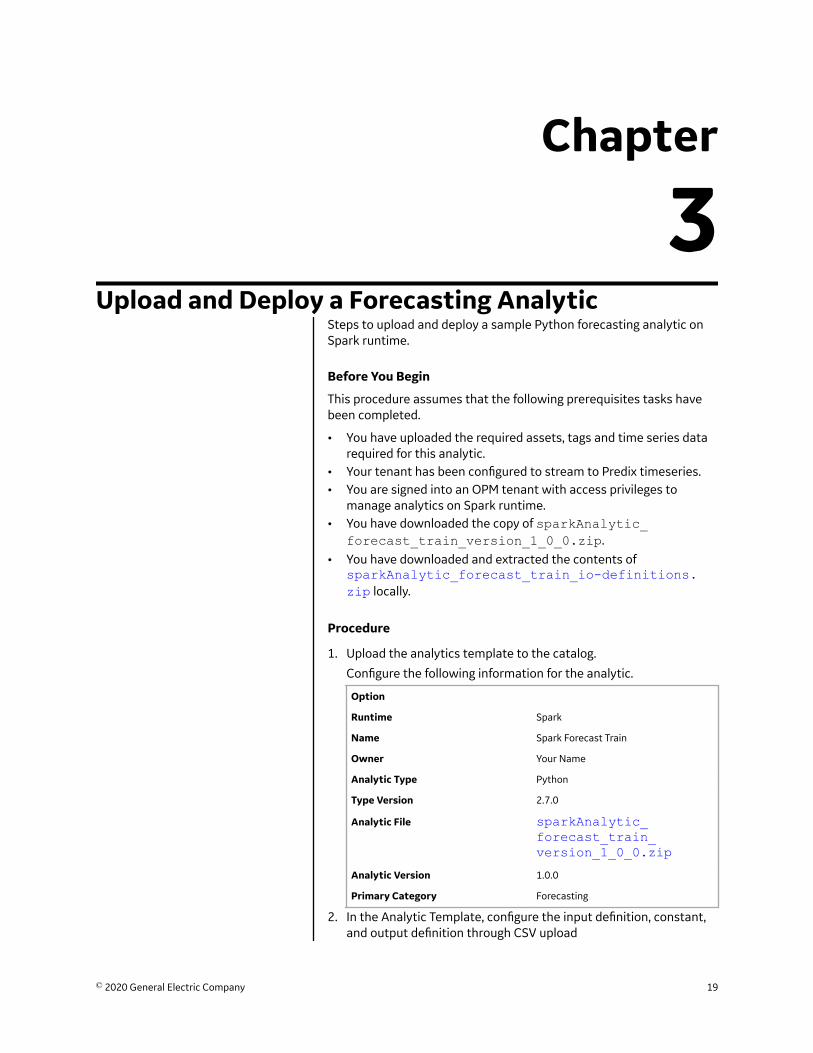
1. Upload the analytics template to the catalog.
Configure the following information for the analytic.
Option
Runtime Spark
Name Spark Forecast Train
Owner Your Name
Analytic Type Python
Type Version 2.7.0
Analytic File sparkAnalytic_forecast_train_version_1_0_0.zip
Analytic Version 1.0.0
Primary Category Forecasting
2. In the Analytic Template, configure the input definition, constant,and output definition through CSV upload
© 2020 General Electric Company 19
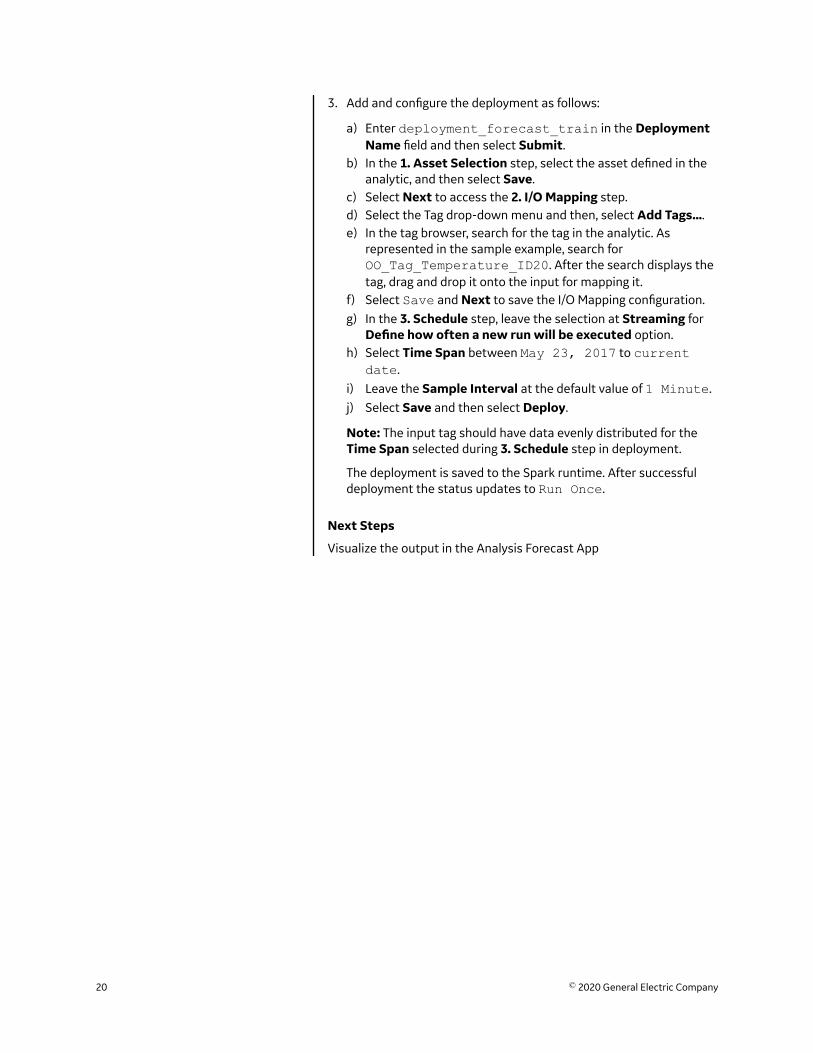
3. Add and configure the deployment as follows:
a) Enter deployment_forecast_train in the DeploymentName field and then select Submit.
b) In the 1. Asset Selection step, select the asset defined in theanalytic, and then select Save.
c) Select Next to access the 2. I/O Mapping step.d) Select the Tag drop-down menu and then, select Add Tags....e) In the tag browser, search for the tag in the analytic. As
represented in the sample example, search forOO_Tag_Temperature_ID20. After the search displays thetag, drag and drop it onto the input for mapping it.
f) Select Save and Next to save the I/O Mapping configuration.g) In the 3. Schedule step, leave the selection at Streaming for
Define how often a new run will be executed option.h) Select Time Span between May 23, 2017 to current
date.i) Leave the Sample Interval at the default value of 1 Minute.j) Select Save and then select Deploy.
Note: The input tag should have data evenly distributed for theTime Span selected during 3. Schedule step in deployment.
The deployment is saved to the Spark runtime. After successfuldeployment the status updates to Run Once.
Next Steps
Visualize the output in the Analysis Forecast App
20 © 2020 General Electric Company
Chapter
4Generate Analytic with Alerts
Steps to upload and deploy a sample Python analytic with alerts onSpark runtime.
Before You Begin
This procedure assumes that the following prerequites tasks havebeen completed.
• You have uploaded the required assets, tags and time series datarequired for this analytic.
• Your tenant's Event Hub is also registered with the APM Alertservice.
• You are signed into an OPM tenant with access privileges tomanage analytics on Spark runtime.
• You have downloaded the copy of sparkAlertAnalytics_python_version_1_0_0.zip
• You have downloaded and extracted the copy ofsparkAlertAnalytics_python_io-definitions.ziplocally.
Procedure
1. Add the alert template
a) Select Alert Templates.b) Select + to add new template.c) Enter Analytics in the Alert Template field.d) Select Save.
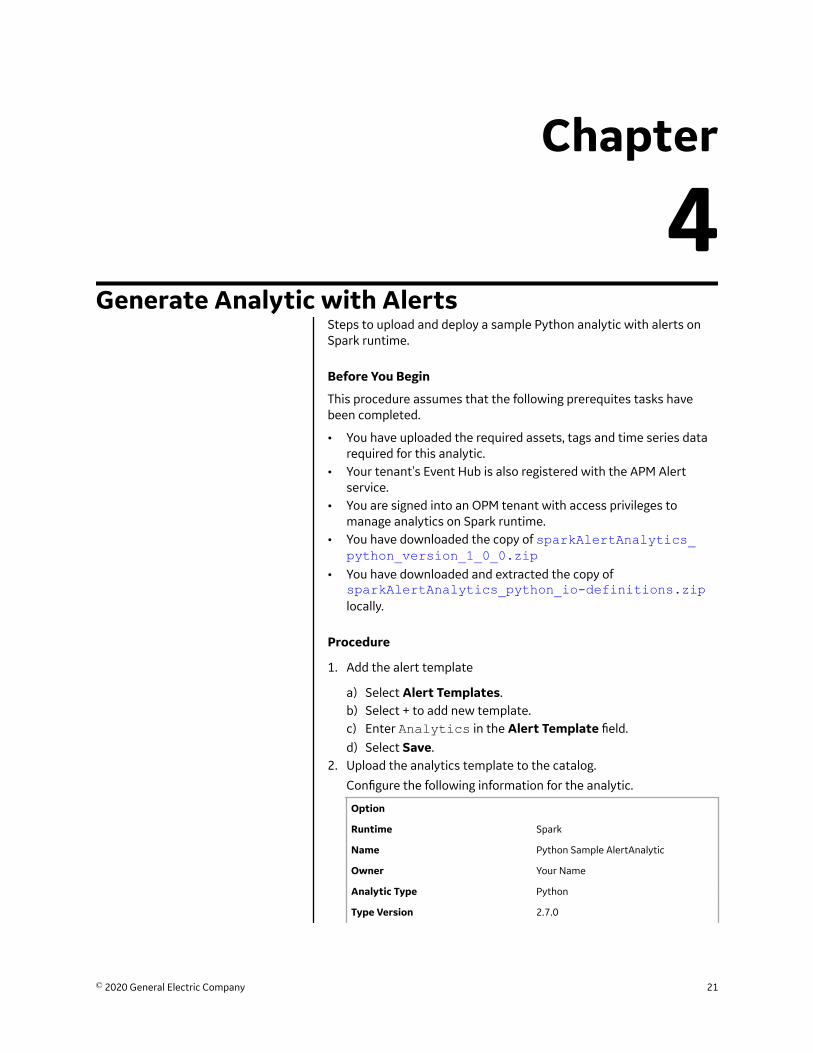
2. Upload the analytics template to the catalog.
Configure the following information for the analytic.
Option
Runtime Spark
Name Python Sample AlertAnalytic
Owner Your Name
Analytic Type Python
Type Version 2.7.0
© 2020 General Electric Company 21
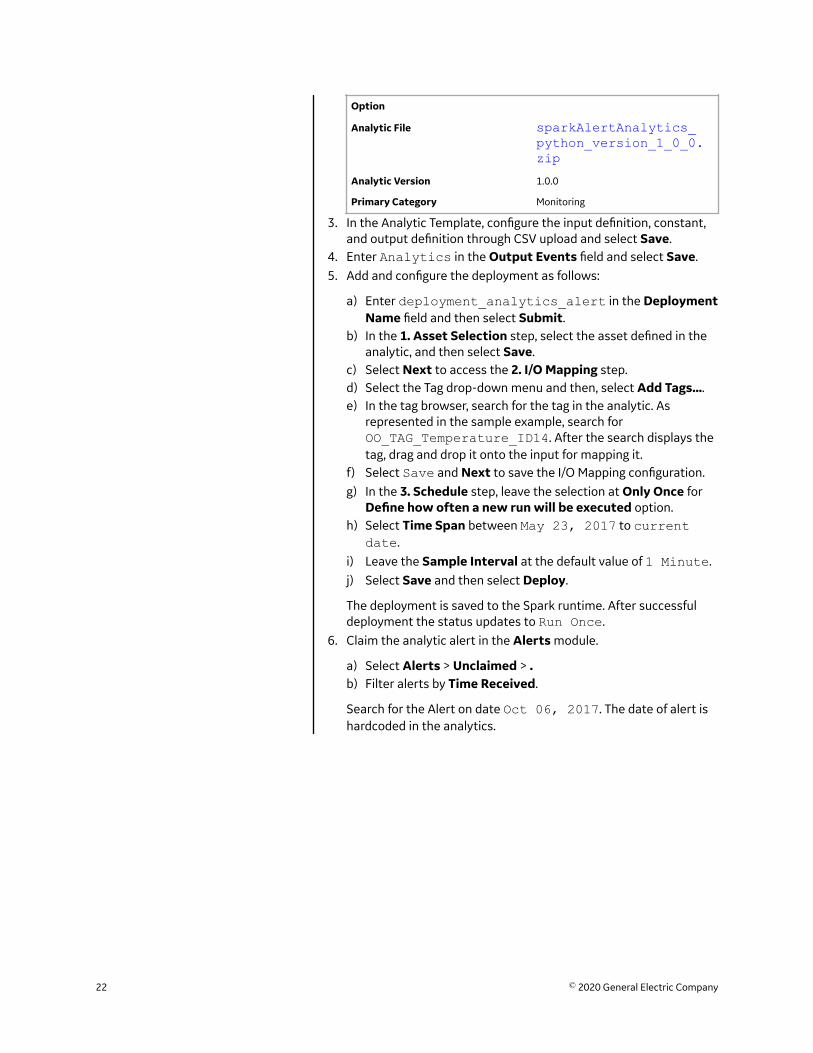
Option
Analytic File sparkAlertAnalytics_python_version_1_0_0.zip
Analytic Version 1.0.0
Primary Category Monitoring
3. In the Analytic Template, configure the input definition, constant,and output definition through CSV upload and select Save.
4. Enter Analytics in the Output Events field and select Save.5. Add and configure the deployment as follows:
a) Enter deployment_analytics_alert in the DeploymentName field and then select Submit.
b) In the 1. Asset Selection step, select the asset defined in theanalytic, and then select Save.
c) Select Next to access the 2. I/O Mapping step.d) Select the Tag drop-down menu and then, select Add Tags....e) In the tag browser, search for the tag in the analytic. As
represented in the sample example, search forOO_TAG_Temperature_ID14. After the search displays thetag, drag and drop it onto the input for mapping it.
f) Select Save and Next to save the I/O Mapping configuration.g) In the 3. Schedule step, leave the selection at Only Once for
Define how often a new run will be executed option.h) Select Time Span between May 23, 2017 to current
date.i) Leave the Sample Interval at the default value of 1 Minute.j) Select Save and then select Deploy.
The deployment is saved to the Spark runtime. After successfuldeployment the status updates to Run Once.
6. Claim the analytic alert in the Alerts module.
a) Select Alerts > Unclaimed > .b) Filter alerts by Time Received.
Search for the Alert on date Oct 06, 2017. The date of alert ishardcoded in the analytics.
22 © 2020 General Electric Company