Embed Size (px)
DESCRIPTION
Detouring the Mass Exodus: Housing as an Economic Development Strategy. Barry Bluestone Dean, School of Social Science, Urban Affairs, and Public Policy Director, Center for Urban and Regional Policy Northeastern University Northeast Association of REALTORS Holiday Inn - PowerPoint PPT Presentation
Citation preview
Detouring the Mass Exodus: Housing as an Economic Development Strategy
Barry BluestoneDean, School of Social Science, Urban Affairs, and Public Policy
Director, Center for Urban and Regional Policy Northeastern University
Northeast Association of REALTORS
Holiday Inn
Tewksbury, Massachusetts
October 3, 2007
Presentation Outline
Employment Trends Population Dynamics Housing Prices Cost of Living across U.S. Metro Areas Impact of Housing Prices on Employment Impact of Housing Prices on Migration Housing Price/Vacancy Relationship Chapter 40R & 40S
-3.0%
-2.0%
-1.0%
0.0%
1.0%
2.0%
3.0%
4.0%
5.0%
6.0%
7.0%
Jan-9
3
Jan-9
4
Jan-9
5
Jan-9
6
Jan-9
7
Jan-9
8
Jan-9
9
Jan-0
0
Jan-0
1
Jan-0
2
Jan-0
3
Jan-0
4
Jan-0
5
Jan-0
6
Jan-0
7
US MA
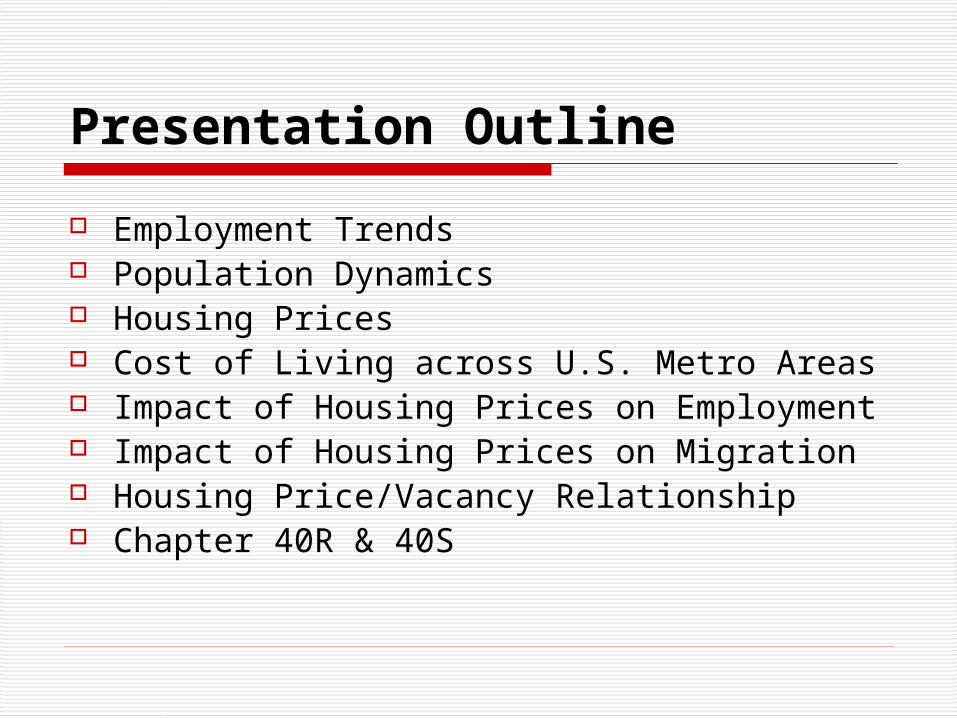
Economic Activity Index: Massachusetts vs. U.S. (1993-2007)
January 1993 – October 2001
Leading the Nation
October 2001 – June 2007Lagging the Nation
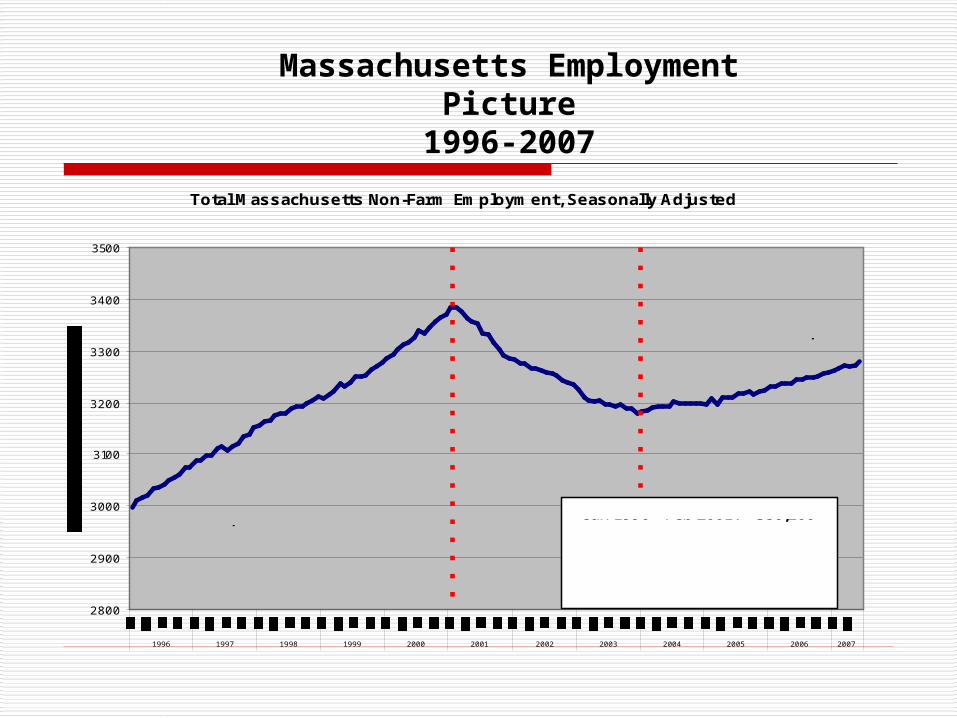
Total Massachusetts Non-Farm Employment, Seasonally Adjusted
2800
2900
3000
3100
3200
3300
3400
3500
1996 1997 1998 1999 2000 2001 2002 2003 2004 2005 2006 2007
Feb 2001 - Dec 2003: -205,100
Dec 2003 - Dec 2006: +79,100
Jan 2007 - Jun 2007: +29,200
Feb 2001: 3,384.0
Dec 2003: 3,178.9
Jun 2007: 3,281.2
Jan 1996: 2,997.9 Jan 1996 - Feb 2001: + 386,100
Massachusetts Employment Picture1996-2007
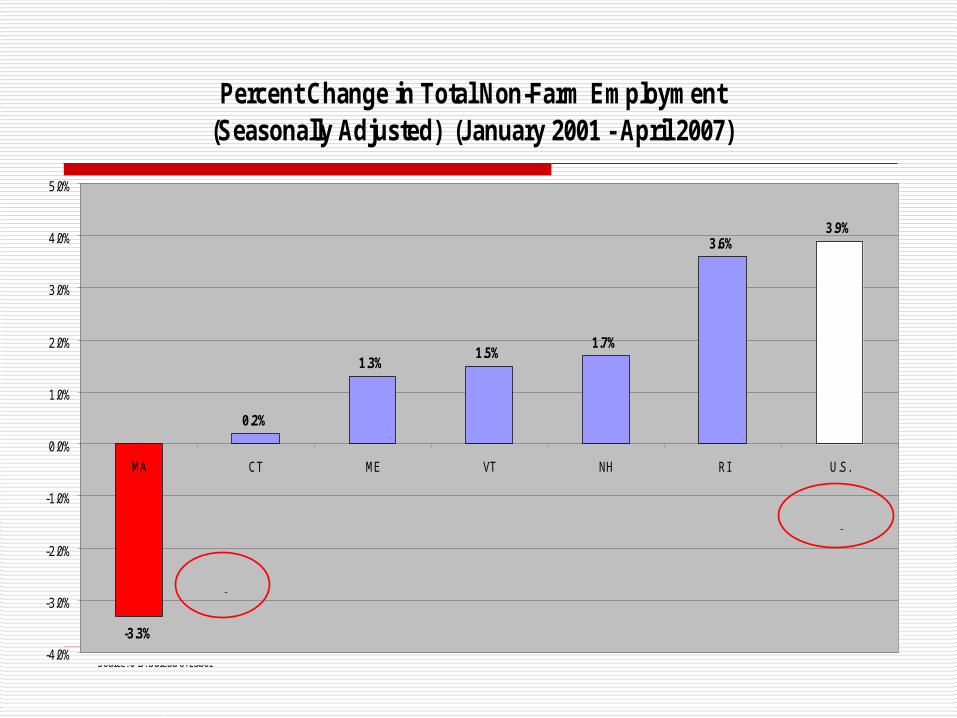
Percent Change in Total Non-Farm Employment (Seasonally Adjusted) (January 2001 - April 2007)
-3.3%
0.2%
1.3%1.5%
1.7%
3.6%3.9%
-4.0%
-3.0%
-2.0%
-1.0%
0.0%
1.0%
2.0%
3.0%
4.0%
5.0%
MA CT ME VT NH RI U.S.
-111,400 jobs
+5,213,000 jobs
Source: U.S. Bureau of Labor
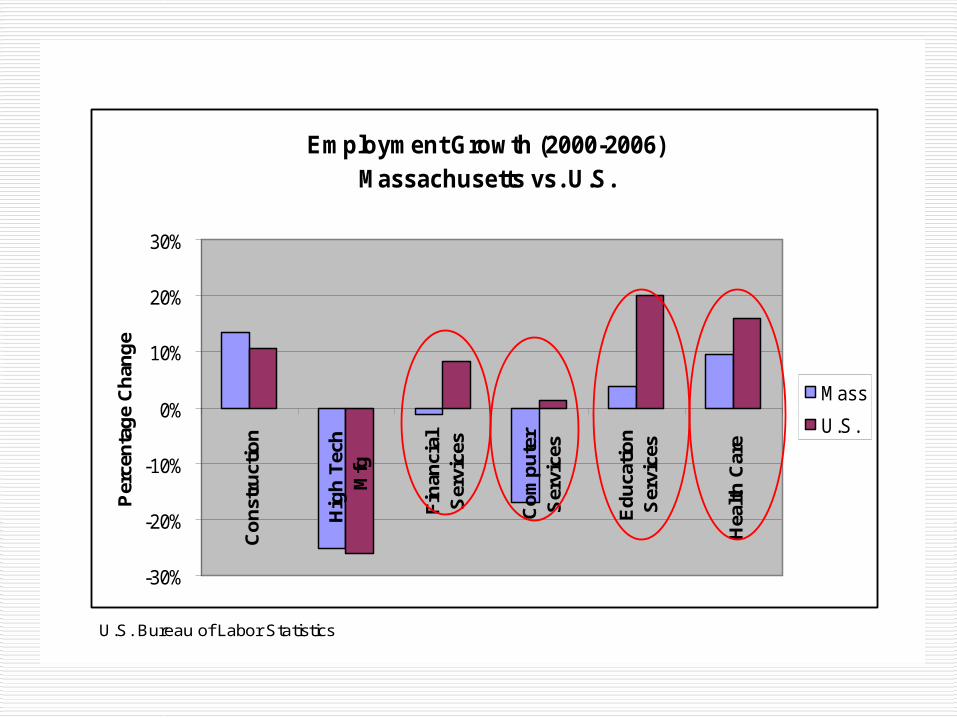
Employment Growth (2000-2006) Massachusetts vs. U.S.
-30%
-20%
-10%
0%
10%
20%
30%C
on
stru
ctio
n
Hig
h T
ech
Mfg
Fin
anci
alS
ervi
ces
Co
mp
ute
rS
ervi
ces
Ed
uca
tio
nS
ervi
ces
Hea
lth
Car
e
Per
cen
tag
e C
han
ge
Mass
U.S.
U.S. Bureau of Labor Statistics
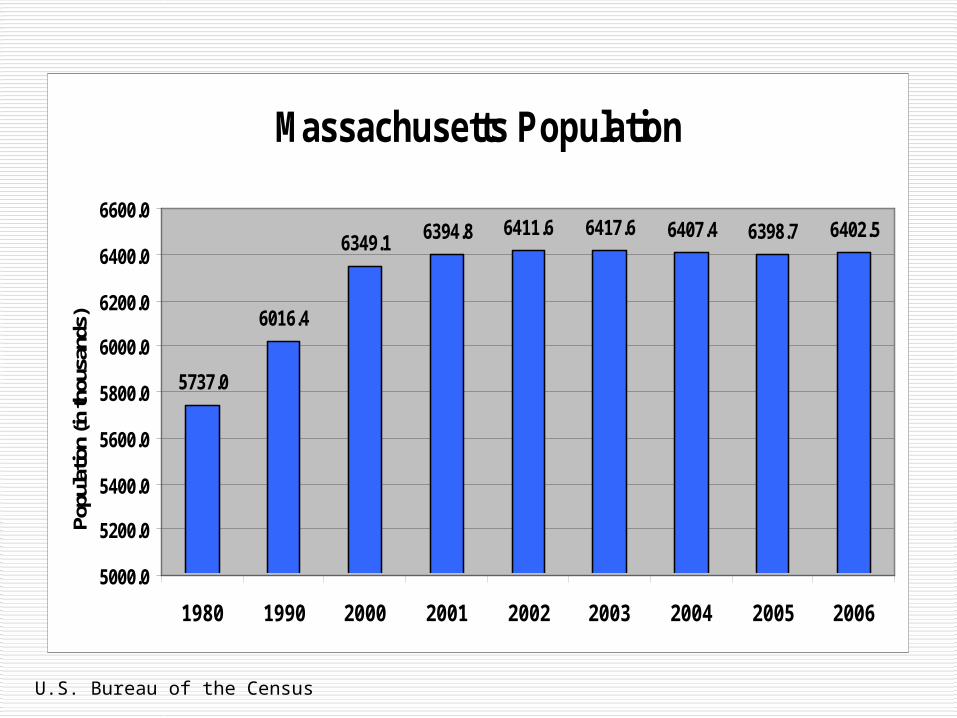
Massachusetts Population
5737.0
6016.4
6349.1 6394.8 6411.6 6417.6 6407.4 6398.7 6402.5
5000.0
5200.0
5400.0
5600.0
5800.0
6000.0
6200.0
6400.0
6600.0
1980 1990 2000 2001 2002 2003 2004 2005 2006
Popu
latio
n (in
thou
sand
s)
U.S. Bureau of the Census
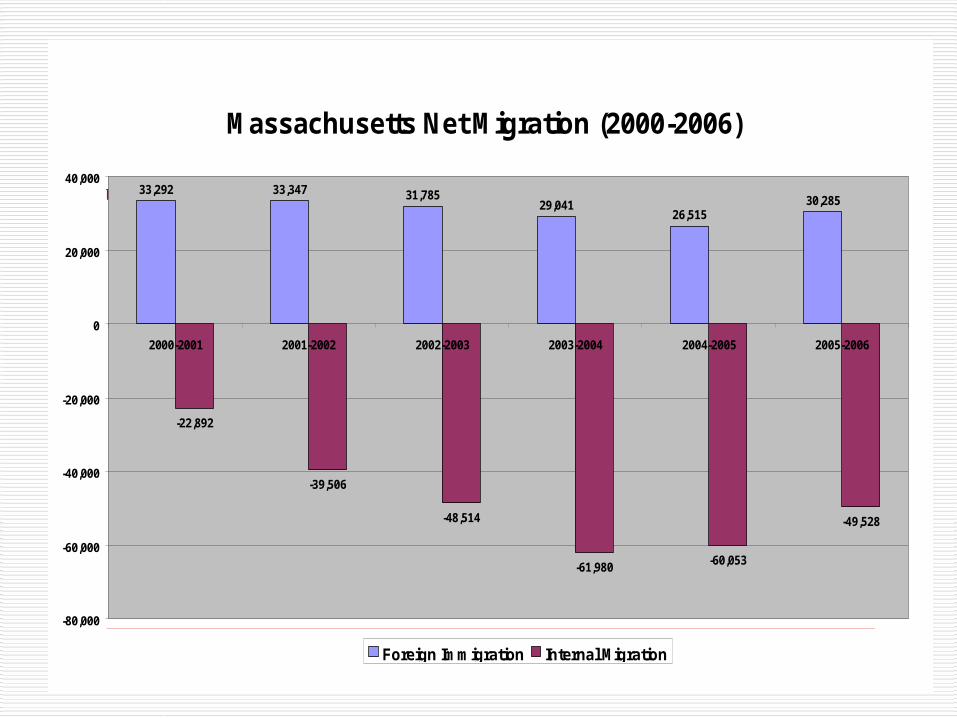
Massachusetts Net Migration (2000-2006)
33,292 33,347 31,78529,041
26,51530,285
-22,892
-39,506
-48,514
-61,980-60,053
-49,528
-80,000
-60,000
-40,000
-20,000
0
20,000
40,000
2000-2001 2001-2002 2002-2003 2003-2004 2004-2005 2005-2006
Foreign Immigration Internal Migration
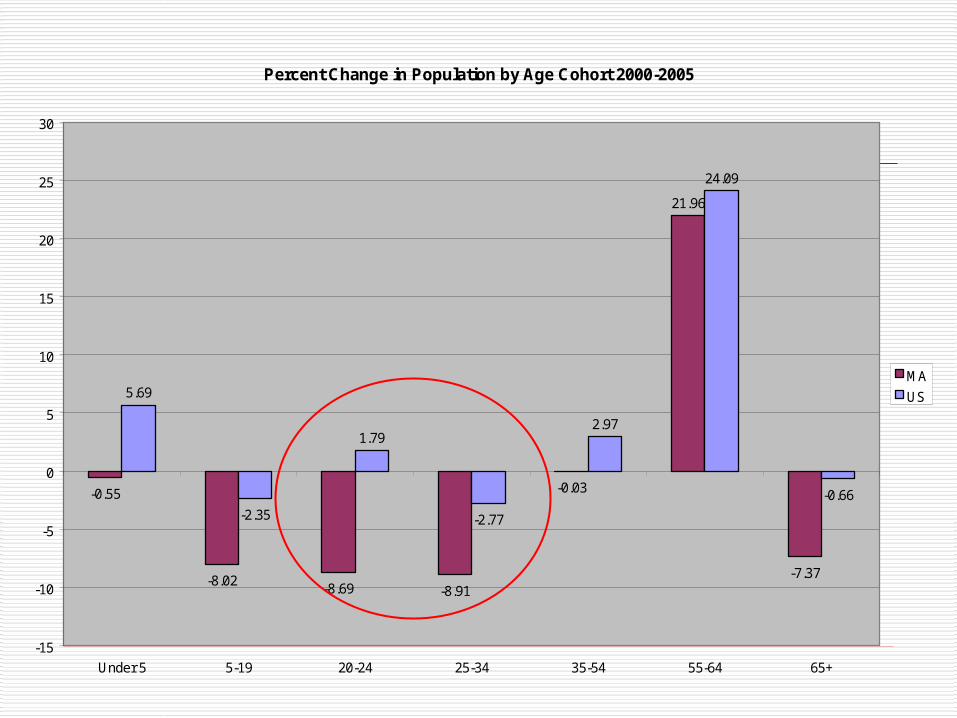
Percent Change in Population by Age Cohort 2000-2005
-0.55
-8.02-8.69 -8.91
-0.03
21.96
-7.37
5.69
-2.35
1.79
-2.77
2.97
24.09
-0.66
-15
-10
-5
0
5
10
15
20
25
30
Under 5 5-19 20-24 25-34 35-54 55-64 65+
MA
US
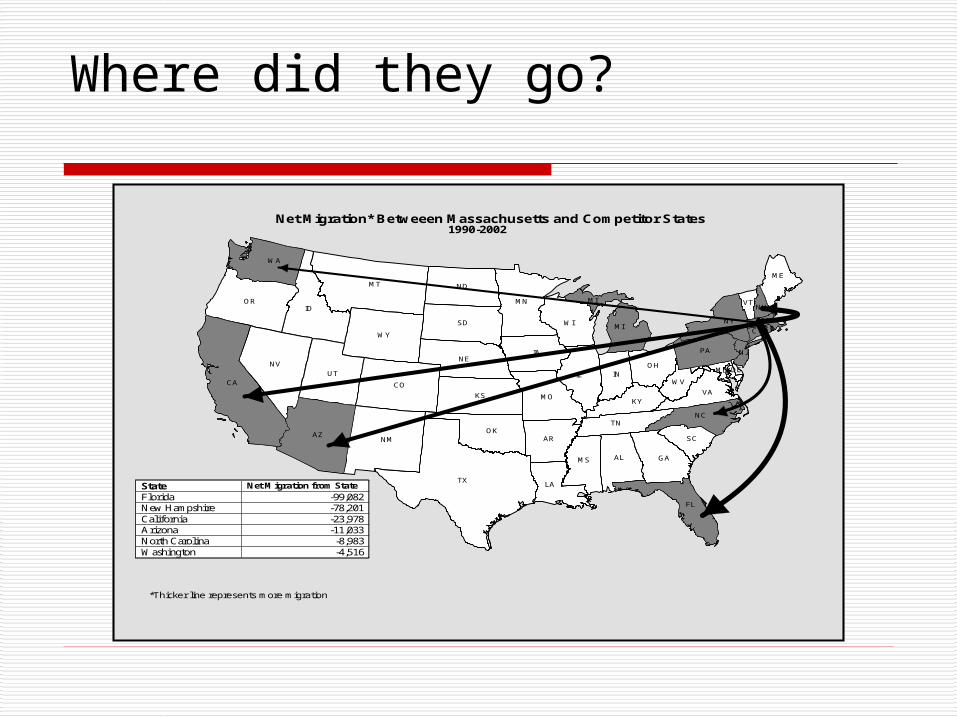
Where did they go?
TX
CA
MT
AZ
ID
NV
NM
CO
IL
OR
UT
KS
WY
IA
SD
NE
MN
ND
FL
OK
WI
MO
AL
WA
GA
AR
LA
MI
IN
NY
PA
NC
MS
TN
KYVA
OH
SC
ME
WV
MI VTNH
MD
NJ
MA
CT
DE
RI
Net Migration* Betweeen Massachusetts and Competitor States1990-2002
*Thicker line represents more migration
State Net Migration from State
Florida -99,082 New Hampshire -78,201 California -23,978 Arizona -11,033 North Carolina -8,983 Washington -4,516

The Cost of Living Challenge
$100,000
$150,000
$200,000
$250,000
$300,000
$350,000
$400,000
$450,000
1986
1987
1988
1989
1990
1991
1992
1993
1994
1995
1996
1997
1998
1999
2000
2001
2002
2003
2004
2005
2006
2007*
Pri
ce
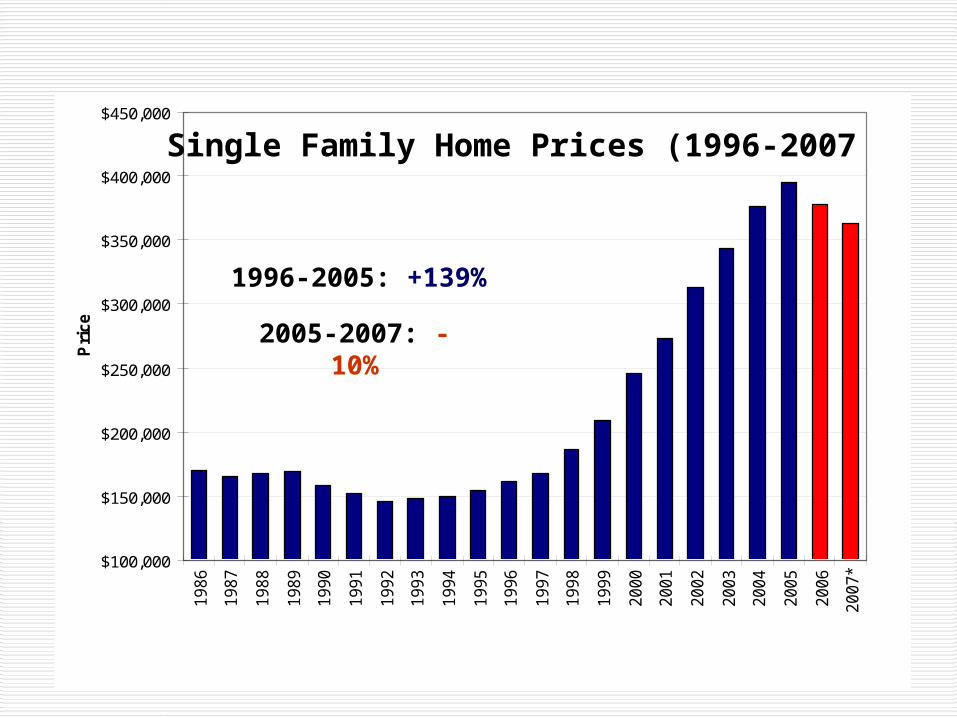
Single Family Home Prices (1996-2007
1996-2005: +139%
2005-2007: - 10%
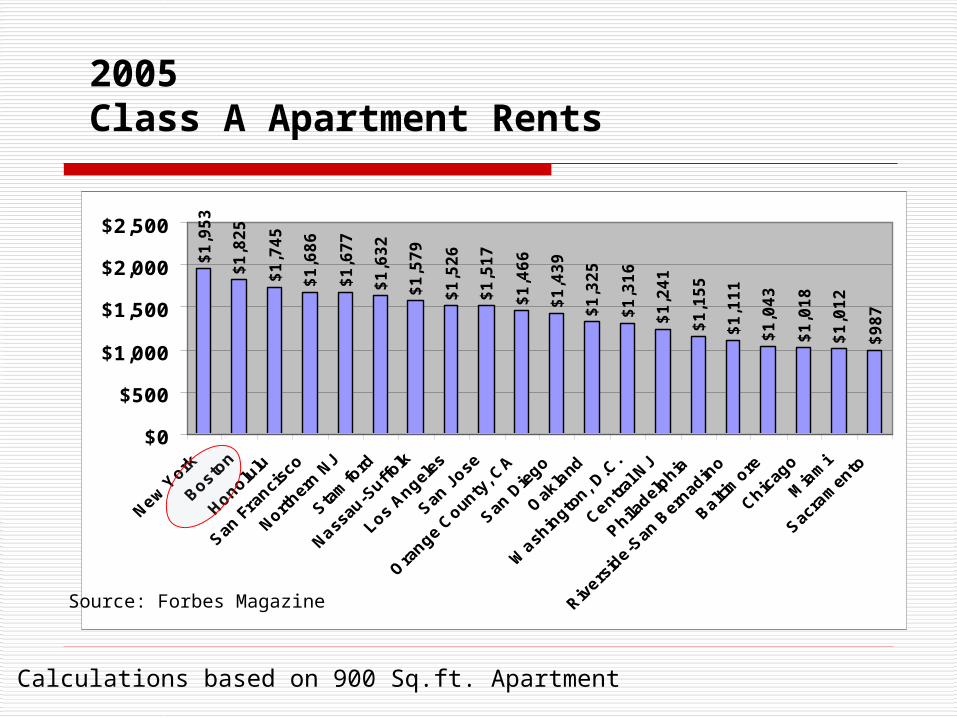
2005Class A Apartment Rents
$1
,95
3
$1
,82
5
$1
,74
5
$1
,68
6
$1
,67
7
$1
,63
2
$1
,57
9
$1
,52
6
$1
,51
7
$1
,46
6
$1
,43
9
$1
,32
5
$1
,31
6
$1
,24
1
$1
,15
5
$1
,11
1
$1
,04
3
$1
,01
8
$1
,01
2
$9
87
$0
$500
$1,000
$1,500
$2,000
$2,500
Source: Forbes Magazine
Calculations based on 900 Sq.ft. Apartment
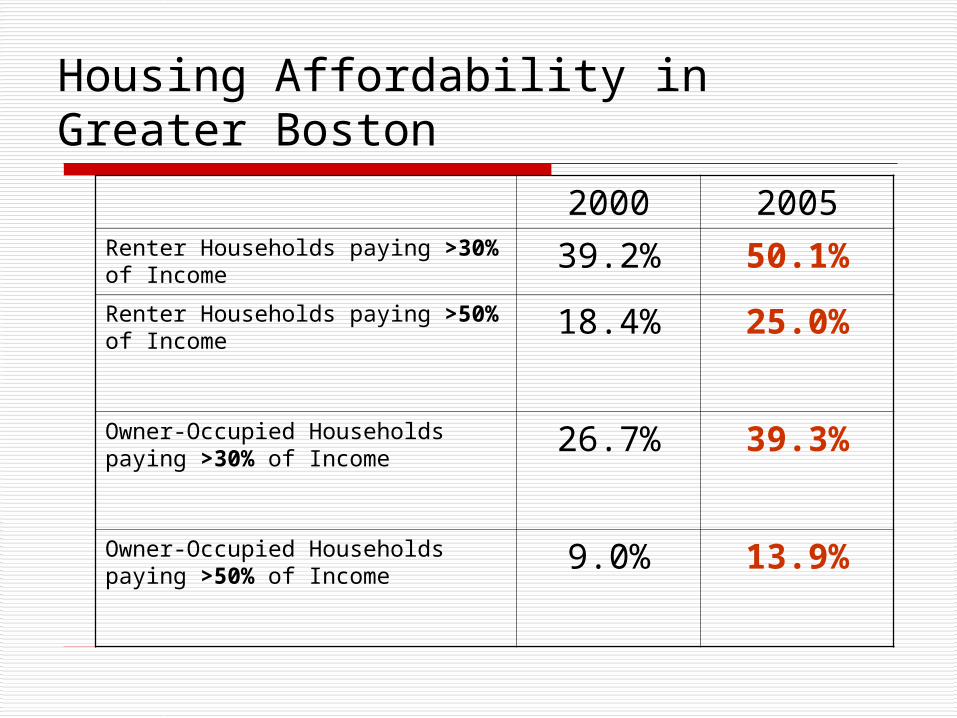
Housing Affordability in Greater Boston
2000 2005Renter Households paying >30% of Income
39.2% 50.1%
Renter Households paying >50% of Income
18.4% 25.0%
Owner-Occupied Households paying >30% of Income
26.7% 39.3%
Owner-Occupied Households paying >50% of Income
9.0% 13.9%
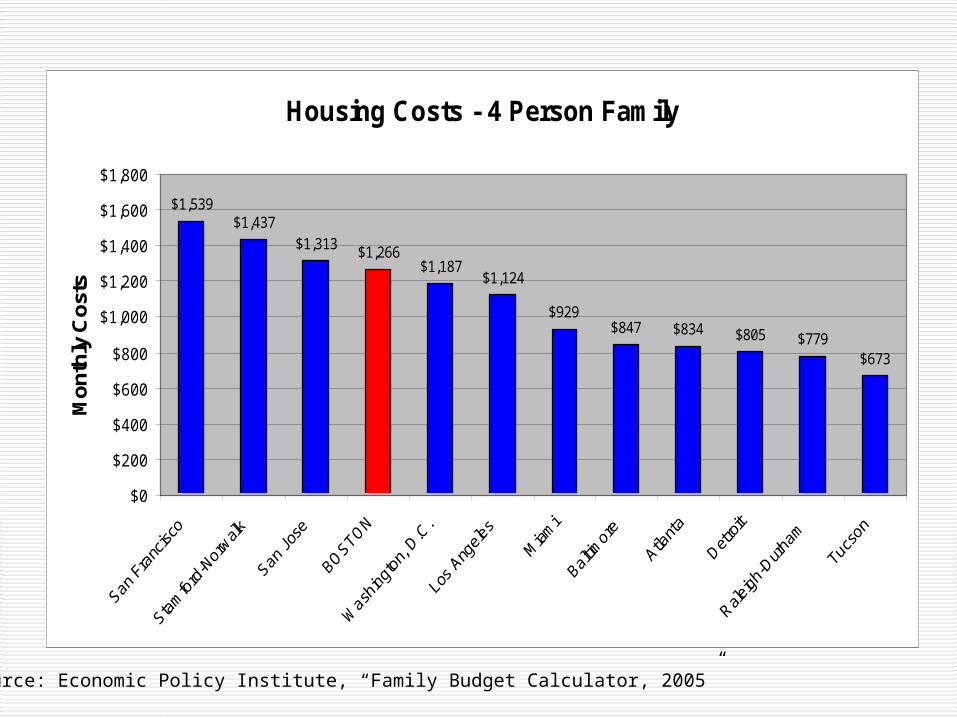
Housing Costs - 4 Person Family
$1,539$1,437
$1,313 $1,266$1,187
$1,124
$929$847 $834 $805 $779
$673
$0
$200
$400
$600
$800
$1,000
$1,200
$1,400
$1,600
$1,800
Mo
nth
ly C
ost
s
Source: Economic Policy Institute, “Family Budget Calculator, 2005”
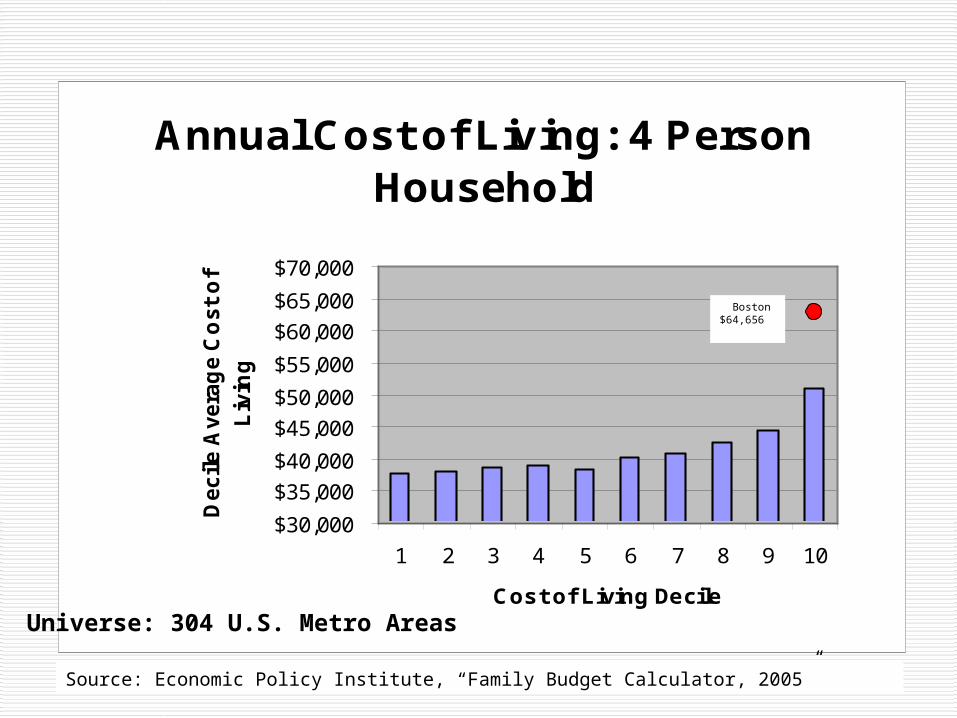
Annual Cost of Living: 4 Person Household
$30,000
$35,000
$40,000
$45,000
$50,000
$55,000
$60,000
$65,000
$70,000
1 2 3 4 5 6 7 8 9 10
Cost of Living Decile
De
cil
e A
ve
rag
e C
os
t o
f
Liv
ing
Boston$64,656
Source: Economic Policy Institute, “Family Budget Calculator, 2005”
Universe: 304 U.S. Metro Areas
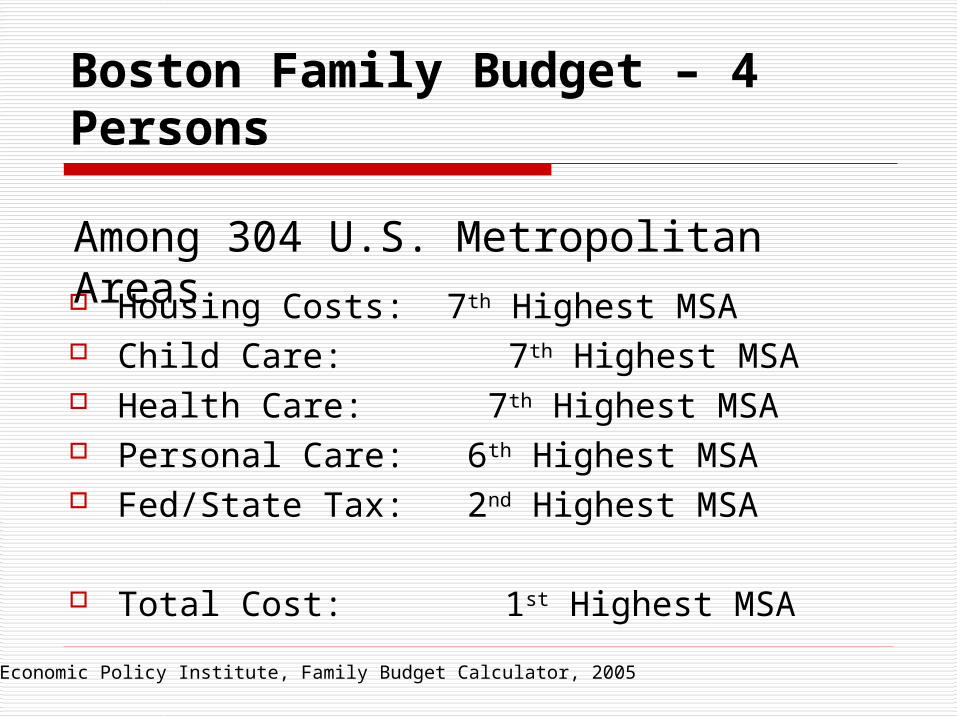
Boston Family Budget – 4 Persons
Housing Costs: 7th Highest MSA Child Care: 7th Highest MSA Health Care: 7th Highest MSA Personal Care: 6th Highest MSA Fed/State Tax: 2nd Highest MSA
Total Cost: 1st Highest MSA
Economic Policy Institute, Family Budget Calculator, 2005
Among 304 U.S. Metropolitan Areas
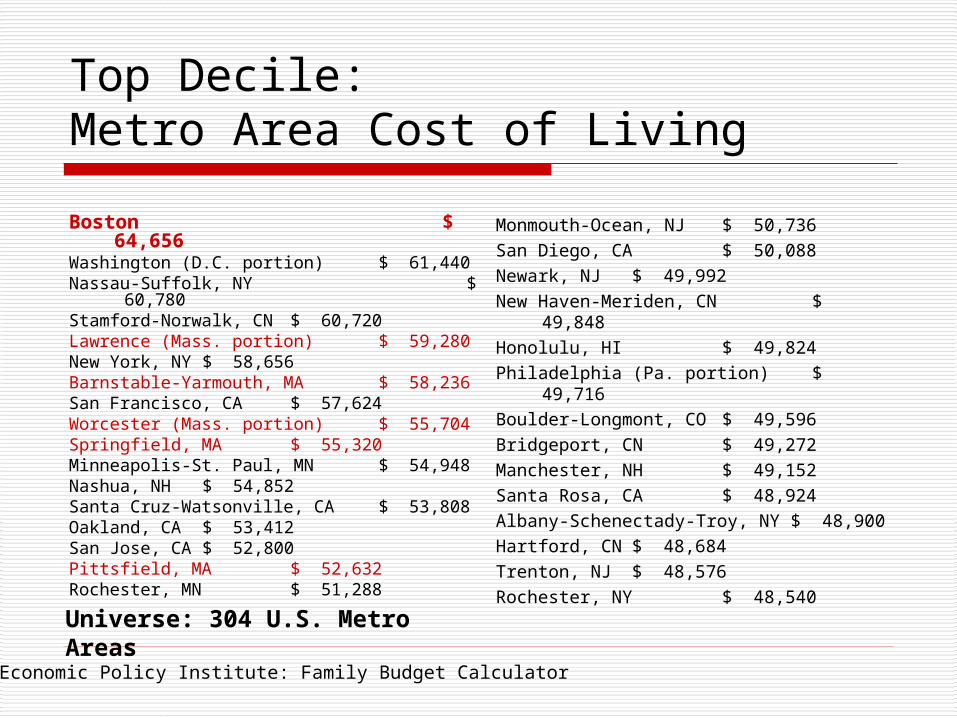
Top Decile: Metro Area Cost of Living
Boston $ 64,656Washington (D.C. portion) $ 61,440Nassau-Suffolk, NY $ 60,780 Stamford-Norwalk, CN $ 60,720 Lawrence (Mass. portion) $ 59,280 New York, NY $ 58,656 Barnstable-Yarmouth, MA $ 58,236 San Francisco, CA $ 57,624 Worcester (Mass. portion) $ 55,704Springfield, MA $ 55,320Minneapolis-St. Paul, MN $ 54,948 Nashua, NH $ 54,852 Santa Cruz-Watsonville, CA $ 53,808Oakland, CA $ 53,412 San Jose, CA $ 52,800 Pittsfield, MA $ 52,632 Rochester, MN $ 51,288
Monmouth-Ocean, NJ $ 50,736San Diego, CA $ 50,088Newark, NJ $ 49,992New Haven-Meriden, CN $ 49,848Honolulu, HI $ 49,824Philadelphia (Pa. portion) $
49,716Boulder-Longmont, CO $ 49,596Bridgeport, CN $ 49,272Manchester, NH $
49,152Santa Rosa, CA $ 48,924Albany-Schenectady-Troy, NY $ 48,900Hartford, CN $ 48,684Trenton, NJ $ 48,576Rochester, NY $ 48,540
Economic Policy Institute: Family Budget Calculator
Universe: 304 U.S. Metro Areas
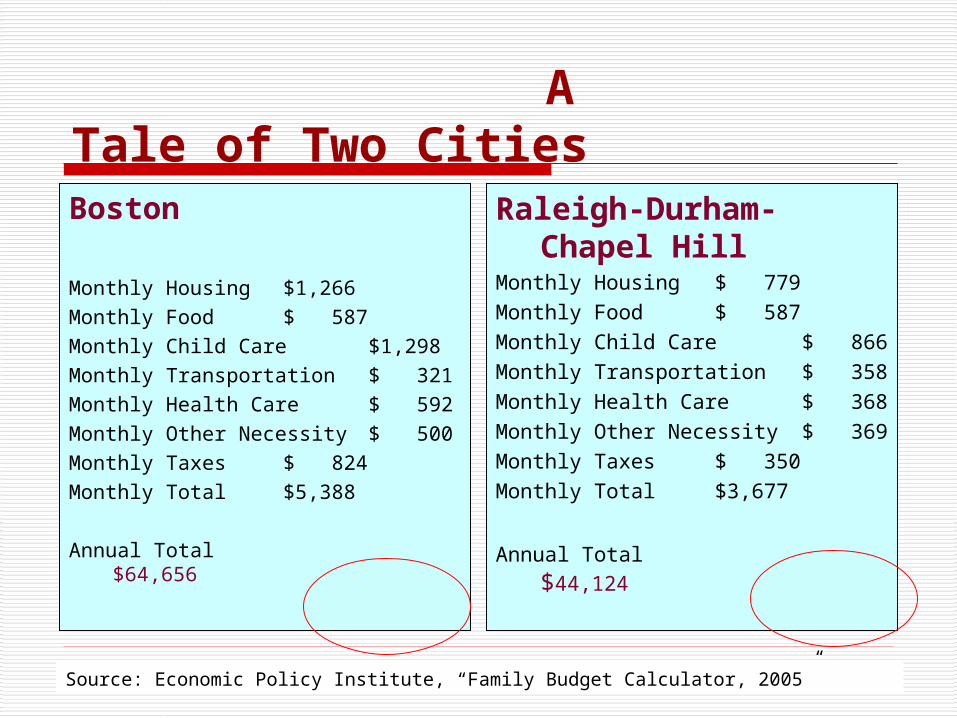
A Tale of Two CitiesBasic Budget2 Parents, 2 Children
Boston
Monthly Housing $1,266
Monthly Food $ 587
Monthly Child Care $1,298
Monthly Transportation $ 321
Monthly Health Care $ 592
Monthly Other Necessity $ 500
Monthly Taxes $ 824
Monthly Total $5,388
Annual Total $64,656
Raleigh-Durham-Chapel Hill
Monthly Housing $ 779
Monthly Food $ 587
Monthly Child Care $ 866
Monthly Transportation $ 358
Monthly Health Care $ 368
Monthly Other Necessity $ 369
Monthly Taxes $ 350
Monthly Total $3,677
Annual Total $44,124
A Tale of Two Cities
Source: Economic Policy Institute, “Family Budget Calculator, 2005”
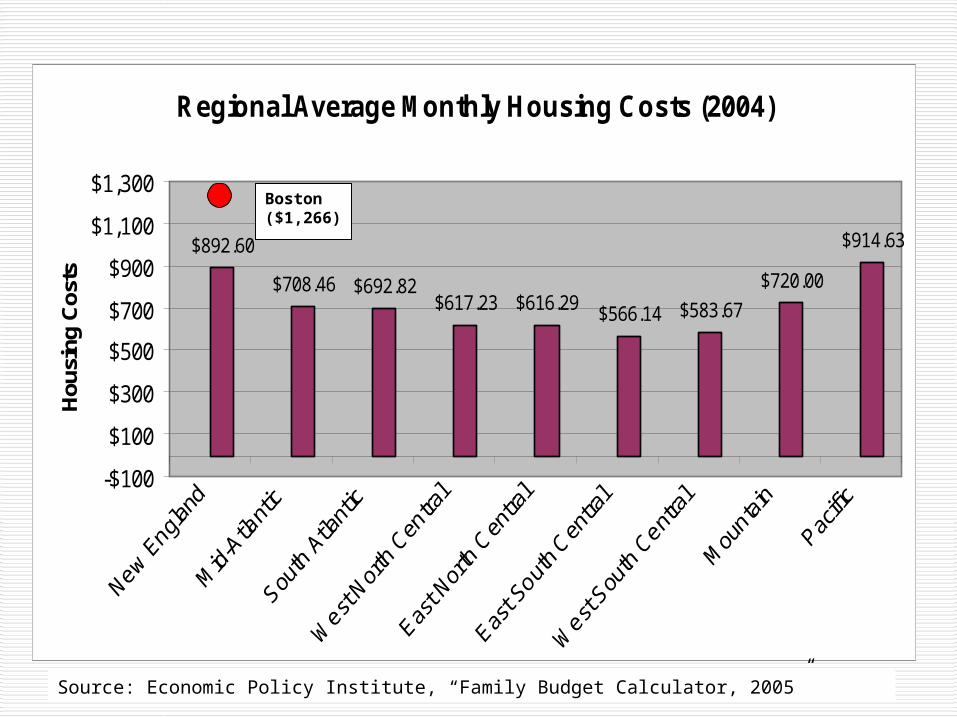
Regional Average Monthly Housing Costs (2004)
$892.60
$708.46 $692.82$617.23 $616.29 $566.14 $583.67
$720.00
$914.63
-$100
$100
$300
$500
$700
$900
$1,100
$1,300
Hou
sing
Cos
ts
Boston ($1,266)
Source: Economic Policy Institute, “Family Budget Calculator, 2005”

New Housing Research
New England Public Policy Center Alicia Sasser, Bo Zhao, and Darcy Rollins
The Rappaport Institute for Greater Boston Edward L. Glaeser
The Center for Urban and Regional Policy Barry Bluestone
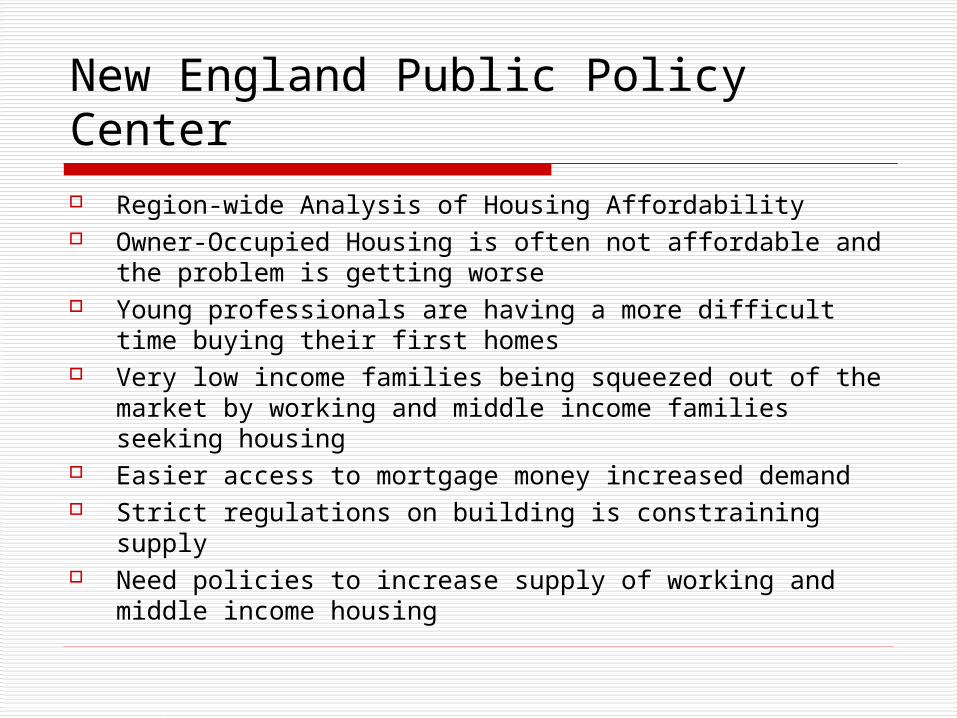
New England Public Policy Center Region-wide Analysis of Housing Affordability Owner-Occupied Housing is often not affordable and the
problem is getting worse Young professionals are having a more difficult time
buying their first homes Very low income families being squeezed out of the
market by working and middle income families seeking housing
Easier access to mortgage money increased demand Strict regulations on building is constraining supply Need policies to increase supply of working and middle
income housing
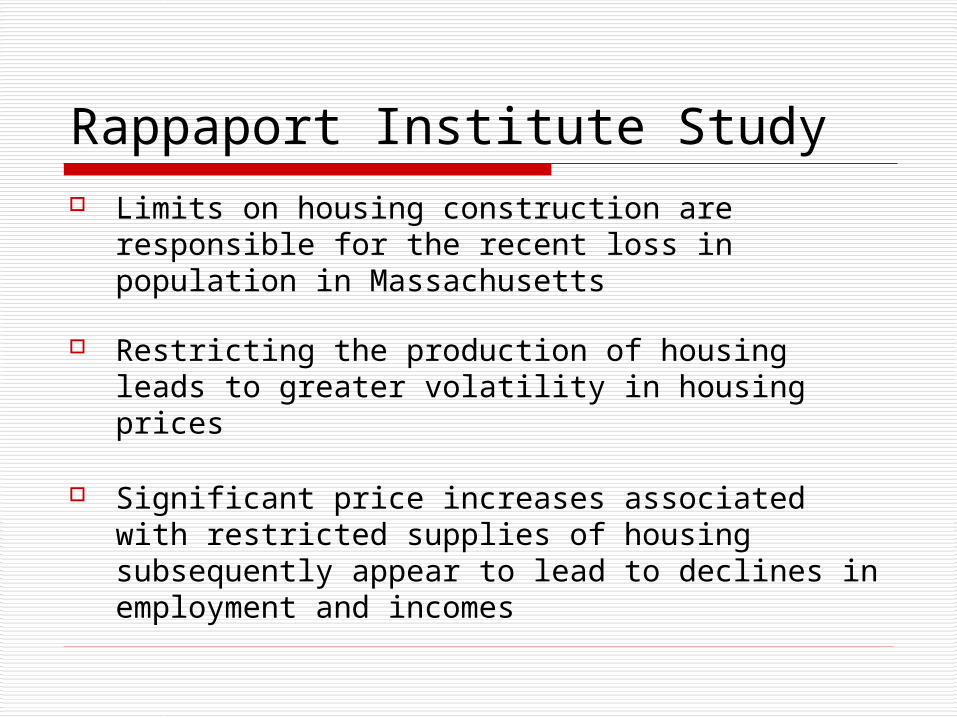
Rappaport Institute Study Limits on housing construction are responsible
for the recent loss in population in Massachusetts
Restricting the production of housing leads to greater volatility in housing prices
Significant price increases associated with restricted supplies of housing subsequently appear to lead to declines in employment and incomes
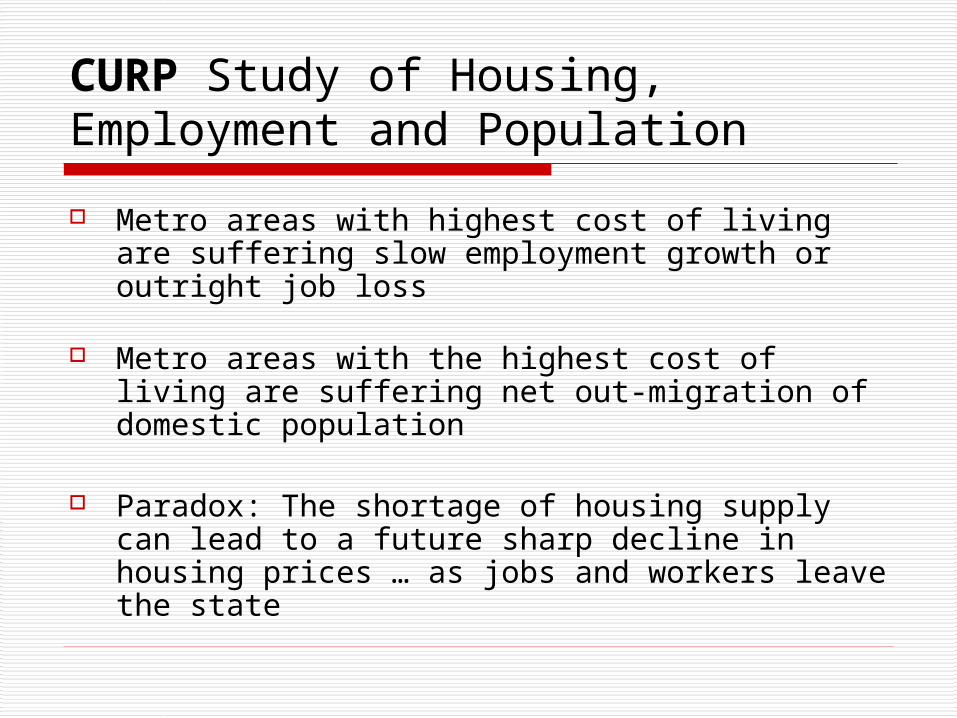
CURP Study of Housing, Employment and Population
Metro areas with highest cost of living are suffering slow employment growth or outright job loss
Metro areas with the highest cost of living are suffering net out-migration of domestic population
Paradox: The shortage of housing supply can lead to a future sharp decline in housing prices … as jobs and workers leave the state
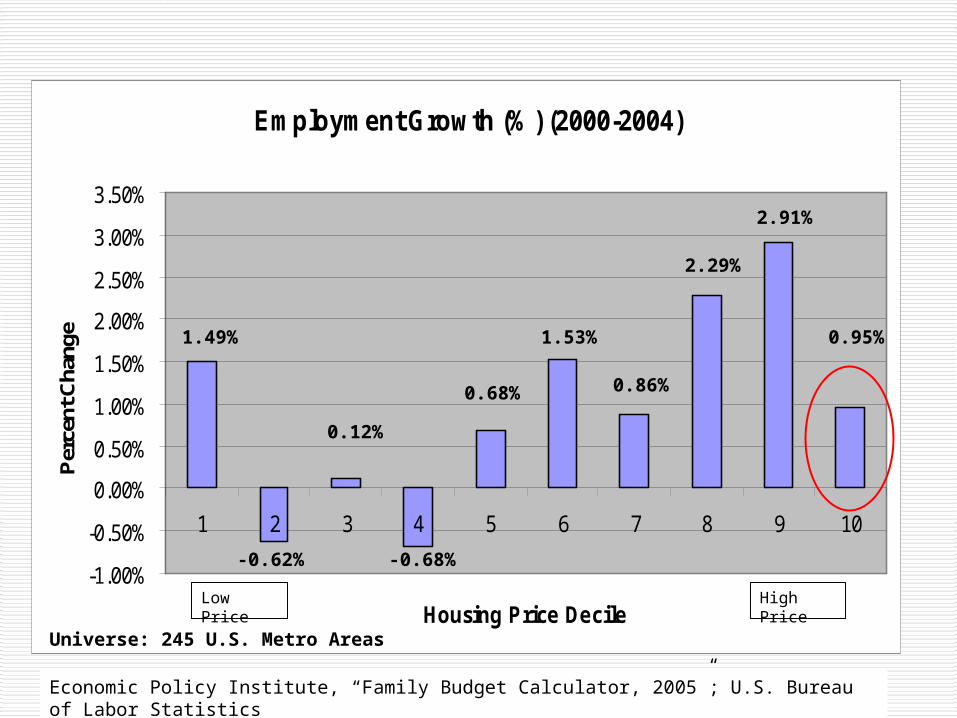
Employment Growth (%) (2000-2004)
-1.00%
-0.50%
0.00%
0.50%
1.00%
1.50%
2.00%
2.50%
3.00%
3.50%
1 2 3 4 5 6 7 8 9 10
Housing Price Decile
Per
cent
Cha
nge
Low Price High Price
Economic Policy Institute, “Family Budget Calculator, 2005”; U.S. Bureau of Labor Statistics
Universe: 245 U.S. Metro Areas
0.95%
2.91%
2.29%
0.86%
1.53%
0.68%
-0.68%
0.12%
-0.62%
1.49%
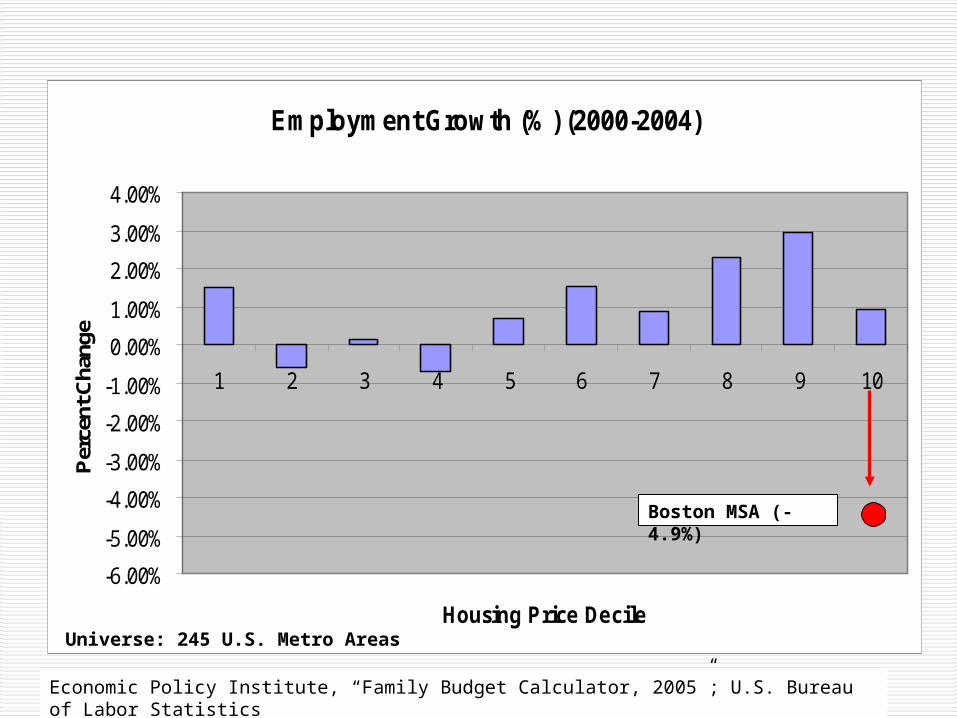
Employment Growth (%) (2000-2004)
-6.00%
-5.00%
-4.00%
-3.00%
-2.00%
-1.00%
0.00%
1.00%
2.00%
3.00%
4.00%
1 2 3 4 5 6 7 8 9 10
Housing Price Decile
Per
cent
Cha
nge
Boston MSA (-4.9%)
Economic Policy Institute, “Family Budget Calculator, 2005”; U.S. Bureau of Labor Statistics
Universe: 245 U.S. Metro Areas
0.20
0.10
0.00
-0.10
-0.20
$1,600$1,400$1,200$1,000$800$600$400
Quadratic
Observed
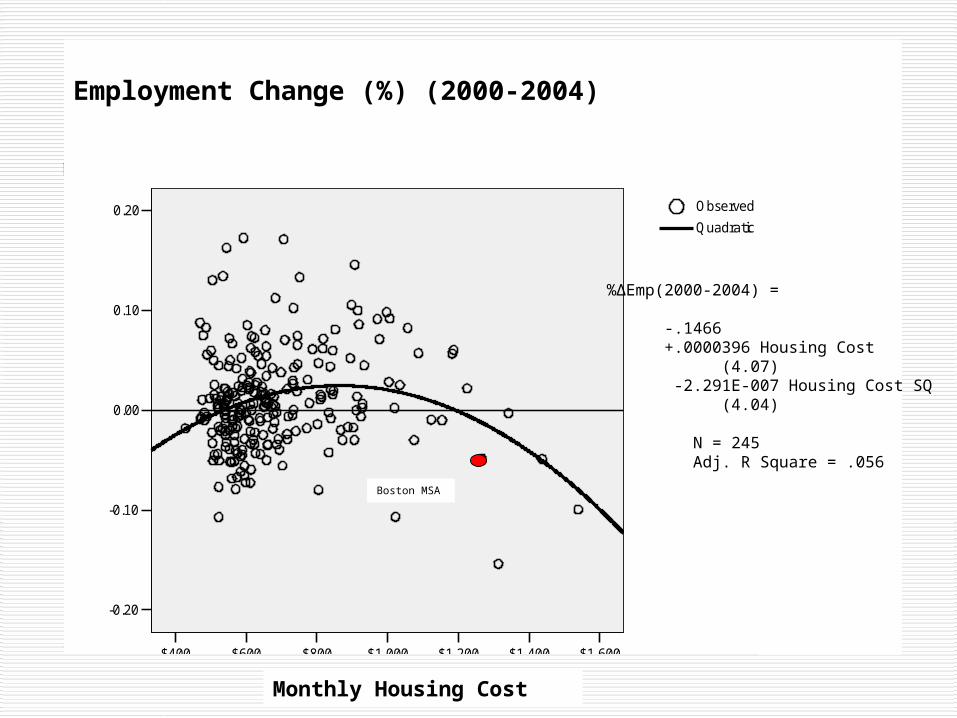
Monthly Housing Cost
Employment Change (%) (2000-2004)
Boston MSA
%∆Emp(2000-2004) =
-.1466 +.0000396 Housing Cost (4.07) -2.291E-007 Housing Cost SQ (4.04)
N = 245 Adj. R Square = .056
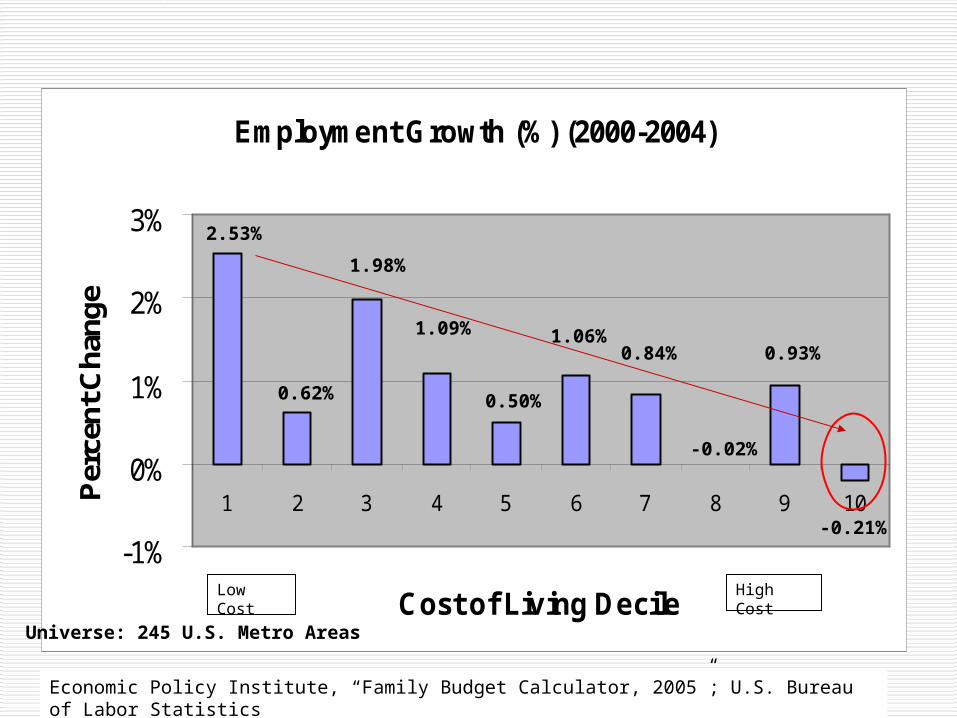
Employment Growth (%) (2000-2004)
-1%
0%
1%
2%
3%
1 2 3 4 5 6 7 8 9 10
Cost of Living Decile
Per
cent
Cha
nge
Low Cost High Cost
Economic Policy Institute, “Family Budget Calculator, 2005”; U.S. Bureau of Labor Statistics
-0.21%
0.93%
-0.02%
0.84%1.06%
0.50%
1.09%
1.98%
0.62%
2.53%
Universe: 245 U.S. Metro Areas
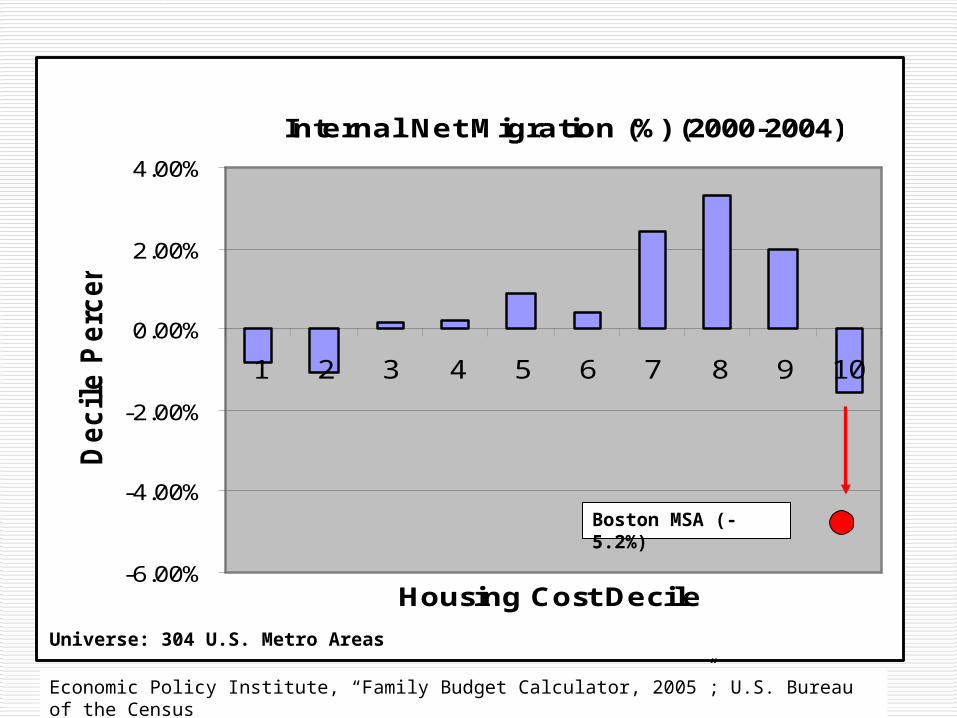
Internal Net Migration (%) (2000-2004)
-6.00%
-4.00%
-2.00%
0.00%
2.00%
4.00%
1 2 3 4 5 6 7 8 9 10
Housing Cost Decile
Decil
e P
erc
en
t
Boston MSA (-5.2%)
Economic Policy Institute, “Family Budget Calculator, 2005”; U.S. Bureau of the Census
Universe: 304 U.S. Metro Areas
0.1500
0.1000
0.0500
0.0000
-0.0500
-0.1000
-0.1500
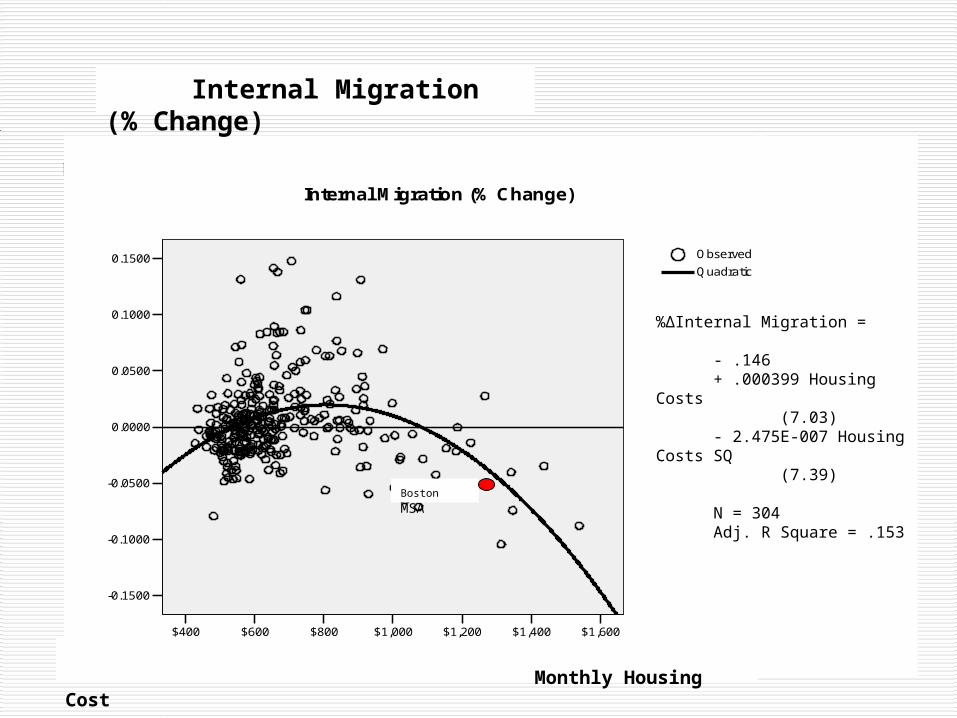
$1,600$1,400$1,200$1,000$800$600$400
Monthly Housing Costs
Quadratic
Observed
Internal Migration (% Change)
Internal Migration (% Change)
Monthly Housing Cost
Boston MSA
%∆Internal Migration =
- .146 + .000399 Housing Costs (7.03) - 2.475E-007 Housing Costs SQ (7.39)
N = 304 Adj. R Square = .153
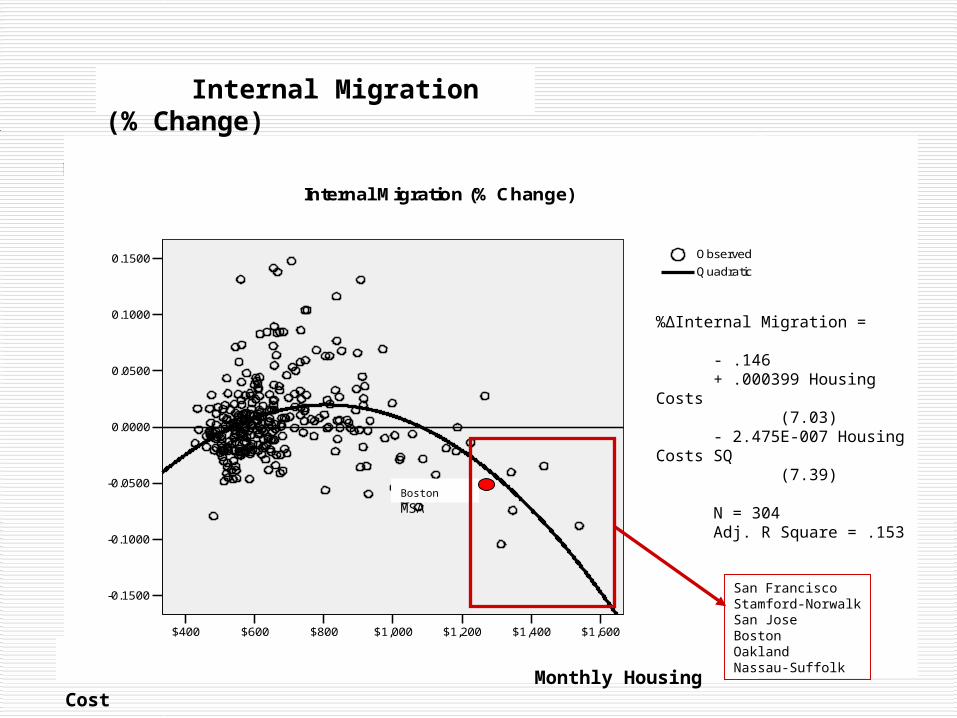
0.1500
0.1000
0.0500
0.0000
-0.0500
-0.1000
-0.1500
$1,600$1,400$1,200$1,000$800$600$400
Monthly Housing Costs
Quadratic
Observed
Internal Migration (% Change)
Internal Migration (% Change)
Monthly Housing Cost
Boston MSA
%∆Internal Migration =
- .146 + .000399 Housing Costs (7.03) - 2.475E-007 Housing Costs SQ (7.39)
N = 304 Adj. R Square = .153
San FranciscoStamford-NorwalkSan JoseBostonOaklandNassau-Suffolk
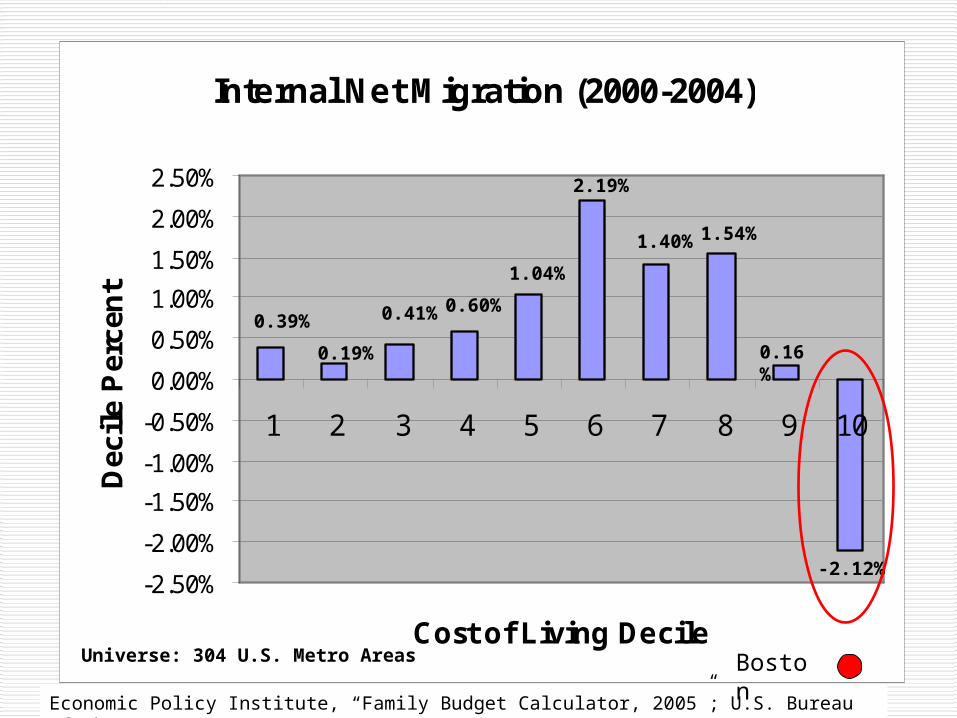
Internal Net Migration (2000-2004)
-2.50%
-2.00%
-1.50%
-1.00%
-0.50%
0.00%
0.50%
1.00%
1.50%
2.00%
2.50%
1 2 3 4 5 6 7 8 9 10
Cost of Living Decile
Dec
ile
Per
cen
t
-2.12%
0.16%
1.54%1.40%
2.19%
1.04%
0.60%0.41%
0.19%
0.39%
Economic Policy Institute, “Family Budget Calculator, 2005”; U.S. Bureau of the Census
Universe: 304 U.S. Metro Areas Boston

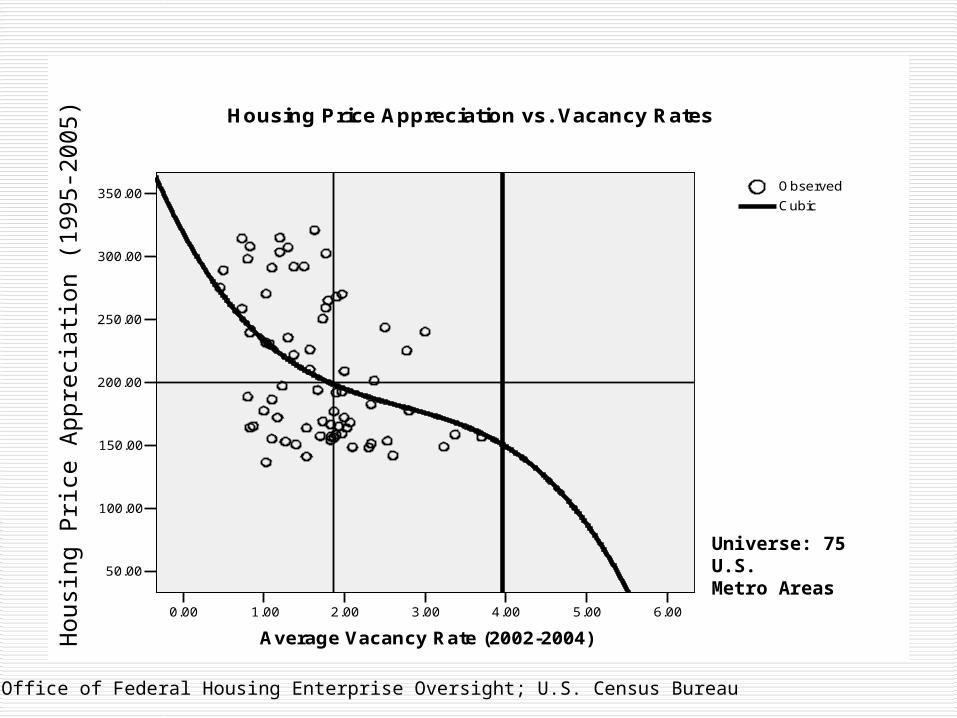
What is the relationship between housing prices and housing supply?
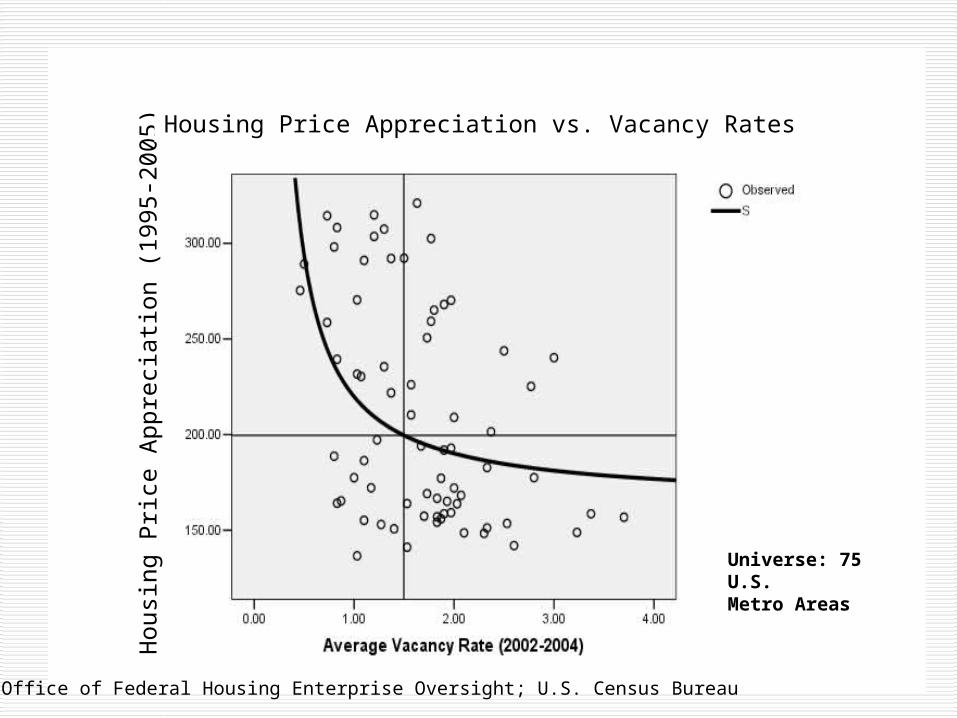
Hou
sing
Pric
e A
ppre
ciat
ion
(199
5-20
05)
Housing Price Appreciation vs. Vacancy Rates
Office of Federal Housing Enterprise Oversight; U.S. Census Bureau
Universe: 75 U.S. Metro Areas
350.00
300.00
250.00
200.00
150.00
100.00
50.00
6.005.004.003.002.001.000.00
Average Vacancy Rate (2002-2004)
Cubic
Observed
Housing Price Appreciation vs. Vacancy Rates
Office of Federal Housing Enterprise Oversight; U.S. Census Bureau
Universe: 75 U.S. Metro Areas
Hou
sing
Pric
e A
ppre
ciat
ion
(199
5-20
05)
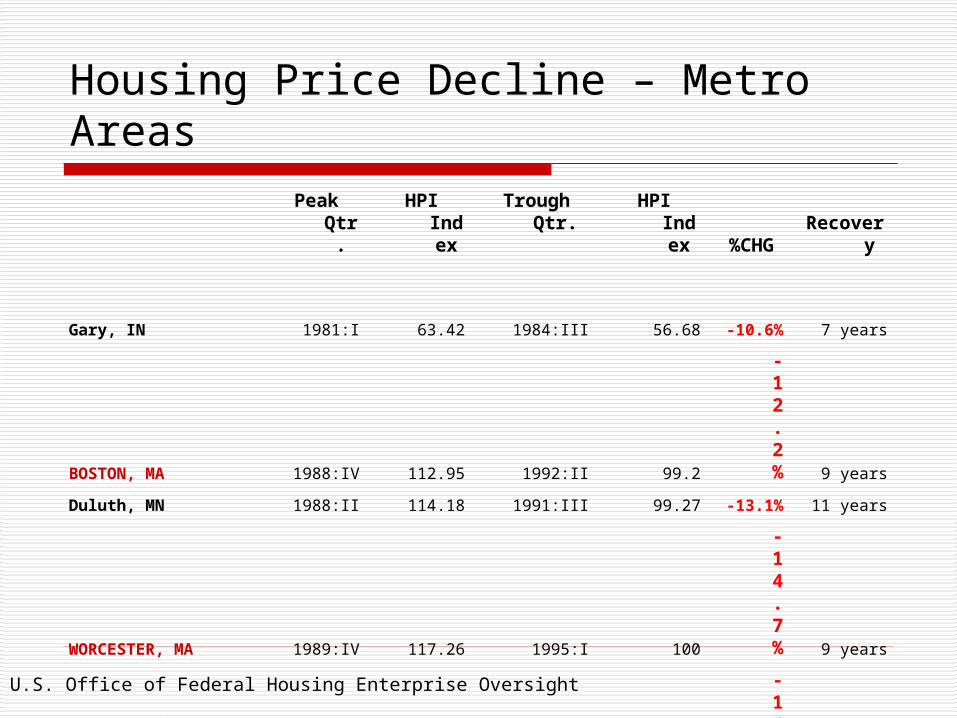
Housing Price Decline – Metro Areas
Peak Qtr. HPI IndexTrough Qtr.
HPI Index %CHG Recovery
Gary, IN 1981:I 63.42 1984:III 56.68 -10.6% 7 years
BOSTON, MA 1988:IV 112.95 1992:II 99.2 -12.2% 9 years
Duluth, MN 1988:II 114.18 1991:III 99.27 -13.1% 11 years
WORCESTER, MA 1989:IV 117.26 1995:I 100 -14.7% 9 years
SPRINGFIELD, MA 1989:iv 117.43 1995:i 100 -14.8% 11 years
Honolulu, HI 1993:II 101.55 1999:III 84.69 -16.6% 9 years
Detroit, MI 1981:IV 61.29 1982:IV 49.69 -18.9% 5 years
Hartford, CN 1988:III 126.4 1995:I 100 -20.9% 13 years
Los Angeles, CA 1990:III 127.16 1996:III 99.7 -21.6% 12 years
Lafayette, LA 1982:iii 115.27 1988:IV 65.53 -43.2% 15 years
U.S. Office of Federal Housing Enterprise Oversight
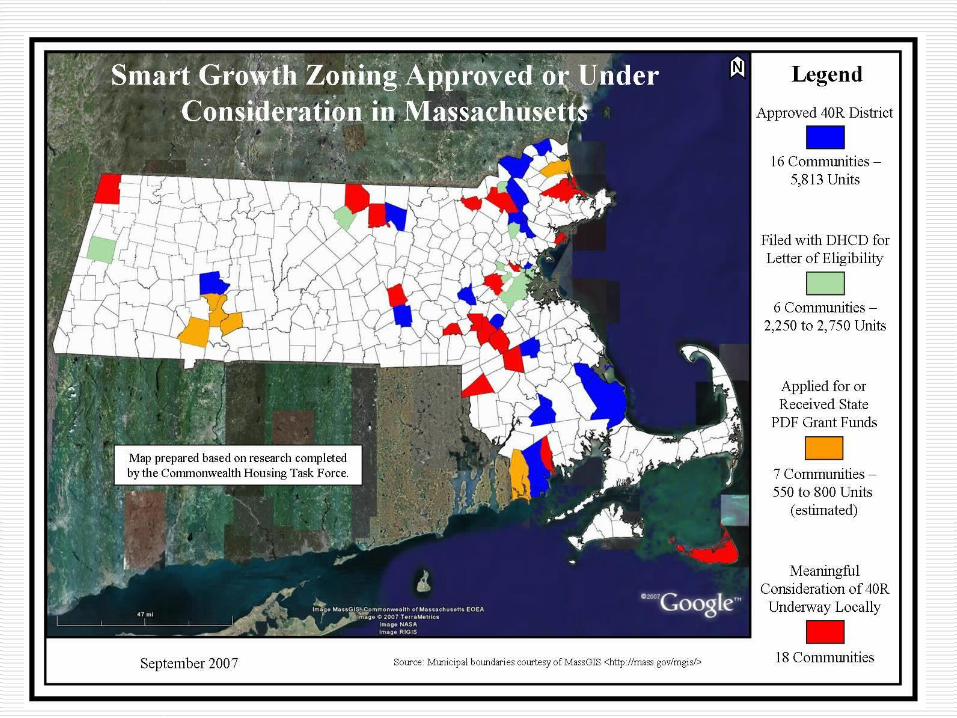
Chapter 40R and 40S
New Steps to Solve the Massachusetts Housing Crisis … and protect the Commonwealth’s economy
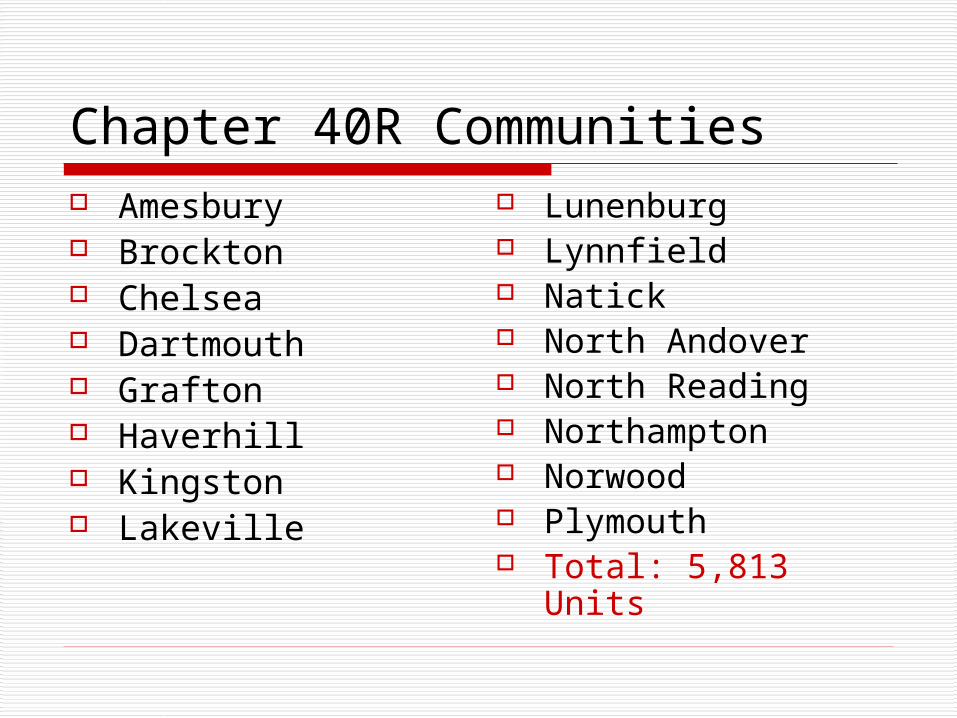
Chapter 40R Communities Amesbury Brockton Chelsea Dartmouth Grafton Haverhill Kingston Lakeville
Lunenburg Lynnfield Natick North Andover North Reading Northampton Norwood Plymouth Total: 5,813 Units
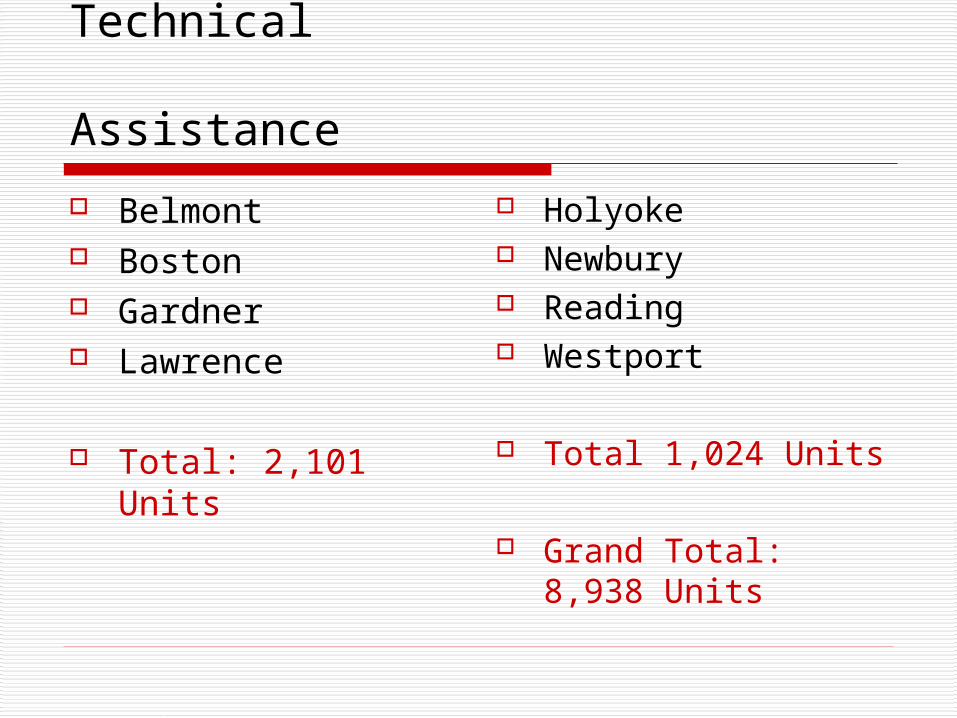
Filed for 40R Filed for Technical Assistance
Belmont Boston Gardner Lawrence
Total: 2,101 Units
Holyoke Newbury Reading Westport
Total 1,024 Units
Grand Total: 8,938 Units
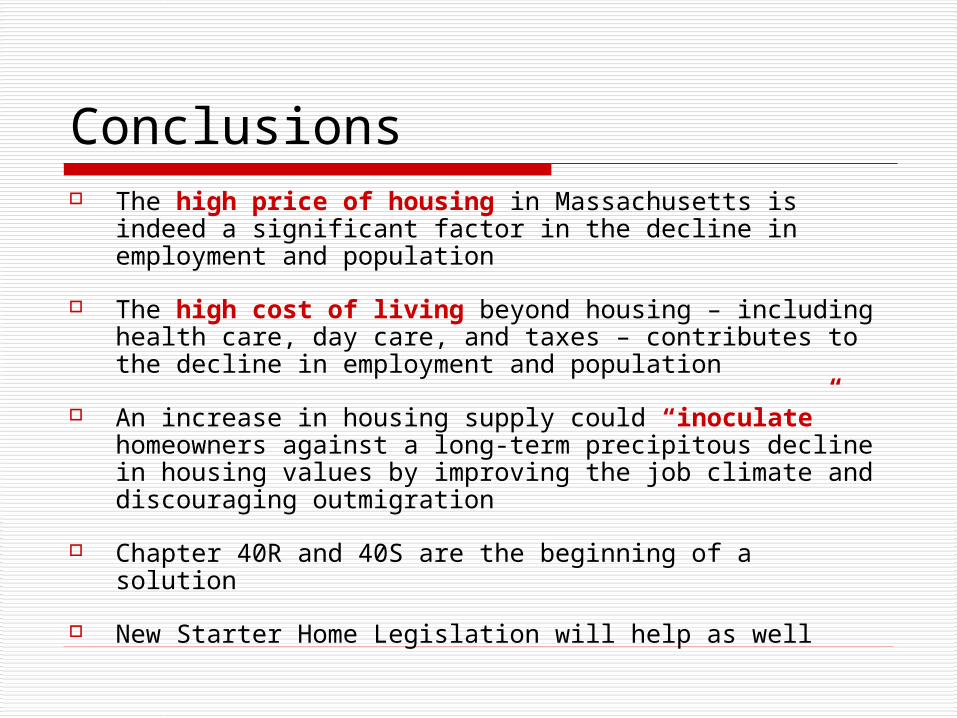
Conclusions The high price of housing in Massachusetts is indeed a
significant factor in the decline in employment and population
The high cost of living beyond housing – including health care, day care, and taxes – contributes to the decline in employment and population
An increase in housing supply could “inoculate” homeowners against a long-term precipitous decline in housing values by improving the job climate and discouraging outmigration
Chapter 40R and 40S are the beginning of a solution
New Starter Home Legislation will help as well