Embed Size (px)
Citation preview
1143Q 2002 Estuarine Research Federation
Estuaries Vol. 25, No. 6A, p. 1143–1163 December 2002
Determining the Trophic Guilds of Fishes and Macroinvertebrates
in a Seagrass Food Web
JOSEPH J. LUCZKOVICH1,2,*, GARCY P. WARD3, JEFFREY C. JOHNSON1,4, ROBERT R. CHRISTIAN2,DANIEL BAIRD5, HILARY NECKLES6, and WILLIAM M. RIZZO7
1 Institute for Coastal and Marine Resources, East Carolina University, Greenville, North Carolina27858
2 Department of Biology, East Carolina University, Greenville, North Carolina 278583 North Carolina Department of Environment and Natural Resources, Division of Water Quality,
943 Washington Square Mall, Washington, North Carolina 278894 Department of Sociology, East Carolina University, Greenville, North Carolina 278585 Department of Zoology, University of Port Elizabeth, P.O. Box 1600, Port Elizabeth, South Africa6 United States Geological Survey, Patuxent Wildlife Research Center, 26 Ganneston Drive,
Augusta, Maine 043307 United States Geological Survey, Northern Prairie Wildlife Research Center, Missouri Field
Station, University of Missouri—Columbia, 302 Gentry Hall, Columbia, Missouri 65211
ABSTRACT: We established trophic guilds of macroinvertebrate and fish taxa using correspondence analysis and ahierarchical clustering strategy for a seagrass food web in winter in the northeastern Gulf of Mexico. To create the dietmatrix, we characterized the trophic linkages of macroinvertebrate and fish taxa present in Halodule wrightii seagrasshabitat areas within the St. Marks National Wildlife Refuge (Florida) using binary data, combining dietary links obtainedfrom relevant literature for macroinvertebrates with stomach analysis of common fishes collected during January andFebruary of 1994. Heirarchical average-linkage cluster analysis of the 73 taxa of fishes and macroinvertebrates in thediet matrix yielded 14 clusters with diet similarity $ 0.60. We then used correspondence analysis with three factors tojointly plot the coordinates of the consumers (identified by cluster membership) and of the 33 food sources. Corre-spondence analysis served as a visualization tool for assigning each taxon to one of eight trophic guilds: herbivores,detritivores, suspension feeders, omnivores, molluscivores, meiobenthos consumers, macrobenthos consumers, and pis-civores. These trophic groups, cross-classified with major taxonomic groups, were further used to develop consumercompartments in a network analysis model of carbon flow in this seagrass ecosystem. The method presented here shouldgreatly improve the development of future network models of food webs by providing an objective procedure foraggregating trophic groups.
IntroductionTrophic relationships comprise the framework
upon which estuarine communities are organized.Increasingly, quantitative food-web models and car-bon flow network analyses are being employed tostudy and describe the trophic structure in estu-aries (Baird and Ulanowicz 1989; Baird et al. 1991,1998; Monaco and Ulanowicz 1997; Christian andLuczkovich 1999). Such models are useful becausethe vast complexity of estuarine food web datafrom published studies can be summarized in asimplified model consisting of a network of com-partments connected by trophic links or carbonflows.
It is often unclear what entities are to be includ-ed as the nodes or compartments in the networkmodel. One approach would be to use species as
* Corresponding author; e-mail: [email protected].
nodes (or even ontogenetic stage within a species;Polis and Winemiller 1996). The species-level ap-proach is often impractical, because it is difficultto identify and link quantitatively all species in thefood web (especially the microbes) at the level ofspecies (Cohen et al. 1993). Most published die-tary studies on estuarine species do not identifyprey to the level of species (Hicks and Coull 1983;Huh and Kitting 1985; Gaston et al. 1988, 1992;Livingston 1988; Motta et al. 1995). In networkanalysis packages such as ECOPATH (Christiansenand Pauly 1992, 1993; Heymans and Baird 2000)or NETWRK (Ulanowicz 1987), one must specifydetailed input parameters for each designatedcompartment, including measurements of produc-tion, respiration, consumption, and biomass (Kayet al. 1989). These parameters may be unknownfor all species present in the estuary. The typicalsolution for handling such missing data is to pool
1144 J. J. Luczkovich et al.
species into trophic groups and assume that all spe-cies in a group have similar diets and metabolicactivity. Aggregation of species into trophically sim-ilar groups is a desirable goal for food web mod-elers (Yodzis 1996). Various notions have been sug-gested for aggregating taxa into trophic groups, in-cluding guilds, which include taxa that exploit sim-ilar prey resources (Root 1973) and trophospecies,which include taxa that have similar diets and sim-ilar predators (Briand and Cohen 1984; Yodzis1989; Turner and Roff 1993; Yodzis and Winemill-er 1999).
It is not clear how one should aggregate consum-er taxa into trophic groups. While aggregation oftaxa based on the diet relations is routinely donein network analysis, the past methods have beenad hoc or based on intuition alone. Current prac-tice relies mostly on ad hoc methods of aggrega-tion based on the modeler’s perception of whichgroups of species have similar diets. Aggregationbased solely on diet similarity, with groupings con-taining taxa that consume similar foods in a similarmanner, is the basis for the trophic guild concept(Root 1973). In a guild analysis, diet similarityamong taxa to be grouped can be measuredthrough the use of niche overlap indices, cluster-ing strategies, or ordination procedures (Sheridan1979; Livingtson 1980, 1982; Grossman 1986; Mot-ta et al. 1995). Similarity in both diet and predatorrelations could be jointly used to aggregate taxa,which is the trophospecies or trophic group con-cept proposed by Yodzis and Winemiller (1999).The trophic groups should reflect both the preyand predator relations (Turner and Roff 1993;Persson et al. 1996; Yodzis and Winemiller 1999;Johnson et al. 2001).
Problems arise for network modelers when at-tempting to use published dietary studies alone tospecify both the predator and prey relations, be-cause, as noted above, the prey and predator re-lations are not often specified at the level of spe-cies. An initial aggregation of taxa often has oc-curred during the publication of original diet anal-ysis, and, even if a species’ diet is known, itspredators may not be well described. After the di-etary data are compiled from the literature, theycan be represented as a diet matrix with the vari-ous consumer taxa as rows and the aggregatedfoods consumed as columns, with fewer columnsthan rows. The resulting diet matrix will be rect-angular. But network models require a square ma-trix for dietary data (i.e., all compartments mustappear in both rows and columns and the cells rep-resent the proportion of flow of material fromeach compartment to the others). A solution forthis problem is to employ a dual-mode classifica-tion approach, which can be used on the rectan-
gular matrix data to combine consumer taxa intoa smaller number of groups with similar diets (tro-phospecies).
There are many multivariate approaches for an-alyzing such two-mode matrices, including such fa-miliar ordination methods (factor analysis, PCA)or hierarchical clustering algorithms (Dillon andGoldstein 1984). These approaches show only thesimilarity among the rows or consumers based onsimilarity in diet, but not among the columnsbased on similarity among predators. An approachin which both relations can be discerned simulta-neously is called dual-scaling analysis (Greenacre1984; Gittins 1985). One such dual-scaling ap-proach is correspondence analysis (or reciprocalaveraging), which allows a simultaneous display ofthe similarity of consumer taxa in the same multi-variate space as the aggregated prey categories(Gittins 1985). By using correspondence analysis,one can uncover similarity in both the diets of theconsumers in the food web and in predator rela-tions of the food or prey resources. Proximity oftwo consumers or food sources in a correspon-dence analysis factor score plot indicates a similardiet (for consumer taxa) or a similar suite of pred-ators (for the food resources).
We demonstrate the use of cluster analysis andcorrespondence analysis to aggregate estuarinemacroinvertebrates and fish into trophic groupsbased on measures of diet and predator similarity.This method is a type of guild analysis, in whichpredator relationships may also be discerned. Wedeveloped our trophic classifications using dietarydata obtained during the construction of a carbon-flow network model of the St. Marks, Florida, Hal-odule wrightii seagrass ecosystem during the winterof 1994 (Baird et al. 1998; Christian and Luczkov-ich 1999). Cluster analysis was first used to groupconsumer taxa in to a small number of clusters,which could be coded for further analysis. A cor-respondence analysis was used to calculate factorscores of each of the food sources and the originallist of consumers. A factor scores plot was visuallyexamined to discern groups of consumer taxa(coded by cluster membership) and match themwith their food sources. The resulting trophicgroups were used in establishing the compart-ments in network models. We apply the methodhere, both to the fishes present in our study area,for which we collected some new dietary data, aswell as the entire suite of macroinvertebrate andfish consumer taxa in the St. Marks Wildlife Refugeseagrass ecosystem.
Materials and MethodsOur study goal was to characterize the winter H.
wrightii seagrass food web of the St. Marks National
Trophic Guilds in a Seagrass Food Web 1145
Wildlife Refuge in St. Marks, Florida, ranging fromthe intertidal zone to 150 m offshore. Four studysites (each 200 m along the coast 3 150 m off-shore) were established in Apalachee Bay andGoose Creek Bay near the mouth of the St. MarksRiver. Two sites were chosen in Goose Creek Bay:Live Oak Island (3084.59N, 84816.49W) and WakullaBeach (3086.29N, 84815.69W). These were sampledin January and February 1994. To assess sampleadequacy and variability among sites, an additionalsite was established in Apalachee Bay each month:one site at Sprague Island (3085.09N, 84812.29W, inJanuary) and another at the St. Marks Lighthouse(3084.29N, 84811.09W, in February). Water depthvaried within this zone according to tides andwinds, never exceeded 1.0 m during sampling, andaveraged 0.75 m deep.
At each of these sites, we obtained replicate sam-ples of the various zooplankton, benthic macroin-vertebrate, and fish taxa along three 100-m tran-sects perpendicular to the shore spaced 100 mapart. The minimal level of replication was threesamples for each site (see individual sections belowfor details on replication).
ZOOPLANKTON
Zooplankton samples were obtained with a 29-cm diameter, 90-mm mesh plankton net towed overa 45.7-m distance (three replicate tows per site)along each transect. The net was pulled throughthe water with the aid of a small boat powered byan electric trolling motor, and the amount of waterfiltered in the samples was calculated to be 2.9 m3.Zooplankton organisms (calanoid and harpacti-coid copepods, nematodes, larval forms, and pyc-nogonids) were concentrated in a 1000-ml collec-tion jar. The zooplankton samples were preservedwith 5% formalin and rose bengal stain. Three rep-licate 2-ml subsamples were obtained with a cali-brated pipette from each 1000-ml sample (after re-suspension of the sample by repeated inversionand mixing of the sample in the jar) and the zoo-plankton taxa enumerated under low power mag-nification. The taxa were identified using Smith(1977). Zooplankton abundance data sampleswere used to get a species list of dominant taxa tobe included as presence-absence data in the dietmatrix as consumers.
MACROBENTHOS
The macrobenthos (which included the echi-noderms, gastropods, bivalves, amphipods, deca-pods, isopods, cumacea, and polychaetes . 500mm) within the study zone at each site were sam-pled using a 75-mm diameter PVC coring tube(Lewis and Stoner 1981). Ten macrobenthic coressamples (to 10 cm depth) were taken randomly
along each of the three transects at a site. The tran-sects were located along a very slight depth gradi-ent (, 5 cm difference between ends of the tran-sect), but all were contained within Halodule habi-tats at each site. All cores from a transect line werepooled, regardless of distance from shore, so thatthere were three groups of 10 pooled core samplesfrom each site (thus 3 replicates per site). All coresamples were sieved in the field and preserved in10% formalin and stained with rose bengal for lat-er sorting, identification, enumeration, and weigh-ing in the laboratory. The amphipods, gastropods,bivalves, isopods, and decapods were all identifiedto the species level using identification guides inSchultz (1969), Gosner (1971), Bousfield (1973),Fox and Bynum (1975), Morris (1975), Myers(1981), Williams (1984), and Fox and Rupert(1985). The polychaetes were identified to thefamily level using Fauchauld (1977) and Uebelack-er and Johnson (1984). Taxonomic names followthose given in Camp et al. (1998). Smaller benthicconsumers (meiofauna, microfauna, and benthicbacteria) were sampled separately (see Baird et al.1998; Christian and Luczkovich 1999) and werenot included as consumer taxa in this analysis.
FISHES AND NEKTON
The fishes and large mobile invertebrate nektonwere sampled using a barrier seine, which was de-veloped for this study, and gill nets. Barrier nets(3.2-mm mesh seines, 1.22-m high by 11-m long oneach side tied to PVC poles driven into the sedi-ment) were placed approximately 10 m beyond theend of each transect line, forming two sides of a60-m2 triangular area. There were three barriernets set up at each site. The barrier nets were de-ployed upon arriving at a site in the morning, andsampled about 2 h later, to allow nekton to recover.The barrier nets were sampled using a 15.2-m longby 1.8-m high collection seine (3.2-mm mesh) witha 3-m by 2-m collection bag sewn into the middle,which was stretched along the hypotenuse of thetriangular sampling area while being held tightlyto one of the corner poles. When the collectionseine had been completely stretched along the hy-potenuse, the net was pulled inside the barrier netsalong the two remaining sides of the triangle, untilreaching around to its other end, thus completelyencircling the area to be sampled. This procedureswept the area clear of most fishes and mobile in-vertebrates. At this point the collection bag waspursed and lifted into a large plastic basin for ex-amination and preservation of the catch. Mark andrecapture studies indicated that an average of 45%of fin-clipped pinfish Lagodon rhomboides (;45 mmSL, n 5 283 tagged fish) introduced within theenclosed 60-m2 area were recovered on three rep-
1146 J. J. Luczkovich et al.
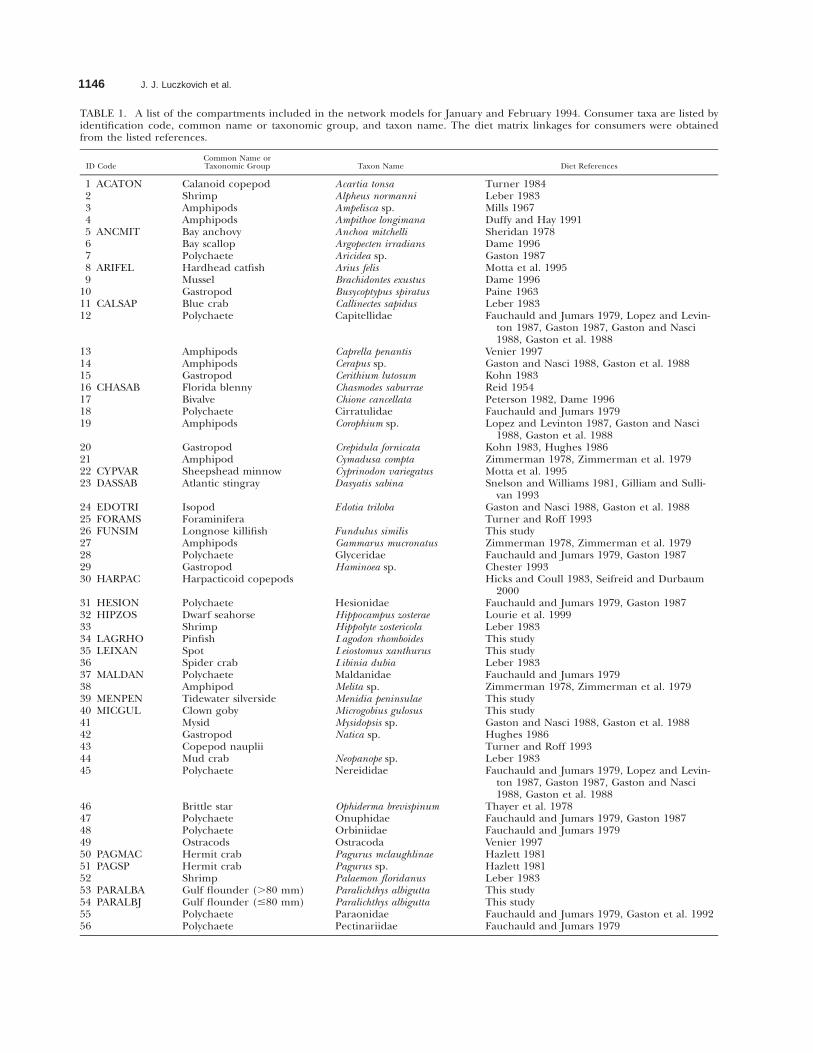
TABLE 1. A list of the compartments included in the network models for January and February 1994. Consumer taxa are listed byidentification code, common name or taxonomic group, and taxon name. The diet matrix linkages for consumers were obtainedfrom the listed references.
ID CodeCommon Name orTaxonomic Group Taxon Name Diet References
1 ACATON2345 ANCMIT678 ARIFEL9
1011 CALSAP
Calanoid copepodShrimpAmphipodsAmphipodsBay anchovyBay scallopPolychaeteHardhead catfishMusselGastropodBlue crab
Acartia tonsaAlpheus normanniAmpelisca sp.Ampithoe longimanaAnchoa mitchelliArgopecten irradiansAricidea sp.Arius felisBrachidontes exustusBusycoptypus spiratusCallinectes sapidus
Turner 1984Leber 1983Mills 1967Duffy and Hay 1991Sheridan 1978Dame 1996Gaston 1987Motta et al. 1995Dame 1996Paine 1963Leber 1983
12 Polychaete Capitellidae Fauchauld and Jumars 1979, Lopez and Levin-ton 1987, Gaston 1987, Gaston and Nasci1988, Gaston et al. 1988
1314
AmphipodsAmphipods
Caprella penantisCerapus sp.
Venier 1997Gaston and Nasci 1988, Gaston et al. 1988
1516 CHASAB171819
GastropodFlorida blennyBivalvePolychaeteAmphipods
Cerithium lutosumChasmodes saburraeChione cancellataCirratulidaeCorophium sp.
Kohn 1983Reid 1954Peterson 1982, Dame 1996Fauchauld and Jumars 1979Lopez and Levinton 1987, Gaston and Nasci
1988, Gaston et al. 198820 Gastropod Crepidula fornicata Kohn 1983, Hughes 198621 Amphipod Cymadusa compta Zimmerman 1978, Zimmerman et al. 197922 CY PVAR23 DASSAB
Sheepshead minnowAtlantic stingray
Cyprinodon variegatusDasyatis sabina
Motta et al. 1995Snelson and Williams 1981, Gilliam and Sulli-
van 199324 EDOTRI Isopod Edotia triloba Gaston and Nasci 1988, Gaston et al. 198825 FORAMS26 FUNSIM27
ForaminiferaLongnose killifishAmphipods
Fundulus similisGammarus mucronatus
Turner and Roff 1993This studyZimmerman 1978, Zimmerman et al. 1979
282930 HARPAC
PolychaeteGastropodHarpacticoid copepods
GlyceridaeHaminoea sp.
Fauchauld and Jumars 1979, Gaston 1987Chester 1993Hicks and Coull 1983, Seifreid and Durbaum
200031 HESION32 HIPZOS3334 LAGRHO35 LEIXAN3637 MALDAN3839 MENPEN
PolychaeteDwarf seahorseShrimpPinfishSpotSpider crabPolychaeteAmphipodTidewater silverside
HesionidaeHippocampus zosteraeHippolyte zostericolaLagodon rhomboidesLeiostomus xanthurusLibinia dubiaMaldanidaeMelita sp.Menidia peninsulae
Fauchauld and Jumars 1979, Gaston 1987Lourie et al. 1999Leber 1983This studyThis studyLeber 1983Fauchauld and Jumars 1979Zimmerman 1978, Zimmerman et al. 1979This study
40 MICGUL Clown goby Microgobius gulosus This study41 Mysid Mysidopsis sp. Gaston and Nasci 1988, Gaston et al. 198842434445
GastropodCopepod naupliiMud crabPolychaete
Natica sp.
Neopanope sp.Nereididae
Hughes 1986Turner and Roff 1993Leber 1983Fauchauld and Jumars 1979, Lopez and Levin-
ton 1987, Gaston 1987, Gaston and Nasci1988, Gaston et al. 1988
46474849
Brittle starPolychaetePolychaeteOstracods
Ophiderma brevispinumOnuphidaeOrbiniidaeOstracoda
Thayer et al. 1978Fauchauld and Jumars 1979, Gaston 1987Fauchauld and Jumars 1979Venier 1997
50 PAGMAC51 PAGSP5253 PARALBA54 PARALBJ55
Hermit crabHermit crabShrimpGulf flounder (.80 mm)Gulf flounder (#80 mm)Polychaete
Pagurus mclaughlinaePagurus sp.Palaemon floridanusParalichthys albiguttaParalichthys albiguttaParaonidae
Hazlett 1981Hazlett 1981Leber 1983This studyThis studyFauchauld and Jumars 1979, Gaston et al. 1992
56 Polychaete Pectinariidae Fauchauld and Jumars 1979
Trophic Guilds in a Seagrass Food Web 1147
TABLE 1. Continued.
ID CodeCommon Name orTaxonomic Group Taxon Name Diet References
57 FARDUO58 POLINICES5960 PRIONOT61
ShrimpGastropodPolychaete larvaeSearobinsShrimp
Farfantepenaeus duoarumPolinices sp.
Prionotus sp.Processa bermudensis
Leber 1983Paine 1963, Kohn 1983, Hughes 1986Turner and Roff 1993Richards et al. 1979Leber 1983
62 SABELL63 SCIACEJ64 SCIOCEA6566
PolychaetesRed drum (juveniles)Red drum (adults)PolychaetesPolychaetes
SabellidaeSciaenops ocellatusSciaenops ocellatusSerpulidaeSpionidae
Fauchauld and Jumars 1979Peters and McMichael 1987Peters and McMichael 1987Fauchauld and Jumars 1979Fauchauld and Jumars 1979, Gaston and Nasci1988, Gaston et al. 1988
67 STRMAR68
Atlantic needlefishPolychaete
Strongylura marinaSyllidae
This studyFauchauld and Jumars 1979, Gaston 1987
69 SYMPLA70 SYNSCO
Blackcheek tonguefishGulf pipefish
Symphurus plagisuaSyngnathus scovelli
Topp and Hoff 1972Huh and Kitting 1985, Motta et al. 1995
71 Tanaeid Hargeria rapax Gaston and Nasci 1988, Gaston et al. 198872 UROFLO73
Southern hakegastropod
Urophycis floridanaUrosalpinx perrugata
This studyKohn 1983, Hughes 1986
Food sourcesALGAAMPHBACTBIVACARRIONCILLCRABCUMADETRDOCECHIEPIP
Macro-algaeAmphipodsBacteriaBivalvesCarrionCilliated protozoansCrabsCumaceansDetritusDissolved organic carbonEchinodermsEpiphytic algae
FISHFORAGASTHARPISOPMALGMYSIDNEMAPOLYSEAGSHRIMPWBAC
FishesForaminiferaGastropodsHaracticoid copepodsIsopodsMicroalgae and diatomsMysidsNematodesPolychaetesSeagrassesShrimpWater-column bacteria
WCALWCILWDETWFOR
WHAR
WMIC
WNEMWPOLWPYC
Calanoid copepodsWater-column ciliatesSuspended detritusWater-column
foraminiferansWater column harpacticoid
copepodsWater-column microalgae
(phytoplankton)Water-column nematodesWater-column polychaetesWater-column pycnogonids
licate net sweeps. Fishes and invertebrates wereplaced in 10% formalin for later sorting, identifi-cation, enumeration, weighing, and stomach con-tent analysis. Adjacent to each barrier net, a mono-filament gill net (45.7-m long by 1.2-m high, with3.8-cm and 7.6-cm stretch mesh panels) was placedby tying it to 2-m PVC poles driven into the sedi-ment. Three gill nets were set immediately uponarriving at a site and sampled at or before sunsetin February, but were allowed to fish overnight inJanuary because of low daytime tide levels. Fisheswere identified using Robbins and Ray (1986).
DIET ANALYSIS
In order to determine the structure of the dietmatrix required for the network food web model,diets were summarized based on the existing lit-erature (Table 1) or examined directly for somespecies of fishes (see Results). A diet matrix wasconstructed using the feeding relationships, whichconsisted of binary data (1 5 food, 0 5 not food)indicating the trophic links between the 73 con-sumer taxa and 33 possible food sources. The rowsof this rectangular matrix were the consumer taxaand the columns were the food sources, and linkswere based on the published diet studies (Table 1)
and our own data for some of the fishes. An ad-ditional 23 macroinvertebrate taxa were identifiedin benthic samples, but no dietary data were avail-able for these taxa in the literature, so they wereexcluded from this analysis. We assumed that whendetritus was indicated as a food source in the lit-erature, benthic or planktonic bacteria were in-cluded as an additional food source (Lopez andLevinton 1987).
The trophic link data were obtained from themost common fish species in our collections fol-lowing a modified sieve-fractionation stomach-con-tent-analysis methodology (Carr and Adams 1972,1973; Leber 1983; Luczkovich 1987; Luczkovichand Stellwag 1993). In this method, the stomachcontents of individual fish (gulf flounder, Para-lichthys albigutta, and Atlantic needlefish, Strongylu-ra marina) or pooled stomach contents of up to 15individuals (spot, Leiostomus xanthurus, pinfish, L.rhomboides, tidewater silversides, Menidia peninsulae,southern hake, Urophycis floridana, longnose killi-fish, Fundulus similis, and clown goby, Microgobiusgulosus) were passed through a series of nestedsieves (from 75–2,000 mm). Fish with empty stom-achs were not included in any diet analyses. Pool-ing was done for the species indicated above when
1148 J. J. Luczkovich et al.
more than a single fish within a species was ob-tained from a site. Because individuals of the samespecies obtained from a site are not likely to bestatistically independent, we used pooled stomachcontent data from within a barrier net collectionfor trophic link accumulation analyses. Gulf floun-der P. albigutta was rare in the barrier and gill netcollections, so additional stomach contents wereobtained from a National Marine Fisheries Servicetrawl survey conducted from March through Au-gust 1995 in northeastern Gulf of Mexico seagrassmeadows (Koenig personal communication) andanalyzed using our methods. After sieving, eachprey item (or parts of prey) retained on each sievewas identified as belonging to one of the 33 pos-sible food sources and enumerated. Prey categorieswere kept as specific as possible (families of poly-chaetes or genera of crustaceans), but in most cas-es were not identified to the species level. Thesieve fraction was dried at 608C for 48 h thenweighed. The proportional contribution of eachfood source was estimated using the numericalcounts within a sieve fraction and the proportionswere multiplied by the mass of the sieve fractionto obtain a dry mass retained on each sieve foreach food source category. Masses for each foodsource were summed from all sieve fractions to ob-tain the percentage dry mass for each food sourcewithin a fish species. This stomach content analysismethod was chosen because it is the similar to themethod used by Leber (1983), which provided di-etary data on the invertebrates in this region.
Trophic link accumulation curves for fishes col-lected in barrier nets were constructed by deter-mining the cumulative number of links to foodsources for pooled diets from each of the barriernet samples (Grossman 1986; Goldwasser andRoughgarden 1997). These curves represent thenumber of trophic links that were observed uponrepeated sampling within the study areas, and thusthe adequacy of diet analyses for each fish speciescollected. If asymptotes for these curves werereached for a fish species, we judged the diet anal-ysis to be adequate for the sampling area and timeperiod sampled.
STATISTICAL ANALYSIS
A hierarchical clustering procedure with averagelinkage and the Pearson’s distance measure (cal-culated as distance 5 1 2 r, where r is the Pearsoncorrelation among consumer taxa’s diets; Systat10.0, SPSS, Inc.) was used to group consumer taxa(rows in the rectangular binary diet matrix) on thebasis of their similarity in diets (columns in thematrix). Although proportional dietary informa-tion was used in the later network models, for thisanalysis only binary data were needed. Two sepa-
rate diet matrices were analyzed: a subset of thediet matrix consisting of the 20 species of fishesand their 22 possible food sources and the entirediet matrix with 73 macro-consumer taxa and their33 food sources. We used an agglomerative hier-archical clustering strategy, with each taxon consid-ered in its own cluster initially, and taxa werejoined using the average linkage method, whichaverages all distances among taxa within clusters tocalculate which cluster or taxon will be linked next.Such a clustering method was determined to bethe best widely available clustering method for thistype of data set by Yodzis and Winemiller (1999).A correspondence analysis (CA) between the con-sumer taxa (rows) and food sources (columns) wasthen used to compute CA factor scores for eachdiet matrix. CA is an ordination procedure that isone of a subset of methods referred to as dual-scaling of variables (Gittings 1985) that displays thesimilarity of two-mode data (e.g., in a rectangularmatrix of species by environmental variables) in acommon factor space. The CA procedure can beused on categorical or continuous data and wasimplemented using the network statistics softwarepackage UCINET 5 (Borgatti et al. 1999). Our pro-cedures here are similar to a procedure calledTWINSPAN in the ecological community analysisliterature (Gauch and Whittaker 1981), which usesCA in conjunction with divisive clustering strategy.Using CA, one can simultaneously visualize the re-lationships among row (in this case fish or macro-consumer taxa clusters) and column (in this casefood sources in the environment) data in the samelow-dimensional vector space (Greenacre 1984). Inthe subset of the diet matrix consisting of fishes, atwo-factor CA was done with factor scores for thefish species and their food sources plotted in a scat-terplot; species that did not exceed a threshold of0.4 Pearson’s distance in the hierarchical clusteranalysis were considered a separate cluster andidentified on the CA factor scores plot. A three-factor CA was done for the complete diet matrixand factor scores from the CA were plotted foreach possible food source and consumer taxon(106 points). The CA factor score plots were visu-ally inspected to find clusters of consumer taxathat were close in multivariate space to one of the33 food sources in each plot. By visualizing thecluster membership and the closest food sourcesin the plots, we established trophic guild member-ship for each species.
Results
DIET ANALYSIS OF FISHES
The diets of the fishes collected in the barrierand gill nets showed that most fishes consumed
Trophic Guilds in a Seagrass Food Web 1149
TABLE 2. Fish stomach contents (% dry mass) pooled from barrier seine collections at all sites (1, 2, 3, and 4) in January andFebruary 1994. Additional samples of gulf flounder were analyzed in 1995 from nearby sites to increase the sample size.
Prey Item Pinfish SpotTidewaterSilverside
GulfFlounder
,80 mm SL
GulfFlounder
.80 mm SLAtlantic
NeedlefishSouthern
HakeClownGoby
HardheadCatfish
LongnoseKillifish
SheepsheadMinnow
AmphipodsCalanoid copepodsCrabsCrustacean remainsCumaceaCladoceran
0.090.030.000.000.000.02
0.030.010.000.080.010.00
0.340.000.000.040.000.00
0.070.010.000.250.150.00
0.000.000.000.010.000.00
0.000.040.000.000.000.00
0.040.000.000.210.000.00
0.110.000.010.470.000.00
0.000.000.360.000.000.00
0.210.000.010.190.000.00
0.000.000.000.030.000.00
DiatomsEggsFish remainsFish scalesFishesGastropodsHarpacticoid copepods
0.230.050.000.020.000.000.28
0.240.000.000.000.000.000.38
0.050.060.110.000.130.000.00
0.000.000.140.000.040.000.00
0.000.000.180.000.730.000.00
0.000.000.360.000.590.000.00
0.000.000.120.000.300.080.00
0.000.000.000.000.000.000.31
0.000.000.020.170.040.000.00
0.000.000.040.000.000.000.00
0.070.000.010.000.000.000.01
InsectsIsopodsMacroalgaeMusselsMysidsNematodesOphuroids
0.020.000.000.000.000.020.00
0.000.000.000.000.000.010.00
0.000.000.000.000.000.000.04
0.000.000.000.000.240.000.00
0.000.000.000.000.000.010.00
0.000.000.000.000.000.000.00
0.000.000.000.000.000.000.00
0.000.030.000.020.000.020.00
0.000.000.000.000.000.000.00
0.000.000.270.050.000.030.00
0.000.000.810.000.000.000.00
OstracodsPolychaetesPycnogonidsShrimpsTanaeidaeVascular plantTotal
0.130.030.080.000.000.001.00
0.000.230.010.000.000.001.00
0.000.080.010.120.000.000.98
0.000.000.000.100.000.001.00
0.000.000.000.070.000.001.00
0.000.000.000.000.000.001.00
0.000.000.010.260.000.001.00
0.000.000.020.000.000.020.99
0.000.270.000.060.000.091.00
0.000.100.000.000.000.081.00
0.000.000.010.000.000.071.00
Average SL (mm)Sample size (n)
15.045
13.094
77.77
52.011
134.420
377.52
83.39
28.920
335.01
62.912
46.023
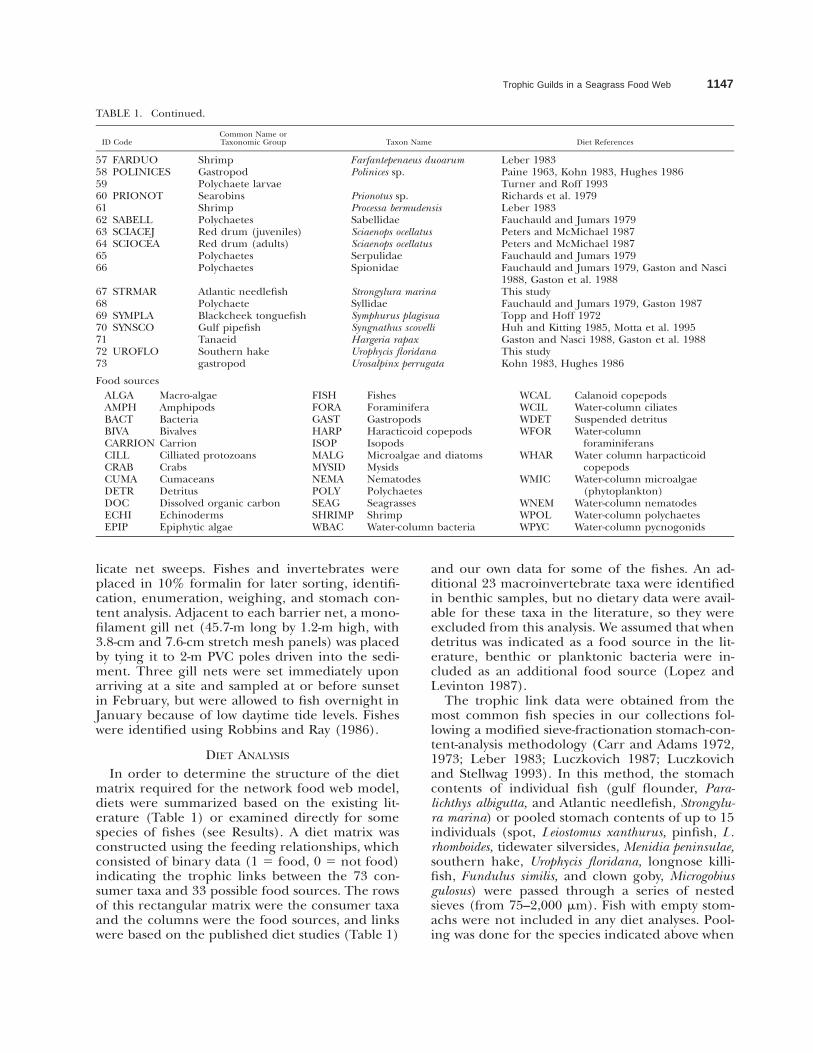
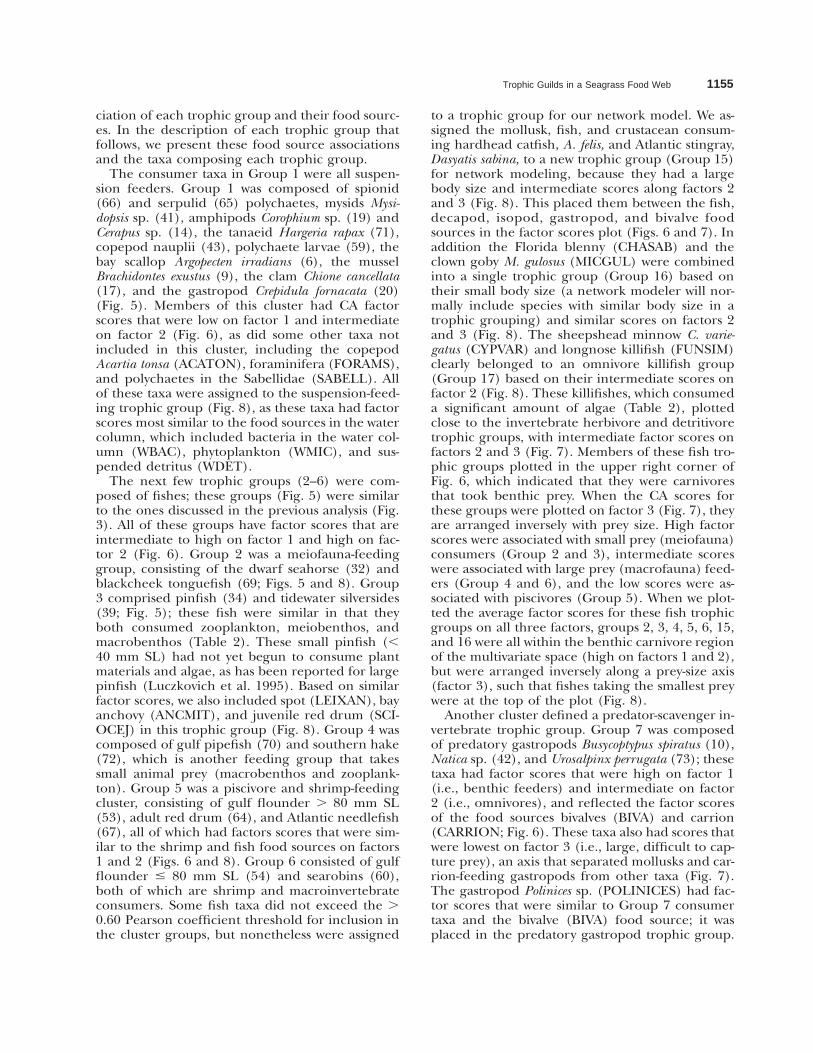
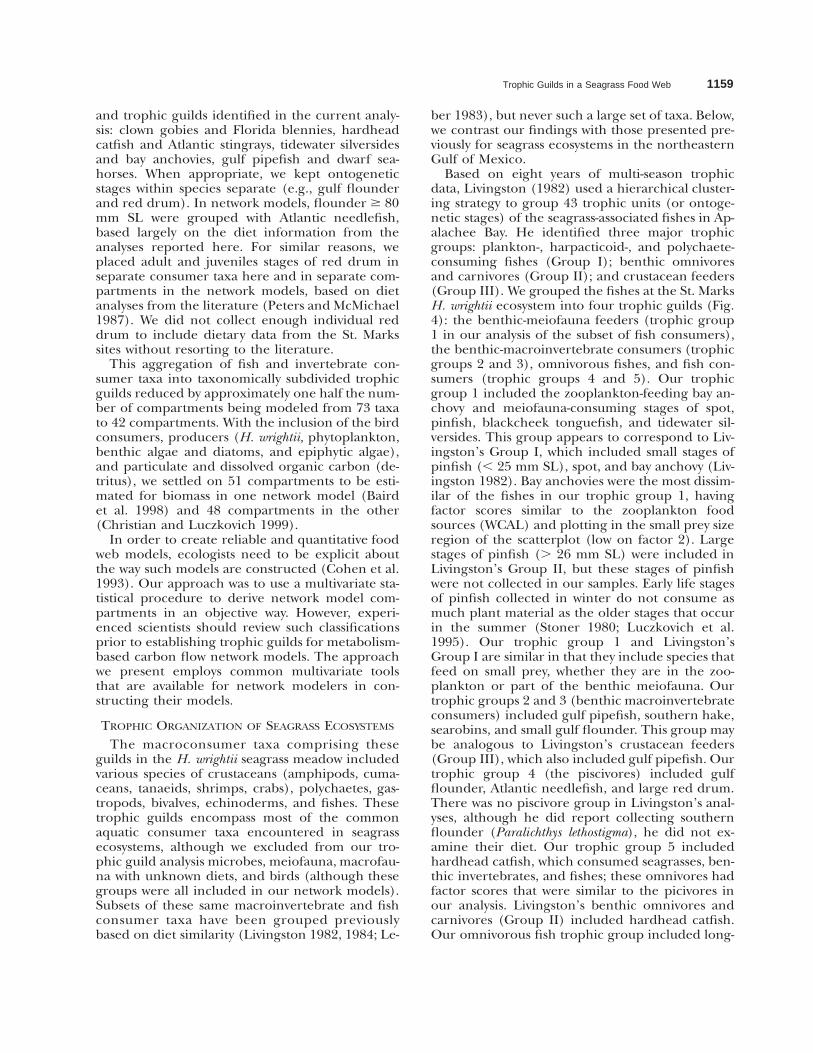
Fig. 1. A bar graph showing ontogenetic changes of gulfflounder, Paralichthys albigutta, diets collected in the St. Marksstudy areas and in a National Marine Fisheries Service trawlsurvey of northeastern Gulf of Mexico seagrass beds. The per-centage of diet is based on dry mass of fish stomach contents.Fish with empty stomachs have been excluded.
benthic prey (Table 2). Tidewater silversides M.peninsulae (x̄ SL 5 77.7 mm) preyed heavily onmacrobenthic prey such as amphipods and poly-chaetes, which was unexpected for this pelagic spe-cies. Even more surpisingly, in addition to benthicprey, tidewater silversides also fed on small fishes,
primarily juvenile spot of the same size as in oursamples, which composed 13% of their diet. Othersmaller fishes (clown goby M. gulosus x̄ SL 5 28.9mm, pinfish L. rhomboides x̄ SL 5 15.0 mm, andspot L. xanthurus x̄ SL 5 13.0 mm) fed heavily onmeiofauna (harpacticoid copepods). Other largefishes (gulf flounder P. albigutta . 80 mm, x̄ SL 5134.4 mm, Atlantic needlefish S. marina x̄ SL 5377.5 mm, and southern hake U. floridana x̄ SL 583.3 mm) were piscivores, with the proportion offishes in the diet varying from 30% in southernhake to 73% in gulf flounder $ 80 mm SL. Be-cause some of the gulf flounder were obtainedfrom a National Marine Fisheries Service trawlstudy conducted over a wider region of the north-eastern Gulf of Mexico during the winter, spring,and summer following this study (Koenig personalcommunication), ontogenetic classes were used forthis species (Fig. 1). For further analyses, gulfflounder . 80 mm SL were pooled into a singleontogenetic class that was largely piscivorous; smallgulf flounder # 80 mm SL (x̄ SL 5 52.0 mm) werekept as a separate ontogenetic class, which con-sumed various crustaceans (25% of diet were un-identifiable crustacean remains), mysids (24% ofthe diet), cumacea (15%), and a small amount of
1150 J. J. Luczkovich et al.
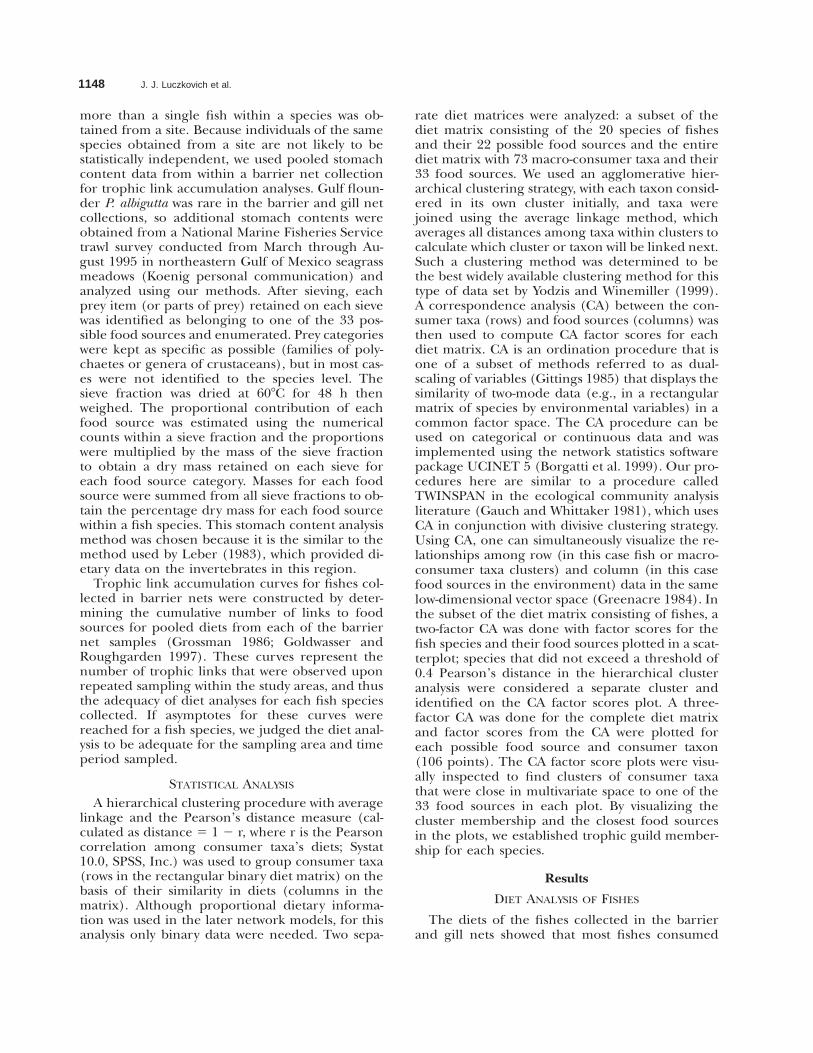
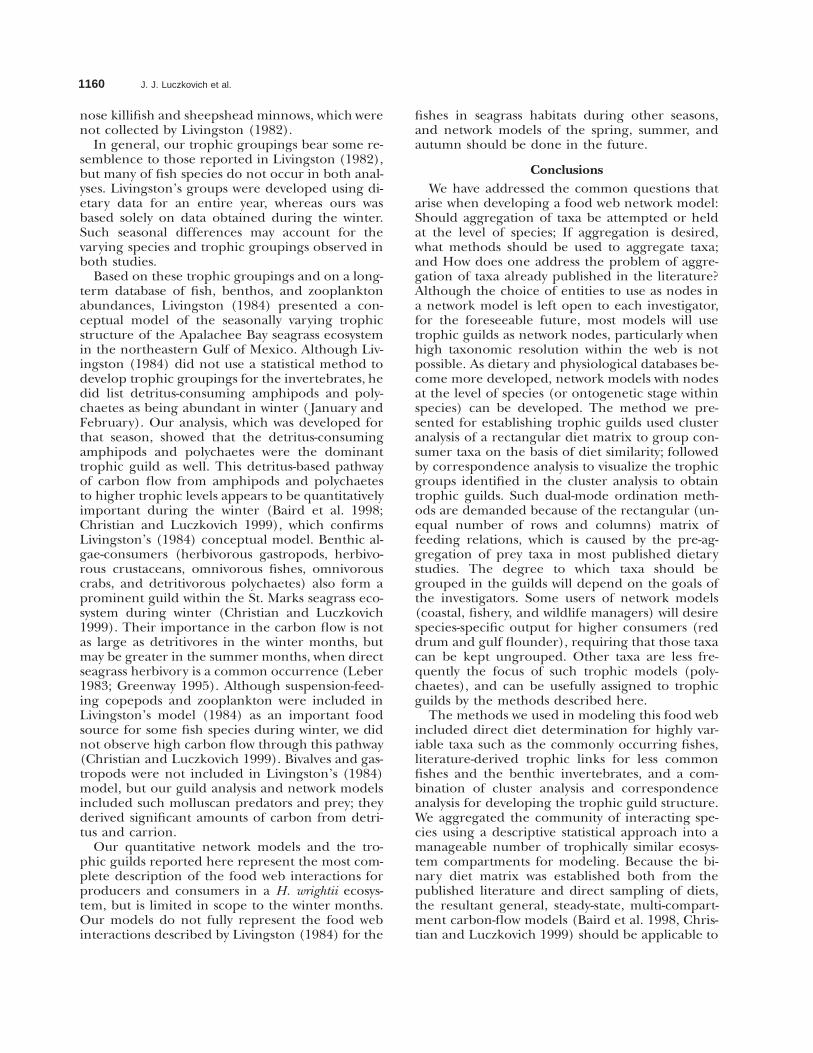
Fig. 2. Trophic linkage accumulation curves for longnosekillifish, Fundulus similis, southern hake, Urophycis floridana, Gulfflounder, Paralichthys albigutta, tidewater silverside, Menidia pen-insulae, pinfish, Lagodon rhomboides, and spot, Leiostomus xanthu-rus, showing the cumulative number of prey categories identi-fied within the stomachs of each species of fish examined ateach site.
fishes and fish remains (18%; Fig. 1). Longnosekillifish F. similis x̄ SL 5 62.9 mm, hardhead catfishArius felis (a single individual had food in the stom-ach, SL 5 335.0 mm), and sheepshead minnows(Cyprinodon variegatus x̄ SL 5 28.9 mm) were om-nivorous, consuming macroalgae, diatoms, and vas-cular plants, as well as amphipods, polychaetes,crabs, crustacean remains, harpacticoid copepods,and fish remains. Few fish were strictly zooplank-tivorous, although pinfish and Atlantic needlefishconsumed some calanoid copepods (, 3% of thediet). Ontogenetic classes were not used here forany species other than gulf flounder because of theuniformity of sizes of individuals captured duringthe 2 mo of sampling. Fish predators played a di-versity of trophic roles, including zooplanktivores,benthic invertebrate consumers, and piscivores, al-though there was a great deal of overlap amongspecies. Because of this overlap, a multivariate ap-proach is required to assign species to trophic clas-ses, which we will address in the next section.
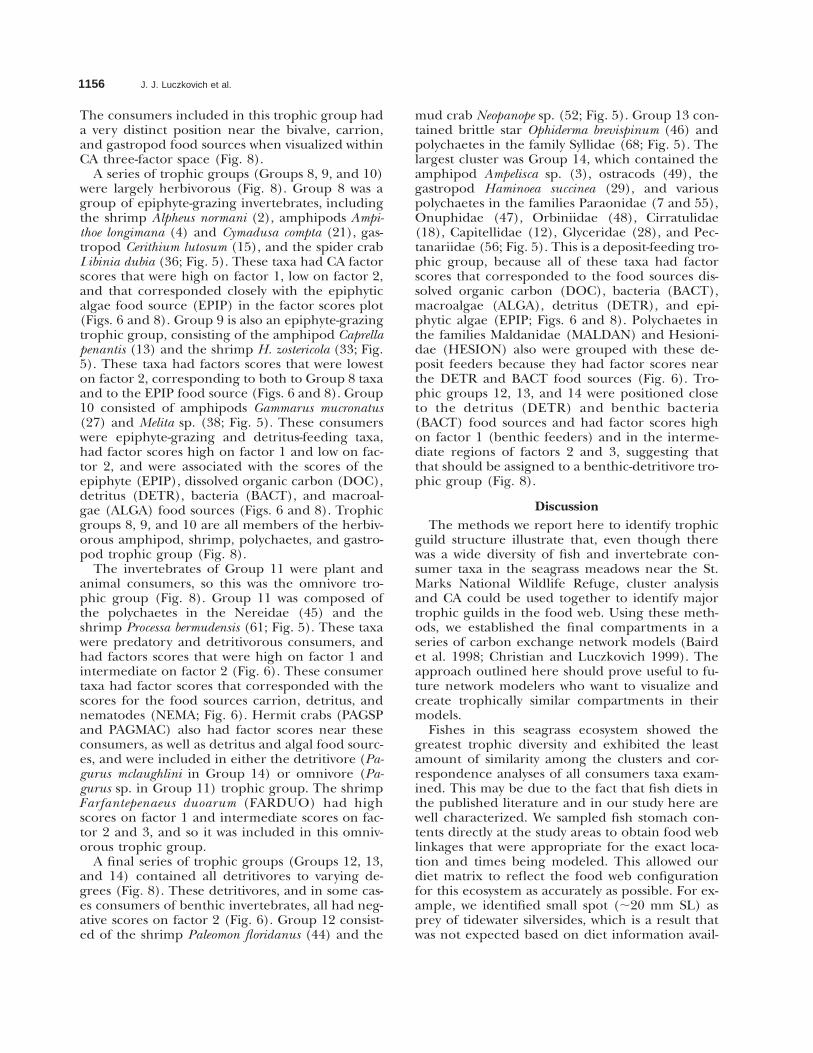
Dietary analyses for the various transect loca-tions were first judged for sampling adequacy usingtrophic link accumulation curves. The cumulativenumber of trophic links (where L 5 number ofprey categories) within fish diets when plotted asa function of the number of barrier net replicatesshowed that the trophic link accumulation curvesfor spot (L 5 8) and tidewater silversides (L 5 12)appeared to reach an asymptote after 3 net sam-ples, but then increased again after the 5th and6th net sample (Fig. 2). The cumulative numberof links did not reach an asymptote for pinfish (L5 13), longnose killifish (L 5 9), southern hake(L 5 8), or gulf flounder # 80 mm SL (L 5 5;
only gulf flounder caught in our barrier net sam-pling at St. Marks are included in this trophic linkanalysis). For some fish species (e.g., Atlantic nee-dlefish, S. marina, hardhead catfish, A. felis, andclown goby, M. gulosus, each of which occurred in, 2 net sets, although 20 clown goby stomachs con-tained food), the sample size was too low to con-clude anything about accumulation of dietarylinks. In terms of estimating the presence of rareprey in the diet, these trophic link accumulationcurves indicated that the diet analysis for fishescaptured in the St. Marks area was inadequate.Since our goal was to document the presence ofdominant food sources in the stomachs of thesespecies during the months of sampling, these dietdata were the best available for the locations andseasons being modeled. They were included in thediet matrix analyzed below, in addition to pub-lished dietary data available from other areas onthe same species.
TROPHIC GUILDS OF FISHESAND MACROINVERTEBRATES
The trophic guilds were established in two stepsfrom the diet matrix (Table 3). First, a hierarchicalclustering strategy was used to initially group theconsumer taxa; second, a CA was then used to si-multaneously display the factor scores of the con-sumers (coded for cluster group membership) andthe food resources in the same multivariate space.In the resulting scatter plots, the proximity ofpoints (factor scores) for each taxon indicatesthe similarity of that consumer with respect toother consumer taxa and their food sources;proximity of food sources in the plot indicatessimilarity of their consumers. These associationswere then used to develop the trophic guilds re-ported here.
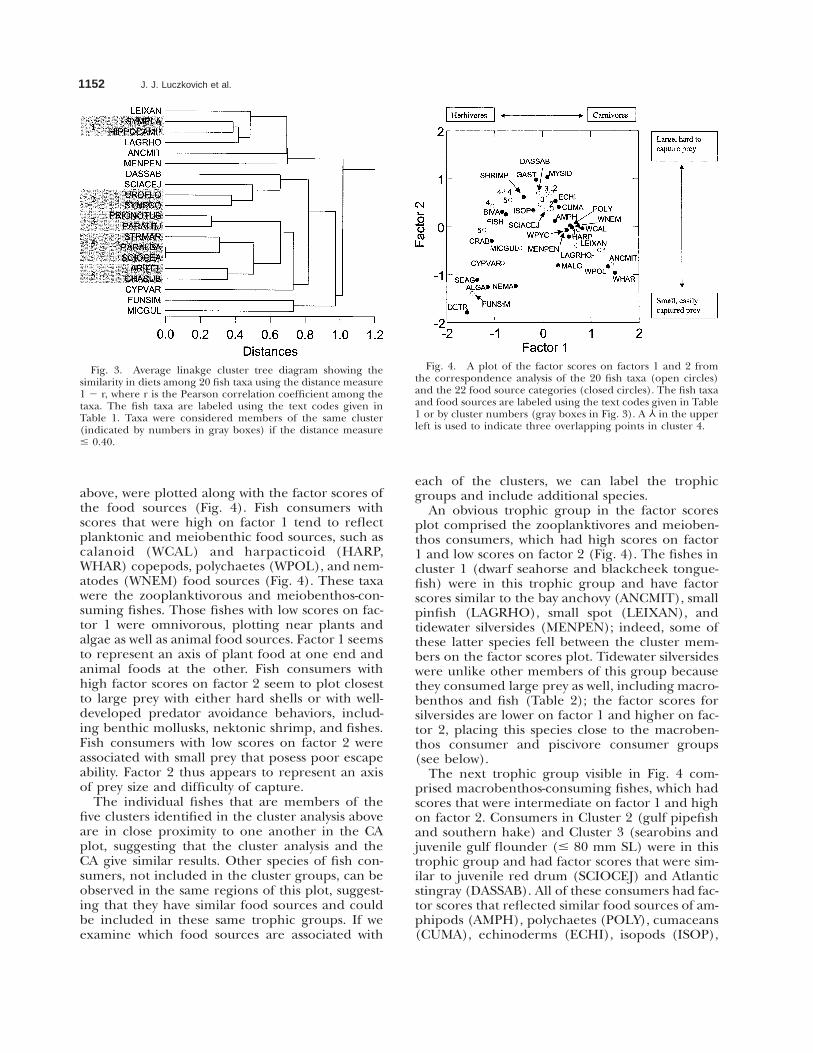
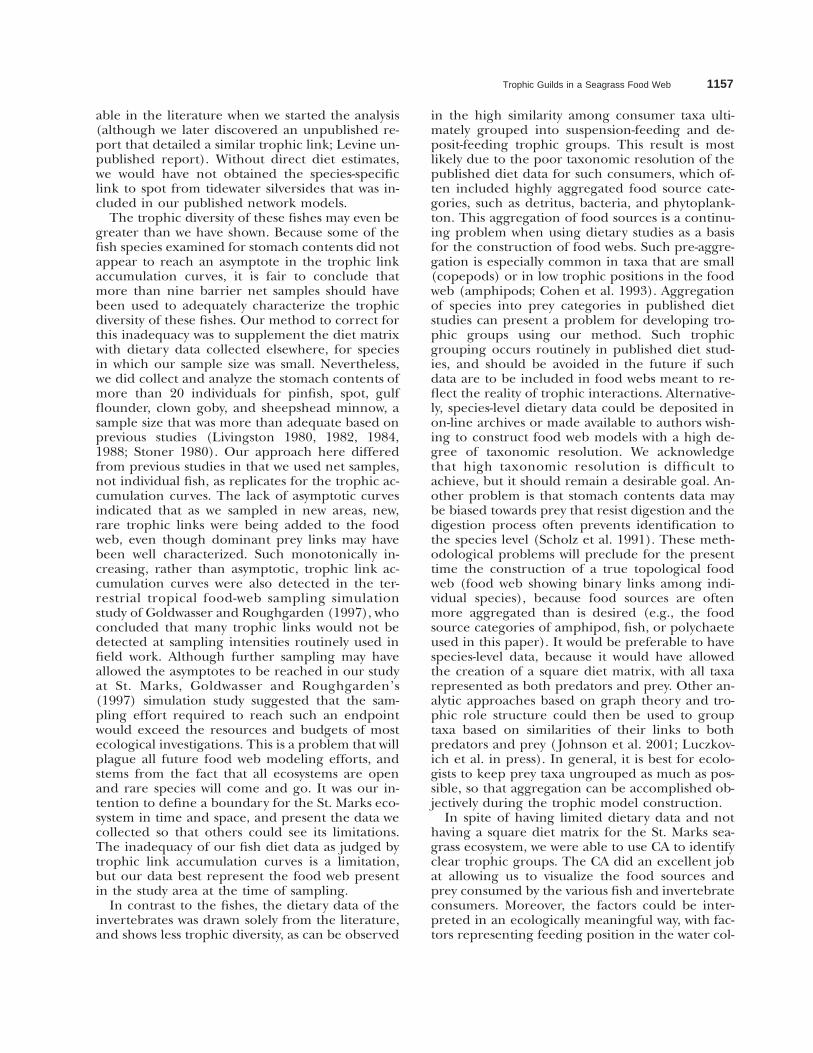
In order to demonstrate our method on a simpleexample, we chose a subset of the total food web,examining the 20 species of fishes and their 22food sources. There were five clusters of the fishspecies with distances # 0.40 (Fig. 3): Cluster 1comprised dwarf seahorse Hippocampus zosterae (HI-PZOS) and blackcheek tonguefish Symphurus pla-giusa (SYMPLA); Cluster 2 comprised gulf pipefishSyngnathus scovelli (SYGSCO) and southern hake U.floridana (UROFLO); Cluster 3 comprised searo-bins Prionotus sp. (PRIONOT) and gulf flounder P.albigutta # 80 mm SL (PARALBJ); Cluster 4 com-prised red drum Sciaenops ocellatus adults (SCI-OCEA), gulf flounder Paralichthys albigutta . 80mm SL (PARALBA), and Atlantic needlefish S. ma-rina (STRMAR); and Cluster 5 comprised Floridablenny Chasmodes saburrae (CHASAB) and hard-head catfish A. felis (ARIFEL). Although some ofthese cluster groupings were unexpected (e.g.,
Trophic Guilds in a Seagrass Food Web 1151
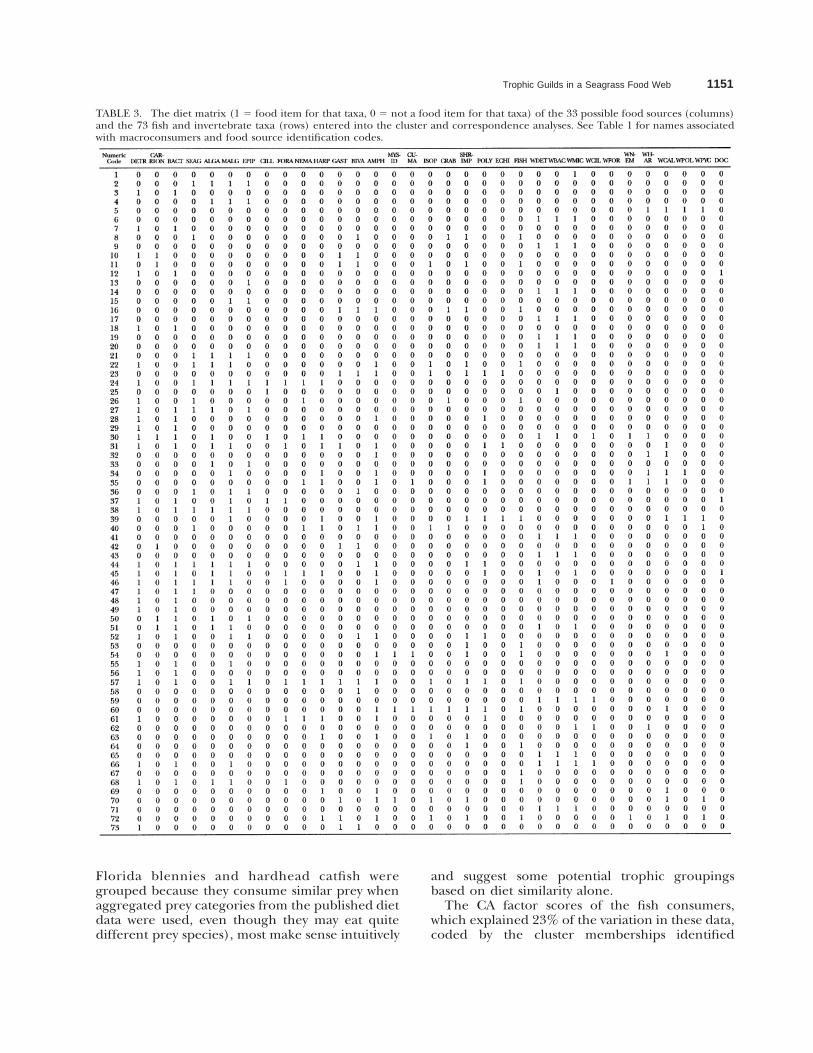
TABLE 3. The diet matrix (1 5 food item for that taxa, 0 5 not a food item for that taxa) of the 33 possible food sources (columns)and the 73 fish and invertebrate taxa (rows) entered into the cluster and correspondence analyses. See Table 1 for names associatedwith macroconsumers and food source identification codes.
Florida blennies and hardhead catfish weregrouped because they consume similar prey whenaggregated prey categories from the published dietdata were used, even though they may eat quitedifferent prey species), most make sense intuitively
and suggest some potential trophic groupingsbased on diet similarity alone.
The CA factor scores of the fish consumers,which explained 23% of the variation in these data,coded by the cluster memberships identified
1152 J. J. Luczkovich et al.
Fig. 3. Average linakge cluster tree diagram showing thesimilarity in diets among 20 fish taxa using the distance measure1 2 r, where r is the Pearson correlation coefficient among thetaxa. The fish taxa are labeled using the text codes given inTable 1. Taxa were considered members of the same cluster(indicated by numbers in gray boxes) if the distance measure# 0.40.
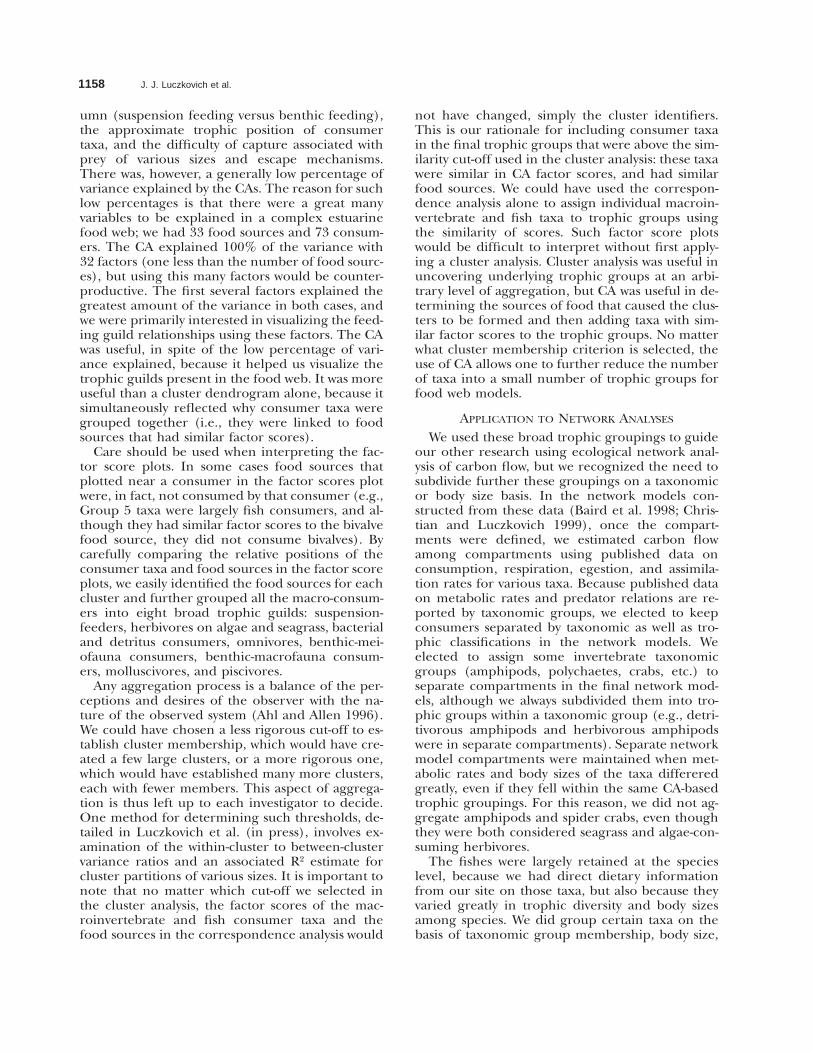
Fig. 4. A plot of the factor scores on factors 1 and 2 fromthe correspondence analysis of the 20 fish taxa (open circles)and the 22 food source categories (closed circles). The fish taxaand food sources are labeled using the text codes given in Table1 or by cluster numbers (gray boxes in Fig. 3). A
Y
in the upperleft is used to indicate three overlapping points in cluster 4.
above, were plotted along with the factor scores ofthe food sources (Fig. 4). Fish consumers withscores that were high on factor 1 tend to reflectplanktonic and meiobenthic food sources, such ascalanoid (WCAL) and harpacticoid (HARP,WHAR) copepods, polychaetes (WPOL), and nem-atodes (WNEM) food sources (Fig. 4). These taxawere the zooplanktivorous and meiobenthos-con-suming fishes. Those fishes with low scores on fac-tor 1 were omnivorous, plotting near plants andalgae as well as animal food sources. Factor 1 seemsto represent an axis of plant food at one end andanimal foods at the other. Fish consumers withhigh factor scores on factor 2 seem to plot closestto large prey with either hard shells or with well-developed predator avoidance behaviors, includ-ing benthic mollusks, nektonic shrimp, and fishes.Fish consumers with low scores on factor 2 wereassociated with small prey that posess poor escapeability. Factor 2 thus appears to represent an axisof prey size and difficulty of capture.
The individual fishes that are members of thefive clusters identified in the cluster analysis aboveare in close proximity to one another in the CAplot, suggesting that the cluster analysis and theCA give similar results. Other species of fish con-sumers, not included in the cluster groups, can beobserved in the same regions of this plot, suggest-ing that they have similar food sources and couldbe included in these same trophic groups. If weexamine which food sources are associated with
each of the clusters, we can label the trophicgroups and include additional species.
An obvious trophic group in the factor scoresplot comprised the zooplanktivores and meioben-thos consumers, which had high scores on factor1 and low scores on factor 2 (Fig. 4). The fishes incluster 1 (dwarf seahorse and blackcheek tongue-fish) were in this trophic group and have factorscores similar to the bay anchovy (ANCMIT), smallpinfish (LAGRHO), small spot (LEIXAN), andtidewater silversides (MENPEN); indeed, some ofthese latter species fell between the cluster mem-bers on the factor scores plot. Tidewater silversideswere unlike other members of this group becausethey consumed large prey as well, including macro-benthos and fish (Table 2); the factor scores forsilversides are lower on factor 1 and higher on fac-tor 2, placing this species close to the macroben-thos consumer and piscivore consumer groups(see below).
The next trophic group visible in Fig. 4 com-prised macrobenthos-consuming fishes, which hadscores that were intermediate on factor 1 and highon factor 2. Consumers in Cluster 2 (gulf pipefishand southern hake) and Cluster 3 (searobins andjuvenile gulf flounder (# 80 mm SL) were in thistrophic group and had factor scores that were sim-ilar to juvenile red drum (SCIOCEJ) and Atlanticstingray (DASSAB). All of these consumers had fac-tor scores that reflected similar food sources of am-phipods (AMPH), polychaetes (POLY), cumaceans(CUMA), echinoderms (ECHI), isopods (ISOP),
Trophic Guilds in a Seagrass Food Web 1153
Fig. 5. Average linkage cluster tree diagram showing simi-larity in diets among the 73 macroinvertebrate and fish taxa(numeric codes listed in Table 1) using 1 2 r as a distancemeasure. Taxa were considered members of the same cluster(as indicated by cluster number shown in the gray boxes) if thedistance measure # 0.40.
gastropods (GAST), and mysids (MYSID). The sim-ilar factor scores for fishes in clusters 2 and 3 sug-gest that all of these fishes could be grouped to-gether along with juvenile red drum as a macro-benthos-consuming trophic group, even thoughthey did not cluster together closely. The inclusionof gulf pipefish in this group may seem unusual,because they mostly consume zooplankton; how-ever, this group assignment reflected that gulfpipefish are reported to consumed gastropods, am-phipods, isopods, and mysids, as well as calanoidcopepods (Huh and Kitting 1985; Motta et al.1995).
A clear trophic group comprised the piscivoresin Cluster 4 (gulf flounder . 80 mm SL, Atlanticneedlefish, and adult red drum), which had factorsscores associated with the fish (FISH) food source.Some species in this piscivore trophic group alsoconsumed shrimp, placing them near the shrimp(SHRIMP) food source in the CA space. Fishes incluster 5 (Florida blenny and hardhead catfish)had factor scores that were not only near the fishand shrimp food sources, but were also associatedwith isopods (ISOP), mysids (MYSID), bivalves(BIVA), and gastropods (GAST) food sources, allof which they have been reported to consume(Reid 1954; Motta et al. 1995). Hardhead catfishwere lower on both factors 1 and 2 than the othersin this group, reflecting that they consumed fishes(juvenile spot was 23% of the diet) as well as ma-crobenthic prey such as crabs, polychaetes, shrimp,and even some seagrass (Table 2). It is convenientto group all fishes in Clusters 4 and 5 into a pis-civore trophic group, although members of Cluster4 did not consume any mollusks, whereas Cluster5 members consumed fish as well as mollusks andbenthic macroinvertebrates.
The remaining fishes were not grouped at a dis-tance of # 0.4 in the cluster analysis, includingsheepshead minnow (CY PVAR), clown goby (MIC-GUL), and longnose killifish (FUNSIM), whichwere grouped into an additional trophic group,based on their similar positions in the plot. Allthese fishes consumed plant or algae producers tosome degree (Table 2), and thus this trophicgroup is best characterized as omnivores. Long-nose killifish were the most herbivorous of all ofthese (Table 2), and had the lowest factor scoreson both factor 1 and factor 2. Food sources in thefactor scores plot confirm this omnivore trophicgrouping, as these fishes were associated with de-tritus (DETR), seagrass (SEAG), macroalgae(ALGA), diatoms and microalgae (MALG) as wellas crabs (CRAB) and nematodes (NEMA).
The various food sources associated with the fishconsumers and cluster analysis groups are easily vi-sualized using a CA factor scores plot. Using such
a plot, each fish consumer can be assigned to aunique trophic group, even those fishes that didnot exceed the arbitrary threshold we establishedin the cluster analysis.
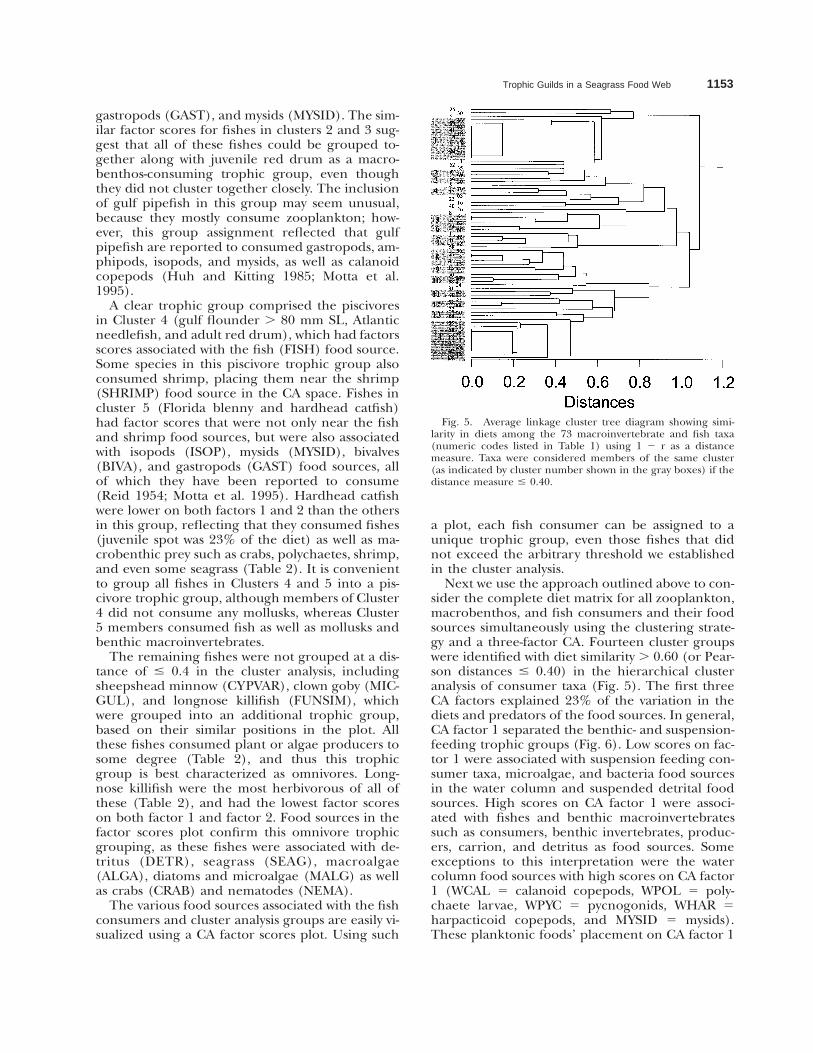
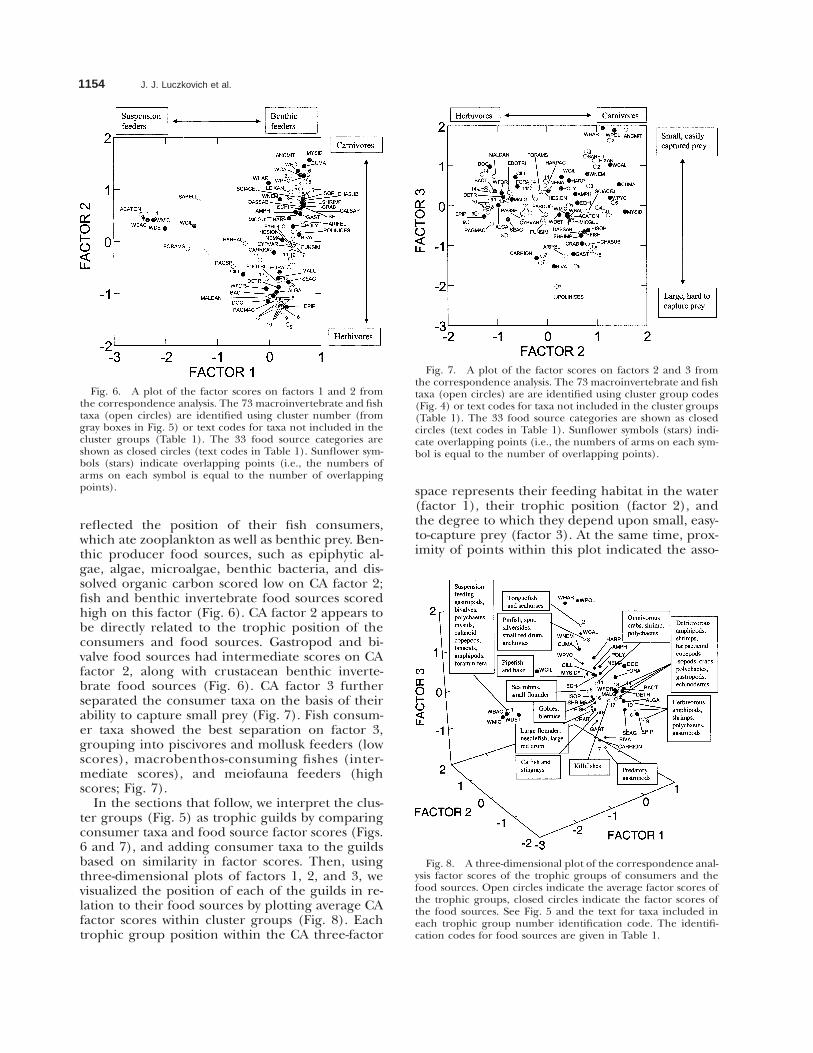
Next we use the approach outlined above to con-sider the complete diet matrix for all zooplankton,macrobenthos, and fish consumers and their foodsources simultaneously using the clustering strate-gy and a three-factor CA. Fourteen cluster groupswere identified with diet similarity . 0.60 (or Pear-son distances # 0.40) in the hierarchical clusteranalysis of consumer taxa (Fig. 5). The first threeCA factors explained 23% of the variation in thediets and predators of the food sources. In general,CA factor 1 separated the benthic- and suspension-feeding trophic groups (Fig. 6). Low scores on fac-tor 1 were associated with suspension feeding con-sumer taxa, microalgae, and bacteria food sourcesin the water column and suspended detrital foodsources. High scores on CA factor 1 were associ-ated with fishes and benthic macroinvertebratessuch as consumers, benthic invertebrates, produc-ers, carrion, and detritus as food sources. Someexceptions to this interpretation were the watercolumn food sources with high scores on CA factor1 (WCAL 5 calanoid copepods, WPOL 5 poly-chaete larvae, WPYC 5 pycnogonids, WHAR 5harpacticoid copepods, and MYSID 5 mysids).These planktonic foods’ placement on CA factor 1
1154 J. J. Luczkovich et al.
Fig. 6. A plot of the factor scores on factors 1 and 2 fromthe correspondence analysis. The 73 macroinvertebrate and fishtaxa (open circles) are identified using cluster number (fromgray boxes in Fig. 5) or text codes for taxa not included in thecluster groups (Table 1). The 33 food source categories areshown as closed circles (text codes in Table 1). Sunflower sym-bols (stars) indicate overlapping points (i.e., the numbers ofarms on each symbol is equal to the number of overlappingpoints).
Fig. 7. A plot of the factor scores on factors 2 and 3 fromthe correspondence analysis. The 73 macroinvertebrate and fishtaxa (open circles) are are identified using cluster group codes(Fig. 4) or text codes for taxa not included in the cluster groups(Table 1). The 33 food source categories are shown as closedcircles (text codes in Table 1). Sunflower symbols (stars) indi-cate overlapping points (i.e., the numbers of arms on each sym-bol is equal to the number of overlapping points).
Fig. 8. A three-dimensional plot of the correspondence anal-ysis factor scores of the trophic groups of consumers and thefood sources. Open circles indicate the average factor scores ofthe trophic groups, closed circles indicate the factor scores ofthe food sources. See Fig. 5 and the text for taxa included ineach trophic group number identification code. The identifi-cation codes for food sources are given in Table 1.
reflected the position of their fish consumers,which ate zooplankton as well as benthic prey. Ben-thic producer food sources, such as epiphytic al-gae, algae, microalgae, benthic bacteria, and dis-solved organic carbon scored low on CA factor 2;fish and benthic invertebrate food sources scoredhigh on this factor (Fig. 6). CA factor 2 appears tobe directly related to the trophic position of theconsumers and food sources. Gastropod and bi-valve food sources had intermediate scores on CAfactor 2, along with crustacean benthic inverte-brate food sources (Fig. 6). CA factor 3 furtherseparated the consumer taxa on the basis of theirability to capture small prey (Fig. 7). Fish consum-er taxa showed the best separation on factor 3,grouping into piscivores and mollusk feeders (lowscores), macrobenthos-consuming fishes (inter-mediate scores), and meiofauna feeders (highscores; Fig. 7).
In the sections that follow, we interpret the clus-ter groups (Fig. 5) as trophic guilds by comparingconsumer taxa and food source factor scores (Figs.6 and 7), and adding consumer taxa to the guildsbased on similarity in factor scores. Then, usingthree-dimensional plots of factors 1, 2, and 3, wevisualized the position of each of the guilds in re-lation to their food sources by plotting average CAfactor scores within cluster groups (Fig. 8). Eachtrophic group position within the CA three-factor
space represents their feeding habitat in the water(factor 1), their trophic position (factor 2), andthe degree to which they depend upon small, easy-to-capture prey (factor 3). At the same time, prox-imity of points within this plot indicated the asso-
Trophic Guilds in a Seagrass Food Web 1155
ciation of each trophic group and their food sourc-es. In the description of each trophic group thatfollows, we present these food source associationsand the taxa composing each trophic group.
The consumer taxa in Group 1 were all suspen-sion feeders. Group 1 was composed of spionid(66) and serpulid (65) polychaetes, mysids Mysi-dopsis sp. (41), amphipods Corophium sp. (19) andCerapus sp. (14), the tanaeid Hargeria rapax (71),copepod nauplii (43), polychaete larvae (59), thebay scallop Argopecten irradians (6), the musselBrachidontes exustus (9), the clam Chione cancellata(17), and the gastropod Crepidula fornacata (20)(Fig. 5). Members of this cluster had CA factorscores that were low on factor 1 and intermediateon factor 2 (Fig. 6), as did some other taxa notincluded in this cluster, including the copepodAcartia tonsa (ACATON), foraminifera (FORAMS),and polychaetes in the Sabellidae (SABELL). Allof these taxa were assigned to the suspension-feed-ing trophic group (Fig. 8), as these taxa had factorscores most similar to the food sources in the watercolumn, which included bacteria in the water col-umn (WBAC), phytoplankton (WMIC), and sus-pended detritus (WDET).
The next few trophic groups (2–6) were com-posed of fishes; these groups (Fig. 5) were similarto the ones discussed in the previous analysis (Fig.3). All of these groups have factor scores that areintermediate to high on factor 1 and high on fac-tor 2 (Fig. 6). Group 2 was a meiofauna-feedinggroup, consisting of the dwarf seahorse (32) andblackcheek tonguefish (69; Figs. 5 and 8). Group3 comprised pinfish (34) and tidewater silversides(39; Fig. 5); these fish were similar in that theyboth consumed zooplankton, meiobenthos, andmacrobenthos (Table 2). These small pinfish (,40 mm SL) had not yet begun to consume plantmaterials and algae, as has been reported for largepinfish (Luczkovich et al. 1995). Based on similarfactor scores, we also included spot (LEIXAN), bayanchovy (ANCMIT), and juvenile red drum (SCI-OCEJ) in this trophic group (Fig. 8). Group 4 wascomposed of gulf pipefish (70) and southern hake(72), which is another feeding group that takessmall animal prey (macrobenthos and zooplank-ton). Group 5 was a piscivore and shrimp-feedingcluster, consisting of gulf flounder . 80 mm SL(53), adult red drum (64), and Atlantic needlefish(67), all of which had factors scores that were sim-ilar to the shrimp and fish food sources on factors1 and 2 (Figs. 6 and 8). Group 6 consisted of gulfflounder # 80 mm SL (54) and searobins (60),both of which are shrimp and macroinvertebrateconsumers. Some fish taxa did not exceed the .0.60 Pearson coefficient threshold for inclusion inthe cluster groups, but nonetheless were assigned
to a trophic group for our network model. We as-signed the mollusk, fish, and crustacean consum-ing hardhead catfish, A. felis, and Atlantic stingray,Dasyatis sabina, to a new trophic group (Group 15)for network modeling, because they had a largebody size and intermediate scores along factors 2and 3 (Fig. 8). This placed them between the fish,decapod, isopod, gastropod, and bivalve foodsources in the factor scores plot (Figs. 6 and 7). Inaddition the Florida blenny (CHASAB) and theclown goby M. gulosus (MICGUL) were combinedinto a single trophic group (Group 16) based ontheir small body size (a network modeler will nor-mally include species with similar body size in atrophic grouping) and similar scores on factors 2and 3 (Fig. 8). The sheepshead minnow C. varie-gatus (CY PVAR) and longnose killifish (FUNSIM)clearly belonged to an omnivore killifish group(Group 17) based on their intermediate scores onfactor 2 (Fig. 8). These killifishes, which consumeda significant amount of algae (Table 2), plottedclose to the invertebrate herbivore and detritivoretrophic groups, with intermediate factor scores onfactors 2 and 3 (Fig. 7). Members of these fish tro-phic groups plotted in the upper right corner ofFig. 6, which indicated that they were carnivoresthat took benthic prey. When the CA scores forthese groups were plotted on factor 3 (Fig. 7), theyare arranged inversely with prey size. High factorscores were associated with small prey (meiofauna)consumers (Group 2 and 3), intermediate scoreswere associated with large prey (macrofauna) feed-ers (Group 4 and 6), and the low scores were as-sociated with piscivores (Group 5). When we plot-ted the average factor scores for these fish trophicgroups on all three factors, groups 2, 3, 4, 5, 6, 15,and 16 were all within the benthic carnivore regionof the multivariate space (high on factors 1 and 2),but were arranged inversely along a prey-size axis(factor 3), such that fishes taking the smallest preywere at the top of the plot (Fig. 8).
Another cluster defined a predator-scavenger in-vertebrate trophic group. Group 7 was composedof predatory gastropods Busycoptypus spiratus (10),Natica sp. (42), and Urosalpinx perrugata (73); thesetaxa had factor scores that were high on factor 1(i.e., benthic feeders) and intermediate on factor2 (i.e., omnivores), and reflected the factor scoresof the food sources bivalves (BIVA) and carrion(CARRION; Fig. 6). These taxa also had scores thatwere lowest on factor 3 (i.e., large, difficult to cap-ture prey), an axis that separated mollusks and car-rion-feeding gastropods from other taxa (Fig. 7).The gastropod Polinices sp. (POLINICES) had fac-tor scores that were similar to Group 7 consumertaxa and the bivalve (BIVA) food source; it wasplaced in the predatory gastropod trophic group.
1156 J. J. Luczkovich et al.
The consumers included in this trophic group hada very distinct position near the bivalve, carrion,and gastropod food sources when visualized withinCA three-factor space (Fig. 8).
A series of trophic groups (Groups 8, 9, and 10)were largely herbivorous (Fig. 8). Group 8 was agroup of epiphyte-grazing invertebrates, includingthe shrimp Alpheus normani (2), amphipods Ampi-thoe longimana (4) and Cymadusa compta (21), gas-tropod Cerithium lutosum (15), and the spider crabLibinia dubia (36; Fig. 5). These taxa had CA factorscores that were high on factor 1, low on factor 2,and that corresponded closely with the epiphyticalgae food source (EPIP) in the factor scores plot(Figs. 6 and 8). Group 9 is also an epiphyte-grazingtrophic group, consisting of the amphipod Caprellapenantis (13) and the shrimp H. zostericola (33; Fig.5). These taxa had factors scores that were loweston factor 2, corresponding to both to Group 8 taxaand to the EPIP food source (Figs. 6 and 8). Group10 consisted of amphipods Gammarus mucronatus(27) and Melita sp. (38; Fig. 5). These consumerswere epiphyte-grazing and detritus-feeding taxa,had factor scores high on factor 1 and low on fac-tor 2, and were associated with the scores of theepiphyte (EPIP), dissolved organic carbon (DOC),detritus (DETR), bacteria (BACT), and macroal-gae (ALGA) food sources (Figs. 6 and 8). Trophicgroups 8, 9, and 10 are all members of the herbiv-orous amphipod, shrimp, polychaetes, and gastro-pod trophic group (Fig. 8).
The invertebrates of Group 11 were plant andanimal consumers, so this was the omnivore tro-phic group (Fig. 8). Group 11 was composed ofthe polychaetes in the Nereidae (45) and theshrimp Processa bermudensis (61; Fig. 5). These taxawere predatory and detritivorous consumers, andhad factors scores that were high on factor 1 andintermediate on factor 2 (Fig. 6). These consumertaxa had factor scores that corresponded with thescores for the food sources carrion, detritus, andnematodes (NEMA; Fig. 6). Hermit crabs (PAGSPand PAGMAC) also had factor scores near theseconsumers, as well as detritus and algal food sourc-es, and were included in either the detritivore (Pa-gurus mclaughlini in Group 14) or omnivore (Pa-gurus sp. in Group 11) trophic group. The shrimpFarfantepenaeus duoarum (FARDUO) had highscores on factor 1 and intermediate scores on fac-tor 2 and 3, and so it was included in this omniv-orous trophic group.
A final series of trophic groups (Groups 12, 13,and 14) contained all detritivores to varying de-grees (Fig. 8). These detritivores, and in some cas-es consumers of benthic invertebrates, all had neg-ative scores on factor 2 (Fig. 6). Group 12 consist-ed of the shrimp Paleomon floridanus (44) and the
mud crab Neopanope sp. (52; Fig. 5). Group 13 con-tained brittle star Ophiderma brevispinum (46) andpolychaetes in the family Syllidae (68; Fig. 5). Thelargest cluster was Group 14, which contained theamphipod Ampelisca sp. (3), ostracods (49), thegastropod Haminoea succinea (29), and variouspolychaetes in the families Paraonidae (7 and 55),Onuphidae (47), Orbiniidae (48), Cirratulidae(18), Capitellidae (12), Glyceridae (28), and Pec-tanariidae (56; Fig. 5). This is a deposit-feeding tro-phic group, because all of these taxa had factorscores that corresponded to the food sources dis-solved organic carbon (DOC), bacteria (BACT),macroalgae (ALGA), detritus (DETR), and epi-phytic algae (EPIP; Figs. 6 and 8). Polychaetes inthe families Maldanidae (MALDAN) and Hesioni-dae (HESION) also were grouped with these de-posit feeders because they had factor scores nearthe DETR and BACT food sources (Fig. 6). Tro-phic groups 12, 13, and 14 were positioned closeto the detritus (DETR) and benthic bacteria(BACT) food sources and had factor scores highon factor 1 (benthic feeders) and in the interme-diate regions of factors 2 and 3, suggesting thatthat should be assigned to a benthic-detritivore tro-phic group (Fig. 8).
DiscussionThe methods we report here to identify trophic
guild structure illustrate that, even though therewas a wide diversity of fish and invertebrate con-sumer taxa in the seagrass meadows near the St.Marks National Wildlife Refuge, cluster analysisand CA could be used together to identify majortrophic guilds in the food web. Using these meth-ods, we established the final compartments in aseries of carbon exchange network models (Bairdet al. 1998; Christian and Luczkovich 1999). Theapproach outlined here should prove useful to fu-ture network modelers who want to visualize andcreate trophically similar compartments in theirmodels.
Fishes in this seagrass ecosystem showed thegreatest trophic diversity and exhibited the leastamount of similarity among the clusters and cor-respondence analyses of all consumers taxa exam-ined. This may be due to the fact that fish diets inthe published literature and in our study here arewell characterized. We sampled fish stomach con-tents directly at the study areas to obtain food weblinkages that were appropriate for the exact loca-tion and times being modeled. This allowed ourdiet matrix to reflect the food web configurationfor this ecosystem as accurately as possible. For ex-ample, we identified small spot (;20 mm SL) asprey of tidewater silversides, which is a result thatwas not expected based on diet information avail-
Trophic Guilds in a Seagrass Food Web 1157
able in the literature when we started the analysis(although we later discovered an unpublished re-port that detailed a similar trophic link; Levine un-published report). Without direct diet estimates,we would have not obtained the species-specificlink to spot from tidewater silversides that was in-cluded in our published network models.
The trophic diversity of these fishes may even begreater than we have shown. Because some of thefish species examined for stomach contents did notappear to reach an asymptote in the trophic linkaccumulation curves, it is fair to conclude thatmore than nine barrier net samples should havebeen used to adequately characterize the trophicdiversity of these fishes. Our method to correct forthis inadequacy was to supplement the diet matrixwith dietary data collected elsewhere, for speciesin which our sample size was small. Nevertheless,we did collect and analyze the stomach contents ofmore than 20 individuals for pinfish, spot, gulfflounder, clown goby, and sheepshead minnow, asample size that was more than adequate based onprevious studies (Livingston 1980, 1982, 1984,1988; Stoner 1980). Our approach here differedfrom previous studies in that we used net samples,not individual fish, as replicates for the trophic ac-cumulation curves. The lack of asymptotic curvesindicated that as we sampled in new areas, new,rare trophic links were being added to the foodweb, even though dominant prey links may havebeen well characterized. Such monotonically in-creasing, rather than asymptotic, trophic link ac-cumulation curves were also detected in the ter-restrial tropical food-web sampling simulationstudy of Goldwasser and Roughgarden (1997), whoconcluded that many trophic links would not bedetected at sampling intensities routinely used infield work. Although further sampling may haveallowed the asymptotes to be reached in our studyat St. Marks, Goldwasser and Roughgarden’s(1997) simulation study suggested that the sam-pling effort required to reach such an endpointwould exceed the resources and budgets of mostecological investigations. This is a problem that willplague all future food web modeling efforts, andstems from the fact that all ecosystems are openand rare species will come and go. It was our in-tention to define a boundary for the St. Marks eco-system in time and space, and present the data wecollected so that others could see its limitations.The inadequacy of our fish diet data as judged bytrophic link accumulation curves is a limitation,but our data best represent the food web presentin the study area at the time of sampling.
In contrast to the fishes, the dietary data of theinvertebrates was drawn solely from the literature,and shows less trophic diversity, as can be observed
in the high similarity among consumer taxa ulti-mately grouped into suspension-feeding and de-posit-feeding trophic groups. This result is mostlikely due to the poor taxonomic resolution of thepublished diet data for such consumers, which of-ten included highly aggregated food source cate-gories, such as detritus, bacteria, and phytoplank-ton. This aggregation of food sources is a continu-ing problem when using dietary studies as a basisfor the construction of food webs. Such pre-aggre-gation is especially common in taxa that are small(copepods) or in low trophic positions in the foodweb (amphipods; Cohen et al. 1993). Aggregationof species into prey categories in published dietstudies can present a problem for developing tro-phic groups using our method. Such trophicgrouping occurs routinely in published diet stud-ies, and should be avoided in the future if suchdata are to be included in food webs meant to re-flect the reality of trophic interactions. Alternative-ly, species-level dietary data could be deposited inon-line archives or made available to authors wish-ing to construct food web models with a high de-gree of taxonomic resolution. We acknowledgethat high taxonomic resolution is difficult toachieve, but it should remain a desirable goal. An-other problem is that stomach contents data maybe biased towards prey that resist digestion and thedigestion process often prevents identification tothe species level (Scholz et al. 1991). These meth-odological problems will preclude for the presenttime the construction of a true topological foodweb (food web showing binary links among indi-vidual species), because food sources are oftenmore aggregated than is desired (e.g., the foodsource categories of amphipod, fish, or polychaeteused in this paper). It would be preferable to havespecies-level data, because it would have allowedthe creation of a square diet matrix, with all taxarepresented as both predators and prey. Other an-alytic approaches based on graph theory and tro-phic role structure could then be used to grouptaxa based on similarities of their links to bothpredators and prey ( Johnson et al. 2001; Luczkov-ich et al. in press). In general, it is best for ecolo-gists to keep prey taxa ungrouped as much as pos-sible, so that aggregation can be accomplished ob-jectively during the trophic model construction.
In spite of having limited dietary data and nothaving a square diet matrix for the St. Marks sea-grass ecosystem, we were able to use CA to identifyclear trophic groups. The CA did an excellent jobat allowing us to visualize the food sources andprey consumed by the various fish and invertebrateconsumers. Moreover, the factors could be inter-preted in an ecologically meaningful way, with fac-tors representing feeding position in the water col-
1158 J. J. Luczkovich et al.
umn (suspension feeding versus benthic feeding),the approximate trophic position of consumertaxa, and the difficulty of capture associated withprey of various sizes and escape mechanisms.There was, however, a generally low percentage ofvariance explained by the CAs. The reason for suchlow percentages is that there were a great manyvariables to be explained in a complex estuarinefood web; we had 33 food sources and 73 consum-ers. The CA explained 100% of the variance with32 factors (one less than the number of food sourc-es), but using this many factors would be counter-productive. The first several factors explained thegreatest amount of the variance in both cases, andwe were primarily interested in visualizing the feed-ing guild relationships using these factors. The CAwas useful, in spite of the low percentage of vari-ance explained, because it helped us visualize thetrophic guilds present in the food web. It was moreuseful than a cluster dendrogram alone, because itsimultaneously reflected why consumer taxa weregrouped together (i.e., they were linked to foodsources that had similar factor scores).
Care should be used when interpreting the fac-tor score plots. In some cases food sources thatplotted near a consumer in the factor scores plotwere, in fact, not consumed by that consumer (e.g.,Group 5 taxa were largely fish consumers, and al-though they had similar factor scores to the bivalvefood source, they did not consume bivalves). Bycarefully comparing the relative positions of theconsumer taxa and food sources in the factor scoreplots, we easily identified the food sources for eachcluster and further grouped all the macro-consum-ers into eight broad trophic guilds: suspension-feeders, herbivores on algae and seagrass, bacterialand detritus consumers, omnivores, benthic-mei-ofauna consumers, benthic-macrofauna consum-ers, molluscivores, and piscivores.
Any aggregation process is a balance of the per-ceptions and desires of the observer with the na-ture of the observed system (Ahl and Allen 1996).We could have chosen a less rigorous cut-off to es-tablish cluster membership, which would have cre-ated a few large clusters, or a more rigorous one,which would have established many more clusters,each with fewer members. This aspect of aggrega-tion is thus left up to each investigator to decide.One method for determining such thresholds, de-tailed in Luczkovich et al. (in press), involves ex-amination of the within-cluster to between-clustervariance ratios and an associated R2 estimate forcluster partitions of various sizes. It is important tonote that no matter which cut-off we selected inthe cluster analysis, the factor scores of the mac-roinvertebrate and fish consumer taxa and thefood sources in the correspondence analysis would
not have changed, simply the cluster identifiers.This is our rationale for including consumer taxain the final trophic groups that were above the sim-ilarity cut-off used in the cluster analysis: these taxawere similar in CA factor scores, and had similarfood sources. We could have used the correspon-dence analysis alone to assign individual macroin-vertebrate and fish taxa to trophic groups usingthe similarity of scores. Such factor score plotswould be difficult to interpret without first apply-ing a cluster analysis. Cluster analysis was useful inuncovering underlying trophic groups at an arbi-trary level of aggregation, but CA was useful in de-termining the sources of food that caused the clus-ters to be formed and then adding taxa with sim-ilar factor scores to the trophic groups. No matterwhat cluster membership criterion is selected, theuse of CA allows one to further reduce the numberof taxa into a small number of trophic groups forfood web models.
APPLICATION TO NETWORK ANALYSES
We used these broad trophic groupings to guideour other research using ecological network anal-ysis of carbon flow, but we recognized the need tosubdivide further these groupings on a taxonomicor body size basis. In the network models con-structed from these data (Baird et al. 1998; Chris-tian and Luczkovich 1999), once the compart-ments were defined, we estimated carbon flowamong compartments using published data onconsumption, respiration, egestion, and assimila-tion rates for various taxa. Because published dataon metabolic rates and predator relations are re-ported by taxonomic groups, we elected to keepconsumers separated by taxonomic as well as tro-phic classifications in the network models. Weelected to assign some invertebrate taxonomicgroups (amphipods, polychaetes, crabs, etc.) toseparate compartments in the final network mod-els, although we always subdivided them into tro-phic groups within a taxonomic group (e.g., detri-tivorous amphipods and herbivorous amphipodswere in separate compartments). Separate networkmodel compartments were maintained when met-abolic rates and body sizes of the taxa differeredgreatly, even if they fell within the same CA-basedtrophic groupings. For this reason, we did not ag-gregate amphipods and spider crabs, even thoughthey were both considered seagrass and algae-con-suming herbivores.
The fishes were largely retained at the specieslevel, because we had direct dietary informationfrom our site on those taxa, but also because theyvaried greatly in trophic diversity and body sizesamong species. We did group certain taxa on thebasis of taxonomic group membership, body size,
Trophic Guilds in a Seagrass Food Web 1159
and trophic guilds identified in the current analy-sis: clown gobies and Florida blennies, hardheadcatfish and Atlantic stingrays, tidewater silversidesand bay anchovies, gulf pipefish and dwarf sea-horses. When appropriate, we kept ontogeneticstages within species separate (e.g., gulf flounderand red drum). In network models, flounder $ 80mm SL were grouped with Atlantic needlefish,based largely on the diet information from theanalyses reported here. For similar reasons, weplaced adult and juveniles stages of red drum inseparate consumer taxa here and in separate com-partments in the network models, based on dietanalyses from the literature (Peters and McMichael1987). We did not collect enough individual reddrum to include dietary data from the St. Markssites without resorting to the literature.
This aggregation of fish and invertebrate con-sumer taxa into taxonomically subdivided trophicguilds reduced by approximately one half the num-ber of compartments being modeled from 73 taxato 42 compartments. With the inclusion of the birdconsumers, producers (H. wrightii, phytoplankton,benthic algae and diatoms, and epiphytic algae),and particulate and dissolved organic carbon (de-tritus), we settled on 51 compartments to be esti-mated for biomass in one network model (Bairdet al. 1998) and 48 compartments in the other(Christian and Luczkovich 1999).
In order to create reliable and quantitative foodweb models, ecologists need to be explicit aboutthe way such models are constructed (Cohen et al.1993). Our approach was to use a multivariate sta-tistical procedure to derive network model com-partments in an objective way. However, experi-enced scientists should review such classificationsprior to establishing trophic guilds for metabolism-based carbon flow network models. The approachwe present employs common multivariate toolsthat are available for network modelers in con-structing their models.
TROPHIC ORGANIZATION OF SEAGRASS ECOSYSTEMS
The macroconsumer taxa comprising theseguilds in the H. wrightii seagrass meadow includedvarious species of crustaceans (amphipods, cuma-ceans, tanaeids, shrimps, crabs), polychaetes, gas-tropods, bivalves, echinoderms, and fishes. Thesetrophic guilds encompass most of the commonaquatic consumer taxa encountered in seagrassecosystems, although we excluded from our tro-phic guild analysis microbes, meiofauna, macrofau-na with unknown diets, and birds (although thesegroups were all included in our network models).Subsets of these same macroinvertebrate and fishconsumer taxa have been grouped previouslybased on diet similarity (Livingston 1982, 1984; Le-
ber 1983), but never such a large set of taxa. Below,we contrast our findings with those presented pre-viously for seagrass ecosystems in the northeasternGulf of Mexico.
Based on eight years of multi-season trophicdata, Livingston (1982) used a hierarchical cluster-ing strategy to group 43 trophic units (or ontoge-netic stages) of the seagrass-associated fishes in Ap-alachee Bay. He identified three major trophicgroups: plankton-, harpacticoid-, and polychaete-consuming fishes (Group I); benthic omnivoresand carnivores (Group II); and crustacean feeders(Group III). We grouped the fishes at the St. MarksH. wrightii ecosystem into four trophic guilds (Fig.4): the benthic-meiofauna feeders (trophic group1 in our analysis of the subset of fish consumers),the benthic-macroinvertebrate consumers (trophicgroups 2 and 3), omnivorous fishes, and fish con-sumers (trophic groups 4 and 5). Our trophicgroup 1 included the zooplankton-feeding bay an-chovy and meiofauna-consuming stages of spot,pinfish, blackcheek tonguefish, and tidewater sil-versides. This group appears to correspond to Liv-ingston’s Group I, which included small stages ofpinfish (, 25 mm SL), spot, and bay anchovy (Liv-ingston 1982). Bay anchovies were the most dissim-ilar of the fishes in our trophic group 1, havingfactor scores similar to the zooplankton foodsources (WCAL) and plotting in the small prey sizeregion of the scatterplot (low on factor 2). Largestages of pinfish (. 26 mm SL) were included inLivingston’s Group II, but these stages of pinfishwere not collected in our samples. Early life stagesof pinfish collected in winter do not consume asmuch plant material as the older stages that occurin the summer (Stoner 1980; Luczkovich et al.1995). Our trophic group 1 and Livingston’sGroup I are similar in that they include species thatfeed on small prey, whether they are in the zoo-plankton or part of the benthic meiofauna. Ourtrophic groups 2 and 3 (benthic macroinvertebrateconsumers) included gulf pipefish, southern hake,searobins, and small gulf flounder. This group maybe analogous to Livingston’s crustacean feeders(Group III), which also included gulf pipefish. Ourtrophic group 4 (the piscivores) included gulfflounder, Atlantic needlefish, and large red drum.There was no piscivore group in Livingston’s anal-yses, although he did report collecting southernflounder (Paralichthys lethostigma), he did not ex-amine their diet. Our trophic group 5 includedhardhead catfish, which consumed seagrasses, ben-thic invertebrates, and fishes; these omnivores hadfactor scores that were similar to the picivores inour analysis. Livingston’s benthic omnivores andcarnivores (Group II) included hardhead catfish.Our omnivorous fish trophic group included long-
1160 J. J. Luczkovich et al.
nose killifish and sheepshead minnows, which werenot collected by Livingston (1982).
In general, our trophic groupings bear some re-semblence to those reported in Livingston (1982),but many of fish species do not occur in both anal-yses. Livingston’s groups were developed using di-etary data for an entire year, whereas ours wasbased solely on data obtained during the winter.Such seasonal differences may account for thevarying species and trophic groupings observed inboth studies.
Based on these trophic groupings and on a long-term database of fish, benthos, and zooplanktonabundances, Livingston (1984) presented a con-ceptual model of the seasonally varying trophicstructure of the Apalachee Bay seagrass ecosystemin the northeastern Gulf of Mexico. Although Liv-ingston (1984) did not use a statistical method todevelop trophic groupings for the invertebrates, hedid list detritus-consuming amphipods and poly-chaetes as being abundant in winter ( January andFebruary). Our analysis, which was developed forthat season, showed that the detritus-consumingamphipods and polychaetes were the dominanttrophic guild as well. This detritus-based pathwayof carbon flow from amphipods and polychaetesto higher trophic levels appears to be quantitativelyimportant during the winter (Baird et al. 1998;Christian and Luczkovich 1999), which confirmsLivingston’s (1984) conceptual model. Benthic al-gae-consumers (herbivorous gastropods, herbivo-rous crustaceans, omnivorous fishes, omnivorouscrabs, and detritivorous polychaetes) also form aprominent guild within the St. Marks seagrass eco-system during winter (Christian and Luczkovich1999). Their importance in the carbon flow is notas large as detritivores in the winter months, butmay be greater in the summer months, when directseagrass herbivory is a common occurrence (Leber1983; Greenway 1995). Although suspension-feed-ing copepods and zooplankton were included inLivingston’s model (1984) as an important foodsource for some fish species during winter, we didnot observe high carbon flow through this pathway(Christian and Luczkovich 1999). Bivalves and gas-tropods were not included in Livingston’s (1984)model, but our guild analysis and network modelsincluded such molluscan predators and prey; theyderived significant amounts of carbon from detri-tus and carrion.
Our quantitative network models and the tro-phic guilds reported here represent the most com-plete description of the food web interactions forproducers and consumers in a H. wrightii ecosys-tem, but is limited in scope to the winter months.Our models do not fully represent the food webinteractions described by Livingston (1984) for the
fishes in seagrass habitats during other seasons,and network models of the spring, summer, andautumn should be done in the future.
ConclusionsWe have addressed the common questions that
arise when developing a food web network model:Should aggregation of taxa be attempted or heldat the level of species; If aggregation is desired,what methods should be used to aggregate taxa;and How does one address the problem of aggre-gation of taxa already published in the literature?Although the choice of entities to use as nodes ina network model is left open to each investigator,for the foreseeable future, most models will usetrophic guilds as network nodes, particularly whenhigh taxonomic resolution within the web is notpossible. As dietary and physiological databases be-come more developed, network models with nodesat the level of species (or ontogenetic stage withinspecies) can be developed. The method we pre-sented for establishing trophic guilds used clusteranalysis of a rectangular diet matrix to group con-sumer taxa on the basis of diet similarity; followedby correspondence analysis to visualize the trophicgroups identified in the cluster analysis to obtaintrophic guilds. Such dual-mode ordination meth-ods are demanded because of the rectangular (un-equal number of rows and columns) matrix offeeding relations, which is caused by the pre-ag-gregation of prey taxa in most published dietarystudies. The degree to which taxa should begrouped in the guilds will depend on the goals ofthe investigators. Some users of network models(coastal, fishery, and wildlife managers) will desirespecies-specific output for higher consumers (reddrum and gulf flounder), requiring that those taxacan be kept ungrouped. Other taxa are less fre-quently the focus of such trophic models (poly-chaetes), and can be usefully assigned to trophicguilds by the methods described here.
The methods we used in modeling this food webincluded direct diet determination for highly var-iable taxa such as the commonly occurring fishes,literature-derived trophic links for less commonfishes and the benthic invertebrates, and a com-bination of cluster analysis and correspondenceanalysis for developing the trophic guild structure.We aggregated the community of interacting spe-cies using a descriptive statistical approach into amanageable number of trophically similar ecosys-tem compartments for modeling. Because the bi-nary diet matrix was established both from thepublished literature and direct sampling of diets,the resultant general, steady-state, multi-compart-ment carbon-flow models (Baird et al. 1998, Chris-tian and Luczkovich 1999) should be applicable to
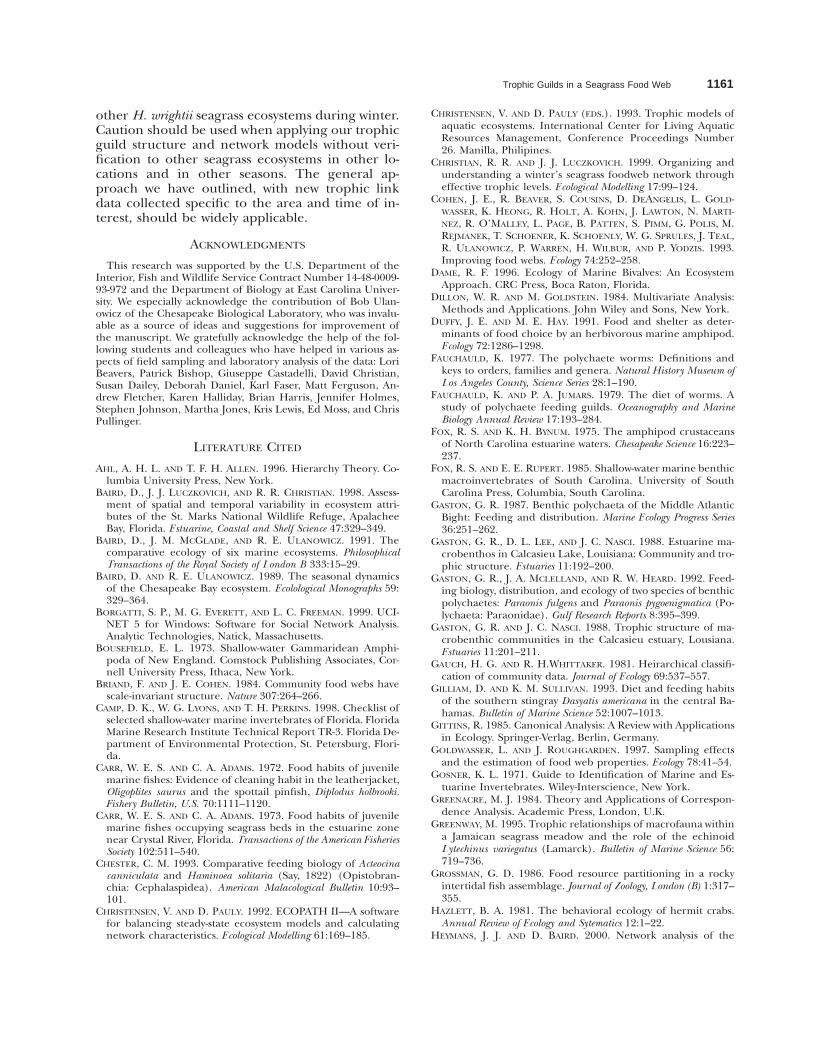
Trophic Guilds in a Seagrass Food Web 1161
other H. wrightii seagrass ecosystems during winter.Caution should be used when applying our trophicguild structure and network models without veri-fication to other seagrass ecosystems in other lo-cations and in other seasons. The general ap-proach we have outlined, with new trophic linkdata collected specific to the area and time of in-terest, should be widely applicable.
ACKNOWLEDGMENTS
This research was supported by the U.S. Department of theInterior, Fish and Wildlife Service Contract Number 14-48-0009-93-972 and the Department of Biology at East Carolina Univer-sity. We especially acknowledge the contribution of Bob Ulan-owicz of the Chesapeake Biological Laboratory, who was invalu-able as a source of ideas and suggestions for improvement ofthe manuscript. We gratefully acknowledge the help of the fol-lowing students and colleagues who have helped in various as-pects of field sampling and laboratory analysis of the data: LoriBeavers, Patrick Bishop, Giuseppe Castadelli, David Christian,Susan Dailey, Deborah Daniel, Karl Faser, Matt Ferguson, An-drew Fletcher, Karen Halliday, Brian Harris, Jennifer Holmes,Stephen Johnson, Martha Jones, Kris Lewis, Ed Moss, and ChrisPullinger.
LITERATURE CITED
AHL, A. H. L. AND T. F. H. ALLEN. 1996. Hierarchy Theory. Co-lumbia University Press, New York.
BAIRD, D., J. J. LUCZKOVICH, AND R. R. CHRISTIAN. 1998. Assess-ment of spatial and temporal variability in ecosystem attri-butes of the St. Marks National Wildlife Refuge, ApalacheeBay, Florida. Estuarine, Coastal and Shelf Science 47:329–349.
BAIRD, D., J. M. MCGLADE, AND R. E. ULANOWICZ. 1991. Thecomparative ecology of six marine ecosystems. PhilosophicalTransactions of the Royal Society of London B 333:15–29.
BAIRD, D. AND R. E. ULANOWICZ. 1989. The seasonal dynamicsof the Chesapeake Bay ecosystem. Ecolological Monographs 59:329–364.
BORGATTI, S. P., M. G. EVERETT, AND L. C. FREEMAN. 1999. UCI-NET 5 for Windows: Software for Social Network Analysis.Analytic Technologies, Natick, Massachusetts.
BOUSEFIELD, E. L. 1973. Shallow-water Gammaridean Amphi-poda of New England. Comstock Publishing Associates, Cor-nell University Press, Ithaca, New York.
BRIAND, F. AND J. E. COHEN. 1984. Community food webs havescale-invariant structure. Nature 307:264–266.
CAMP, D. K., W. G. LYONS, AND T. H. PERKINS. 1998. Checklist ofselected shallow-water marine invertebrates of Florida. FloridaMarine Research Institute Technical Report TR-3. Florida De-partment of Environmental Protection, St. Petersburg, Flori-da.
CARR, W. E. S. AND C. A. ADAMS. 1972. Food habits of juvenilemarine fishes: Evidence of cleaning habit in the leatherjacket,Oligoplites saurus and the spottail pinfish, Diplodus holbrooki.Fishery Bulletin, U.S. 70:1111–1120.
CARR, W. E. S. AND C. A. ADAMS. 1973. Food habits of juvenilemarine fishes occupying seagrass beds in the estuarine zonenear Crystal River, Florida. Transactions of the American FisheriesSociety 102:511–540.
CHESTER, C. M. 1993. Comparative feeding biology of Acteocinacanniculata and Haminoea solitaria (Say, 1822) (Opistobran-chia: Cephalaspidea). American Malacological Bulletin 10:93–101.
CHRISTENSEN, V. AND D. PAULY. 1992. ECOPATH II—A softwarefor balancing steady-state ecosystem models and calculatingnetwork characteristics. Ecological Modelling 61:169–185.
CHRISTENSEN, V. AND D. PAULY (EDS.). 1993. Trophic models ofaquatic ecosystems. International Center for Living AquaticResources Management, Conference Proceedings Number26. Manilla, Philipines.
CHRISTIAN, R. R. AND J. J. LUCZKOVICH. 1999. Organizing andunderstanding a winter’s seagrass foodweb network througheffective trophic levels. Ecological Modelling 17:99–124.
COHEN, J. E., R. BEAVER, S. COUSINS, D. DEANGELIS, L. GOLD-WASSER, K. HEONG, R. HOLT, A. KOHN, J. LAWTON, N. MARTI-NEZ, R. O’MALLEY, L. PAGE, B. PATTEN, S. PIMM, G. POLIS, M.REJMANEK, T. SCHOENER, K. SCHOENLY, W. G. SPRULES, J. TEAL,R. ULANOWICZ, P. WARREN, H. WILBUR, AND P. YODZIS. 1993.Improving food webs. Ecology 74:252–258.
DAME, R. F. 1996. Ecology of Marine Bivalves: An EcosystemApproach. CRC Press, Boca Raton, Florida.
DILLON, W. R. AND M. GOLDSTEIN. 1984. Multivariate Analysis:Methods and Applications. John Wiley and Sons, New York.
DUFFY, J. E. AND M. E. HAY. 1991. Food and shelter as deter-minants of food choice by an herbivorous marine amphipod.Ecology 72:1286–1298.
FAUCHAULD, K. 1977. The polychaete worms: Definitions andkeys to orders, families and genera. Natural History Museum ofLos Angeles County, Science Series 28:1–190.
FAUCHAULD, K. AND P. A. JUMARS. 1979. The diet of worms. Astudy of polychaete feeding guilds. Oceanography and MarineBiology Annual Review 17:193–284.
FOX, R. S. AND K. H. BYNUM. 1975. The amphipod crustaceansof North Carolina estuarine waters. Chesapeake Science 16:223–237.
FOX, R. S. AND E. E. RUPERT. 1985. Shallow-water marine benthicmacroinvertebrates of South Carolina. University of SouthCarolina Press, Columbia, South Carolina.
GASTON, G. R. 1987. Benthic polychaeta of the Middle AtlanticBight: Feeding and distribution. Marine Ecology Progress Series36:251–262.
GASTON, G. R., D. L. LEE, AND J. C. NASCI. 1988. Estuarine ma-crobenthos in Calcasieu Lake, Louisiana: Community and tro-phic structure. Estuaries 11:192–200.
GASTON, G. R., J. A. MCLELLAND, AND R. W. HEARD. 1992. Feed-ing biology, distribution, and ecology of two species of benthicpolychaetes: Paraonis fulgens and Paraonis pygoenigmatica (Po-lychaeta: Paraonidae). Gulf Research Reports 8:395–399.
GASTON, G. R. AND J. C. NASCI. 1988. Trophic structure of ma-crobenthic communities in the Calcasieu estuary, Lousiana.Estuaries 11:201–211.
GAUCH, H. G. AND R. H.WHITTAKER. 1981. Heirarchical classifi-cation of community data. Journal of Ecology 69:537–557.
GILLIAM, D. AND K. M. SULLIVAN. 1993. Diet and feeding habitsof the southern stingray Dasyatis americana in the central Ba-hamas. Bulletin of Marine Science 52:1007–1013.
GITTINS, R. 1985. Canonical Analysis: A Review with Applicationsin Ecology. Springer-Verlag, Berlin, Germany.
GOLDWASSER, L. AND J. ROUGHGARDEN. 1997. Sampling effectsand the estimation of food web properties. Ecology 78:41–54.
GOSNER, K. L. 1971. Guide to Identification of Marine and Es-tuarine Invertebrates. Wiley-Interscience, New York.
GREENACRE, M. J. 1984. Theory and Applications of Correspon-dence Analysis. Academic Press, London, U.K.
GREENWAY, M. 1995. Trophic relationships of macrofauna withina Jamaican seagrass meadow and the role of the echinoidLytechinus variegatus (Lamarck). Bulletin of Marine Science 56:719–736.
GROSSMAN, G. D. 1986. Food resource partitioning in a rockyintertidal fish assemblage. Journal of Zoology, London (B) 1:317–355.
HAZLETT, B. A. 1981. The behavioral ecology of hermit crabs.Annual Review of Ecology and Sytematics 12:1–22.
HEYMANS, J. J. AND D. BAIRD. 2000. Network analysis of the
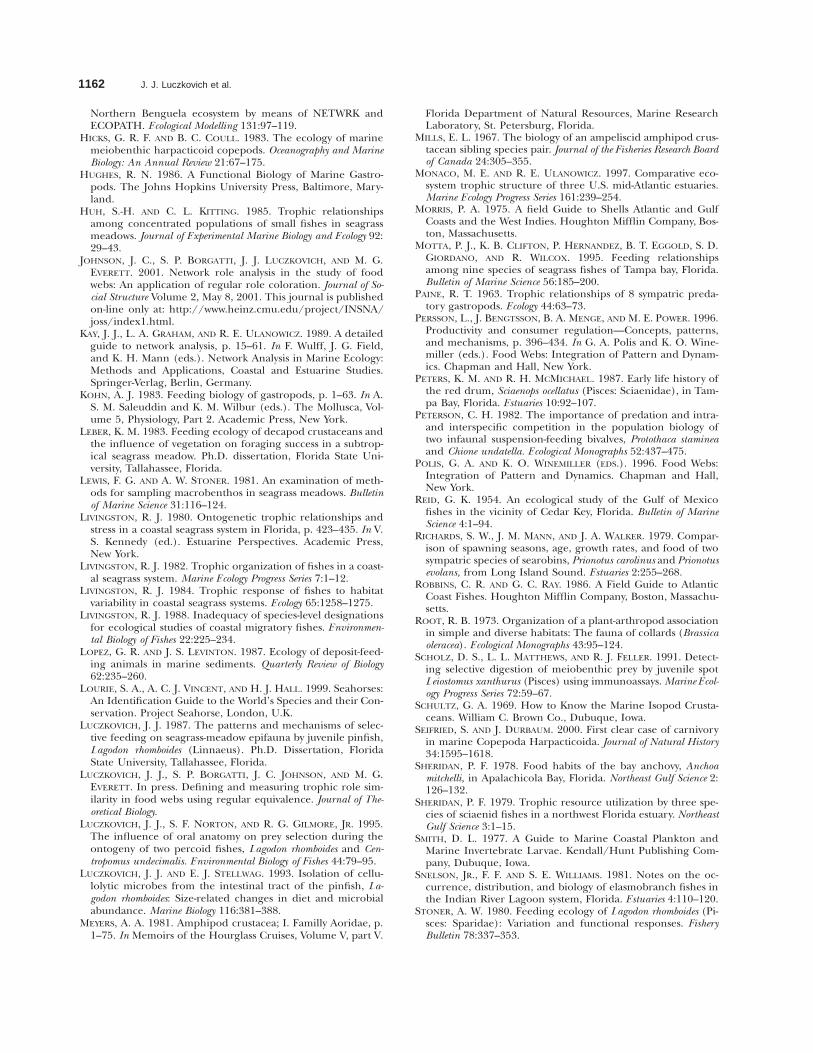
1162 J. J. Luczkovich et al.
Northern Benguela ecosystem by means of NETWRK andECOPATH. Ecological Modelling 131:97–119.
HICKS, G. R. F. AND B. C. COULL. 1983. The ecology of marinemeiobenthic harpacticoid copepods. Oceanography and MarineBiology: An Annual Review 21:67–175.
HUGHES, R. N. 1986. A Functional Biology of Marine Gastro-pods. The Johns Hopkins University Press, Baltimore, Mary-land.
HUH, S.-H. AND C. L. KITTING. 1985. Trophic relationshipsamong concentrated populations of small fishes in seagrassmeadows. Journal of Experimental Marine Biology and Ecology 92:29–43.
JOHNSON, J. C., S. P. BORGATTI, J. J. LUCZKOVICH, AND M. G.EVERETT. 2001. Network role analysis in the study of foodwebs: An application of regular role coloration. Journal of So-cial Structure Volume 2, May 8, 2001. This journal is publishedon-line only at: http://www.heinz.cmu.edu/project/INSNA/joss/index1.html.
KAY, J. J., L. A. GRAHAM, AND R. E. ULANOWICZ. 1989. A detailedguide to network analysis, p. 15–61. In F. Wulff, J. G. Field,and K. H. Mann (eds.). Network Analysis in Marine Ecology:Methods and Applications, Coastal and Estuarine Studies.Springer-Verlag, Berlin, Germany.
KOHN, A. J. 1983. Feeding biology of gastropods, p. 1–63. In A.S. M. Saleuddin and K. M. Wilbur (eds.). The Mollusca, Vol-ume 5, Physiology, Part 2. Academic Press, New York.
LEBER, K. M. 1983. Feeding ecology of decapod crustaceans andthe influence of vegetation on foraging success in a subtrop-ical seagrass meadow. Ph.D. dissertation, Florida State Uni-versity, Tallahassee, Florida.
LEWIS, F. G. AND A. W. STONER. 1981. An examination of meth-ods for sampling macrobenthos in seagrass meadows. Bulletinof Marine Science 31:116–124.
LIVINGSTON, R. J. 1980. Ontogenetic trophic relationships andstress in a coastal seagrass system in Florida, p. 423–435. In V.S. Kennedy (ed.). Estuarine Perspectives. Academic Press,New York.
LIVINGSTON, R. J. 1982. Trophic organization of fishes in a coast-al seagrass system. Marine Ecology Progress Series 7:1–12.
LIVINGSTON, R. J. 1984. Trophic response of fishes to habitatvariability in coastal seagrass systems. Ecology 65:1258–1275.
LIVINGSTON, R. J. 1988. Inadequacy of species-level designationsfor ecological studies of coastal migratory fishes. Environmen-tal Biology of Fishes 22:225–234.
LOPEZ, G. R. AND J. S. LEVINTON. 1987. Ecology of deposit-feed-ing animals in marine sediments. Quarterly Review of Biology62:235–260.
LOURIE, S. A., A. C. J. VINCENT, AND H. J. HALL. 1999. Seahorses:An Identification Guide to the World’s Species and their Con-servation. Project Seahorse, London, U.K.
LUCZKOVICH, J. J. 1987. The patterns and mechanisms of selec-tive feeding on seagrass-meadow epifauna by juvenile pinfish,Lagodon rhomboides (Linnaeus). Ph.D. Dissertation, FloridaState University, Tallahassee, Florida.
LUCZKOVICH, J. J., S. P. BORGATTI, J. C. JOHNSON, AND M. G.EVERETT. In press. Defining and measuring trophic role sim-ilarity in food webs using regular equivalence. Journal of The-oretical Biology.
LUCZKOVICH, J. J., S. F. NORTON, AND R. G. GILMORE, JR. 1995.The influence of oral anatomy on prey selection during theontogeny of two percoid fishes, Lagodon rhomboides and Cen-tropomus undecimalis. Environmental Biology of Fishes 44:79–95.
LUCZKOVICH, J. J. AND E. J. STELLWAG. 1993. Isolation of cellu-lolytic microbes from the intestinal tract of the pinfish, La-godon rhomboides: Size-related changes in diet and microbialabundance. Marine Biology 116:381–388.
MEYERS, A. A. 1981. Amphipod crustacea; I. Familly Aoridae, p.1–75. In Memoirs of the Hourglass Cruises, Volume V, part V.
Florida Department of Natural Resources, Marine ResearchLaboratory, St. Petersburg, Florida.
MILLS, E. L. 1967. The biology of an ampeliscid amphipod crus-tacean sibling species pair. Journal of the Fisheries Research Boardof Canada 24:305–355.
MONACO, M. E. AND R. E. ULANOWICZ. 1997. Comparative eco-system trophic structure of three U.S. mid-Atlantic estuaries.Marine Ecology Progress Series 161:239–254.
MORRIS, P. A. 1975. A field Guide to Shells Atlantic and GulfCoasts and the West Indies. Houghton Mifflin Company, Bos-ton, Massachusetts.
MOTTA, P. J., K. B. CLIFTON, P. HERNANDEZ, B. T. EGGOLD, S. D.GIORDANO, AND R. WILCOX. 1995. Feeding relationshipsamong nine species of seagrass fishes of Tampa bay, Florida.Bulletin of Marine Science 56:185–200.
PAINE, R. T. 1963. Trophic relationships of 8 sympatric preda-tory gastropods. Ecology 44:63–73.
PERSSON, L., J. BENGTSSON, B. A. MENGE, AND M. E. POWER. 1996.Productivity and consumer regulation—Concepts, patterns,and mechanisms, p. 396–434. In G. A. Polis and K. O. Wine-miller (eds.). Food Webs: Integration of Pattern and Dynam-ics. Chapman and Hall, New York.
PETERS, K. M. AND R. H. MCMICHAEL. 1987. Early life history ofthe red drum, Sciaenops ocellatus (Pisces: Sciaenidae), in Tam-pa Bay, Florida. Estuaries 10:92–107.
PETERSON, C. H. 1982. The importance of predation and intra-and interspecific competition in the population biology oftwo infaunal suspension-feeding bivalves, Protothaca stamineaand Chione undatella. Ecological Monographs 52:437–475.
POLIS, G. A. AND K. O. WINEMILLER (EDS.). 1996. Food Webs:Integration of Pattern and Dynamics. Chapman and Hall,New York.
REID, G. K. 1954. An ecological study of the Gulf of Mexicofishes in the vicinity of Cedar Key, Florida. Bulletin of MarineScience 4:1–94.
RICHARDS, S. W., J. M. MANN, AND J. A. WALKER. 1979. Compar-ison of spawning seasons, age, growth rates, and food of twosympatric species of searobins, Prionotus carolinus and Prionotusevolans, from Long Island Sound. Estuaries 2:255–268.
ROBBINS, C. R. AND G. C. RAY. 1986. A Field Guide to AtlanticCoast Fishes. Houghton Mifflin Company, Boston, Massachu-setts.
ROOT, R. B. 1973. Organization of a plant-arthropod associationin simple and diverse habitats: The fauna of collards (Brassicaoleracea). Ecological Monographs 43:95–124.
SCHOLZ, D. S., L. L. MATTHEWS, AND R. J. FELLER. 1991. Detect-ing selective digestion of meiobenthic prey by juvenile spotLeiostomus xanthurus (Pisces) using immunoassays. Marine Ecol-ogy Progress Series 72:59–67.
SCHULTZ, G. A. 1969. How to Know the Marine Isopod Crusta-ceans. William C. Brown Co., Dubuque, Iowa.
SEIFRIED, S. AND J. DURBAUM. 2000. First clear case of carnivoryin marine Copepoda Harpacticoida. Journal of Natural History34:1595–1618.
SHERIDAN, P. F. 1978. Food habits of the bay anchovy, Anchoamitchelli, in Apalachicola Bay, Florida. Northeast Gulf Science 2:126–132.
SHERIDAN, P. F. 1979. Trophic resource utilization by three spe-cies of sciaenid fishes in a northwest Florida estuary. NortheastGulf Science 3:1–15.
SMITH, D. L. 1977. A Guide to Marine Coastal Plankton andMarine Invertebrate Larvae. Kendall/Hunt Publishing Com-pany, Dubuque, Iowa.
SNELSON, JR., F. F. AND S. E. WILLIAMS. 1981. Notes on the oc-currence, distribution, and biology of elasmobranch fishes inthe Indian River Lagoon system, Florida. Estuaries 4:110–120.
STONER, A. W. 1980. Feeding ecology of Lagodon rhomboides (Pi-sces: Sparidae): Variation and functional responses. FisheryBulletin 78:337–353.
Trophic Guilds in a Seagrass Food Web 1163
THAYER, G. W., P. L. PARKER, M. W. LACROIX, AND B. FRY. 1978.The stable isotope ratio of the components of an eelgrass,Zostera marina, bed. Oecologia 35:1–12.
TOPP, R. W. AND F. H. HOFF, JR. 1972. Flatfishes (Pleuronecti-formes). Memoirs of the Hourglass Cruises Volume 4, Part II.Marine Research Laboratory, Florida Department of NaturalResources, St. Petersburg, Florida.
TURNER, J. T. 1984. Zooplankton feeding ecology: Contents offecal pellets of the copepods Acartia tonsa and Labidocera aes-tiva from continental shelf waters near the mouth of the Mis-sissippi River. PSZNI: Marine Ecology 5:265–282.
TURNER, J. T. AND J. C. ROFF. 1993. Trophic levels and tropho-species in marine plankton: Lessons from the microbial foodweb. Marine Microbial Food Webs 7:225–248.
UBELACKER, J. M. AND P. G. JOHNSON (EDS.). 1984. Taxonomicguide to the polychaetes of the Northern Gulf of Mexico.Final Report to the Minerals Managment Service, contract 14-12-001-29091. Barry A. Vittor and Associates, Inc., Mobile, Al-abama.
ULANOWICZ, R. E. 1987. NETWRK 4: A package of computeralgorithms to analyze ecological flow networks. University ofMaryland Chesapeake Biological Laboratory, Solomons,Maryland.
VENIER, J. M. 1997. Seasonal ecosystem models of the Looe KeyNMS, FL. Masters Thesis, University of British Columbia, Van-couver, Canada.
WILLIAMS, A. B. 1984. Shrimps, lobsters, and crabs of the Atlan-tic Coast of the Eastern United States, Maine to Florida.Smithsonian Institution Press, Washington, D.C.
YODZIS, P. 1989. Introduction to Theoretical Ecology. Harperand Row, New York.
YODZIS, P. 1996. Food webs and perturbation experiments: The-ory and practice, p. 192–200. In G. A. Polis and K. O. Wine-miller (eds.). Food Webs: Integration of Pattern and Dynam-ics. Chapman and Hall, New York.
YODZIS, P. AND K. O. WINEMILLER. 1999. In search of operationaltrophospecies in a tropical aquatic food web. Oikos 87:327–340.
ZIMMERMAN, R. 1978. The feeding habits and trophic positionof dominant gammaridean amphipods in a Caribbean sea-grass community. Ph.D. Dissertation, University of PuertoRico, Mayaguez.
ZIMMERMAN, R., R. GIBSON, AND J. HARRINGTON. 1979. Herbivoryand detritivory among gammaridean amphipods from a Flor-ida seagrass community. Marine Biology 54:41–47.
SOURCES OF UNPUBLISHED MATERIALS
KOENIG, C. Personal Communication. National Marine FisheriesService Laboratory, Panama City Laboratory, 3500 DelwoodBeach Road, Panama City, Florida 32408.
LEVINE, S. J. 1980. Gut contents of forty-four Lake Ponchartrain,Louisiana, fish species, p. 899–1030. In J. H. Stone (ed.). En-vironmental Analysis of Lake Ponchartrain, Louisiana, Its Sur-rounding Wetlands, and Selected Land Uses. Volume II. Cen-ter for Wetland Resources, Louisiana State University, BatonRouge, Louisiana.
Received for consideration, February 10, 2000Accepted for publication, May 21, 2002