Embed Size (px)
Citation preview

1
Determining the effects of novel
benzodiazepine compounds on the ileum of a rat and whether they are acting on
translocator protein (TSPO) to elicit smooth muscle tissue relaxation
by
Ethan Samuel Lowe
being a project submitted in partial fulfi lment of the requirements of the University of Hertfordshire for the degree of Bachelor of Science with Honours in Pharmaceutical Science
School of Life and Medical Sciences University of Hertfordshire Date: 02/04/2014

2
DECLARATION I declare that: (a) all the work described in this report has been carried out by me – and all
the results (including any survey findings, etc.) given herein were first obtained by me – except where I may have given due acknowledgement to others;
(b) all the prose in this report has been written by me in my own words,
except where I may have given due acknowledgement to others and used quotation marks, and except also for occasional brief phrases of no special significance which may be taken from other people’s work without such acknowledgement and use of quotation marks;
(c) all the figures and diagrams in this report have been devised and
produced by me, except where I may have given due acknowledgement to others.
I understand that if I have not complied with the above statements, I may be deemed to have failed the project assessment, and/or I may have some other penalty imposed upon me by the Board of Examiners. Signed …………………………… Date …………………………... Name …………………………… Programme code ……………

3
Acknowledgements
I would like to thank Dr. Christopher Benham for being so helpful as both my personal and project tutor for the past 3 years. I would also like to thank John Dolan for being an excellent lab manager for the duration of my project and additional thanks must go to the technical staff of 2G150, Komal, Tharan, Alex and Yugal you were all very accommodating. Further thanks must go to Mr. N Green who is the main reason why I’m studying science at this level and finally I would to thank my parents and Sarah Riley for being incredibly supportive of me throughout this extremely stressful year.

4
Contents: 2.0 Introduction............................................................................................................................ 6
2.1 Benzodiazepines ..................................................................................................................... 6
2.2 TSPO ...................................................................................................................................... 8
2.3 Rat Ileum .............................................................................................................................. 10
2.4 Aims and Objectives .............................................................................................................. 10
2.5 Compound structures............................................................................................................ 11
3.0 Materials and methods.......................................................................................................... 12
3.1 Rat sacrifice .......................................................................................................................... 12
3.2 Tissue preparation ................................................................................................................ 12
3.3 Drug/solvent preparation ...................................................................................................... 12
3.4 Tissue pre-contraction ........................................................................................................... 12
3.5 DMSO vehicle test ................................................................................................................. 13
3.6 Drug testing .......................................................................................................................... 14
3.7 PK11195 ............................................................................................................................... 16
4.0 Results ................................................................................................................................. 17
4.1 Drug Data (2 examples of individual drug analysis) .................................................................. 18
4.2 Comparison of halogen substituents ...................................................................................... 19
4.3 Comparison of ring substituent positioning............................................................................. 20
4.4 PK11195 Results.................................................................................................................... 21
5.0 Discussion............................................................................................................................. 22
6.0 Appendices ........................................................................................................................... 29
6.1 Appendix 1 – Risk Assessment forms ...................................................................................... 29
6.2 Appendix 2 – CoSHH forms .................................................................................................... 34
6.3 Appendix 3 - Carbachol data examples ................................................................................... 38
6.4 Appendix 4 - DMSO vehicle test data ..................................................................................... 39
6.5 Appendix 5 - Drug data .......................................................................................................... 42
6.5.1 MH2 .................................................................................................................................. 42
6.5.2 MH4 .................................................................................................................................. 44
6.5.3 MH5 .................................................................................................................................. 48
6.5.4 MH7 .................................................................................................................................. 52
6.5.5 MH8 .................................................................................................................................. 56
6.5.6 MH10 ................................................................................................................................ 60
6.6 Appendix 6 - PK11195 data .................................................................................................... 64

5
1.0 Abstract
Six novel benzodiazepine compounds (analogues of (E)-6-phenyl-7,14-
dihydrobenzo[6,7][1,5]diazocino[2,1-a]isoindol-12(7aH)-one) were analysed to determine whether
they were pharmacologically active and if active there relative efficacies and potencies were
evaluated. They were evaluated by their abilities to act as muscle relaxants and they were tested by
examining the extent they caused relaxation of rat ileum pre-contracted with carbachol. All the
compounds differed from of the original drug compound in the respect that they all had halogen
substituents added to one of the benzene rings present on the compound; structures of the
compounds are shown Figs. 1-6. The compounds were tested and the data analysed to try and
determine whether the ring position or the relative electronegativity of the halogens present caused
any change in the activity of the drugs; also further experiments were carried about to determine
whether the drugs were acting on TSPO, these experiment were carried out using PK11195 (a well -
known TSPO antagonist). It was found that all six compounds were pharmacologically active,
although they had varied effects, for example the compound MH4 caused an average peak % tissue
relaxation value of 24.06% and the compound MH5 produced a value of only 11.33%. It was
concluded that neither the ring position nor the electronegativity of the halogen substituents
effected drug activity and that the benzene ring altered is not involved in the binding of the drug
molecule to its receptor. Finally it was also concluded that the compounds were not eliciting their
relaxation effects as a result of binding to TSPO as the PK11195 binding to the TSPO did not reverse
the effects of the drug.

6
2.0 Introduction
2.1 Benzodiazepines
Benzodiazepines are a group of drugs that are extremely important in the world today, they have a
very wide range of actions which vary across the different benzodiazepine compounds and can also
be effected by altering dosage. Benzodiazepines can be used as sedatives, anxiolytics, hypnotics,
muscle relaxants, anti-convulsants, amnesiatics (mild memory-loss inducers), anti-depressants or
even as intoxicants. All benzodiazepine drugs will cause at least one of these effects, some
compounds such as diazepam (“Valium”) can stimulate a large range of biological effects depending
on the dose, on the patient and also what GABAA receptor subtype(s) they are acting on; research
shows that there are 19 kinds of GABAA receptor subtypes (Olsen and Sieghart, 2009). The
differences between these subtypes are the subunits; specifically the α subunits, the benzodiazepine
binding site is between α and γ subunits and it is the different types of α subunits that can affect the
drugs actions on the receptor e.g. receptors with an α1 subunit mediate the sedative effects and
receptors with α2 or α3 subunits will cause anxiolytic effects (Smith et al, 2012). Benzodiazepines
are also used psychologically (in the treatment of some mental disorders).
The basic chemical structure of benzodiazepines is relatively simple, the only pre-requisites are a
benzene ring that is bound to a diazepam ring, then the only differences between the different
benzodiazepine drugs are what is substituted on these two rings. The most common drug
compounds involve a 1, 4-diazepine ring (i.e. the two nitrogen atoms are in the 1 and 4 positions of
the 8-membered ring, relative the benzene ring) however some 1, 5-benzodiazepines are also used
and although their effects do vary slightly to that of the 1-4 compounds this structural difference is
not considered to be overly significant especially when compared to the effects of changing ring
substituents and other aspects of the drug structure.
The pharmacological effects of benzodiazepines were not discovered until 1955 when Leo
Sternbach, a chemist working at Hoffman-LaRoche accidentally came across the effects of one
benzodiazepine, chlordiazepoxide (Librium). Librium was then brought to market my Hoffman-
LaRoche in 1960 and was quickly accepted by the medical and scientific community,
benzodiazepines were a huge step forward in terms of sedative/hypnotic drugs. The main drugs of
this class of pharmacological agent before benzodiazepines were barbiturates (such as Barbital and
Phenylbarbitol) which were effective but carried heavy risks including substance
addiction/dependence and had numerous side-effects, such as respiratory depression (which lead to
respiratory failure in some cases) and even hallucinations as barbiturates are psychoactive

7
compounds. Benzodiazepines are, in general, more potent than barbiturates whereas barbiturates
have a higher efficacy i.e. are longer lasting. In the case of sedatives/hypnotics, potency is the more
desired quality because a patient wants the effects of hypnotic i.e. a drug that makes you fall asleep,
to act quite quickly and the problem with the long efficacy of barbiturates was that the effects of the
drug would continue after a person had woken from sleep causing them to feel very drows y or
groggy and effecting there physical and psychological functions. While benzodiazepines are
associated with some of these side-effects (including dependence issues) they are considered far
less severe than the effects of barbiturates; also benzodiazepines are classed as safer drugs as they
have relatively broad therapeutic window and if an overdose occurs the patient can be treated with
Flumazenil, whereas barbiturates have a narrow therapeutic window and there is no antidote for
overdoses.
A lot of information is known about the primary mechanism of action of benzodiazepines i.e. their
action on GABAA receptors in the brain, discovered in 1988 (Levitan, 1988). They bind to GABAA
receptors and cause positive allosteric modulations to the receptor to occur. These changes cause
GABA’s affinity for the receptor to increase which in turn increases the amount of times the receptor
is activated by GABA (Gamma aminobutyric acid). GABAA receptors are ionotropic ligand-gated ion
channels, namely they channel are chloride ions. GABA is the primary inhibitory neurotransmitter in
the brain and causes inhibition of action potentials being fired by neurons by binding to GABA
receptors, which will channel chloride ions into the pre-synaptic neuron, causing hyperpolarisation
of the cell and significantly lowering the chance that threshold will be reached and an action
potential will be fired; which is why benzodiazepines have inhibitory effects. They bind to GABA A
receptors at the benzodiazepine binding site and potentiate binding of GABA to the receptor causing
neuronal inhibition without having any direct inhibitory effects.
Benzodiazepines are historically important and still to this day, clinically relevant and yet there is still
a great deal of information that is not known about them. We know all about their actions on GABA A
receptors but there are some effects of benzodiazepines that have been observed both in vivo and
in vitro that cannot be explained by this mechanism of action (Haenisch, 2013). There are many
theories about these alternative benzodiazepine actions but the primary theory is that they are
acting on and having some kind of effect on translocator protein (TSPO) which was previously known
as the peripheral benzodiazepine receptor.

8
2.2 TSPO
Translocator protein (18kDa) AKA TSPO was discovered in 1977 (Braestrup, 1977) and named the
peripheral benzodiazepine receptor, it was given this name as it was discovered in renal tissue (a
peripheral tissue) and the first drug to act as a ligand to this receptor was diazepam (a
benzodiazepine). It was later renamed TSPO because it was found not to be specific to peripheral
tissues and its ligands are not exclusively benzodiazepines (Papadopoulos, 2006) . It is located
primarily on the outer membranes of mitochondria in peripheral tissues (accounting for 2% of the
outer mitochondrial membrane protein) and also in the central nervous system (CNS). The tissue
distribution of TSPO in the body is reasonably extensive, it can be found in many different tissues,
for example, heart, liver, adrenal and testis as well as in hemopoietic and lymphatic cells; there are
several suggested roles of TSPO in the body and I will briefly describe each them.
Firstly TSPO is thought to have an important role in the production of steroids (steroidogenesis). The
initial theory was that TSPO regulates and acts as a trigger for the transference of cholesterol from
the outer mitochondrial membrane (OMM) to the inner mitochondrial membrane (IMM). It is now
known that this role is fulfilled by steroidogenic acute regulatory protein (StAR), however TSPO is
key to this process, it may not regulate it but it is still heavily involved; TSPO forms a complex with
the 32 kDa voltage-dependent anion channel (VDAC) and the 30 kDa adenine nucleotide transporter
(ANT) (which are both also present on the OMM) and this complex is believed to transport
cholesterol from the OMM to the IMM (Papadopoulos & Miller, 2012). It is in the IMM that the
cholesterol side-chain cleavage enzyme (P450scc) is present, this enzyme catalyses the breaking
down of the cholesterol to pregnenolone which is the precursor used in the biosynthesis of all
steroid hormones in the body, such as, progestogens, androgens, mineralocorticoids, estrogens,
glucocorticoids and even neuroactive steroids (Mohareb, 2013).
TSPO is also heavily indicated in cell proliferation, several studies have been conducted whereby the
effects of specifically inhibiting TSPO on cell proliferation have been measured. A n antagonist of the
protein such as the isoquinoline carboxamide PK11195 was used to inhibit TSPO and cell
proliferation was recorded to have decreased (Kletsas et al, 2004), directly linking TSPO to cell
proliferation. While it is still unknown how the two are linked, it is theorised that TSPO helps to
transport mitochondrial pre-proteins into the mitochondria for maturation, which is an extremely
important stage in cell proliferation.

9
A third process in which TSPO is involved is apoptosis; this process is chiefly governed by the
mitochondrial permeability transition pore (MPTP). Under normal circumstances or, at least during
ideal homeostatic conditions the MPTP will open and close appropriately to allow for a consistent
transmembrane potential; however if the MPTP remains open for a prolonged period of time then
apoptopic factors such as small mitochondria-derived activator of caspases (Smac), apoptosis
inducing factor (AIF) and cytochrome c. TSPO not only forms part of the MPTP, it also assists in the
regulation and release of the apoptopic factors (Austin et al, 2013).
There are also many other processes in which TSPO is considered to have a role, such as, protein
import, porphyrin transport, heme Ion transport, immunomodulation, respiration and regulation of
mitochondrial metabolism (Papadopoulos, 2006). As a result of TSPO’s involvement in such large
amount of biological processes, more and more research is being done into the possible medical
applications of TSPO e.g. using it as a drug target in cancer treatments, using it as a biomarker in
neurodegenerative diseases etc. (Cagnin et al, 2007). Because of TSPO’s evident therapeutic
relevance it is of the upmost importance that more research be done into the activity of TSPO and
the biological effects that can be elicited by its ligands.
Some research has already been done into the structure activity relationship TSPO has with its
ligands, for example Fukaya and his colleagues looked into designing drugs with a high specificity for
TSPO whilst also aiming for high potency and high metabolic stability. Their research was aimed
towards designing new anxiolytic drugs; benzodiazepines are potent, fast acting anxiolytics but they
do cause side-effects which can, in some cases be quite severe. Fukaya’s theory was that the
anxiolytic effects of benzodiazepines are partially caused by their action on TSPO (as TSPO has a key
role in the regulation of neurosteroid production) but that the negative side effects are caused only
by the benzodiazepines acting on GABAA receptors. If this is true then a drug which is specific to
TSPO (and has no action on GABAA receptors) would make an effective anxiolytic without any side
effects, such as dependence, which are closely associated with benzodiazepines. They first
investigated the structure activity relationship between novel benzoxazolone derivatives and TSPO
(Fukaya et al, 2012) and then subsequently they looked into novel tricyclic benzimidazolone
derivatives as TSPO ligands (Fukaya et al, 2013). With this project I will attempt to investigate the
effects of novel benzodiazepines specifically on TSPO, as the experiments that will conducted wi ll all
be performed on rat ileum, this tissue has no GABAA receptors and so the benzodiazepine’s effects
will not be linked in any way with their traditional mechanism of action.

10
2.3 Rat Ileum
Over the course of this project I will be using rat ileum, the justification being that it is proven that
when this type of tissue is exposed to benzodiazepines muscle relaxation occurs (Koga, 1992). There
is also a huge amount of compounds that can elicit muscle contraction of this tissue (Ohama et al,
2007; Hullihan et al, 1983) which is important because the experiments involved all involve pre-
contraction of the tissue i.e. relaxation cannot be measured unless there is contraction to begin
with. There is also evidence that TSPO is present in this type of tissue (Ostuni et al, 2009) which
obviously is essential.
2.4 Aims and Objectives
The main aims of this project are as follows, firstly I aim to investigate the muscle relaxant properties
of 6 novel benzodiazepines (all analogues of (E)-6-phenyl-7,14-dihydrobenzo[6,7][1,5]diazocino[2,1-
a]isoindol-12(7aH)-one), these compounds are untested and while it is likely they will elicit the same
kind of effects as other common benzodiazepines, it is unknown to what extent they will cause
muscle relaxation, they could also have unknown pharmacological effects. The second aim of the
project is to investigate whether altering the substituents of one of the benzene rings of the drugs
will significantly alter their potency and/or their efficacy; specifically by altering the halogen present
and altering what position that halogen is in on the ring. The final aim is to determine whether any
pharmacological effects caused by the drugs are as a direct result of the drugs action on TSPO and if
so via what kind of pharmacological mechanism.

11
2.5 Compound structures
Figure 4. MH7 structure
Figure 6. MH10 structure
Figure 3. MH5 structure
Figure 5. MH8 structure
Figure 2. MH4 structure Figure 1. MH2 structure
12
3.0 Materials and methods
3.1 Rat sacrifice
The rats were all raised in a sterile environment by the Home Office and then sacrificed via CO2
euthanasia i.e. their cages were pumped with CO2; this is considered to be the most effective and
humane procedure for rodent sacrifice (Dannenman et al 1997).
3.2 Tissue preparation
Tissue samples (approximately 1cm in length) were taken from the ileum, any excess fat was
removed and the tissue was rinsed with Kreb’s solution. The tissue was placed into a 15ml organ
bath filled with Kreb’s solution, one end of the tissue was then attached to the base of the bath and
the other end attached to a transduced directly above the bath. The transducer was then raised,
stretching the tissue, until a tension of 1g was recorded.
3.3 Drug/solvent preparation
Carbachol: A 10-2 M stock solution was prepared and the other solutions (ranging from 10-2M-10-6M)
were prepared from the stock solution by serial dilution.
MH Drugs: The drugs were found to be virtually insoluble in water at the concentrations we required
and so the solvent choice was revised and it was determined that DMSO would be used instead. The
solubility of the drugs was far better in DMSO solutions, but that being said the most concentrated
stock solution that could be made up was 10-2M or even 10-3M in some cases. The procedure for
preparing the drug solutions was to add the drug solid to the DMSO and then place the volumetric
flask into the sonicator bath until the drug was dissolved. This 10-2M (or in some cases 10-3M) stock
solution was then used to prepare the rest of the drug solutions (concentration range =
10-2M/10-3M-10-6M).
DMSO: The DMSO was already available in the lab in solution (100% DMSO stock solution)
3.4 Tissue pre-contraction
Carbachol was used to elicit the contraction of the ileum; first a cumulative dose assay for carbachol
was carried out with the following final bath concentration (FBC) range:

13
Table 1. Table of stock concentrations/volumes added/FBCs for carbachol cumulative dose response
assay
A graph was then plotted from the results of the carbachol dose response assay, a cumulative dose
response curve i.e. FBC of carbachol (M) against ileum response (g of tension increase). This graph
was then used to determine the EC50 dose value for carbachol and subsequently the EC80, this step
is important because for the MH drugs testing phase the ileum needed to be a constant and
consistent level of contraction and to achieve this a reasonably specific dose of carbachol w as
required. If the EC100 dose was used then the tissue would have a high level of tension but it would
then relax again by itself as all of the Ca+ ion stores in the tissue of the tissue would have been
released allowing for no more contraction and if the EC50 dose was used then the tissue would
maintain a constant level of contraction but not one that would be high enough to register a large
enough range of relaxation. Therefore the EC80 was the dose used to contract the tissue because
the response generated at this dose is much more consistent than the response at the EC100 and
much more significant than the response generated at the EC50 and this could only be obtained via a
cumulative dosage curve plot.
3.5 DMSO vehicle test
DMSO is known to cause smooth muscle tissue relaxation; obviously this is a problem because that
was also the predicted effect of our drug compounds. So a series of tests were carried out to
determine to what extent using DMSO as a solvent would affect the results of the drug testi ng.
The tests involved setting up the tissue, pre-contracting it and then dosing cumulatively with DMSO
across a range of FBCs to determine the maximum amount of DMSO that could be present in the
bath without severely affecting the results.
Concentration of
carbachol added (M)
Volume required (µl) Volume added (µl) FBC (M)
1 x 10⁻⁶ 150 150 1 x 10⁻⁸
1 x 10⁻⁶ 450 300 3 x 10⁻⁸
1 x 10⁻⁵ 150 105 1 x 10⁻⁷
1 x 10⁻⁵ 450 300 3 x 10⁻⁷
1 x 10⁻⁴ 150 105 1 x 10⁻⁶
1 x 10⁻⁴ 450 300 3 x 10⁻⁶
1 x 10⁻³ 150 105 1 x 10⁻⁵
1 x 10⁻³ 450 300 3 x 10⁻⁵
14
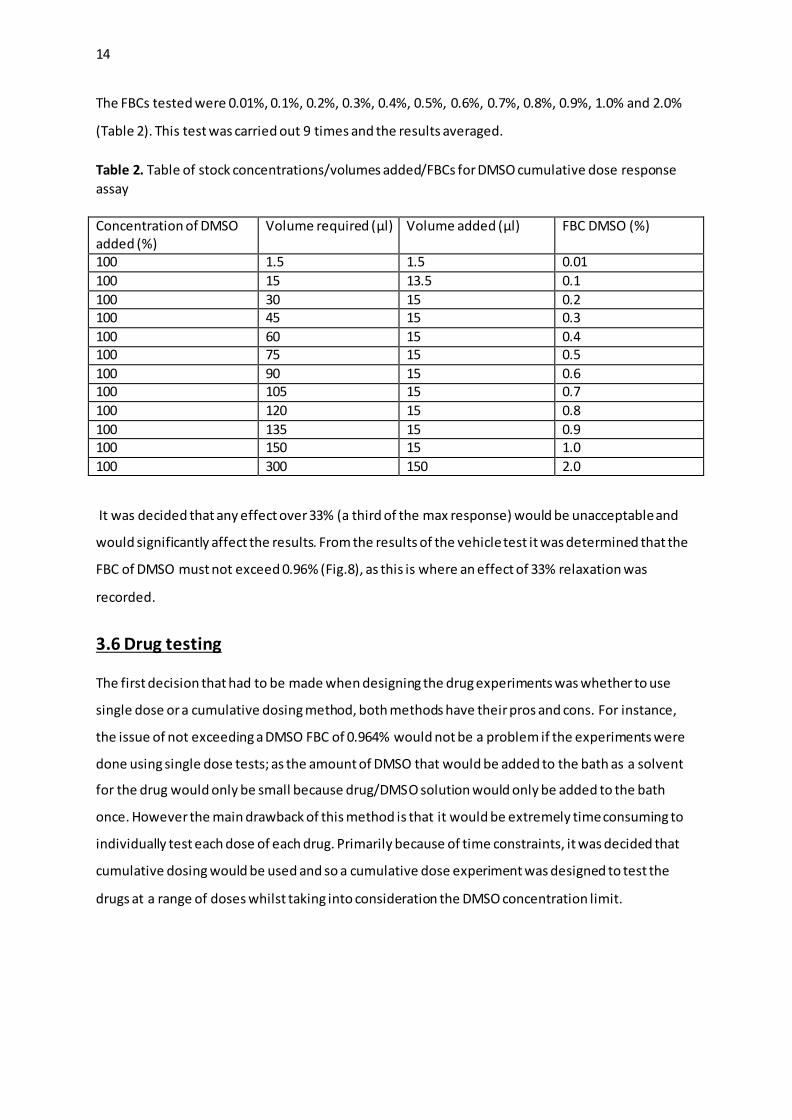
The FBCs tested were 0.01%, 0.1%, 0.2%, 0.3%, 0.4%, 0.5%, 0.6%, 0.7%, 0.8%, 0.9%, 1.0% and 2.0%
(Table 2). This test was carried out 9 times and the results averaged.
Table 2. Table of stock concentrations/volumes added/FBCs for DMSO cumulative dose response
assay
It was decided that any effect over 33% (a third of the max response) would be unacceptable and
would significantly affect the results. From the results of the vehicle test it was determined that the
FBC of DMSO must not exceed 0.96% (Fig.8), as this is where an effect of 33% relaxation was
recorded.
3.6 Drug testing
The first decision that had to be made when designing the drug experiments was whether to use
single dose or a cumulative dosing method, both methods have their pros and cons. For instance,
the issue of not exceeding a DMSO FBC of 0.964% would not be a problem if the experiments were
done using single dose tests; as the amount of DMSO that would be added to the bath as a solvent
for the drug would only be small because drug/DMSO solution would only be added to the bath
once. However the main drawback of this method is that it would be extremely time consuming to
individually test each dose of each drug. Primarily because of time constraints, it was decided that
cumulative dosing would be used and so a cumulative dose experiment was designed to test the
drugs at a range of doses whilst taking into consideration the DMSO concentration limit.
Concentration of DMSO added (%)
Volume required (µl) Volume added (µl) FBC DMSO (%)
100 1.5 1.5 0.01
100 15 13.5 0.1
100 30 15 0.2 100 45 15 0.3
100 60 15 0.4 100 75 15 0.5
100 90 15 0.6 100 105 15 0.7
100 120 15 0.8
100 135 15 0.9 100 150 15 1.0
100 300 150 2.0
15
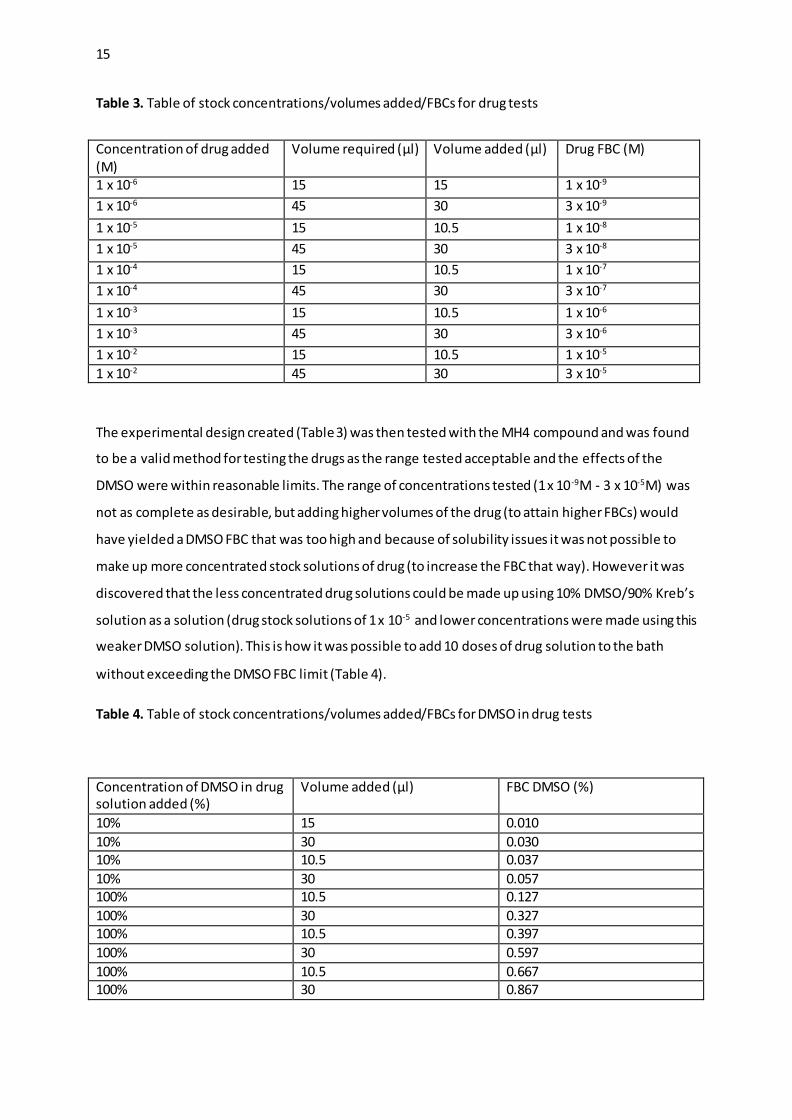
Table 3. Table of stock concentrations/volumes added/FBCs for drug tests
The experimental design created (Table 3) was then tested with the MH4 compound and was found
to be a valid method for testing the drugs as the range tested acceptable and the effects of the
DMSO were within reasonable limits. The range of concentrations tested (1 x 10⁻⁹M - 3 x 10⁻⁵M) was
not as complete as desirable, but adding higher volumes of the drug (to attain higher FBCs) would
have yielded a DMSO FBC that was too high and because of solubility issues it was not possible to
make up more concentrated stock solutions of drug (to increase the FBC that way). However it was
discovered that the less concentrated drug solutions could be made up using 10% DMSO/90% Kreb’s
solution as a solution (drug stock solutions of 1 x 10⁻⁵ and lower concentrations were made using this
weaker DMSO solution). This is how it was possible to add 10 doses of drug solution to the bath
without exceeding the DMSO FBC limit (Table 4).
Table 4. Table of stock concentrations/volumes added/FBCs for DMSO in drug tests
Concentration of drug added (M)
Volume required (µl) Volume added (µl) Drug FBC (M)
1 x 10⁻⁶ 15 15 1 x 10⁻⁹
1 x 10⁻⁶ 45 30 3 x 10⁻⁹
1 x 10⁻⁵ 15 10.5 1 x 10⁻⁸
1 x 10⁻⁵ 45 30 3 x 10⁻⁸
1 x 10⁻⁴ 15 10.5 1 x 10⁻⁷
1 x 10⁻⁴ 45 30 3 x 10⁻⁷
1 x 10⁻³ 15 10.5 1 x 10⁻⁶
1 x 10⁻³ 45 30 3 x 10⁻⁶
1 x 10⁻² 15 10.5 1 x 10⁻⁵
1 x 10⁻² 45 30 3 x 10⁻⁵
Concentration of DMSO in drug solution added (%)
Volume added (µl) FBC DMSO (%)
10% 15 0.010
10% 30 0.030 10% 10.5 0.037
10% 30 0.057 100% 10.5 0.127
100% 30 0.327 100% 10.5 0.397
100% 30 0.597
100% 10.5 0.667 100% 30 0.867
16
DMSO controls were carried out between each drug test on each tissue and the results from these
tests were used to adjust the data from the drug tests. Values for % relaxation were recorded for the
drug tests and then the same values were recorded for the DMSO control immediately after, the
DMSO values were then subtracted from the drug test values to give the values of % relaxation
caused by the drug specifically. These results were not always accurate as the ileum could
spontaneously be relaxed far more than average and therefore when these results were subtracted
from the drug test results the values obtained were either well below average or even negative; for
this reason the DMSO control data was then averaged (as an attempt to remove anomalous results)
and then subtracted from the drug test results.
Each one of the drugs were tested (using the experimental design above) 3 times, on two different
tissue samples (6 tests total), this data was then averaged to give the final results for each drug.
3.7 PK11195
PK11195 was used to determine whether the drugs were acting on TSPO, PK11195 is TSPO
antagonist with a very high affinity for TSPO. The theory behind this series of tests was that if the
drugs were binding to the TSPO and that was what was causing the muscle relaxant effects then if
PK11195 was added to the bath the effects would be reversed as the PK11195 displaced the drugs
from the TSPO.
This experiment was carried out by adding a large single dose of the MH4 compound (resulting in a
FBC of 3 x 10⁻⁶), then dosing the tissue with PK11195 (also resulting in a FBC of 3 x 10⁻⁶) and
recording whether the addition of the PK11195 to the bath altered the extent of muscle relaxat ion.
This test was carried out 2 times (time constraints did not allow for a third test) and the results
averaged.

17
4.0 Results
Figure 7. A graph to show carbachol FBC against % of maximum response, showing EC50 and EC80
values.
This graph is an example of how EC50/EC80 values were calculated for each of the tissues to
determine the correct dose for pre-contraction.
Figure 8. A graph to show % FBC of DMSO against average % relaxation of tissue, showing DMSO
concentration at 33% tissue relaxation.
This graph was plotted from the averaged data of 9 DMSO control tests and shows the DMSO FBC at
the point at where 33% relaxation of the tissue was occurring (0.96%). This was the FBC of DMSO
that it was decided could not be exceeded and hence the drug tests were designed around not
exceeding a FBC of DMSO higher than 0.96%.
EC50 = 1.5 x 10⁻⁷
EC80 = 4 x 10⁻⁶
0.96%
18
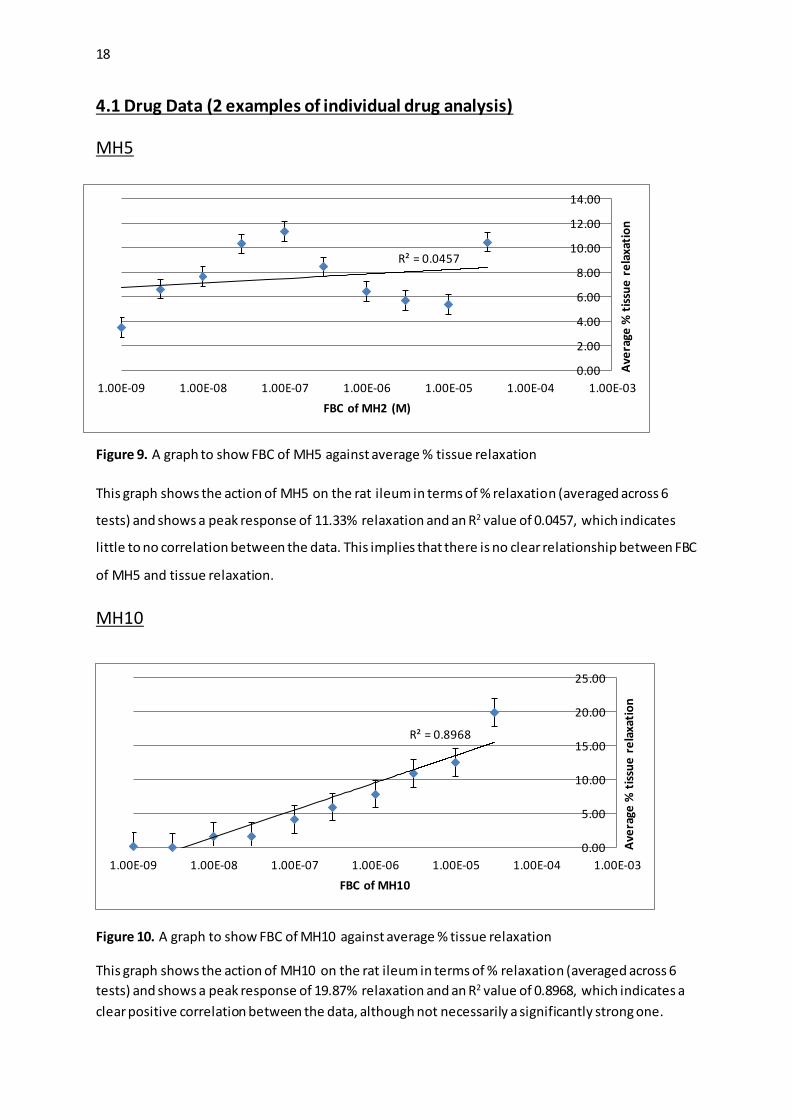
4.1 Drug Data (2 examples of individual drug analysis)
MH5
Figure 9. A graph to show FBC of MH5 against average % tissue relaxation
This graph shows the action of MH5 on the rat ileum in terms of % relaxation (averaged across 6
tests) and shows a peak response of 11.33% relaxation and an R2 value of 0.0457, which indicates
little to no correlation between the data. This implies that there is no clear relationship between FBC
of MH5 and tissue relaxation.
MH10
Figure 10. A graph to show FBC of MH10 against average % tissue relaxation
This graph shows the action of MH10 on the rat ileum in terms of % relaxation (averaged across 6
tests) and shows a peak response of 19.87% relaxation and an R2 value of 0.8968, which indicates a
clear positive correlation between the data, although not necessarily a significantly strong one.
R² = 0.0457
0.00
2.00
4.00
6.00
8.00
10.00
12.00
14.00
1.00E-09 1.00E-08 1.00E-07 1.00E-06 1.00E-05 1.00E-04 1.00E-03
Ave
rage
% t
issu
e r
ela
xati
on
FBC of MH2 (M)
R² = 0.8968
0.00
5.00
10.00
15.00
20.00
25.00
1.00E-09 1.00E-08 1.00E-07 1.00E-06 1.00E-05 1.00E-04 1.00E-03
Ave
rage
% t
issu
e r
ela
xati
on
FBC of MH10

19
4.2 Comparison of halogen substituents
Figure 11. A graph to compare the effects of different halogen substitutions on the average % tissue
relaxation caused by the 3 sets of MH compounds
Figure 12. A graph to compare the effects of different halogen substitutions on the average peak %
tissue relaxation caused by the 3 sets of MH compounds
These graphs (Figures 11&12) show that on average, the chloride substituted compounds MH2 and
MH4) caused a larger response in the ileum. However there is no significant correlation that could
be used to come to clear conclusion on what effect having a different halide substituents had on the
efficacy or potency of the MH compounds.
-5.00
0.00
5.00
10.00
15.00
20.00
25.00
1.00E-09 1.00E-08 1.00E-07 1.00E-06 1.00E-05 1.00E-04
Ave
rage
% t
issu
e re
laxa
tio
n
FBC of Drug (M)
Chloride
Bromide
Fluoride
0
5
10
15
20
25
Chloride Bromide Fluoride
Ave
rage
pe
ak %
tis
sue
re
laxa
tio
n
Halogen substituent
Chloride
Bromide
Fluoride

20
4.3 Comparison of ring substituent positioning
Figure 13. A graph to compare the effects that the difference in substituent positioning has on
average % tissue relaxation between the chloride substituted compounds (MH2 and MH4)
Figure 14. A graph to compare the effects that the difference in substituent positioning has on
average % tissue relaxation between the bromide substituted compounds (MH5 and MH7)
Figure 15. A graph to compare the effects that the difference in substituent positioning has on
average % tissue relaxation between the fluoride substituted compounds (MH8 and MH10)
-1.00
4.00
9.00
14.00
19.00
24.00
1.00E-09 1.00E-08 1.00E-07 1.00E-06 1.00E-05 1.00E-04 1.00E-03
Ave
rage
% t
issu
e r
ela
xati
on
FBC of Drug
MH8
MH10
-1.00
4.00
9.00
14.00
19.00
1.00E-09 1.00E-08 1.00E-07 1.00E-06 1.00E-05 1.00E-04 1.00E-03
Ave
rage
% t
issu
e r
ela
xati
on
FBC of Drug
MH5
MH7
0.00
5.00
10.00
15.00
20.00
25.00
30.00
1.00E-09 1.00E-08 1.00E-07 1.00E-06 1.00E-05 1.00E-04 1.00E-03
Ave
rage
% t
issu
e r
ela
xati
on
FBC of Drug
MH2
MH4

21
Figure 16. A graph to compare the effects of halide substitution positions by average % peak
response of individual MH drugs
Fig. 16 suggests that show that the compounds with their halogen substituent in the ortho position
(MH4,MH7 & MH10) have higher potencies than the compounds with their halogens in the para
positions (MH2,MH5 & MH8). However Figs. 13-15 show a direct comparison of across the entire
range of FBCs and these comparisons show very little correlation between ring positioning and the
efficacy/potency of the drug compounds.
4.4 PK11195 Results
Figure 17. A
graph to
compare the
effect of adding
PK11195 to the
bath on the rate
at which the
tissue relaxes as
a result of an
MH4 dose
Fig. 17 shows that the rate at which tissue relaxation occurs is reduced by post-treatment with PK11195 although not significantly as there is an overlap of the standard error bars.
0
5
10
15
20
25
30
MH2 MH4 MH5 MH7 MH8 MH10
Ave
rage
% p
eak
re
spo
nse
[Chloride] [Bromide] [Fluoride]
0.52
0.57
0.62
0.67
0.72
0.77
0.82
R
a
t
e
o
f
R
e
l
a
x
a
t
i
o
n
Before PK11195 After PK11195

22
5.0 Discussion
In the introduction I outlined the 3 specific aims of this project and I will address and discuss them
each individually below:
The first aim of this project was to identify if any of the of the analogues of (E)-6-phenyl-7,14-
dihydrobenzo[6,7][1,5]diazocino[2,1-a]isoindol-12(7aH)-one were active pharmacological agents.
The compound’s activity was evaluated via their abilities to cause smooth muscle tissue relaxation,
as this is how most benzodiazepines affect this type of tissue (Koga, 1992, Hullihan et al, 1983). All
the compounds tested elicited smooth muscle relaxation to some extent, indicating they are all
pharmacologically active compounds; there were however, significant differences in their relative
actions on the tissue. For example MH5 caused an average peak % response of 11.33% and MH10
caused an average peak % response of 19.87% (Figs. 9 & 10). These huge differences are most likely
due to the compound’s individual structure activity relationship with the binding site of the receptor
they were acting on (Nisius, 2012). Structure activity relationships between drugs and their
receptors are incredibly important when it comes to the efficacy and potency of drugs (also it is
important when trying to eliminate unwanted side-effects of drugs as looking at structure activity
relationships is a useful method when trying to increase the specificity of a drug compound).
This second aim of the project was to determine whether altering the substituents of one of the
benzene rings present on the compound would affect the drug’s activity; the two variables that were
tested were the halogen present on the ring (chlorine, bromine or fluorine) and the second was the
position of the halogen on the ring (meta or para). This was done by testing six different compounds;
two with each halide substituent present (each with the halogen atom in one of the two positions).
The comparison of the different halogen substituents was carried out by averaging the effects of the
two compounds with each of the halide groups present e.g. (MH2 effects + MH4 effects)/2 = average
chloride effects. The theory behind comparing the three halogens was that if electronegativity of
functional groups was a factor in the binding of these drugs to their receptor then that would be
shown in the results i.e. as the electronegativity of the groups increased from the relatively low
electronegativity of bromine to the high electronegativity of fluorine a clear increase/decrease
would be seen in drug activity. This may be the case if the receptor binding site is either strongly
nucleophilic or electrophilic; in that circumstance the effect electron withdrawing/electron donating
functional groups would be significant. Having an electron withdrawing functional group (such as a
halide group) present on the benzene ring would cause the ring to become more positive/less
negative, which would make it more susceptible nucleophil ic attack, so if the receptor binding sight

23
were highly nucleophilic it would it easier for the drug to bind to the receptor and it would bond
more strongly (increasing efficacy and potency by increasing the drug’s affinity and specificity for its
receptor). The second reason why varying the halide group present might affect drug activity is that
the halogen atoms are all different sizes (fluorine being the smallest and bromine the largest), this
may affect how the drug’s respective activities by, again affecting how the drugs bind to the
receptor. If the size of the atoms involved is a factor in drug receptor binding then it would be
expected that the presence of a relatively large atom such as bromine would have a negative effect
on activity as it may cause steric hindrance and make it less likely that the drug will bind to the
receptor.
After comparing the effects of the functional group differences using Figs. 11 & 12 it seems that
there is no direct relationship between which halogen is present and the activity of the novel
benzodiazepine compounds. Fig.11 shows that overall, the chloride substituted compounds (MH2
and MH4) caused strongest relaxation response in the tissue and that the bromide and fluoride
substituted compounds had relatively similar effects. This proves there is no relationship between
the electronegativity and/or atom size of single halogen substituents on that particular benzene ring
and overall average drug activity (efficacy). This is because the chloride substituted compounds
showed the highest responses and chlorine’s size and electronegativity are situated between the
values for bromine and fluorine; if there was a direct correlation then either bromine or fluorine
would elicit the highest amounts of relaxation. Fig.12 compares the peak average % responses for
the three different halide groups present; it shows that chloride substituted compounds had the
highest peak % response and that the bromide substituted compounds had the lowest. This proves
that there is no relationship between the electronegativity and/or atom size of single halogen
substituents on that particular benzene ring and peak average % response (potency) for a the same
reason that proved it had no effect on efficacy.
The reason (or reasons) why changing the halide substituent had no effect on the drugs activity (in
terms of potency and efficacy) must be related to the structure activity relationship between the
drugs and the receptor they were acting on, the primary theory is that the benzene ring used for this
series experiments has little or nothing to do with the binding process, which would explain wh y
making changes to it does not affect drug activity. Another theory is that perhaps both the size of
the halogen atoms and their electronegativities have an effect but there effects are opposite i.e. if
having a larger atoms cause greater levels of steric hindrance and the receptor binding site is
electrophilic (meaning that the lower the electronegativity of the compound, the higher its affinity
for the receptor) then the two effects would cancel themselves out e.g. bromine, the least

24
electronegative element also has the largest atoms and so if the desirable qualities of substituents
were small atoms with low electronegativity values, then bromine would be the best candidate but
simultaneously the worst; the relative benefits and costs of using a bromide substituent would
cancel each other. Whatever the reason it is clear that altering which halogen is present on the
benzene ring in question does not alter drug activity.
The comparison of the different halogen ring positions was carried out by directly comparing the
individual sets of compounds for each different halogen e.g. the chloride compounds (MH2 & MH4)
were compared. The theory behind this comparison was that if ring position had any effect on drug
activity then a significant and consistent difference would be seen between the meta and para
substituted compounds. The reason why it was thought that the relative ring positioning of the
halides may affect drug activity is that substituent positioning can often have large effects on drug
receptor binding; this is because changing the position of a functional group can increase the
availability of the group or other neighbouring groups and can also reduce the extent of steric
hindrance.
Figs. 13-15 show direct overall comparisons of the different ring substitutions (MH2, MH5 & MH8 =
para; MH4, MH7 & MH10 = meta), Fig. 13 shows that MH4 elicited significantly higher levels of
relaxation than MH2 but Figs. 14 & 15 indicates that there was virtually no difference between the
meta and para substituted compounds in either the bromide or the fluoride sets of compounds. This
indicates that there is no relationship between the positioning of single halogen substituents on that
particular benzene ring and overall drug activity (efficacy).
Fig. 16 is a comparison of the peak average % response for each of the drug compounds and shows a
clear correlation between ring position and drug activity; it shows that all the meta substitute d
compounds elicited higher peak responses than there para substituted counterparts. However, once
standard error is allowed for it is clear that only the chloride compounds have a significant
difference in peak response, which implies there is no relationship between the positioning of single
halogen substituents on that particular benzene ring and peak average % response (potency). This
further supports the conclusions from the previous set of experiments; that it is likely the benzene
ring which was altered on each compound has no role in the binding of the drug to the receptor it is
acting on, which is why none of the changes made to this ring had any direct effects on drug activity.
The third and final aim of this project was to determine whether or not the drug compounds were
acting on TSPO; this was achieved by pre-contracting a tissue, dosing with MH4 and then post-dosing
with PK11195, the theory being that if the PK11195 reversed the relaxation effects of the MH4 then

25
it will have displaced the MH4, proving it was bound to TSPO. Analysis of the data showed that the
PK11195 did nothing to reverse the effects of the MH4 but when analysed further it was revealed
that the rate at which the tissue was being relaxed decreased after the PK11195 dosing (Fig. 17).
Although only a relatively small decrease in rate it was believed that the slight impact of the
PK11195 on the drug’s action could still be an indication that the MH4 was acting on TSPO and that
the reason why the PK11195 did not have a significant effect on the action of the drug was because
of flaws in experimental design i.e. the PK11195 might not have been able to displace the MH4 from
the TSPO and that the contracted tissue should have been pre-dosed with PK11195 to give it a better
chance of binding. However, it is unlikely that PK11195 was unable to bind as it has been shown that
TSPO present in rats has a high affinity for PK11195 and a low affinity for benzodiazepines
(Parola et al, 1991) and when standard error was taken into account it appeared that the change in
rate caused by the PK11195 was not significant (Fig. 17). This lead to the conclusion that the change
in rate was most likely due to the fact that whatever receptors the MH4 was acting on were almost
all bound to the drug already decreasing the availability of receptors or and therefore the rate of
relaxation.
Therefore it can be said with a reasonable degree of certainty that the drugs were acting on
something else present in the tissue to elicit their relaxation effects. The main theory is that the drug
compounds had some kind of effect on calcium levels, either by reducing the influx of calcium or by
inhibiting the release of intracellular calcium stores; causing a decrease in the amount of calcium
available for the contractile machinery, therefore inhibiting contraction and causing relaxation
(Perez-Guerrero et al, 1997).
There were several limitations to the experiments conducted, the most significant being the
solubility of the compounds; it was impossible to dissolve any of the drug compounds to make
anything stronger than 10-2M solution. This ordinarily wouldn’t be an issue because higher volumes
of lower concentrated solutions could have been added to the bath to increase the FBC above 10 -5M
(the highest FBC tested), however the only solvent available that the compounds would dissolve in
was DMSO (which causes muscle relaxation). This meant that not only was there a cap on the
strength of stock solution available but there was also limitations on the volume of drug solution
that could be added to the bath as the solvent used would corrupt the data at higher concentrations.
This resulted in a only a narrow range of drug FBCs that could be tested; this was a severe limitation
as it has been shown that other benzodiazepines only begin to exhibit clear muscle relaxation effects
at FBCs around 10-3M (Hullihan et al, 1983). Because of this fact it is believed that only a fraction of
the drug compound’s possible action was witnessed. Another limitation was that only three of the

26
halogens were tested, if compounds with other halogens substituted (e.g. iodide substituents) had
been available clearer conclusions could have been made as a larger range of electronegativities
could have been tested; also it would of useful to test compounds that had been di -substituted.
In conclusion, it was discovered that all six compounds tested were active pharmacological agents
and that the addition of single halogen substituents to the benzene ring tested, present on the
benzodiazepine (E)-6-phenyl-7,14-dihydrobenzo[6,7][1,5]diazocino[2,1-a]isoindol-12(7aH)-one has
no direct effects on the drug’s action as a muscle relaxant in smooth muscle tissue, regardless of the
position of the substituent. It was also further proven that the drug’s action is not as a result of it
binding to TSPO.

27
References
Austin, C.J.D, et al (2013) ‘The translocator protein (TSPO): A novel target for cancer
chemotherapy’, The International Journal of Biochemistry & Cell Biology, 45(7), pp. 1212–1216.
Braestrup, C, et al. (1977) ‘High densities of benzodiazepine receptors in human cortical areas’,
Nature, 269, pp. 702–704.
Cagnin, A, et al (2007) ‘Positron emission tomography imaging of neuroinflammation’,
Neurotherapeutics, 4, pp. 443–452.
Dannenman, P. J et al (1997) ‘Humane and practical implications of using carbon dioxide mixed
with oxygen for anesthesia or euthanasia of rats’ Laboratory Animal Science, 47: 376-385.
Fukaya, T, et al (2012) ‘Design, synthesis and structure–activity relationships of novel
benzoxazolone derivatives as 18 kDa translocator protein (TSPO) ligands’, Bioorganic & Medicinal
Chemistry, 20(18), pp. 5568–5582.
Fukaya, T, et al (2013) ‘Design, synthesis and structure–activity relationship of novel tricyclic
benzimidazolone derivatives as potent 18 kDa translocator protein (TSPO) ligands’, Bioorganic &
Medicinal Chemistry, 21(5), pp. 1257–1267.
Haenisch, B, et al. (2013) ‘Investigation into mechanisms mediating the inhibitory effect of 1,4-
benzodiazepines on mast cells by gene expression profiling’, Life Sciences, 92(6–7), pp. 345-351.
Hullihan, J.P (1983) ‘The binding of [3H]-diazepam to guinea-pig ileal longitudinal muscle and the
in vitro inhibition of contraction by benzodiazepines’, British Journal of Pharmacology, 78, pp.
321-327.
Kletsas, D, et al (2004) ‘Peripheral-type benzodiazepine receptor (PBR) and PBR drug ligands in
fibroblast and fibrosarcoma cell proliferation: role of ERK, c-Jun and ligand-activated PBR-
independent pathways’, Biochemical Pharmacology, 67, pp. 1927-1932.
Levitan, E.S (1988) ‘Structural and functional basis for GABAA receptor heterogeneity’, Nature,
335(6185), pp. 76-79.
López-Muñoz, F, et al. (2011) ‘The discovery of chlordiazepoxide and the clinical introduction of
benzodiazepines: Half a century of anxiolytic drugs’, Journal of Anxiety Disorders, 25(4) May
2011, pp. 554-562.

28
Mohareb, M, et al (2013) ‘The Knoevenagel reactions of pregnenolone with cyanomethylene
reagents: Synthesis of thiophene, thieno[2,3-b]pyridine, thieno[3,2-d]isoxazole derivatives of
pregnenolone and their in vitro cytotoxicity towards tumor and normal cell lines’, Steroids,
78(12-13), pp. 1209.
Nisius, B et al (2012) ‘Structure-based computational analysis of protein binding sites for function
and druggability prediction’, Journal of Biotechnology, 159, pp. 123-134.
Ohama, T et al (2007) ‘Mechanism of abnormal intestinal motility in inflammatory bowel disease:
how smooth muscle contraction is reduced?’, Journal of Smooth Muscle Research, 43(2), pp. 43-
54.
Olsen, R.W and Sieghart, W, (2009) ‘GABAA receptors: Subtypes provide diversity of function and
pharmacology’, Neuropharmacology, 56, pp. 141-148.
Ostuni, M.A et al ‘Distribution, pharmacological characterization and function of the 18 kDa
translocator protein in rat small intestine’, Biology of the cell, 101(10), pp. 573-586.
Papadopoulos, V and Miller, W.L, 2012 ‘Role of mitochondria in steroidogenesis. Best practice &
research’, Journal of Clinical Endocrinology & Metabolism, 26, pp. 771–790.
Papadopoulos, V, et al. (2006) 'Translocator protein (18 kDa): new nomenclature for the
peripheral-type benzodiazepine receptor based on its structure and molecular function', Trends
in Pharmacological Sciences, 27(8), pp. 402-409.
Parola, AL et al (1991) ‘Cloning and expression of pharmacologically unique bovine peripheral-
type benzodiazepine receptor isoquinoline binding protein’, Journal of Biological Chemistry, 21,
pp. 14082-14087.
Perez-Guerrero, C et al (1997) ‘Spasmolytic effects of Tetrazepam on rat duodenum and guinea-
pig ileum’, Pharmacological Research, 35(5), pp. 493–497.
Smith, K.S et al (2012) ‘Benzodiazepine-induced anxiolysis and reduction of conditioned fear are
mediated by distinct GABAA receptor subtypes in mice’ , 63(2), pp. 250–258.
Yu, S and Ho, I.K (1990) ‘Effects of acute barbiturate administration, tolerance and dependence
on brain GABA system: Comparison to alcohol and benzodiazepines’, Alcohol, 7(3), pp. 261-272.

29
6.0 Appendices
6.1 Appendix 1 – Risk Assessment forms
ACTIVITY INFORMATION
Name of Assessor/ Contact details
Name: Ethan
Email address: [email protected]
Title of Activity
The effects of functional groups present on benzodiazepines on their efficacy and potency whist acting on Peripheral Benzodiazepine Receptors (Translocator protein 18 kDa) in the ileum of a rat.
Location of Activity
CP Snow, 2G150
Description of Activity
Testing the muscle relaxant properties of novel benzodiazepines on rat ileum (in vivo).
Personnel Involved
Myself, Chris Benham, technical staff and other students working in 2G150
TYPES OF HAZARD LIKELY TO BE ENCOUNTERED
Animal Allergens Biological Agents (see
COSHH) Chemical Compounds (see
CoSHH)
Compressed/liquefied gases Computers Electricity
Falling Objects Farm Machinery Fire
Glassware Handling
Hand Tools Ionising Radiation
Office Equipment Laboratory Equipment Ladders
Manual Handling Non-ionising Radiation Hot or cold extremes
Repetitive Handling Severe Weather
Sharps Slips/trips/falls
Stress Travel Vacuum systems
Pressure systems Vehicles Violence, physical
or verbal abuse Workshop
Machinery
Ref No:
Date:
Review Date:
30
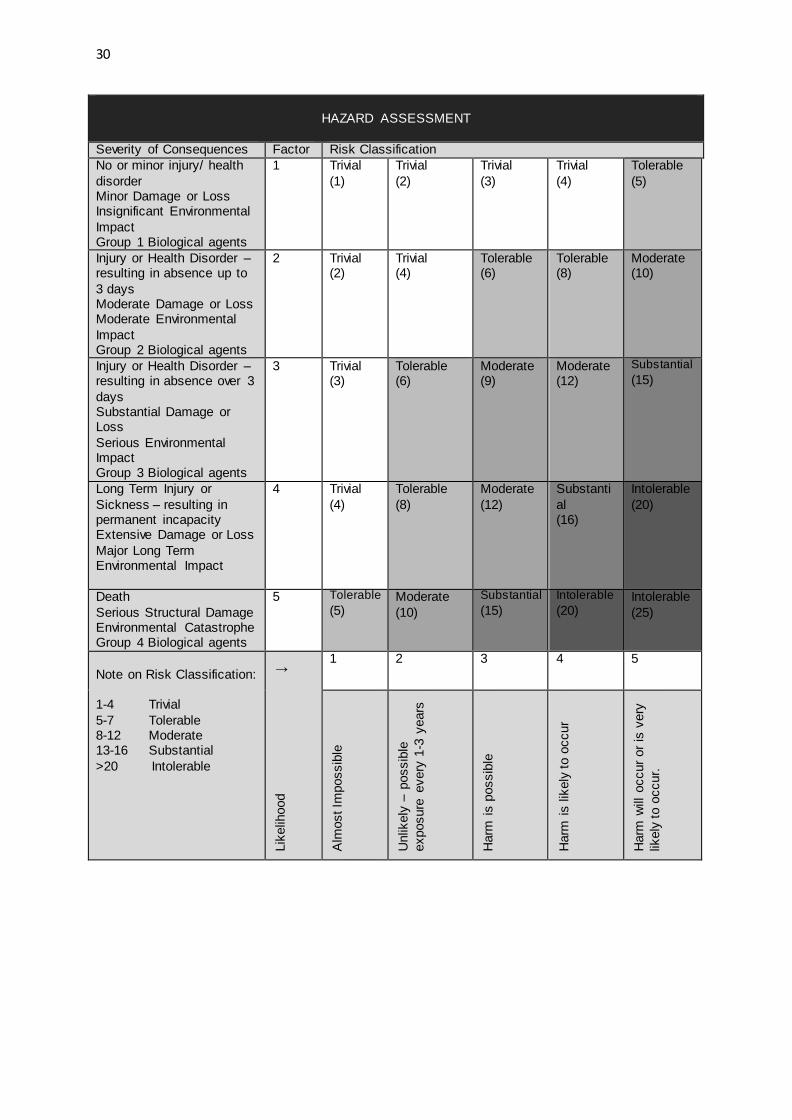
HAZARD ASSESSMENT
Severity of Consequences Factor Risk Classification
No or minor injury/ health
disorder Minor Damage or Loss Insignificant Environmental
Impact Group 1 Biological agents
1 Trivial
(1)
Trivial
(2)
Trivial
(3)
Trivial
(4)
Tolerable
(5)
Injury or Health Disorder – resulting in absence up to
3 days Moderate Damage or Loss Moderate Environmental
Impact Group 2 Biological agents
2 Trivial (2)
Trivial (4)
Tolerable (6)
Tolerable (8)
Moderate (10)
Injury or Health Disorder – resulting in absence over 3
days Substantial Damage or Loss
Serious Environmental Impact Group 3 Biological agents
3 Trivial (3)
Tolerable (6)
Moderate (9)
Moderate (12)
Substantial
(15)
Long Term Injury or
Sickness – resulting in permanent incapacity Extensive Damage or Loss
Major Long Term Environmental Impact
4 Trivial
(4)
Tolerable
(8)
Moderate
(12)
Substanti
al (16)
Intolerable
(20)
Death
Serious Structural Damage Environmental Catastrophe Group 4 Biological agents
5 Tolerable
(5) Moderate
(10)
Substantial
(15)
Intolerable
(20) Intolerable
(25)
Note on Risk Classification: 1-4 Trivial
5-7 Tolerable 8-12 Moderate 13-16 Substantial
>20 Intolerable
Lik
elih
ood
↓ 1 2 3 4 5
Alm
ost Im
possib
le
Unlik
ely
– p
ossib
le
exposure
every
1-3
years
Harm
is p
ossib
le
Harm
is lik
ely
to o
ccur
Harm
will
occur
or
is v
ery
likely
to o
ccur.

31
ASSESSMENT OF RISK CLASSIFICATION
Hazard Likelihood Score
Severity Score
Risk Classification
Novel
Benzodiazepines
2 2 4
Carbachol
2 3
6
Atropine
2 3 6
PK 11195
1 1 1
Nifedipine
2 2 4
DMSO (solvent)
1 1 1
Electricity (e.g.
electric shock due to lack of precautions)
1 5 5
Glassware (e.g. cuts from broken glass)
1 2 2
Laboratory equipment (e.g.
knocking over heavy equipment)
1 3 3
Sharps (e.g. cuts from scissors etc.)
1 2 2
Slips/trips/falls (e.g. slipping on wet
floors/tripping over cables etc.)
2 3 6
EFFECT OF RISK CLASSIFICATION
Risk Classification Action
Trivial No further action required. Activity can begin.
Tolerable No additional controls required. Current controls must be maintained and monitored.
Moderate Reduce risks if cost effective. Implement new controls over an agreed period.
Substantial Activity cannot begin without major risk reduction.
Intolerable Activity must not begin.

32
RISK CONTROL MEASURES
Is the local code of practice or local rules adequate to control the risks identified? Yes/No
If no, list all additional measures required.
Additional Measures: Wear gloves when handling chemicals. Weigh dangerous chemicals in the fume
cupboard. Wear safety glasses wear necessary. For electricity: PAT testing. Isolated bench.
HEALTH SURVEILLANCE ISSUES
Persons at Special Risk
People with allergies to substances listed above.
Health Surveillance Measures (including symptoms
and signs of exposure)
For Atropine: General advice:
Consult a physician. Show this safety data sheet to the doctor in attendance. In case of skin contact: Wash off with soap and plenty of water. If irritation occurs consult a
physician. In case of eye contact: Flush eyes with water as a precaution.
If swallowed: Never give anything by mouth to an unconscious person. Rinse mouth with water. Consult a physician.
For Carbachol:
General advice: Consult a physician. Show this safety data sheet to the doctor in attendance. In case of skin contact:
In case of contact, immediately flush skin with plenty of water for at least 15 minutes In case of eye contact:
Check for and remove any contact lenses. In case of contact, immediately flush eyes with plenty of water for at least 15 minutes. Cold water may be used. Get medical attention.
If swallowed: Do not induce vomiting unless directed to do so by medical personnel. Never give anything by mouth to an unconscious person. Loosen tight
clothing such as a collar, tie, belt or waistband. Seek medical attention immediately.
Exclusions

33
SIGNATURES
Staff/PhD student/MSc student/Undergraduate
Name (Print) Signature Date
Assessor
Supervisor (if Assessor is a student)
Local Health and Safety Advisor / Laboratory
Manager

34
6.2 Appendix 2 – CoSHH forms
ACTIVITY INFORMATION
Name of Assessor/Contact details
Name: Ethan
Email address: [email protected]
Title of Activity
The effects of functional groups present on benzodiazepines on
their efficacy and potency whist acting on Peripheral
Benzodiazepine Receptors (Translocator protein 18 kDa) in the
ileum of a rat.
Location of Activity
CP Snow, 2G150
Description of Activity
Testing the muscle relaxant properties of novel benzodiazepines on rat ileum (in vivo).
Personnel Involved
Myself, Chris Benham, technical staff and other students working
in 2G150
HAZARD CLASSIFICATION
Hazards involved in project.
X Harmful/Irritant
□ Corrosive
□ Radioactive
□ Biological
X Toxic
□ Health Hazard
□ Explosive
□ Oxidising
□ Flammable
□ Hazardous to the Environment
□ Gas under pressure
Ref No:
Date:
Review Date:

35
Severity Classification
Harmful/Irritant 2
Corrosive 3 Radioactive * Biological **
Toxic 3
Health Hazard 4
Explosive 5 Oxidising 5
Flammable 3 Hazardous to the Environment 4
Gas under pressure 5
* Radioactive – If any work will involve use of Radioactivity contact the Radiation Protection Supervisor, Janet Evans (ext. 4379, [email protected]) for an accurate severity classification before work begins.
** Biological – If any work will involve using biological samples or suspected biohazards contact the Biological Safety Advisor.
For Department of Human and Environmental Sciences contact Di Francis (ext. 4527, [email protected]). For Department of Pharmacy contact James Stanley (ext. 4599, [email protected]).
Substance Used or
Produced.
Concentration or amount
used.
Hazard Words and Pictograms
Route of Entry
Severity
Diazepam (several
novel benzodiazepines are
being used for which there is no
data, diazepam is being used
as a general example for all
benzodiazepines being used.
Carbachol
Atropine
10-2-10-8 Mol
10-2-10-8 Mol
10-2-10-8 Mol
□ Harmful if swallowed
□ Fatal if swallowed. Causes skin irritation.
Causes serious eye irritation May cause respiratory irritation.
□ Fatal if Swallowed
All routes
All routes
All routes
2
3
3

36
PK 11195
Nifedipine
DMSO
(solvent)
10-2-10-8 Mol
10-2-10-8 Mol
100%
Not a hazardous substance or mixture according to Regulation (EC) No. 1272/2008. This substance is not classified as dangerous according to Directive 67/548/EEC.
□ Harmful if swallowed
Not a hazardous substance or mixture according to Regulation (EC) No.
1272/2008. This substance is not classified as dangerous according to Directive
67/548/EEC.
All routes
All routes
All routes
1
2
1
Information sources (e.g. MSDS)
MSDS, Sigma-Aldrich website (http://www.sigmaaldrich.com)
CONTROL MEASURES
Additional measures to be used over and above local codes of practice and local rules.
Wear gloves and safety glasses. Use the fume cupboard for weighing out toxic chemicals.
Are alternative less hazardous substances available? If so please list below and state why they cannot be used.
Not available.
EMERGENCY AND DISPOSAL PROCEDURES
Measures to be taken in case of Spillage or Uncontrolled release
Solid spill: Prevent further leakage/spillage. Bag & bin. Inform technical staff.
Liquid Spill: Prevent further leakage/spillage. Mop with plenty of water, dilute down and dispose of
down sink. Inform technical staff
37
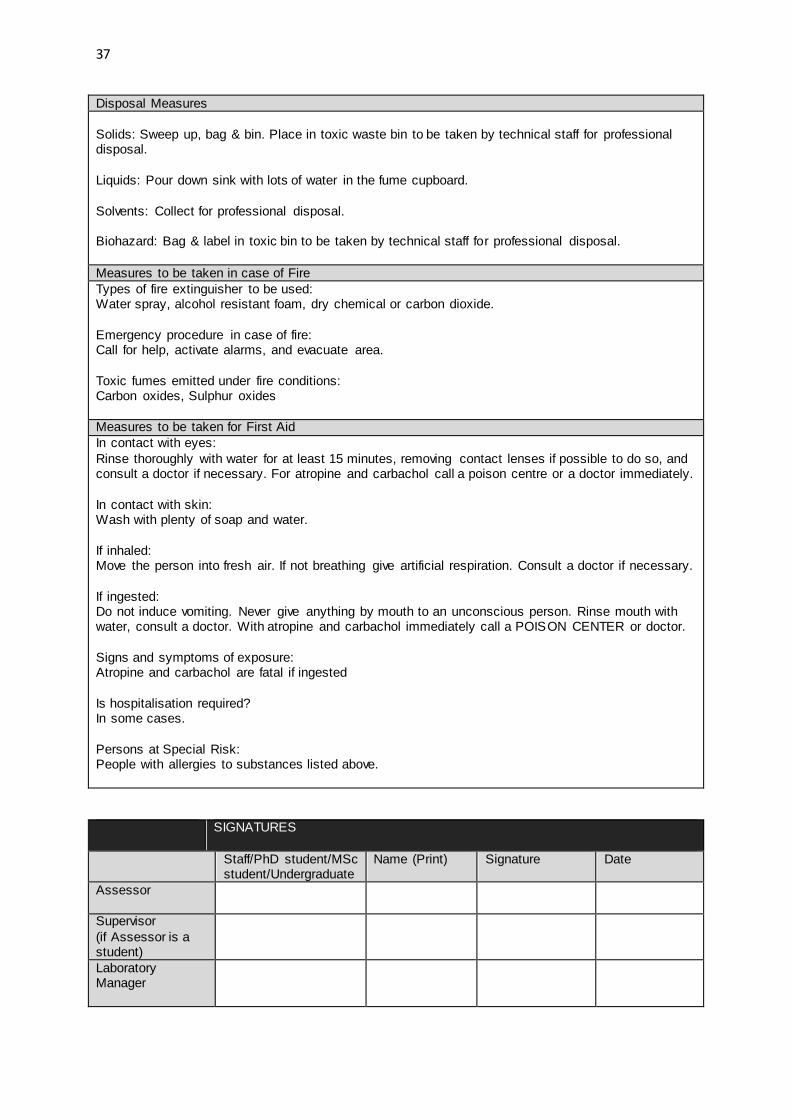
Disposal Measures
Solids: Sweep up, bag & bin. Place in toxic waste bin to be taken by technical staff for professional disposal.
Liquids: Pour down sink with lots of water in the fume cupboard.
Solvents: Collect for professional disposal. Biohazard: Bag & label in toxic bin to be taken by technical staff for professional disposal.
Measures to be taken in case of Fire
Types of fire extinguisher to be used: Water spray, alcohol resistant foam, dry chemical or carbon dioxide.
Emergency procedure in case of fire: Call for help, activate alarms, and evacuate area.
Toxic fumes emitted under fire conditions: Carbon oxides, Sulphur oxides
Measures to be taken for First Aid
In contact with eyes:
Rinse thoroughly with water for at least 15 minutes, removing contact lenses if possible to do so, and consult a doctor if necessary. For atropine and carbachol call a poison centre or a doctor immediately.
In contact with skin: Wash with plenty of soap and water.
If inhaled: Move the person into fresh air. If not breathing give artificial respiration. Consult a doctor if necessary.
If ingested: Do not induce vomiting. Never give anything by mouth to an unconscious person. Rinse mouth with water, consult a doctor. With atropine and carbachol immediately call a POISON CENTER or doctor.
Signs and symptoms of exposure: Atropine and carbachol are fatal if ingested
Is hospitalisation required? In some cases.
Persons at Special Risk: People with allergies to substances listed above.
SIGNATURES
Staff/PhD student/MSc student/Undergraduate
Name (Print) Signature Date
Assessor
Supervisor
(if Assessor is a student)
Laboratory Manager

38
6.3 Appendix 3 – Carbachol raw data examples
FBC (M) Ileum response (g) % of maximum response
1.00E-08 0.364 13.098
3.00E-08 0.429 15.437
1.00E-07 0.885 31.846
3.00E-07 1.549 55.739
1.00E-06 2.336 84.059
3.00E-06 2.57 92.479
1.00E-05 2.779 100.000
3.00E-05 2.138 76.934
FBC (M) Ileum response (g) % of maximum response
1.00E-08 0.092 4.303
3.00E-08 0.185 8.653
1.00E-07 0.306 14.312
3.00E-07 0.462 21.609
1.00E-06 0.826 38.634
3.00E-06 1.843 86.202
1.00E-05 2.017 94.341
3.00E-05 2.138 100.000
FBC (M) Ileum response (g) % of maximum response
1.00E-08 0.228 9.508
3.00E-08 0.307 12.802
1.00E-07 0.5955 24.833
3.00E-07 1.0055 41.931
1.00E-06 1.581 65.930
3.00E-06 2.2065 92.014
1.00E-05 2.398 100.000
3.00E-05 2.138 89.158

39
6.4 Appendix 4 - DMSO vehicle test raw data
Test 3 DMSO FBC starting tension (g) tension after dose (g) difference (g) % difference
0.01 2.632 2.612 0.020 0.76
0.1 2.632 2.580 0.052 1.98
0.2 2.632 2.489 0.143 5.43
0.3 2.632 2.365 0.267 10.14
0.4 2.632 2.144 0.488 18.54
0.5 2.632 2.040 0.592 22.49
0.6 2.632 1.994 0.638 24.24
0.7 2.632 1.851 0.781 29.67
0.8 2.632 1.729 0.903 34.31
0.9 2.632 1.685 0.947 35.98
1.0 2.632 1.630 1.002 38.07
2.0 2.632 1.311 1.321 50.19
Test 2 DMSO FBC starting tension (g) tension after dose (g) difference (g) % difference
0.01 2.651 2.543 0.108 4.07
0.1 2.651 2.404 0.247 9.32
0.2 2.651 2.280 0.371 13.99
0.3 2.651 2.209 0.442 16.67
0.4 2.651 2.163 0.488 18.41
0.5 2.651 2.001 0.650 24.52
0.6 2.651 1.909 0.742 27.99
0.7 2.651 1.852 0.799 30.14
0.8 2.651 1.773 0.878 33.12
0.9 2.651 1.656 0.995 37.53
1.0 2.651 1.584 1.067 40.25
2.0 2.651 1.252 1.399 52.77
Test 1 DMSO FBC starting tension (g) tension after dose (g) difference (g) % difference
0.01 3.003 2.994 0.009 0.30
0.1 3.003 2.873 0.130 4.33
0.2 3.003 2.749 0.254 8.46
0.3 3.003 2.612 0.391 13.02
0.4 3.003 2.508 0.495 16.48
0.5 3.003 2.463 0.540 17.98
0.6 3.003 2.345 0.658 21.91
0.7 3.003 2.222 0.781 26.01
0.8 3.003 1.994 1.009 33.60
0.9 3.003 1.890 1.113 37.06
1.0 3.003 1.805 1.198 39.89
2.0 3.003 1.337 1.666 55.48

40
Test 4 DMSO FBC starting tension (g) tension after dose (g) difference (g) % difference
0.01 N/A N/A N/A N/A
0.1 5.954 5.799 0.155 2.60
0.2 5.954 5.728 0.226 3.80
0.3 5.954 5.547 0.407 6.84
0.4 5.954 5.333 0.621 10.43
0.5 5.954 5.029 0.925 15.54
0.6 5.954 4.913 1.041 17.48
0.7 5.954 4.641 1.313 22.05
0.8 5.954 4.453 1.501 25.21
0.9 5.954 4.253 1.701 28.57
1.0 5.954 3.852 2.102 35.30
2.0 5.954 1.975 3.979 66.83
Test 5 DMSO FBC starting tension (g) tension after dose (g) difference (g) % difference
0.01 N/A N/A N/A N/A
0.1 5.733 5.728 0.005 0.09
0.2 5.733 5.469 0.264 4.60
0.3 5.733 5.327 0.406 7.08
0.4 5.733 5.133 0.600 10.47
0.5 5.733 4.854 0.879 15.33
0.6 5.733 4.609 1.124 19.61
0.7 5.733 4.207 1.526 26.62
0.8 5.733 3.987 1.746 30.46
0.9 5.733 3.645 2.088 36.42
1.0 5.733 3.386 2.347 40.94
2.0 5.733 1.788 3.945 68.81
Test 6 DMSO FBC starting tension (g) tension after dose (g) difference (g) % difference
0.01 4.823 4.725 0.098 2.03
0.1 4.823 4.557 0.266 5.52
0.2 4.823 4.446 0.377 7.82
0.3 4.823 4.297 0.526 10.91
0.4 4.823 4.187 0.636 13.19
0.5 4.823 3.928 0.895 18.56
0.6 4.823 3.650 1.173 24.32
0.7 4.823 3.495 1.328 27.53
0.8 4.823 3.275 1.548 32.10
0.9 4.823 3.139 1.684 34.92
1.0 4.823 2.997 1.826 37.86
2.0 4.823 1.593 3.230 66.97
41
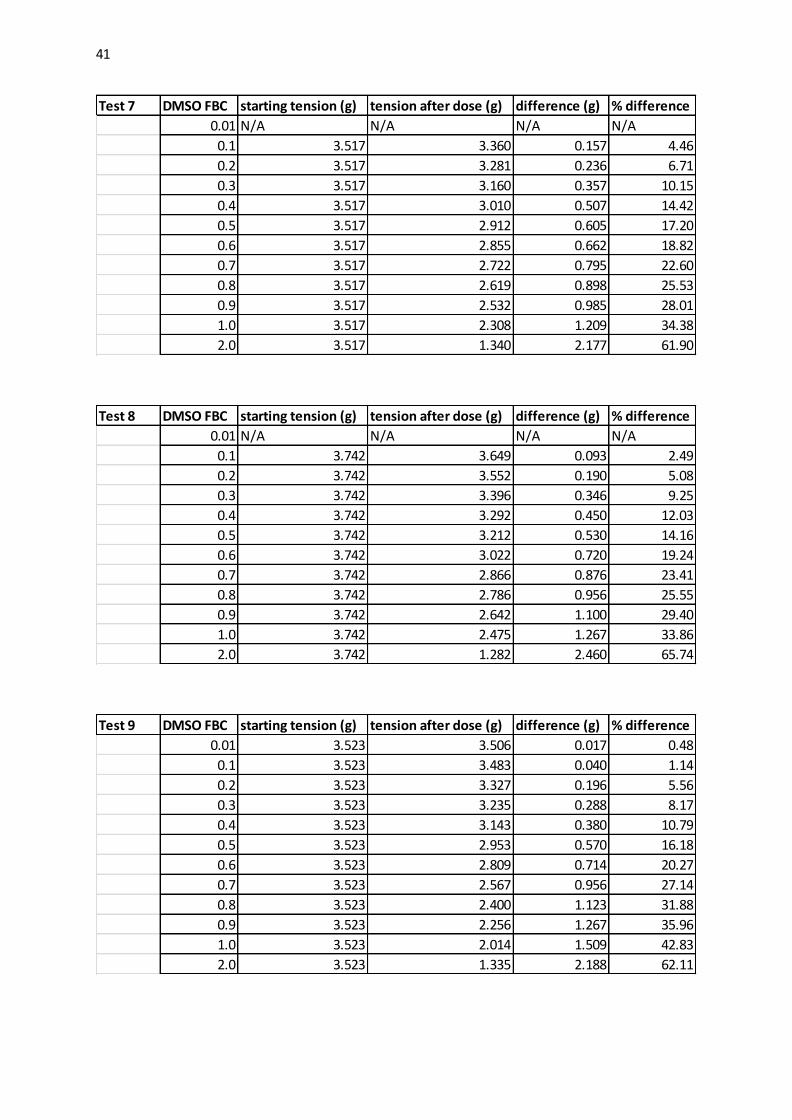
Test 7 DMSO FBC starting tension (g) tension after dose (g) difference (g) % difference
0.01 N/A N/A N/A N/A
0.1 3.517 3.360 0.157 4.46
0.2 3.517 3.281 0.236 6.71
0.3 3.517 3.160 0.357 10.15
0.4 3.517 3.010 0.507 14.42
0.5 3.517 2.912 0.605 17.20
0.6 3.517 2.855 0.662 18.82
0.7 3.517 2.722 0.795 22.60
0.8 3.517 2.619 0.898 25.53
0.9 3.517 2.532 0.985 28.01
1.0 3.517 2.308 1.209 34.38
2.0 3.517 1.340 2.177 61.90
Test 8 DMSO FBC starting tension (g) tension after dose (g) difference (g) % difference
0.01 N/A N/A N/A N/A
0.1 3.742 3.649 0.093 2.49
0.2 3.742 3.552 0.190 5.08
0.3 3.742 3.396 0.346 9.25
0.4 3.742 3.292 0.450 12.03
0.5 3.742 3.212 0.530 14.16
0.6 3.742 3.022 0.720 19.24
0.7 3.742 2.866 0.876 23.41
0.8 3.742 2.786 0.956 25.55
0.9 3.742 2.642 1.100 29.40
1.0 3.742 2.475 1.267 33.86
2.0 3.742 1.282 2.460 65.74
Test 9 DMSO FBC starting tension (g) tension after dose (g) difference (g) % difference
0.01 3.523 3.506 0.017 0.48
0.1 3.523 3.483 0.040 1.14
0.2 3.523 3.327 0.196 5.56
0.3 3.523 3.235 0.288 8.17
0.4 3.523 3.143 0.380 10.79
0.5 3.523 2.953 0.570 16.18
0.6 3.523 2.809 0.714 20.27
0.7 3.523 2.567 0.956 27.14
0.8 3.523 2.400 1.123 31.88
0.9 3.523 2.256 1.267 35.96
1.0 3.523 2.014 1.509 42.83
2.0 3.523 1.335 2.188 62.11

42
6.5 Appendix 5 – Raw drug data
6.5.1 MH2
Test 1 FBC (M) starting tension (g) tension after dose (g) difference (g) % difference
1.00E-09 0.333 0.304 0.029 8.71
3.00E-09 0.333 0.293 0.040 12.01
1.00E-08 0.333 0.276 0.057 17.12
3.00E-08 0.333 0.270 0.063 18.92
1.00E-07 0.333 0.264 0.069 20.72
3.00E-07 0.333 0.225 0.108 32.43
1.00E-06 0.333 0.208 0.125 37.54
3.00E-06 0.333 0.185 0.148 44.44
1.00E-05 0.333 0.139 0.194 58.26
3.00E-05 0.333 0.082 0.251 75.38
DMSO Control FBC (%) starting tension (g) tension after dose (g) difference (g) % difference
0.010 0.373 0.356 0.017 4.56
0.030 0.373 0.339 0.034 9.12
0.037 0.373 0.316 0.057 15.28
0.057 0.373 0.310 0.063 16.89
0.127 0.373 0.293 0.080 21.45
0.327 0.373 0.270 0.103 27.61
0.397 0.373 0.208 0.165 44.24
0.597 0.373 0.168 0.205 54.96
0.667 0.373 0.128 0.245 65.68
0.867 0.373 0.094 0.279 74.80
Test 2 FBC (M) starting tension (g) tension after dose (g) difference (g) % difference
1.00E-09 0.504 0.458 0.046 9.13
3.00E-09 0.504 0.441 0.063 12.50
1.00E-08 0.504 0.418 0.086 17.06
3.00E-08 0.504 0.407 0.097 19.25
1.00E-07 0.504 0.356 0.148 29.37
3.00E-07 0.504 0.304 0.200 39.68
1.00E-06 0.504 0.270 0.234 46.43
3.00E-06 0.504 0.213 0.291 57.74
1.00E-05 0.504 0.179 0.325 64.48
3.00E-05 0.504 0.082 0.422 83.73

43
DMSO Control FBC (%) starting tension (g) tension after dose (g) difference (g) % difference
0.010 0.367 0.361 0.006 1.63
0.030 0.367 0.350 0.017 4.63
0.037 0.367 0.344 0.023 6.27
0.057 0.367 0.339 0.028 7.63
0.127 0.367 0.333 0.034 9.26
0.327 0.367 0.304 0.063 17.17
0.397 0.367 0.282 0.085 23.16
0.597 0.367 0.242 0.125 34.06
0.667 0.367 0.219 0.148 40.33
0.867 0.367 0.173 0.194 52.86
Test 3 FBC (M) starting tension (g) tension after dose (g) difference (g) % difference
1.00E-09 0.504 0.492 0.012 2.38
3.00E-09 0.504 0.487 0.017 3.37
1.00E-08 0.504 0.475 0.029 5.75
3.00E-08 0.504 0.470 0.034 6.75
1.00E-07 0.504 0.458 0.046 9.13
3.00E-07 0.504 0.441 0.063 12.50
1.00E-06 0.504 0.390 0.114 22.62
3.00E-06 0.504 0.361 0.143 28.37
1.00E-05 0.504 0.270 0.234 46.43
3.00E-05 0.504 0.213 0.291 57.74
DMSO Control FBC (%) starting tension (g) tension after dose (g) difference (g) % difference
0.010 0.430 0.424 0.006 1.40
0.030 0.430 0.424 0.006 1.40
0.037 0.430 0.418 0.012 2.79
0.057 0.430 0.418 0.012 2.79
0.127 0.430 0.413 0.017 3.95
0.327 0.430 0.356 0.074 17.21
0.397 0.430 0.350 0.080 18.60
0.597 0.430 0.293 0.137 31.86
0.667 0.430 0.270 0.160 37.21
0.867 0.430 0.230 0.200 46.51

44
6.5.2 MH4
Test 1 FBC (M) starting tension (g) tension after dose (g) difference (g) % difference
1.00E-09 0.468 0.338 0.130 27.78
3.00E-09 0.468 0.313 0.155 33.12
1.00E-08 0.468 0.300 0.168 35.90
3.00E-08 0.468 0.268 0.200 42.74
1.00E-07 0.468 0.216 0.252 53.85
3.00E-07 0.468 0.158 0.310 66.24
1.00E-06 0.468 0.113 0.355 75.85
3.00E-06 0.468 0.107 0.361 77.14
1.00E-05 0.468 0.068 0.400 85.47
3.00E-05 0.468 0.004 0.464 99.15
DMSO Control FBC (%) starting tension (g) tension after dose (g) difference (g) % difference
0.010 0.576 0.529 0.047 8.16
0.030 0.576 0.493 0.083 14.41
0.037 0.576 0.486 0.090 15.63
0.057 0.576 0.454 0.122 21.18
0.127 0.576 0.428 0.148 25.69
0.327 0.576 0.371 0.205 35.59
0.397 0.576 0.364 0.212 36.81
0.597 0.576 0.345 0.231 40.10
0.667 0.576 0.313 0.263 45.66
0.867 0.576 0.261 0.315 54.69
Test 2 FBC (M) starting tension (g) tension after dose (g) difference (g) % difference
1.00E-09 0.465 0.391 0.074 15.91
3.00E-09 0.465 0.323 0.142 30.54
1.00E-08 0.465 0.261 0.204 43.87
3.00E-08 0.465 0.210 0.255 54.84
1.00E-07 0.465 0.204 0.261 56.13
3.00E-07 0.465 0.159 0.306 65.81
1.00E-06 0.465 0.136 0.329 70.75
3.00E-06 0.465 0.068 0.397 85.38
1.00E-05 0.465 0.045 0.420 90.32
3.00E-05 0.465 0.000 0.465 100.00

45
DMSO Control FBC (%) starting tension (g) tension after dose (g) difference (g) % difference
0.010 0.318 0.306 0.012 3.77
0.030 0.318 0.301 0.017 5.35
0.037 0.318 0.272 0.046 14.47
0.057 0.318 0.255 0.063 19.81
0.127 0.318 0.232 0.086 27.04
0.327 0.318 0.204 0.114 35.85
0.397 0.318 0.181 0.137 43.08
0.597 0.318 0.164 0.154 48.43
0.667 0.318 0.147 0.171 53.77
0.867 0.318 0.108 0.210 66.04
Test 3 FBC (M) starting tension (g) tension after dose (g) difference (g) % difference
1.00E-09 1.162 1.040 0.122 10.50
3.00E-09 1.162 0.982 0.180 15.49
1.00E-08 1.162 0.853 0.309 26.59
3.00E-08 1.162 0.790 0.372 32.01
1.00E-07 1.162 0.712 0.450 38.73
3.00E-07 1.162 0.557 0.605 52.07
1.00E-06 1.162 0.461 0.701 60.33
3.00E-06 1.162 0.371 0.791 68.07
1.00E-05 1.162 0.338 0.824 70.91
3.00E-05 1.162 0.145 1.017 87.52
DMSO Control FBC (%) starting tension (g) tension after dose (g) difference (g) % difference
0.010 1.542 1.310 0.232 15.05
0.030 1.542 1.156 0.386 25.03
0.037 1.542 1.072 0.470 30.48
0.057 1.542 0.905 0.637 41.31
0.127 1.542 0.757 0.785 50.91
0.327 1.542 0.602 0.940 60.96
0.397 1.542 0.589 0.953 61.80
0.597 1.542 0.461 1.081 70.10
0.667 1.542 0.371 1.171 75.94
0.867 1.542 0.216 1.326 85.99

46
Test 4 FBC (M) starting tension (g) tension after dose (g) difference (g) % difference
1.00E-09 1.681 1.239 0.442 26.29
3.00E-09 1.681 1.125 0.556 33.08
1.00E-08 1.681 1.102 0.579 34.44
3.00E-08 1.681 1.085 0.596 35.46
1.00E-07 1.681 0.927 0.754 44.85
3.00E-07 1.681 0.620 1.061 63.12
1.00E-06 1.681 0.859 0.822 48.90
3.00E-06 1.681 0.802 0.879 52.29
1.00E-05 1.681 0.671 1.010 60.08
3.00E-05 1.681 0.252 1.429 85.01
DMSO Control FBC (%) starting tension (g) tension after dose (g) difference (g) % difference
0.010 2.021 1.982 0.039 1.93
0.030 2.021 1.862 0.159 7.87
0.037 2.021 1.743 0.278 13.76
0.057 2.021 1.590 0.431 21.33
0.127 2.021 1.465 0.556 27.51
0.327 2.021 1.250 0.771 38.15
0.397 2.021 1.068 0.953 47.15
0.597 2.021 0.853 1.168 57.79
0.667 2.021 0.768 1.253 62.00
0.867 2.021 0.444 1.577 78.03
Test 5 FBC (M) starting tension (g) tension after dose (g) difference (g) % difference
1.00E-09 0.409 0.396 0.013 3.18
3.00E-09 0.409 0.358 0.051 12.47
1.00E-08 0.409 0.338 0.071 17.36
3.00E-08 0.409 0.326 0.083 20.29
1.00E-07 0.409 0.300 0.109 26.65
3.00E-07 0.409 0.229 0.180 44.01
1.00E-06 0.409 0.210 0.199 48.66
3.00E-06 0.409 0.197 0.212 51.83
1.00E-05 0.409 0.152 0.257 62.84
3.00E-05 0.409 0.062 0.347 84.84

47
DMSO Control FBC (%) starting tension (g) tension after dose (g) difference (g) % difference
0.010 0.576 0.529 0.047 8.16
0.030 0.576 0.493 0.083 14.41
0.037 0.576 0.486 0.090 15.63
0.057 0.576 0.454 0.122 21.18
0.127 0.576 0.428 0.148 25.69
0.327 0.576 0.371 0.205 35.59
0.397 0.576 0.364 0.212 36.81
0.597 0.576 0.345 0.231 40.10
0.667 0.576 0.313 0.263 45.66
0.867 0.576 0.261 0.315 54.69
Test 6 FBC (M) starting tension (g) tension after dose (g) difference (g) % difference
1.00E-09 1.335 1.131 0.204 15.28
3.00E-09 1.335 1.006 0.329 24.64
1.00E-08 1.335 0.904 0.431 32.28
3.00E-08 1.335 0.859 0.476 35.66
1.00E-07 1.335 0.796 0.539 40.37
3.00E-07 1.335 0.558 0.777 58.20
1.00E-06 1.335 0.501 0.834 62.47
3.00E-06 1.335 0.331 1.004 75.21
1.00E-05 1.335 0.263 1.072 80.30
3.00E-05 1.335 0.064 1.271 95.21
DMSO Control FBC (%) starting tension (g) tension after dose (g) difference (g) % difference
0.010 1.811 1.766 0.045 2.48
0.030 1.811 1.726 0.085 4.69
0.037 1.811 1.613 0.198 10.93
0.057 1.811 1.556 0.255 14.08
0.127 1.811 1.511 0.300 16.57
0.327 1.811 1.392 0.419 23.14
0.397 1.811 1.153 0.658 36.33
0.597 1.811 1.029 0.782 43.18
0.667 1.811 0.746 1.065 58.81
0.867 1.811 0.581 1.230 67.92

48
6.5.3 MH5
Test 1 FBC (M) starting tension (g) tension after dose (g) difference (g) % difference
1.00E-09 1.332 1.255 0.077 5.78
3.00E-09 1.332 1.184 0.148 11.11
1.00E-08 1.332 1.120 0.212 15.92
3.00E-08 1.332 1.088 0.244 18.32
1.00E-07 1.332 0.978 0.354 26.58
3.00E-07 1.332 0.876 0.456 34.23
1.00E-06 1.332 0.805 0.527 39.56
3.00E-06 1.332 0.657 0.675 50.68
1.00E-05 1.332 0.561 0.771 57.88
3.00E-05 1.332 0.285 1.047 78.60
DMSO Control FBC (%) starting tension (g) tension after dose (g) difference (g) % difference
0.010 0.882 0.863 0.019 2.15
0.030 0.882 0.856 0.026 2.95
0.037 0.882 0.843 0.039 4.42
0.057 0.882 0.837 0.045 5.10
0.127 0.882 0.766 0.116 13.15
0.327 0.882 0.696 0.186 21.09
0.397 0.882 0.599 0.283 32.09
0.597 0.882 0.464 0.418 47.39
0.667 0.882 0.413 0.469 53.17
0.867 0.882 0.310 0.572 64.85
Test 2 FBC (M) starting tension (g) tension after dose (g) difference (g) % difference
1.00E-09 1.011 0.940 0.071 7.02
3.00E-09 1.011 0.837 0.174 17.21
1.00E-08 1.011 0.786 0.225 22.26
3.00E-08 1.011 0.734 0.277 27.40
1.00E-07 1.011 0.689 0.322 31.85
3.00E-07 1.011 0.587 0.424 41.94
1.00E-06 1.011 0.567 0.444 43.92
3.00E-06 1.011 0.458 0.553 54.70
1.00E-05 1.011 0.394 0.617 61.03
3.00E-05 1.011 0.285 0.726 71.81

49
DMSO Control FBC (%) starting tension (g) tension after dose (g) difference (g) % difference
0.010 0.683 0.670 0.013 1.90
0.030 0.683 0.599 0.084 12.30
0.037 0.683 0.574 0.109 15.96
0.057 0.683 0.574 0.109 15.96
0.127 0.683 0.567 0.116 16.98
0.327 0.683 0.445 0.238 34.85
0.397 0.683 0.400 0.283 41.43
0.597 0.683 0.349 0.334 48.90
0.667 0.683 0.291 0.392 57.39
0.867 0.683 0.233 0.450 65.89
Test 3 FBC (M) starting tension (g) tension after dose (g) difference (g) % difference
1.00E-09 0.747 0.715 0.032 4.28
3.00E-09 0.747 0.683 0.064 8.57
1.00E-08 0.747 0.664 0.083 11.11
3.00E-08 0.747 0.631 0.116 15.53
1.00E-07 0.747 0.599 0.148 19.81
3.00E-07 0.747 0.497 0.250 33.47
1.00E-06 0.747 0.471 0.276 36.95
3.00E-06 0.747 0.355 0.392 52.48
1.00E-05 0.747 0.291 0.456 61.04
3.00E-05 0.747 0.188 0.559 74.83
DMSO Control FBC (%) starting tension (g) tension after dose (g) difference (g) % difference
0.010 0.400 0.387 0.013 3.25
0.030 0.400 0.387 0.013 3.25
0.037 0.400 0.381 0.019 4.75
0.057 0.400 0.375 0.025 6.25
0.127 0.400 0.355 0.045 11.25
0.327 0.400 0.304 0.096 24.00
0.397 0.400 0.285 0.115 28.75
0.597 0.400 0.227 0.173 43.25
0.667 0.400 0.195 0.205 51.25
0.867 0.400 0.124 0.276 69.00
50
Test 4 FBC (M) starting tension (g) tension after dose (g) difference (g) % difference
1.00E-09 1.746 1.648 0.098 5.61
3.00E-09 1.746 1.556 0.190 10.88
1.00E-08 1.746 1.498 0.248 14.20
3.00E-08 1.746 1.377 0.369 21.13
1.00E-07 1.746 1.291 0.455 26.06
3.00E-07 1.746 1.141 0.605 34.65
1.00E-06 1.746 1.072 0.674 38.60
3.00E-06 1.746 0.939 0.807 46.22
1.00E-05 1.746 0.882 0.864 49.48
3.00E-05 1.746 0.680 1.066 61.05
DMSO Control FBC (%) starting tension (g) tension after dose (g) difference (g) % difference
0.010 1.331 1.331 0.000 0.00
0.030 1.331 1.325 0.006 0.45
0.037 1.331 1.285 0.046 3.46
0.057 1.331 1.245 0.086 6.46
0.127 1.331 1.181 0.150 11.27
0.327 1.331 1.049 0.282 21.19
0.397 1.331 0.991 0.340 25.54
0.597 1.331 0.853 0.478 35.91
0.667 1.331 0.772 0.559 42.00
0.867 1.331 0.709 0.622 46.73
Test 5 FBC (M) starting tension (g) tension after dose (g) difference (g) % difference
1.00E-09 1.360 1.268 0.092 6.76
3.00E-09 1.360 1.129 0.231 16.99
1.00E-08 1.360 1.060 0.300 22.06
3.00E-08 1.360 1.037 0.323 23.75
1.00E-07 1.360 0.991 0.369 27.13
3.00E-07 1.360 0.876 0.484 35.59
1.00E-06 1.360 0.795 0.565 41.54
3.00E-06 1.360 0.674 0.686 50.44
1.00E-05 1.360 0.548 0.812 59.71
3.00E-05 1.360 0.340 1.020 75.00

51
DMSO Control FBC (%) starting tension (g) tension after dose (g) difference (g) % difference
0.010 0.525 0.513 0.012 2.29
0.030 0.525 0.473 0.040 7.80
0.037 0.525 0.455 0.070 13.33
0.057 0.525 0.455 0.070 13.33
0.127 0.525 0.444 0.081 15.43
0.327 0.525 0.375 0.150 28.57
0.397 0.525 0.340 0.185 35.24
0.597 0.525 0.277 0.248 47.24
0.667 0.525 0.219 0.306 58.29
0.867 0.525 0.190 0.335 63.81
Test 6 FBC (M) starting tension (g) tension after dose (g) difference (g) % difference
1.00E-09 0.870 0.841 0.029 3.33
3.00E-09 0.870 0.824 0.046 5.29
1.00E-08 0.870 0.807 0.063 7.24
3.00E-08 0.870 0.790 0.080 9.20
1.00E-07 0.870 0.767 0.103 11.84
3.00E-07 0.870 0.732 0.138 15.86
1.00E-06 0.870 0.626 0.244 28.05
3.00E-06 0.870 0.565 0.305 35.06
1.00E-05 0.870 0.461 0.409 47.01
3.00E-05 0.870 0.311 0.559 64.25
DMSO Control FBC (%) starting tension (g) tension after dose (g) difference (g) % difference
0.010 0.836 0.818 0.018 2.15
0.030 0.836 0.807 0.029 3.47
0.037 0.836 0.795 0.041 4.90
0.057 0.836 0.784 0.052 6.22
0.127 0.836 0.776 0.060 7.18
0.327 0.836 0.708 0.128 15.31
0.397 0.836 0.612 0.224 26.79
0.597 0.836 0.563 0.273 32.66
0.667 0.836 0.488 0.348 41.63
0.867 0.836 0.398 0.438 52.39

52
6.5.4 MH7
Test 1 FBC (M) starting tension (g) tension after dose (g) difference (g) % difference
1.00E-09 2.592 2.561 0.031 1.20
3.00E-09 2.592 2.492 0.100 3.86
1.00E-08 2.592 2.405 0.187 7.21
3.00E-08 2.592 2.225 0.367 14.16
1.00E-07 2.592 1.888 0.704 27.16
3.00E-07 2.592 1.715 0.877 33.83
1.00E-06 2.592 1.541 1.051 40.55
3.00E-06 2.592 1.404 1.188 45.83
1.00E-05 2.592 1.211 1.381 53.28
3.00E-05 2.592 1.087 1.505 58.06
DMSO Control FBC (%) starting tension (g) tension after dose (g) difference (g) % difference
0.010 2.635 2.561 0.074 2.81
0.030 2.635 2.474 0.161 6.11
0.037 2.635 2.393 0.242 9.18
0.057 2.635 2.312 0.323 12.26
0.127 2.635 2.075 0.560 21.25
0.327 2.635 1.946 0.689 26.15
0.397 2.635 1.660 0.975 37.00
0.597 2.635 1.505 1.130 42.88
0.667 2.635 1.430 1.205 45.73
0.867 2.635 1.324 1.311 49.75
Test 2 FBC (M) starting tension (g) tension after dose (g) difference (g) % difference
1.00E-09 2.753 2.505 0.248 9.01
3.00E-09 2.753 2.325 0.428 15.55
1.00E-08 2.753 2.256 0.497 18.05
3.00E-08 2.753 2.107 0.646 23.47
1.00E-07 2.753 1.908 0.845 30.69
3.00E-07 2.753 1.747 1.006 36.54
1.00E-06 2.753 1.560 1.193 43.33
3.00E-06 2.753 1.380 1.373 49.87
1.00E-05 2.753 1.119 1.634 59.35
3.00E-05 2.753 0.896 1.857 67.45

53
DMSO Control FBC (%) starting tension (g) tension after dose (g) difference (g) % difference
0.010 2.029 1.911 0.118 5.82
0.030 2.029 1.855 0.174 8.58
0.037 2.029 1.805 0.224 11.04
0.057 2.029 1.718 0.311 15.33
0.127 2.029 1.650 0.379 18.68
0.327 2.029 1.477 0.552 27.21
0.397 2.029 1.334 0.695 34.25
0.597 2.029 1.135 0.894 44.06
0.667 2.029 1.089 0.940 46.33
0.867 2.029 0.956 1.073 52.88
Test 3 FBC (M) starting tension (g) tension after dose (g) difference (g) % difference
1.00E-09 2.135 2.085 0.050 2.34
3.00E-09 2.135 1.936 0.199 9.32
1.00E-08 2.135 1.849 0.286 13.40
3.00E-08 2.135 1.814 0.321 15.04
1.00E-07 2.135 1.706 0.429 20.09
3.00E-07 2.135 1.495 0.640 29.98
1.00E-06 2.135 1.302 0.833 39.02
3.00E-06 2.135 1.078 1.057 49.51
1.00E-05 2.135 0.936 1.199 56.16
3.00E-05 2.135 0.786 1.349 63.19
DMSO Control FBC (%) starting tension (g) tension after dose (g) difference (g) % difference
0.010 1.998 1.929 0.069 3.45
0.030 1.998 1.886 0.112 5.61
0.037 1.998 1.867 0.131 6.56
0.057 1.998 1.881 0.117 5.86
0.127 1.998 1.669 0.329 16.47
0.327 1.998 1.488 0.510 25.53
0.397 1.998 1.358 0.640 32.03
0.597 1.998 1.252 0.746 37.34
0.667 1.998 1.128 0.870 43.54
0.867 1.998 1.023 0.975 48.80

54
Test 4 FBC (M) starting tension (g) tension after dose (g) difference (g) % difference
1.00E-09 1.572 1.440 0.132 8.40
3.00E-09 1.572 1.228 0.344 21.88
1.00E-08 1.572 1.004 0.568 36.13
3.00E-08 1.572 0.826 0.746 47.46
1.00E-07 1.572 0.705 0.867 55.15
3.00E-07 1.572 0.602 0.970 61.70
1.00E-06 1.572 0.487 1.085 69.02
3.00E-06 1.572 0.303 1.269 80.73
1.00E-05 1.572 0.212 1.360 86.51
3.00E-05 1.572 0.114 1.458 92.75
DMSO Control FBC (%) starting tension (g) tension after dose (g) difference (g) % difference
0.010 1.813 1.716 0.097 5.35
0.030 1.813 1.549 0.264 14.56
0.037 1.813 1.394 0.419 23.11
0.057 1.813 1.302 0.511 28.19
0.127 1.813 1.101 0.712 39.27
0.327 1.813 0.981 0.832 45.89
0.397 1.813 0.854 0.959 52.90
0.597 1.813 0.676 1.137 62.71
0.667 1.813 0.562 1.251 69.00
0.867 1.813 0.441 1.372 75.68
Test 5 FBC (M) starting tension (g) tension after dose (g) difference (g) % difference
1.00E-09 1.767 1.652 0.115 6.51
3.00E-09 1.767 1.440 0.327 18.51
1.00E-08 1.767 1.302 0.465 26.32
3.00E-08 1.767 1.228 0.539 30.50
1.00E-07 1.767 1.067 0.700 39.62
3.00E-07 1.767 0.906 0.861 48.73
1.00E-06 1.767 0.745 1.022 57.84
3.00E-06 1.767 0.579 1.188 67.23
1.00E-05 1.767 0.407 1.360 76.97
3.00E-05 1.767 0.284 1.483 83.93
55
DMSO Control FBC (%) starting tension (g) tension after dose (g) difference (g) % difference
0.010 1.027 0.904 0.123 11.98
0.030 1.027 0.841 0.186 18.11
0.037 1.027 0.812 0.215 20.93
0.057 1.027 0.783 0.244 23.76
0.127 1.027 0.743 0.284 27.65
0.327 1.027 0.611 0.416 40.51
0.397 1.027 0.537 0.490 47.71
0.597 1.027 0.473 0.554 53.94
0.667 1.027 0.387 0.640 62.32
0.867 1.027 0.313 0.714 69.52
Test 6 FBC (M) starting tension (g) tension after dose (g) difference (g) % difference
1.00E-09 0.889 0.832 0.057 6.41
3.00E-09 0.889 0.789 0.100 11.25
1.00E-08 0.889 0.751 0.138 15.52
3.00E-08 0.889 0.694 0.195 21.93
1.00E-07 0.889 0.608 0.281 31.61
3.00E-07 0.889 0.499 0.390 43.87
1.00E-06 0.889 0.413 0.476 53.54
3.00E-06 0.889 0.338 0.551 61.98
1.00E-05 0.889 0.229 0.660 74.24
3.00E-05 0.889 0.109 0.780 87.74
DMSO Control FBC (%) starting tension (g) tension after dose (g) difference (g) % difference
0.010 0.935 0.878 0.057 6.10
0.030 0.935 0.786 0.149 15.94
0.037 0.935 0.728 0.207 22.14
0.057 0.935 0.688 0.247 26.42
0.127 0.935 0.608 0.327 34.97
0.327 0.935 0.522 0.413 44.17
0.397 0.935 0.470 0.465 49.73
0.597 0.935 0.401 0.534 57.11
0.667 0.935 0.344 0.591 63.21
0.867 0.935 0.241 0.694 74.22

56
6.5.5 MH8
Test 1 FBC (M) starting tension (g) tension after dose (g) difference (g) % difference
1.00E-09 2.952 2.846 0.106 3.59
3.00E-09 2.952 2.766 0.186 6.30
1.00E-08 2.952 2.561 0.391 13.25
3.00E-08 2.952 2.269 0.683 23.14
1.00E-07 2.952 1.859 1.093 37.03
3.00E-07 2.952 1.436 1.516 51.36
1.00E-06 2.952 1.213 1.739 58.91
3.00E-06 2.952 1.076 1.876 63.55
1.00E-05 2.952 0.747 2.205 74.70
3.00E-05 2.952 0.436 2.516 85.23
DMSO Control FBC (%) starting tension (g) tension after dose (g) difference (g) % difference
0.010 2.455 2.366 0.089 3.63
0.030 2.455 2.256 0.199 8.11
0.037 2.455 2.051 0.404 16.46
0.057 2.455 1.902 0.553 22.53
0.127 2.455 1.734 0.721 29.37
0.327 2.455 1.579 0.876 35.68
0.397 2.455 1.449 1.006 40.98
0.597 2.455 1.188 1.267 51.61
0.667 2.455 1.033 1.422 57.92
0.867 2.455 0.902 1.553 63.26
Test 2 FBC (M) starting tension (g) tension after dose (g) difference (g) % difference
1.00E-09 2.592 2.505 0.087 3.36
3.00E-09 2.592 2.325 0.267 10.30
1.00E-08 2.592 2.151 0.441 17.01
3.00E-08 2.592 1.989 0.603 23.26
1.00E-07 2.592 1.772 0.820 31.64
3.00E-07 2.592 1.541 1.051 40.55
1.00E-06 2.592 1.231 1.361 52.51
3.00E-06 2.592 1.026 1.566 60.42
1.00E-05 2.592 0.753 1.839 70.95
3.00E-05 2.592 0.442 2.150 82.95

57
DMSO Control FBC (%) starting tension (g) tension after dose (g) difference (g) % difference
0.010 1.803 1.747 0.056 3.11
0.030 1.803 1.703 0.100 5.55
0.037 1.803 1.629 0.174 9.65
0.057 1.803 1.579 0.224 12.42
0.127 1.803 1.498 0.305 16.92
0.327 1.803 1.219 0.584 32.39
0.397 1.803 1.144 0.659 36.55
0.597 1.803 0.927 0.876 48.59
0.667 1.803 0.840 0.963 53.41
0.867 1.803 0.635 1.168 64.78
Test 3 FBC (M) starting tension (g) tension after dose (g) difference (g) % difference
1.00E-09 2.660 2.585 0.075 2.82
3.00E-09 2.660 2.523 0.137 5.15
1.00E-08 2.660 2.405 0.255 9.59
3.00E-08 2.660 2.287 0.373 14.02
1.00E-07 2.660 2.088 0.572 21.50
3.00E-07 2.660 1.710 0.950 35.71
1.00E-06 2.660 1.480 1.180 44.36
3.00E-06 2.660 1.039 1.621 60.94
1.00E-05 2.660 0.703 1.957 73.57
3.00E-05 2.660 0.492 2.168 81.50
DMSO Control FBC (%) starting tension (g) tension after dose (g) difference (g) % difference
0.010 2.151 2.064 0.087 4.04
0.030 2.151 2.020 0.131 6.09
0.037 2.151 1.840 0.311 14.46
0.057 2.151 1.747 0.404 18.78
0.127 2.151 1.604 0.547 25.43
0.327 2.151 1.256 0.895 41.61
0.397 2.151 1.088 1.063 49.42
0.597 2.151 0.834 1.317 61.23
0.667 2.151 0.705 1.446 67.22
0.867 2.151 0.584 1.567 72.85

58
Test 4 FBC (M) starting tension (g) tension after dose (g) difference (g) % difference
1.00E-09 1.934 1.781 0.153 7.91
3.00E-09 1.934 1.465 0.469 24.25
1.00E-08 1.934 1.328 0.606 31.33
3.00E-08 1.934 1.259 0.675 34.90
1.00E-07 1.934 1.144 0.790 40.85
3.00E-07 1.934 0.983 0.951 49.17
1.00E-06 1.934 0.903 1.031 53.31
3.00E-06 1.934 0.682 1.252 64.74
1.00E-05 1.934 0.556 1.378 71.25
3.00E-05 1.934 0.378 1.556 80.46
DMSO Control FBC (%) starting tension (g) tension after dose (g) difference (g) % difference
0.010 1.038 0.981 0.057 5.49
0.030 1.038 0.946 0.092 8.86
0.037 1.038 0.906 0.132 12.72
0.057 1.038 0.872 0.166 15.99
0.127 1.038 0.786 0.252 24.28
0.327 1.038 0.694 0.344 33.14
0.397 1.038 0.579 0.459 44.22
0.597 1.038 0.512 0.526 50.67
0.667 1.038 0.478 0.560 53.95
0.867 1.038 0.398 0.640 61.66
Test 5 FBC (M) starting tension (g) tension after dose (g) difference (g) % difference
1.00E-09 2.170 2.067 0.103 4.75
3.00E-09 2.170 1.969 0.201 9.26
1.00E-08 2.170 1.906 0.264 12.17
3.00E-08 2.170 1.689 0.481 22.17
1.00E-07 2.170 1.497 0.673 31.01
3.00E-07 2.170 1.305 0.865 39.86
1.00E-06 2.170 1.184 0.986 45.44
3.00E-06 2.170 1.120 1.050 48.39
1.00E-05 2.170 0.851 1.319 60.78
3.00E-05 2.170 0.734 1.436 66.18

59
DMSO Control FBC (%) starting tension (g) tension after dose (g) difference (g) % difference
0.010 2.163 2.106 0.057 2.64
0.030 2.163 1.985 0.178 8.23
0.037 2.163 1.836 0.327 15.12
0.057 2.163 1.658 0.505 23.35
0.127 2.163 1.497 0.666 30.79
0.327 2.163 1.342 0.821 37.96
0.397 2.163 1.279 0.884 40.87
0.597 2.163 1.147 1.016 46.97
0.667 2.163 1.044 1.119 51.73
0.867 2.163 0.929 1.234 57.05
Test 6 FBC (M) starting tension (g) tension after dose (g) difference (g) % difference
1.00E-09 1.882 1.710 0.172 9.14
3.00E-09 1.882 1.457 0.425 22.58
1.00E-08 1.882 1.268 0.614 32.62
3.00E-08 1.882 1.187 0.695 36.93
1.00E-07 1.882 1.055 0.827 43.94
3.00E-07 1.882 0.958 0.924 49.10
1.00E-06 1.882 0.774 1.108 58.87
3.00E-06 1.882 0.602 1.280 68.01
1.00E-05 1.882 0.464 1.418 75.35
3.00E-05 1.882 0.280 1.602 85.12
DMSO Control FBC (%) starting tension (g) tension after dose (g) difference (g) % difference
0.010 1.756 1.593 0.163 9.28
0.030 1.756 1.478 0.278 15.83
0.037 1.756 1.392 0.364 20.73
0.057 1.756 1.323 0.433 24.66
0.127 1.756 1.168 0.588 33.49
0.327 1.756 1.078 0.678 38.61
0.397 1.756 0.929 0.827 47.10
0.597 1.756 0.803 0.953 54.27
0.667 1.756 0.659 1.097 62.47
0.867 1.756 0.562 1.194 68.00
60
6.5.6 MH10
Test 1 FBC (M) starting tension (g) tension after dose (g) difference (g) % difference
1.00E-09 2.116 2.072 0.044 2.08
3.00E-09 2.116 2.016 0.100 4.73
1.00E-08 2.116 1.954 0.162 7.66
3.00E-08 2.116 1.892 0.224 10.59
1.00E-07 2.116 1.718 0.398 18.81
3.00E-07 2.116 1.445 0.671 31.71
1.00E-06 2.116 1.314 0.802 37.90
3.00E-06 2.116 0.973 1.143 54.02
1.00E-05 2.116 0.731 1.385 65.45
3.00E-05 2.116 0.426 1.690 79.87
DMSO Control FBC (%) starting tension (g) tension after dose (g) difference (g) % difference
0.010 1.215 1.190 0.025 2.06
0.030 1.215 1.116 0.099 8.15
0.037 1.215 1.066 0.149 12.26
0.057 1.215 1.004 0.211 17.37
0.127 1.215 0.929 0.286 23.54
0.327 1.215 0.812 0.403 33.17
0.397 1.215 0.688 0.527 43.37
0.597 1.215 0.570 0.645 53.09
0.667 1.215 0.489 0.726 59.75
0.867 1.215 0.315 0.900 74.07
Test 2 FBC (M) starting tension (g) tension after dose (g) difference (g) % difference
1.00E-09 2.072 1.971 0.101 4.87
3.00E-09 2.072 1.898 0.174 8.40
1.00E-08 2.072 1.811 0.261 12.60
3.00E-08 2.072 1.693 0.379 18.29
1.00E-07 2.072 1.619 0.453 21.86
3.00E-07 2.072 1.271 0.801 38.66
1.00E-06 2.072 1.165 0.907 43.77
3.00E-06 2.072 0.842 1.230 59.36
1.00E-05 2.072 0.737 1.335 64.43
3.00E-05 2.072 0.389 1.683 81.23

61
DMSO Control FBC (%) starting tension (g) tension after dose (g) difference (g) % difference
0.010 1.439 1.395 0.044 3.06
0.030 1.439 1.333 0.106 7.37
0.037 1.439 1.290 0.149 10.35
0.057 1.439 1.234 0.205 14.25
0.127 1.439 1.203 0.236 16.40
0.327 1.439 1.128 0.311 21.61
0.397 1.439 1.109 0.330 22.93
0.597 1.439 0.948 0.491 34.12
0.667 1.439 0.873 0.566 39.33
0.867 1.439 0.755 0.684 47.53
Test 3 FBC (M) starting tension (g) tension after dose (g) difference (g) % difference
1.00E-09 1.855 1.824 0.031 1.67
3.00E-09 1.855 1.780 0.075 4.04
1.00E-08 1.855 1.755 0.100 5.39
3.00E-08 1.855 1.712 0.143 7.71
1.00E-07 1.855 1.563 0.292 15.74
3.00E-07 1.855 1.408 0.447 24.10
1.00E-06 1.855 1.221 0.634 34.18
3.00E-06 1.855 1.047 0.808 43.56
1.00E-05 1.855 0.923 0.932 50.24
3.00E-05 1.855 0.606 1.249 67.33
DMSO Control FBC (%) starting tension (g) tension after dose (g) difference (g) % difference
0.010 1.892 1.811 0.081 4.28
0.030 1.892 1.805 0.087 4.60
0.037 1.892 1.749 0.143 7.56
0.057 1.892 1.706 0.186 9.83
0.127 1.892 1.631 0.261 13.79
0.327 1.892 1.457 0.435 22.99
0.397 1.892 1.358 0.534 28.22
0.597 1.892 1.209 0.683 36.10
0.667 1.892 1.122 0.770 40.70
0.867 1.892 0.968 0.924 48.84

62
Test 4 FBC (M) starting tension (g) tension after dose (g) difference (g) % difference
1.00E-09 0.975 0.929 0.046 4.72
3.00E-09 0.975 0.895 0.080 8.21
1.00E-08 0.975 0.797 0.178 18.26
3.00E-08 0.975 0.717 0.258 26.46
1.00E-07 0.975 0.613 0.362 37.13
3.00E-07 0.975 0.499 0.476 48.82
1.00E-06 0.975 0.367 0.608 62.36
3.00E-06 0.975 0.235 0.740 75.90
1.00E-05 0.975 0.206 0.769 78.87
3.00E-05 0.975 0.091 0.884 90.67
DMSO Control FBC (%) starting tension (g) tension after dose (g) difference (g) % difference
0.010 1.354 1.303 0.052 3.80
0.030 1.354 1.216 0.138 10.19
0.037 1.354 1.124 0.230 16.99
0.057 1.354 1.055 0.299 22.08
0.127 1.354 0.935 0.419 30.95
0.327 1.354 0.728 0.626 46.23
0.397 1.354 0.596 0.758 55.98
0.597 1.354 0.510 0.844 62.33
0.667 1.354 0.441 0.913 67.43
0.867 1.354 0.372 0.982 72.53
Test 5 FBC (M) starting tension (g) tension after dose (g) difference (g) % difference
1.00E-09 1.262 1.187 0.075 5.94
3.00E-09 1.262 1.141 0.121 9.59
1.00E-08 1.262 0.963 0.299 23.69
3.00E-08 1.262 0.906 0.356 28.21
1.00E-07 1.262 0.861 0.401 31.77
3.00E-07 1.262 0.774 0.488 38.67
1.00E-06 1.262 0.675 0.587 46.51
3.00E-06 1.262 0.550 0.712 56.42
1.00E-05 1.262 0.441 0.821 65.06
3.00E-05 1.262 0.286 0.976 77.34

63
DMSO Control FBC (%) starting tension (g) tension after dose (g) difference (g) % difference
0.010 0.986 0.946 0.040 4.06
0.030 0.986 0.912 0.074 7.51
0.037 0.986 0.889 0.097 9.84
0.057 0.986 0.805 0.181 18.36
0.127 0.986 0.797 0.189 19.17
0.327 0.986 0.681 0.305 30.93
0.397 0.986 0.613 0.373 37.83
0.597 0.986 0.499 0.487 49.39
0.667 0.986 0.447 0.539 54.67
0.867 0.986 0.367 0.619 62.78
Test 6 FBC (M) starting tension (g) tension after dose (g) difference (g) % difference
1.00E-09 0.986 0.952 0.034 3.45
3.00E-09 0.986 0.895 0.091 9.23
1.00E-08 0.986 0.866 0.120 12.17
3.00E-08 0.986 0.803 0.183 18.56
1.00E-07 0.986 0.751 0.235 23.83
3.00E-07 0.986 0.608 0.378 38.34
1.00E-06 0.986 0.527 0.459 46.55
3.00E-06 0.986 0.412 0.574 58.22
1.00E-05 0.986 0.338 0.648 65.72
3.00E-05 0.986 0.114 0.872 88.41
DMSO Control FBC (%) starting tension (g) tension after dose (g) difference (g) % difference
0.010 1.027 0.981 0.046 4.48
0.030 1.027 0.929 0.098 9.54
0.037 1.027 0.895 0.132 12.85
0.057 1.027 0.843 0.184 17.92
0.127 1.027 0.814 0.213 20.74
0.327 1.027 0.722 0.305 29.70
0.397 1.027 0.659 0.368 35.83
0.597 1.027 0.544 0.483 47.03
0.667 1.027 0.487 0.540 52.58
0.867 1.027 0.412 0.615 59.88

64
6.6 Appendix 6 - PK11195 raw data
Test 1 starting tension (g) Time after (s) tension after dose (g) difference (g) % difference
2.411 10 2.273 0.138 5.72
2.411 20 1.927 0.484 20.07
2.411 30 1.736 0.675 28.00
2.411 40 1.610 0.801 33.22
2.411 50 1.383 1.028 42.64
2.411 60 1.294 1.117 46.33
PK11195 added
2.411 70 1.244 1.167 48.40
2.411 80 0.944 1.467 60.85
2.411 90 0.679 1.732 71.84
2.411 100 0.571 1.840 76.32
2.411 110 0.428 1.983 82.25
2.411 120 0.368 2.043 84.74
Test 2 starting tension (g) Time after (s) tension after dose (g) difference (g) % difference
0.900 10 0.682 0.218 24.22
0.900 20 0.579 0.321 35.67
0.900 30 0.521 0.379 42.11
0.900 40 0.464 0.436 48.44
0.900 50 0.342 0.558 62.00
0.900 60 0.294 0.606 67.33
PK11195 added
0.900 70 0.265 0.635 70.56
0.900 80 0.118 0.782 86.89
0.900 90 0.021 0.879 97.67
0.900 100 0.015 0.885 98.33
0.900 110 0.010 0.890 98.89
0.900 120 0.003 0.897 99.67


![Kinetic analysis of the translocator protein positron ... GE18… · Kinetic analysis of the translocator protein positron emission tomography ligand [18F]GE-180 in the human brain](https://img.pdfslide.us/doc/110x75/5f06d7fa7e708231d41a03eb/kinetic-analysis-of-the-translocator-protein-positron-ge18-kinetic-analysis.jpg)