Embed Size (px)
Citation preview
J. Dairy Sci. 86:2525–2536© American Dairy Science Association, 2003.
Determining Effects of Freezing on Pasta Filata and Non-Pasta FilataMozzarella Cheeses by Nuclear Magnetic Resonance Imaging
M.-I. Kuo, M. E. Anderson,1 and S. GunasekaranDepartment of Biological Systems Engineering,460 Henry Mall,University of Wisconsin-Madison, Madison, WI 53706
ABSTRACT
The formation of ice during freezing of pasta filataand non-pasta filata Mozzarella cheeses, and the spa-tial redistribution of water T2 relaxation time and thechanges of water self-diffusion coefficient (D) withinthe unfrozen and frozen-stored cheese samples wereobserved by nuclear magnetic resonance imaging. Im-ages of water spin number density and water T2 relax-ation time were obtained using spin-echo imagingpulse sequence. The water self-diffusion coefficientwas measured by pulsed-field gradient spin-echo tech-nique. The ice formation was accompanied by loss ofsignal intensity in the affected areas of the cheesesample. There was a significant change in T2 and Dvalues of water following freezing-thawing, which canbe used to characterize the effect of freezing oncheeses. The D values of the frozen-stored pasta filataMozzarella cheese samples were higher than those forthe unfrozen samples. Such a difference was not ob-served for the non-pasta filata Mozzarella cheese sam-ples. The T2 distributions of frozen-stored pasta filataMozzarella cheese samples were narrower, and thosefor the non-pasta filata Mozzarella cheese sampleswere broader T2. This may be attributed to the micro-structure differences between the two cheeses.(Key words: Mozzarella cheese, T2 relaxation, self-diffusion coefficient, MRI)
Abbreviation key: FOV = field of view, LMPS = low-moisture, part-skim, MRI = magnetic resonance im-aging, NMR = nuclear magnetic resonance, PGSE =pulsed-field gradient spin-echo, SEM = scanning elec-tron microscopy, TE = echo-delay time, TR = repeti-tion time.
Received October 2, 2002.Accepted February 27, 2003.Corresponding author: S. Gunasekaran; e-mail: [email protected] Magnetic Resonance Facility at Madison (NMRFAM),
Biochemistry Department, 433 Babcock Drive, University of Wiscon-sin-Madison, Madison, WI 53706.
2525
INTRODUCTION
Freezing of block and shredded Mozzarella cheesesoon after its manufacture is preferred to improvecheese production and handling. Although freezing iseffective in extending the shelf-life and preserving thecolor, flavor, and nutritive value of many foods, freez-ing of cheeses presents problems. There have beenseveral studies on frozen storage of Mozzarella cheeseto ascertain if the cheese can be frozen, how long thefrozen cheese can be stored, and what physical or tex-tural changes result (Dahlstrom, 1978; Cervantes etal., 1983; Oberg et al., 1992; Diefes et al., 1993; Bertolaet al., 1996). These studies indicate that freezing,thawing, and frozen storage modifies physical proper-ties of Mozzarella cheese. Relatively few investiga-tions into the effect of freezing on physicochemicalcharacteristics and microstructure of cheese have beencarried out (Fontecha et al., 1994, 1996; Perez-Mu-nuera et al., 1999; Tejada et al., 2002), and those perti-nent to Mozzarella cheese are scarce (Kuo, 2001; Kuoand Gunasekaran, 2003). It is believed that thechanges in the physical states of water (i.e., character-istics of molecular motion of water or water mobility)and cheese microstructure after a freeze-thaw cycleinfluence cheese quality and functional properties(Kuo and Gunasekaran, 2003).
Nuclear magnetic resonance (NMR) and magneticresonance imaging (MRI) can be used to detect freez-ing and thawing related changes in foods (Duce et al.1992). The MRI is developed as a noninvasive andnondestructive method for routine use in medical re-search and diagnosis and has great potential for usein food science (Hills, 1995; Schmidt et al., 1996). De-pending on the imaging protocol, we can obtain mapsof spatial distribution of NMR parameters such as spinnumber density, spin-lattice relaxation time (T1) andspin-spin (T2) relaxation time, magnetization transferrates, chemical shifts, self-diffusion coefficient (D),and velocity flow rates from a defined region within alarge sample.
A number of reports have discussed the use of MRIto study changes following freezing of foods. Duce et al.
KUO ET AL.2526
(1992) investigated the effect of freezing on courgetteusing MRI. They found qualitative changes in imagesof courgette before and after freezing and thawing.Freezing ruptured the cell walls and altered the tissuemorphology, which in turn affected the transverse re-laxation time of water protons in the tissue, and thusthe image contrast. Gamble (1994) used MRI to studythe distribution of water and sugar in blueberries andchanges in relaxation times before and after freezing/thawing. Kerr et al. (1997) investigated whether freezedamage of kiwifruit could be detected and related tochanges in various properties measured by NMR (i.e.,changes in NMR relaxation parameters and diffusionof water molecules). The T2 relaxation of water wasfaster, and the water self-diffusion coefficient wasgreater in frozen-thawed fruit than in fresh fruit. Theyexplained that water is no longer confined to the fruitcell after cell dehydration and rupture by freezing andthawing, thus the effect of cell relaxation is dimin-ished, and the water diffusion is more rapid in thefreeze-thawed samples. They concluded that the sig-nificant changes in T2 relaxation and diffusion proper-ties following freezing has implications for designs foronline sensors assessing fruit quality.
In recent years, MRI techniques have been appliedto characterize the freezing process (Kerr et al., 1996,1997, 1998). Advances in MRI have made it possible toview phase transitions in vivo (McCarthy and Kouten,1990; McCarthy, 1994). Loss of proton mobility duringphase transitions results in a decrease in signal inten-sity, i.e., a decrease in signal intensity for water withina given volume element during freezing is indicativeof transition from liquid to solid state. It is desirableto observe food freezing noninvasively and in real time.Visualizing ice formation would allow monitoring thefreezing rate and determining when freezing iscomplete.
Our objectives were to use MRI and NMR to: 1)follow formation of ice in pasta filata and non-pastafilata Mozzarella cheeses during freezing by mappingthe distribution of water and 2) study the effect offreezing on structure and mobility of water in pastafilata and non-pasta filata Mozzarella cheeses throughobserved changes in T2 relaxation time and self-diffu-sion coefficient of water molecules.
MATERIALS AND METHODS
Cheese Making and Experimental Protocol
Low-moisture, part-skim (LMPS) pasta filata andnon-pasta filata Mozzarella cheeses were manufac-tured in the Wisconsin Center for Dairy Research pilotplant at University of Wisconsin-Madison. The makeprocedures for the cheeses and the methods of their
Journal of Dairy Science Vol. 86, No. 8, 2003
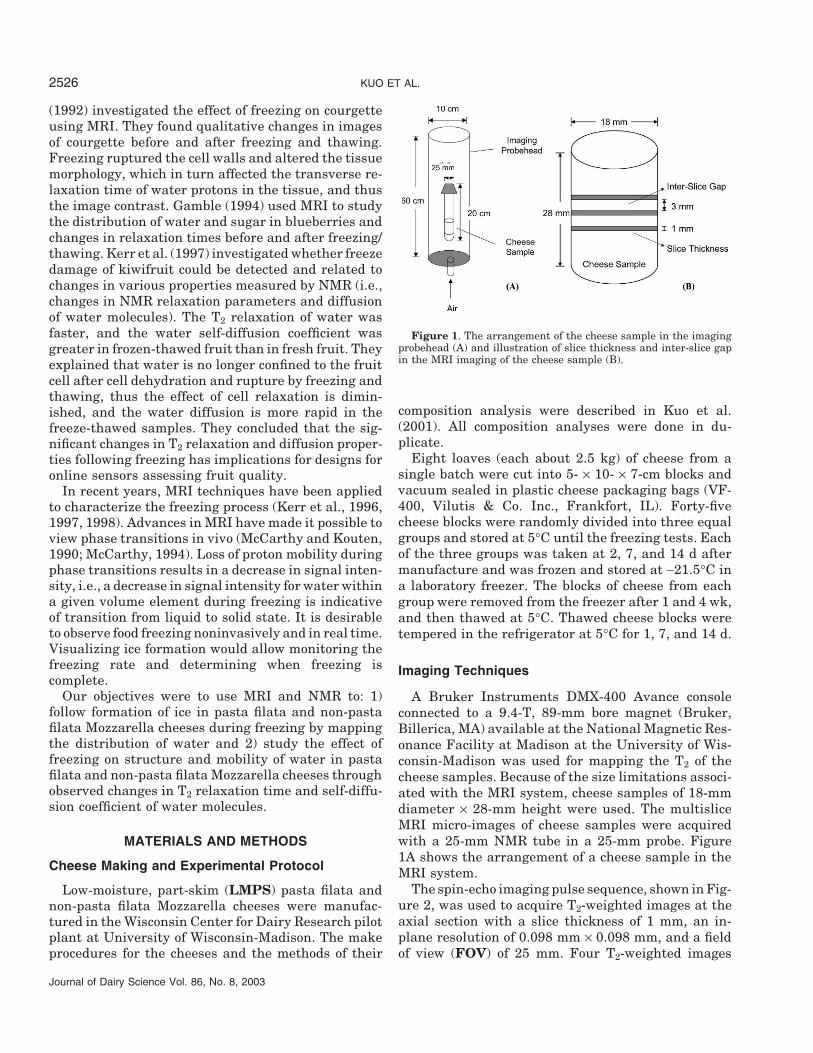
Figure 1. The arrangement of the cheese sample in the imagingprobehead (A) and illustration of slice thickness and inter-slice gapin the MRI imaging of the cheese sample (B).
composition analysis were described in Kuo et al.(2001). All composition analyses were done in du-plicate.
Eight loaves (each about 2.5 kg) of cheese from asingle batch were cut into 5- × 10- × 7-cm blocks andvacuum sealed in plastic cheese packaging bags (VF-400, Vilutis & Co. Inc., Frankfort, IL). Forty-fivecheese blocks were randomly divided into three equalgroups and stored at 5°C until the freezing tests. Eachof the three groups was taken at 2, 7, and 14 d aftermanufacture and was frozen and stored at −21.5°C ina laboratory freezer. The blocks of cheese from eachgroup were removed from the freezer after 1 and 4 wk,and then thawed at 5°C. Thawed cheese blocks weretempered in the refrigerator at 5°C for 1, 7, and 14 d.
Imaging Techniques
A Bruker Instruments DMX-400 Avance consoleconnected to a 9.4-T, 89-mm bore magnet (Bruker,Billerica, MA) available at the National Magnetic Res-onance Facility at Madison at the University of Wis-consin-Madison was used for mapping the T2 of thecheese samples. Because of the size limitations associ-ated with the MRI system, cheese samples of 18-mmdiameter × 28-mm height were used. The multisliceMRI micro-images of cheese samples were acquiredwith a 25-mm NMR tube in a 25-mm probe. Figure1A shows the arrangement of a cheese sample in theMRI system.
The spin-echo imaging pulse sequence, shown in Fig-ure 2, was used to acquire T2-weighted images at theaxial section with a slice thickness of 1 mm, an in-plane resolution of 0.098 mm × 0.098 mm, and a fieldof view (FOV) of 25 mm. Four T2-weighted images
EFFECT OF FREEZING ON MOZZARELLA CHEESE 2527
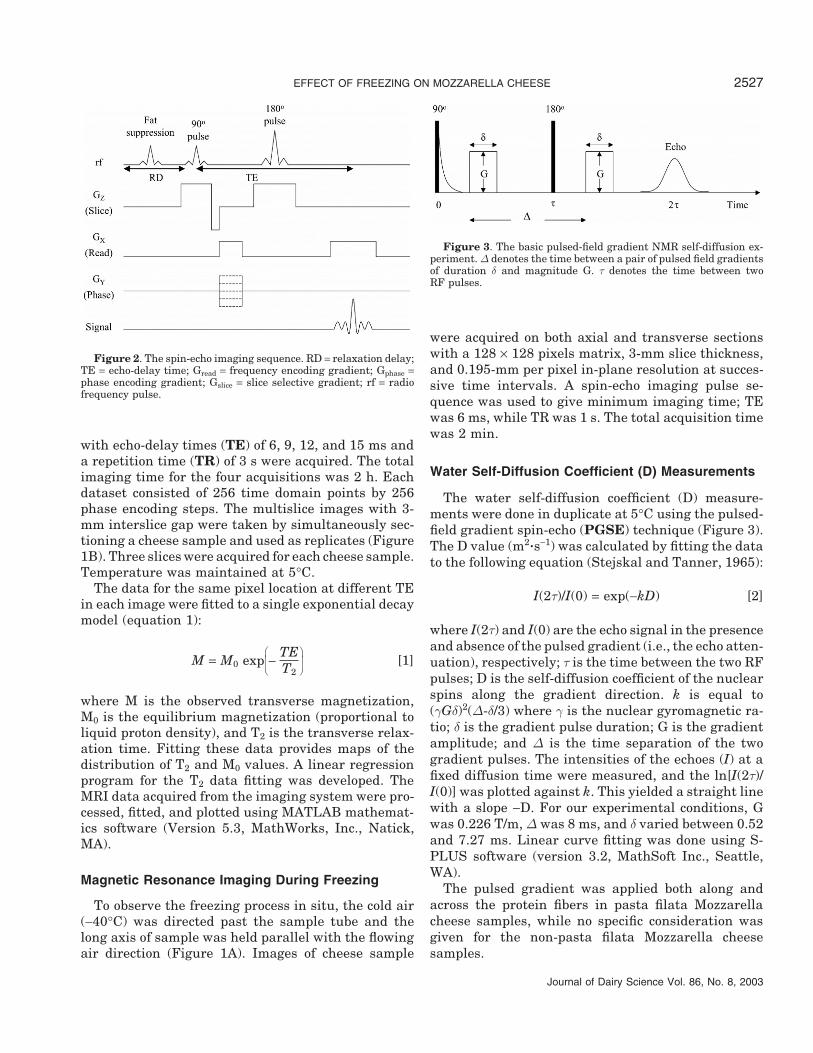
Figure 2. The spin-echo imaging sequence. RD = relaxation delay;TE = echo-delay time; Gread = frequency encoding gradient; Gphase =phase encoding gradient; Gslice = slice selective gradient; rf = radiofrequency pulse.
with echo-delay times (TE) of 6, 9, 12, and 15 ms anda repetition time (TR) of 3 s were acquired. The totalimaging time for the four acquisitions was 2 h. Eachdataset consisted of 256 time domain points by 256phase encoding steps. The multislice images with 3-mm interslice gap were taken by simultaneously sec-tioning a cheese sample and used as replicates (Figure1B). Three slices were acquired for each cheese sample.Temperature was maintained at 5°C.
The data for the same pixel location at different TEin each image were fitted to a single exponential decaymodel (equation 1):
M = M0 exp⎛⎜⎝− TE
T2
⎞⎟⎠
[1]
where M is the observed transverse magnetization,M0 is the equilibrium magnetization (proportional toliquid proton density), and T2 is the transverse relax-ation time. Fitting these data provides maps of thedistribution of T2 and M0 values. A linear regressionprogram for the T2 data fitting was developed. TheMRI data acquired from the imaging system were pro-cessed, fitted, and plotted using MATLAB mathemat-ics software (Version 5.3, MathWorks, Inc., Natick,MA).
Magnetic Resonance Imaging During Freezing
To observe the freezing process in situ, the cold air(−40°C) was directed past the sample tube and thelong axis of sample was held parallel with the flowingair direction (Figure 1A). Images of cheese sample
Journal of Dairy Science Vol. 86, No. 8, 2003
Figure 3. The basic pulsed-field gradient NMR self-diffusion ex-periment. Δ denotes the time between a pair of pulsed field gradientsof duration δ and magnitude G. τ denotes the time between twoRF pulses.
were acquired on both axial and transverse sectionswith a 128 × 128 pixels matrix, 3-mm slice thickness,and 0.195-mm per pixel in-plane resolution at succes-sive time intervals. A spin-echo imaging pulse se-quence was used to give minimum imaging time; TEwas 6 ms, while TR was 1 s. The total acquisition timewas 2 min.
Water Self-Diffusion Coefficient (D) Measurements
The water self-diffusion coefficient (D) measure-ments were done in duplicate at 5°C using the pulsed-field gradient spin-echo (PGSE) technique (Figure 3).The D value (m2�s−1) was calculated by fitting the datato the following equation (Stejskal and Tanner, 1965):
I(2τ)/I(0) = exp(−kD) [2]
where I(2τ) and I(0) are the echo signal in the presenceand absence of the pulsed gradient (i.e., the echo atten-uation), respectively; τ is the time between the two RFpulses; D is the self-diffusion coefficient of the nuclearspins along the gradient direction. k is equal to(γGδ)2(Δ-δ/3) where γ is the nuclear gyromagnetic ra-tio; δ is the gradient pulse duration; G is the gradientamplitude; and Δ is the time separation of the twogradient pulses. The intensities of the echoes (I) at afixed diffusion time were measured, and the ln[I(2τ)/I(0)] was plotted against k. This yielded a straight linewith a slope −D. For our experimental conditions, Gwas 0.226 T/m, Δ was 8 ms, and δ varied between 0.52and 7.27 ms. Linear curve fitting was done using S-PLUS software (version 3.2, MathSoft Inc., Seattle,WA).
The pulsed gradient was applied both along andacross the protein fibers in pasta filata Mozzarellacheese samples, while no specific consideration wasgiven for the non-pasta filata Mozzarella cheesesamples.
KUO ET AL.2528
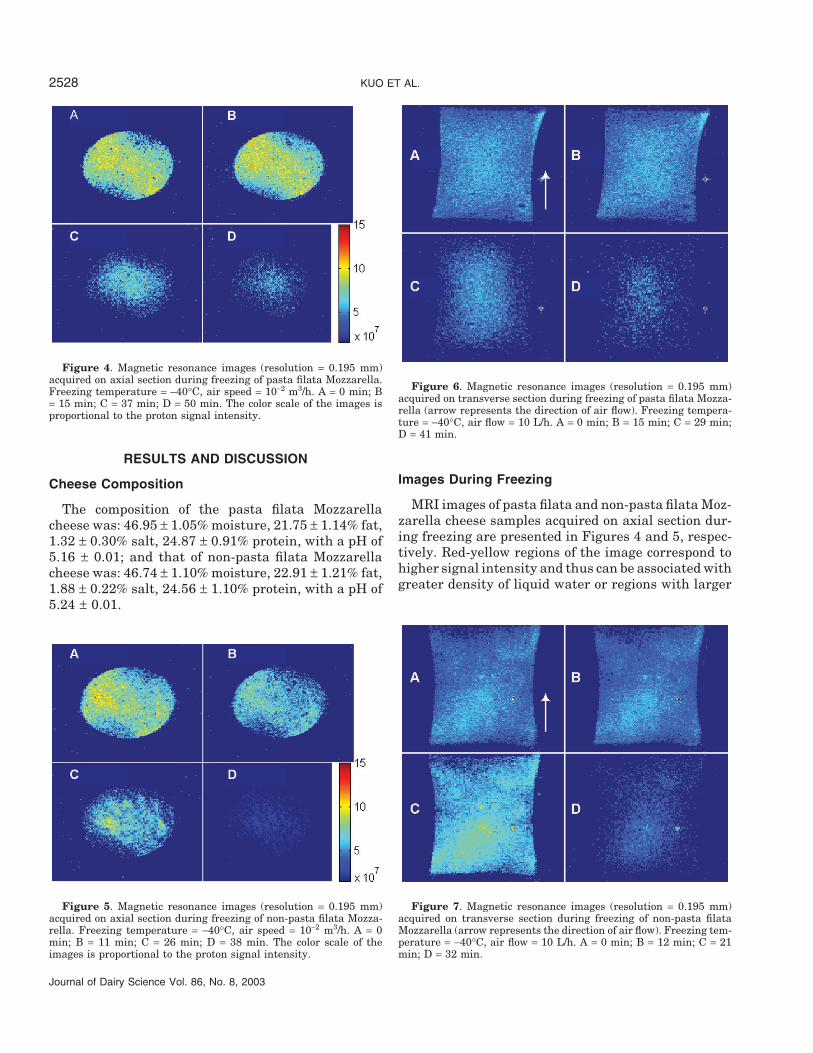
Figure 4. Magnetic resonance images (resolution = 0.195 mm)acquired on axial section during freezing of pasta filata Mozzarella.Freezing temperature = −40°C, air speed = 10−2 m3/h. A = 0 min; B= 15 min; C = 37 min; D = 50 min. The color scale of the images isproportional to the proton signal intensity.
RESULTS AND DISCUSSION
Cheese Composition
The composition of the pasta filata Mozzarellacheese was: 46.95 ± 1.05% moisture, 21.75 ± 1.14% fat,1.32 ± 0.30% salt, 24.87 ± 0.91% protein, with a pH of5.16 ± 0.01; and that of non-pasta filata Mozzarellacheese was: 46.74 ± 1.10% moisture, 22.91 ± 1.21% fat,1.88 ± 0.22% salt, 24.56 ± 1.10% protein, with a pH of5.24 ± 0.01.
Figure 5. Magnetic resonance images (resolution = 0.195 mm)acquired on axial section during freezing of non-pasta filata Mozza-rella. Freezing temperature = −40°C, air speed = 10−2 m3/h. A = 0min; B = 11 min; C = 26 min; D = 38 min. The color scale of theimages is proportional to the proton signal intensity.
Journal of Dairy Science Vol. 86, No. 8, 2003
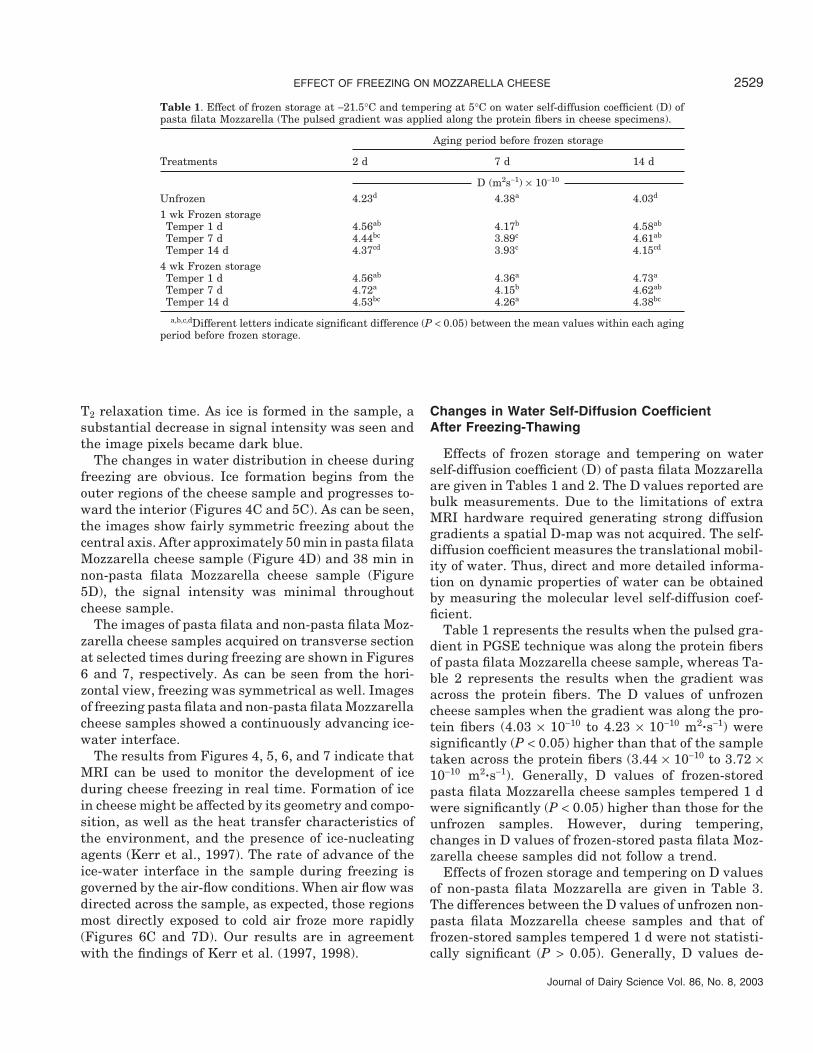
Figure 6. Magnetic resonance images (resolution = 0.195 mm)acquired on transverse section during freezing of pasta filata Mozza-rella (arrow represents the direction of air flow). Freezing tempera-ture = −40°C, air flow = 10 L/h. A = 0 min; B = 15 min; C = 29 min;D = 41 min.
Images During Freezing
MRI images of pasta filata and non-pasta filata Moz-zarella cheese samples acquired on axial section dur-ing freezing are presented in Figures 4 and 5, respec-tively. Red-yellow regions of the image correspond tohigher signal intensity and thus can be associated withgreater density of liquid water or regions with larger
Figure 7. Magnetic resonance images (resolution = 0.195 mm)acquired on transverse section during freezing of non-pasta filataMozzarella (arrow represents the direction of air flow). Freezing tem-perature = −40°C, air flow = 10 L/h. A = 0 min; B = 12 min; C = 21min; D = 32 min.
EFFECT OF FREEZING ON MOZZARELLA CHEESE 2529
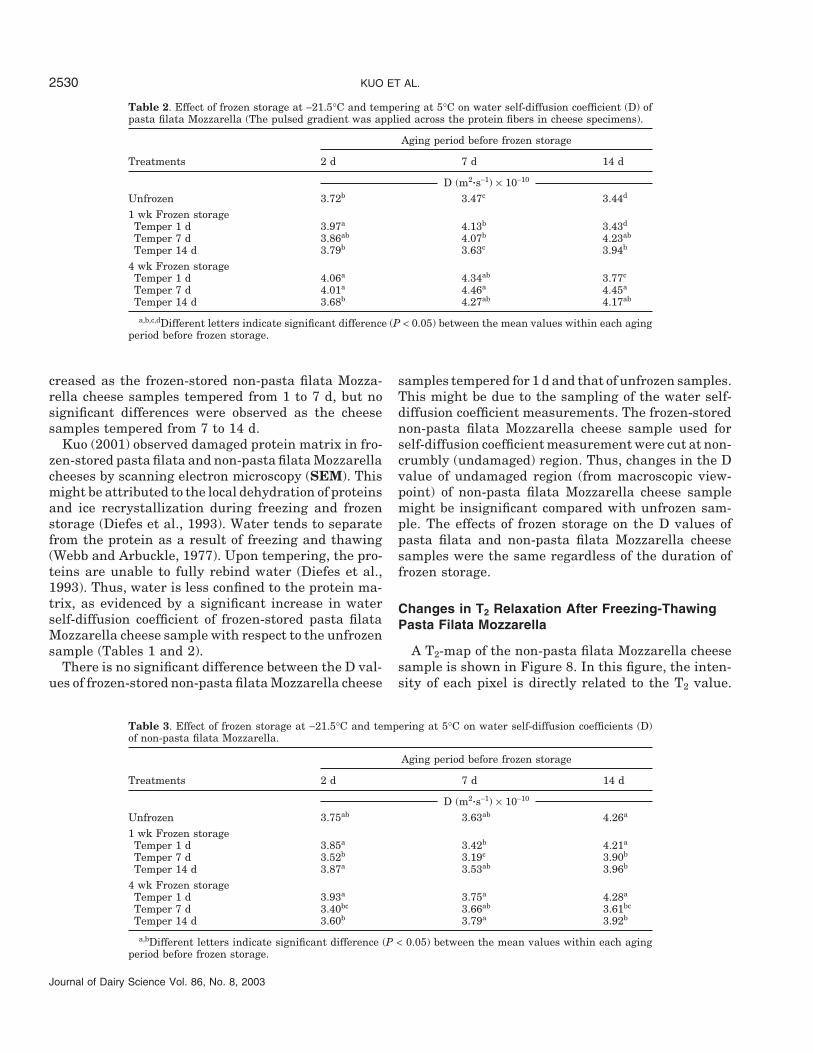
Table 1. Effect of frozen storage at −21.5°C and tempering at 5°C on water self-diffusion coefficient (D) ofpasta filata Mozzarella (The pulsed gradient was applied along the protein fibers in cheese specimens).
Aging period before frozen storage
Treatments 2 d 7 d 14 d
D (m2s−1) × 10−10
Unfrozen 4.23d 4.38a 4.03d
1 wk Frozen storageTemper 1 d 4.56ab 4.17b 4.58ab
Temper 7 d 4.44bc 3.89c 4.61ab
Temper 14 d 4.37cd 3.93c 4.15cd
4 wk Frozen storageTemper 1 d 4.56ab 4.36a 4.73a
Temper 7 d 4.72a 4.15b 4.62ab
Temper 14 d 4.53bc 4.26a 4.38bc
a,b,c,dDifferent letters indicate significant difference (P < 0.05) between the mean values within each agingperiod before frozen storage.
T2 relaxation time. As ice is formed in the sample, asubstantial decrease in signal intensity was seen andthe image pixels became dark blue.
The changes in water distribution in cheese duringfreezing are obvious. Ice formation begins from theouter regions of the cheese sample and progresses to-ward the interior (Figures 4C and 5C). As can be seen,the images show fairly symmetric freezing about thecentral axis. After approximately 50 min in pasta filataMozzarella cheese sample (Figure 4D) and 38 min innon-pasta filata Mozzarella cheese sample (Figure5D), the signal intensity was minimal throughoutcheese sample.
The images of pasta filata and non-pasta filata Moz-zarella cheese samples acquired on transverse sectionat selected times during freezing are shown in Figures6 and 7, respectively. As can be seen from the hori-zontal view, freezing was symmetrical as well. Imagesof freezing pasta filata and non-pasta filata Mozzarellacheese samples showed a continuously advancing ice-water interface.
The results from Figures 4, 5, 6, and 7 indicate thatMRI can be used to monitor the development of iceduring cheese freezing in real time. Formation of icein cheese might be affected by its geometry and compo-sition, as well as the heat transfer characteristics ofthe environment, and the presence of ice-nucleatingagents (Kerr et al., 1997). The rate of advance of theice-water interface in the sample during freezing isgoverned by the air-flow conditions. When air flow wasdirected across the sample, as expected, those regionsmost directly exposed to cold air froze more rapidly(Figures 6C and 7D). Our results are in agreementwith the findings of Kerr et al. (1997, 1998).
Journal of Dairy Science Vol. 86, No. 8, 2003
Changes in Water Self-Diffusion CoefficientAfter Freezing-Thawing
Effects of frozen storage and tempering on waterself-diffusion coefficient (D) of pasta filata Mozzarellaare given in Tables 1 and 2. The D values reported arebulk measurements. Due to the limitations of extraMRI hardware required generating strong diffusiongradients a spatial D-map was not acquired. The self-diffusion coefficient measures the translational mobil-ity of water. Thus, direct and more detailed informa-tion on dynamic properties of water can be obtainedby measuring the molecular level self-diffusion coef-ficient.
Table 1 represents the results when the pulsed gra-dient in PGSE technique was along the protein fibersof pasta filata Mozzarella cheese sample, whereas Ta-ble 2 represents the results when the gradient wasacross the protein fibers. The D values of unfrozencheese samples when the gradient was along the pro-tein fibers (4.03 × 10⁻¹⁰ to 4.23 × 10⁻¹⁰ m2�s−1) weresignificantly (P < 0.05) higher than that of the sampletaken across the protein fibers (3.44 × 10⁻¹⁰ to 3.72 ×10⁻¹⁰ m2�s−1). Generally, D values of frozen-storedpasta filata Mozzarella cheese samples tempered 1 dwere significantly (P < 0.05) higher than those for theunfrozen samples. However, during tempering,changes in D values of frozen-stored pasta filata Moz-zarella cheese samples did not follow a trend.
Effects of frozen storage and tempering on D valuesof non-pasta filata Mozzarella are given in Table 3.The differences between the D values of unfrozen non-pasta filata Mozzarella cheese samples and that offrozen-stored samples tempered 1 d were not statisti-cally significant (P > 0.05). Generally, D values de-
KUO ET AL.2530
Table 2. Effect of frozen storage at −21.5°C and tempering at 5°C on water self-diffusion coefficient (D) ofpasta filata Mozzarella (The pulsed gradient was applied across the protein fibers in cheese specimens).
Aging period before frozen storage
Treatments 2 d 7 d 14 d
D (m2�s−1) × 10−10
Unfrozen 3.72b 3.47c 3.44d
1 wk Frozen storageTemper 1 d 3.97a 4.13b 3.43d
Temper 7 d 3.86ab 4.07b 4.23ab
Temper 14 d 3.79b 3.63c 3.94b
4 wk Frozen storageTemper 1 d 4.06a 4.34ab 3.77c
Temper 7 d 4.01a 4.46a 4.45a
Temper 14 d 3.68b 4.27ab 4.17ab
a,b,c,dDifferent letters indicate significant difference (P < 0.05) between the mean values within each agingperiod before frozen storage.
creased as the frozen-stored non-pasta filata Mozza-rella cheese samples tempered from 1 to 7 d, but nosignificant differences were observed as the cheesesamples tempered from 7 to 14 d.
Kuo (2001) observed damaged protein matrix in fro-zen-stored pasta filata and non-pasta filata Mozzarellacheeses by scanning electron microscopy (SEM). Thismight be attributed to the local dehydration of proteinsand ice recrystallization during freezing and frozenstorage (Diefes et al., 1993). Water tends to separatefrom the protein as a result of freezing and thawing(Webb and Arbuckle, 1977). Upon tempering, the pro-teins are unable to fully rebind water (Diefes et al.,1993). Thus, water is less confined to the protein ma-trix, as evidenced by a significant increase in waterself-diffusion coefficient of frozen-stored pasta filataMozzarella cheese sample with respect to the unfrozensample (Tables 1 and 2).
There is no significant difference between the D val-ues of frozen-stored non-pasta filata Mozzarella cheese
Table 3. Effect of frozen storage at −21.5°C and tempering at 5°C on water self-diffusion coefficients (D)of non-pasta filata Mozzarella.
Aging period before frozen storage
Treatments 2 d 7 d 14 d
D (m2�s−1) × 10−10
Unfrozen 3.75ab 3.63ab 4.26a
1 wk Frozen storageTemper 1 d 3.85a 3.42b 4.21a
Temper 7 d 3.52b 3.19c 3.90b
Temper 14 d 3.87a 3.53ab 3.96b
4 wk Frozen storageTemper 1 d 3.93a 3.75a 4.28a
Temper 7 d 3.40bc 3.66ab 3.61bc
Temper 14 d 3.60b 3.79a 3.92b
a,bDifferent letters indicate significant difference (P < 0.05) between the mean values within each agingperiod before frozen storage.
Journal of Dairy Science Vol. 86, No. 8, 2003
samples tempered for 1 d and that of unfrozen samples.This might be due to the sampling of the water self-diffusion coefficient measurements. The frozen-storednon-pasta filata Mozzarella cheese sample used forself-diffusion coefficient measurement were cut at non-crumbly (undamaged) region. Thus, changes in the Dvalue of undamaged region (from macroscopic view-point) of non-pasta filata Mozzarella cheese samplemight be insignificant compared with unfrozen sam-ple. The effects of frozen storage on the D values ofpasta filata and non-pasta filata Mozzarella cheesesamples were the same regardless of the duration offrozen storage.
Changes in T2 Relaxation After Freezing-ThawingPasta Filata Mozzarella
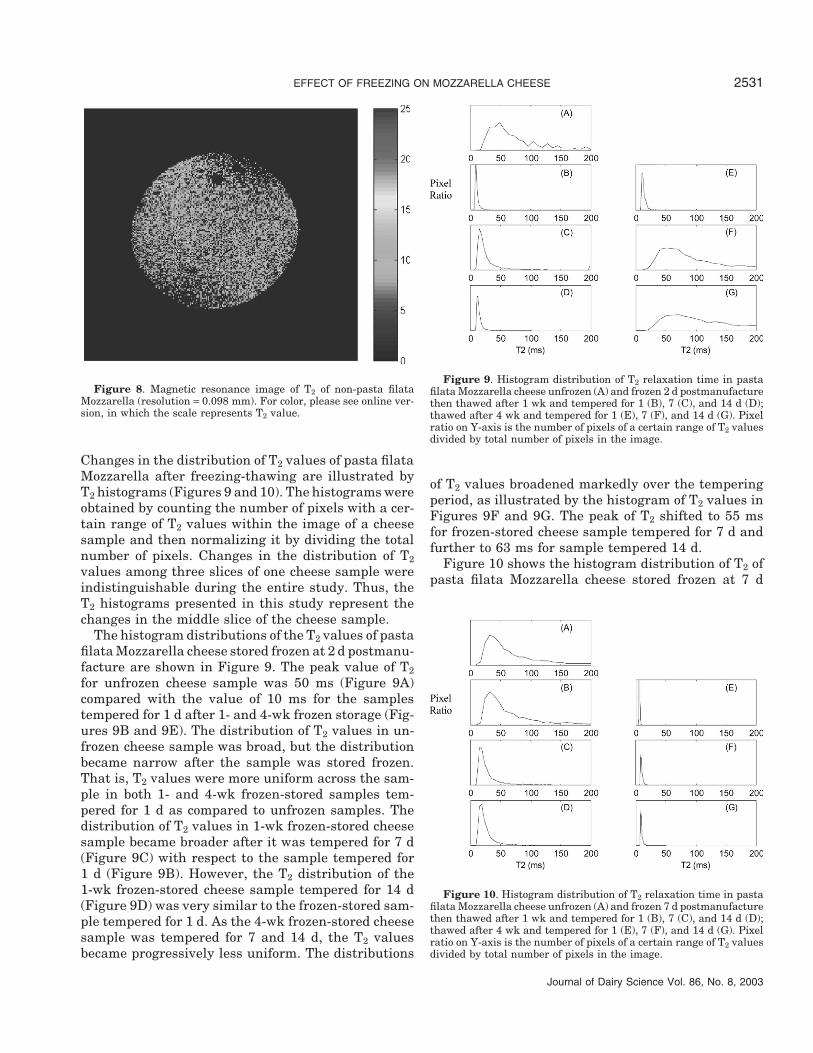
A T2-map of the non-pasta filata Mozzarella cheesesample is shown in Figure 8. In this figure, the inten-sity of each pixel is directly related to the T2 value.
EFFECT OF FREEZING ON MOZZARELLA CHEESE 2531
Figure 8. Magnetic resonance image of T2 of non-pasta filataMozzarella (resolution = 0.098 mm). For color, please see online ver-sion, in which the scale represents T2 value.
Changes in the distribution of T2 values of pasta filataMozzarella after freezing-thawing are illustrated byT2 histograms (Figures 9 and 10). The histograms wereobtained by counting the number of pixels with a cer-tain range of T2 values within the image of a cheesesample and then normalizing it by dividing the totalnumber of pixels. Changes in the distribution of T2values among three slices of one cheese sample wereindistinguishable during the entire study. Thus, theT2 histograms presented in this study represent thechanges in the middle slice of the cheese sample.
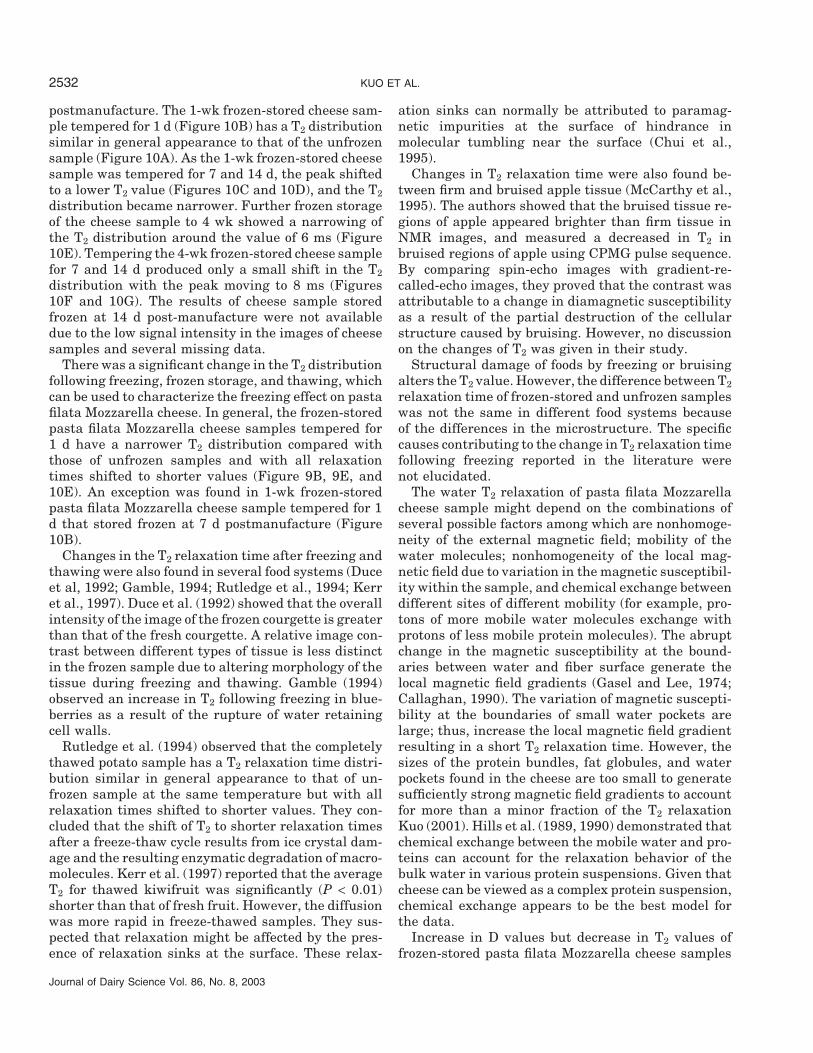
The histogram distributions of the T2 values of pastafilata Mozzarella cheese stored frozen at 2 d postmanu-facture are shown in Figure 9. The peak value of T2for unfrozen cheese sample was 50 ms (Figure 9A)compared with the value of 10 ms for the samplestempered for 1 d after 1- and 4-wk frozen storage (Fig-ures 9B and 9E). The distribution of T2 values in un-frozen cheese sample was broad, but the distributionbecame narrow after the sample was stored frozen.That is, T2 values were more uniform across the sam-ple in both 1- and 4-wk frozen-stored samples tem-pered for 1 d as compared to unfrozen samples. Thedistribution of T2 values in 1-wk frozen-stored cheesesample became broader after it was tempered for 7 d(Figure 9C) with respect to the sample tempered for1 d (Figure 9B). However, the T2 distribution of the1-wk frozen-stored cheese sample tempered for 14 d(Figure 9D) was very similar to the frozen-stored sam-ple tempered for 1 d. As the 4-wk frozen-stored cheesesample was tempered for 7 and 14 d, the T2 valuesbecame progressively less uniform. The distributions
Journal of Dairy Science Vol. 86, No. 8, 2003
Figure 9. Histogram distribution of T2 relaxation time in pastafilata Mozzarella cheese unfrozen (A) and frozen 2 d postmanufacturethen thawed after 1 wk and tempered for 1 (B), 7 (C), and 14 d (D);thawed after 4 wk and tempered for 1 (E), 7 (F), and 14 d (G). Pixelratio on Y-axis is the number of pixels of a certain range of T2 valuesdivided by total number of pixels in the image.
of T2 values broadened markedly over the temperingperiod, as illustrated by the histogram of T2 values inFigures 9F and 9G. The peak of T2 shifted to 55 msfor frozen-stored cheese sample tempered for 7 d andfurther to 63 ms for sample tempered 14 d.
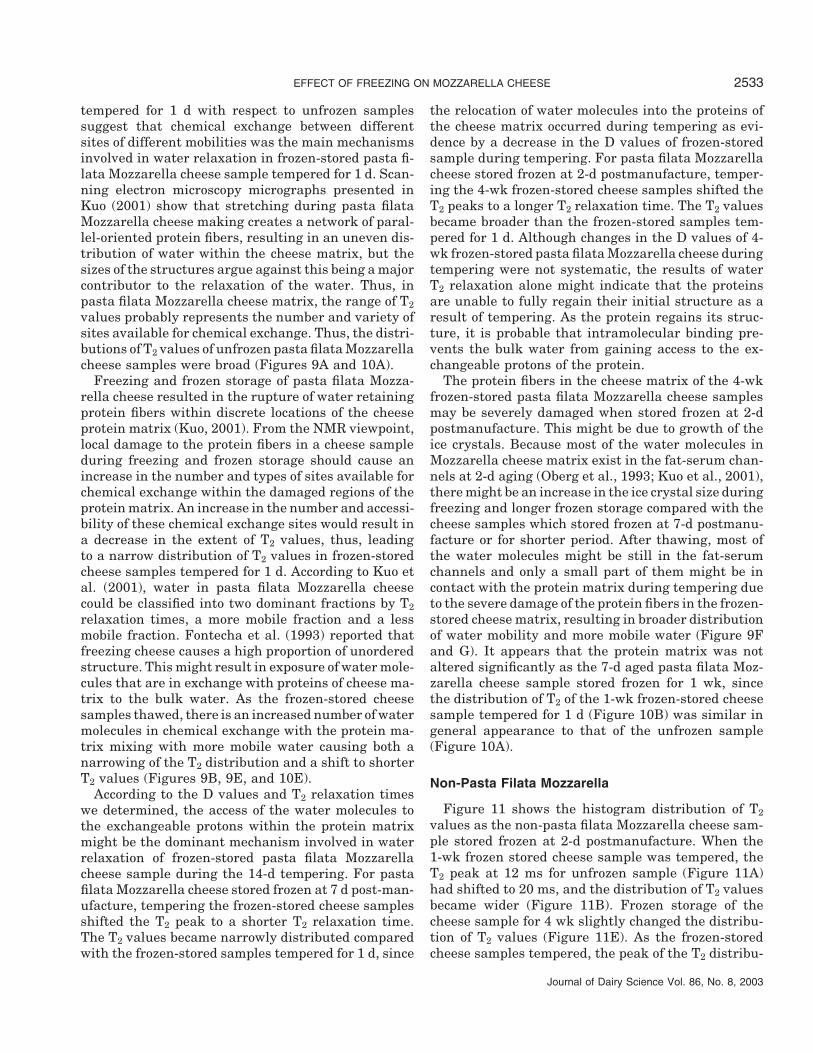
Figure 10 shows the histogram distribution of T2 ofpasta filata Mozzarella cheese stored frozen at 7 d
Figure 10. Histogram distribution of T2 relaxation time in pastafilata Mozzarella cheese unfrozen (A) and frozen 7 d postmanufacturethen thawed after 1 wk and tempered for 1 (B), 7 (C), and 14 d (D);thawed after 4 wk and tempered for 1 (E), 7 (F), and 14 d (G). Pixelratio on Y-axis is the number of pixels of a certain range of T2 valuesdivided by total number of pixels in the image.
KUO ET AL.2532
postmanufacture. The 1-wk frozen-stored cheese sam-ple tempered for 1 d (Figure 10B) has a T2 distributionsimilar in general appearance to that of the unfrozensample (Figure 10A). As the 1-wk frozen-stored cheesesample was tempered for 7 and 14 d, the peak shiftedto a lower T2 value (Figures 10C and 10D), and the T2distribution became narrower. Further frozen storageof the cheese sample to 4 wk showed a narrowing ofthe T2 distribution around the value of 6 ms (Figure10E). Tempering the 4-wk frozen-stored cheese samplefor 7 and 14 d produced only a small shift in the T2distribution with the peak moving to 8 ms (Figures10F and 10G). The results of cheese sample storedfrozen at 14 d post-manufacture were not availabledue to the low signal intensity in the images of cheesesamples and several missing data.
There was a significant change in the T2 distributionfollowing freezing, frozen storage, and thawing, whichcan be used to characterize the freezing effect on pastafilata Mozzarella cheese. In general, the frozen-storedpasta filata Mozzarella cheese samples tempered for1 d have a narrower T2 distribution compared withthose of unfrozen samples and with all relaxationtimes shifted to shorter values (Figure 9B, 9E, and10E). An exception was found in 1-wk frozen-storedpasta filata Mozzarella cheese sample tempered for 1d that stored frozen at 7 d postmanufacture (Figure10B).
Changes in the T2 relaxation time after freezing andthawing were also found in several food systems (Duceet al, 1992; Gamble, 1994; Rutledge et al., 1994; Kerret al., 1997). Duce et al. (1992) showed that the overallintensity of the image of the frozen courgette is greaterthan that of the fresh courgette. A relative image con-trast between different types of tissue is less distinctin the frozen sample due to altering morphology of thetissue during freezing and thawing. Gamble (1994)observed an increase in T2 following freezing in blue-berries as a result of the rupture of water retainingcell walls.
Rutledge et al. (1994) observed that the completelythawed potato sample has a T2 relaxation time distri-bution similar in general appearance to that of un-frozen sample at the same temperature but with allrelaxation times shifted to shorter values. They con-cluded that the shift of T2 to shorter relaxation timesafter a freeze-thaw cycle results from ice crystal dam-age and the resulting enzymatic degradation of macro-molecules. Kerr et al. (1997) reported that the averageT2 for thawed kiwifruit was significantly (P < 0.01)shorter than that of fresh fruit. However, the diffusionwas more rapid in freeze-thawed samples. They sus-pected that relaxation might be affected by the pres-ence of relaxation sinks at the surface. These relax-
Journal of Dairy Science Vol. 86, No. 8, 2003
ation sinks can normally be attributed to paramag-netic impurities at the surface of hindrance inmolecular tumbling near the surface (Chui et al.,1995).
Changes in T2 relaxation time were also found be-tween firm and bruised apple tissue (McCarthy et al.,1995). The authors showed that the bruised tissue re-gions of apple appeared brighter than firm tissue inNMR images, and measured a decreased in T2 inbruised regions of apple using CPMG pulse sequence.By comparing spin-echo images with gradient-re-called-echo images, they proved that the contrast wasattributable to a change in diamagnetic susceptibilityas a result of the partial destruction of the cellularstructure caused by bruising. However, no discussionon the changes of T2 was given in their study.
Structural damage of foods by freezing or bruisingalters the T2 value. However, the difference between T2relaxation time of frozen-stored and unfrozen sampleswas not the same in different food systems becauseof the differences in the microstructure. The specificcauses contributing to the change in T2 relaxation timefollowing freezing reported in the literature werenot elucidated.
The water T2 relaxation of pasta filata Mozzarellacheese sample might depend on the combinations ofseveral possible factors among which are nonhomoge-neity of the external magnetic field; mobility of thewater molecules; nonhomogeneity of the local mag-netic field due to variation in the magnetic susceptibil-ity within the sample, and chemical exchange betweendifferent sites of different mobility (for example, pro-tons of more mobile water molecules exchange withprotons of less mobile protein molecules). The abruptchange in the magnetic susceptibility at the bound-aries between water and fiber surface generate thelocal magnetic field gradients (Gasel and Lee, 1974;Callaghan, 1990). The variation of magnetic suscepti-bility at the boundaries of small water pockets arelarge; thus, increase the local magnetic field gradientresulting in a short T2 relaxation time. However, thesizes of the protein bundles, fat globules, and waterpockets found in the cheese are too small to generatesufficiently strong magnetic field gradients to accountfor more than a minor fraction of the T2 relaxationKuo (2001). Hills et al. (1989, 1990) demonstrated thatchemical exchange between the mobile water and pro-teins can account for the relaxation behavior of thebulk water in various protein suspensions. Given thatcheese can be viewed as a complex protein suspension,chemical exchange appears to be the best model forthe data.
Increase in D values but decrease in T2 values offrozen-stored pasta filata Mozzarella cheese samples
EFFECT OF FREEZING ON MOZZARELLA CHEESE 2533
tempered for 1 d with respect to unfrozen samplessuggest that chemical exchange between differentsites of different mobilities was the main mechanismsinvolved in water relaxation in frozen-stored pasta fi-lata Mozzarella cheese sample tempered for 1 d. Scan-ning electron microscopy micrographs presented inKuo (2001) show that stretching during pasta filataMozzarella cheese making creates a network of paral-lel-oriented protein fibers, resulting in an uneven dis-tribution of water within the cheese matrix, but thesizes of the structures argue against this being a majorcontributor to the relaxation of the water. Thus, inpasta filata Mozzarella cheese matrix, the range of T2values probably represents the number and variety ofsites available for chemical exchange. Thus, the distri-butions of T2 values of unfrozen pasta filata Mozzarellacheese samples were broad (Figures 9A and 10A).
Freezing and frozen storage of pasta filata Mozza-rella cheese resulted in the rupture of water retainingprotein fibers within discrete locations of the cheeseprotein matrix (Kuo, 2001). From the NMR viewpoint,local damage to the protein fibers in a cheese sampleduring freezing and frozen storage should cause anincrease in the number and types of sites available forchemical exchange within the damaged regions of theprotein matrix. An increase in the number and accessi-bility of these chemical exchange sites would result ina decrease in the extent of T2 values, thus, leadingto a narrow distribution of T2 values in frozen-storedcheese samples tempered for 1 d. According to Kuo etal. (2001), water in pasta filata Mozzarella cheesecould be classified into two dominant fractions by T2relaxation times, a more mobile fraction and a lessmobile fraction. Fontecha et al. (1993) reported thatfreezing cheese causes a high proportion of unorderedstructure. This might result in exposure of water mole-cules that are in exchange with proteins of cheese ma-trix to the bulk water. As the frozen-stored cheesesamples thawed, there is an increased number of watermolecules in chemical exchange with the protein ma-trix mixing with more mobile water causing both anarrowing of the T2 distribution and a shift to shorterT2 values (Figures 9B, 9E, and 10E).
According to the D values and T2 relaxation timeswe determined, the access of the water molecules tothe exchangeable protons within the protein matrixmight be the dominant mechanism involved in waterrelaxation of frozen-stored pasta filata Mozzarellacheese sample during the 14-d tempering. For pastafilata Mozzarella cheese stored frozen at 7 d post-man-ufacture, tempering the frozen-stored cheese samplesshifted the T2 peak to a shorter T2 relaxation time.The T2 values became narrowly distributed comparedwith the frozen-stored samples tempered for 1 d, since
Journal of Dairy Science Vol. 86, No. 8, 2003
the relocation of water molecules into the proteins ofthe cheese matrix occurred during tempering as evi-dence by a decrease in the D values of frozen-storedsample during tempering. For pasta filata Mozzarellacheese stored frozen at 2-d postmanufacture, temper-ing the 4-wk frozen-stored cheese samples shifted theT2 peaks to a longer T2 relaxation time. The T2 valuesbecame broader than the frozen-stored samples tem-pered for 1 d. Although changes in the D values of 4-wk frozen-stored pasta filata Mozzarella cheese duringtempering were not systematic, the results of waterT2 relaxation alone might indicate that the proteinsare unable to fully regain their initial structure as aresult of tempering. As the protein regains its struc-ture, it is probable that intramolecular binding pre-vents the bulk water from gaining access to the ex-changeable protons of the protein.
The protein fibers in the cheese matrix of the 4-wkfrozen-stored pasta filata Mozzarella cheese samplesmay be severely damaged when stored frozen at 2-dpostmanufacture. This might be due to growth of theice crystals. Because most of the water molecules inMozzarella cheese matrix exist in the fat-serum chan-nels at 2-d aging (Oberg et al., 1993; Kuo et al., 2001),there might be an increase in the ice crystal size duringfreezing and longer frozen storage compared with thecheese samples which stored frozen at 7-d postmanu-facture or for shorter period. After thawing, most ofthe water molecules might be still in the fat-serumchannels and only a small part of them might be incontact with the protein matrix during tempering dueto the severe damage of the protein fibers in the frozen-stored cheese matrix, resulting in broader distributionof water mobility and more mobile water (Figure 9Fand G). It appears that the protein matrix was notaltered significantly as the 7-d aged pasta filata Moz-zarella cheese sample stored frozen for 1 wk, sincethe distribution of T2 of the 1-wk frozen-stored cheesesample tempered for 1 d (Figure 10B) was similar ingeneral appearance to that of the unfrozen sample(Figure 10A).
Non-Pasta Filata Mozzarella
Figure 11 shows the histogram distribution of T2
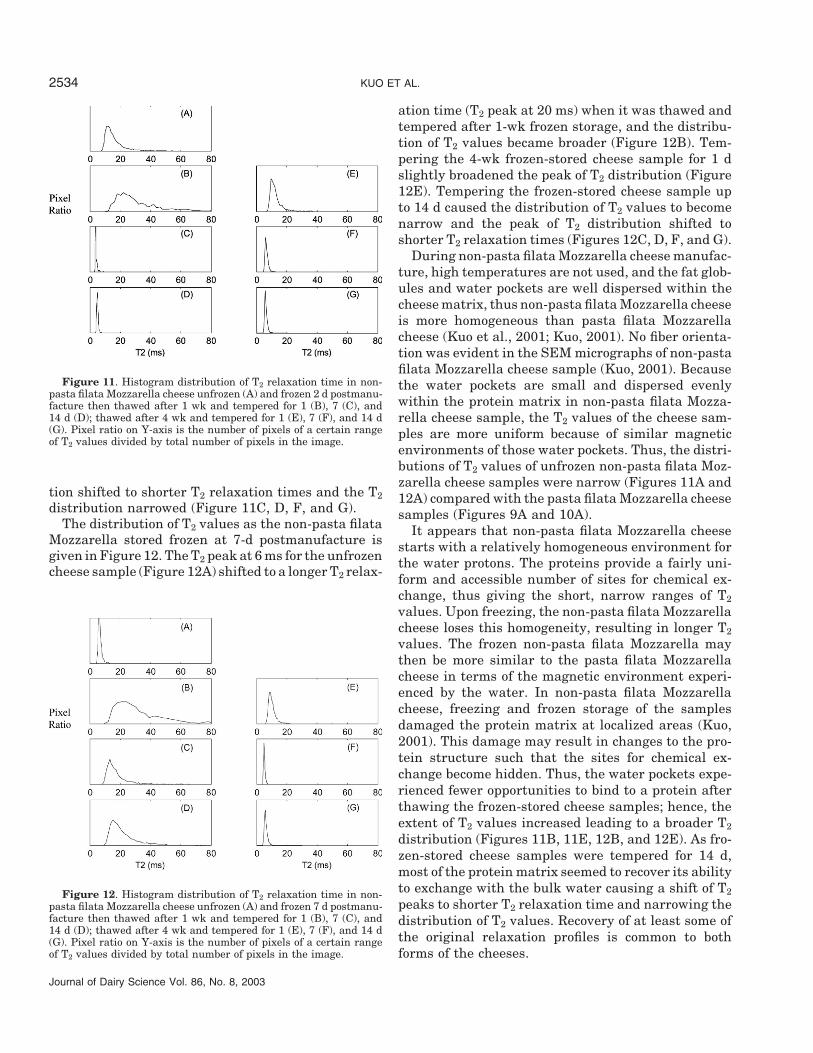
values as the non-pasta filata Mozzarella cheese sam-ple stored frozen at 2-d postmanufacture. When the1-wk frozen stored cheese sample was tempered, theT2 peak at 12 ms for unfrozen sample (Figure 11A)had shifted to 20 ms, and the distribution of T2 valuesbecame wider (Figure 11B). Frozen storage of thecheese sample for 4 wk slightly changed the distribu-tion of T2 values (Figure 11E). As the frozen-storedcheese samples tempered, the peak of the T2 distribu-
KUO ET AL.2534
Figure 11. Histogram distribution of T2 relaxation time in non-pasta filata Mozzarella cheese unfrozen (A) and frozen 2 d postmanu-facture then thawed after 1 wk and tempered for 1 (B), 7 (C), and14 d (D); thawed after 4 wk and tempered for 1 (E), 7 (F), and 14 d(G). Pixel ratio on Y-axis is the number of pixels of a certain rangeof T2 values divided by total number of pixels in the image.
tion shifted to shorter T2 relaxation times and the T2distribution narrowed (Figure 11C, D, F, and G).
The distribution of T2 values as the non-pasta filataMozzarella stored frozen at 7-d postmanufacture isgiven in Figure 12. The T2 peak at 6 ms for the unfrozencheese sample (Figure 12A) shifted to a longer T2 relax-
Figure 12. Histogram distribution of T2 relaxation time in non-pasta filata Mozzarella cheese unfrozen (A) and frozen 7 d postmanu-facture then thawed after 1 wk and tempered for 1 (B), 7 (C), and14 d (D); thawed after 4 wk and tempered for 1 (E), 7 (F), and 14 d(G). Pixel ratio on Y-axis is the number of pixels of a certain rangeof T2 values divided by total number of pixels in the image.
Journal of Dairy Science Vol. 86, No. 8, 2003
ation time (T2 peak at 20 ms) when it was thawed andtempered after 1-wk frozen storage, and the distribu-tion of T2 values became broader (Figure 12B). Tem-pering the 4-wk frozen-stored cheese sample for 1 dslightly broadened the peak of T2 distribution (Figure12E). Tempering the frozen-stored cheese sample upto 14 d caused the distribution of T2 values to becomenarrow and the peak of T2 distribution shifted toshorter T2 relaxation times (Figures 12C, D, F, and G).
During non-pasta filata Mozzarella cheese manufac-ture, high temperatures are not used, and the fat glob-ules and water pockets are well dispersed within thecheese matrix, thus non-pasta filata Mozzarella cheeseis more homogeneous than pasta filata Mozzarellacheese (Kuo et al., 2001; Kuo, 2001). No fiber orienta-tion was evident in the SEM micrographs of non-pastafilata Mozzarella cheese sample (Kuo, 2001). Becausethe water pockets are small and dispersed evenlywithin the protein matrix in non-pasta filata Mozza-rella cheese sample, the T2 values of the cheese sam-ples are more uniform because of similar magneticenvironments of those water pockets. Thus, the distri-butions of T2 values of unfrozen non-pasta filata Moz-zarella cheese samples were narrow (Figures 11A and12A) compared with the pasta filata Mozzarella cheesesamples (Figures 9A and 10A).
It appears that non-pasta filata Mozzarella cheesestarts with a relatively homogeneous environment forthe water protons. The proteins provide a fairly uni-form and accessible number of sites for chemical ex-change, thus giving the short, narrow ranges of T2
values. Upon freezing, the non-pasta filata Mozzarellacheese loses this homogeneity, resulting in longer T2
values. The frozen non-pasta filata Mozzarella maythen be more similar to the pasta filata Mozzarellacheese in terms of the magnetic environment experi-enced by the water. In non-pasta filata Mozzarellacheese, freezing and frozen storage of the samplesdamaged the protein matrix at localized areas (Kuo,2001). This damage may result in changes to the pro-tein structure such that the sites for chemical ex-change become hidden. Thus, the water pockets expe-rienced fewer opportunities to bind to a protein afterthawing the frozen-stored cheese samples; hence, theextent of T2 values increased leading to a broader T2
distribution (Figures 11B, 11E, 12B, and 12E). As fro-zen-stored cheese samples were tempered for 14 d,most of the protein matrix seemed to recover its abilityto exchange with the bulk water causing a shift of T2
peaks to shorter T2 relaxation time and narrowing thedistribution of T2 values. Recovery of at least some ofthe original relaxation profiles is common to bothforms of the cheeses.
EFFECT OF FREEZING ON MOZZARELLA CHEESE 2535
CONCLUSIONS
There was a significant change in the water self-diffusion coefficient and distribution of T2 relaxationtime of water following freezing-thawing, which canbe used to characterize effects of freezing on cheeses.The changes in T2, determined spatially at discretelocations within the cheese sample, take into accountthe localized nature of injury in the frozen-storedcheese sample. For the frozen-stored pasta filata Moz-zarella cheese samples tempered for 1 d, the D valueswere higher and T2 distributions were narrower thanthose for the unfrozen samples and with all T2 relax-ation times shifting to shorter values. In contrast, theT2 values of the frozen-stored non-pasta filata Mozza-rella cheese samples were longer. The differences be-tween T2 distributions of the pasta filata and non-pasta filata Mozzarella cheeses may be attributed tothe differences in the cheese microstructure, specifi-cally the ability of the water to exchange with theprotein matrix.
Although structural changes in cheese, such as de-formation and rupture of the protein matrix, are ap-parent in SEM micrographs (Kuo, 2001), it is moredifficult to quantify and make assessments based onthe microstructural features. The quantifiablechanges in the NMR parameters may consequentlyprove more useful. Thus, NMR imaging technique canserve as an alternative tool to assist in the study ofchanges in cheese quality parameters during frozenstorage and/or subsequent thawing.
ACKNOWLEDGMENTS
This research was founded by a grant from DairyManagement, Inc. (Rosemont, IL). Nuclear magneticresonance studies were carried out at the NationalMagnetic Resonance Facility at Madison with supportfrom the NIH Biomedical Technology Program(RR02301) and additional equipment funding from theUniversity of Wisconsin, NSF Academic Infrastruc-ture Program (BIR-9214394), NIH Shared Instrumen-tation Program (RR02781, RR08438), NIH ResearchCollaborations to Provide 400 MHz NMR Spectroscopy(GM66326), NSF Biological Instrumentation Program(DMB-8415048), and U.S. Department of Agriculture.
REFERENCES
Bertola, N. C., A. N. Califano, A. E. Bevilacqua, and N. E. Zaritzky.1996. Effect of freezing conditions on functional properties oflow moisture Mozzarella cheese. J. Dairy Sci. 29:185–190.
Callaghan, P. T. 1990. Susceptibility-limited resolution in nuclearmagnetic resonance microscopy. J. Magn. Res. 87:304–318.
Cervantes, M. A., D. B. Lund, and N. F. Olson. 1983. Effects ofsalt concentration and freezing on Mozzarella cheese texture.J. Dairy Sci. 66:204–213.
Journal of Dairy Science Vol. 86, No. 8, 2003
Chui, M. M., R. J. Phillips, and M. J. McCarthy. 1995. Measurementof the porous microstructure of hydrogels by nuclear magneticresonance. J. Colloid Interface Sci. 174:336–344.
Dahlstrom, D. G. 1978. Frozen storage of low moisture, part-skimMozzarella cheese. M.S. Thesis, Univ. of Wisconsin-Madison,Madison.
Diefes, H. A., S. S. H. Rizvi, and J. A. Bartsch. 1993. Rheologicalbehavior of frozen and thawed low-moisture, part-skim Mozza-rella cheese. J. Food Sci. 58:764–769.
Duce, S. L., T. A. Carpenter, and L. D. Hall. 1992. Nuclear magneticresonance imaging of fresh and frozen courgettes. J. Food Eng.16:165–172.
Fontecha, J., J. Bellanato, and M. Juarez. 1993. Infrared and Ramanspectroscopic study of casein in cheese: Effect of freezing andfrozen storage. J. Dairy Sci. 76:3303–3309.
Fontecha, J., C. Pelaez, M. Juarez, and M. C. Martin-Hernandez.1994. Effect of freezing and frozen storage on the physicochemi-cal, organoleptic and microbiological characteristics of a semi-hard ewes’ milk cheese. J. Dairy Res. 61:133–142.
Fontecha, J., M. Kalab, J. A. Medina, C. Pelaez, and M. Juarez. 1996.Effects of freezing and frozen storage on the microstructure andtexture of ewe’s milk cheese. Z. Lebensm-Unters. Forsch.203:245–251.
Gamble, G. R. 1994. Non-invasive determination of freezing effectsin blueberry fruit tissue by magnetic resonance imaging. J. FoodSci. 59:571–573.
Gasel, J. A., and K. H. Lee. 1974. On the interpretation of waternuclear magnetic resonance relaxation times in heterogeneoussystems. J. Am. Chem. Soc. 96:970–978.
Hills, B. 1995. Food processing: An MRI perspective. Trends FoodSci. Technol. 6:111–117.
Hills, B. P., S. F. Takacs, and P. S. Belton. 1989. The effects ofproteins on the proton N.M.R. transverse relaxation times ofwater. I. Native bovine serum albumin. Mol. Physics 67:903–918.
Hills, B. P., S. F. Takacs, and P. S. Belton. 1989. The effects ofproteins on the proton N.M.R. transverse relaxation times ofwater. II. Protein aggregation. Mol. Physics 67:919–937.
Hills, B. P., S. F. Takacs, and P. S. Belton. 1990. A new interpretationof proton NMR relaxation time measurements of water in food.Food Chem. 37:95–111.
Holz, M., and H. Weingartner. 1991. Calibration in accurate spin-echo self-diffusion measurements using 1H and less-commonnuclei. J. Magn. Reson. 92:115–125.
Kerr, W. L., R. J. Kauten, M. Ozilgen, and M. J. McCarthy. 1996.NMR imaging, calorimetric, and mathematical modeling studiesof food freezing. J. Food Process Eng. 19:363–384.
Kerr, W. L., C. J. Clark, M. J. McCarthy, and J. S. de Ropp. 1997.Freezing effects in fruit tissue of kiwifruit observed by magneticresonance imaging. Sci. Hortic. 69:169–179.
Kerr, W. L., R. J. Kauten, M. J. McCarthy, and D. S. Reid. 1998.Monitoring the formation of ice during food freezing by magneticresonance imaging. Food Sci. and Technol./Lebensmittel-Wis-senchatt Technologie (LWD). 31:215–220.
Kuo, M.-I., S. Gunasekaran, M. Johnson, and C. Chen. 2001. Nuclearmagnetic resonance study of water mobility in pasta filata andnon-pasta filata Mozzarella. J. Dairy Sci. 84:1950–1958.
Kuo, M.-I. 2001. Distribution and mobility of water in pasta filataand non-pasta filata Mozzarella cheeses. Ph.D. Thesis, Univ. ofWisconsin-Madison.
Kuo, M.-I., and S. Gunasekaran. 2003. Effect of frozen storage onphysical properties of pasta filata and non-pasta filata Mozza-rella cheeses. J. Dairy Sci. 86:1108–1117.
McCarthy, M. J., and R. J. Kauten. 1990. Magnetic resonance im-aging applications in food research. Trends Food Sci. Technol.1:134–139.
McCarthy, M. J. 1994. Magnetic resonance imaging in food research.Chapman and Hall, New York.
McCarthy, M. J., B. Zion, and P. Chen. 1995 Diamagnetic suscepti-bility changes in apple tissue after bruising. J. Sci. Food Agric.67:13–20.
KUO ET AL.2536
Oberg, C. J., R. K. Merrill, R. J. Brown, and G. H. Richardson. 1992.Effects of freezing, thawing, and shredding on low moisture,part-skim Mozzarella cheese. J. Dairy Sci. 75:1161–1166.
Oberg, C. J., W. R. McManus, and D. J. McMahon. 1993. Microstruc-ture of Mozzarella cheese during manufacture. Food Struct.12:251–258.
Perez-Munuera, I., M. Estevez, and M. A. Lluch. 1999. Note. Studyof some typical Spanish cheeses by scanning electron microscopy.Main microstructural modifications caused by freezing. FoodSci. Technol. Int. 5:515–521.
Rutledge, D. N., F. Rene, B. P. Hills, and L. Foucat. 1994. Magneticresonance imaging studies of the freeze-drying kinetics of potato.J. Food Process Eng. 17:325–352.
Journal of Dairy Science Vol. 86, No. 8, 2003
Schmidt, S. J., X. Sun, and J. B. Litchfield. 1996. Applications ofmagnetic resonance imaging in food science. Crit. Rev. Food Sci.Nutr. 36:357–385.
Stejskal, E. O., and J. E. Tanner. 1965. Spin diffusion measure-ments: spin echoes in the presence of a time dependent fieldgradient. J. Chem. Phys. 42:288–292.
Tejada, L., E. Sanchez, R. Gomez, M. Vioque, and J. Fernandez-Salguero. 2002. Effect of freezing and frozen storage on chemicaland microbiological characteristics in sheep milk cheese. J. FoodSci. 67:126–129.
Webb, B. H., and W. S. Arbuckle. 1977. Freezing of dairy products.Page 357–395 in Fundamentals of Food Freezing. N. W. Desro-sier, ed. AVI Pub. Co., Westport, CT.