Embed Size (px)
Citation preview

FOI Services Teleconference TC161130
Determining a Statistically
Valid Sample Size: What Does
FDA Expect to See? Presented by:
Steven Walfish
When: November 30, 2016
Eastern Standard Time: 1:00pm – 2:30pm (GMT-5) Central Time: 12:00pm – 1:30 pm
Mountain Time: 11:00am – 12:30pm Pacific Time: 10:00am – 11:30am
Prepare: Please provide each listener with access to this handout; it is online
at www.foiservices.com/safesam4166.htm Black & white photocopies can be used.
Connect: Call in 5-10 minutes before the start time:
1-866-614-1121 (Toll-from free US & Canada) Conference ID: 17414166
Your unique PIN is on your invoice & your dial-in email.
Registrants from outside the US/Canada should contact FOI for customized instructions.
Please Note:
Each registration you purchase covers one connection. You are welcome to put the conference on a speakerphone and invite as many listeners as you like for your registration. If you need to dial-in from an additional line, another registration with a different PIN is required; call +1-301-975-9400 for more information.
Do not use a conferencing feature to add remote locations to the one registered location. The quality of the connection will be greatly reduced and several features, such as the ability to ask a question, are disabled.
This is an audio-format presentation. For the best connection, use a corded telephone on a land-line. You will be connected for 90 minutes or more; relying on a battery-powered phone may not be wise.
If you ask a question during the live Q&A session, please try to avoid using a speakerphone.
This presentation is recorded. If you register for the live conference, you can order the audio package of an mp3 file and all of the handouts at a 50% discount; contact FOI for details.
Produced by:
FOI Services, Inc. 23219 Stringtown Road; Suite 240 Clarksburg, MD 20871-9563 • USA Phone: +1-301-975-9400 Email: [email protected] Web: www.foiservices.com
Important Notice: The information provided in this presentation by each instructor is personal opinion and does not necessarily represent the opinions of FOI, Inc. Companies relying on the information do so at their own risk and assume responsibility for any subsequent consequences and liability. The information provided does not constitute legal advice.
©2016, FOI, Inc. All rights reserved. TC161130


Agenda
0 Basic risk management principles 0 The relationship of risk to sample size 0 Tools for continuous data
0 One-sample 0 Individual values 0 One proportion 0 Capability index 0 Non-Inferiority
0 Tools for attribute data 0 ANSI/ASQ Z1.4 0 C=0 0 Square root N plus 1
0 A case study and examples
2

What is Unbiased & Representative?
0 The word bias is thrown around in the statistical literature. What does it mean? 0 “Bias is a quantitative term describing the difference between
the average of measurements made on the same object and its true value.”
0 The concept of unbiased means the sample is representative of the population.
0 The problem is that an inadequate sample, or a poorly
selected sample will induce bias.
3

Sampling Plans are Poorly Written
0 Most documents that detail a sampling plan state the sample size, but not the sampling method. 0 “Measure the pH of ten samples” 0 “Inspect thirty labels”
0 Should be written:
0 “Measure the pH of ten samples throughout the process” 0 “Inspect thirty labels, ten each from the beginning, middle and end.”
0 Sampling plans should also reflect the acceptance levels and risks
levels. 0 Inspect thirty labels, ten each from the beginning, middle and end
with no defects. This reflects 95% confidence with 90% reliability.
4

Principles of Risk Management
0 Two primary principles of quality risk management are: 0 The evaluation of the risk to quality should be based on
scientific knowledge and ultimately link to the protection of the patient; and
0 The level of effort, formality and documentation of the quality risk management process should be commensurate with the level of risk.
0 Sample size is a function of risk
5

Representative Sampling
6
0 Decisions are often based on our analysis of a sample.
0 How we conduct a sample is very important. 0 Want:
0 Minimize bias 0 Sample reflects the
characteristics of the lot or batch
0 Economical sample size

Sampling Selection 0 Simple random sampling (SRS) ensures that all units are
selected independently with equal probability (i.e. raffle).
0 Stratified random sampling ensures that each strata (subgroup) are represented in the sample.
0 Composite sampling combines several samples into a single sample unit (10 tablets used to make a single sample prep).
0 Systematic sampling is a convenient sampling method ensuring that items from the beginning, middle and end are sampled.
7

Which is the Best?
0 As all good statisticians say… 0 It depends!
0 The selection of a sample is based on the answer
needed to the question to be asked
0 It is not a one size fits all problem
8

Sampling Error 0 Sampling has inherent risks and potential error. 0 The number of samples should be sufficient to
minimize the risks. 0 Cost versus benefit
9
Decision
Reality
Accept Reject
Accept Correct Decision (green)
Type II Error (β) Consumer Risk
(red)
Reject Type I Error (α) Producer Risk
(red)
Correct Decision (green)

Definitions 0 AQL – Acceptable Quality Level is the process average percent
defective we will accept with high probability (usually set at 95%)
0 LQ – Limiting Quality is the process average percent defective we will accept with low probability (usually set at 10%)
0 Accept Number – Maximum number of defectives allowable in our sample and still accept the “lot or batch”
0 Reject Number – Minimum number of defectives allowable in our sample that will cause “lot or batch” to be rejected
0 Sample Size – The number of units to be tested from the lot or batch.
0 Sampling Plan – A combination of sample size, accept/reject number with AQL and LQ levels. 10
OC Curve
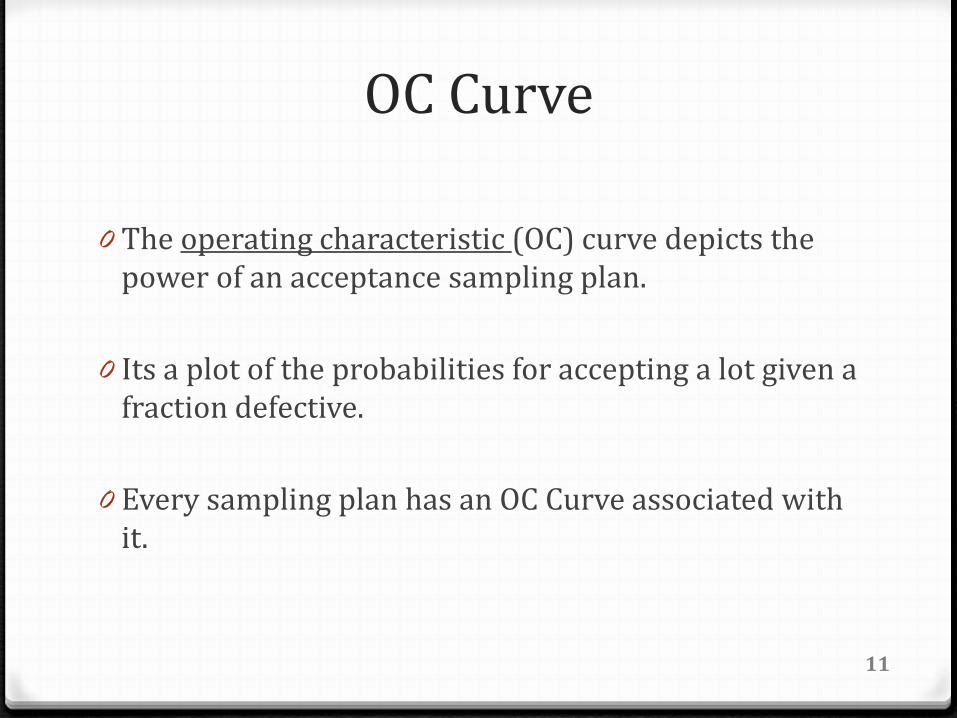
0 The operating characteristic (OC) curve depicts the power of an acceptance sampling plan.
0 Its a plot of the probabilities for accepting a lot given a fraction defective.
0 Every sampling plan has an OC Curve associated with it.
11

OC Curve
12
N Accept Number (C) AQL LQ
50 0 0.101% 4.507%
75 0 0.069% 3.025%
100 1 0.355% 3.833%
500 5 0.526% 1.851%

Reportable Value
0 A reportable value is an average value of readings from one or more units of a test solution.
0 Taking three values and averaging them into a single reportable value has a smaller error.
0 This plays an important role in determining sample size.
13

Reportable Value - Example
0 Taking 6 individual samples with a standard deviation 0.58 has a 95% confidence interval of +/- 0.61
0 Taking 6 sets of three value reduces the width of the interval.
0 Determining which replication strategy to use is a function of the sources of variability seen in obtaining a reportable value.
14
Sampling & Measurement Error
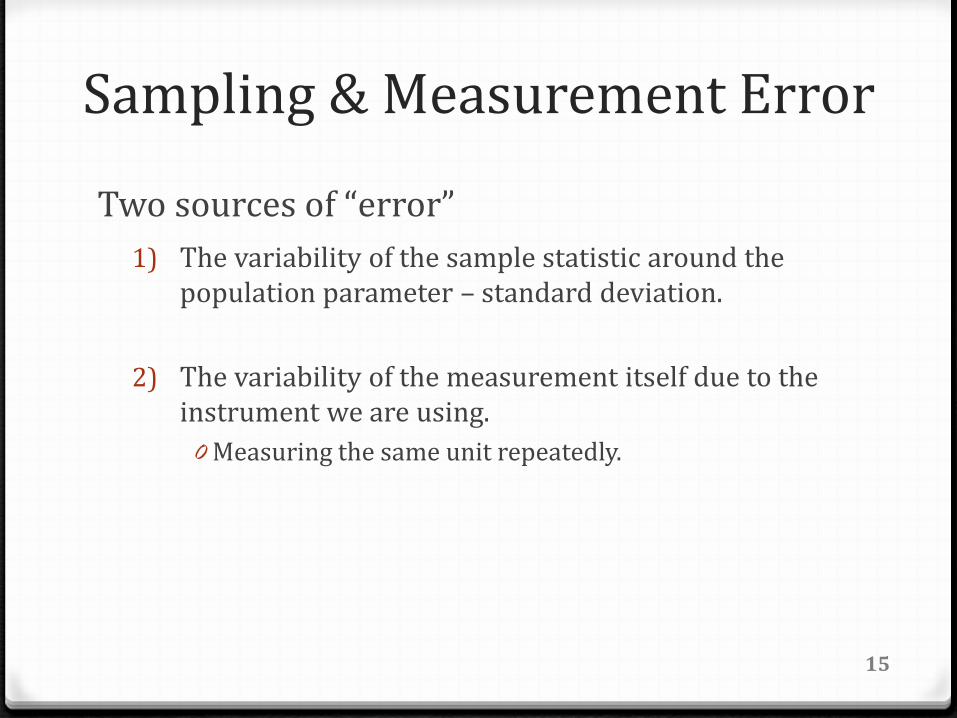
Two sources of “error” 1) The variability of the sample statistic around the
population parameter – standard deviation.
2) The variability of the measurement itself due to the instrument we are using.
0 Measuring the same unit repeatedly.
15

Sampling & Measurement Error
0 Minimizing the variation: 0 To get a more precise estimate of the population
parameter, take a larger sample. (i.e., more individual sampling units)
0 To obtain a more precise measurement, measure the same individual sampling unit multiple times (replicates) and take the average.
16

Sample Size for Mean
( )2 2
2
Z Z Sn α β+=
∆
17
• Zα and Zβ are the Type I and Type II error rates.
• You can substitute the t-value for smaller sample sizes.
• Differs slightly from the method used by software such as JMP™.

Example 0 Type I error rate is 5% (95% Confidence)
0 Zα=1.96
0 Type II error rate is 1% (99% Power) 0 Zβ = 2.326
0 Standard deviation of 1 and a delta of 0.5.
18
( )
745.0
)1(326.296.12
22
=
+=
n
n

Sample Size for Individual Values
0 Can develop sample sizes for individual values instead of the mean.
0 Requires a confidence level and percent of future values expected to be in the interval (coverage or reliability).
0 This approach is for all future observations (beta-content approach)
0 Two-sided tolerance limits for normal populations-Some improvements. Howe, W. G. 1969, Journal of the American Statistical Association, Vol. 64, pp. 610-620)
19
LSk
USk
>−
<+
*X
*X

Example 0 How large a sample do I need to have 95% confidence
with 95% reliability for a mean of 10.0 and standard deviation of 0.55?
0 The specification are 8.5 to 12.0
0 Since the mean is closest to the lower specification
20
727.25.855.0*0
=>−
kk1
Sample size is approximately 21
What is the Difference?
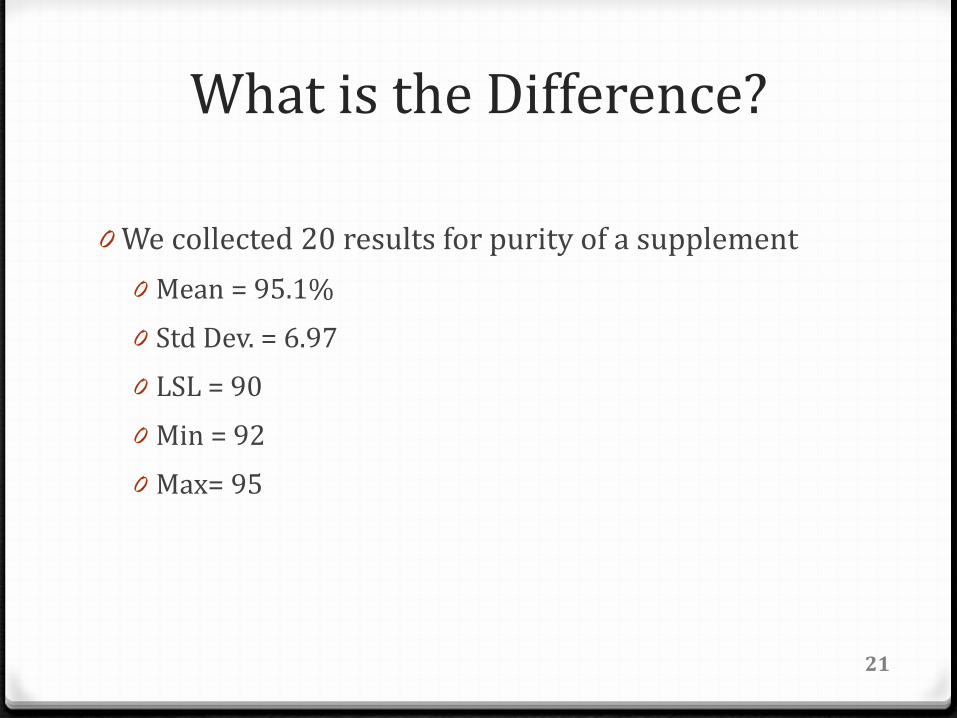
0 We collected 20 results for purity of a supplement 0 Mean = 95.1%
0 Std Dev. = 6.97 0 LSL = 90
0 Min = 92
0 Max= 95
21

Which is Right? 0 Want to test if the MEAN is greater than 90.
0 The 95% Lower Bound on the mean of 95.1 is 92.4. This implies if we sample 20 units from a population whose mean is 95.1 with SD=6.97, the average will be greater than 92.4 approximately 95% of the time.
0 Want to test if the INDIVIDUAL purity is greater than 95.
0 The lower bound with 95% confidence and 99% coverage (reliability) is on the distribution of the individuals is 72.1. This implies if we sample 20 units from a population whose mean is 95.1 with SD=6.97, 99% of the individual values would be greater than 72.1.
22

Which is Right
0 The mean of 20 results would meet the specification.
0 A sample of 20 results would have a high probability of failure.
0 Must be careful to specify what is the reportable value for the testing.
23

24
Sample Size for Proportions
Where 0 α = alpha level of the test (two-sided) 0 1 – β = power of the test 0 p0 = proportion under the null hypothesis 0 p1 = proportion under the alternative hypothesis
2
01
111001 2
−
+=
−−
pp
qpzqpzn
βα

25
Example
How large a sample is needed to test H0: p = .21 against Ha: p = .31 at α = 0.05 (two-sided) with 90% power?
1943.193
21.031.0)69.0)(31.0(28.1)79.0)(21.0(96.1
2
⇒=
−+
=n
Note: The symbol ⇒ means round up to ensure stated power

26
Power Calculation
−−Φ=−
−
11
001012 1
qp
qpznpp α
β
Where: • α = alpha level of the test (two-sided) • n = sample size • p0 = proportion under the null hypothesis • p1 = proportion under the alternative hypothesis
27
Power - Example
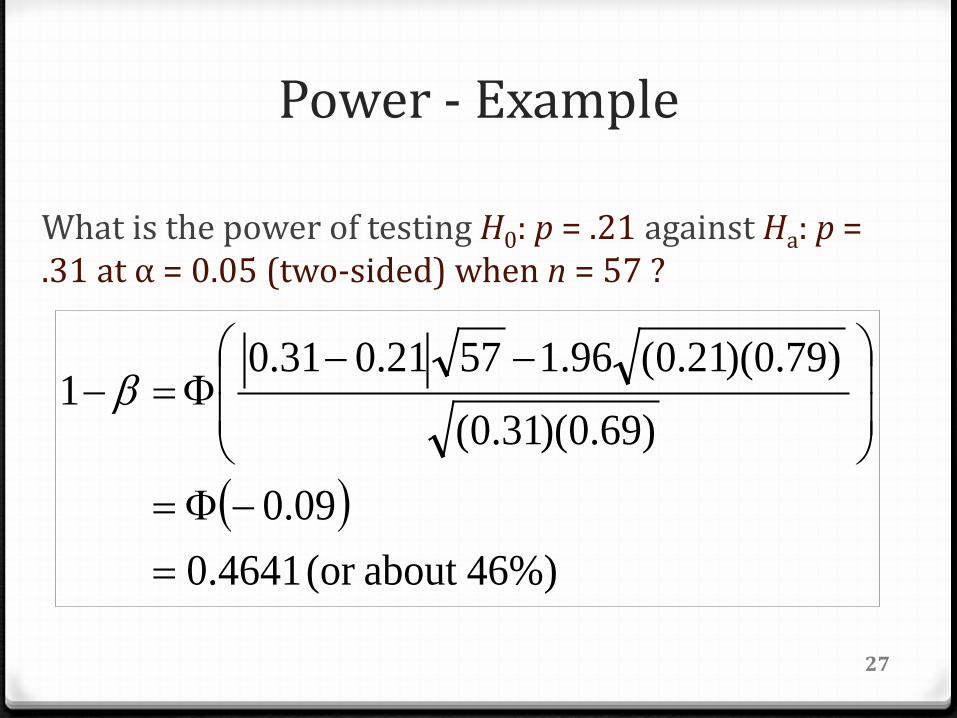
What is the power of testing H0: p = .21 against Ha: p = .31 at α = 0.05 (two-sided) when n = 57 ?
( )46%)about (or 4641.0
09.0
)69.0)(31.0(
)79.0)(21.0(96.15721.031.0 1
=−Φ=
−−Φ=− β

Sample Size for Capability 0 Some companies are calculating sample size based on
capability indices.
0 This can only be done using a confidence interval approach.
0 Have to set a lower limit on the capability index and an observed capability index.
28
−++≤≤
−+−
)1(21
)ˆ(911ˆ
)1(21
)ˆ(911ˆ
2222 npkCnZpkCCpk
npkCnZpkC αα

Capability Sample Size Example 2Observed 1Lower Limit on Cpk=Observed
9 2 2pk
pk
CC Z
n nα− +−
Sample Size Observed Cpk 3 5.69 4 3.10 5 2.44 6 2.13 7 1.95 8 1.83 9 1.73
10 1.67
95% Confidence that the “True” Cpk is no worse than 1.0
29

Non-Inferiority 0 The “at least good as” criterion.
0 A one-sided significance test to reject the null hypothesis
that standard therapy is better than experimental therapy by a clinically acceptable amount.
0 To demonstrate that a new device is 'at least as good as' an existing device, a statistical test or confidence interval procedure must rule out clinical inferiority with a high probability.
30

Sample Size - NonInferiority
( )
21 1( )
(1 ) (1 )T T C CT C
Z Zn P P P P
P Pα β
δ− − +
≥ − + − − −
31
The noninferiority hypothesis and sample size are attributable to Blackwelder (1982). The sample size computation is given below for equal sample size in each treatment group.
Blackwelder, W. “Proving the null hypothesis in clinical trials.” Controlled Clinical Trials 3: 345-353, 1982.

Example
( )
2(1.645 0.841790 0.8(1 0.8) 0.8(1 0.8)
0.80 0.80 0.05
+ ≥ − + − − −
32
In a group of patients using an approved sleeping apparatus, 80% claim an improvement in their insomnia. The new device is proved to be non-inferior to the predicate if the rate of insomnia is no worse than 75% (a=0.05, Power=80%).

Attribute Sampling Plans When All Units Pass
0 At 95% Confidence and 90% Reliability
0 𝑛 = ln(1−𝐶𝐶𝐶𝐶𝐶𝐶𝐶𝐶𝐶𝐶)ln(𝑅𝐶𝑅𝐶𝑅𝑅𝐶𝑅𝐶𝑅𝑅)
= ln(1−0.95)ln(0.90)
= 28
33
Confidence Reliability Sample Size
80% 80% 8
80% 90% 16
80% 95% 32
80% 99% 161
90% 80% 11
90% 90% 22
90% 95% 45
90% 99% 230
95% 80% 14
95% 90% 29
95% 95% 59
95% 99% 299
99% 80% 21
99% 90% 44
99% 95% 90
99% 99% 459

ANSI Z1.4
0 Z1.4 is a standard developed for incoming inspection where the attribute is pass/fail.
0 ANSI Z1.4 system is a collection of sampling plans with switching rules.
0 Plans are intended primarily to be used for a continuing series of lots or batches.
34

Attribute Sampling Plans
AQL: Acceptable Quality Level “is the maximum percent nonconforming (or the maximum number of nonconformities per hundred units) that, for purposes of sampling inspection, can be considered satisfactory as a process average.” §4.2 Note: AQL is not lot or batch specific but rather a process average. AQL is stated in the standard as a percent: an AQL = 0.15 is a rate of 0.15 nonconforming units per 100 units or 0.15%.
35

ANSI Z1.4 – Normal Inspection
36
N=1250, acc=5
AQL=0.15%

Power of Attribute Sampling Plans
0.900.910.920.930.940.950.960.970.980.991.00
0.10
%
0.11
%
0.12
%
0.13
%
0.14
%
0.15
%
0.16
%
0.17
%
0.18
%
0.19
%
0.20
%
0.21
%
0.22
%
0.23
%
0.24
%
0.25
%
Prob
abili
ty o
f Acc
epta
nce
Percent Non-Conforming Units
Attribute Acceptance Sampling - OC Curve AQL = 0.15% n = 1250 a = 5
P(A) = 98.8% not 95%
37

0 was an unpublished report by the AOAC in 1927.
0 It was intended to be a quick rule of thumb for inspection of foods.
0 Since it was unpublished, there was not a description of the statistical basis of it.
38
𝑁 + 1
𝑁 + 1

0 There is no known statistical justification for the use of the square root of n plus one’ sampling plan.
0 “Despite the fact that there is no statistical basis for a ‘square root of n plus one’ sampling plan, most firms utilize this approach for incoming raw materials.”
Henson, E., A Pocket Guide to CGMP Sampling, IVT.
39
𝑁 + 1

Compare the Plans
40
0 ANSI/ASQ Z1.4
0 Lot Size N=1000
0 Sample size n=32
0 Acceptance Ac=0
0 Rejection Re=1
0 AQL=0.160%
0 LQ = 6.94%
0 Square root N plus one
0 Lot Size N=1000
0 Sample size n=33
0 Acceptance Ac=0
0 Rejection Re=1
0 AQL=0.153%
0 LQ = 6.63%

Case Study 0 Have a new product that requires potency of 45± 5.
During development, the average was found to be 45.2 with a SD of 3.2.
0 What sample size do we need to have 95% confidence with 99% reliability that the average will meet the requirement?
0 What sample size do we need to have 95% confidence with 99% reliability that the individual values will be the requirement?
41

Calculations (Mean)
42
𝑁 =𝑧𝛼 + 𝑧𝛽
2𝑠2
∆2
𝑁 =1.96 + 2.326 2 ∗ 3.22
50 − 45.2 2
𝑁 = 8.2
Round up to 9
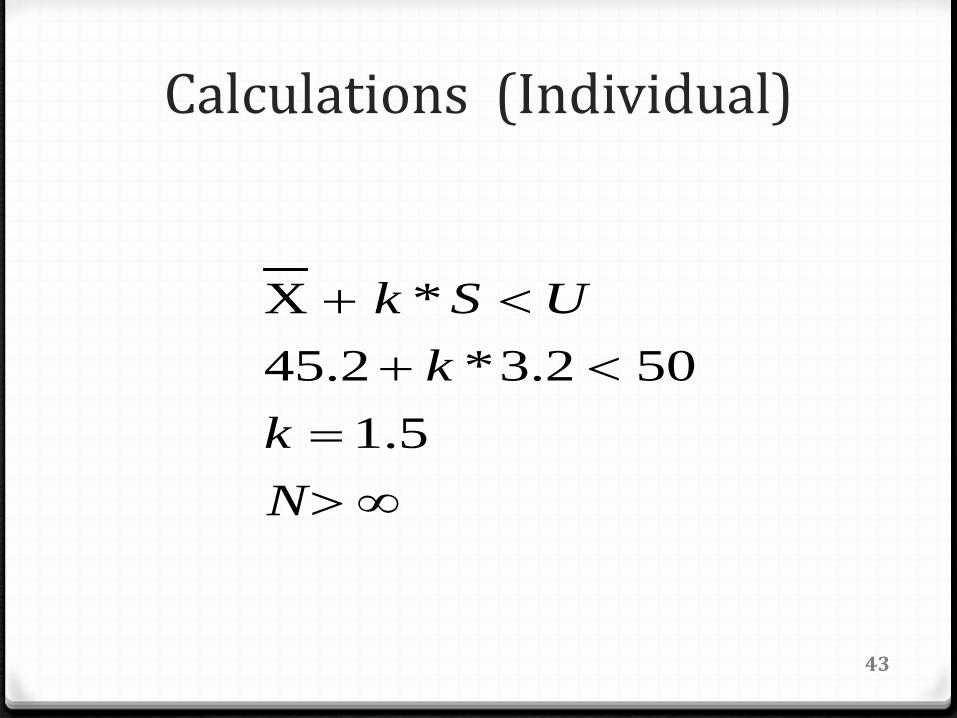
Calculations (Individual)
43
∞>=
<+<+
Nk
kUSk
5.1502.3*2.45
*X

Why the Difference?
0 A mean difference of 4.8 is different than having all the individual values between 40 and 50.
0 The capability analysis would show a Ppk of 0.50
44

Parting Thoughts
• There is no RIGHT answer, just different options. It depends on the risks you are willing to take
• Sampling plans can be developed for continuous or attribute characteristics
• It is important to know what you want your sample to tell you.
• Reportable units what sampling size calculations are based.
45

Thank You! Questions?
46
All questions are welcome To protect your privacy, anyone asking a question will be announced only by the first name of the person reported to the operator at initial dial-in. However, anyone in your group is welcome to ask a question. Please try to avoid using a speakerphone while asking your question. If you think of a question later, or prefer to research an issue privately, you are invited to contact the speaker at [email protected] We value your feedback Please complete and return the evaluation on the next page to be entered into a drawing for a $100 amazon.com gift card and/or arrange to receive a certificate verifying your participation in the 1.5 hours of this educational session. Handouts & audio files For an online copy of these slides, including live links to email addresses and cited websites, go to www.foiservices.com/safesam4166.htm This site also describes how to order an audio file of this presentation at a 50% attendee discount.

Training Evaluation Form Determining a Statisically Valid Sample Size:What Does FDA Expect to SeeSteven Walfish - November 30, 2016
Win a $100 Amazon.com Gift Certificate from FOI!Just complete this form and fax it to +1-301-569-7506 by December 7, 2016
and you will be entered in a drawing for an Amazon.com Gift Certificate
Please indicate your primary job responsibility (circle one):
Regulatory Affairs QA/QC Statistics Medical Writing Electronic Submissions General Management
Other (please specify):____________________________________
Please rate various aspects of this course (1 = Poor; 2=Fair; 3=Good; 4=Very Good; 5=Excellent – please circle your answers)
What is your overall rating of the course? 1 2 3 4 5
How do you rate the content of the course? 1 2 3 4 5
Were course materials clear and understandable? 1 2 3 4 5
Was the length of the course adequate to cover the content? 1 2 3 4 5
Was the instructor knowledgeable about the subject matter? 1 2 3 4 5
How would you rate the instructor overall? 1 2 3 4 5
Other comments: Please feel free to comment on any aspect of this course, including the instructor, content, and technical arrangements:
TC161130
By providing the information below and faxing this page to +1-301-569-7506 by December 7, 2016 you will be entered in a drawing for a $100 Amazon.com Gift Certificate from FOI.
Your Name: _______________________________________________________________________
Company Name: ___________________________________________________________________
Email Address: ____________________________________________________________
Check here to receive a Certification of Attendance verifying your 1.5 training contact hours for this educational session. Please provide your legibly printed name with your signature next to it, email address, and fax this form to the number below. Your certificate will be emailed to you.