Embed Size (px)
Citation preview
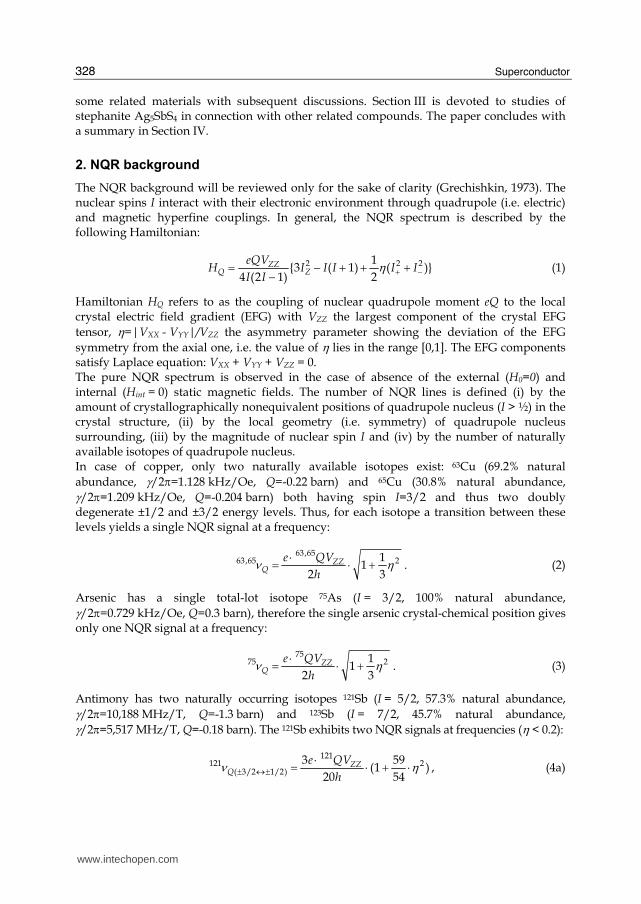
17
Determination of the Local Crystal-Chemical Features of Complex Chalcogenides by Copper,
Antimony, and Arsenic NQR
R.R. Gainov1,2, A.V. Dooglav1, I.N. Pen’kov2, A.Yu. Orlova1, I.A. Evlampiev1, N.N. Mozgova3, and R.R. Khasanov2
1Department of Physics, Kazan Federal University, Kazan, Kremlevskaya str. 18, 420008, 2Department of Geology, Kazan Federal University, Kazan, Kremlevskaya str. 4/5, 420111,
3Institute of geology of ore deposits, petrography, mineralogy and geochemistry of the Russian Academy of Science, Staromonetny per. 35, Moscow 109017,
Russian Federation
1. Introduction
In recent years, a number of reviews have appeared in scientific literature on the application of different physical methods in the structural-chemical and physical studies of solid state materials, for example, high-temperature superconductors (HTSC). An important place among them is occupied by nuclear-resonance methods, particular, nuclear magnetic resonance (NMR), nuclear quadrupole resonance (NQR), nuclear gamma resonance (NGR or Mössbauer spectroscopy) and other. Particularly, this article shows the feasibility of using the NQR method, in some instance, in the study of those features of material structure and chemistry, which are difficult or impossible to attack by conventional methods. The key advantage of NQR is a possibility to probe directly the electric (quadrupole) interactions between nuclei and their local environment. In general, the quadrupole interaction describes the coupling of the nuclear quadrupole moment to the electric field gradient (EFG). The EFG is determined by bond directions and electronic charge distribution, therefore the quadrupole interaction is a very sensitive tool for structural-chemical studies of condensed matter. Notably, it is possible to analyze NQR data (both the spectroscopic and the relaxation) in materials containing different structural copper (63,65Cu), arsenic (75As), and antimony (121,123Sb) complexes. This circumstance is especially important in the light of existence of two types of HTSC: Cu-oxide materials (cuprates) (Rigamonti et al., 1998) and As- and Sb-bearing pnictides (Wilson, 2009). Our article is devoted to brief review of some important spectroscopic experimental results obtained during the studies of binary chalcogenide CuS (also known as covellite), representing the unusual low-temperature superconductor, and ternary material Ag5SbS4 (referred to as a stephanite). Examples are taken mainly from the studies of the authors′ research group. The article is organized as follows. Section I contains necessary NQR background for 63,65Cu, 75As, 121,123Sb nuclei. In Section II we report our results concerning the covellite CuS and
www.intechopen.com
Superconductor
328
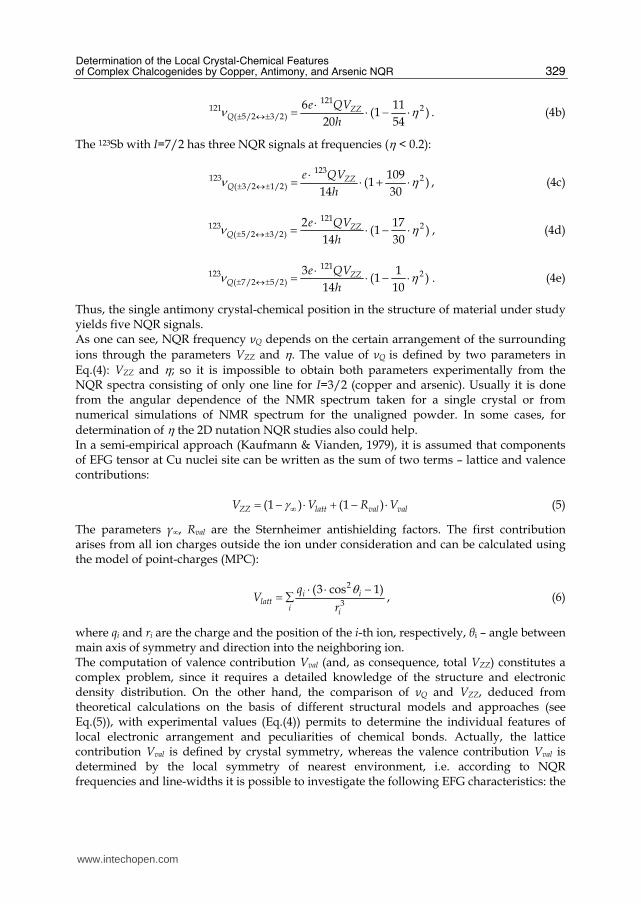
some related materials with subsequent discussions. Section III is devoted to studies of stephanite Ag5SbS4 in connection with other related compounds. The paper concludes with a summary in Section IV.
2. NQR background
The NQR background will be reviewed only for the sake of clarity (Grechishkin, 1973). The nuclear spins I interact with their electronic environment through quadrupole (i.e. electric) and magnetic hyperfine couplings. In general, the NQR spectrum is described by the following Hamiltonian:
2 2 21{3 ( 1) ( )}
4 (2 1) 2ZZ
Q Z
eQVH I I I I I
I Iη + −= − + + +− (1)
Hamiltonian HQ refers to as the coupling of nuclear quadrupole moment eQ to the local crystal electric field gradient (EFG) with VZZ the largest component of the crystal EFG tensor, η=|VXX - VYY|/VZZ the asymmetry parameter showing the deviation of the EFG symmetry from the axial one, i.e. the value of η lies in the range [0,1]. The EFG components satisfy Laplace equation: VXX + VYY + VZZ = 0. The pure NQR spectrum is observed in the case of absence of the external (H0=0) and internal (Hint = 0) static magnetic fields. The number of NQR lines is defined (i) by the amount of crystallographically nonequivalent positions of quadrupole nucleus (I > ½) in the crystal structure, (ii) by the local geometry (i.e. symmetry) of quadrupole nucleus surrounding, (iii) by the magnitude of nuclear spin I and (iv) by the number of naturally available isotopes of quadrupole nucleus. In case of copper, only two naturally available isotopes exist: 63Cu (69.2% natural abundance, γ/2π=1.128 kHz/Oe, Q=-0.22 barn) and 65Cu (30.8% natural abundance, γ/2π=1.209 kHz/Oe, Q=-0.204 barn) both having spin I=3/2 and thus two doubly degenerate ±1/2 and ±3/2 energy levels. Thus, for each isotope a transition between these levels yields a single NQR signal at a frequency:
63,65
63,65 211
2 3ZZ
Q
e QV
hν η⋅= ⋅ + . (2)
Arsenic has a single total-lot isotope 75As (I = 3/2, 100% natural abundance, γ/2π=0.729 kHz/Oe, Q=0.3 barn), therefore the single arsenic crystal-chemical position gives only one NQR signal at a frequency:
75
75 211
2 3ZZ
Q
e QV
hν η⋅= ⋅ + . (3)
Antimony has two naturally occurring isotopes 121Sb (I = 5/2, 57.3% natural abundance, γ/2π=10,188 MHz/T, Q=-1.3 barn) and 123Sb (I = 7/2, 45.7% natural abundance, γ/2π=5,517 MHz/T, Q=-0.18 barn). The 121Sb exhibits two NQR signals at frequencies (η < 0.2):
121
121 2( 3/2 1/2)
3 59(1 )
20 54ZZ
Q
e QV
hν η± ↔±
⋅= ⋅ + ⋅ , (4a)
www.intechopen.com
Determination of the Local Crystal-Chemical Features of Complex Chalcogenides by Copper, Antimony, and Arsenic NQR
329
121
121 2( 5/2 3/2)
6 11(1 )
20 54ZZ
Q
e QV
hν η± ↔±
⋅= ⋅ − ⋅ . (4b)
The 123Sb with I=7/2 has three NQR signals at frequencies (η < 0.2):
123
123 2( 3/2 1/2)
109(1 )
14 30ZZ
Q
e QV
hν η± ↔±
⋅= ⋅ + ⋅ , (4c)
121
123 2( 5/2 3/2)
2 17(1 )
14 30ZZ
Q
e QV
hν η± ↔±
⋅= ⋅ − ⋅ , (4d)
121
123 2( 7/2 5/2)
3 1(1 )
14 10ZZ
Q
e QV
hν η± ↔±
⋅= ⋅ − ⋅ . (4e)
Thus, the single antimony crystal-chemical position in the structure of material under study yields five NQR signals. As one can see, NQR frequency νQ depends on the certain arrangement of the surrounding ions through the parameters VZZ and η. The value of νQ is defined by two parameters in Eq.(4): VZZ and η; so it is impossible to obtain both parameters experimentally from the NQR spectra consisting of only one line for I=3/2 (copper and arsenic). Usually it is done from the angular dependence of the NMR spectrum taken for a single crystal or from numerical simulations of NMR spectrum for the unaligned powder. In some cases, for determination of η the 2D nutation NQR studies also could help. In a semi-empirical approach (Kaufmann & Vianden, 1979), it is assumed that components of EFG tensor at Cu nuclei site can be written as the sum of two terms – lattice and valence contributions:
(1 ) (1 )ZZ latt val valV V R Vγ ∞= − ⋅ + − ⋅ (5)
The parameters γ∞, Rval are the Sternheimer antishielding factors. The first contribution arises from all ion charges outside the ion under consideration and can be calculated using the model of point-charges (MPC):
2
3(3 cos 1)i i
latti i
qV
r
θ⋅ ⋅ −= ∑ , (6)
where qi and ri are the charge and the position of the i-th ion, respectively, ┠i – angle between main axis of symmetry and direction into the neighboring ion. The computation of valence contribution Vval (and, as consequence, total VZZ) constitutes a complex problem, since it requires a detailed knowledge of the structure and electronic density distribution. On the other hand, the comparison of νQ and VZZ, deduced from theoretical calculations on the basis of different structural models and approaches (see Eq.(5)), with experimental values (Eq.(4)) permits to determine the individual features of local electronic arrangement and peculiarities of chemical bonds. Actually, the lattice contribution Vval is defined by crystal symmetry, whereas the valence contribution Vval is determined by the local symmetry of nearest environment, i.e. according to NQR frequencies and line-widths it is possible to investigate the following EFG characteristics: the
www.intechopen.com
Superconductor
330
electronic density distribution inside of different coordination complexes and their symmetry, the extent of ionic (covalent) bonds and angles between them. Every factor, which is connected with reorganization of atomic or molecular group, can change significantly the EFG value on the nucleus inside of a such group and, as consequence, NQR is very sensitive to different crystal-chemical transformations in crystal lattice. Therefore, the studies of temperature dependences of NQR spectroscopic parameters give the possibility to find phase transitions and investigate their nature.
3. Towards to electronic structure of binary copper chalcogenides
There is a great number of compounds in the system of binary copper chalcogenides Cu-S, Cu-Se, and Cu-Te. In particular, materials eleven natural minerals and two unstable synthetic phases among only binary copper-sulfide have been discovered up to date (Goble, 1985; Gablina, 1997). Many of them are widely used in optoelectronics (Abrikosov et al., 1975; Isac et al., 2007) and some of them represent the industrial mineral specimens in copper-ore deposits (Izoitko, 1997). The more significant involving of these compounds into the practical application is stopped by the fact that currently available standard instrumental techniques for studying crystal-chemical problems such as X-ray structural diagnosis, optical spectroscopy, and electronic microscopy have inherent limitations (Gablina, 1997). These manifest themselves in being unable to characterize the chalcogenides samples fully, especially if they are polycrystalline. These methods are mainly ineffective and little informative in case of multiphase natural samples (minerals) (Gablina, 1997). This Section describes briefly the spectroscopic studies of layered low-temperature superconductor CuS (covellite, originally published in (Gainov et al., 2009)) and related, potentially perspective, but insufficiently known compounds: non-stoichiometric sulfide Cu1.6S (naturally occurring as geerite) and selenium analog of CuS – ┙-CuSe (klockmannite). The description of experimental methodic and synthesis conditions can be found in (Gainov et al., 2009).
3.1 Crystal-chemistry of CuS, Cu1.6S, and α-CuSe
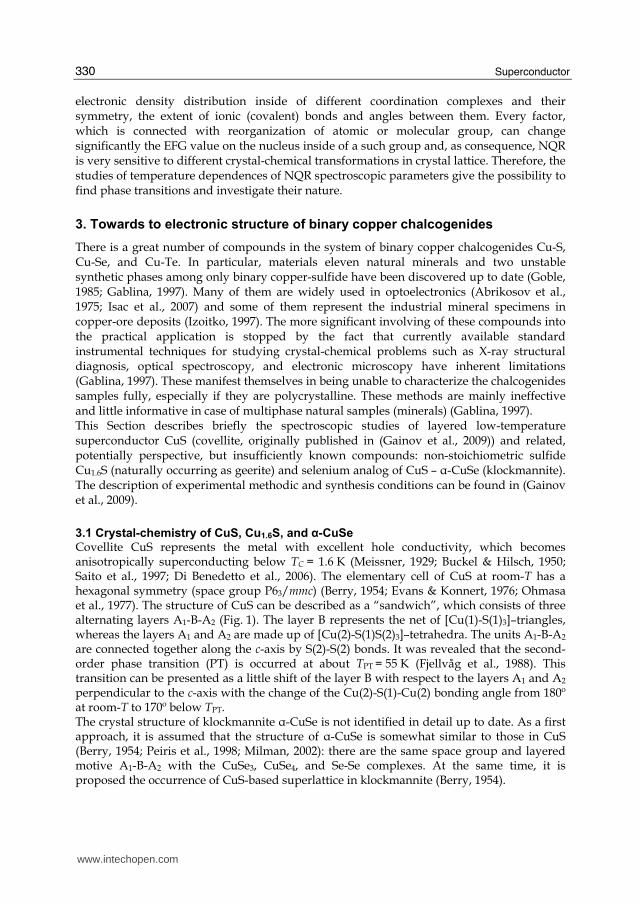
Covellite CuS represents the metal with excellent hole conductivity, which becomes anisotropically superconducting below TC = 1.6 K (Meissner, 1929; Buckel & Hilsch, 1950; Saito et al., 1997; Di Benedetto et al., 2006). The elementary cell of CuS at room-T has a hexagonal symmetry (space group P63/mmc) (Berry, 1954; Evans & Konnert, 1976; Ohmasa et al., 1977). The structure of CuS can be described as a “sandwich”, which consists of three alternating layers A1-B-A2 (Fig. 1). The layer B represents the net of [Cu(1)-S(1)3]–triangles, whereas the layers A1 and A2 are made up of [Cu(2)-S(1)S(2)3]–tetrahedra. The units A1-B-A2 are connected together along the c-axis by S(2)-S(2) bonds. It was revealed that the second-order phase transition (PT) is occurred at about TPT = 55 K (Fjellvåg et al., 1988). This transition can be presented as a little shift of the layer B with respect to the layers A1 and A2 perpendicular to the c-axis with the change of the Cu(2)-S(1)-Cu(2) bonding angle from 180º at room-T to 170º below TPT. The crystal structure of klockmannite ┙-CuSe is not identified in detail up to date. As a first approach, it is assumed that the structure of ┙-CuSe is somewhat similar to those in CuS (Berry, 1954; Peiris et al., 1998; Milman, 2002): there are the same space group and layered motive A1-B-A2 with the CuSe3, CuSe4, and Se-Se complexes. At the same time, it is proposed the occurrence of CuS-based superlattice in klockmannite (Berry, 1954).
www.intechopen.com
Determination of the Local Crystal-Chemical Features of Complex Chalcogenides by Copper, Antimony, and Arsenic NQR
331
The structure of geerite Cu1.6S is unsolved. It was suggested only that Cu1.6S can have a structure with the blende-like subcell (Goble, 1985).
Fig. 1. Crystal structure of the covellite CuS above TPT = 55 K. For details, see text
3.2 NQR spectra of CuS, Cu1.6S, α-CuSe
In Table I the NQR frequencies observed for the title materials together with previously published data are listed. As one can see, the values of NQR frequencies are quite different. However, their comparison and analysis can allows us to reveal some unique features of compounds studied. Let us start from the covellite CuS. It was found that copper NQR spectra of both synthetic and natural samples of CuS contain two copper pairs (Gainov et al., 2009). The presence of two spectral pairs permits us to assert that NQR spectra reflect the occurrence of two crystallographically non-equivalent sites of copper nuclei in CuS. The first pair, attributed to three-coordinated Cu(1), is placed at 14.88 (63Cu, 4.2 K) and 13.77 MHz (65Cu, 4.2 K) (Fig. 2(a)), whereas the second pair, assigned to four-coordinated Cu(2) site (not shown here, see (Gainov et al., 2009)), is located at 1.87 (63Cu, 4.2 K) and 1.73 MHz (65Cu, 4.2 K). In general, there is no EFG at the sites with cubic local symmetry (Slichter, 1996). This case is takes place for the tetrahedral Cu(2) sites in layers A1 and A2 (Fig. 1). However, significant deformations of the CuS4 tetrahedrons break the cubic symmetry and, as consequence, EFG on the copper nucleus in this position becomes nonzero. The appearance of low-frequency NQR signals points that this case is realized actually for the tetrahedral Cu(2) sites in CuS. Therefore, our NQR spectra prove strongly the crystallographic data (Fjellvåg et al., 1988) concerning the occurrence of low-symmetry distortions around Cu(2) sites below TPT = 55 K. Other words, NQR spectra can serve as an independent confirmation of the low-T model of the CuS structure.
www.intechopen.com
Superconductor
332
Material Positions 63Cu NQR frequencies 1, MHz
(T = 4.2 K)
Site 1 14.89 CuS (covellite) Site 2 1.87 Site 1 16.95 Site 2 16.20 Site 3 15.25 Site 4 11.95
Cu1.6S (geerite)
Site ? Below 2 MHz? Site 1 12.17 Site 2 11.89 Site 3 9.49 Site 4 9.39 Site 5 8.27 Site 6 6.60 Site 7 6.50 Site 8 4.49 Site 9 4.01
Site 10 3.75 Site 11 3.29 Site 12 2.83
┙-CuSe (klockmannite)
Site 13 2.09 1 The values of NQR frequencies for 65Cu isotope can be calculated in accordance with ratio νQ(63Cu)/νQ(65Cu) = 1,081.
Table I. NQR frequencies for CuS and some related compounds.
High-frequency NQR spectra, corresponding to triangular Cu(1), are also intriguing (Fig. 2(a)). It is notable that these NQR signals are placed at lower frequency range in comparison with the region of 20-25 MHz, in frame of which NQR signals of majority of other copper sulfides lie (Abdullin et al., 1987). In case of copper sulfides EFG is mainly formed by the lattice term and a quite narrow range of the νQ changes can be explained by insignificant variations of the Cu-S distances, S-Cu-S angles and the polarity of chemical bonds. In fact, such conclusion was checked by theoretical calculations according to Mulliken-Wolfsberg-Helmholtz method (Abdullin et al., 1987). This result indicates directly that the valence contribution for the EFG at the Cu(1) site in CuS is more considerable than in case of triangular units CuS3 of other sulfides. Analysis shows that the more probable reason of this unusual νQ lowering is connected with anomalously short Cu(1)-S distances in CuS (2.19 Å) compared to those in other sulfides (≈ 2.33 Å). It seems, however, that due to Bayer’s influence of thermal-induced lattice vibrations, NQR frequency νQ must increase with decreasing distances as it takes place in most compounds (Semin et al., 1975): according to MPC model (Eq.(6)), EFG is inversely proportional to the distance between metal and ligand. On the other hand, the shortening of metal–ligand distances can lead to charge transfer with subsequent redistribution on the different orbitals (Semin et al., 1975). In our case this process can be related to the charge transfer between valency Cu-4p,3d and S-3p orbitals (Gainov et al., 2009). Indeed, in frame of the semi-empirical approach (Section I), the valence contribution to the EFG, Vval, is related particularly to the various electronic hole densities as follows:
www.intechopen.com
Determination of the Local Crystal-Chemical Features of Complex Chalcogenides by Copper, Antimony, and Arsenic NQR
333
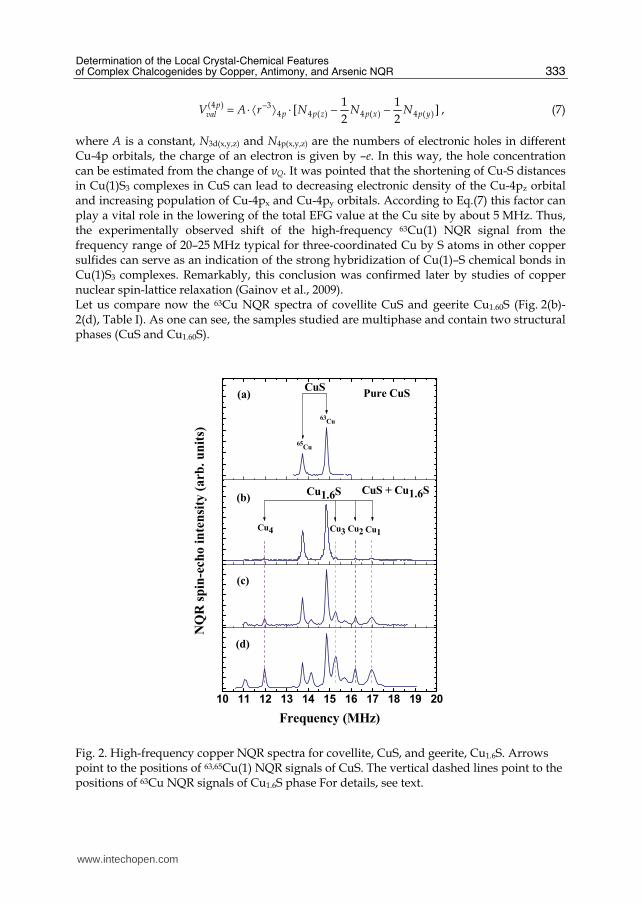
(4 ) 34 4 ( ) 4 ( ) 4 ( )
1 1[ ]
2 2p
p p z p x p yvalV A r N N N−= ⋅ ⟨ ⟩ ⋅ − − , (7)
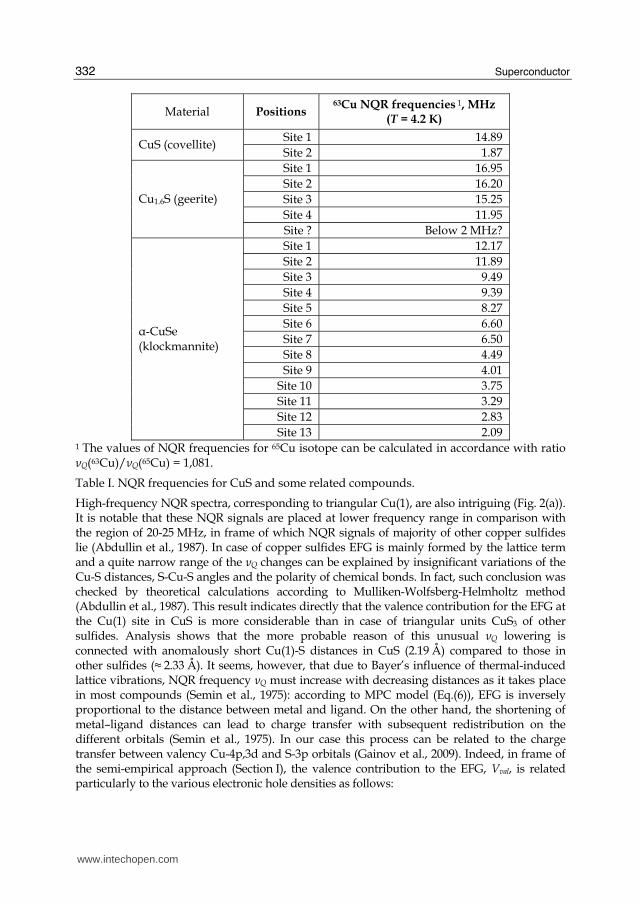
where A is a constant, N3d(x,y,z) and N4p(x,y,z) are the numbers of electronic holes in different Cu-4p orbitals, the charge of an electron is given by –e. In this way, the hole concentration can be estimated from the change of νQ. It was pointed that the shortening of Cu-S distances in Cu(1)S3 complexes in CuS can lead to decreasing electronic density of the Cu-4pz orbital and increasing population of Cu-4px and Cu-4py orbitals. According to Eq.(7) this factor can play a vital role in the lowering of the total EFG value at the Cu site by about 5 MHz. Thus, the experimentally observed shift of the high-frequency 63Cu(1) NQR signal from the frequency range of 20–25 MHz typical for three-coordinated Cu by S atoms in other copper sulfides can serve as an indication of the strong hybridization of Cu(1)–S chemical bonds in Cu(1)S3 complexes. Remarkably, this conclusion was confirmed later by studies of copper nuclear spin-lattice relaxation (Gainov et al., 2009). Let us compare now the 63Cu NQR spectra of covellite CuS and geerite Cu1.60S (Fig. 2(b)-2(d), Table I). As one can see, the samples studied are multiphase and contain two structural phases (CuS and Cu1.60S).
10 11 12 13 14 15 16 17 18 19 20
(d)
Frequency (MHz)
(c)
Cu3 Cu2
CuS + Cu1.6S
(b)
Cu1
CuS
Cu1.6S
63Cu
NQ
R s
pin
-ech
o i
nte
nsi
ty (
arb
. u
nit
s)
Pure CuS
65Cu
Cu4
(a)
Fig. 2. High-frequency copper NQR spectra for covellite, CuS, and geerite, Cu1.6S. Arrows point to the positions of 63,65Cu(1) NQR signals of CuS. The vertical dashed lines point to the positions of 63Cu NQR signals of Cu1.6S phase For details, see text.
www.intechopen.com
Superconductor
334
The principle difference between samples is a variation of quantitative proportion of CuS and Cu1.60S. The NQR spectra of such samples are convenient for detailed discussion. As indicated in Fig. 2, at high-frequency range (10.00-17.00 MHz) there are five copper NQR pairs, one of them corresponds to covellite CuS (exact coincidence of Cu line frequencies); the additional four Cu pairs belong to another structural phase – geerite Cu1.60S. Notably, the NQR spectra, which pertain to this phase, coincide in all multiphase samples and include the following lines: 16.95, 16.20, 15.25, 11.95 MHz for 63Cu and 15.67, 14.98, 14.11, 11.06 MHz for 65Cu. It should be noted that our results prove fully the previous data for Cu1.6S (Anashkin et al., 1994), according to which these eight Cu NQR lines have been observed at the same frequencies. It is interesting that the NQR signal intensities of Cu1.6S phase increase with increasing amount of Cu1.6S and, simultaneously, the signals intensities of CuS decrease according to the same proportion (Fig. 2). We not here that this fact can in general serve as supplementary striking evidence for the possibility to use NQR method in qualitative and quantitative phase-analytical diagnostics of different chalcogenides. As it was pointed above (Section I), the number of NQR centers in the structure of material studied is not less than the amount of crystallographically non-equivalent positions of resonant nuclei. At least four centers exist in case of geerite Cu1.6S (four pairs of 63Cu and 65Cu lines). Hence, the total number of different crystal-chemical sites of copper in this compound is not less than four. This circumstance reflects the serious distinction in symmetry of CuS and Cu1.6S electronic structures. On the other hand, we can see that the range of 10.00-17.00 MHz, in frame of which eight 63,65Cu lines of Cu1.6S are located, is also not typical for NQR signals exhibited by most of copper sulfides. Moreover, NQR lines of Cu1.6S are grouped around the high-frequency Cu NQR signal of covellite CuS. Taking into account these two aspects, it is possible to claim that the electronic structures of CuS and Cu1.60S are still different, but they have the same crystal-chemical motive. In principle, our NQR results suggest that the structure Cu1.60S can be interpreted as the derivative of covellite CuS structure with the strong deformations. To our knowledge, this conclusion is a first experimental argument in favor of crystallographical proximity between CuS and Cu1.60S phases. We turn now to the 63Cu NQR spectrum for CuS and the 63Cu NQR spectrum for selenium analog of CuS – klockmannite, ┙-CuSe (Table I). Their comparative analysis can also introduce new information concerning their electronic structure as well as highlight some reasons for low-temperature phase transitions in these materials (Section II.1). In general, the copper selenide CuSe undergoes two phase transitions upon cooling: from ┛-CuSe into ┚-CuSe modification near 398 K and to ┙-CuSe at 323 K (Nozaki et al., 1995; Milman, 2002). It was proposed that ┙-CuSe has the same structure as CuS (Berry, 1954) and the ┚–┛ transformation of CuSe is similar to that in CuS at TPT=55 K (Nozaki et al., 1995). Notably, Raman spectroscopy and powder X-ray diffratometry shows that in the system of CuS1-xSex (0≤x≤1) compounds TPT increases from 55 K for x=0 up to 398 K for x=1 (Nozaki et al., 1995). However, it was found that ┙-CuSe is characterized by 13 lines in the spectrum with NQR frequencies in the range of 13–2 MHz at 4.2 K. First, this aspect points strongly to the presence of strong deformations of the ┙-CuSe crystal and gives evidence that CuS and ┙-CuSe are not isostructural as it was supposed earlier (Berry, 1954). It is clearly seen that ┙-CuSe has at least 13 non-equivalent Cu positions. These data point that ┙-CuSe can be considered as distorted version of CuS-based structure. Second, 63Cu NQR frequencies in ┙-CuSe are rather low as compared with that in CuS. This indicates that insertion of Se atoms
www.intechopen.com
Determination of the Local Crystal-Chemical Features of Complex Chalcogenides by Copper, Antimony, and Arsenic NQR
335
instead of S in CuS results in the conversion of Cu(1) threefold units (Fig. 1) into distorted fourfold ones in CuS1-xSex. However, such a substitution mechanism implies basically the preservation of layered structural motive in CuS1-xSex (as in CuS). The preferential occupation of Se at the S(2) sites (Nozaki et al., 1995) leads to the approaching of some Se(2) atoms to Cu(1) sites and to the formation of distorted tetrahedrons Cu(1)Se(1)3Se(2)1 in ┙-CuSe instead of triangular units Cu(1)S(1)3 in CuS (Fig. 1). In this case such deformations would promote the approaching of Cu(1) and Cu(2) ions to each other and creation of an effective interaction between them, as it was proposed for CuS and ┙-CuSe earlier (Fjellvåg et al., 1988; Milman, 2002). Upon cooling this interaction can stimulate the phase transition. Such scenario is supported by the dependence of the TPT value on the Se amount in mixed samples CuS1-xSex (0≤x≤1) (Nozaki et al., 1995). Actually, since the Cu(1)-Cu(2) bonds in CuS are longer than that in CuS1-xSex, this phase transition in CuS occurs at lower T. Thus, NQR spectra signify that ┙-CuSe material is related crystal-chemically to CuS and have a somewhat similar layered structure, but either of Cu(1)Se3 and Cu(2)Se4 complexes in this compound are strongly distorted and this aspect leads again to layered A1-B-A2 structure, as in CuS, but with different and uncertain structures of layers A1, A2, and B (Fig. 1).
3.3 Temperature dependences of NQR spectra of CuS, Cu1.6S, α-CuSe
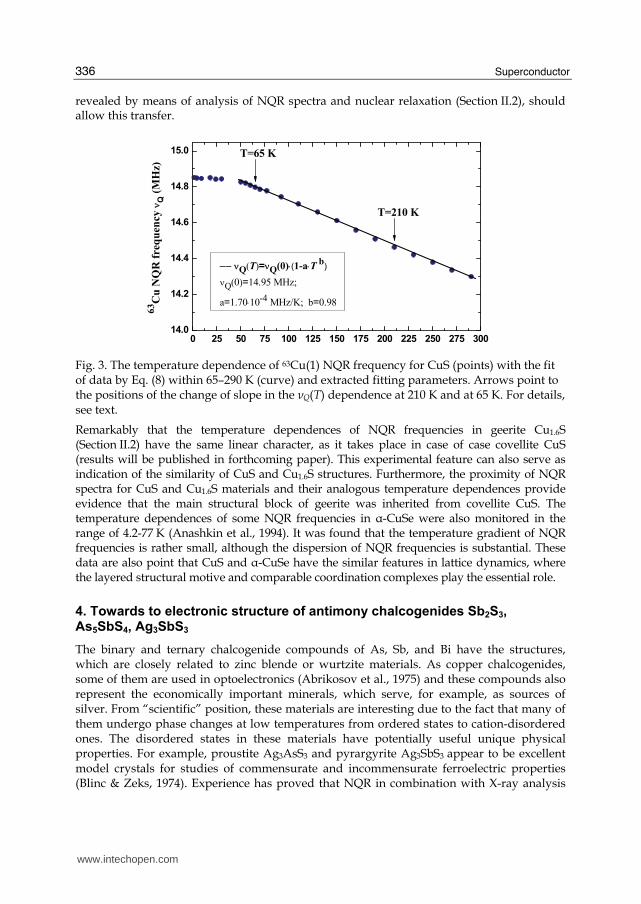
The dependence of the high-frequency 63Cu(1) NQR line of CuS on temperature is shown in Fig. 3. As one can see, the quadrupole frequency νQ decreases with increasing temperature without significant anomalies. However, there exist two weak effects: the change of the slope in the temperature dependence of νQ at 65 K (near TPT) and 210 K. In order to describe an approximate behavior of νQ in the region of 65–290 K we applied the following equation (Kaufmann & Vianden, 1979):
( ) (0) (1 )bQ QT a Tν ν= ⋅ − ⋅ , (8)
where νQ(0), a and b are the fitting parameters. The best result of fitting depicted in Fig. 3 by solid curve was obtained for νQ(0) = (14.95 ± 0.02) MHz, a = (1.7 ± 0.5)*10-4 MHz/K and b = (0.98 ± 0.05). It has been argued that the dependence of the NQR frequency in CuS on temperature can be understood in terms of charge fluctuations in Cu(1)-S(1)-Cu(2) bonds. It is known that a lot of non-cubic metals νQ(T) can be well reproduced by the empirical Eq. (8) with b=1.5; this relation is often referred to as the “T 3/2 law” (Kaufmann & Vianden, 1979). No reliable explanation of the T 3/2 temperature dependence of νQ has been presented in the literature (Kaufmann & Vianden, 1979; Torumba et al., 2006). However, it is proposed that thermal vibrations of the host lattice atoms are regarded as responsible for such universal relation. CuS shows another relation – parameter b is close to 1 and, as consequence, νQ(T) does not follow the T 3/2 law. Such unusual behavior of νQ is observed in mixed-valence metals, for example, in EuCu2Si2 (Sampathkumaran, et al., 1979). The principle distinction of mixed-valence metals from “simple” ones is a variable number of conduction electrons (holes), which can “stick” temporary to ionic orbitals as valence electrons (holes). This valence instability initiated by Eu ions influences indirectly the Cu quadrupole interactions (VZZ) and, as it was shown experimentally, the T 3/2 law becomes not valid. Since in the range of 60–290 K there are no structural changes in CuS (┟ ≈ 0), the dependence of νQ on temperature is determined only by VZZ. In a similar manner, the bridging S(1) ion in CuS can provide a minor charge transfer between Cu(1) and Cu(2) in some fluctuating regime. The strong hybridization of Cu(1) and Cu(2) conduction bands via S(1) atom, which was
www.intechopen.com
Superconductor
336
revealed by means of analysis of NQR spectra and nuclear relaxation (Section II.2), should allow this transfer.
0 25 50 75 100 125 150 175 200 225 250 275 30014.0
14.2
14.4
14.6
14.8
15.0
T=210 K
63C
u N
QR
freq
uen
cy
ν Q (
MH
z)
−− νQ(T)=νQ(0)⋅(1-a⋅T b)
νQ(0)=14.95 MHz;
a=1.70⋅10-4 MHz/K; b=0.98
T=65 K
Fig. 3. The temperature dependence of 63Cu(1) NQR frequency for CuS (points) with the fit of data by Eq. (8) within 65–290 K (curve) and extracted fitting parameters. Arrows point to the positions of the change of slope in the νQ(T) dependence at 210 K and at 65 K. For details, see text.
Remarkably that the temperature dependences of NQR frequencies in geerite Cu1.6S (Section II.2) have the same linear character, as it takes place in case of case covellite CuS (results will be published in forthcoming paper). This experimental feature can also serve as indication of the similarity of CuS and Cu1.6S structures. Furthermore, the proximity of NQR spectra for CuS and Cu1.6S materials and their analogous temperature dependences provide evidence that the main structural block of geerite was inherited from covellite CuS. The temperature dependences of some NQR frequencies in ┙-CuSe were also monitored in the range of 4.2-77 K (Anashkin et al., 1994). It was found that the temperature gradient of NQR frequencies is rather small, although the dispersion of NQR frequencies is substantial. These data are also point that CuS and ┙-CuSe have the similar features in lattice dynamics, where the layered structural motive and comparable coordination complexes play the essential role.
4. Towards to electronic structure of antimony chalcogenides Sb2S3, As5SbS4, Ag3SbS3
The binary and ternary chalcogenide compounds of As, Sb, and Bi have the structures, which are closely related to zinc blende or wurtzite materials. As copper chalcogenides, some of them are used in optoelectronics (Abrikosov et al., 1975) and these compounds also represent the economically important minerals, which serve, for example, as sources of silver. From “scientific” position, these materials are interesting due to the fact that many of them undergo phase changes at low temperatures from ordered states to cation-disordered ones. The disordered states in these materials have potentially useful unique physical properties. For example, proustite Ag3AsS3 and pyrargyrite Ag3SbS3 appear to be excellent model crystals for studies of commensurate and incommensurate ferroelectric properties (Blinc & Zeks, 1974). Experience has proved that NQR in combination with X-ray analysis
www.intechopen.com
Determination of the Local Crystal-Chemical Features of Complex Chalcogenides by Copper, Antimony, and Arsenic NQR
337
can be as an effective tool for studies of detailed aspects of such phases (Blinc & Zeks, 1974). In spite of this fact, some related materials (for instance, phase of stephanite, Ag5SbS4) are little known from crystal-chemical and physical point of views. In order to highlight the electronic features of Ag5SbS4, we present here some modern NQR data concerning this compound and comparative analysis in the context of associated materials, such as stibnite (antimonite) Sb2S3 and pyrargyrite Ag3SbS3.
4.1 Crystal-chemistry of Sb2S3, As5SbS4, Ag3SbS3
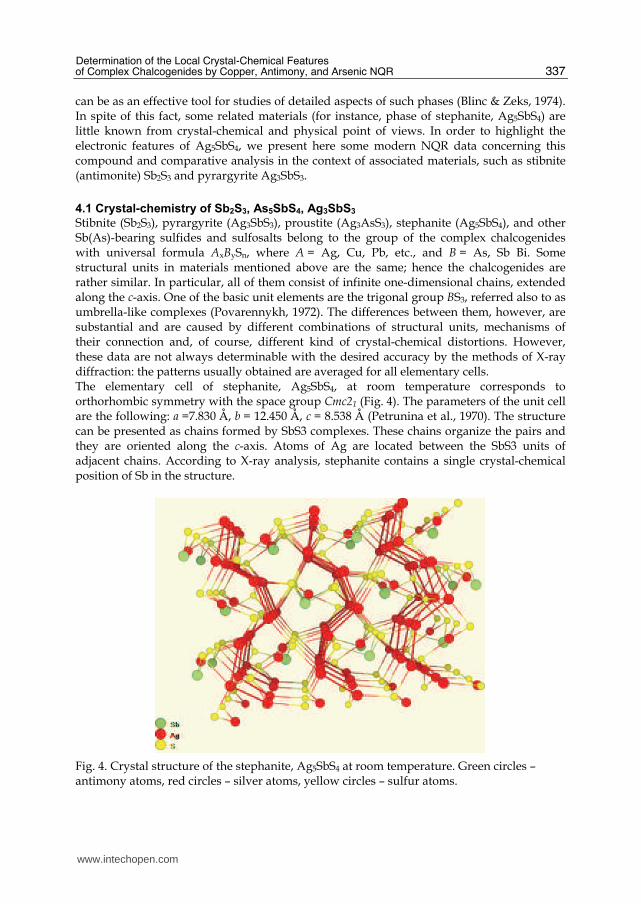
Stibnite (Sb2S3), pyrargyrite (Ag3SbS3), proustite (Ag3AsS3), stephanite (Ag5SbS4), and other Sb(As)-bearing sulfides and sulfosalts belong to the group of the complex chalcogenides with universal formula AxBySn, where A = Ag, Cu, Pb, etc., and B = As, Sb Bi. Some structural units in materials mentioned above are the same; hence the chalcogenides are rather similar. In particular, all of them consist of infinite one-dimensional chains, extended along the c-axis. One of the basic unit elements are the trigonal group BS3, referred also to as umbrella-like complexes (Povarennykh, 1972). The differences between them, however, are substantial and are caused by different combinations of structural units, mechanisms of their connection and, of course, different kind of crystal-chemical distortions. However, these data are not always determinable with the desired accuracy by the methods of X-ray diffraction: the patterns usually obtained are averaged for all elementary cells. The elementary cell of stephanite, Ag5SbS4, at room temperature corresponds to orthorhombic symmetry with the space group Cmc21 (Fig. 4). The parameters of the unit cell are the following: a =7.830 Å, b = 12.450 Å, c = 8.538 Å (Petrunina et al., 1970). The structure can be presented as chains formed by SbS3 complexes. These chains organize the pairs and they are oriented along the c-axis. Atoms of Ag are located between the SbS3 units of adjacent chains. According to X-ray analysis, stephanite contains a single crystal-chemical position of Sb in the structure.
Fig. 4. Crystal structure of the stephanite, Ag5SbS4 at room temperature. Green circles – antimony atoms, red circles – silver atoms, yellow circles – sulfur atoms.
www.intechopen.com
Superconductor
338
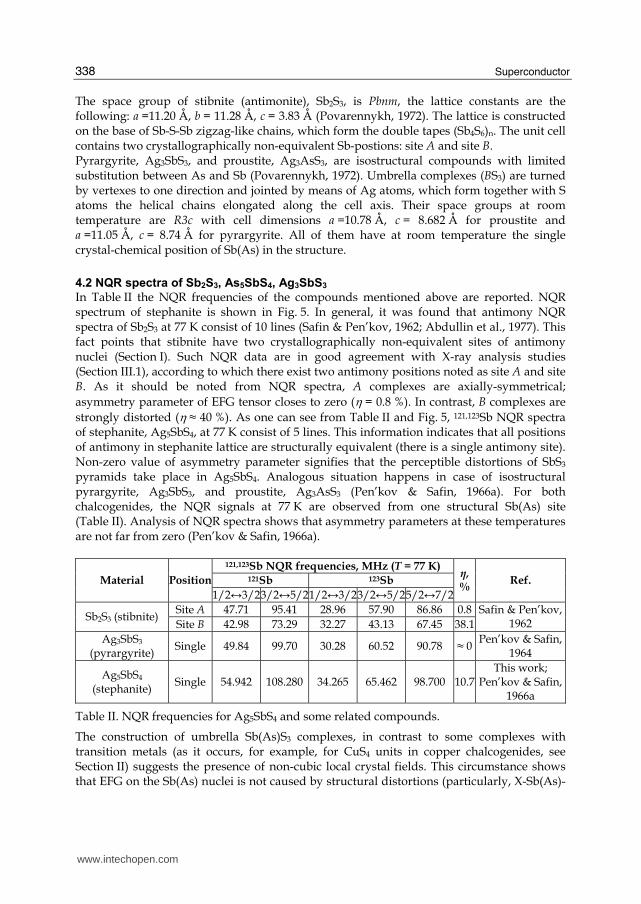
The space group of stibnite (antimonite), Sb2S3, is Pbnm, the lattice constants are the following: a =11.20 Å, b = 11.28 Å, c = 3.83 Å (Povarennykh, 1972). The lattice is constructed on the base of Sb-S-Sb zigzag-like chains, which form the double tapes (Sb4S6)n. The unit cell contains two crystallographically non-equivalent Sb-postions: site A and site B. Pyrargyrite, Ag3SbS3, and proustite, Ag3AsS3, are isostructural compounds with limited substitution between As and Sb (Povarennykh, 1972). Umbrella complexes (BS3) are turned by vertexes to one direction and jointed by means of Ag atoms, which form together with S atoms the helical chains elongated along the cell axis. Their space groups at room temperature are R3c with cell dimensions a =10.78 Å, c = 8.682 Å for proustite and a =11.05 Å, c = 8.74 Å for pyrargyrite. All of them have at room temperature the single crystal-chemical position of Sb(As) in the structure.
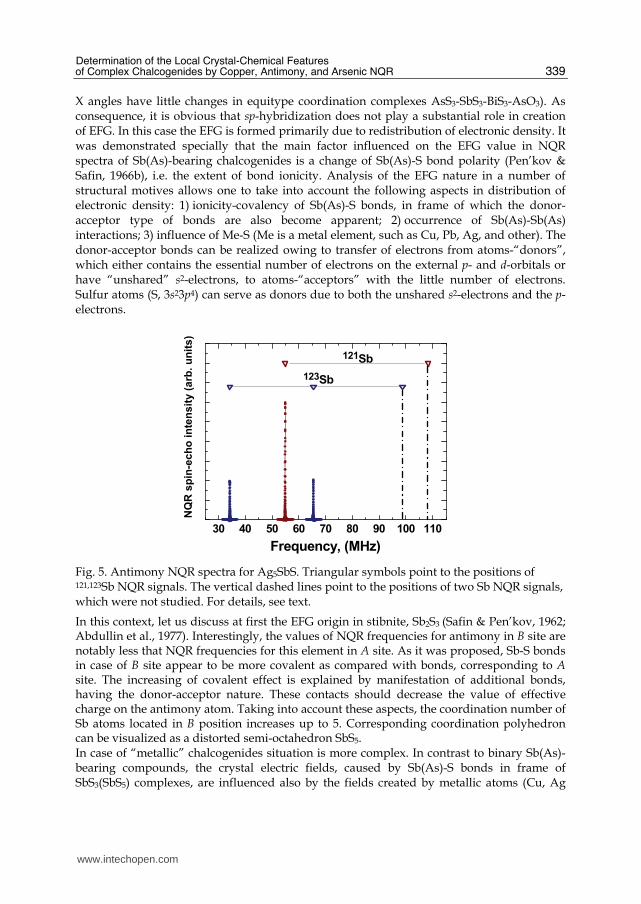
4.2 NQR spectra of Sb2S3, As5SbS4, Ag3SbS3
In Table II the NQR frequencies of the compounds mentioned above are reported. NQR spectrum of stephanite is shown in Fig. 5. In general, it was found that antimony NQR spectra of Sb2S3 at 77 K consist of 10 lines (Safin & Pen’kov, 1962; Abdullin et al., 1977). This fact points that stibnite have two crystallographically non-equivalent sites of antimony nuclei (Section I). Such NQR data are in good agreement with X-ray analysis studies (Section III.1), according to which there exist two antimony positions noted as site A and site B. As it should be noted from NQR spectra, A complexes are axially-symmetrical; asymmetry parameter of EFG tensor closes to zero (η = 0.8 %). In contrast, B complexes are strongly distorted (η ≈ 40 %). As one can see from Table II and Fig. 5, 121,123Sb NQR spectra of stephanite, Ag5SbS4, at 77 K consist of 5 lines. This information indicates that all positions of antimony in stephanite lattice are structurally equivalent (there is a single antimony site). Non-zero value of asymmetry parameter signifies that the perceptible distortions of SbS3
pyramids take place in Ag5SbS4. Analogous situation happens in case of isostructural pyrargyrite, Ag3SbS3, and proustite, Ag3AsS3 (Pen’kov & Safin, 1966a). For both chalcogenides, the NQR signals at 77 K are observed from one structural Sb(As) site (Table II). Analysis of NQR spectra shows that asymmetry parameters at these temperatures are not far from zero (Pen’kov & Safin, 1966a).
121,123Sb NQR frequencies, MHz (T = 77 K) 121Sb 123Sb Material Position
1/2↔3/23/2↔5/21/2↔3/23/2↔5/25/2↔7/2
η, %
Ref.
Site A 47.71 95.41 28.96 57.90 86.86 0.8Sb2S3 (stibnite) Site B 42.98 73.29 32.27 43.13 67.45 38.1
Safin & Pen’kov, 1962
Ag3SbS3 (pyrargyrite) Single 49.84 99.70 30.28 60.52 90.78 ≈ 0 Pen’kov & Safin,
1964
Ag5SbS4 (stephanite) Single 54.942 108.280 34.265 65.462 98.700 10.7
This work; Pen’kov & Safin,
1966a
Table II. NQR frequencies for Ag5SbS4 and some related compounds.
The construction of umbrella Sb(As)S3 complexes, in contrast to some complexes with transition metals (as it occurs, for example, for CuS4 units in copper chalcogenides, see Section II) suggests the presence of non-cubic local crystal fields. This circumstance shows that EFG on the Sb(As) nuclei is not caused by structural distortions (particularly, X-Sb(As)-
www.intechopen.com
Determination of the Local Crystal-Chemical Features of Complex Chalcogenides by Copper, Antimony, and Arsenic NQR
339
X angles have little changes in equitype coordination complexes AsS3-SbS3-BiS3-AsO3). As consequence, it is obvious that sp-hybridization does not play a substantial role in creation of EFG. In this case the EFG is formed primarily due to redistribution of electronic density. It was demonstrated specially that the main factor influenced on the EFG value in NQR spectra of Sb(As)-bearing chalcogenides is a change of Sb(As)-S bond polarity (Pen’kov & Safin, 1966b), i.e. the extent of bond ionicity. Analysis of the EFG nature in a number of structural motives allows one to take into account the following aspects in distribution of electronic density: 1) ionicity-covalency of Sb(As)-S bonds, in frame of which the donor-acceptor type of bonds are also become apparent; 2) occurrence of Sb(As)-Sb(As) interactions; 3) influence of Me-S (Me is a metal element, such as Cu, Pb, Ag, and other). The donor-acceptor bonds can be realized owing to transfer of electrons from atoms-“donors”, which either contains the essential number of electrons on the external p- and d-orbitals or have “unshared” s2-electrons, to atoms-“acceptors” with the little number of electrons. Sulfur atoms (S, 3s23p4) can serve as donors due to both the unshared s2-electrons and the p-electrons.
30 40 50 60 70 80 90 100 110
123Sb
NQ
R s
pin
-ec
ho
in
ten
sit
y (
arb
. u
nit
s)
Frequency, (MHz)
121Sb
Fig. 5. Antimony NQR spectra for Ag5SbS. Triangular symbols point to the positions of 121,123Sb NQR signals. The vertical dashed lines point to the positions of two Sb NQR signals, which were not studied. For details, see text.
In this context, let us discuss at first the EFG origin in stibnite, Sb2S3 (Safin & Pen’kov, 1962; Abdullin et al., 1977). Interestingly, the values of NQR frequencies for antimony in B site are notably less that NQR frequencies for this element in A site. As it was proposed, Sb-S bonds in case of B site appear to be more covalent as compared with bonds, corresponding to A site. The increasing of covalent effect is explained by manifestation of additional bonds, having the donor-acceptor nature. These contacts should decrease the value of effective charge on the antimony atom. Taking into account these aspects, the coordination number of Sb atoms located in B position increases up to 5. Corresponding coordination polyhedron can be visualized as a distorted semi-octahedron SbS5. In case of “metallic” chalcogenides situation is more complex. In contrast to binary Sb(As)-bearing compounds, the crystal electric fields, caused by Sb(As)-S bonds in frame of SbS3(SbS5) complexes, are influenced also by the fields created by metallic atoms (Cu, Ag
www.intechopen.com
Superconductor
340
and other). These interactions lead to appearance of twofold consequence. First factor is a so-called steric effect: Sb(As) and S atoms are repulsed. Second factor is an induction effect, according to which the metallic atoms “remove” part of electronic density. These effects are closely associated and usually coexist. As a result, Sb(As)-S bonds are “loosened” and they become more polar. This leads, as a rule, to increase of NQR frequencies. The pyrargyrite-proustite phases Ag3[Sb(As)]S3 may serve as an excellent example of such behavior (Pen’kov & Safin, 1966a). As it was found, the natural samples of pyrargyrite, Ag3SbS3, can contain a little number of As impurity; these substitution atoms occupy the positions of Sb. The resonance frequency shift for As impurities indicates the existence of more ionic nature for the As-S bonds in Ag3SbS3 matrix than for those in the etalon samples of proustite, Ag3AsS3. The increasing of ionicity is explained by steric inconsistency: actually, the covalent radiuses of As and Sb atoms are 1.21 and 1.41 Ǻ, respectively. In this case, the impurity atoms are forced to accommodate themselves into the structural positions and dimensions of “native” matrix atoms. Now, it is easier to discuss the EFG nature in stephanite, Ag5SbS4. Indeed, 121,123Sb NQR frequencies for Ag5SbS4 are higher than that for binary stibnite, Sb2S3. This fact provides evidence that the “metallic” twofold factor, in addition to “standard” donor-acceptor bonds, also exists in Ag5SbS4. Moreover, the values of NQR frequencies for Ag5SbS4 exceed the values of resonance frequencies exhibited by pyrargyrite, Ag3SbS3. Therefore, Sb-S bonds in stephanite appear to be more polar than in stibnite and pyrargyrite. This circumstance implies also that the higher NQR frequencies (as compared with pyrargyrite) are associated with a higher coordination number of the Ag atoms (in other words, with stronger induction interaction of the Sb-S and Ag-S bonds).
4.3 Temperature dependences of NQR spectra of Sb2S3, As5SbS4, Ag3SbS3
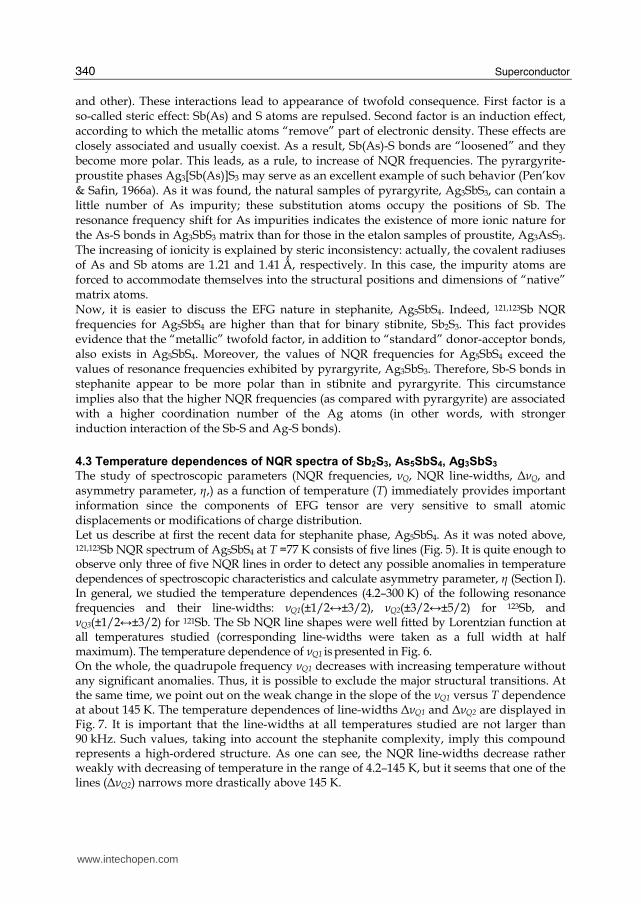
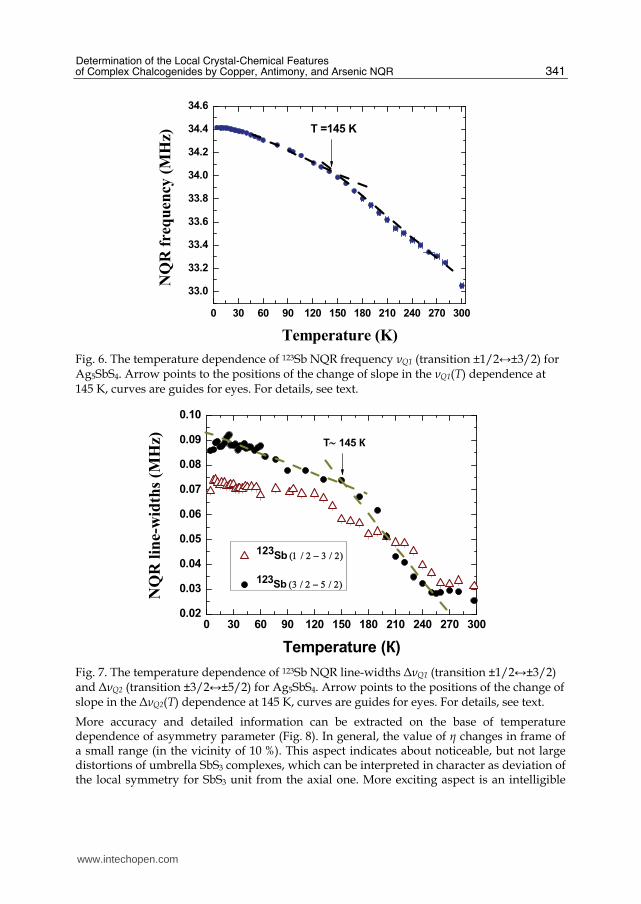
The study of spectroscopic parameters (NQR frequencies, νQ, NQR line-widths, ΔνQ, and asymmetry parameter, ┟,) as a function of temperature (T) immediately provides important information since the components of EFG tensor are very sensitive to small atomic displacements or modifications of charge distribution. Let us describe at first the recent data for stephanite phase, Ag5SbS4. As it was noted above, 121,123Sb NQR spectrum of Ag5SbS4 at T =77 K consists of five lines (Fig. 5). It is quite enough to observe only three of five NQR lines in order to detect any possible anomalies in temperature dependences of spectroscopic characteristics and calculate asymmetry parameter, ┟ (Section I). In general, we studied the temperature dependences (4.2–300 K) of the following resonance frequencies and their line-widths: νQ1(±1/2↔±3/2), νQ2(±3/2↔±5/2) for 123Sb, and νQ3(±1/2↔±3/2) for 121Sb. The Sb NQR line shapes were well fitted by Lorentzian function at all temperatures studied (corresponding line-widths were taken as a full width at half maximum). The temperature dependence of νQ1 is presented in Fig. 6. On the whole, the quadrupole frequency νQ1 decreases with increasing temperature without any significant anomalies. Thus, it is possible to exclude the major structural transitions. At the same time, we point out on the weak change in the slope of the νQ1 versus T dependence at about 145 K. The temperature dependences of line-widths ΔνQ1 and ΔνQ2 are displayed in Fig. 7. It is important that the line-widths at all temperatures studied are not larger than 90 kHz. Such values, taking into account the stephanite complexity, imply this compound represents a high-ordered structure. As one can see, the NQR line-widths decrease rather weakly with decreasing of temperature in the range of 4.2–145 K, but it seems that one of the lines (ΔνQ2) narrows more drastically above 145 K.
www.intechopen.com
Determination of the Local Crystal-Chemical Features of Complex Chalcogenides by Copper, Antimony, and Arsenic NQR
341
0 30 60 90 120 150 180 210 240 270 300
33.0
33.2
33.4
33.6
33.8
34.0
34.2
34.4
34.6
NQ
R fre
qu
ency
(M
Hz)
Temperature (K)
T =145 K
Fig. 6. The temperature dependence of 123Sb NQR frequency νQ1 (transition ±1/2↔±3/2) for Ag5SbS4. Arrow points to the positions of the change of slope in the νQ1(T) dependence at 145 K, curves are guides for eyes. For details, see text.
0 30 60 90 120 150 180 210 240 270 3000.02
0.03
0.04
0.05
0.06
0.07
0.08
0.09
0.10
123Sb (1 / 2 − 3 / 2)
123Sb (3 / 2 − 5 / 2)
Тemperature (К)
NQ
R l
ine-
wid
ths
(MH
z) Т∼ 145 К
Fig. 7. The temperature dependence of 123Sb NQR line-widths ΔνQ1 (transition ±1/2↔±3/2) and ΔνQ2 (transition ±3/2↔±5/2) for Ag5SbS4. Arrow points to the positions of the change of slope in the ΔνQ2(T) dependence at 145 K, curves are guides for eyes. For details, see text.
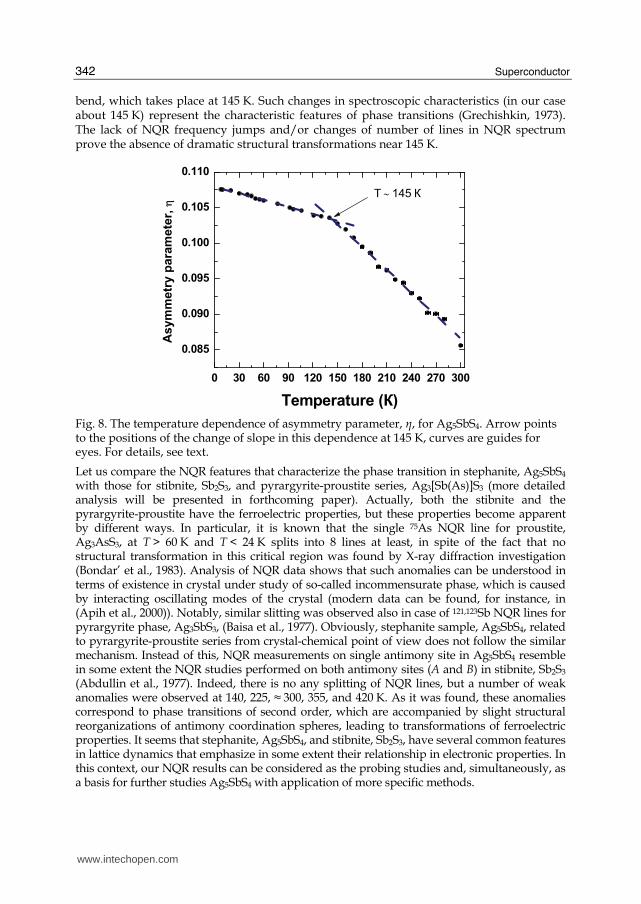
More accuracy and detailed information can be extracted on the base of temperature dependence of asymmetry parameter (Fig. 8). In general, the value of ┟ changes in frame of a small range (in the vicinity of 10 %). This aspect indicates about noticeable, but not large distortions of umbrella SbS3 complexes, which can be interpreted in character as deviation of the local symmetry for SbS3 unit from the axial one. More exciting aspect is an intelligible
www.intechopen.com
Superconductor
342
bend, which takes place at 145 K. Such changes in spectroscopic characteristics (in our case about 145 K) represent the characteristic features of phase transitions (Grechishkin, 1973). The lack of NQR frequency jumps and/or changes of number of lines in NQR spectrum prove the absence of dramatic structural transformations near 145 K.
0 30 60 90 120 150 180 210 240 270 300
0.085
0.090
0.095
0.100
0.105
0.110
Asym
metr
y p
ara
mete
r, η
Тemperature (К)
Т ∼ 145 К
Fig. 8. The temperature dependence of asymmetry parameter, ┟, for Ag5SbS4. Arrow points to the positions of the change of slope in this dependence at 145 K, curves are guides for eyes. For details, see text.
Let us compare the NQR features that characterize the phase transition in stephanite, Ag5SbS4 with those for stibnite, Sb2S3, and pyrargyrite-proustite series, Ag3[Sb(As)]S3 (more detailed analysis will be presented in forthcoming paper). Actually, both the stibnite and the pyrargyrite-proustite have the ferroelectric properties, but these properties become apparent by different ways. In particular, it is known that the single 75As NQR line for proustite, Ag3AsS3, at T > 60 K and T < 24 K splits into 8 lines at least, in spite of the fact that no structural transformation in this critical region was found by X-ray diffraction investigation (Bondar’ et al., 1983). Analysis of NQR data shows that such anomalies can be understood in terms of existence in crystal under study of so-called incommensurate phase, which is caused by interacting oscillating modes of the crystal (modern data can be found, for instance, in (Apih et al., 2000)). Notably, similar slitting was observed also in case of 121,123Sb NQR lines for pyrargyrite phase, Ag3SbS3, (Baisa et al., 1977). Obviously, stephanite sample, Ag5SbS4, related to pyrargyrite-proustite series from crystal-chemical point of view does not follow the similar mechanism. Instead of this, NQR measurements on single antimony site in Ag5SbS4 resemble in some extent the NQR studies performed on both antimony sites (A and B) in stibnite, Sb2S3 (Abdullin et al., 1977). Indeed, there is no any splitting of NQR lines, but a number of weak anomalies were observed at 140, 225, ≈ 300, 355, and 420 K. As it was found, these anomalies correspond to phase transitions of second order, which are accompanied by slight structural reorganizations of antimony coordination spheres, leading to transformations of ferroelectric properties. It seems that stephanite, Ag5SbS4, and stibnite, Sb2S3, have several common features in lattice dynamics that emphasize in some extent their relationship in electronic properties. In this context, our NQR results can be considered as the probing studies and, simultaneously, as a basis for further studies Ag5SbS4 with application of more specific methods.
www.intechopen.com
Determination of the Local Crystal-Chemical Features of Complex Chalcogenides by Copper, Antimony, and Arsenic NQR
343
5. Conclusions
Our examples of NQR spectroscopic studies of copper, antimony, and arsenic chalcogenides show that rather broad and diverse information may be obtained. There are themes typical to many solid state investigations, i.e. phase transitions, the relation of electric field gradients to electronic structure. NQR has proven to be an indispensable tool in this field.
6. Anknowledgment
This work is partly supported by the Grant RNP-2.1.1/6183 from the Ministry of Education and Science, Russian Federation.
7. References
Abdullin, R.S.; Pen’kov, I.N.; Nizamutdinov, N.M.; Grigas, I. & Safin, I.A. (1977). Temperature dependence of NQR spectra of 121,123Sb in Sb2S3. Physics of the Solid State, 19, 1632-1635.
Abdullin, R.S.; Kal’chev, V.P.; Pen’kov, I.N. (1987). Investigation of copper minerals by NQR: crystallochemistry, electronic structure, lattice dynamics. Phys. Chem. Minerals, 14, 258–263.
Abrikosov, N.K.; Bankina, V.F.; Poretskaya, L.V.; Skudnova, E.V. & Chizhevskaya, S.N. (1975). Semiconducting chalcogenides and their alloys, Publishing House Nauka, Moscow.
Anashkin, V.N.; Kalinina, T.A.; Matukhin, V.L.; Pen’kov, I.N. & Safin, I.A. (1994). NQR spectra of 63,65Cu in coexisting covelline (CuS) and geerite (Cu1,6S). Proceedings Rus. Mineral. Soc., 5, 59-63.
Apih, T.; Mikac, U.; Dolinšek, J.; Seliger, J. & Blinc, R. (2000). Unique 1-q and 3-q incommensurate phases in proustite: 75As NQR line-shape and spin-lattice relaxation study. Phys. Rev. B, 61, 1003-1013.
Baisa, D.F.; Bondar’, A.V. & Gordon, A.Ja. (1977). The phase transition ”order-disorder” in pyrargyrite. Physics of the Solid State, 19, 1273-1276.
Berry, L.G. (1954). The crystal structure of covellite, CuS, and klockmanite, CuSe. Am. Mineral., 39, 504-509.
Blinc, R. & Zeks, B. (1974). Soft modes in ferroelectrics and antiferroelectrics, Elsevier, New York. Bondar’, A. V.; Vihnin, V. S.; Rjabchenko, S. M. & Jachmenov, V. E. (1983). Incommensurate
phase near the second-order phase transition in proustite. Physics of the Solid State, 25, 2602-2609.
Buckel, W. & Hilsch, R. (1950). Zur Supraleitung von Kupfersulfid. Z. für Physik, 128, 324-346. Di Benedetto, F.; Borgheresi, M.; Caneschi, A.; Chastanet, G.; Cipriani, C.; Gatteschi, D.;
Pratesi, G.; Romanelli, M. & Sessoli R. (2006). First evidence of natural superconductivity. Eur. J. Mineral., 18, 283-287.
Evans, H. T. Jr. & Konnert, J. A. (1976). Crystal structure refinement of covellite. Am. Mineral., 61, 996-1000.
Fjellvåg, H.; Grønvold, F.; Stølen, S.; Andresen, A.F.; Müller-Käfer, R. & Simon, A. (1988). Low-temperature structural distortion in CuS. Z. für Kristallogr., 184, 111-121.
Gainov, R. R.; Dooglav, A. V.; Pen’kov, I. N.; Mukhamedshin, I. R.; Mozgova, N. N.; Evlampiev, I. A. & Bryzgalov, I. A. (2009). Phase transition and anomalous electronic behavior in the layered superconductor CuS probed by NQR. Phys. Rev. B., 79, 075115.
Grechishkin, V.S. (1973). Nuclear quadrupole interactions in solids, Nauka (in Russian), Moscow.
www.intechopen.com
Superconductor
344
Goble, R.J. (1985). The relationship between crystal structure, bonding and cell dimensions in the copper sulfides. Can. Mineral., 23, 61-76.
Gablina, I.F. (1997). Copper sulfides as indicators of the ore-forming environment. Transactions RAS. 357, 1133-1137.
Izoitko, V.M. (1997). Technological mineralogy and estimation of ore, Nauka, St. Petersburg. Isac, L.A.; Duta, A.; Kriza, A.; Enesca, I.A. & Nanu, M. (2007). The growth of CuS thin films
by Spray Pyrolysis. J. Phys.: Confer. Series, 61, 477-481. Itoh, Y.; Hayashi, A.; Yamagata, H.; Matsumura, M.; Koga, K. & Ueda, Y. (1996). Cu NMR
and NQR study of CuS. J Phys Soc Japan (letters), 65, 1953-1956. Kaufmann, E.N. & Vianden, R.J. (1979). The electric field gradient in non-cubic metals. Rev.
Mod. Phys., 51, 161-214. Meissner, W. (1929). Messungen mit Hilfe von fliissigem Helium. V. Supraleitfahigkeit von
Kupfersulfid. Z. für Physik, 58, 570-572. Milman, V. (2002). Klockmannite, CuSe: structure, properties and phase stability from ab
initio modeling. Acta Cryst. B., 58, 437-447. Nozaki, H.; Shibata, K.; Ishii, M. & Yukino, K. (1995). Phase transition of CuS1-xSex (0≤x≤1)
studied by X-ray diffractometry. J. Solid State Chem., 118, 176-179. Ohmasa, M. ; Suzuki, M. & Takeuchi, Y. (1977). A refinement of the crystal structure of
covellite, CuS. Mineral. J. (Japan), 8, 311-319. Peiris, S.M.; Pearson, T.T. & Heinz, D.L. (1998). Compression of klockmannite, CuSe. J.
Chem. Phys., 109, 634-636. Pen’kov, I.N. & Safin, I. A. (1964). Nuclear quadrupole resonance in proustite and
pyrargyrite. Physics of the Solid State, 6, 2467-2470. Pen’kov, I.N. & Safin, I. A. (1966a). NQR study of stephanite (Ag5SbS4). Dokl. Akad. Nauk
SSSR, 168, 1148-1150. Pen’kov, I.N. & Safin, I. A. (1966b). Application of nuclear quadrupole resonance in study of
minerals. Izv. Akad. Nauk SSSR (Geol. Ser), 12, 41-52. Petrunina, A.A.; Maksimov, B.M. & Iljuhin, V.V. (1970). Crystal Structure of Stephanite
Ag5SbS4. Sov. Phys. Dokl., 188, 342-346. Povarennykh, A.S. (1972). Crystal chemical classification of minerals, Plenum Press, New York. Rigamonti, A.; Borsa, F. & Carretta, P. (1998). Basic aspects and main results of NMR-NQR
spectroscopies in high-temperature superconductors. Rep. Prog. Phys., 61, 1367-1439. Safin, I. A. & Pen’kov, I.N. (1962). NQR in stibnite. Dokl. Akad. Nauk SSSR, 147, 2, 410-413. Saito, S.-H.; Kishi, H.; Nie, K.; Nakamaru, H.; Wagatsuma, F. & Shinohara, T. (1997). 63Cu
NMR studies of copper sulfide., Phys. Rev. B 55, 14527-14535. Sampathkumaran, E.V.; Gupta, L.C. & Vijayaraghavan, R. (1979). Valence fluctuation and
the temperature dependence of copper nuclear quadrupole interaction in EuCu2Si2 and YbCu2Si2. Phys. Rev. Lett., 43, 1189-1192.
Semin, G.K.; Babushkina, T.A. & Yakobson, G.G. (1975). Nuclear quadrupole resonance in chemistry, John Wiley & Sons, New York.
Slichter, C.P. (1996). Principles of magnetic resonance (3rd enriched and updated edition), Springer-Verlag, Berlin.
Torumba, D.; Parlinski, K.; Rots, M. & Cottenier, S. (2006). Temperature dependence of the electric-field gradient in hcp-Cd from first principles. Phys. Rev. B., 74, 144304.
Wilson, J.A. (2009). A perspective on the pnictide superconductors. Cornell University Library (http://arxiv.org/abs/0809.0560)
www.intechopen.com
SuperconductorEdited by Doctor Adir Moyses Luiz
ISBN 978-953-307-107-7Hard cover, 344 pagesPublisher SciyoPublished online 18, August, 2010Published in print edition August, 2010
InTech EuropeUniversity Campus STeP Ri Slavka Krautzeka 83/A 51000 Rijeka, Croatia Phone: +385 (51) 770 447 Fax: +385 (51) 686 166www.intechopen.com
InTech ChinaUnit 405, Office Block, Hotel Equatorial Shanghai No.65, Yan An Road (West), Shanghai, 200040, China
Phone: +86-21-62489820 Fax: +86-21-62489821
This book contains a collection of works intended to study theoretical and experimental aspects ofsuperconductivity. Here you will find interesting reports on low-Tc superconductors (materials with Tc< 30 K),as well as a great number of researches on high-Tc superconductors (materials with Tc> 30 K). Certainly thisbook will be useful to encourage further experimental and theoretical researches in superconducting materials.
How to referenceIn order to correctly reference this scholarly work, feel free to copy and paste the following:
R.R. Gainov, A.V. Dooglav, I.N. Penkov, A.Yu. Orlova, I.A. Evlampiev, N.N. Mozgova and R.R. Khasanov(2010). Determination of the Local Crystal-Chemical Features of Complex Chalcogenides by Copper,Antimony, and Arsenic NQR, Superconductor, Doctor Adir Moyses Luiz (Ed.), ISBN: 978-953-307-107-7,InTech, Available from: http://www.intechopen.com/books/superconductor/determination-of-the-local-crystal-chemical-features-of-complex-chalcogenides-by-copper-antimony-and

© 2010 The Author(s). Licensee IntechOpen. This chapter is distributedunder the terms of the Creative Commons Attribution-NonCommercial-ShareAlike-3.0 License, which permits use, distribution and reproduction fornon-commercial purposes, provided the original is properly cited andderivative works building on this content are distributed under the samelicense.