Embed Size (px)
Citation preview
Determination of Sulfur Components in Natural Gas: A Review Hai Pham Tuan, Hans-Gerd Janssen*, and Carel A. Cramers, Eindhoven University of Technology, Laboratory for Instrumental Analysis, P.O. Box 51 3, 5600 MB Eindhoven, The Netherlands,
Andre L. C. Smit and Ellen M. van Loo, N.V. Nederlandse Gasunie, P.O. Box 19, 9700 MA Groningen, The Netherlands
Key Words: GC Natural gas analysis Sulfur components Selective enrighment Sulfur selective detection Calibration
Summary More stringent environmental regulations as well as higher de- mands presently being imposed on the sulfur content of natural gas feed-stocks for chemical processes necessitate the development of new analytical procedures for sulfur determination in natural gas. Only analytical procedures based on gas chromatography can meet the sensitivity and accuracy requirements dictated by environ- mental regulation institutions and modern chemical industry. The complexity of the natural gas matrix as well as the extremely low concentration levels at which the sulfur species occur make the development of these analytical methods a true challenge. In this review the three steps common for analytical methods for trace analysis in complex matrices, be. pretreatment, chromatographic separation, and detection, are discussed in detail. Possible methods for calibration of the system are discussed in the final section.
Various techniques to determine sulfur in natural gas are described. Depending on the application, the most suitable system has to be selected. For example, for on-line application in a hazardous area a simple and rugged system is required, i.e. a simple gas chroma- tograph with a flame photometric detector, while for laboratory application a more complex instrument including preconcentration, column switching, and more exotic detection systems could be more suitable. Therefore it is crucial to define the requirements of the instrument at an early stage and use the information in this review article to develop/select a dedicated instrumentlprocedure for the problem at hand.
1 Introduction
Natural gas is a well estabhshed contnbutor to the world's energy needs At this moment the use of natural gas compnses over 20% of the total energy consumed world-wde Furthermore, natural gas is also an important starting matenal in a number of large-scale production processes in the chermcal industry The presence of sulfur components in natural gas constitutes a source of concern because of the corrosive nature of these components as well as their potential hazards for human health and for the natural envlronment Additionally, if natural gas is used as a reagent in chemical proc- esses, sulfur species present in the gas may adversely affect the performance and hfe-time of catalysts involved in the reaction
For the reasons outhned above, the accurate deterrmnation of sulfur components 111 natural gas is of utmost importance The group of components that should be analyzed includes hydrogen sulfide, carbonyl sulfide, the Ci to C4 mercaptans, lower sulfides and
odorants, such as for example tetrahydrothiophene (THT), added to the gas to impart a charactenstic smell for safety purposes The concentrations of these components differ, depending on the ongin of the gas In general, the concentrations of sulfur components in natural gas for domestic and industnal use range typically from a few to several tens of parts per milhon on a voIume basis An exception is HzS whch can be present at concentration levels up to one percent [ 11
Standardized methods for the determination of sulfur species in natural gas have been pubhshed by the International Organisation for Standardization (ISO) They can be classified as either conven- tional techniques ( Wickbold, Lingenerj or modern instrumental techniques (GC-based) IS0 standard 4260 descnbes the Wickbold combustion method, a method for the deterrmnation of the total- sulfur content of natural- and other gases In the Wickbold method the natural gas sample is supphed to the burner of an oxy-hydrogen flame, where the sulfur compounds are burnt w t h a considerable excess of oxygen The resulting sulfur oxldes are converted into sulfunc acid by absorption in a hydrogen peroxide solution De- pending on the sulfur content of the sample, the sulfate ions in the absorption solution are deterrmned by colonmetnc nephelometnc, turbidimetric or conductometnc titrations More recently, IS0 standard 6326-5 was pubhshed This standard procedure describes the use of the Lingener combustion method In the Lingener method a given volume of natural gas is burnt with a r at atmos- pheric pressure in an enclosed combustion apparatus The resulting sulfur oxldes are oxldized to sulfunc acid by absorption in a hydro- gen peroxide solution and afterwards titrated with a barium chlo- nde solution The total sulfur content which can be determined with this measurement method is 10 - 1000 mg S/m3 [2]
As opposed to the Lingener and the Wickbold method, which both measure the total sulfur content, IS0 method 6326-3 descnbes a potentiometnc method for sulfur determination that only reponds to hydrogen sulfide, mercaptans and carbonyl sulfide In this method hydrogen sulfide and mercaptans are absorbed in a 40% ( d m ) potassium hydroxlde solution, carbonyl sulfide is absorbed downstream in a 5% ( d m ) alcohohc mono ethanolamine solution and afterwards titration of the absorbed hydrogen sulfide, mercap- tans and carbonyl sulfide is performed with a silver nitrate solution The concentration range of sulfur compounds whch can be deter-
Journal of High Resolution Chromatography VOL. 17, JUNE 1994 373
Determination of Sulfur Components in Natural Gas: A Review
mined with this measurement method is 1 - 10 mg S/m3 for HzS, 1 - 20 mg S/m3 for mercaptans and 1 - 30 mg S/m3 for COS [a] Apart from one common advantage, i.e. no cahbration procedure is needed as the three methods described above are absolute meas- urement techniques, they also suffer from a number of common disadvantages. The measurements are time-consuming, complex and are, due to the complexity of the experimental steps involved, difficult to automate. Moreover, the accuracy and the detection limits of especially the Lingener method do not meet the required hmts. It is evident that because the methods measure the total sulfur content (IS0 4260 and IS0 6326-5) or the concentration of different classes of sulfur compounds (IS0 6326-3), no information on the concentrations of the individual sulfur species is obtained. This disadvantage can be overcome by using GC-based methods for sulfur determination. The IS0 standards 6326-2 and 6326-4 descnbe gas chromatographc methods for separation and detec- tion of individual sulfur components in natural gas In IS0 6326-2 hydrogen sulfide, methyl to butyl mercaptans and tetrahydrotho- phene (THT) are separated on a gas chromatographic system equipped with a separation column containing 30% ( m h ) sbcone oil and 30% ( m h ) dinonyl phthalate on Chromosorb W. The sulfur compounds are subsequently detected with an electrochemical cell, in which they are oxidized by a chromium oxide solution and at the same time the potential difference over the platinum elec- trodes is measured. The IS0 6236-2 method suffers from two serious disadvantages. Firstly, it is not applicable for the determination of carbonyl sulfide. Furthermore, the chromatographc conditions specified in the method only enable hydrogen sulfide and methyl- mercaptan to be determined if the ratio of the concentration of the former to the concentration of the latter is less than 10. The same applies for the quantification of two thiols eluted consecutively.
A few of the major hmitations of the IS0 6326-2 method were eliminated in IS0 6326-4. The chromatographc separation of the sulfur components was optimized, resulting in a system that en- abled quantification of all major sulfur species in natural gas sam- ples. The components are separated using a temperature programmed 1.2 m x 2 mm column packed with styrene/divinyl- benzene porous polymer beads (80 - 100 mesh) and measured with a sulfur-selective flame photometric detector (FPD). The detection hmit is approximately 0.1 mg S/m3, which is comparable to the detection limits obtainable by the IS0 standard method 6326-2.
The IS0 methods 6326-2 and 6326-4 yield the concentrations of the indwidual sulfur components in the gas. The total S concentration can then be obtained by summing the equivalent S-weights of the individual components. The chromatographic separation proce- dure incorporated in IS0 6326-4 provides sufficient separation of all sulfur components. Unfortunately, however, it still has a number of problems, most of which originate from the use of flame photomet- ric detection. The selectivity of the flame photometric detector (FPD) is limited and, although fairly selective, this detector still responds to high concentrations of non-sulfur components. More- over, high concentrations of hydrocarbons coeluting with a sulfur- containing component can quench the sulfur signal. Finally, the response of the FPD is inherently non-hear and often also com- pound dependent. For these reasons, the concentration of the sulfur species to be determined are limited to the range of 0.1-30 mg S/m3.
For most present applications, the detection limits and the reliability of the analytical results achievable by GC w t h FPD detection are withm the desired range. More strmgent environmental regulations as well as hgher demands currently being posed on the purity of natural feed-stocks for chemcal processes, however, force analyti- cal chemists to develop new analytical methods that allow the
accurate and reliable determination of sulfur in natural gas at concentrations well below the limits currently achievable. The complexity of the natural gas matrix and the extremely low detec- tion limits required render this task extremely challenging. Analyti- cal methods for analyses at trace levels in complex and interfering matrices often require the use of selective preconcentration/enrich- ment techruques. Only if this step and the subsequent separation and detection are fully optimized, it is possible to meet the required sensitivity limits with an acceptable level of reliability. In the vast majority of applications, the demands posed on each of these three steps is determined by the performance of the other two. If, for example, a universal detector is employed, the requirements im- posed on the sample pretreatment and separation are much more stringent than in the case of the use of a truely specific detector.
In subsequent chapters of this revlew each of the three steps of the analytical procedure for the quantification of low concentrations of sulpur components in natural gas, i.e. sample pretreatment, sepa- ration and detection, will be discussed in detail. Up tillnow, virtually no attention has been paid in literature to the use of preconcentra- tion techniques in natural gas analysis. On the other hand, various methods for preconcentration of sulfur in samples of enwonmental or medical origin have been published. In general, the principles of these methods are also applicable for trace analysis of sulfur in natural gas. Irrespective of the matrix, the strong tendency of sulfur components to adsorb on various types of surfaces senously com- plicates preconcentration and analysis of these compounds. In literature, both packed and open-tubular columns have been em- ployed for the separation of sulfur species in a wide variety of samples. In a chapter devoted to the chromatographic separation of sulfur components, the merits of each of these two approaches will be compared. The selection of the detection device is of crucial importance for the performance of the combined set-up. Various detectors will be considered in a separate chapter. As opposed to the three standardized absolute methods for sulfur determination descnbed earlier, GC-based techniques are relative methods and hence require cahbration. Procedures for cahbration wlll be treated in detail in the last chapter. Again, the adsorptive nature of sulfur components constitutes a serious source of concern in preparation and storage of sulfur cahbration mixtures.
2 Trace Enrichment of Sulfur Components
The determination of trace components in a complex matrix often requires selective enrichment of the components of interest prior to transfer of the sample into the chromatographic system. In this step the target compounds are selectively retained on for example a sohd adsorbent or a cold trap while at the same time the interfering main components are eliminated For the particular case of sulfur deter- mination in natural gas this means a material is required that selectively adsorbs sulfur containing species wthout adsorbing hydrocarbons.
Up till now, no preconcentration techniques have been developed for the GC determination of sulfur components in natural gas. Several preconcentration methods, however, were descnbed for determination of these compounds in ambient air Due to the low concentrations of sulfur components in air a preconcentration step prior to analysis is virtually always required.
Early work in this field, wthout connection to a GC separation [3,4], often reports collection methods for individual sulfur compounds from an atmospheric matrix by wet chemical techniques or by using impregnated filters with subsequent spectrophotometnc analysis. West and Gaeke [5] developed a nowadays traditional wet chemical
374 VOL. 17, JUNE 1994 Journal of High Resolution Chromatography
Determination of Sulfur Components in Natural Gas: A Review
techruque for atmospheric sulfur dioxlde (SOz) measurements T h s method uses a bubbler trapping system containing a tetrachloro- mercurate (11) (HgClz + 2NaC1) solution The analysis is spectro- photometnc, involvlng the dye pararosanihne The West-Gaeke procedure has been successfully used to measure concentrations as low as 5 ppb Axekodet ai [4] used an alternative to the bubbler samphng method, 1 e the use of an impregnated filter contamng the same solution, and were able to determine SO2 in concentra- tions down to 0 05 ppb Simlarly, H2S 131 was extracted from an by reaction w t h an AgN03 impregnated filter The resulting Ag2S was dissolved in a NaCN solution and analyzed fluorrnetncally by using a very dllute fluorescein mercunc acetate A detection hmit of 5 ppt was reported In both expenments very high collection efficiencies were achieved 92 - 95%
For detemnation of H2S and other organosulfur compounds in air Braman et al [6] used preconcentration of the components in a trap filled w t h gold coated glass beads Sulfur compounds and HzS were removed by heating the trap (500 - 600 "C for 5 min) and were subsequently separated on a short hquid mtrogen cooled U-trap column and detected by means of a flame photometnc detector (FPD) These authors reported detectionhmts of approximately 0 01 ng or 0 1 ppt for 100 L sample Collection efficiencies of several metal-foils for a larger group of atmospheric sulfur gases were examined by Kagel and Farwell [7] Here the compounds were released by flash desorption and determined by an FPD These authors found Pd and Pt foils to be the best for the preconcentration of the gases of interest The collection efficiencies ranged from 13% for COS on Pt-foil to 45% for H2S on Pd-foil The sulfur gas detecta- bilitv of this metal foil collection / flash vaDorization / flame
breakthrough volume (ca 25 L/g) and released the adsorbed com- ponents almost completely dunng the thermal desorption process (1 rmnute at 258 "C) The recovenes were 83 -87% for SO2 and 75 - 82% for H2S The GC analysis was carned out on a Teflon column packed w t h Supelpak S Detection using an FPD ylelded detection hmts in the ppb range for both gases For the specific purpose of sulfur detemnation in natural gas the apphcabihty of the non-polar adsorbents such as those studied by Black et a1 appears to be hrmted as these matenals are most hkely not capable of selectively isolating sulfur species from a large excess of hydrocarbons
For the simultaneous collection of a larger group of sulfur com- pounds in au (COS, HzS, methyl mercaptan (MeSH) CS2 dimethyl sulfide (DMS) and dimethyl disulfide (DMDS)) Steudler et a1 [ 101 used a combination of two sohd adsorbents Molecular Sieve 5A for SO2 and H2S and Tenax GC for the others The specially designed adsorption tubes showed a very h g h affinity for the sulfur com- pounds tested and yelded acceptable recovenes varymg from 50% for DMDS to 75% for COS The recovery efficiencies were found to be a function of the desorption temperature, time and the hehum gas flow rate dunng desorption Because of the long time required for thermal desorption, it was necessary to cryogemcally focus the desorbed sulfur gases in a Teflon loop cooled by hquld nitrogen before inlection onto the GC column The detection hmts achieved were 8 8 - 20 pg of S depending on the various sulfur gases (FPD) An interesting observation was that the recovenes appeared to be constant for each sulfur gas within the humdity range studied (30 - 95%) Agam the apphcation of a very strong non-selective adsorb- ent such as Mol Sieve 5A precludes the use of this set-up for selective ennchment of sulfur comDonents from natural sas
photometric detection (MC/FV/FPD) approach was less than 50 ppt A similar method of desorption and detection ( ~ / F P D ) was em- ployed by FarweU et al [8] SO2 was collected in a glass fibre filter after complete thermal conversion of the reduced sulfur gases to SO2 in a quartz tube held at a furnace temperature of 1050 oc The recovenes here were 100% No detection hmts were repofled A ~ S O no information on the apphcabhty of this approach for the isolation of other sulfur species is available
-
In contrast to the results pubhshed by Steudler, Przyazny[ 111 in his comparative study Of several porous polymers (Chromosorb lo2, XAD-2, xAD-4, XAD-78 Tenax GC) concluded that Tenax Gc 1s a Poor adsorbent for OrganOSUlfUr compounds (thols, sulfides, disul- fide? thophenes) XAD-4, with its extremely large specific surface area (850 m2/g) was found to have the hghest sorption capacity Unfortunately, the long time necessary for complete thermal desorption makes the followng GC analysis more difficult unless a
The largest group of collection matenals used for preconcentrating sulfur components are the sohd adsorbents, whch were used both at ambient as well as at subambient temperature (cryogenic trap- ping) An attractive aspect of the use of sohd adsorbents is their capabihty to be directly coupled to a GC system An effective sohd adsorbent should fulfill the following cnteria (1) high breakthrough volume 2, This means a high capacity for the compounds of interest but as low as possible for other interfering components, (ii) easy to desorb
Black et ai [9] tned to collect SO2 and H2S in glass tubes packed with several non-polar adsorbents such as Tenax GC, Carbopak B, Porapak Q or P, Chromosorb 102, Mol Sieve 5A and Mol Sieve 13X They found Molecular Sieve 5A to be the best sohd adsorbent for these sulfur gases at ambient temperature (25 "C) All tubes were conditioned pnor to use by heating at a high temperature (200 - 250 "C for 10 - 12 hours) under mtrogen Ths conditioning step was required for obtaning quantitative recovenes and sharp desorption profiles The selected Molecular Sieve matenal showed the hghest
For gaseous samples the unit ppm is defined as 10 molimol, this in contrast to the situation in liquids where one ppm is usually defined as one mg/L This can lead to confusion as some authors incorrectly apply the hquid definition of ppm to gases
') Breakthrough volume, defined as the volume of gas that can be passed through an adsorbent before the investigated compound begins to be eluted
cryogenic focusing step is employed. For samples consisting of high-boiling components only, Tenax GC may be the adsorbent of choice, because of its high thermal stability and relatively low desorption volumes. These characteristics would allow the sample components to be desorbed more rapidly from Tenax than from other sorbents. Also the sorption of MeSH and DMS on the carbon molecular sieve Carbosphere was investigated. The breakthrough volumes determined were ca. 2900 L/g for both sulfur compounds Hence, this sorbent can be used for preconcentration of MeSH and DMS from samples containing extremely low levels of these con- taminants. However, thermal desorption from Carbosphere is very difficult due to strong retention of the different sulfur derivates.
Tangerman et ai. [ 121 and also Przyjazny [ 111 studied the sorption capacities of Tenax GC towards highly volatile sulfur compounds at lower adsorption temperatures. With the goal of measuring volatile sulfur compounds in human breath, Tangennan found that the capacity of the Tenax trap tubes is increased to a large extent by keeping the trap tubes in dry ice (-70 "C) or in liquid nitrogen (-196 "C). Ths was especially the case for hydrogen sulfide adsorp- tion. The minimum amount of sulfur gases that could be detected by gas chromatography employmg a glass column packed with 20% SE-30 on Chromosorb P and an FPD was approxlmately 0.2 ng/L (0.1 ppb). The same technique: cryogenic Tenax trapping (liquld nitrogen, -196 "C), thermal desorption (200 "C) / GC / FPD was later used by the same author [13] to determine simultaneously a large
Journal of High Resolution Chromatography VOL. 17, JUNE 1994 375
Determination of Sulfur Components in Natural Gas: A Review
group of volatile sulfur gases HzS, COS CSz, thiols, sulfides, disul- fides in ambient a r To prevent build-up of water in the Tenax tube at these low temperatures, the water was pretrapped by passsing the gas through a dessicant (calcium chlonde) which was found not to adsorb any of the sulfur-containing volatiles [ 131 The expenmen- tal recovenes were relatively high (around 92%) and the author could detect volatile sulfur gases in air at the ppt level, although no concrete detection hmits were quoted Problems were only found in the detemnation of SOz Preconcentration of this component onto Tenax at -196 "C followed by GC analysis resulted in a com- plete loss of this component Probably, in spite of the use of calcium chlonde drymg tubes, traces of water react with SO2 in the Tenax tube or in the GC column, thereby preventing its detection
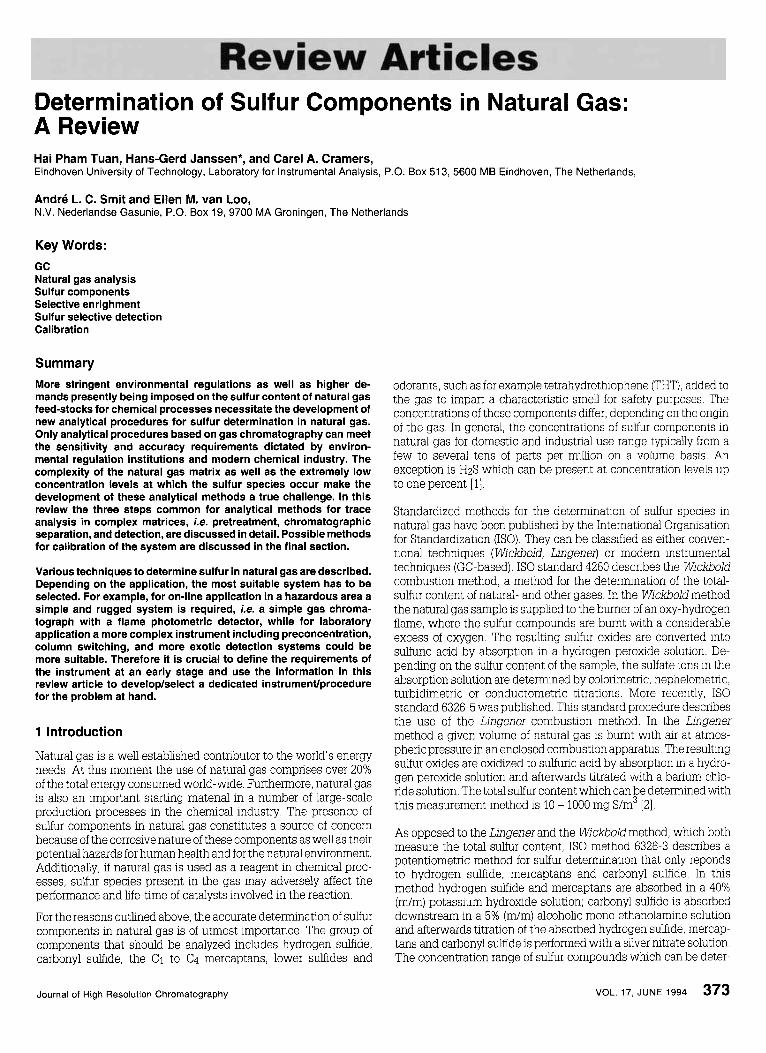
Later, when analyzing low-boiling organic sulfur compounds (MeSH, DMDS, CS2) in anoxic lake-water Henatsch et al. [14] used cryoadsoIption on Tenax tubes followed by analysis on a UCON coated glass capillary column and FPD detection. Due to the sensi- tivity differences of the FPD for the individual sulfur compounds different detection limits were found, CSz was detectable with a lowest limit of 5 ng/L. The detection limts of MeSH and DMDS were around 50 ng/L. One of the features of this process is that the disturbance of the procedure by excessive amounts of methane also present in the anoxic sample was avoided by using solid carbon dioxide rather than liquid nitrogen to cool the cryotraps. A sche- matic representation of the instrumentation developed by Henatsch and Jiittneris shown in Figure 1. The water-trap (part D in Figure 1) was constructed by using two 1-mL pipette tips connected end-to-end by silicone tubing. This trap was introduced into the gas line and cooled with solid carbon dioxide. It was shown that the sulfur compounds were not retamed in this trap.
1 1 1 1 I
Figure 1 Cryotrapping system for the preconcentration of volatile organic sulfur com- pounds. A I Rotameter for regulation of the nitrogen gas flow (180 mllmin) during purging the water sample and thermal transfer (20 mumin) of the compounds onto the GC column; B = injection needle; C = exit needle; D = water-trap; E = cryotrap (Tenax TA), both cooled with carbon dioxide; F = cryotrap connected to the GC system; G = thermal transfer of the compounds onto the capillary column by rapid heating of the cryotrap with a heating gun (H). For the transfer, the GC oven was cooled to 0 "C. PTFE tubes were fixed to the individual parts of the arrangements with silicone tubing. Reprinted with permission granted by Elsevier Science Publishers BV from "Capillary gas chromatographic analysis of low-boiling organic sulphur compounds in an- oxic lake-water by cryoadsorption" by J. J. Henatsch and F. Juttner, Journal of Chromatography, Vol. 445, p. 95-105 (1988).
Several experiments of cryogenic absorption of sulfur gases on unpacked sorption tubes were also described In these cases, hquid argon [15], nitrogen [16], oxygen 1171 were used to cool the deacti- vated Pyrex glass or Teflon trap tubes Hot water ensured desorp- tion into the chromatographc system Flame photometnc detectors or even mass spectrometers were used to detect the sulfur gases tested at sub ppb concentrations
From the hterature study descnbed above, it is clear that several matenals are capable of adsorbing sulfur species with large break- through volumes Whether these matenals provlde sufficient sulfur- to-hydrocarbon selectivity yet remains to be estabhshed
3 Chromatographic Separation
The second step in GC-based analytical procedures for the deter- mination of sulfur components in natural gas is the separation of the individual sulfur components. The separation efficiency required depends on both the performance of the selective enrichment step as well as on the selectivity of the detector. If non-sulfur containing species are removed quantitatively in the sample pretreatment step, a separation of the individual sulfur components solely is sufficient The same holds for the case that a truely selective, quenching-free detector is employed. In more reastic cases where both the sample pretreatment and the detection step are not 100% selective, sepa- ration of only the individual sulfur species is no longer adequate. Now all sulfur peaks should not only be separated from each other but also from all other components that might perturb measure- ments. For a successful and complete separation of a mixture covering such a wide range in boiling points as sulfur compounds in natural gas, it is very important to have a suitable column or system of columns for separation. If the separation performance is found to be insufficient due to poor resolution or to a too long analysis time, combination of two or more columns with or without switching valves could be an alternative. Detds of these ap- proaches and an overview of advantages and/or disadvantages of the individual techniques will be reviewed subsequently.
3.1 Packed-Column Systems
One of the advantages of packed columns over capillary columns is the high sample capacity of packed systems, which makes it pos- sible to inlect large sample volumes. On the other hand, however, packed columns generally suffer from a low resolving power. For sulfur analysis this means that only a limited number of sulfur gases can be simultaneously separated on a single column. Moreover, there is a serious risk of adsorption losses on the column due to the adsorptive nature of sulfur components on the one hand, and the limited inertness of packed columns on the other hand. As column materials, Teflon or properly deactivated glass are usually the ma- terials of choice due to the activity of volatile sulfur compounds and their strong tendency to adsorb onto glass and/or metal surfaces whch can cause peak tahng and sometimes complete losses of trace sample components. Thus, it is essential to deactivate the glass and metal surfaces of a chromatographic system or to use only Teflon columns and connections to minimize both peak tailing and losses incurred by irreversible adsorption of low concentrations of sulfur-containing compounds.
In the IS0 methods for the GC determination of individual sulfur components in natural gas packed GC columns are used exclu- sively. IS0 method 6326-2 uses a glass or teflon column packed with two stationary phases. The first two thirds of the column is packed with 40% silicone oil DC 200 on Chromosorb W and the last one third is packed with 40% dinonylphthalate on the same support. The separation strength of this column is limited. Accurate quantifica- tion of for example hydrogen sulfide and methylmercaptan is only possible if the ratio of the concentrations of these components is below approximately 10. IS0 method 6326-4 is based on the use of a glass or teflon column packed with 80-100 mesh polysty- rene/divinylbenzene porous polymer beads. With this column a good resolution between the components of interest is acheved. Vanous chromatographic columns optimized for the separation of
376 VOL. 17, JUNE 1994 Journal of High Resolution Chromatography
Determination of Sulfur Components in Natural Gas: A Review
sulfur containing components have been descibed in literature. A short overview of these systems is presented below.
Stevens [ 181 described the use of a 36-feet Teflon column packed with Teflon powder coated with 1% polyphenyl ether and ortho- phosphoric acid and succeeded in analyzing HzS, SOz and mercap- tans at the ppb level using a GC system equipped with an FPD. Following t h s example Bruner et al. [I91 also used a small amount of orthophosphoric acid (0.5%) mixed with 0.3% Dexsll 300 as a non-polar, low-bleeding hquid phase. Now, however, Graphon, a type of graphitized carbon black was used as solid support for paclung a 1.25 m x 3 mm i.d. Teflon column. Orthophosphoric acid increased the retention time of HzS and S02, which only have a weak interaction with the pure Graphon surface, while the Dexsil 300 reduces the surface area of the adsorbent. In t h s way the retention times of the compounds under examination are com- pressed into a smaller elution window. With such a column, oper- ated isothermally at 40 "C, HzS and SO2 could be detected on an FPD at minimal detectable concentrations of 20 and 10 ppb, respec- tively.
Later, HzS and COS were detected in a mixture of hydrocarbons and inorganic gases (CO, COz, Nz and 02) by Suierand Hill [20]. These authors used the observation from the work by de Souza et al. [21] that a column packed with acetone-washed Porapak QS gave a good separation of HzS and COS and from the work by Burgett [22], that COS, HzS, and SOz could be determined in the sub-ppm range using a column packed with acetone-washed Porapak coated with 0.5% H3P04. In their own experimental work, Suier and HiUused a Teflon-coated stainless steel column packed with Porapak QS to separate a slightly more complex mixture and improved this proce- dure by adding a short (3 feet) precolumn packed with Porapak R to acheve adequate separation of HzS and SOz from interfering water. Separation between the COS and the water peak was im- proved by temperature programmng the column at a slow rate, i.e. subambient initial temperature -65 "C (3 min) to 10 "C at 30"/min, then to 92 "C at 5"/min, then at 30"/min to 170 "C, allowing the COS to elute before the elution of the water began. A thermal conduc- tivity detector was used but no detection hmits were quoted. The separation was relatively slow. The total analysis time was 45 minutes
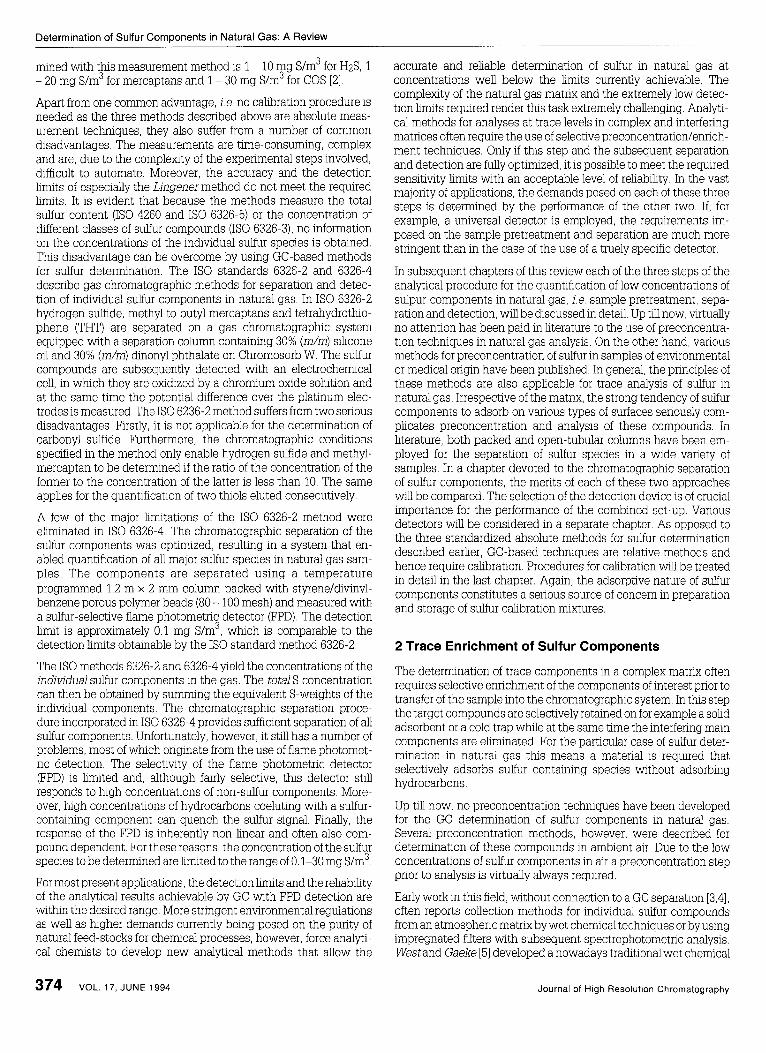
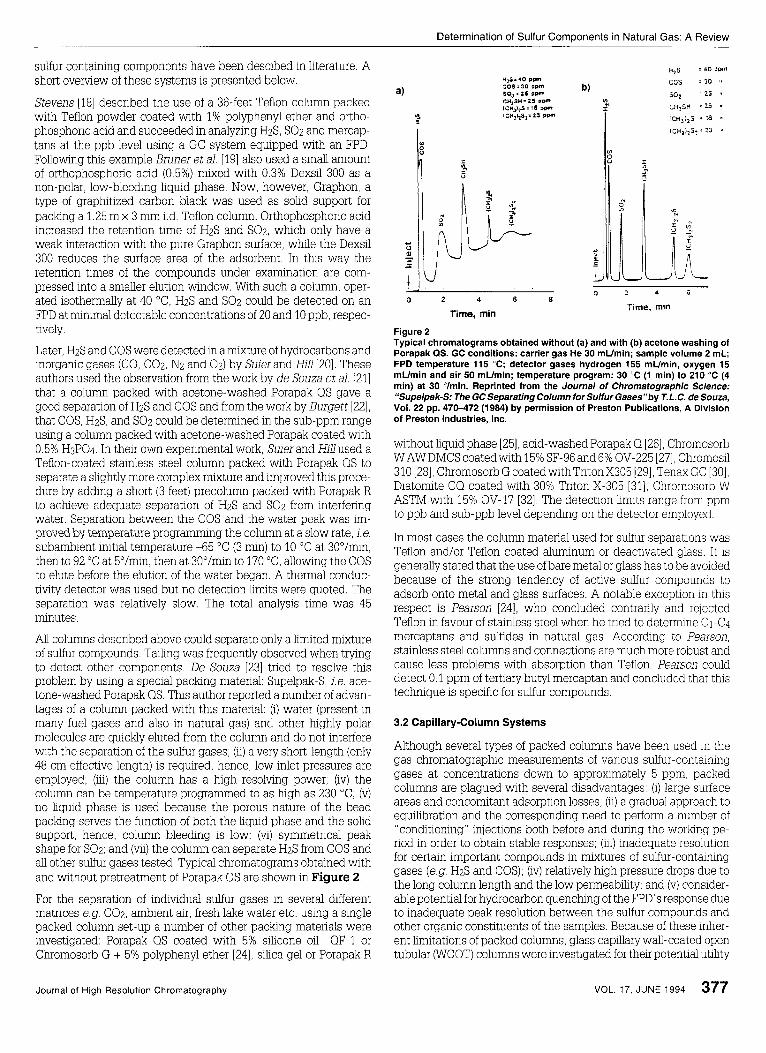
All columns described above could separate only a limited mixture of sulfur compounds. Tailing was frequently observed when trymg to detect other components De Souza [23] tried to resolve this problem by using a special paclung material: Supelpak-S, ie. ace- tone-washed Porapak QS. This author reported a number of advan- tages of a column packed with this material: (i) water (present in many fuel gases and also in natural gas) and other highly polar molecules are quickly eluted from the column and do not interfere with the separation of the sulfur gases; (ii) a very short-length (only 48 cm effective length) is required, hence, low inlet pressures are employed; (iii) the column has a high resolving power; (iv) the column can be temperature programmed to as high as 230 "C; (v) no liquid phase is used because the porous nature of the bead paclung serves the function of both the liquid phase and the solid support, hence, column bleeclmg is low; (vi) symmetrical peak shape for SOz; and (mi) the column can separate HzS from COS and all other sulfur gases tested. Typical chromatograms obtained with and without pretreatment of Porapak QS are shown in Figure 2.
For the separation of individual sulfur gases in several different matrices e.g. COz, ambient air, fresh lake water etc. using a single packed column set-up a number of other paclung materials were investigated: Porapak QS coated with 5% silicone oil QF-1 or Chromosorb G + 5% polyphenyl ether [24], silica gel or Porapak R
0 2 4 , ,
0 2 4 6 8 Time. mln
Time, min
Figure 2 Typical chromatograms obtained without (a) and with (b) acetone washing of Porapak QS. GC conditions: carrier gas He 30 mumin; sample volume 2 mL; FPD temperature 115 "C; detector gases hydrogen 155 mumin, oxygen 15 mUmin and air 50 mumin; temperature program: 30 "C (1 min) to 210 "C (4 min) at 30 Vmin. Reprinted from the Journal of Chromatographic Science: "Supelpak-S: The GC Separating Column for Sulfur Gases"by T. L.C. de Souza, Vol. 22 pp. 470-472 (1984) by permission of Preston Publications, A Division of Preston Industries, Inc.
without liquid phase [as], acid-washed Porapak 0 [26], Chromosorb WAWDMCScoatedwith15% SF-96and6% OV-225 [27], Chromosil 310 [as], ChromosorbGcoatedwithTritonX305 [29], TenaxGC [30], Diatomite CO coated with 30% Triton X-305 [31], Chromosorb W ASTM with 15% OV-17 [32]. The detection limits range from ppm to ppb and sub-ppb level depending on the detector employed.
In most cases the column material used for sulfur separations was Teflon and/or Teflon coated alumnum or deactivated glass. It is generally stated that the use of bare metal or glass has to be avoided because of the strong tendency of active sulfur compounds to adsorb onto metal and glass surfaces. A notable exception in this respect is Pearson [24], who concluded contrarily and rejected Teflon in favour of stainless steel when he tried to determine CyC4 mercaptans and sulfides in natural gas According to Pearson, stainless steel columns and connections are much more robust and cause less problems with absorption than Teflon. Pearson could detect 0 1 ppm of tertiary butyl mercaptan and concluded that this technique is specific for sulfur compounds
3.2 Capillary-Column Systems
Although several types of packed columns have been used in the gas chromatographic measurements of various sulfur-containing gases at concentrations down to approximately 5 ppm, packed columns are plagued with several disadvantages: (i) large surface areas and concomitant adsorption losses, (ii) a gradual approach to equilibration and the corresponding need to perform a number of "conditioning" injections both before and during the worlung pe- riod in order to obtain stable responses; (in) inadequate resolution for certain important compounds in mixtures of sulfur-containing gases (e.g. HzS and COS); (iv) relatively high pressure drops due to the long column length and the low permeability; and (v) consider- able potential for hydrocarbon quenching of the FPD's response due to inadequate peak resolution between the sulfur compounds and other organic constituents of the samples. Because of these inher- ent limitations of packed columns, glass capillary wall-coated open tubular (WCOT) columns were investigated for their potential utility
Journal of High Resolution Chromatography VOL. 17, JUNE 1994 377
Determination of Sulfur Components in Natural Gas: A Review
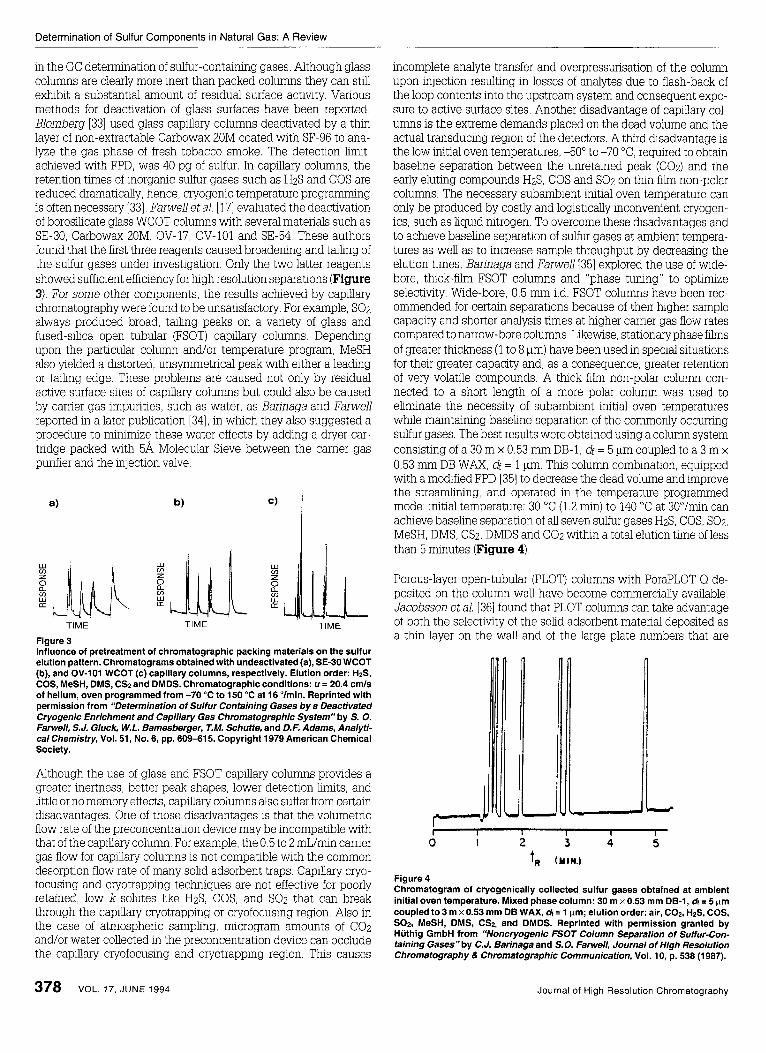
in the GC determination of sulfur-containing gases. Although glass columns are clearly more inert than packed columns they can still exhbit a substantial amount of residual surface activity. Various methods for deactivation of glass surfaces have been reported. Elomberg [33] used glass capillary columns deactivated by a t h n layer of non-extractable Carbowax 20M coated with SF-96 to ana- lyze the gas phase of fresh tobacco smoke. The detection limit, acheved with FPD, was 40 pg of sulfur. In capillary columns, the retention times of inorganic sulfur gases such as HzS and COS are reduced dramatically, hence, cryogenic temperature programming is often necessary [33]. Farwell et al. [ 171 evaluated the deactivation of borosihcate glass WCOT columns with several materials such as SE-30, Carbowax 20M, OV-17, OV-101 and SE-54. These authors found that the first three reagents caused broadening and taling of the sulfur gases under investigation. Only the two latter reagents showed sufficient efficiency for high resolution separations (Figure 3). For some other components, the results acheved by capillary chromatography were found to be unsatisfactory. For example, SOz always produced broad, taihng peaks on a vanety of glass and fused-silica open tubular (FSOT) capillary columns Dependmg upon the particular column and/or temperature program, MeSH also ylelded a distorted, unsymmetrical peak with either a leadmg or tailing edge. These problems are caused not only by residual active surface sites of capillary columns but could also be caused by carrier gas impurities, such as water, as Barinaga and Farwell reported in a later pubhcation [34], in which they also suggested a procedure to mnimize these water effects by adding a dryer car- tridge packed with 5a Molecular Sieve between the carrier gas purifier and the injection valve.
Figure 3 Influence of pretreatment of chromatographic packing materials on the sulfur elution pattern. Chromatograms obtained with undeactivated (a), SE-30 WCOT (b), and OV-101 WCOT (c) capillary columns, respectively. Elution order: HzS, COS, MeSH, DMS, CS2 and DMDS. Chromatographic conditions: u = 20.4 cmls of helium, oven programmed from -70 "C to 150 "C at 16 Ohin. Reprinted with permission from "Determination of Sulfur Containing Gases by a Deactivated Cryogenic Enrichment and Capillary Gas Chromatographic System" by S. 0. Fanvell, S.J. Gluck, W.L. Bamesberger, T.M. Schuffe, and D.F. Adams, Analyfi- cal Chemisfry, Vol. 51, No. 6, pp. 609-61 5. Copyright 1979 American Chemical Society.
Although the use of glass and FSOT capillary columns provides a greater inertness, better peak shapes, lower detection limits, and little or no memory effects, capillary columns also suffer from certain disadvantages. One of those disadvantages is that the volumetnc flow rate of the preconcentration device may be incompatible with that of the capillary column. For example, the 0.5 to 2 mL/min camer gas flow for capillary columns is not compatible mth the common desorption flow rate of many sohd adsorbent traps. Capillary cryo- focusing and cryotrapping techniques are not effective for poorly retained, low k solutes like HzS, COS, and SOz that can break through the capillary cryotrapping or cryofocusing region. Also in the case of atmospheric sampling, microgram amounts of C02 and/or water collected in the preconcentration device can occlude the capillary cryofocusing and cryotrapping region. This causes
incomplete analyte transfer and overpressurisation of the column upon injection resulting in losses of analytes due to flash-back of the loop contents into the upstream system and consequent expo- sure to active surface sites. Another disadvantage of capillary col- umns is the extreme demands placed on the dead volume and the actual transducing reDon of the detectors. A thrd disadvantage is the low initial oven temperatures, -50" to -70 "C, required to obtain baseline separation between the unretained peak (COz) and the early eluting compounds H2S, COS and SOz on thin film non-polar columns. The necessary subambient initial oven temperature can only be produced by costly and logistically inconvenient cryogen- ics, such as liquid nitrogen. To overcome these disadvantages and to achieve baseline separation of sulfur gases at ambient tempera- tures as well as to increase sample throughput by decreasing the elution times, Barinaga and Farwell 1351 explored the use of wide- bore, thick-film FSOT columns and "phase tuning" to optimize selectivity. Wide-bore, 0.5 mm i.d. FSOT columns have been rec- ommended for certain separations because of their hgher sample capacity and shorter analysis times at higher carrier gas flow rates compared to narrow-bore columns. Likewise, stationary phase films of greater thickness (1 to 8 pm) have been used in special situations for their greater capacity and, as a consequence, greater retention of very volatile compounds. A thck film non-polar column con- nected to a short length of a more polar column was used to eliminate the necessity of subambient initial oven temperatures while maintaining baseline separation of the commonly occurring sulfur gases. The best results were obtained using a column system consisting of a 30 m x 0.53 mm DB-1, df = 5 pm coupled to a 3 m x 0.53 mm DB WAX, df = 1 pm. This column combination, equipped with a modified FPD I351 to decrease the dead volume and improve the streamhning, and operated in the temperature programmed mode: initial temperature: 30 "C (1.2 min) to 140 "C at 30"lmin can achieve baseline separation of all seven sulfur gases HzS, COS, SOz, MeSH, DMS, CSz, DMDS and COz within a total elution time of less than 5 minutes (Figure 4).
Porous-layer open-tubular (PLOT) columns with PoraPLOT 0 de- posited on the column wall have become commercially avallable Jacobsson et al [36] found that PLOT columns can take advantage of both the selectimty of the sohd adsorbent matenal deposited as a thin layer on the wall and of the large plate numbers that are
I I I I I I
0 I 2 3 4 5 t, (YIN.)
Figure 4 Chromatogram of cryogenically collected sulfur gases obtained at ambient initial oven temperature. Mixed phase column: 30 rn x 0.53 mm DB-1, & = 5 pm coupled to 3 m x 0.53 mm DB WAX, & = 1 pm; elution order: air, COZ, HzS, COS, SO?, MeSH, DMS, CS2, and DMDS. Reprinted with permission granted by Huthig GmbH from "Moncryogenic FSOT Column Separation of Sulfur-Con- taining Gases" by C. J. Barinaga and S. 0. Fanvell, Journal of High Resolution Chromatography & Chromatographic Communication, Vol. 10, p. 538 (1987).
378 VOL. 17, JUNE 1994 Journal of High Resolution Chromatography
Determination of Sulfur Components in Natural Gas: A Review
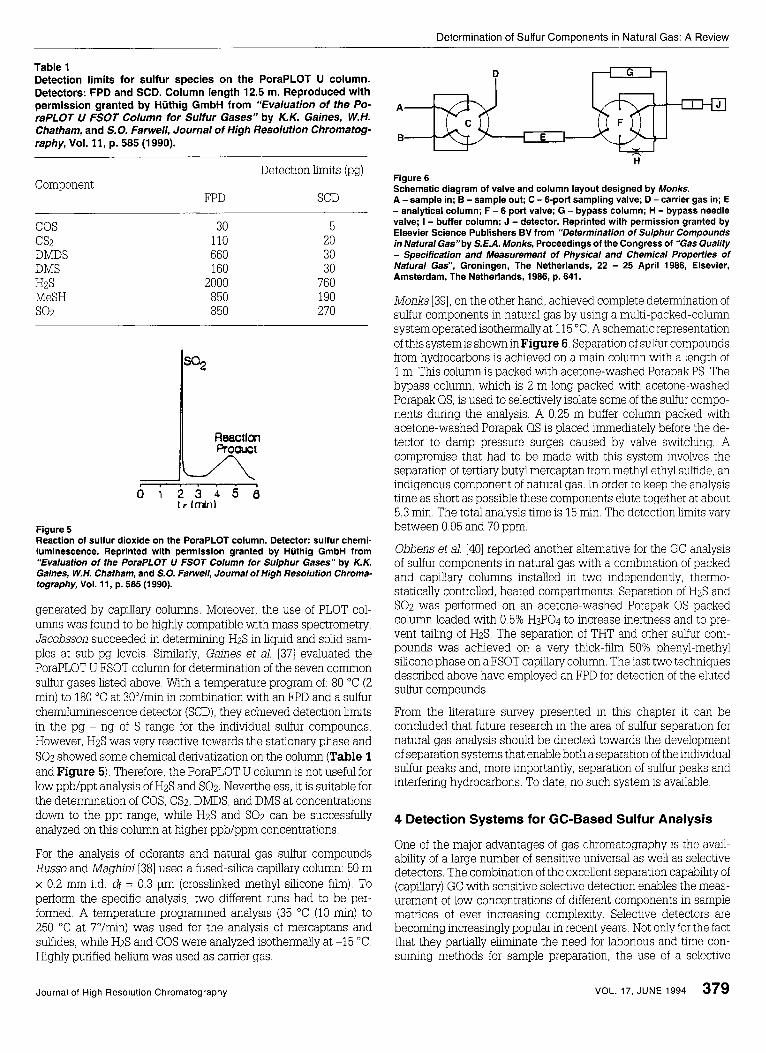
Table 1 Detection limits for sulfur species on the PoraPLOT U column. Detectors: FPD and SCD. Column length 12.5 m. Reproduced with permission granted by Huthig GmbH from “Evaluation of the Po- raPLOT U FSOT Column for Sulfur Gases” by K.K. Gaines, W.H. Chatham, and S.O. Farwell, Journal of High Resolution Chromatog- raphy, Vol. 11, p. 585 (1990).
Component Detection limits (pg)
FPD SCD
cos CSZ DMDS DMS HzS MeSH so2
30 5 110 20 660 30 160 30
2000 760 850 190 850 270
Figure 5 Reaction of sulfur dioxide on the PoraPLOT column. Detector: sulfur chemi- luminescence. Reprinted with permission granted by Huthig GmbH from “Evaluation of the PoraPLOT U FSOT Column for Sulphur Gases“ by K.K. Gaines, W.H. Chatham, and S.O. Farwell, Journal of High Resolution Chroma- tography, Vol. 11, p. 585 (1 990).
generated by caplllary columns. Moreover, the use of PLOT col- umns was found to be highly compatible with mass spectrometry. Jacobsson succeeded in determining HzS in liquid and solid sam- ples at sub-pg levels. Similarly, Gaines et al. [37] evaluated the PoraPLOT U FSOT column for determination of the seven common sulfur gases listed above. With a temperature program of: 80 “C (2 min) to 180 “C at 30”/min in combination with an FPD and a sulfur chemiluminescence detector (SCD), they acheved detection hmits in the pg - ng of S range for the individual sulfur compounds. However, HzS was very reactive towards the stationary phase and SOz showed some chemical derivatization on the column (Table 1 and Figure 5). Therefore, the PoraPLOT U column is not useful for low ppb/ppt analysis of HzS and SOz. Nevertheless, it is suitable for the determination of COS, CSz, DMDS, and DMS at concentrations down to the ppt range, while HzS and SOz can be successfully analyzed on t h s column at higher ppb/ppm concentrations.
For the analysis of odorants and natural gas sulfur compounds Russo and Maghini [38] used a fused-silica capillary column. 50 m x 0.2 mm i.d. dr = 0.3 ym (crosslinked methyl shcone film). To perform the specific analysis, two different runs had to be per- formed. A temperature programmed analysis (35 “C (10 min) to 250 “C at 7”lmin) was used for the analysis of mercaptans and sulfides, while HzS and COS were analyzed isothermally at -15 “C Bghly purified helium was used as carrier gas.
D I
c A
B U
H
Figure 6 Schematic diagram of valve and column layout designed by Monks. A -sample in; B - sample out; C - 6-port sampling valve; D - carrier gas in; E - analytical column; F - 6 port valve; G - bypass column; H - bypass needle valve; I - buffer column; J -detector. Reprinted with permission granted by Elsevier Science Publishers BV from “Determination of Sulphur Compounds in Natura1Gas”by S E A . Monks, Proceedings of the Congress of “Gas Ouality - Specification and Measurement of Physical and Chemical Properties of Natural Gas”, Groningen, The Netherlands, 22 - 25 April 1986, Elsevier, Amsterdam, The Netherlands, 1986, p. 641.
Monks [39], on the other hand, acheved complete determination of sulfur components in natural gas by using a multi-packed-column system operated isothermally at 115 “C. A schematic representation of this system is shown in Figure 6. Separation of sulfur compounds from hydrocarbons is acheved on a main column with a length of 1 m. This column is packed with acetone-washed Porapak PS The bypass column, which is 2 m long packed with acetone-washed Porapak QS, is used to selectively isolate some of the sulfur compo- nents during the analysis. A 0.25 m buffer column packed with acetone-washed Porapak QS is placed immediately before the de- tector to damp pressure surges caused by valve switchmg. A compromise that had to be made with thls system involves the separation of tertiary butyl mercaptan from methyl ethyl sulfide, an indigenous component of natural gas. In order to keep the analysis time as short as possible these components elute together at about 5.3 min. The total analysis time is 15 m n . The detection hmits vary between 0.05 and 70 ppm.
Obbens et al. [40] reported another alternative for the GC analysis of sulfur components in natural gas with a combination of packed and capillary columns installed in two independently, thermo- statically controlled, heated compartments. Separation of HzS and SOz was performed on an acetone-washed Porapak QS packed column loaded with 0.5% H3P04 to increase inertness and to pre- vent tailing of HzS. The separation of THT and other sulfur com- pounds was acheved on a very thick-film 50% phenyl-methyl silicone phase on a FSOT capillary column. The last two techniques described above have employed an FPD for detection of the eluted sulfur compounds.
From the literature survey presented in this chapter it can be concluded that future research in the area of sulfur separation for natural gas analysis should be directed towards the development of separation systems that enable both a separation of the individual sulfur peaks and, more importantly, separation of sulfur peaks and interfering hydrocarbons. To date, no such system is available.
4 Detection Systems for GC-Based Sulfur Analysis
One of the malor advantages of gas chromatography is the avail- abihty of a large number of sensitive umversal as well as selective detectors The combination of the excellent separation capabihty of (caplllary) GC with sensitive selective detection enables the meas- urement of low concentrations of different components in sample matnces of ever increasing complexity Selective detectors are becomng increasmgly popular in recent years Not only for the fact that they partially ehmnate the need for labonous and time con- sumng methods for sample preparation, the use of a selective
Journal of High Resolution Chromatography VOL. 17, JUNE 1994 379
Determination of Sulfur Components in Natural Gas: A Review
detection device also reduces the risk of false-positive identifica- tions. It is evident that also the separation itself is simplified if selective detectors are employed Selective detection enables target compounds to be measured while other coeluting compounds are not sensed. Important universal detectors are the flame ionization detector (FID) and the thermal conductivity detector (TCD). As these detectors respond to virtually all components amenable to GC, high demands are posed on sample preparation and separation. For non-hydrocarbon compounds containing for example sulfur, nitrogen or phosphorous, a w d e range of selective detectors is available. For the selective detection of sulfur t h s includes the flame photometnc detector (FPD), the sulfur chemiluminescence detector (SCD), atomic emission detector (AED), photo ionization detector (PID), electron capture detector (ECD), mass spectrometric (MS) detection devices and detection techniques based on electrochemi- cal principles such as the Hall electrolytic conductivity detector (HElCD) and coulometric detection devices The basic principles of the various detection systems for GC as well as the hardware requirements are the subject of a series of books and review articles 141-441. An excellent review article of potential gas chroma- tographic sulfur-sensitive detectors in envlronmental analysis has been published by Wardencki and Zygmunt in 1991 [45]. In the present review only improvements that have been achieved after this date will be discussed. In spite of the fact that most of the sulfur selective detectors are already available for many years, consider- able improvements in the performance of especially the FPD and the SCD have been achieved in the last three years.
4.1 Improvements in Flame Photometric Detection
The FPD is nowadays the most widely used sulfur-selective detec- tor for GC. Present-day systems are mostly based on the work of Brody and Chaney I461 published some 30 years ago. The FPD is basically a flame emssion photometer. Sulfur compounds, burnt in a hydrogen-nch flame, produce Sz which emits radiation near 400 nm This radiatjon is monitored by a photomultiplier tube. Although the role of Sz as a maip emitter in FPD has not been totally unambiguous [47], the S2 /Sz mechanism is now widely accepted and used to explain the square root dependence of the detector response towards the concentration of sulfur compounds tested. Although rather sensitive, the FPD suffers from a number of inherent problems such as non-linear response; dependence of the response factor on molecular structure; and quenching by hydrocarbons and other species coeluting with the sulfur compounds.
The most serious problem in the practical application of the FPD is the quenching effect. Although the exact cause of quenchmg re- mains yet to be established, it appears that both the change in the flame temperature as well as in the flame chemistry that occur when large amounts of hydrocarbons are introduced in the flame play a role. Various instrumental changes to reduce the susceptibitity of the FPD for quenching have been proposed in hterature. Patterson et al. 1481 developed the dual flame photometric detector. In this detector components eluting from the GC colymn are burnt in a hydrogen nch first flame. In a second flame S2 species emit light which is than measured on the photomultiplier tube. As all compo- nents are burnt in the first flame, the flame chemistry of the second flame is much less affected by coelution of sulfur and non-sulfur contaimng components. As aresult of this the dual-flamemode FPD resists quenching and is more truly quadratic in response Unfortu- nately, however, the sensitivity of the dual flame FPD is only ap- proximately 10% to 20% of that of the single flame version [49]. Moreover, dual flame operation enhances hydrocarbon response. The selectivity of sulfur versus carbon of the dual flame FPD is only lo3 to lo4 as opposed to a selectivity of lo5 to lo6 for the single flame
FPD [50]. Because the poor selectivity of the dual flame FPD (D-FPD) the analysis of individual S compounds in a complex hydrocarbon mixture is complicated by the simultaneous hydrocarbon response. A method to overcome t h s difficulty has been published by Baiget al. [SO]. In the method designed by these authors the effluent of the column is split into two streams. One stream is fed to the D-FPD, the second to an FID. Next, the FID signal is subtracted from the D-FPD signal which results in a simplified chromatogram as the hydrocarbon response is eliminated.
A fully chromatographic approach for eliminating quenchng of the FPD was described by Efer et al. [51]. These authors used a series- coupled system of two capillary columns with different polarities to achieve selectivity tuning. By varylng the mid-point pressure set- tings overlap of sulfur-containing and sulfur free components could be controlled, resulting in quenching free chromatograms or at least chromatograms that contain quenching free regions. Eferalso applied this set-up for detailed studies of the magnitude of the quenching effect. When studying the degree of quenching of ethylthiophene by nonane, it was found that a ten-fold excess of the quenching compound was required to obtain a significant signal reduction. The relationshp between signal reduction and the con- centration of the quenching component was found to be non-linear. Similar studies by Liu et al. [52] revealed that the decrease of the sulfur signal caused by flame hydrocarbons is strongly dependent on the oxygen to hydrogen ratio in the flame and, under certain conditions, also on the sulfur to carbon ratio of the sample. Higher O/H ratios decrease the quenching effects as well as the depend- ence of t h s quenching on the S/C ratio in the sample The detection limit of the FPD is about g S/s, which provides mass detection limits in the sub-nanogram range.
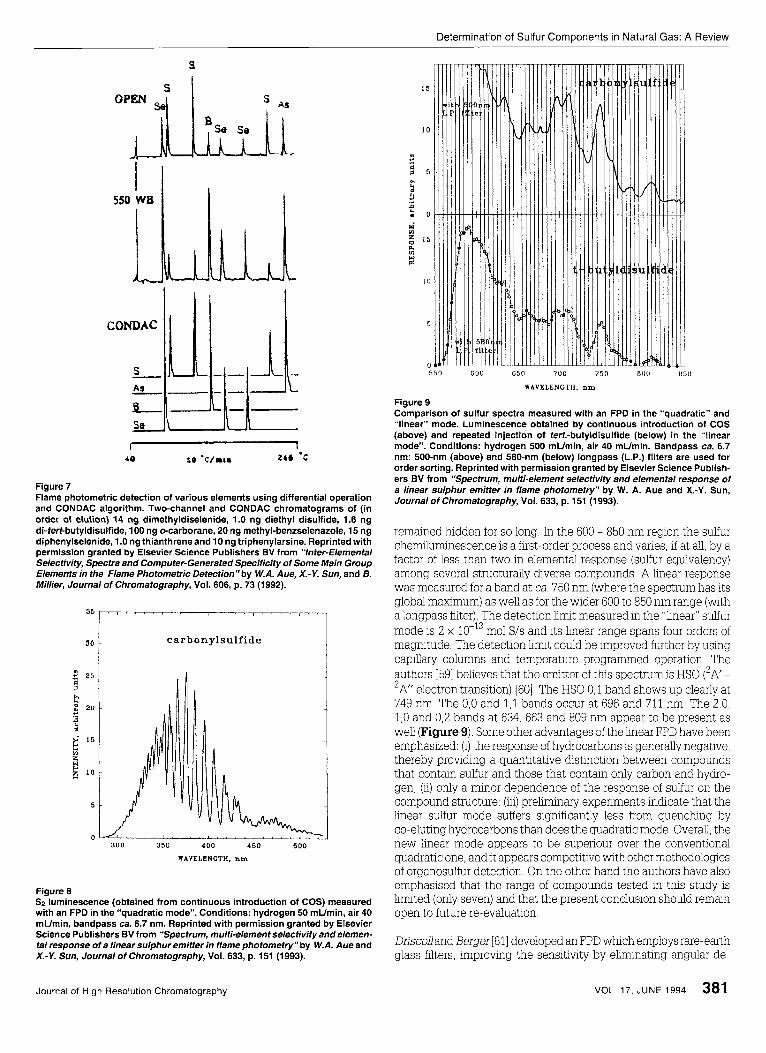
Apart from quenching also the limited linearity and selectivity of the FPD can hamper its use in practical apphcations. A series of other papers have been published in literature in which important meth- ods for improving the linearity and the selectiwty are described. A numbers of authors [53-551 proposed the use of dopants such as SO2 or CS2 to linearize the detector output The difficulty with t h s procedure is that the dynamic range is reduced and the linear output is dependent on the dopant and the solute. Sevcik and Phuong Thao [56] have evaluated the selectivity of the FPD and suggested that the unsuitable geometry of the interference filters resulted in interference from hydrocarbons and heteroatoms. They found that the selectivity of the detector improved with respect to hydrocarbon and heteroatom interference when the flame output was cohmated. Aue et al. improved the sulfur selectivity by about one to three orders of magnitude by using a dual-channel FPD, which annulled the response of carbon or other elements by differ- ential operation; or by having the CONDAC ("conditional access" or "conditional acceptance") algorithm deny unwanted elements access to the chromatogram [57]. The two-channel and CONDAC chromatograms of the compounds under investigations are shown in Figure 7. In their own expenments Aue et al. preferred to use the FPD "open", i.e. free of spectral discrimnation beyond the response profile of the photomultiplier tube
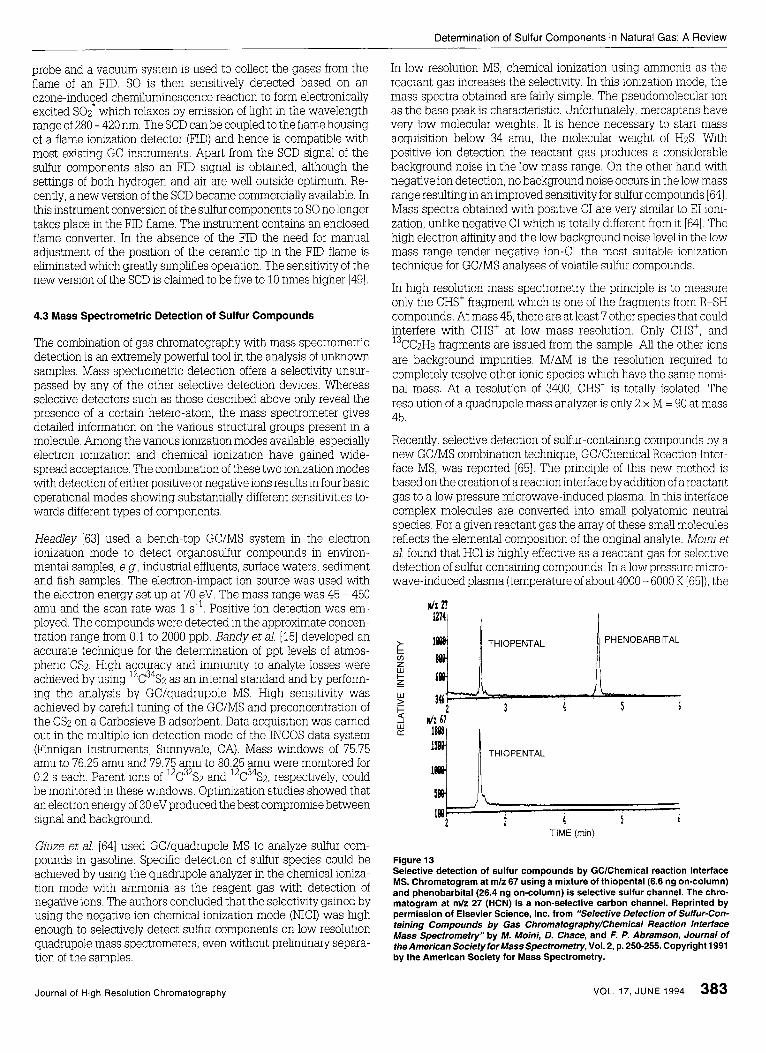
An approach to obtain a truely linear relationship between the FPD output signal and the sulfur concentration was published by Aue and Sun 1581 Experimental work by these authors confirmed that although the luminescence from sulfur compounds in the FPD is domnated by the Sz mansystem bands (of approximately quad- ratic response), it also contains a linear emitter with a "spectrum" in the 600 to 850 nm region. Up till now in the spectra of conventional quadratic emissions (Figure 8) no emission beyond 520 nm had been measured. For that reason the linear sulfur emission had
380 VOL. 17, JUNE 1994 Journal of High Resolution Chromatography
Determination of Sulfur Components in Natural G a s : A Review
3
S I
O P U * ~ e Se
I I
40 10 ‘c/rc. 2bb ‘C
Figure 7 Flame photometric detection of various elements using differential operation and CONDAC algorithm. Two-channel and CONDAC chromatograms of (in order of elution) 14 ng dimethyldiselenide, 1.0 ng diethyl disulfide, 1.6 ng di-tert-butyldisulfide, 100 ng ecarborane, 20 ng methyl-benzselenazole, 15 ng diphenylselenide, 1.0 ng thianthreneand 10 ng triphenylarsine. Reprinted with permission granted by Elsevier Science Publishers BV from “lnter-Elemental Selectivity, Spectra and Computer-Generated Specificity of Some Main Group Elements in the Flame Photometric Detection”by W.A. Aue, X.-Y. Sun, and B. Millier, Journal of chromatography, Vol. 606, p. 73 (1992).
35
30
5
0
carbonylsulfidc
300 350 400 450 500
WAYELENGTH. nm
Figure 8 SZ luminescence (obtained from continuous introduction of COS) measured with an FPD in the “quadratic mode”. Conditions: hydrogen 50 mumin, air 40 mUmin, bandpass ca. 6.7 nm. Reprinted with permission granted by Elsevier Science Publishers BV from “Spectrum, multi-element selectivityandelemen- fa/ response of a linear sulphur emitter in flame photometry” by W.A. Aue and X.-Y. Sun, Journal of Chromatography, Vol. 633, p. 151 (1 993).
550 GOO 640 700 750 l!OO 0 5 0
WAVELENGTH. n m
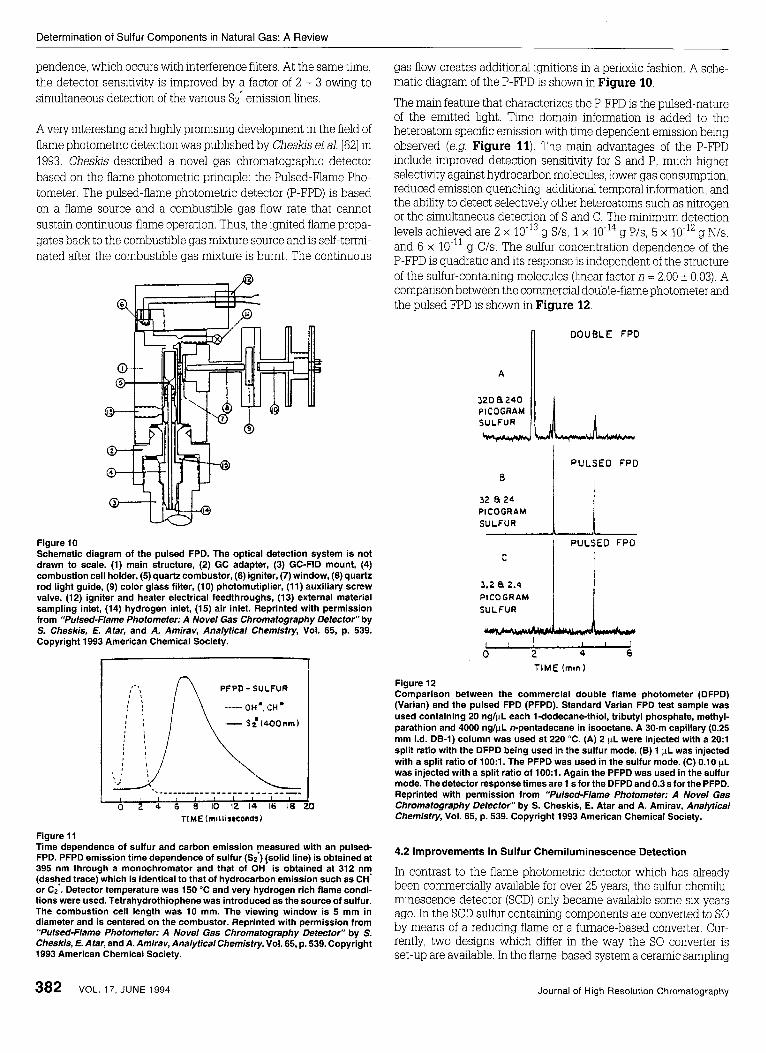
Figure 9 Comparison of sulfur spectra measured with an FPD in the “quadratic” and “linear” mode. Luminescence obtained by continuous introduction of COS (above) and repeated injection of terf.-butyldisulfide (below) in the “linear mode”. Conditions: hydrogen 500 mumin, air 40 mumin. Bandpass ca. 6.7 nm: 500-nm (above) and 580-nm (below) longpass (L.P.) filters are used for order sorting. Reprinted with permission granted by Elsevier Science Publish- ers BV from “Spectrum, multi-element selectivity and elemental response of a linear sulphur emiffer in flame photometry” by W. A. Aue and X.-Y. Sun, Journal of Chromatography, Vol. 633, p. 151 (1993).
remaned hidden for so long In the 600 - 850 nm region the sulfur chemilurmnescence is a first order process and varies if at all by a factor of less than two in elemental response (sulfur equivalency) among several structurally diverse compounds A h e a r response was measured for a band at ca 750 nm (where the spectrum has its global maximum) as well as for the wider 600 to 850 nm range (with a longpass filter) The detection hrmt measured in the “hnear sulfur mode is 2 x mol S/s and its hnear range spans four orders of magnitude The detection hmt could be improved further by using capillary columns and temperature programmed operation The authors [ 591 beheves that the emtter of this spectrum IS HSO (2A’ - 2A” electron transition) 1601 The HSO 0 1 band shows up clearly at 749 nm The 0,O and 1,1 bands occur at 696 and 711 nm The 2 0 1,0 and 0 2 bands at 634 663 and 809 nm appear to be present as well (Figure 9) Some other advantages of the hnear FPD have been emphasized (I) the response of hydrocarbons is generally negative thereby provlding a quantitative distinction between compounds that contam sulfur and those that contain only carbon and hydro gen, (ii) only a minor dependence of the response of sulfur on the compound structure, (iii) prehrmnary expenments indicate that the h e a r sulfur mode suffers significantly less from quenching by co-eluting hydrocarbons than does the quadratic mode Overall the new hnear mode appears to be supenour over the conventional quadratic one, and it appears competitive wth other methodologies of organosulfur detection On the other hand the authors have also emphasised that the range of compounds tested in this study is hmted (only seven) and that the present conclusion should reman open to future re evaluation
Driscolland Berger [61] developed an FPD which employs rare-earth glass filters, improvlng the sensitivity by ehminating angular de-
Journal of High Resolution Chromatography VOL. 17, JUNE 1994 381
Determination of Sulfur Components in Natural Gas: A Review
pendence, which occurs with interference filters At the same time, the detector sensitivlty is improved by a factor of 2 - 3 omng to simultaneous detection of the vanous Sz* emssion hnes
A very interesting and highly promising development in the field of flame photometnc detection was pubhshed by Chesks et ai [62] in 1993 Cheslas descnbed a novel gas chromatographc detector based on the flame photometnc pnnciple the Pulsed-Flame Pho- tometer The pulsed-flame photometnc detector (P-FPD) is based on a flame source and a combustible gas flow rate that cannot sustain continuous-flame operation Thus, the ignited flame propa- gates back to the combustible gas mixture source and is self-term- nated after the combustible gas rmxture is burnt The continuous
1 P
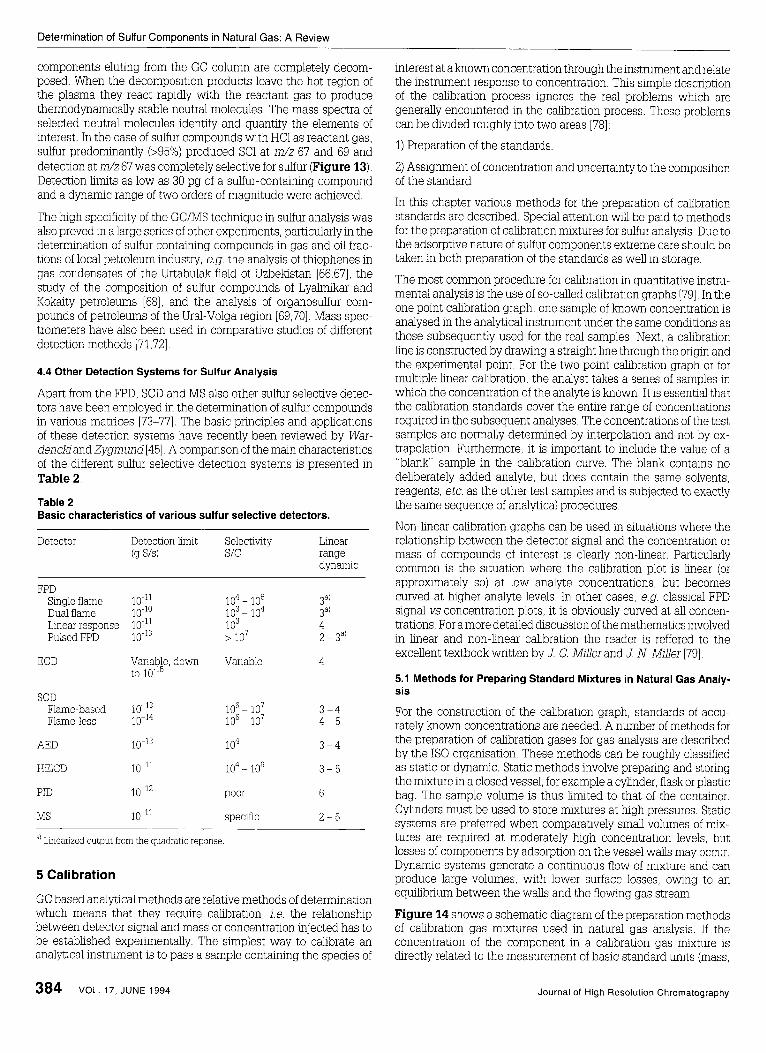
Figure 10 Schematic diagram of the pulsed FPD. The optical detection system is not drawn to scale. (1) main structure, (2) GC adapter, (3) GC-FID mount, (4) combustion cell holder, (5) quartz combustor, (6) igniter, (7) window, (8) quartz rod light guide, (9) color glass filter, (10) photomutiplier, (11) auxiliary screw valve, (12) igniter and heater electrical feedthroughs, (13) external material sampling inlet, (14) hydrogen inlet, (15) air inlet. Reprinted with permission from “Pulsed-Flame Photometer: A Novel Gas Chromatography Defector” by S. Cheskis, E. Atar, and A. Amirav, Analytical Chemistry, Vol. 65, p. 539. Copyright 1993 American Chemical Society.
TI ME (miiliseconds~
Figure 11 Time dependence of sulfur and carbon emission measured with an pulsed- FPD. PFPD emission time dependence of sulfur (S;) {solid line) is obtained at 395 nm through a monochromator and that of OH is obtained at 312 nm (dashed trace) which is identical to that of hydrocarbon emission such as CH or CZ . Detector temperature was 150 “C and very hydrogen rich flame condi- tions were used. Tetrahydrothiophene was introduced as the source of sulfur. The combustion cell length was 10 mm. The viewing window is 5 mm in diameter and is centered on the combustor. Reprinted with permission from “Pulsed-Flame Photometer: A Novel Gas Chromatography Detector” by S. Cheskis, E. Atar, and A. Amirav, Analytical Chemistry, Vol. 65, p. 539. Copyright 1993 American Chemical Society.
gas flow creates additional ignitions in a periodic fashon. A sche- matic diagram of the P-FPD is shown in Figure 10.
The main feature that characterizes the P-FPD is the pulsed-nature of the emitted light. Time domain information is added to the heteroatom specific emission with time dependent ermssion being observed (e.g. Figure 11). The main advantages of the P-FPD include improved detection sensitivity for S and P, much hgher selectivlty against hydrocarbon molecules, lower gas consumption, reduced emission quenching, additional temporal information, and the ability to detect selectively other heteroatoms such as nitrogen or the simultaneous detection of S and C. The minimum detection levels achieved are 2 x g S/s, 1 x g P/s, 5 x 10-l’ g N/s, and 6 x g U s . The sulfur concentration dependence of the P-FPD is quadratic and its response is independent of the structure of the sulfwcontaining molecules (linear factor n = 2.00 k 0.03). A comparison between the commercial double-flame photometer and the pulsed FPD is shown in Figure 12.
DOUBLE FPO n 320 0 240 PICOGRAM
1 PULSED FPD e
32 e 24 PICOGRAM SULFUR
I PULSED FPO C
3.2 0 2.4 PIC0 GR AM S U L F U R
, ! ! , , , I 0 2 4 6
TIME (min)
Figure 12 Comparison between the commercial double flame photometer (DFPD) (Varian) and the pulsed FPD (PFPD). Standard Varian FPD test sample was used containing 20 ng/pL each 1-dodecane-thiol, tributyl phosphate, methyl- parathion and 4000 nglpL rrpentadecane in isooctane. A 30-m capillary (0.25 mm i.d. DB-1) column was used at 220 “C. (A) 2 pL were injected with a 20:l split ratio with the DFPD being used in the sulfur mode. (B) 1 pL was injected with a split ratio of 1OO:l. The PFPD was used in the sulfur mode. (C) 0.10 pL was injected with a split ratio of 1OO:l. Again the PFPD was used in the sulfur mode. The detector response times are 1 s for the DFPD and 0.3 s for the PFPD. Reprinted with permission from “Pulsed-Flame Photometer; A Novel Gas Chromatography Detector” by S. Cheskis, E. Atar and A. Amirav, Analytical Chemistry, Vol. 65, p. 539. Copyright 1993 American Chemical Society.
4.2 Improvements in Sulfur Chemiluminescence Detection
In contrast to the flame photometnc detector which has already been commercially avalable for over 25 years, the sulfur chemlu- mnescence detector (SCD) only became avallable some six years ago In the SCD sulfur contamng components are converted to SO by means of a reducing flame or a furnace-based converter Cur- rently, two designs which differ in the way the SO converter is set-up are available In the flame-based system a ceramic samphng
382 VOL. 17, JUNE 1994 Journal of High Resolution Chromatography
Determination of Sulfur Components in Natural Gas: A Review
probe and a vacuum system is used to collect the gases from the flame of an FID SO is then sensitively detected based on an ozone-indu2ed chemilumnescence reaction to form electronically excited SO2 which relaxes by ermssion of hght in the wavelength range of 280 -420 nm The SCD can be coupled to the flame housing of a flame ionization detector (FID) and hence is compatible with most existing GC instruments Apart from the SCD signal of the sulfur components also an FID signal is obtaned, although the settings of both hydrogen and an are well outside optimum Re- cently, a new version of the SCD became commercially available In t h s instrument conversion of the sulfur components to SO no longer takes place in the FID flame The instrument contams an enclosed flame converter In the absence of the FIE the need for manual adlustment of the position of the ceramic tip in the FID flame is ehrmnated which greatly simphfies operation The sensitivlty of the new version of the SCD is clamed to be five to 10 times higher 1491
4.3 Mass Spectrometric Detection of Sulfur Compounds
The combination of gas chromatography with mass spectrometric detection is an extremely powerful tool in the analysis of unknown samples Mass spectrometnc detection offers a selectivlty unsur- passed by any of the other selective detection devlces Whereas selective detectors such as those descnbed above only reveal the presence of a certain hetero-atom, the mass spectrometer gives detaled information on the vanous structural groups present in a molecule Among the vanous ionization modes available especially electron ionization and chemcal ionization have gamed wide- spread acceptance The combination of these two iomzation modes with detection of either positive or negative ions results in four basic operational modes showng substantially different sensitivlties to- wards different types of components
Headley [63] used a bench-top GUMS system in the electron ionization mode to detect organosulfur compounds in environ- mental samples, e.g., industrial effluents, surface waters, sediment and fish samples. The electron-impact ion source was used with the electron energy set up at 70 eV. The mass range was 45 - 450 amu and the scan rate was 1 s-'. Positive ion detection was em- ployed. The compounds were detected in the approximate concen- tration range from 0.1 to 2000 ppb. Bandy et al. [15] developed an accurate technique for the determination of ppt levels of atmos- pheric CSz. High accuracy and immunity to analyte losses were achieved by using 1zC34S2 as an internal standard and by perform- ing the analysis by GC/quadrupole MS. High sensitivity was achieved by careful tuning of the GUMS and preconcentration of the CSz on a Carbosieve B adsorbent. Data acquisition was carried out in the multiple ion detection mode of the INCOS data system (Finnigan Instruments, Sunnyvale, CA). Mass windows of 75.75 amu to 76.25 amu and 79.75 amu to 80.25 amu were monitored for 0.2 s each. Parent ions of 1zC32Sz and 1zC34Sz, respectively, could be monitored in these windows. Optimization studies showed that an electron energy of 30 eV produced the best compromise between signal and background.
Giuze et al. [64] used GC/quadrupole MS to analyze sulfur com- pounds in gasoline. Specific detection of sulfur species could be achieved by using the quadrupole analyzer in the chemical ioniza- tion mode with ammonia as the reagent gas with detection of negative ions. The authors concluded that the selectivity gained by using the negative ion chemical ionization mode (NICI) was h g h enough to selectively detect sulfur components on low resolution quadrupole mass spectrometers, even without preliminary separa- tion of the samples.
In low resolution MS, chemical iomzation using ammonia as the reactant gas increases the selectivity In this ionization mode, the mass spectra obtained are farly simple The pseudomolecular ion as the base peak is charactenstic Unfortunately mercaptans have very low molecular weights It is hence necessary to start mass acquisition below 34 amu, the molecular weight of HzS With positive ion detection the reactant gas produces a considerable background noise in the low mass range On the other hand w t h negative ion detection, no background noise occurs in the low mass range resulting in an improved sensitivlty for sulfur compounds [64] Mass spectra obtained with positive CI are very sirmlar to EI ioni- zation, unhke negative CI whch is totally different from it [64] The high electron affinity and the low background noise level in the low mass range render negative ion-CI the most suitable ionization technique for GUMS analyses of volatile sulfur compounds
In high resolution mass spectrometry the principle is to measure only the CHS' fragment which is one of the fragments from R-SH compounds At mass 45, there are at least 7 other species that could interfere with CHS' at low mass resolution Only CHS', and 13CCzH8 fragments are issued from the sample All the other ions are background impunties M/AM is the resolution required to completely resolve other ionic species which have the same nomi- nal mass At a resolution of 3400, CHS' is totally isolated The resolution of a quadrupole mass analyzer is only 2 x M = 90 at mass 45
Recently, selective detection of sulfur-contaming compounds by a new GUMS combination technique, GC/Chemcal Reaction Inter- face MS, was reported [65] The pnnciple of this new method is based on the creation of a reaction interface by addition of a reactant gas to a low pressure mcrowave-induced plasma In t h s interface complex molecules are converted into small polyatomc neutral species For a gven reactant gas the array of these small molecules reflects the elemental composition of the onginal analyte M o m et a1 found that HC1 is highly effective as a reactant gas for selective detection of sulfur contanmg compounds In a low pressure micro- wave-induced plasma (temperature of about 4000 - 6000 K [65]), the
Jz n
PHENOBARBITAL THIOPENTAL v)
z w c 3 4 5 i
1 THIOPENTAL
l u u 2 3 4 5 i
TIME (rnin)
Figure 13 Selective detection of sulfur compounds by GClChemical reaction Interface MS. Chromatogram at m h 67 using a mixture of thiopental(6.6 ng on-column) and phenobarbital (26.4 ng on-column) is selective sulfur channel. The chro- matogram at m/z 27 (HCN) is a non-selective carbon channel. Reprinted by permission of Elsevier Science, Inc. from "Selective Detection of Sulfur-Con- taining Compounds by Gas Chromatography/Chemical Reaction Interface Mass Spectrometry" by M. Moini, D. Chace, and F. P. Abramson, Journal of the American Societyfor MassSpectrometry, Vol. 2, p. 250-255. Copyright 1991 by the American Society for Mass Spectrometry.
Journal of High Resolution Chromatography VOL. 17, JUNE 1994 383
Determination of Sulfur Components in Natural Gas: A Review
components eluting from the GC column are completely decom- posed. When the decomposition products leave the hot region of the plasma they react rapidly with the reactant gas to produce thermodynamically stable neutral molecules. The mass spectra of selected neutral molecules identify and quantify the elements of interest. In the case of sulfur compounds with HC1 as reactant gas, sulfur predomnantly (>95%) produced SC1 at m/z 67 and 69 and detection at m/z67 was completely selective for sulfur (Figure 13). Detection limits as low as 30 pg of a sulfur-containing compound and a dynamic range of two orders of magnitude were achieved.
The high specificity of the GUMS technique in sulfur analysis was also proved in a large series of other experiments, particularly in the determination of sulfur containing compounds in gas and oil frac- tions of local petroleum industry, e.g. the analysis of thophenes in gas condensates of the Urtabulak field of Uzbehstan (66,671, the study of the composition of sulfur compounds of Lyalrmkar and Kokaity petroleums [68], and the analysis of organosulfur com- pounds of petroleums of the Ural-Volga region (69,701. Mass spec- trometers have also been used in comparative studies of different detection methods (71,721
4.4 Other Detection Systems for Sulfur Analysis
Apart from the FPD, SCD and MS also other sulfur selective detec- tors have been employed in the determnation of sulfur compounds in various matrices [73-771 The basic pnnciples and apphcations of these detection systems have recently been reviewed by War- den& and Zygmund [45] A companson of the m a n charactenstics of the different sulfur selective detection systems is presented in Table 2
Table 2 Basic characteristics of various sulfur selective detectors.
Detector Detection hmit Selectivlty Linear (9 Sis) SIC range
dynamic
FPD Single flame Dual flame Linear response Pulsed FPD
ECD
SCD Flame-based Flame-less
AED
HElCD
PID
MS
10 l1
10- l~
to 1 0 - l ~
lo-;; 10
Variable, down
10 l 2
10-11
10-l2
lo4 - lo6 lo3 - lo4 1 o3 > lo7
Variable
lo6 - lo7 lo6 - lo7
lo4
lo4 - lo6
poor
specific
3a) 3a) 4 2 - 3a)
4
3 - 4 4 - 5
3 - 4
3 - 5
6
2 - 5
a' Linearized output from the quadratic reponse
5 Calibration
GC based analytical methods are relative methods of determnation which means that they require cahbration, 1 e the relationship between detector signal and mass or concentration injected has to be estabhshed experimentally The simplest way to cahbrate an analytical instrument is to pass a sample contaning the species of
interest at a known concentration through the instrument and relate the instrument response to concentration. This simple description of the calibration process ignores the real problems which are generally encountered in the cahbration process. These problems can be divided roughly into two areas [78]: 1) Preparation of the standards
2) Assignment of concentration and uncertainty to the composition of the standard.
In this chapter various methods for the preparation of calibration standards are described. Special attention will be pad to methods for the preparation of cahbration mixtures for sulfur analysis Due to the adsorptive nature of sulfur components extreme care should be taken in both preparation of the standards as well in storage
The most common procedure for calibration in quantitative instru- mental analysis is the use of so-called calibration graphs (791. In the one point cahbration graph, one sample of known concentration is analysed in the analytical instrument under the same conditions as those subsequently used for the real samples. Next, a c&bration line is constructed by drawing a straight line through the origin and the experimental point. For the two point calibration graph or for multiple linear calibration, the analyst takes a senes of samples in which the concentration of the analyte is known It is essential that the cahbration standards cover the entire range of concentrations required in the subsequent analyses. The concentrations of the test samples are normally determined by interpolation and not by ex- trapolation. Furthermore, it is important to include the value of a "blank" sample in the cahbration curve. The blank contains no deliberately added analyte, but does contain the same solvents, reagents, etc. as the other test samples and is subjected to exactly the same sequence of analytical procedures
Non-linear cahbration graphs can be used in situations where the relationshp between the detector signal and the concentration or mass of compounds of interest is clearly non-linear. Particularly common is the situation where the cahbration plot is linear (or approximately so) at low analyte concentrations, but becomes curved at higher analyte levels In other cases, e.g. classical FPD signal vs concentration plots, it is obviously curved at all concen- trations. For a more detailed discussion of the mathematics involved in linear and non-linear cahbration the reader is reffered to the excellent textbook written by J C. Miller and J N Miller [79].
5.1 Methods for Preparing Standard Mixtures in Natural Gas Analy- sis
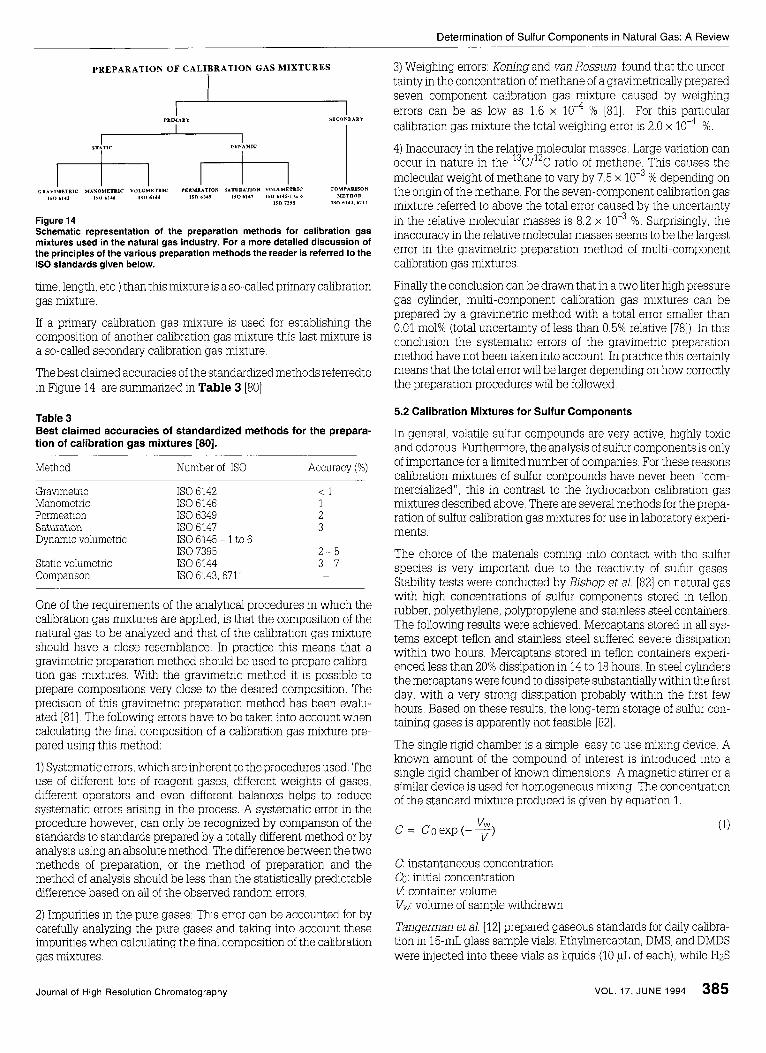
For the construction of the cahbration graph, standards of accu- rately known concentrations are needed. A number of methods for the preparation of calibration gases for gas analysis are described by the IS0 organisation. These methods can be roughly classified as static or dynamic. Static methods involve preparing and storing the mixture in a closed vessel, for example a cylinder, flask or plastic bag. The sample volume is thus limted to that of the container. Cylinders must be used to store mixtures at high pressures. Static systems are preferred when comparatively small volumes of mix- tures are required at moderately high concentration levels, but losses of components by adsorption on the vessel walls may occur. Dynamic systems generate a continuous flow of rmxture and can produce large volumes, with lower surface losses, owing to an equilibnum between the walls and the flowing gas stream
Figure 14 shows a schematic diagram of the preparation methods of calibration gas mixtures used in natural gas analysis. If the concentration of the component in a calibration gas mixture is directly related to the measurement of basic standard units (mass,
384 VOL. 17, JUNE 1994 Journal of High Resolution Chromatography
Determination of Sulfur Components in Natural Gas: A Review
PREPARATION OF CALIBRATION GAS MIXTURES
I
m m I Figure 14 Schematic representation of the preparation methods for calibration gas mixtures used in the natural gas industry. For a more detailed discussion of the principles of the various preparation methods the reader is referred to the IS0 standards given below.
time, length, etc ) than t h s mixture is a so-called pnmary cahbration gas mixture
If a pnmary cahbration gas mixture is used for estabhshmg the composition of another cahbration gas mixture this last mixture is a so-called secondary cahbration gas mixture
The best claimed accuracies of the standardized methods referredto in Figure 14 are summanzed in Table 3 [80]
Table 3 Best claimed accuracies of standardized methods for the prepara- tion of calibration gas mixtures [80].
Method Number of IS0 Accuracy (%)
Gravlmetnc IS0 6142 < 1 Manometric IS0 6146 1 Permeation IS0 6349 2 Saturation IS0 6147 3 Dynamic volumetnc IS0 6145 - 1 to 6
IS0 7395 2 - 5 Static volumetnc IS0 6144 3 - 7 Companson IS0 6143,6711 -
One of the requrements of the analytical procedures in which the cahbration gas rmxtures are apphed, is that the composition of the natural gas to be analyzed and that of the cahbration gas mxture should have a close resemblance In practice this means that a gravimetric preparation method should be used to prepare cahbra- tion gas mixtures With the gravimetnc method it is possible to prepare compositions very close to the desired composition The precision of t h s gravimetric preparation method has been evalu- ated I811 The following errors have to be taken into account when calculating the final composition of a cahbration gas mxture pre- pared using this method
1) Systematic errors which are inherent to the procedures used The use of different lots of reagent gases, different weights of gases, different operators and even different balances helps to reduce systematic errors ansing in the process A systematic error in the procedure however, can only be recognized by companson of the standards to standards prepared by a totally different method or by analysis using an absolute method The difference between the two methods of preparation, or the method of preparation and the method of analysis should be less than the statistically predictable difference based on all of the observed random errors
2) Impunties in the pure gases This error can be accounted for by carefully analyzing the pure gases and tahng into account these impunties when calculating the final composition of the cahbration gas mixtures
3) Weighing errors Koningand van Rossum found that the uncer- tainty in the concentration of methane of a gravimetrically prepared seven component cahbration gas mxture caused by weighing errors can be as low as 1 6 x % [81] For this particular cahbration gas mxture the total weighing error is 2 0 x lo4 %
4) Inaccuracy in the relative molecular masses Large vanation can occur in nature in the 13C/12C ratio of methane This causes the molecular weight of methane to vary by 7 5 x % depending on the ongm of the methane For the seven-component cahbration gas mixture referred to above the total error caused by the uncertainty in the relative molecular masses is 8 2 x 10 % Surprisingly the inaccuracy in the relative molecular masses seems to be the largest error in the grammetric preparation method of multi-component cahbration gas rmxtures
Finally the conclusion can be drawn that in a two hter high pressure gas cyhnder, multi-component cahbration gas mixtures can be prepared by a gravimetnc method with a total error smaller than 0 01 mol% (total uncertainty of less than 0 5% relative [78]) In this conclusion the systematic errors of the gravimetnc preparation method have not been taken into account In practice this certainly means that the total error will be larger depending on how correctly the preparation procedures will be followed
5.2 Calibration Mixtures for Sulfur Components
In general, volatile sulfur compounds are very active, highly toxic and odorous. Furthermore, the analysis of sulfur components is only of importance for a limited number of companies. For these reasons calibration mixtures of sulfur compounds have never been "com- mercialized", t h s in contrast to the hydrocarbon cahbration gas mixtures described above. There are several methods for the prepa- ration of sulfur calibration gas mixtures for use in laboratory expen- ments.
The choice of the materials coming into contact with the sulfur species is very important due to the reactivity of sulfur gases. Stability tests were conducted by Bishop et al. [82] on natural gas with high concentrations of sulfur components stored in teflon, rubber, polyethylene, polypropylene and stainless steel containers. The following results were achieved. Mercaptans stored in all sys- tems except teflon and stainless steel suffered severe dissipation within two hours. Mercaptans stored in teflon containers experi- enced less than 20% dissipation in 14 to 18 hours. In steel cyhnders the mercaptans were found to dissipate substantially within the first day, with a very strong dissipation probably within the first few hours. Based on these results, the long-term storage of sulfur con- taining gases is apparently not feasible [82]
The single rigid chamber is a simple, easy to use mixing device A known amount of the compound of interest is introduced into a single rigd chamber of known dimensions. A magnetic stirrer or a similar device is used for homogeneous mixing The concentration of the standard mixture produced is gven by equation 1.
VW C = Coexp(--) V
C instantaneous concentration Co initial concentration V contamer volume V, volume of sample withdrawn
Tangerman et a1 [12] prepared gaseous standards for daly cahbra- tion in 15-mL glass sample vlals Ethylmercaptan, DMS, and DMDS were inlected into these vlals as hquids (10 pL of each), whde HzS
Journal of High Resolution Chromatography VOL. 17, JUNE 1994 385
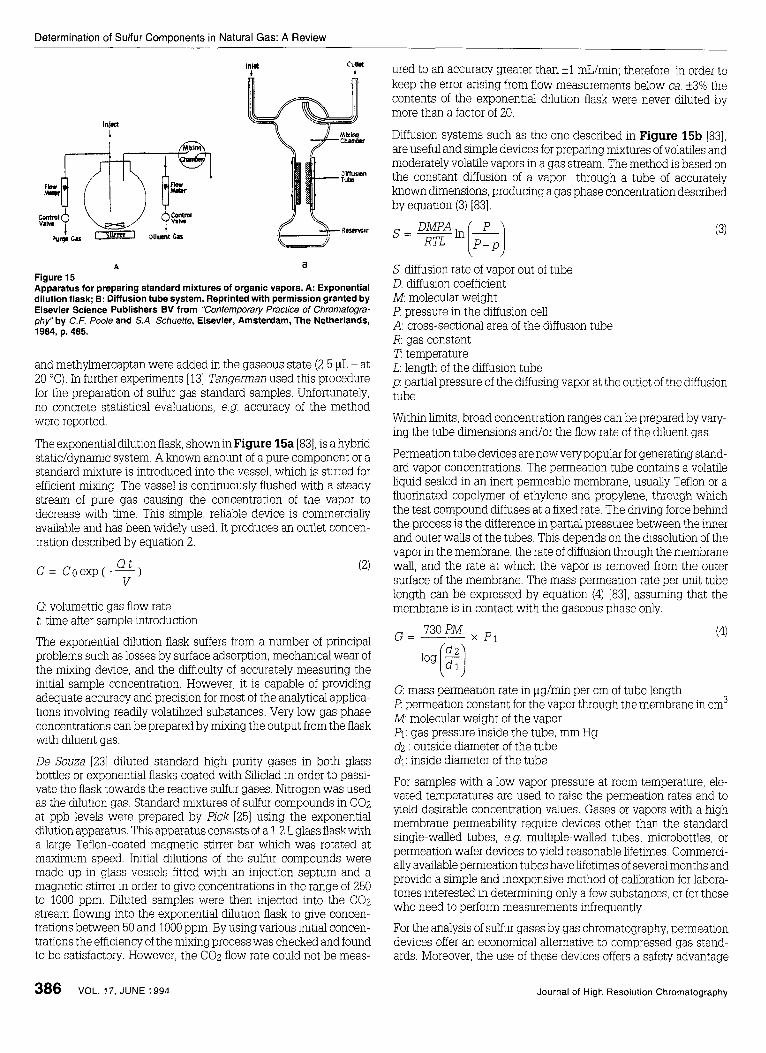
Determination of Sulfur Components in Natural Gas: A Review
ured to an accuracy greater than +1 mL/min; therefore, in order to keep the error arising from flow measurements below ca. +3% the contents of the exponential dilution flask were never diluted by more than a factor of 20.
Diffusion systems such as the one descnbed in Figure 15b (831, are useful and simple demces for prepanng rmxtures of volatiles and moderately volatile vapors in a gas stream The method is based on the constant diffusion of a vapor through a tube of accurately known dimensions, produang a gas phase concentration descnbed by equation (3) [83]
A 8 Figure 15 Apparatus for preparing standard mixtures of organic vapors. A: Exponential dilution flask; B: Diffusion tube system. Reprinted with permission granted by Elsevier Science Publishers BV from "Contemporay Practice of Chromatogra- phy" by C.F. Poole and S.A. Schueffe, Elsevier, Amsterdam, The Netherlands, 1984, p. 485.
and methylmercaptan were added in the gaseous state (2 5 pL - at 20 "C) In further expenments [ 131 Tangeman used t h s procedure for the preparation of sulfur gas standard samples Unfortunately, no concrete statistical evaluations, e g accuracy of the method were reported
The exponential ddution flask, shown in Figure 15a [83], is a hybnd statiddynamic system A known amount of a pure component or a standard mxture is introduced into the vessel, which is stirred for efficient mixlng The vessel is continuously flushed with a steady stream of pure gas causing the concentration of the vapor to decrease with time This simple, rehable devlce is commercially available and has been vvldely used It produces an outlet concen- tration descnbed by equation 2
C = Coexp(--) Q t (2) V
0: volumetric gas flow rate t: time after sample introduction
The exponential dilution flask suffers from a number of principal problems such as losses by surface adsorption, mechmcal wear of the mixing device, and the &fficulty of accurately measuring the initial sample concentration. However, it is capable of provihng adequate accuracy and precision for most of the analytical applica- tions involving readily volatilized substances. Very low gas phase concentrations can be prepared by mixing the output from the flask with diluent gas.
De Souza [23] diluted standard high purity gases in both glass bottles or exponential flasks coated with Siliclad in order to passi- vate the flask towards the reactive sulfur gases. Nitrogen was used as the dilution gas. Standard mixtures of sulfur compounds in COz at ppb levels were prepared by Rck [25] using the exponential blution apparatus. This apparatus consists of a 1.2 L glass flask with a large Teflon-coated magnetic stirrer bar which was rotated at maximum speed. Initial dilutions of the sulfur compounds were made up in glass vessels fitted with an injection septum and a magnetic stirrer in order to give concentrations in the range of 250 to 1000 ppm. Diluted samples were then injected into the COz stream flowing into the exponential dilution flask to gve concen- trations between 50 and 1000 ppm By using various initial concen- trations the efficiency of the mixing process was checked and found to be satisfactory. However, the COz flow rate could not be meas-
S diffusion rate of vapor out of tube D: diffusion coefficient M molecular weight P pressure in the diffusion cell A: cross-sectional area of the diffusion tube R: gas constant T temperature L: length of the diffusion tube p: partial pressure of the diffusing vapor at the outlet of the diffusion tube
Within limits, broad concentration ranges can be prepared by vary- ing the tube dimensions and/or the flow rate of the diluent gas.
Permeation tube devices are now very popular for generating stand- ard vapor concentrations. The permeation tube contans a volatile liquid sealed in an inert permeable membrane, usually Teflon or a fluorinated copolymer of ethylene and propylene, through which the test compound diffuses at a fixed rate. The driving force behind the process is the difference in partial pressures between the inner and outer walls of the tubes This depends on the dissolution of the vapor in the membrane, the rate of diffusion through the membrane wall, and the rate at whch the vapor is removed from the outer surface of the membrane. The mass permeation rate per unit tube length can be expressed by equation (4) [83], assuming that the membrane is in contact with the gaseous phase only.
G=- 730 PM (4)
G: mass permeation rate in yg/min per cm of tube length P permeation constant for the vapor through the membrane in cm3 M molecular weight of the vapor PI: gas pressure inside the tube, mm Hg dz : outside diameter of the tube di: inside diameter of the tube
For samples with a low vapor pressure at room temperature, ele- vated temperatures are used to raise the permeation rates and to yeld desirable concentration values. Gases or vapors with a high membrane permeability require devices other than the standard single-walled tubes, e.g. multiple-walled tubes, microbottles, or permeation wafer devices to veld reasonable lifetimes. Commerci- ally available permeation tubes have lifetimes of several months and provide a simple and inexpensive method of calibration for labora- tories interested in determining only a few substances, or for those who need to perform measurements infrequently.
For the analysis of sulfur gases by gas chromatography, permeation devices offer an economical alternative to compressed gas stand- ards. Moreover, the use of these devices offers a safety advantage
386 VOL. 17, JUNE 1994 Journal of High Resolution Chromatography
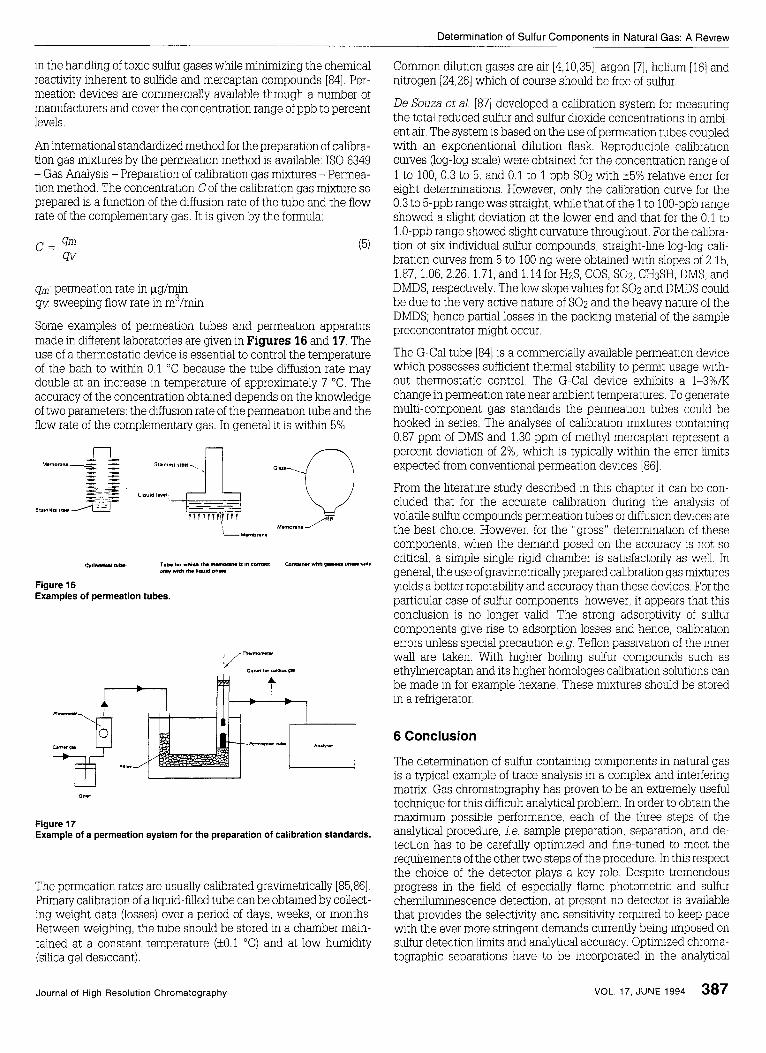
Determination of Sulfur Components in Natural Gas: A Review
in the handhng of toxlc sulfur gases whle rmmmzing the chemcal reactimty inherent to sulfide and mercaptan compounds [84] Per- meation demces are commercially available through a number of manufacturers and cover the concentration range of ppb to percent levels
An international standardized method for the preparation of cahbra- tion gas rmxtures by the permeation method is avalable IS0 6349 - Gas Analysis - Preparation of cahbration gas mxtures - Permea- tion method The concentration C of the cahbration gas mxture so prepared is a function of the diffusion rate of the tube and the flow rate of the complementary gas It is gwen by the formula
(5)
Qm permeation rate in pg/mn qv sweeping flow rate in m3/mn
Some examples of permeation tubes and permeation apparatus made 1 ~ 1 different laboratones are gven in Figures 16 and 17 The use of a thermostatic demce is essential to control the temperature of the bath to withn 0 1 "C because the tube diffusion rate may double at an increase in temperature of approxlmately 7 "C The accuracy of the concentration obtamed depends on the knowledge of two parameters the diffusion rate of the permeation tube and the flow rate of the complementary gas In general it is vvlthin 5%
Figure 16 Examples of permeation tubes.
Fill"
;> Figure 17 Example of a permeation system for the preparation of calibration standards.
The permeation rates are usually cahbrated gravimetrically [85,861 Pnmary cahbration of a hquid-filled tube can be obtained by collect- ing weight data (losses) over a penod of days, weeks, or months Between weighing, the tube should be stored in a chamber main- taned at a constant temperature (k0 1 "C) and at low humdity (sihca gel desiccant)
Common dilution gases are air [4,10,351, argon [7], helium I161 and nitrogen [24,26] which of course should be free of sulfur.
De Souza et al. [87] developed a calibration system for measuring the total reduced sulfur and sulfur dioxide concentrations in ambi- ent air. The system is based on the use of permeation tubes coupled with an exponentional dilution flask. Reproducible cahbration curves (log-log scale) were obtained for the concentration range of 1 to 100, 0.3 to 5, and 0.1 to 1 ppb SOz with f5% relative error for eight determinations. However, only the cahbration curve for the 0.3 to 5-ppb range was straight, whde that of the 1 to 100-ppb range showed a slight deviation at the lower end and that for the 0 1 to 1.0-ppb range showed slight curvature throughout. For the calibra- tion of six individual sulfur compounds, straight-line log-log cah- bration curves from 5 to 100 ng were obtained with slopes of 2.15, 1.87, 1.06,2.26, 1.71, and 1.14 for HzS, COS, SOz, CH3SH, DMS, and DMDS, respectively. The low slope values for SO2 and DMDS could be due to the very active nature of SOz and the heavy nature of the DMDS; hence partial losses in the paclang material of the sample preconcentrator might occur.
The G-Cal tube 1841 is a commercially available permeation device which possesses sufficient thermal stability to permit usage with- out thermostatic control. The G-Cal device exhibits a 1-3%/K change in permeation rate near ambient temperatures. To generate multi-component gas standards the permeation tubes could be hooked in series. The analyses of cdbration mxtures containing 0.87 ppm of DMS and 1.30 ppm of methyl mercaptan represent a percent demation of 2%, which is typically within the error limits expected from conventional permeation devices [86].
From the literature study described in this chapter it can be con- cluded that for the accurate cahbration during the analysis of volatile sulfur compounds permeation tubes or diffusion devices are the best choice. However, for the "gross" determnation of these components, when the demand posed on the accuracy is not so critical, a simple single rigid chamber is satisfactonly as well In general, the use of gravimetrically prepared cahbration gas mixtures yelds a better repetabhty and accuracy than these devices. For the particular case of sulfur components, however, it appears that t h s conclusion is no longer vahd. The strong adsorptivity of sulfur components give rise to adsorption losses and hence, calibration errors unless special precaution e.g. Teflon passivation of the inner wall are taken. With higher boiling sulfur compounds such as ethylmercaptan and its higher homologes calibration solutions can be made in for example hexane. These mxtures should be stored in a refrigerator.
6 Conclusion
The detemnation of sulfur contaning components in natural gas is a typical example of trace analysis in a complex and interfering matnx Gas chromatography has proven to be an extremely useful techruque for this difficult analytical problem In order to obtain the maxlmum possible performance, each of the three steps of the analytical procedure, I e sample preparation separation, and de- tection has to be carefully optimzed and fine-tuned to meet the requirements of the other two steps of the procedure In t h s respect the choice of the detector plays a key role Despite tremendous progress in the field of especially flame photometnc and sulfur chemlurmnescence detection, at present no detector is avalable that promdes the selectivity and sensitivity required to keep pace mth the ever more stnngent demands currently being imposed on sulfur detection hmts and analytical accuracy Optimzed chroma- tographc separations have to be incorporated in the analytical
Journal of High Resolution Chromatography VOL. 17, JUNE 1994 387
Determination of Sulfur Components in Natural Gas: A Review
procedure Due to their high resolving power capillary columns are to be prefered over the classical packed columns The sensitimty of the analytical system can be improved by preconcentration of the sulfur components on a suitable sohd adsorbent pnor to transfer of the sample on to the chromatographic column Polar adsorbents appear highly promising as these matenals could promde selective ennchment of the components of interest For cahbration of GC- based analytical techniques for sulfur deterrmnation in natural gas dynarmcally generated cahbration standards appear to be more rehable than statically prepared standards Adsorption losses which are unavoidable in static cahbration, are sigmficantly lower or often even fully absent in dynamic system such as permeation or diffusion devlces
References A L C Smrtand E Meiler, Proceedings of the Congress of "Gas Quahty Specifica- tion and Measurement of Physical and Chemical Properties of Natural Gas", Gronmgen, The Netherlands, 22-25 Apnl 1986, Elsemer, Amsterdam, The Neth- erlands, 1986, p 589
IS0 6326-1 (E) International Standard "Natural Gas-Determination of Sulfur Compounds" Part 1 "General Introduction", Geneve, Switzerland, 1989
DFS. Natusch, H B Klonis, H.D. Axelrod, R.J Teck, and J P . Lodge, Jr . Anal Chem 44 (1972) 2067
H D Axelrodand S.G. Hansen, Anal. Chem. 47 (1975) 2460
P W West and G C. Gaeke, Jr., Anal. Chem 28 (1956) 1816
R.S Braman, J M Ammons, and J L . Bncker, Anal Chem 50 (1978) 992
RA Kagel and S O Farwell, Anal Chem 58 (1986) 1197
S 0 Farwell, D P Liebowitz, R A. Kagel, and D F. Adams, Anal Chem 52 (1980) 2370
M S Black, R B Herbst, and D.R Hitchcock, Anal Chem. 50 (1978) 848.
P A Steudlerand WKijovski, Anal Chem 56 (1984) 1432
A. Przyjazny, J Chromatogr 333 (1985) 327
A Tangerman, M. T Meuwese-Arends, and J H M van Tongeren, Chnica Chimica Acta 130 (1983) 103
A Tangerman, J Chromatogr 366 (1986) 205
J J Henatsch and F Juttner, J Chromatogr 445 (1988) 97.
A R Bandy, B J Tucker, and P i Marouhs, Anal Chem 57 (1985) 1310
F Caronand J R Kramer, Anal. Chem. 61 (1989) 114.
1171 S 0 Farwell, S.J Gluck, W L Bamesberger, TM. Scbutte, and D F Adams, Anal
1181 R K. Stevens, J D . Mulik, A E O'Keeffe, and K J Krost, Anal. Chem 43 (1971) 827
1191 F Bruner, B Ciccioh. and F Di Natra. Anal Chem 47 (1975) 141
1201 D Suierand A Hill, J Chromatogr Sci 20 (1982) 429
1211 T L C de Souza, D C Lane, and S P Bbatia, Anal Chem. 47 (1975) 543 [22] C A Burgett, The Rapid Determination of HzS, COS, and SO2 by Gas Chromatog-
raphy. Hewlett-Packard Application Note ANGC5-75. Hewlett-Packard Com- pany, Avondale. Pennsylvania, 1975.
1231 TL C de Souza, J Chromatogr Sci 22 (1984) 470 1241 C D Pearson, J. Chromatogr Sci. 14 (1974) 154
1251 ME. Pick, J Chromatogr 171 (1979) 305
[ZSl B J Ehrhch, R C Hall, R J Anderson, and H G. Cox, J. Chromatogr. Sci. 19 (1981)
[27J VB Stein and R S Narang, Anal Chem 54 (1982) 991
[281 J L Genna. W D McAninch, and R A Reich, J Chromatogr. 238 (1982) 103
[291 P Ronkainen. J Densiow, and 0 Leppanen. J. Chromatogr Sci 11 (1973) 384
(301 K J Rygie, G.P Feulmer, and R F. Scheideman, J Chromatog Sci 22 (1984) 514
1311 A.H.H. Tameesh. A 0 Bender, and T.M. Sarkissian, J Chromatog 321 (1985) 59
1321 P A Gibbons, Chromatogaphia 19 (1984) 254
1331 L. Blomberg, J Chromatogr 125 (1976) 389 1341 C J Barinaga and S.0 Farwell. J. High Resolut Chromatagr & Chromatog.
Chem 51 (1979) 609
245
Commun 9 (1986) 388
351 C J Barinaga and S 0 Farwell, J High Resclut Chromatogr & Chromatogr
1361 S Jacobsson and 0. Fak, J. Chromatogr 479 (1989) 194
I371 KK. Gaines, W H Chatham. and S O Farwell, J High Resolut. Chromatogr 11 (1990) 585.
I381 F Russo and F Maghmi, Proceedings of the Congress of "Gas Quality - Specifi- cation and Measurement of Physical and Chemical Properties of Natural Gas", Gronmgen, The Netherlands, 22-25 April 1986, Elsevier, Amsterdam, The Neth- erlands, 1986, p 633.
1391 SE.A Monks, Roceedings of the Congress of "Gas Quality-Specification and Measurement of Physical and Chemical Properties of Natural Gas", Groningen, The Netherlands, 22-25 April 1986, Elsevier, Amsterdam, The Netherlands, 1986, p 641
1401 H. Obbens and L. Huber, Proceedings of the Congress of "Gas Quality -Specifica- tion and Measurement of Physical and Chemicai Properties of Natural Gas", Gronmgen, The Netherlands, 22-25 Apnl 1986, Elsemer, Amsterdam, The Neth- erlands, 1986, p 649
1411 D. Jentzsch and E Otte, "Methoden der Analyse in der Chemie" Band 14 "Detektoren in der Gas-chromatographie", Akademische Verlagsgesellschaft, Frankfurt am Man , Germany, 1970
1421 J Sevcik, J. Chromatogr Lib , Vol +Detectors in Gas Chromatography, Elsemer Pub , Amsterdam, The Netherlands, 1976
1431 M Dressler, J Chromatogr Lib.. Vol 36-Selective Gas Chromatographic Detec- tors, Elsevier Pub., Amsterdam, The Netherlands, 1986
[44] H.V Drushel, J Chromatogr Sci 21 (1983) 375
[45] W Wardencki and B Zygmund, Anal Chim Acta 255 (1991) 1
1461 SS Brodyand J E . Chaney, J Gas Chromatog 4 (1966) 42
1471 S 0 FarweU and C J Bannaga. J Chromatogr Sci 24 (1986) 483.
1481 PL Patterson, R L Howe, and A Abu-Shumays, Anal Chem 50 (1978) 339
[49] M. Dyson, Anal Proceed 30 (1993) 79
[501 A R Bag, C J Cowper, and P A Gibbons, Chromatographla 16 (1982) 297
1511 J Efer, T Maurer, and W Engewald, Chromatographia 29 (1990) 115
1521 G H Liu and P.R Fu, Chromatcgraphia 27 (1989) 159
1531 J Zehnerand R Simonaitis, J Chromatogr Sci 12 (1976) 348
1541 WA Aue and C G Fhnn, J Chromatogr 158 (1975) 161
1551 T Cardwelland P Mamot, J Chromatogr Sci 20 (1982) 3017
[56] J Sevcikand N Phuong Thao, Chromatographia 8 (1975) 559
[57] WA Aue, X - Y Sun, and B. Millier, J Chromatog 606 (1992) 73
[581 WA AueandX-Y. Sun, J Chromatogr 633 (1993) 151
1591 WA Aue and X -Y Sun, J Chromatcgr. 641 (1993) 291
[601 Li Schurath, M Weber, and K H Becker, J Chem. Phys 67 (1977) 110. p 112. Fig 2B
1611 J N Dnscoll and A W Berger, J. Chromatogr 468 (1989) 303
1621 S Chesias, E. Atar, and A Amirav, Anal Chem 65 (1993) 539.
1631 J.V Headley, Biomed Enwron. Mass Spectrom 14 (1987) 275
1641 J Guieze, G Devant, and D Loyaux, Int J Mass Spectrom Ion Phys 46 (1983)
I651 M Moini, D Chace. and FP Abramson, J Am Soc Mass Spectrom 2 (1991) 250
I661 N. V Agadzhanova, N.K Lyapina, R B Aheva, VS Shmakov, and MA Parfenova, Neftechimiya. 26 (1986) 132
1671 N V Agadzhanova, NK. Lyapina, R B Aheva, V.S. Shmakov. and M A Parfenova, Neftechimiya 23 (1983) 424
[68l Kb Khaitbaev, ES Brodskii, and S L Gusinskaya, Dokl Akad Nauk Uzb SSR, 31 (1974) 26
[691 R D Obolentsev, T I Ahlueva, G V Galeeva, R.P Kruglyakova. SS Krivolapov, and I M Sahmareeva, Khim Seraorg Soedm , Soderzh Neftyakh Nefteprod 9 (1972) 364.
1701 R.D. Obolentsev, SS . Knvolapov, T I Allilueva. G.V Galeeva, VS Kaneva, R P. Kaneva, and N.N Lyushina, Khim Senaorg Seodin Soderzh. Neftyakh Nefteprod 8 (1968) 341
1711 Z SChUltheiSZ, S lglewski, M. Kantor, and E Kerenyi, Magy Asvanyola] Foldgaz Kiserl. Intez Kozlem 10 (1969) 31
Commun 10 (1987) 538
313
388 VOL. 17, JUNE 1994 Journal of High Resolution Chromatography

Determination of Sulfur Components in Natural Gas: A Review
I721 I Schdtheisz, M Kantor, K Belafi, P. Szepesvary, and E Kerenyi, Chroma- tographc and Spectrometric Study of Sulphur Compounds of Cracked Gasohnes, paper pres at Con Chem. Chem Process Petrol Natur Gas, Budapest, 1965, p 605.
1731 J E Johnson and J E Lovelock, Anal. Chem 60 (1988) 812
1741 SE Eckert-Tiiotta, S.B Hawthorne, and D J Miller, J Chromatogr. 591 (1992) 313
I751 R C Mitchner, S Nacson, and J Wallace, A portable GC analyzer for on-site analysis of natural gas odorant levels, Paper pres. at IGT Gas Quality Symp (June 12-13 1989). Chicago, IL, USA
1761 R G Schillerand R B Bronsky, J Chrornatogr. SCI 15 (1977) 541
1771 F Lindqmst. J High Resolut Chromatogr 12 (1989) 628
1781 E.E. Hughes, Roceedings of the Congress of "Gas Quality-Specification and Measurement of Physical and Chemical Properties of Natural Gas", Groningen, The Netherlands, 22-25 April 1986, Elsevier, Amsterdam, The Netherlands, 1986, p 675
[791 J C Miller and J N Miller, Statistics for the Anal. Chem. Ellis Horwood Ltd , 3rd E d , West Sussex, England, 1993
I801 Internal pubhcation Lab Info Bulletin No 37, NV Nederlandse Gasunie, Gronin- gen, the Netherlands.
Journal of High Resolution Chromatography
[81l M. Koningand G J van Rossum, Proceedings of the Congress of "Gas Quahty - Specification and Measurement of Physical and Chermcal Properties of Natural Gas", Gronmgen, The Netherlands, 22-25 April 1986. Elsewer. Amsterdam. The Netherlands. 1986, p. 683
[82] H.K. Bishopand J R Bncarello, Odorant Identification and Measurement in Natural Gas by Gas Chromatography, AGA paper pres. at DistribiTrans Conference, Boston, (1985) 601-605
1831 C F Pooleand S.A. Schuette, Contemporary Practice of Chromatography, Elsewer. Amsterdam, The Netherlands, p. 485, 1984
1841 D G. Flowers, Ind. Eng Chem Res 29 (1990) 1565
1851 A E O'Keeffe and G.C. Ortman, Anal. Chem 38 (1966) 760.
[861 F P Scanngelii, A E O'Keeffe, E. Rosenberg, and J P Bell Anal Chem 42 (1970)
1871 T L C deSouza and S P Bhatia. Anal. Chem 48 (1976) 2234
871.
Ms received January 27, 1994 Accepted May 19, 1994
VOL. 17, JUNE 1994 389


![ELEMENTAL SULFUR FROM MEXICO - USITC fileUNITED STATES TARIFF COMMISSION Washington, D.C. [AA1921-92] ELEMENTAL SULFUR FROM MEXICO Determination of Injury On February 4, 1972, the](https://img.pdfslide.us/doc/110x75/5ce106c188c993406b8c2c7b/elemental-sulfur-from-mexico-states-tariff-commission-washington-dc-aa1921-92.jpg)