Embed Size (px)
Citation preview
*Corresponding author.Email: [email protected]
International Food Research Journal 28(5): 987 - 995 (October 2021)Journal homepage: http://www.ifrj.upm.edu.my
© All Rights Reserved
Abstract
Near-infrared reflectance spectroscopy (NIRS) was used to determine the total starch and amylose contents in various kinds of cereals namely wheat, waxy rice, non-waxy rice, millet, sorghum, waxy maize, buckwheat, barley, and hulless oat. The partial least-squares (PLS) analysis and principal component regression (PCR) were used to establish the calibration models. PLS model achieved a better effect than PCR at 1100 - 2500 nm, and the coefficient of determination (R2) of the calibration and prediction sets were both higher than 0.9 after the best pre-treatment method, first derivative plus Savitzky-Golay. Additionally, the root mean square error (RMSE) was lower than 2.50, and the root mean square error of cross-validation (RMSECV) was less than 3.50 for starch. By comparing PLS models at different waveband regions, the optimal determination results for starch and amylose were obtained at 1923 - 1961 and 1724 - 1818 nm, respectively. NIRS was found to be a successful method to determine the starch and amylose contents in various cereals.
Keywords
Article history
Received: 19 March 2020Received in revised form: 10 March 2021Accepted:15 March 2021
near-infrared spectroscopy, chemometrics, rice, millet, amylose
Introduction
Cereals, which mainly include rice, wheat, oat, and sorghum, are a rich source of carbohydrates, vitamins, minerals, oils, and proteins. Global cereal production reached approximately 3,000 million tons, and accounted for more than 73% of the global harvest area. The outputs of maize, rice, and wheat were 10.40, 7.41, and 7.29 hundred million tons, respectively, accounting for 89% of the total cereal production (according to the Food and Agriculture Organization (FAO) statistics). Starch is the most important component of cereals as its content accounts for over 80% of rice (Souza et al., 2016), at least 70% of wheat (Rahman et al., 2000), 62% of maize (Longe et al., 1982), and roughly 75% of millet (all on a dry weight basis). Starch is mainly composed of two glucans, namely the linear and helical amylose, and the branched amylopectin. Native cereal starches have varied content of amylose, e.g., Indica and Japonica rice have approximately 20% amylose, waxy rice only contains < 2% amylose, and waxy maize and amylomaize starch have a wide range of amylose from 1 to 70% (Buckow et al., 2007). The amylose content and the multi-scale structure of starches are the major factors determining the physico-chemical
properties of rice (Wang et al., 2017). Starch with higher amylose content has lower crystallinity, higher retrogradation rate, lower gel temperature, lower viscosity of gelatinisation characteristics, poorer waxy quality, and is also harder to be digested than low-amylose starch (Zhang and Hamaker, 2012; Wang and Copeland, 2015). Starch content is usually measured by the Association of Official Agricultural Chemists (AOAC) method 996.11, by using acid hydrolysis (AOAC, 1997). Single- and double-wave colorimetric methods are used for the determination of amylose (Tian et al., 2015). However, the traditional analysis process is time-consuming and non-environmentally friendly. Near infrared reflectance spectroscopy (NIRS) is a rapid, non-destructive, environmentally friendly, multi-analytical, and highly accurate determination method (Bázár et al., 2016). Recently, NIRS has become a popular method in a wide range of agricultural and food industry applications, and it is even used in some online monitoring systems. Siriphollakul et al. (2017) analysed the eating qualities (amylose content and texture properties) of rice using NIRS. The protein and gluten contents of wheat flour (Chen et al., 2017), and the protein and amylose contents of rice flour have been successfully
1Department of Food Science and Engineering, College of Biological Sciences and Technology, Beijing Key Laboratory of Forest Food Process and Safety, Beijing Forestry University, Beijing 100083, China
2Beijing Centre for Physical and Chemical Analysis, Beijing Food Safety Analysis and Testing Engineering Research Centre, Beijing 100089, China
1He, M. H., 1Hu, J. Q., 2Wu, Y. W. and 1*Ouyang, J.
Determination of starch and amylose contents in various cereals using common model of near-infrared reflectance spectroscopy
988 He, M., et al./IFRJ 28(5) : 987 - 995
determined by NIRS (Xie et al., 2014). Previous literature mainly concentrated on only one kind of cereal to obtain an accurate model, but no common model suitable for all kinds of cereals disregarding the difference in chemical compounds has been established. Therefore, the present work aimed to explore the feasibility of employing NIRS in determining the starch and amylose contents in various cereals including waxy and conventional types. Pre-treatments and chemometric methods including partial least squares (PLS) and principal component regression (PCR) were applied to establish the models and perform the analysis.
Materials and methods
Plant materials A total of 101 cereal samples were purchased from the markets in Beijing, China. The selection of cereal samples was based on their varieties and production. The samples consisted of nine kinds of cereals: wheat (Bainong AK58, 2; Jimai 22, 2), waxy rice (round waxy rice, 11; long waxy rice, 10), non-waxy rice (Japonica rice: Changlixiang, 5; Daohuaxiang, 5; Pearl rice, 5; Komachi rice, 2; Indica rice: Thai Fragrant rice, 5; Simiao rice, 5; Maoya rice, 5), millet (Qinzhou yellow millet, 5; Jingu 21, 4; Longshan millet, 3; Taohuami, 3), sorghum (Dongliang 80, 4), maize (Nonghua 101, 4; Denghai 6702, 4), waxy maize (Zhefengnuo 7, 4; Zhongnuo 301, 4), buckwheat (Yuqiao 3, 3; Tianqiao 92-1, 2), barley (Pu barley 7, 2), and hulless oat (Huabei 2, 2), which were obtained from different varieties and producing areas of China. All cereal samples were ground and passed through a 0.2 mm sieve. The standards (amylose and amylopectin) were purchased from Sigma-Aldrich (Saint Louis, MO, USA). All other analytical grade chemicals were purchased from Sinopharm Chemical Reagent Co., Ltd., (Beijing, China).
Content analysis of starch and apparent amylose The starch content was analysed by method 996.11 (AOAC, 1997). Apparent amylose content (AAC) was determined by forming an iodine-binding complex of soluble starch, and measuring its absorbance using a U-3010 Spectrometer (Hitachi, Tokyo, Japan) at 620 nm (Xie et al., 2014). The AAC was calculated based on a standard curve plotted from different ratios of amylose and amylopectin solutions.
Near-infrared spectra acquisition The near-infrared reflectance spectra of
cereal samples were recorded at 1100 - 2500 nm with an ANTARIS near-infrared Fourier transform spectrometer (Nicolet Instruments Corp., Thermo-Fisher Scientific, Madison, WI, USA) equipped with a halogen lamp light source and an InGaAs detector. Approximately 10 g of powder of each sample was loaded in a round cup with an internal diameter of 38 mm and a depth of 10 mm. The sample was plated with at least 5 mm of thickness to prevent light transmission. Each sample was scanned three times, and each spectrum was collected by 32 scans at a resolution of 2 cm-1. Statistical analysis The NIR spectra were imported into the OMNIC software (Nicolet Instruments Corp., Thermo-Fisher Scientific, Waltham, MA, USA) to obtain the average spectrum of each sample. Analysis of the data was performed by PCR and PLS using the TQ Analysis V6.0 software (Thermo Fisher Scientific, Waltham, MA, USA). PCA is a statistical method that is applied to extract the main information from NIR spectra, and turn a set of possibly correlated variables into a series of linearly uncorrelated variables (PCs) (Hu et al., 2017). PCR is a regression analysis technique based on PCA. PCR considers regressing the outcome on a set of covariates based on a standard linear regression model, and uses PCA to estimate the unknown regression coefficients in the model. The PLS were evaluated using the leave-one-out cross-validation. Pre-treatment methods, including smoothing (Savitzky-Golay and Norris) and derivatives (first derivative and second derivative) were used to eliminate the interference of irrelevant information before calibration stage. Savitzky-Golay filters utilise a local polynomial fit controlled by three parameters to smooth and derivatise the spectra (Savitzky and Golay, 1964). Norris derivative smoothing is used as a variable selection step, and the random noise is removed (Liu et al., 2015). Using the spectroscopic signal to set up the prediction model makes the PLS analysis as the most widely used multivariate calibration technique (Ge et al., 2014). PLS analysis has no restriction in the selected number of wavelengths, and it extracts the maximum information from the spectra to obtain a suitable model (Xie et al., 2009). The prediction performance was assessed by the coefficient of determination (R2), the root mean square error of prediction (RMSEP), the root mean square error of correction (RMSEC), the root mean square error of cross-validation (RMSECV), and the ratio of standard deviation (SD) to RMSEP (RPD). The
He, M., et al./IFRJ 28(5) : 987 - 995 989
optimal number of latent variables was determined by the lowest value of the predicted residual error sum of squares (Shao et al., 2011). Models with lower RMSEC, RMSEP, RMSECV, and higher R2 and RPD are considered better (Xie et al., 2009). For the PLS model establishment, 80 samples (16 waxy rice, 28 non-waxy rice, 12 millet, 3 wheat, 6 maize, 6 waxy maize, 4 buckwheat, 3 sorghum, 1 hulless oat, and 1 barley) among 101 cereal samples were allocated at random from each cereal type to the calibration set to build the models, and the other 21 samples were used as the validation sets.
Results and discussion
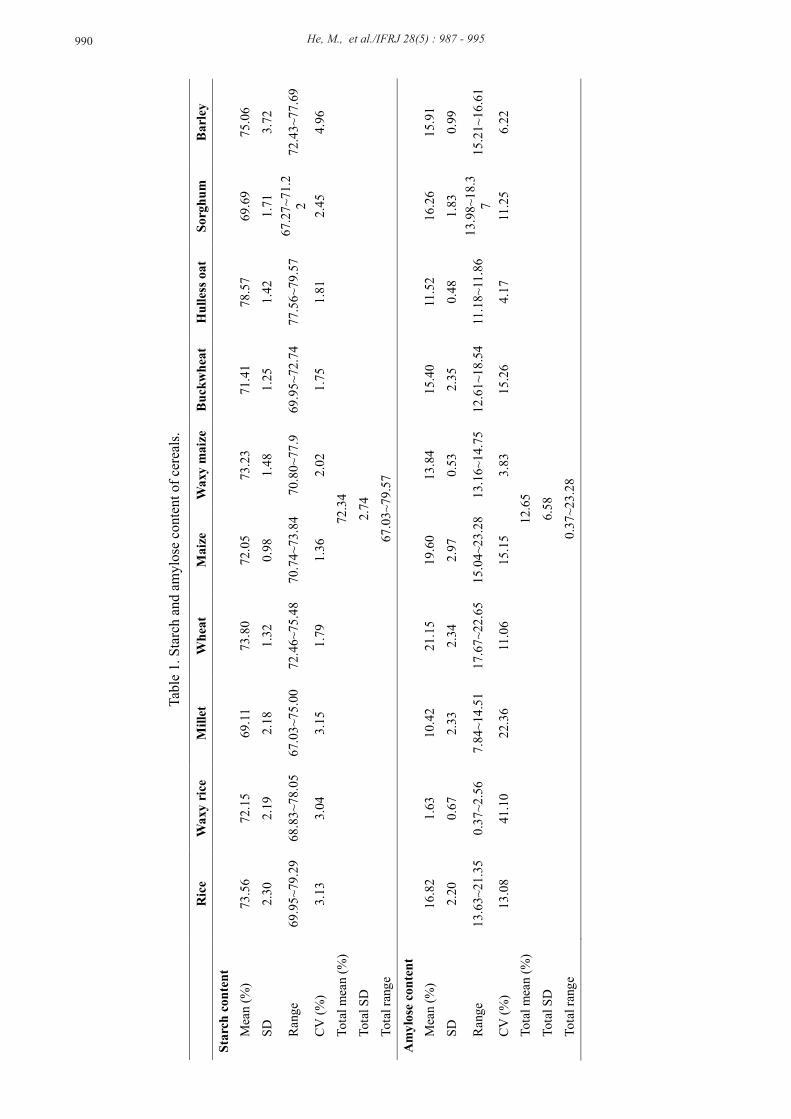
Analysis of starch and AAC in cereals The mean, range, standard deviations (SD), coefficient of variation (CV) of the starch, and AAC of all the various kinds of cereals are presented in Table 1. The starch contents of all the samples were between 67.03 - 79.57% with the mean of 72.34%. The starch contents of the various samples are consistent with previous reports. The contents of carbohydrate in non-waxy rice, waxy rice, millet, wheat, maize, barley, sorghum, and buckwheat from China are 71.8 - 77.5, 74.7 - 79.0, 73.5 - 75.1, 71.5 - 76.1, 66.6 - 69.6, 63.4 - 65.2, 70.4 - 74.7, and 66.5 - 67.8%, respectively, based on wet weight (Yang et al., 2009). In previous studies, the starch contents of millet and sorghum from Nigeria were 75.0 - 85.0 and 55.6 - 75.2%, respectively, based on dry weight (Gaffa et al., 2004). The starch content of waxy rice of Indian varieties was 83.48% (Pachuau et al., 2017), which is higher than that of the Chinese varieties assessed in the present work. There was a significant difference in the AAC of the cereal samples, which ranged from 0.37 - 23.28%. These values indicated that the amylose
diversity of the various kinds of cereals was well represented by the selected samples. Similar results were found in previous studies, e.g., 11.67 - 27.59% amylose in non-waxy rice (Yu et al., 2009), 12.2 - 28.6% in rice (Azudin and Morrison, 1986), 2.2 ± 0.27% in waxy rice (Pachuau et al., 2017), 21.3% in millet, and 20.1 - 21.4% in sorghum (Gaffa et al., 2004).
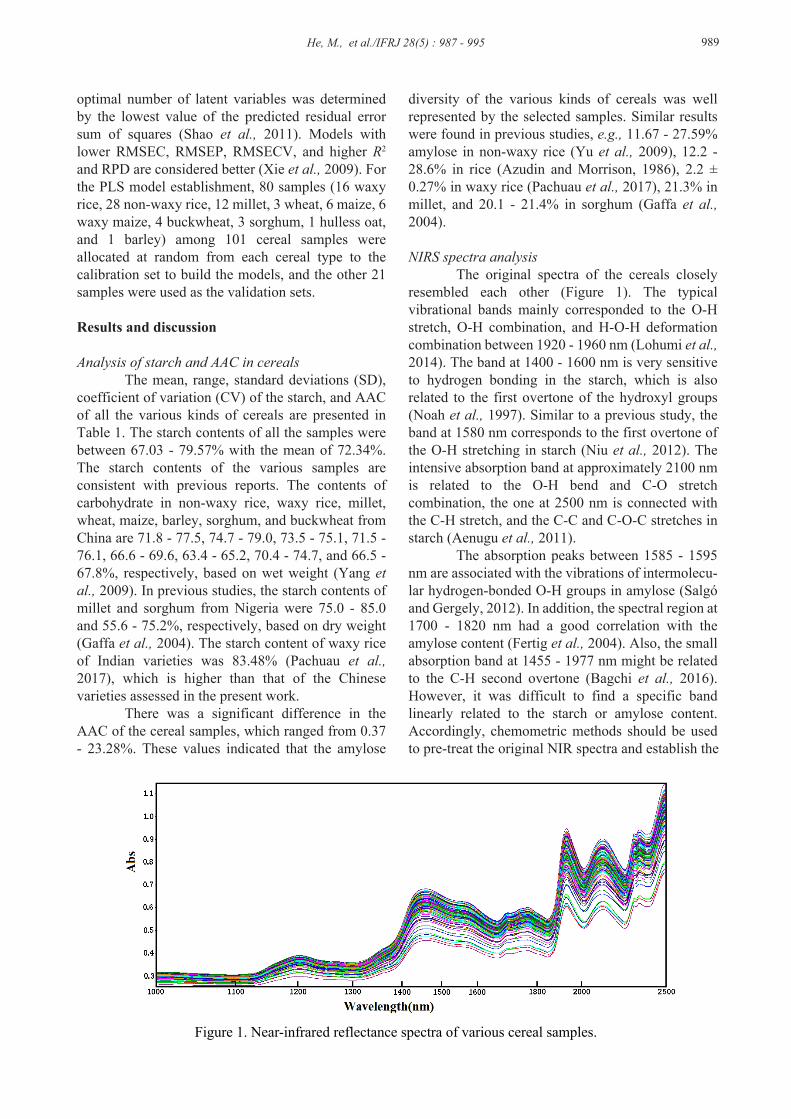
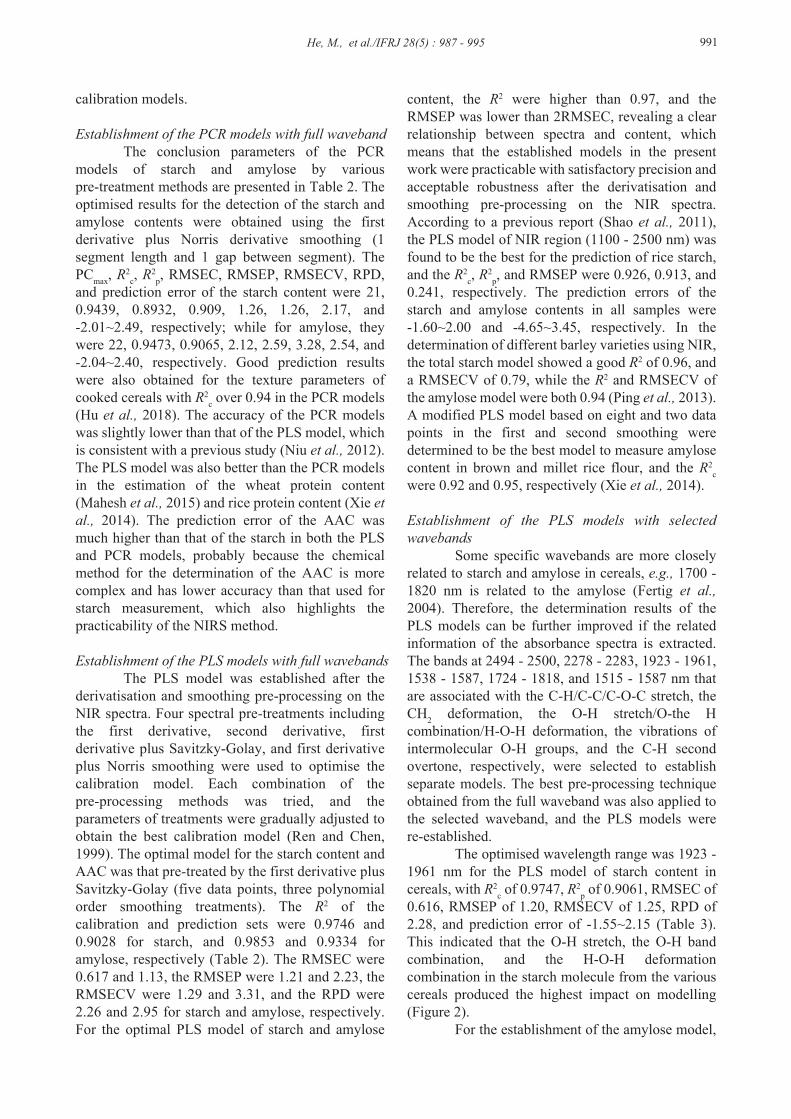
NIRS spectra analysis The original spectra of the cereals closely resembled each other (Figure 1). The typical vibrational bands mainly corresponded to the O-H stretch, O-H combination, and H-O-H deformation combination between 1920 - 1960 nm (Lohumi et al., 2014). The band at 1400 - 1600 nm is very sensitive to hydrogen bonding in the starch, which is also related to the first overtone of the hydroxyl groups (Noah et al., 1997). Similar to a previous study, the band at 1580 nm corresponds to the first overtone of the O-H stretching in starch (Niu et al., 2012). The intensive absorption band at approximately 2100 nm is related to the O-H bend and C-O stretch combination, the one at 2500 nm is connected with the C-H stretch, and the C-C and C-O-C stretches in starch (Aenugu et al., 2011). The absorption peaks between 1585 - 1595 nm are associated with the vibrations of intermolecu-lar hydrogen-bonded O-H groups in amylose (Salgó and Gergely, 2012). In addition, the spectral region at 1700 - 1820 nm had a good correlation with the amylose content (Fertig et al., 2004). Also, the small absorption band at 1455 - 1977 nm might be related to the C-H second overtone (Bagchi et al., 2016). However, it was difficult to find a specific band linearly related to the starch or amylose content. Accordingly, chemometric methods should be used to pre-treat the original NIR spectra and establish the
Figure 1. Near-infrared reflectance spectra of various cereal samples.
990 He, M., et al./IFRJ 28(5) : 987 - 995
R
ice
Wax
y ri
ce
Mill
et
Whe
at
Mai
ze
Wax
y m
aize
B
uckw
heat
H
ulle
ss o
at
Sorg
hum
B
arle
y
Star
ch c
onte
nt
Mea
n (%
) 73
.56
72.1
5 69
.11
73.8
0 72
.05
73.2
3 71
.41
78.5
7 69
.69
75.0
6
SD
2.30
2.
19
2.18
1.
32
0.98
1.
48
1.25
1.
42
1.71
3.
72
Ran
ge
69.9
5~79
.29
68.8
3~78
.05
67.0
3~75
.00
72.4
6~75
.48
70.7
4~73
.84
70.8
0~77
.9
69.9
5~72
.74
77.5
6~79
.57
67.2
7~71
.22
72.4
3~77
.69
CV
(%)
3.13
3.
04
3.15
1.
79
1.36
2.
02
1.75
1.
81
2.45
4.
96
Tota
l mea
n (%
) 72
.34
Tota
l SD
2.
74
Tota
l ran
ge
67.0
3~79
.57
Am
ylos
e co
nten
t M
ean
(%)
16.8
2 1.
63
10.4
2 21
.15
19.6
0 13
.84
15.4
0 11
.52
16.2
6 15
.91
SD
2.20
0.
67
2.33
2.
34
2.97
0.
53
2.35
0.
48
1.83
0.
99
Ran
ge
13.6
3~21
.35
0.37
~2.5
6 7.
84~1
4.51
17
.67~
22.6
5 15
.04~
23.2
8 13
.16~
14.7
5 12
.61~
18.5
4 11
.18~
11.8
6 13
.98~
18.3
7 15
.21~
16.6
1
CV
(%)
13.0
8 41
.10
22.3
6 11
.06
15.1
5 3.
83
15.2
6 4.
17
11.2
5 6.
22
Tota
l mea
n (%
) 12
.65
Tota
l SD
6.
58
Tota
l ran
ge
0.37
~23.
28
Tabl
e 1.
Sta
rch
and
amyl
ose
cont
ent o
f cer
eals
.
He, M., et al./IFRJ 28(5) : 987 - 995 991
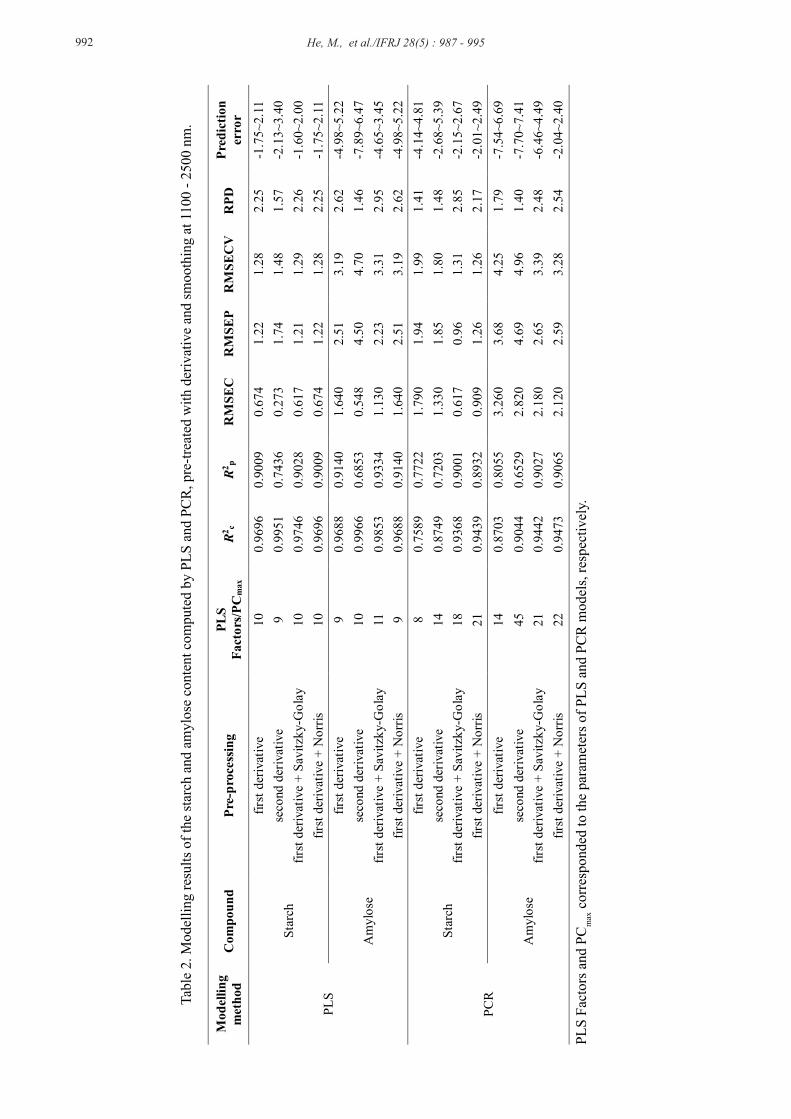
calibration models. Establishment of the PCR models with full waveband The conclusion parameters of the PCR models of starch and amylose by various pre-treatment methods are presented in Table 2. The optimised results for the detection of the starch and amylose contents were obtained using the first derivative plus Norris derivative smoothing (1 segment length and 1 gap between segment). The PCmax, R
2c, R
2p, RMSEC, RMSEP, RMSECV, RPD,
and prediction error of the starch content were 21, 0.9439, 0.8932, 0.909, 1.26, 1.26, 2.17, and -2.01~2.49, respectively; while for amylose, they were 22, 0.9473, 0.9065, 2.12, 2.59, 3.28, 2.54, and -2.04~2.40, respectively. Good prediction results were also obtained for the texture parameters of cooked cereals with R2
c over 0.94 in the PCR models (Hu et al., 2018). The accuracy of the PCR models was slightly lower than that of the PLS model, which is consistent with a previous study (Niu et al., 2012). The PLS model was also better than the PCR models in the estimation of the wheat protein content (Mahesh et al., 2015) and rice protein content (Xie et al., 2014). The prediction error of the AAC was much higher than that of the starch in both the PLS and PCR models, probably because the chemical method for the determination of the AAC is more complex and has lower accuracy than that used for starch measurement, which also highlights the practicability of the NIRS method.
Establishment of the PLS models with full wavebands The PLS model was established after the derivatisation and smoothing pre-processing on the NIR spectra. Four spectral pre-treatments including the first derivative, second derivative, first derivative plus Savitzky-Golay, and first derivative plus Norris smoothing were used to optimise the calibration model. Each combination of the pre-processing methods was tried, and the parameters of treatments were gradually adjusted to obtain the best calibration model (Ren and Chen, 1999). The optimal model for the starch content and AAC was that pre-treated by the first derivative plus Savitzky-Golay (five data points, three polynomial order smoothing treatments). The R2 of the calibration and prediction sets were 0.9746 and 0.9028 for starch, and 0.9853 and 0.9334 for amylose, respectively (Table 2). The RMSEC were 0.617 and 1.13, the RMSEP were 1.21 and 2.23, the RMSECV were 1.29 and 3.31, and the RPD were 2.26 and 2.95 for starch and amylose, respectively. For the optimal PLS model of starch and amylose
content, the R2 were higher than 0.97, and the RMSEP was lower than 2RMSEC, revealing a clear relationship between spectra and content, which means that the established models in the present work were practicable with satisfactory precision and acceptable robustness after the derivatisation and smoothing pre-processing on the NIR spectra. According to a previous report (Shao et al., 2011), the PLS model of NIR region (1100 - 2500 nm) was found to be the best for the prediction of rice starch, and the R2
c, R2p, and RMSEP were 0.926, 0.913, and
0.241, respectively. The prediction errors of the starch and amylose contents in all samples were -1.60~2.00 and -4.65~3.45, respectively. In the determination of different barley varieties using NIR, the total starch model showed a good R2 of 0.96, and a RMSECV of 0.79, while the R2 and RMSECV of the amylose model were both 0.94 (Ping et al., 2013). A modified PLS model based on eight and two data points in the first and second smoothing were determined to be the best model to measure amylose content in brown and millet rice flour, and the R2
c were 0.92 and 0.95, respectively (Xie et al., 2014).
Establishment of the PLS models with selected wavebands Some specific wavebands are more closely related to starch and amylose in cereals, e.g., 1700 - 1820 nm is related to the amylose (Fertig et al., 2004). Therefore, the determination results of the PLS models can be further improved if the related information of the absorbance spectra is extracted. The bands at 2494 - 2500, 2278 - 2283, 1923 - 1961, 1538 - 1587, 1724 - 1818, and 1515 - 1587 nm that are associated with the C-H/C-C/C-O-C stretch, the CH2 deformation, the O-H stretch/O-the H combination/H-O-H deformation, the vibrations of intermolecular O-H groups, and the C-H second overtone, respectively, were selected to establish separate models. The best pre-processing technique obtained from the full waveband was also applied to the selected waveband, and the PLS models were re-established. The optimised wavelength range was 1923 - 1961 nm for the PLS model of starch content in cereals, with R2
c of 0.9747, R2p of 0.9061, RMSEC of
0.616, RMSEP of 1.20, RMSECV of 1.25, RPD of 2.28, and prediction error of -1.55~2.15 (Table 3). This indicated that the O-H stretch, the O-H band combination, and the H-O-H deformation combination in the starch molecule from the various cereals produced the highest impact on modelling (Figure 2). For the establishment of the amylose model,
He, M., et al./IFRJ 28(5) : 987 - 995992
Tabl
e 2.
Mod
ellin
g re
sults
of t
he st
arch
and
am
ylos
e co
nten
t com
pute
d by
PLS
and
PC
R, p
re-tr
eate
d w
ith d
eriv
ativ
e an
d sm
ooth
ing
at 1
100
- 250
0 nm
.
PLS
Fact
ors a
nd P
Cm
ax c
orre
spon
ded
to th
e pa
ram
eter
s of P
LS a
nd P
CR
mod
els,
resp
ectiv
ely.
Mod
ellin
g m
etho
d C
ompo
und
Pre-
proc
essin
g PL
S Fa
ctor
s/PC
max
R2 c
R2 p R
MSE
C
RM
SEP
RM
SEC
V
RPD
Pr
edic
tion
erro
r
PLS
Star
ch
first
der
ivat
ive
10
0.96
96
0.90
09
0.67
4 1.
22
1.28
2.
25
-1.7
5~2.
11
seco
nd d
eriv
ativ
e 9
0.99
51
0.74
36
0.27
3 1.
74
1.48
1.
57
-2.1
3~3.
40
first
der
ivat
ive
+ Sa
vitz
ky-G
olay
10
0.
9746
0.
9028
0.
617
1.21
1.
29
2.26
-1
.60~
2.00
fir
st d
eriv
ativ
e +
Nor
ris
10
0.96
96
0.90
09
0.67
4 1.
22
1.28
2.
25
-1.7
5~2.
11
Am
ylos
e
first
der
ivat
ive
9 0.
9688
0.
9140
1.
640
2.51
3.
19
2.62
-4
.98~
5.22
se
cond
der
ivat
ive
10
0.99
66
0.68
53
0.54
8 4.
50
4.70
1.
46
-7.8
9~6.
47
first
der
ivat
ive
+ Sa
vitz
ky-G
olay
11
0.
9853
0.
9334
1.
130
2.23
3.
31
2.95
-4
.65~
3.45
fir
st d
eriv
ativ
e +
Nor
ris
9 0.
9688
0.
9140
1.
640
2.51
3.
19
2.62
-4
.98~
5.22
PCR
Star
ch
first
der
ivat
ive
8 0.
7589
0.
7722
1.
790
1.94
1.
99
1.41
-4
.14~
4.81
se
cond
der
ivat
ive
14
0.87
49
0.72
03
1.33
0 1.
85
1.80
1.
48
-2.6
8~5.
39
first
der
ivat
ive
+ Sa
vitz
ky-G
olay
18
0.
9368
0.
9001
0.
617
0.96
1.
31
2.85
-2
.15~
2.67
fir
st d
eriv
ativ
e +
Nor
ris
21
0.94
39
0.89
32
0.90
9 1.
26
1.26
2.
17
-2.0
1~2.
49
Am
ylos
e
first
der
ivat
ive
14
0.87
03
0.80
55
3.26
0 3.
68
4.25
1.
79
-7.5
4~6.
69
seco
nd d
eriv
ativ
e 45
0.
9044
0.
6529
2.
820
4.69
4.
96
1.40
-7
.70~
7.41
fir
st d
eriv
ativ
e +
Savi
tzky
-Gol
ay
21
0.94
42
0.90
27
2.18
0 2.
65
3.39
2.
48
-6.4
6~4.
49
first
der
ivat
ive
+ N
orris
22
0.
9473
0.
9065
2.
120
2.59
3.
28
2.54
-2
.04~
2.40
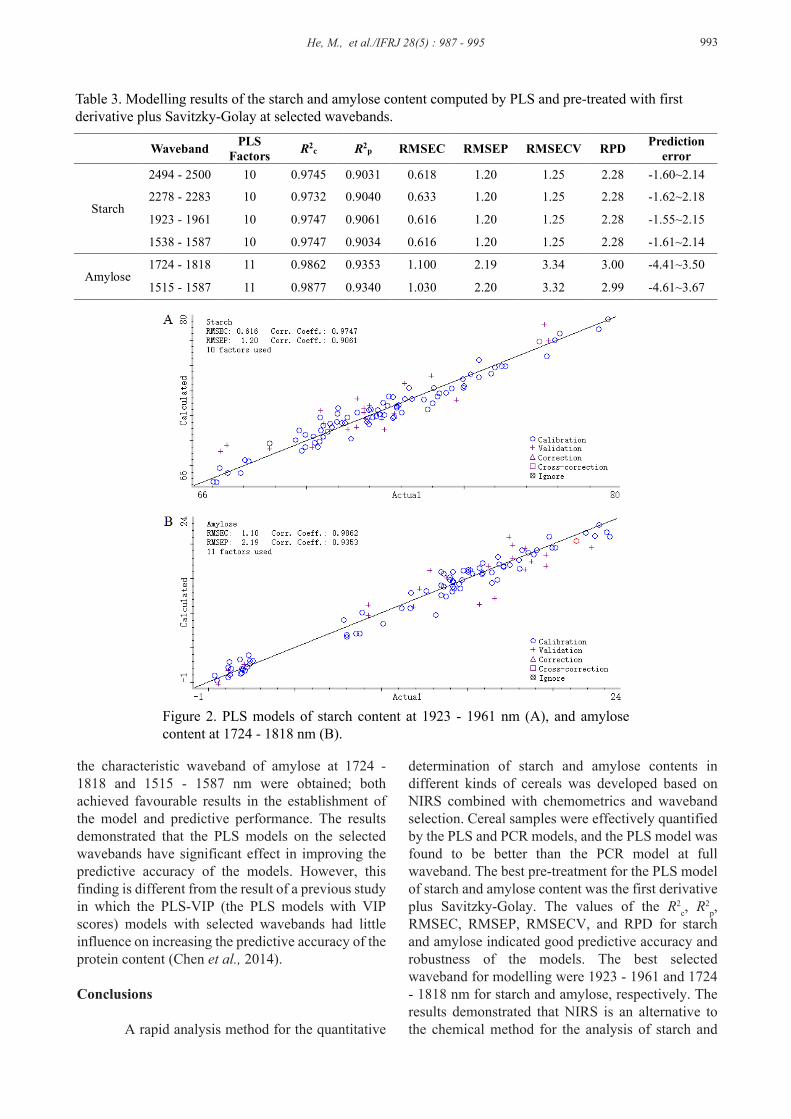
the characteristic waveband of amylose at 1724 - 1818 and 1515 - 1587 nm were obtained; both achieved favourable results in the establishment of the model and predictive performance. The results demonstrated that the PLS models on the selected wavebands have significant effect in improving the predictive accuracy of the models. However, this finding is different from the result of a previous study in which the PLS-VIP (the PLS models with VIP scores) models with selected wavebands had little influence on increasing the predictive accuracy of the protein content (Chen et al., 2014).
Conclusions
A rapid analysis method for the quantitative
determination of starch and amylose contents in different kinds of cereals was developed based on NIRS combined with chemometrics and waveband selection. Cereal samples were effectively quantified by the PLS and PCR models, and the PLS model was found to be better than the PCR model at full waveband. The best pre-treatment for the PLS model of starch and amylose content was the first derivative plus Savitzky-Golay. The values of the R2
c, R2p,
RMSEC, RMSEP, RMSECV, and RPD for starch and amylose indicated good predictive accuracy and robustness of the models. The best selected waveband for modelling were 1923 - 1961 and 1724 - 1818 nm for starch and amylose, respectively. The results demonstrated that NIRS is an alternative to the chemical method for the analysis of starch and
He, M., et al./IFRJ 28(5) : 987 - 995 993
Waveband PLS Factors R2c R2p RMSEC RMSEP RMSECV RPD Prediction
error
Starch
2494 - 2500 10 0.9745 0.9031 0.618 1.20 1.25 2.28 -1.60~2.14
2278 - 2283 10 0.9732 0.9040 0.633 1.20 1.25 2.28 -1.62~2.18
1923 - 1961 10 0.9747 0.9061 0.616 1.20 1.25 2.28 -1.55~2.15
1538 - 1587 10 0.9747 0.9034 0.616 1.20 1.25 2.28 -1.61~2.14
Amylose 1724 - 1818 11 0.9862 0.9353 1.100 2.19 3.34 3.00 -4.41~3.50
1515 - 1587 11 0.9877 0.9340 1.030 2.20 3.32 2.99 -4.61~3.67
Table 3. Modelling results of the starch and amylose content computed by PLS and pre-treated with first derivative plus Savitzky-Golay at selected wavebands.
Figure 2. PLS models of starch content at 1923 - 1961 nm (A), and amylose content at 1724 - 1818 nm (B).
He, M., et al./IFRJ 28(5) : 987 - 995994
amylose in different kinds of cereals due to its simplicity, accuracy, and environmental friendliness.
Acknowledgement The present work was financially supported by the Beijing Natural Science Foundation (2182020) and the Fundamental Research Funds to the Central Universities of China (2015ZCQ-SW-04).
References
Aenugu, H. P. R., Kumar, D. S., Parthiban, S. N., Ghosh, S. S. and Banji, D. 2011. Near infra red spectroscopy - an overview. International Journal of Chemtech Research 3: 825-836.
Association of Official Analytical Chemists (AOAC). 1997. Official methods of analysis of Association of Official Analytical Chemists. 16th ed. United States: AOAC.
Azudin, M. N. and Morrison, W. R. 1986. Non-starch lipids and starch lipids in milled rice. Journal of Cereal Science 4: 23-31.
Bagchi, T. B., Sharma, S. and Chattopadhyay, K. 2016. Development of NIRS models to predict protein and amylose content of brown rice and proximate compositions of rice bran. Food Chemistry 191: 21-27.
Bázár, G., Romvári, R., Szabó, A., Somogyi, T., Éles, V. and Tsenkova, R. 2016. NIR detection of honey adulteration reveals differences in water spectral pattern. Food Chemistry 194: 873-880.
Buckow, R., Heinz, V. and Knorr, D. 2007. High pressure phase transition kinetics of maize starch. Journal of Food Engineering 81: 469-475.
Chen, H. Z., Song, Q. Q., Tang, G. Q. and Xu, L. L. 2014. An optimization strategy for waveband selection in FT-NIR quantitative analysis of corn protein. Journal of Cereal Science 60: 595-601.
Chen, J., Zhu, S. P. and Zhao, G. H. 2017. Rapid determination of total protein and wet gluten in commercial wheat flour using siSVR-NIR. Food Chemistry 221: 1939-1946.
Fertig, C. C., Podczeck, F., Jee, R. D. and Smith, M. R. 2004. Feasibility study for the rapid determination of the amylose content in starch by near-infrared spectroscopy. European Journal of Pharmaceutical Sciences 21: 155-159.
Gaffa, T., Yoshimoto, Y., Hanashiro, I., Honda, O., Kawasaki, S. and Takeda, Y. 2004. Physicochemical properties and molecular structures of starches from millet (Pennisetum typhoides) and sorghum (Sorghum bicolor L.
Moench) cultivars in Nigeria. Cereal Chemistry 81: 255-260.
Ge, F., Chen, C., Liu, D. and Zhao, S. 2014. Rapid quantitative determination of walnut oil adulteration with sunflower oil using fluorescence spectroscopy. Food Analytical Methods 7: 146-150.
Hu, J. Q., Ma, X. C., Liu, L. L., Wu, Y. W. and Ouyang, J. 2017. Rapid evaluation of the quality of chestnuts using near-infrared reflectance spectroscopy. Food Chemistry 231: 141-147.
Hu, J. Q., Wang, Z., Wu, Y. W., Liu, Y. G. and Ouyang, J. 2018. Rapid determination of the texture properties of cooked cereals using near-infrared reflectance spectroscopy. Infrared Physics and Technology 94: 165-172.
Liu, X., Zhang, X., Rong, Y. Z., Wu, J. H., Yang, Y. J. and Wang, Z. W. 2015. Rapid determination of fat, protein and amino acid content in Coix seed using near-infrared spectroscopy technique. Food Analytical Methods 8: 334-342.
Lohumi, S., Lee, S., Lee, W. H., Kim, M. S., Mo, C., Bae, H. and Cho, B. K. 2014. Detection of starch adulteration in onion powder by FT-NIR and FT-IR spectroscopy. Journal of Agricultural and Food Chemistry 62: 9246-9251.
Longe, O. G., Fetuga, B. L. and Aken'Ova, M. E. 1982. Carbohydrate constituents of some Nigerian maize varieties grown at three soil nitrogen levels. Food Chemistry 8: 179-186.
Mahesh, S., Jayas, D. S., Paliwal, J. and White, N. D. G. 2015. Comparison of partial least squares regression (PLSR) and principal components regression (PCR) methods for protein and hardness predictions using the near-infrared (NIR) hyperspectral images of bulk samples of Canadian wheat. Food and Bioprocess Technology 8: 31-40.
Niu, X. Y., Zhao, Z. L., Jia, K. J. and Li, X. T. 2012. A feasibility study on quantitative analysis of glucose and fructose in lotus root powder by FT-NIR spectroscopy and chemometrics. Food Chemistry 133: 592-597.
Noah, L., Robert, P., Millar, S. and Champ, M. 1997. Near-infrared spectroscopy as applied to starch analysis of digestive contents. Journal of Agricultural and Food Chemistry 45: 2593-2597.
Pachuau, L., Dutta, R. S., Roy, P. K., Kalita, P. and Lalhlenmawia, H. 2017. Physicochemical and disintegrant properties of glutinous rice starch of Mizoram, India. International Journal of Biological Macromolecules 95: 1298-1304.
Ping, H., Wang, J. H. and Ren, G. X. 2013. Prediction of the total starch and amylose content
He, M., et al./IFRJ 28(5) : 987 - 995 995
in barley using near-infrared reflectance spectroscopy. Intelligent Automation and Soft Computing 19: 231-237.
Rahman, S., Li, Z., Batey, I., Cochrane, M. P., Appels, R. and Morell, M. 2000. Genetic alteration of starch functionality in wheat. Journal of Cereal Science 31: 91-110.
Ren, G. X. and Chen, F. 1999. Simultaneous quantification of ginsenosides in American ginseng (Panax quinquefolium) root powder by visible/near-infrared reflectance spectroscopy. Journal of Agricultural and Food Chemistry 47: 2771-2775.
Salgó, A. and Gergely, S. 2012. Analysis of wheat grain development using NIR spectroscopy. Journal of Cereal Science 56: 31-38.
Savitzky, A. and Golay, M. J. E. 1964. Smoothing and differentiation of data by simplified least squares procedures. Analytical Chemistry 36: 1627-1639.
Shao, Y. N., Cen, Y. L., He, Y. and Liu, F. 2011. Infrared spectroscopy and chemometrics for the starch and protein prediction in irradiated rice. Food Chemistry 126: 1856-1861.
Siriphollakul, P., Nakano, K., Kanlayanarat, S., Ohashi, S., Sakai, R., Rittiron, R. and Maniwara, P. 2017. Eating quality evaluation of Khao Dawk Mali 105 rice using near-infrared spectroscopy. LWT - Food Science and Technology 79: 70-77.
Souza, D., Sbardelotto, A. F., Ziegler, D. R., Marczak, L. D. F. and Tessaro, I. C. 2016. Characterization of rice starch and protein obtained by a fast alkaline extraction method. Food Chemistry 191: 36-44.
Tian, B., Deng, Z. Y., Xie, Q. G. and Tian, J. C. 2015. Genetic dissection of the developmental behaviour of total starch content and its components in wheat grain. Crop and Pasture Science 66: 445-455.
Wang, S. J. and Copeland, L. 2015. Effect of acid hydrolysis on starch structure and functionality: a review. Critical Reviews in Food Science and Nutrition 55: 1081-1097.
Wang, S. J., Li, P. Y., Yu, J. L., Guo, P. and Wang, S. 2017. Multi-scale structures and functional properties of starches from Indica hybrid, Japonica and waxy rice. International Journal of Biological Macromolecules 102: 136-143.
Xie, L. H., Tang, S. Q., Chen, N., Luo, J., Jiao, G. A., Shao, G. N., ... and Hu, P. S. 2014. Optimisation of near-infrared reflectance model in measuring protein and amylose content of rice flour. Food Chemistry 142: 92-100.
Xie, L. J., Ye, X. Q., Liu, D. H. and Ying, Y. B. 2009.
Quantification of glucose, fructose and sucrose in bayberry juice by NIR and PLS. Food Chemistry 114: 1135-1140.
Yang, Y. X., Wang, G. Y. and Pan, X. C. 2009. China food composition. 2nd ed. Beijing: Peking University Medical Press.
Yu, S. F., Ma, Y. and Sun, D. W. 2009. Impact of amylose content on starch retrogradation and texture of cooked milled rice during storage. Journal of Cereal Science 50: 139-144.
Zhang, P. Y. and Hamaker, B. R. 2012. Banana starch structure and digestibility. Carbohydrate Polymers 87: 1552-1558.


![Leaching of amylose from wheat and corn starch · Q-^^ AllEOfi31Sfl3E]](https://img.pdfslide.us/doc/110x75/5e83b0df0da5934e304d5a7c/leaching-of-amylose-from-wheat-and-corn-starch-q-alleofi31sfl3e.jpg)


