Embed Size (px)
Citation preview
DETERMINATION OF PROJECT BOUNDARY TO FACILITATE MEASURING AND MONITORING
OF CARBON STOCKS
Ari Wibowo
RM Wiwied Widodo Nugroho
ITTO PD 519/08/Rev.1 (F):
In Cooperation with Forestry Research and Development Agency
Ministry of Forestry, Indonesia Bogor, 2010
DETERMINATION OF PROJECT BOUNDARY TO FACILITATE MEASURING AND MONITORING OF CARBON STOCKS ISBN 978-602-95842-6-4 Technical Report No 3. Bogor, May 2010. By: Ari Wibowo, RM Wiwied Widodo, and Nugroho This report is a part of Program “Tropical Forest Conservation for Reducing Emissions from Deforestation and Forest Degradation and Enhancing Carbon Stocks in Meru Betiri National Park, Indonesia” Collaboration between:
• Pusat Penelitian Sosial Ekonomi dan Kebijakan Departemen Kehutanan (Center For Socio Economic and Policy on Forestry Research Ministry of Forestry) Jl. Gunung Batu No. 5 Bogor West Java Indonesia Phone : +62-251-8633944 Fax. : +62-251-8634924 Email : [email protected] Website : HUhttp://ceserf-itto.puslitsosekhut.web.idU
• LATIN – the Indonesian Tropical Institute Jl. Sutera No. 1 Situgede Bogor West Java Indonesia Phone : +62-251-8425522/8425523 Fax. : +62-251-8626593 Emai : [email protected] and [email protected] Website : HUwww.latin.or.idUH
• Meru Betiri National Park Department of Forestry Jalan Siriwijaya 53, Jember, East Java, Indonesia Phone : +62-331-335535 Fax. : +62-331-335535 Email : [email protected] Website : HUwww.merubetiri.comU
This work is copyright. Except for the logos, graphical and textual information in this publication may be reproduced in whole or in part provided that it is not sold or put to commercial use and its source is acknowledged.
iii
LIST OF CONTENT LIST OF CONTENT ................................................................................... iii
LIST OF TABLE .......................................................................................... iv
LIST OF FIGURE ....................................................................................... iv
LIST OF ANNEX ....................................................................................... v
SUMMARY ............................................................................................. vii
RINGKASAN ........................................................................................... ix I. INTRODUCTION ................................................................................ 1 II. OBJECTIVE, OUTPUTS AND ACTIVITIES ............................................ 3 III. BRIEF DESCRIPTION OF MERU BETIRI NATIONAL PARK (MBNP) ..... 4 IV. METHODS ....................................................................................... 7
4.1. REDD and its Methodological Challenge ................................ 7 4.2. Determination of Project Boundaries and Permanent Sample Plots ........................................................................................ 8 4.3. PSP Design and Measurement of C-Stock .............................. 9
V. RESULTS AND DISCUSSION ............................................................ 14
5.1. Project Boundary .................................................................... 14 5.2. Placement of PSP .................................................................... 16 5.3. Initial Data on PSP .................................................................. 18
VI. CONSLUSION AND RECOMMENDATION ......................................... 69 REFERENCES ............................................................................................ 71
ANNEXES ................................................................................................ 73
iv
LIST OF TABLE
Table 1. Number and area of PSP in every zone ................................ 8
Table 2. Some allometric equations for estimation of tree biomass (Source: Hairiyah dan Rahayu, 2007) ................................... 12
Table 3. Utility of optical sensors at multiple resolutions for deforestation monitoring ....................................................... 15
Table 4. Coordinates, zone, land use and vegetation of each PSP ...... 16
Table 5. Data of pole and tree on each PSP ........................................ 18
Table 6. Data of dominant tree, soil, undergrowth and litter of PSP . 67
LIST OF FIGURE Figure 1. PSP design for measurement of carbon pool ....................... 6
Figure 2. Project Boundary of MBNP and Permanent Sample Plots ..... 10
v
LIST OF ANNEX Annex 1. PHOTOS OF ACTIVITIES ................................................... 73
Photo 1. Ready for departure, Team of Project Boundary and PSP ... 73
Photo 2. Measurement of coordinates points using GPS ................... 73
Photo 3. Placement of PSP pole in the field ........................................ 74
Photo 4. Pole of PSP that has been planted ........................................ 74
Photo 5. Collection of non woody necromass .................................. 75 Annex 2. STRUCTURE OF TREE FOR EVERY PSPS ............................... 76
Figure 1. Vertical structure of trees in PSP 2 ...................................... 76
Figure 2. Vertical structure of trees in PSP 3 ....................................... 76
Figure 3. Vertical structure of trees in PSP 4 ....................................... 77
Figure 4. Vertical structure of trees in PSP 5 ....................................... 77
Figure 5. Vertical structure of trees in PSP 6 ....................................... 78
Figure 6. Vertical structure of trees in PSP 7 ....................................... 78
Figure 7. Vertical structure of trees in PSP 8 ....................................... 79
Figure 8. Vertical structure of trees in PSP 9 ....................................... 79
Figure 9. Vertical structure of trees in PSP 10 ..................................... 80
Figure 10. Vertical structure of trees in PSP 11 ..................................... 80
Figure 11. Vertical structure of trees in PSP 12 ..................................... 81
Figure 12. Vertical structure of trees in PSP 13 ..................................... 81
Figure 13. Vertical structure of trees in PSP 14 ..................................... 82
Figure 14. Vertical structure of trees in PSP 15 ..................................... 82
Figure 15. Vertical structure of trees in PSP 16 ..................................... 83
Figure 16. Vertical structure of trees in PSP 17 ..................................... 83
Figure 17. Vertical structure of trees in PSP 18 ..................................... 84
vi
Figure 18. Vertical structure of trees in PSP 19 ..................................... 84
Figure 19. Vertical structure of trees in PSP 20 ..................................... 85
Figure 20. Vertical structure of trees in PSP 21 ..................................... 85
Figure 21. Vertical structure of trees in PSP 22 ..................................... 86
Figure 22. Vertical structure of trees in PSP 23 ..................................... 86
Figure 23. Vertical structure of trees in PSP 24 ..................................... 87
Figure 24. Vertical structure of trees in PSP 25 ..................................... 87
Figure 25. Vertical structure of trees in PSP 26 ..................................... 88
Figure 26. Vertical structure of trees in PSP 27 ..................................... 88
Figure 27. Vertical structure of trees in PSP 28 ..................................... 89
Figure 28. Vertical structure of trees in PSP 29 ..................................... 89
Figure 29. Vertical structure of trees in PSP 30 ..................................... 90
Figure 30. Vertical structure of trees in PSP 31 ..................................... 90
Figure 31. Vertical structure of trees in PSP 32 ..................................... 91
Figure 32. Vertical structure of trees in PSP 33 ..................................... 91
Figure 33. Vertical structure of trees in PSP 34 ..................................... 92
Figure 34. Vertical structure of trees in PSP 35 ..................................... 92
Figure 35. Vertical structure of trees in PSP 36 ..................................... 93
Figure 36. Vertical structure of trees in PSP 37 ..................................... 93
Figure 37. Vertical structure of trees in PSP 38 ..................................... 94
Figure 38. Vertical structure of trees in PSP 39 ..................................... 94
Figure 39. Vertical structure of trees in PSP 40 ..................................... 95
vii
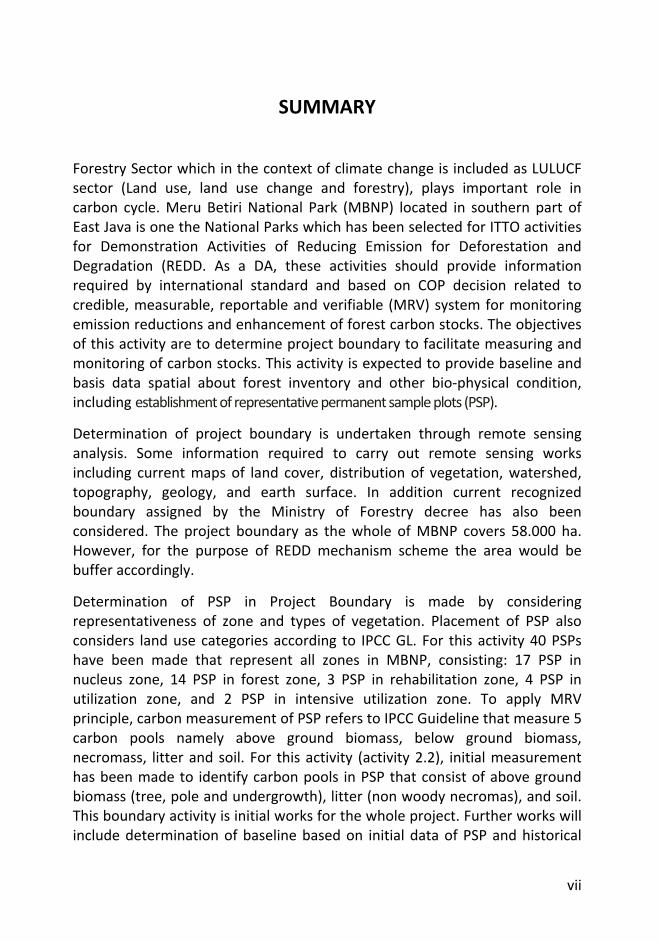
SUMMARY
Forestry Sector which in the context of climate change is included as LULUCF sector (Land use, land use change and forestry), plays important role in carbon cycle. Meru Betiri National Park (MBNP) located in southern part of East Java is one the National Parks which has been selected for ITTO activities for Demonstration Activities of Reducing Emission for Deforestation and Degradation (REDD. As a DA, these activities should provide information required by international standard and based on COP decision related to credible, measurable, reportable and verifiable (MRV) system for monitoring emission reductions and enhancement of forest carbon stocks. The objectives of this activity are to determine project boundary to facilitate measuring and monitoring of carbon stocks. This activity is expected to provide baseline and basis data spatial about forest inventory and other bio-physical condition, including establishment of representative permanent sample plots (PSP).
Determination of project boundary is undertaken through remote sensing analysis. Some information required to carry out remote sensing works including current maps of land cover, distribution of vegetation, watershed, topography, geology, and earth surface. In addition current recognized boundary assigned by the Ministry of Forestry decree has also been considered. The project boundary as the whole of MBNP covers 58.000 ha. However, for the purpose of REDD mechanism scheme the area would be buffer accordingly.
Determination of PSP in Project Boundary is made by considering representativeness of zone and types of vegetation. Placement of PSP also considers land use categories according to IPCC GL. For this activity 40 PSPs have been made that represent all zones in MBNP, consisting: 17 PSP in nucleus zone, 14 PSP in forest zone, 3 PSP in rehabilitation zone, 4 PSP in utilization zone, and 2 PSP in intensive utilization zone. To apply MRV principle, carbon measurement of PSP refers to IPCC Guideline that measure 5 carbon pools namely above ground biomass, below ground biomass, necromass, litter and soil. For this activity (activity 2.2), initial measurement has been made to identify carbon pools in PSP that consist of above ground biomass (tree, pole and undergrowth), litter (non woody necromas), and soil. This boundary activity is initial works for the whole project. Further works will include determination of baseline based on initial data of PSP and historical
viii
data using remote sensing images. The PSP measuring at 20 x 100 meter are laid down (Cf., Asmoro, 2009, Hairiah dan Rahayu, 2007, Hairiah et al, 2001a dan b) to estimate carbon stocks, this PSPSs would support data and information for the purpose of measuring, reporting and verifying forest inventory and carbon accounting in the ground. As basic principle to monitoring changes in REDD is by application of wall-to wall mapping using satellite images and ground truthing through establishment and measurement of PSPs. This is to ensure that the tier 3 and changes of carbon stock can be monitored accurately by applying principles of MRV.
ix
RINGKASAN
Taman Nasional Meru Betiri (TNMB) yang berlokasi di bagian selatan Jawa Timur telah ditetapkan sebagai lokasi kegiatan percontohan (demonstration activity, DA) untuk REDD+ dengan sumber dana dari ITTO. TNMB terdiri dari berbagai tipe vegetasi mulai dari vegetasi pegunungan sampai vegetasi pantai dan kaya akan keragaman jenis, dengan keberadaan masyarakat di dalam dan di sekitar TNMB yang memberikan pengaruh posisitf dan negatif terhadap keberadaan TNMB. TNMB layak untuk proyek REDD karena kawasan ini telah mengalami deforestasi yang tidak terencana dan degradasi.
Tujuan utama kegiatan ini adalah untuk mendapatkan proses pembelajaran dalam kontribusi penurunan emisi dari degradasi hutan, serta peningkatan stok karbon melalui partisipasi masyarakat dalam upaya konservasi dan pengelolaan TNMB. Kegiatan ini diharapkan dapat menghasilkan pengalaman dan informasi yang diperlukan oleh standar internasional dan didasarkan atas keputusan COP terkait sistem yang kredibel yaitu yang dapat diukur (measurable), dapat dilaporkan (reportable) dan dapat diverifikasi (verifiable) atau MRV untuk keperluan monitoring penurunan emisi. Untuk mencapai ini, dilakukan kegiatan penentuan batas untuk fasilitasi pengukuran dan monitoring stok karbon. Kegiatan penentuan batasan kegiatan ini merupakan kegiatan awal untuk pengukuran karbon yang memenuhi kaidah MRV, sehingga menghasilkan data yang credible berdasarkan pengukuran yang transparan dan terbuka untuk review. Pekerjaan selanjutnya meliputi penentuan baseline berdasarkan data PSP, serta data history yang akan menggunakan citra satelit.
Hasil dari kegiatan penentuan batas ini telah dilakukan dengan melakukan analisis GIS yang berdasarkan rencana pengelolaan, TNMB dibagi kedalam beberapa zona, yaitu zona inti, zona rimba, zona rehabilitasi, zona pemanfaatan khusus dan zona pemanfaatan intensif, peta penutupan lahan, peta vegetasi (hutan mangrove, hutan pantai, hutan rawa, hutan hujan tropik dan hutan bambu), daerah aliran sungai, topografi, geologi dan permukaan bumi. Penentuan batas ini mempertimbangkan juga Surat Keputusan Menteri Kehutanan sebagai kawasan Taman Nasional yaitu seluas 58.000 ha yang telah diteyapkan oleh Menteri. Pekerjaan GIS juga telah dilaksanakan untuk penentuan petak contoh permanen (Permanent Sample Plots atau PSP) untuk fasilitasi pengukuran karbon. Informasi yang digunakan untuk pekerjaan GIS.
x
Untuk keperluan inventarisasi karbon, petak ukur permanen (PSP) berukuran 100 x 20 meter telah dibuat, dengan pertimbangan ukuran petak ini telah banyak digunakan dalam pengukuran karbon untuk tipe hutan di Indonesia (misalnya Asmoro, 2009, Hairiah dan Rahayu, 2007, Hairiah et al, 2001a dan b). Sebanyak 40 PSP yang mewakili setiap zona sesuai dengan pembagian tipe penutupan lahan menurut IPCC Guideline (2006) dan penggunaan lahan di TNMB telah dibuat. Dari 40 PSPS, 17 PSP terdapat di zona inti, 14 PSP di zona rimba, 3 PSP di zona rehabilitasi, 4 PSP di zona pemanfaatan dan 2 PSP di zona pemanfaatan khusus.
Pada setiap PSP dilakukan pengukuran karbon untuk menyusun baseline dan Reference Emission Level (REL). Menurut IPCC GL (2006) lima carbon pool yang harus diukur adalah biomasa di atas tanah (AGB/Above Ground Biomass), biomas di bawah tanah (BGB/Below Ground Biomass), necromas berkayu, serasah dan tanah. Pengukuran AGB dilakukan dengan mengukur diameter dan tinggi pohon dan menggunakan persamaan alometrik untuk menghitung kandungan karbon, sehingga tidak dilakukan destruktif sampling. Pengukuran BGB juga menggunakan persamaan alometrik, sedangkan carbon pool lainnya diukur di lapangan.
PSP dibuat dengan mempertimbangkan keterwakilan zona, tipe vegetasi dan kategori lahan menurut IPCC GL. PSP yang telah dibuat dilapangan dipetakan dengan memuat informasi tipe zona, kordinat, penggunaan lahan dan tipe vegetasinya. Pekerjaan awal dilapangan juga telah dilakukan untuk mendukung baseline yaitu analisa vegetasi yang mencatat jenis, mengukur diameter serta tinggi. Selain itu juga telah diukur potensi tumbuhan bawah dan serasah. Contoh tanah juga telah dianalisa untuk mengetahui kandungan karbon.
Hasil kegiatan ini menunjukkan bahwa penentuan batas proyek dan penempatan PSP untuk memonitor stok karbon adalah langkah penting untuk mendukung kegiatan DA REDD. Prinsip dasar untuk memonitor perubahan akibat REDD program pada skala proyek adalah melalui analisa remote sensing menggunakan citra satelit dan pengukuran lapangan melalui pembuatan dan pengukuran di PSP. Hal ini guna memastikan bahwa kegiatan REDD menggunakan Tier 3 dengan tingkat kerincian yang paling tinggi dan memenuhi kriteria MRV.
1
I. INTRODUCTION
Indonesia is one of the largest tropical forest countries. The forest has
contributed to the provision of abundant direct and indirect benefits to local
and global community. Based on its functions the forest in Indonesia is divided
into production forests, conservation and protection forest, and forests that
can be converted to other uses. The total area of conservation forest is
approximately 23 million ha, which consist of National parks, Nature reserve
and recreation forest.
Forestry Sector which in the context of climate change is included as LULUCF
sector (Land use, land use change and forestry), plays important role in
carbon cycle. In global level, contribution of LULUCF sector to total emission
was 18% (Stern, 2007), meanwhile in national level, it cotributed to about 50%
of total GHG emission (SNC, 2009). However, forests also have capability to
absorb carbon through their growth, therefore forest can also contribute to
global community through its role in reducing GHGs emissions.
International scheme is being developed to include REDD (Reducing Emission
from Deforestation and Degradation) as carbon related mechanism to deal
with global warming. The idea is enhancing forest carbon stocks through
conservation of the existing forests. Undisturbed conservation forests, store
significant carbon, and therefore avoiding emission to the atmosphere,
meanwhile, illegal logging and forest encroachment increase carbon emission
to the atmosphere.
Meru Betiri National Park (MBNP) located in southern part of East Java is one
the National Parks which has been selected as the project site for ITTO
activities. The total area of the Park is ± 58000 ha consisting of various
vegetation types from mountainous to coastal areas. MBNP is rich of
biological diversity and community living surrounding the forest which give
both positive and negative effects to the sustainability of the forest.
Determination of Project Boundary to Facilitate Measuring and Monitoring of Carbon Stocks
2
MBNP is eligible for REDD project because the area has been experiencing
unplanned deforestation and degradation. MBNP has been selected as the
site for demonstration activities (DA) of REDD through ITTO project.
Development objective of this project is to contribute to reducing emissions
from deforestation and forest degradation, and enhancing forest carbon
stocks through enhanced community participation in conservation and
management of the MBNP.
MBNP as ITTO project for DA REDD should provide information required by
international standard and based on COP decision related to credible,
measurable, reportable and verifiable (MRV) system for monitoring emission
reductions from deforestation and forest degradation and enhancement of
forest carbon stocks.
3
II. OBJECTIVE, OUTPUTS AND ACTIVITIES
Objective 2 is to develop a credible, measurable, reportable and verifiable
system for monitoring emission reductions from deforestation and forest
degradation and enhancement of forest carbon stocks in the Meru Betiri
National Park (MBNP). This objective will be achieved through several outputs
namely: (1) Output 2.1. Improvement in measurable, reportable and verifiable
form of capacity in resource base inventory and carbon accounting (2) Output
2.2. Report on comprehensive baseline data and estimation of emissions
reduction and carbon enhancement of the national park and (3) Output 2.3.
Establishment and validation of system for monitoring emission reduction and
enhancement of carbon stocks.
For Output 2.2. Report on comprehensive baseline data and estimation of
emissions reduction and carbon stock enhancement of the national park, will
be achieved through the following activities: (1) Activity 2.2.1. Conduct
remote sensing analysis (Year 2, Q2 and 3), (2) Activity 2.2.2. Determine
project boundary to facilitate measuring and monitoring of carbon stocks.
(Year 1, Q1 and 2), (3) Activity 2.2.3. Establish the project baseline to analyze a
land-use and land cover change and the associated carbon stock change. (Year
1, Q3 and 4) and (4) Activity 2.2.4 Estimate emissions reduction and
enhancement of carbon stocks in the MBNP (Year 3 and 4).
4
III. BRIEF DESCRIPTION OF MERU BETIRI NATIONAL PARK (MBNP)
Conservation forests are ecosystems with high carbon stocks and rich in
biodiversity. Sustainable conservation of these forests is essential to mitigate
climate change and to conserve key biodiversity resources and other
environmental goods and services provided by these forests. Meru Betiri
National Park (MBNP) has been selected for DA REDD as a representative area
with many of the challenges usually faced in reducing emission and
enhancement of carbon stocks in one side and poverty reduction of
community living surrounding the forest on the other side.
MBNP is located in southern part of East Java province and surrounded by two
districts of Jember and Banyuwangi with relatively high accessibility.
Topographical condition is from hilly areas to lowland areas, coastal and
mangrove facing to the Indian Ocean. The Park area consists of tropical
rainforest ecosystem with high diversity of floristic potentials (more than 500
identified plant species), such as medicinal plants, ornamental plants, bamboo
and various small to relatively large animals.
In term of the function, the area is divided into five zones, namely core zone,
intact forest zone, utilization zone, rehabilitation and buffer zones. Each zone
is managed specifically based on its specific function. Core zone with total
area of 27.900 ha is strictly protected area and allowed only for research and
education. Intact forest zone with total area of 22.622 ha is allowed for
research and education, limited utilization for ecotourism. Utilization zone
with total of 1.285 ha is for research and education, intensive but wise and
sustainable utilization for highland and coastal ecotourism. Rehabilitation
zone with total area of 4.023 ha is a zone where forest and land rehabilitation
(agro-forestry cultivation) involving local community is taking place to
strengthen and protect inner zone.
Determination of Project Boundary to Facilitate Measuring and Monitoring of Carbon Stocks
5
Rehabilitation activities are carried out in this area to restore forest cover
from illegal conversion and illegal cultivation since early 1990s. Rehabilitation
is carried out based on mutual benefit between the MBNP–Community by
planting economically potential species in Agro-forestry plantation model for
community benefits and protection-conservation for the MBNP. In this
rehabilitation zone, six Agro-forestry models have been introduced by LATIN
in cooperation with Bogor Agricultural University. Buffer zone with the total
area of 2.155 ha and functions as place for the interaction between
community activities and conservation. Several eco-tourism and agro-tourism
activities and medicinal plant cultivation have been introduced in this area.
Meru Betiri National Park represents mangrove forest, swamp forest, and
lowland rain forest ecosystems.This Park is a natural habitat of the rafflesia
flower (Rafflesia zollingeriana), and various other plants such as mangrove
(Rhizophora sp.), api-api (Avicennia sp.), waru (Hibiscus tiliaceus), nyamplung
(Calophyllum inophyllum), rengas (Gluta renghas), Bungur (Lagerstroemia
speciosa), pulai (Alstonia scholaris), bendo (Artocarpus elasticus), and several
medicinal plants.
This Park is also home to several protected animals, including 29 species of
mammal and 180 species of bird. Meru Betiri National Park is known as the
last habitat of the Javan tiger (Panthera tigris sondaica) which is now a highly
endangered and protected species. However, no traces of this tiger have been
found for many years and it is feared to be extinct. Meru Betiri does have
other distinct characteristics. Sukamade Beach is a habitat of the leatherback
turtle, the hawksbill turtle, the common green turtle, and the Pacific ridley
turtle. Several simple breeding facilities have been constructed at this beach
to ensure that the turtles, too, do not become extinct.
Degradation due to illegal harvest of the Park biological resources is taking
place throughout the landscape which is functionally divided into five zones.
The three outer zones, which are utilization, rehabilitation and buffer zones
received more pressure from, not only illegal harvest of biological diversity
Determination of Project Boundary to Facilitate Measuring and Monitoring of Carbon Stocks
6
but also deforestation and encroachment. These illegal activities have caused
significant reduction of ecosystem function of the Park, especially on
environment. Unfortunately, serial data and information on the overall
landscape changes are still lacking and not regularly up-dated. Rehabilitation
through Agro-forestry system has been introduced and initiated by local NGO
and Bogor Agricultural University involving local community.
This project will absolutely contribute to the environment, especially the
ecosystem function provided by MBNP. By improving the park condition in the
all zones, the environmental good and services naturally provided by MBNP,
will function as before. The improving community livelihood will minimize or
reduce the rate of deforestation and forest degradation, since poverty has
been the key source of threat to conservation. On the other hand, it will
maintain the natural process for carbon offset through various rate of
vegetation formation and growth. The successful rehabilitation in
rehabilitation zone (as well in buffer zone) will contribute to enhance carbon
stocks in the area.
7
IV. METHODS
4.1. About REDD and it’s Methodological Challenge
Contribution of LULUCF in global emission is about 18 % of total GHGs
emission (Stern, 2007). About 75 % of it is from developing countries. Among
developing countries, Brazil, Indonesia, PNG, are the biggest contributors of
emission mainly from deforestation. Emission from deforestation in
developing countries tends to increase due to development requirement and
population growth. Policy intervention (policy approaches and positive
incentives) is required for developing countries to reduce its rate of
deforestation while maintaining its requirement for sustainable development.
REDD is basically the activities to reduce emission through avoidance of forest
conversion and other activities that cause deforestation and degradation. It is
not the activities of planting for carbon sequestration such as A/R CDM,
although current discussion on REDD Plus includes management practices and
enhancement of carbon stock. Strategy for REDD implementation should in
line with national priority and policies and ensure that REDD mechanism will
provide benefits to Indonesia. Indonesian’s requirement regarding REDD and
other international meachanisms: They should support Indonesia towards
sustainable development and development priorities (such as: economy,
social, pro-growth, pro-job, pro-poor)
REDD is a performance-based activity, therefore methodological aspect is
crucial. One of the challenging methodological aspects of REDD including
determination of reference emissions level/baseline, calculation of carbon
and monitoring as the basic for calculation of emission reduction and
incentives. Emission reduction should be real, measurable, and has positive
impacts to the environment, and the method should credible, measurable,
reportable and verifiable. REDD DA activities including the ITTO MBNP project
are expected to provide information for improvement of methodology before
REDD is fully implemented in the near future (after 2012). MBNP is selected as
Determination of Project Boundary to Facilitate Measuring and Monitoring of Carbon Stocks
8
DA REDD and the area is eligible because the occurrence of deforestation and
unplanned deforestation
4.2. Determination of Project Boundaries and Permanent Sample Plots
Project boundary for DA REDD is determined as the whole area of MBNP,
which has been assigned according to Ministry of Forestry decree. Total
project area as the whole MBNP covers 58.000 ha. GIS works have been
carried out to produce project boundary and distribution of PSPs. Some
information required to carry out GIS works include current maps of land
cover, distribution of vegetation, watershed, topography, geology and earth
surface.
The area according to management plan of national park is divided into
several zones namely nucleus, forest, intensive utilization, buffer (special
utilization) and rehabilitation. Meanwhile basic forest types in MBNP consist
of mangrove, coastal, swamp, tropical rainforest and bamboo forest.
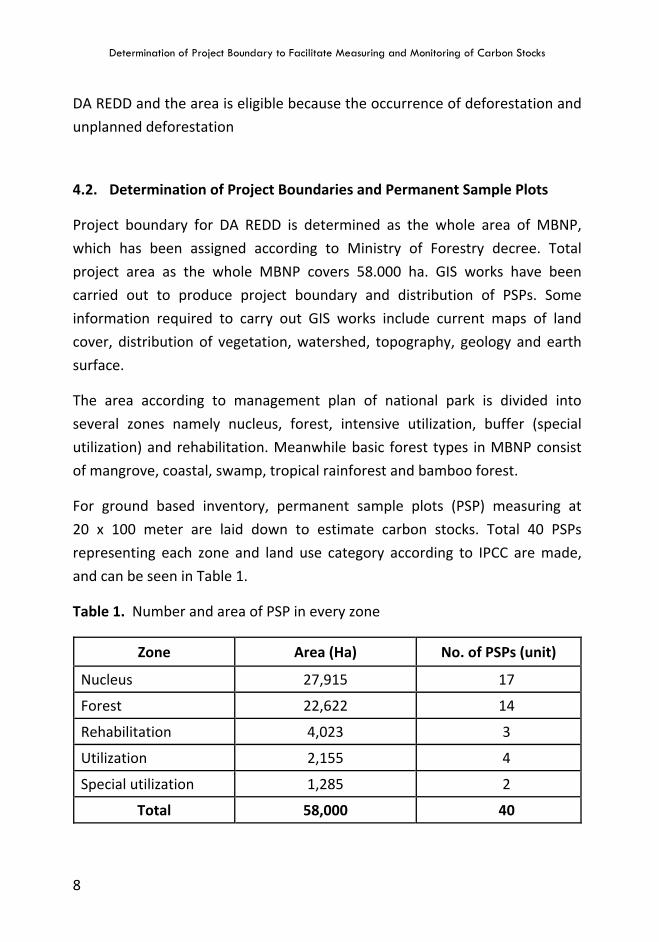
For ground based inventory, permanent sample plots (PSP) measuring at
20 x 100 meter are laid down to estimate carbon stocks. Total 40 PSPs
representing each zone and land use category according to IPCC are made,
and can be seen in Table 1.
Table 1. Number and area of PSP in every zone
Zone Area (Ha) No. of PSPs (unit)
Nucleus 27,915 17
Forest 22,622 14
Rehabilitation 4,023 3
Utilization 2,155 4
Special utilization 1,285 2
Total 58,000 40

Determination of Project Boundary to Facilitate Measuring and Monitoring of Carbon Stocks
9
4.3. PSP Design and Measurement of C-Stock
Various design of sample plots have been applied for measurement of carbon
stock in forestry project, including 40 x 30 m (JICA-Forde project), 100 x 100
(National Forest Inventory), 200 x 200 (PSP for monitoring of increment in
mineral soil, Badan Litbang, 1993), 30 x 30 m (Dahlan et al, 2005), and
20 x 100 m (Asmoro, 2009, Hairiah and Rahayu, 2007, Hairiah et al, 2001a and
b). In this project permanent sample plots of 20 x 100 m are applied. The PSPs
are used to estimate 5 carbon pools according to IPCC Guideline, namely
above ground biomass (AGB), below ground biomass (BGB), dead wood, litter
and soil.
Pal Permanent Supporting pal Sub sub plot of 0.5 X 0.5 meter for measuring DOM and necromass Sub plot of 10 m X 50 m for measuring trees with Ø 5 to 19,9 cm Plot of 20 m X 100 m for measuring trees with Ø ≥ 20 cm
Figure 1. PSP design for measurement of carbon pools
Determination of Project Boundary to Facilitate Measuring and Monitoring of Carbon Stocks
10
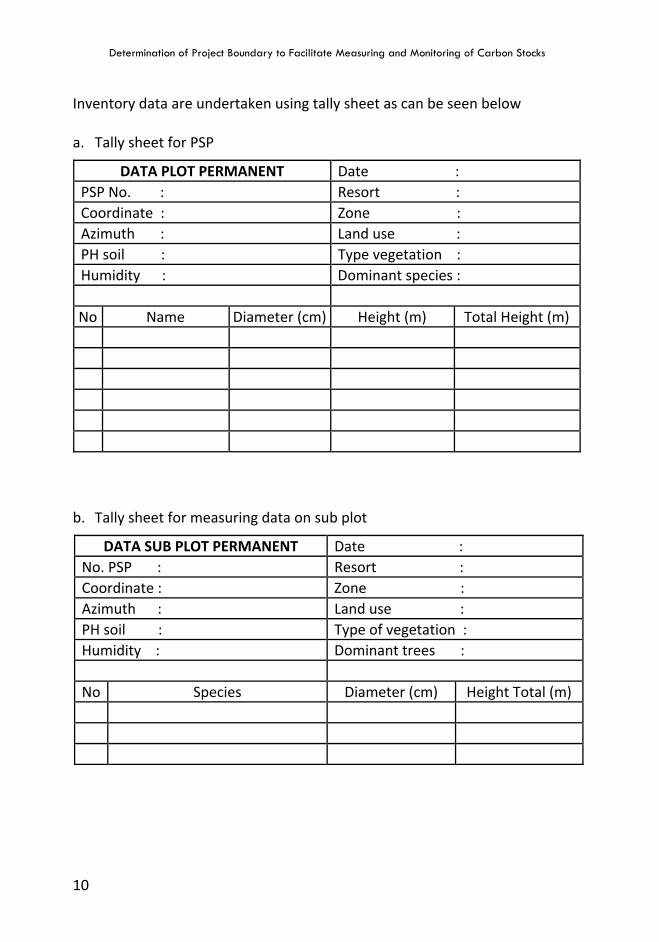
Inventory data are undertaken using tally sheet as can be seen below a. Tally sheet for PSP
DATA PLOT PERMANENT Date : PSP No. : Resort : Coordinate : Zone : Azimuth : Land use : PH soil : Type vegetation : Humidity : Dominant species : No Name Diameter (cm) Height (m) Total Height (m)
b. Tally sheet for measuring data on sub plot
DATA SUB PLOT PERMANENT Date : No. PSP : Resort : Coordinate : Zone : Azimuth : Land use : PH soil : Type of vegetation : Humidity : Dominant trees : No Species Diameter (cm) Height Total (m)
Determination of Project Boundary to Facilitate Measuring and Monitoring of Carbon Stocks
11
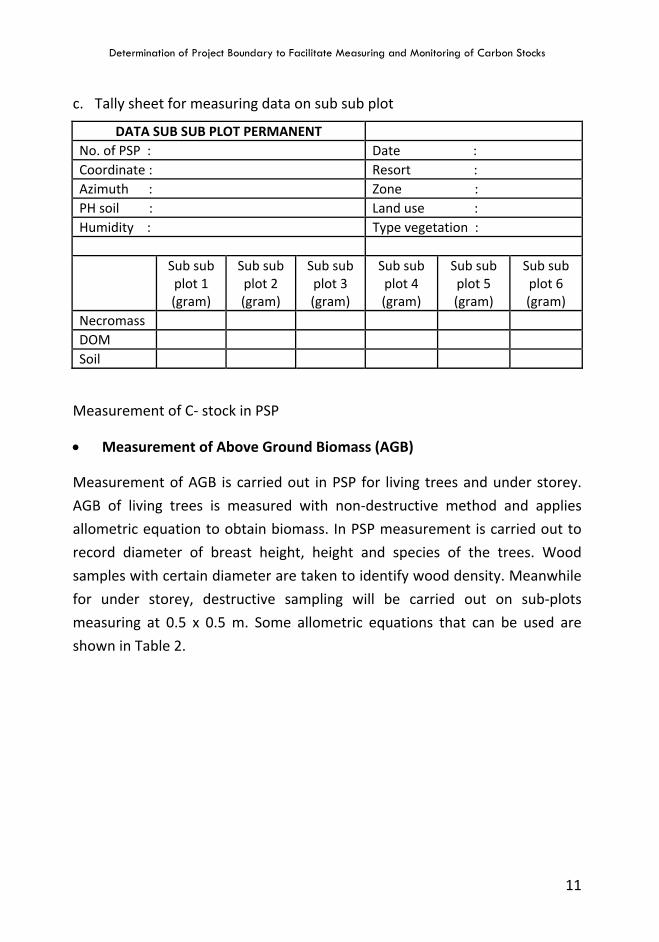
c. Tally sheet for measuring data on sub sub plot
DATA SUB SUB PLOT PERMANENT No. of PSP : Date : Coordinate : Resort : Azimuth : Zone : PH soil : Land use : Humidity : Type vegetation : Sub sub
plot 1 (gram)
Sub sub plot 2 (gram)
Sub sub plot 3 (gram)
Sub sub plot 4 (gram)
Sub sub plot 5 (gram)
Sub sub plot 6 (gram)
Necromass DOM Soil
Measurement of C- stock in PSP
• Measurement of Above Ground Biomass (AGB)
Measurement of AGB is carried out in PSP for living trees and under storey.
AGB of living trees is measured with non-destructive method and applies
allometric equation to obtain biomass. In PSP measurement is carried out to
record diameter of breast height, height and species of the trees. Wood
samples with certain diameter are taken to identify wood density. Meanwhile
for under storey, destructive sampling will be carried out on sub-plots
measuring at 0.5 x 0.5 m. Some allometric equations that can be used are
shown in Table 2.
Determination of Project Boundary to Facilitate Measuring and Monitoring of Carbon Stocks
12
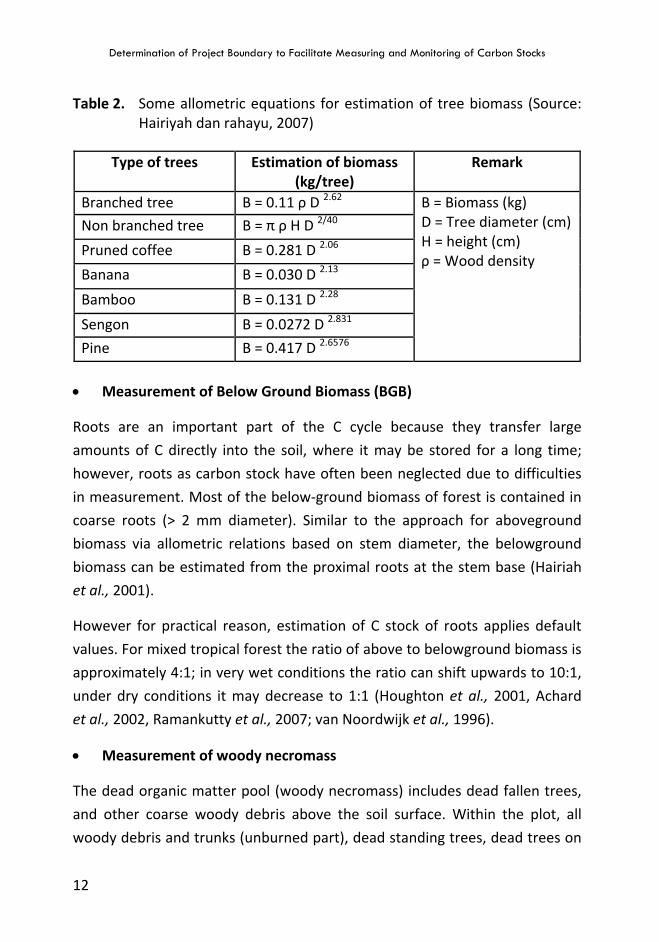
Table 2. Some allometric equations for estimation of tree biomass (Source: Hairiyah dan rahayu, 2007)
Type of trees Estimation of biomass
(kg/tree) Remark
Branched tree B = 0.11 ρ D 2.62 B = Biomass (kg) D = Tree diameter (cm) H = height (cm) ρ = Wood density
Non branched tree B = π ρ H D 2/40
Pruned coffee B = 0.281 D 2.06
Banana B = 0.030 D 2.13
Bamboo B = 0.131 D 2.28
Sengon B = 0.0272 D 2.831
Pine B = 0.417 D 2.6576
• Measurement of Below Ground Biomass (BGB)
Roots are an important part of the C cycle because they transfer large
amounts of C directly into the soil, where it may be stored for a long time;
however, roots as carbon stock have often been neglected due to difficulties
in measurement. Most of the below-ground biomass of forest is contained in
coarse roots (> 2 mm diameter). Similar to the approach for aboveground
biomass via allometric relations based on stem diameter, the belowground
biomass can be estimated from the proximal roots at the stem base (Hairiah
et al., 2001).
However for practical reason, estimation of C stock of roots applies default
values. For mixed tropical forest the ratio of above to belowground biomass is
approximately 4:1; in very wet conditions the ratio can shift upwards to 10:1,
under dry conditions it may decrease to 1:1 (Houghton et al., 2001, Achard
et al., 2002, Ramankutty et al., 2007; van Noordwijk et al., 1996).
• Measurement of woody necromass
The dead organic matter pool (woody necromass) includes dead fallen trees,
and other coarse woody debris above the soil surface. Within the plot, all
woody debris and trunks (unburned part), dead standing trees, dead trees on
Determination of Project Boundary to Facilitate Measuring and Monitoring of Carbon Stocks
13
the ground and stumps are sampled. Their height (length) and diameter are
recorded, as well as notes identifying the type of wood for estimating specific
density.
• Measurement of litter (non woody necromass)
Litter consists of leaves and small branches above the ground as non woody
necromass. Litter samples are collected from the same quadrants of 0.50 m x
0.50 m (0.25 m2) as used for under storey sample. Basically it is separated
from coarse litter and fine litter. Coarse litter is any tree necromass < 5 cm
diameter and/or < 50 cm length, undecomposed plant materials or crop
residues, all unburned leaves and branches. Fine litter is at organic layer
(0-5 cm above mineral soil layer) in the same quadrates, including all woody
roots.
To minimize contamination with mineral soil, the coarse litter samples should
be soaked and washed in water; the floating litter is collected, sun dried and
weighed, the rest is sieved on a 2 mm mesh sieve and added to the fine litter
fraction. A subsample can be taken to obtain dry weight.
• Soil Samples
Soil samples are taken from three layers (depth), 0-10 cm, 10-20 cm dan
20-30 cm at six points on each plot. Soil samples are analyzed in the
laboratory as composite samples to identify chemical properties such as pH
and C content. Undisturbed soil samples are also taken for physical analysis,
especially the 'bulk density', and (specific gravity) of the soil which is essential
to convert the soil dry weights into soil volume.
14
V. RESULTS AND DISCUSSION
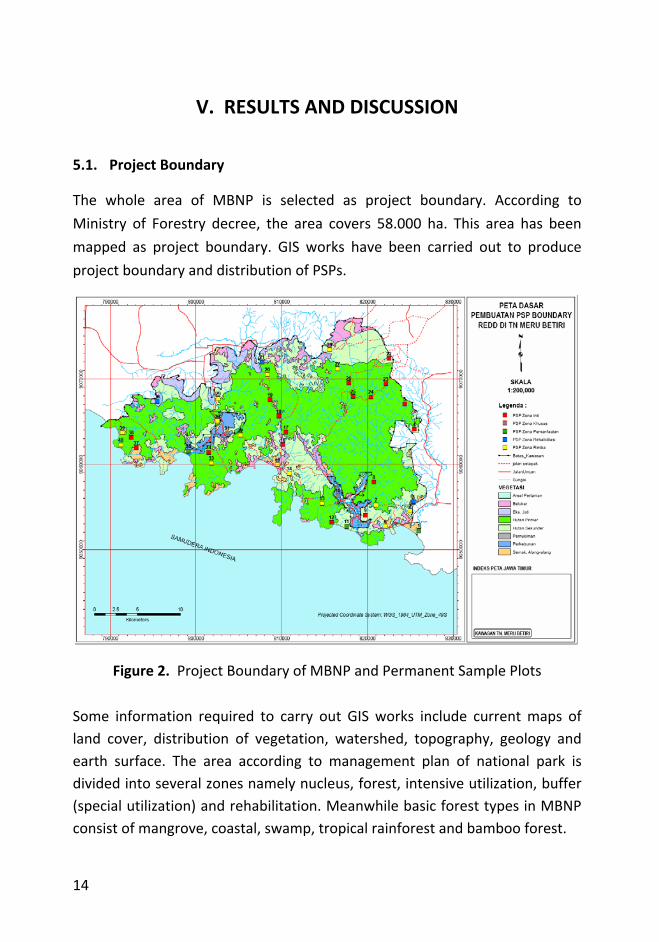
5.1. Project Boundary
The whole area of MBNP is selected as project boundary. According to
Ministry of Forestry decree, the area covers 58.000 ha. This area has been
mapped as project boundary. GIS works have been carried out to produce
project boundary and distribution of PSPs.
Figure 2. Project Boundary of MBNP and Permanent Sample Plots
Some information required to carry out GIS works include current maps of land cover, distribution of vegetation, watershed, topography, geology and earth surface. The area according to management plan of national park is divided into several zones namely nucleus, forest, intensive utilization, buffer (special utilization) and rehabilitation. Meanwhile basic forest types in MBNP consist of mangrove, coastal, swamp, tropical rainforest and bamboo forest.
Determination of Project Boundary to Facilitate Measuring and Monitoring of Carbon Stocks
15
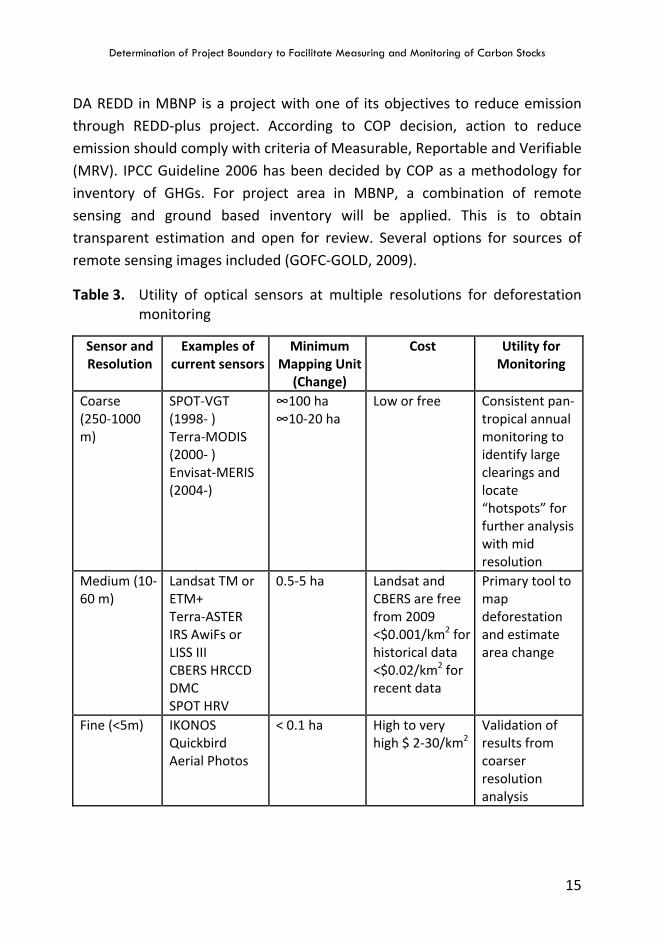
DA REDD in MBNP is a project with one of its objectives to reduce emission through REDD-plus project. According to COP decision, action to reduce emission should comply with criteria of Measurable, Reportable and Verifiable (MRV). IPCC Guideline 2006 has been decided by COP as a methodology for inventory of GHGs. For project area in MBNP, a combination of remote sensing and ground based inventory will be applied. This is to obtain transparent estimation and open for review. Several options for sources of remote sensing images included (GOFC-GOLD, 2009).
Table 3. Utility of optical sensors at multiple resolutions for deforestation monitoring
Sensor and Resolution
Examples of current sensors
Minimum Mapping Unit
(Change)
Cost Utility for Monitoring
Coarse (250-1000 m)
SPOT-VGT (1998- ) Terra-MODIS (2000- ) Envisat-MERIS (2004-)
∞100 ha ∞10-20 ha
Low or free Consistent pan-tropical annual monitoring to identify large clearings and locate “hotspots” for further analysis with mid resolution
Medium (10-60 m)
Landsat TM or ETM+ Terra-ASTER IRS AwiFs or LISS III CBERS HRCCD DMC SPOT HRV
0.5-5 ha Landsat and CBERS are free from 2009 <$0.001/km2 for historical data <$0.02/km2 for recent data
Primary tool to map deforestation and estimate area change
Fine (<5m) IKONOS Quickbird Aerial Photos
< 0.1 ha High to very high $ 2-30/km2
Validation of results from coarser resolution analysis
Determination of Project Boundary to Facilitate Measuring and Monitoring of Carbon Stocks
16
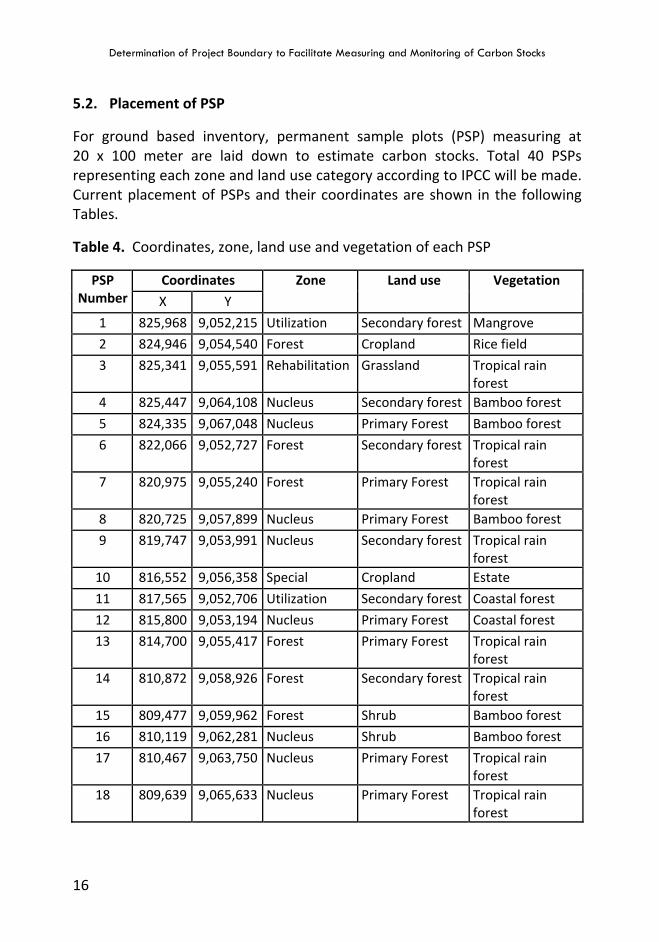
5.2. Placement of PSP
For ground based inventory, permanent sample plots (PSP) measuring at 20 x 100 meter are laid down to estimate carbon stocks. Total 40 PSPs representing each zone and land use category according to IPCC will be made. Current placement of PSPs and their coordinates are shown in the following Tables.
Table 4. Coordinates, zone, land use and vegetation of each PSP
PSP Number
Coordinates Zone Land use Vegetation
X Y
1 825,968 9,052,215 Utilization Secondary forest Mangrove
2 824,946 9,054,540 Forest Cropland Rice field
3 825,341 9,055,591 Rehabilitation Grassland Tropical rain forest
4 825,447 9,064,108 Nucleus Secondary forest Bamboo forest
5 824,335 9,067,048 Nucleus Primary Forest Bamboo forest
6 822,066 9,052,727 Forest Secondary forest Tropical rain forest
7 820,975 9,055,240 Forest Primary Forest Tropical rain forest
8 820,725 9,057,899 Nucleus Primary Forest Bamboo forest
9 819,747 9,053,991 Nucleus Secondary forest Tropical rain forest
10 816,552 9,056,358 Special Cropland Estate
11 817,565 9,052,706 Utilization Secondary forest Coastal forest
12 815,800 9,053,194 Nucleus Primary Forest Coastal forest
13 814,700 9,055,417 Forest Primary Forest Tropical rain forest
14 810,872 9,058,926 Forest Secondary forest Tropical rain forest
15 809,477 9,059,962 Forest Shrub Bamboo forest
16 810,119 9,062,281 Nucleus Shrub Bamboo forest
17 810,467 9,063,750 Nucleus Primary Forest Tropical rain forest
18 809,639 9,065,633 Nucleus Primary Forest Tropical rain forest
Determination of Project Boundary to Facilitate Measuring and Monitoring of Carbon Stocks
17
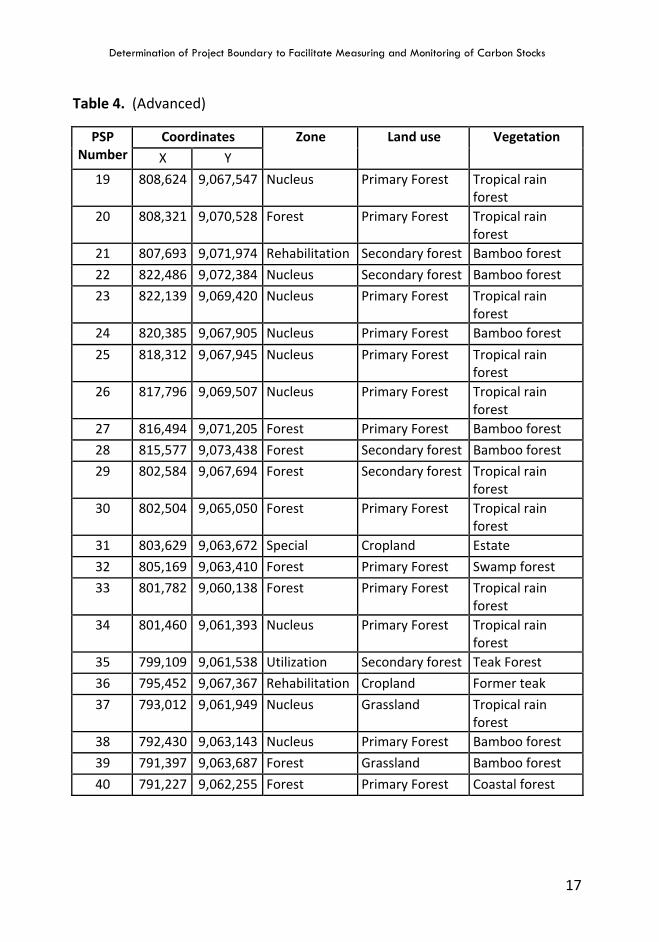
Table 4. (Advanced)
PSP Number
Coordinates Zone Land use Vegetation
X Y
19 808,624 9,067,547 Nucleus Primary Forest Tropical rain forest
20 808,321 9,070,528 Forest Primary Forest Tropical rain forest
21 807,693 9,071,974 Rehabilitation Secondary forest Bamboo forest
22 822,486 9,072,384 Nucleus Secondary forest Bamboo forest
23 822,139 9,069,420 Nucleus Primary Forest Tropical rain forest
24 820,385 9,067,905 Nucleus Primary Forest Bamboo forest
25 818,312 9,067,945 Nucleus Primary Forest Tropical rain forest
26 817,796 9,069,507 Nucleus Primary Forest Tropical rain forest
27 816,494 9,071,205 Forest Primary Forest Bamboo forest
28 815,577 9,073,438 Forest Secondary forest Bamboo forest
29 802,584 9,067,694 Forest Secondary forest Tropical rain forest
30 802,504 9,065,050 Forest Primary Forest Tropical rain forest
31 803,629 9,063,672 Special Cropland Estate
32 805,169 9,063,410 Forest Primary Forest Swamp forest
33 801,782 9,060,138 Forest Primary Forest Tropical rain forest
34 801,460 9,061,393 Nucleus Primary Forest Tropical rain forest
35 799,109 9,061,538 Utilization Secondary forest Teak Forest
36 795,452 9,067,367 Rehabilitation Cropland Former teak
37 793,012 9,061,949 Nucleus Grassland Tropical rain forest
38 792,430 9,063,143 Nucleus Primary Forest Bamboo forest
39 791,397 9,063,687 Forest Grassland Bamboo forest
40 791,227 9,062,255 Forest Primary Forest Coastal forest
Determination of Project Boundary to Facilitate Measuring and Monitoring of Carbon Stocks
18
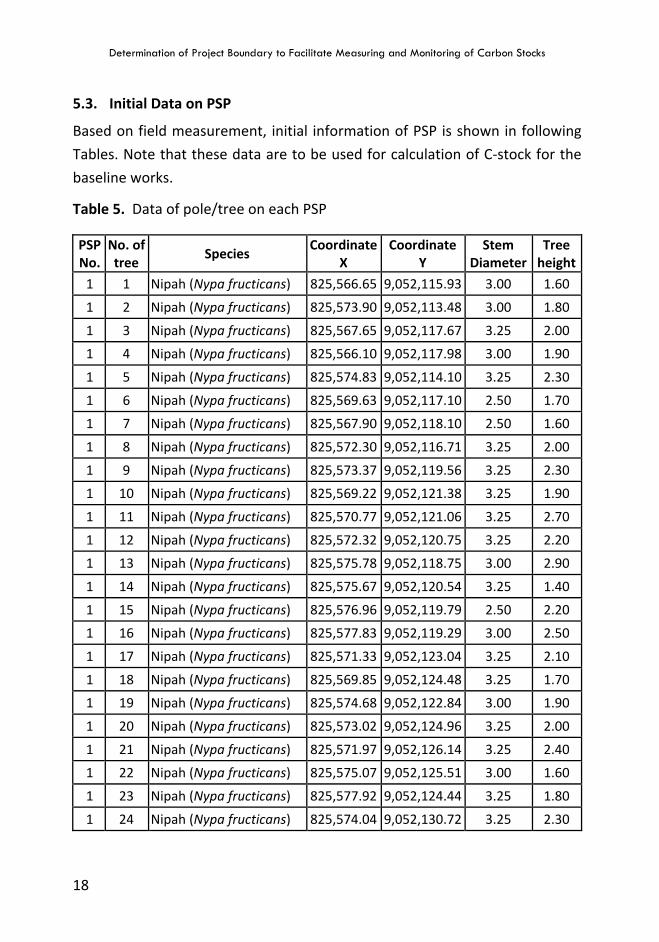
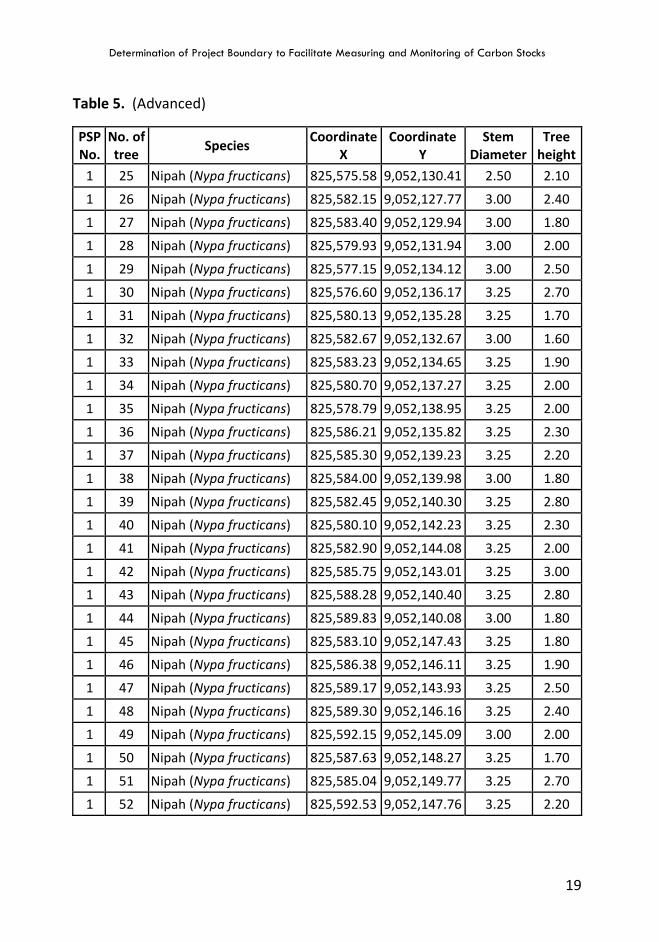
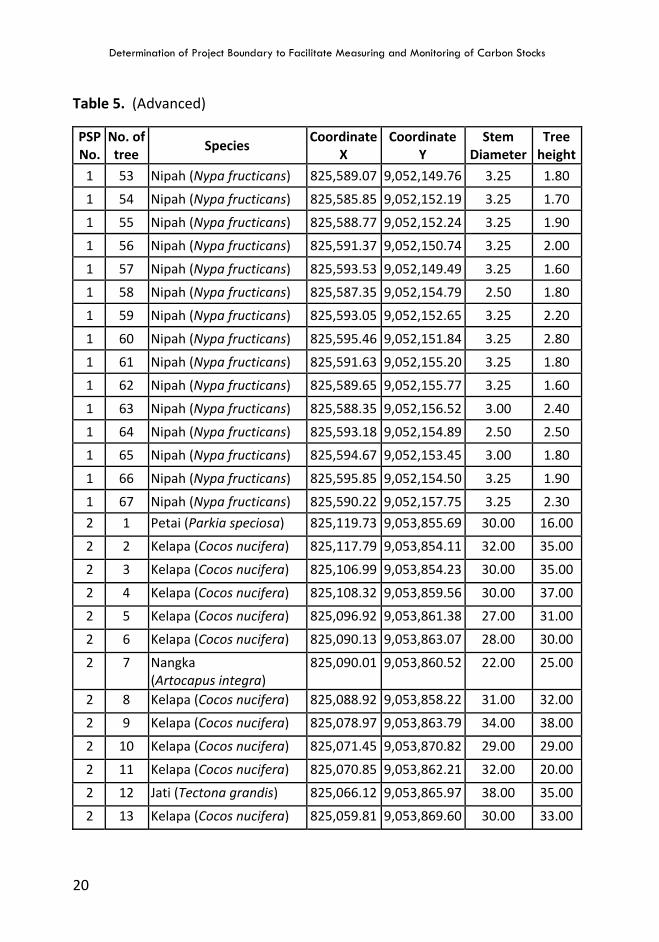
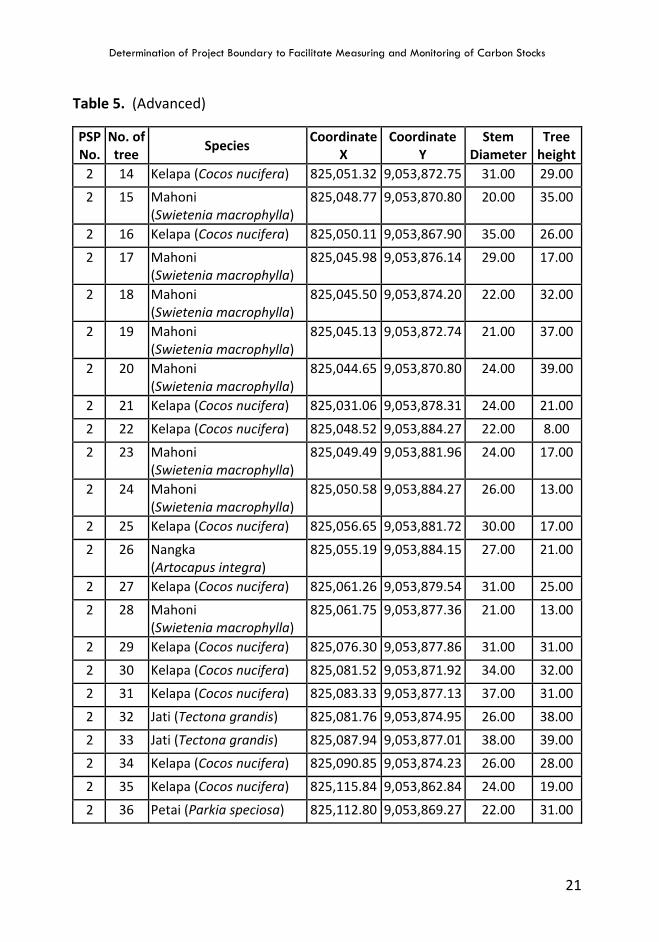
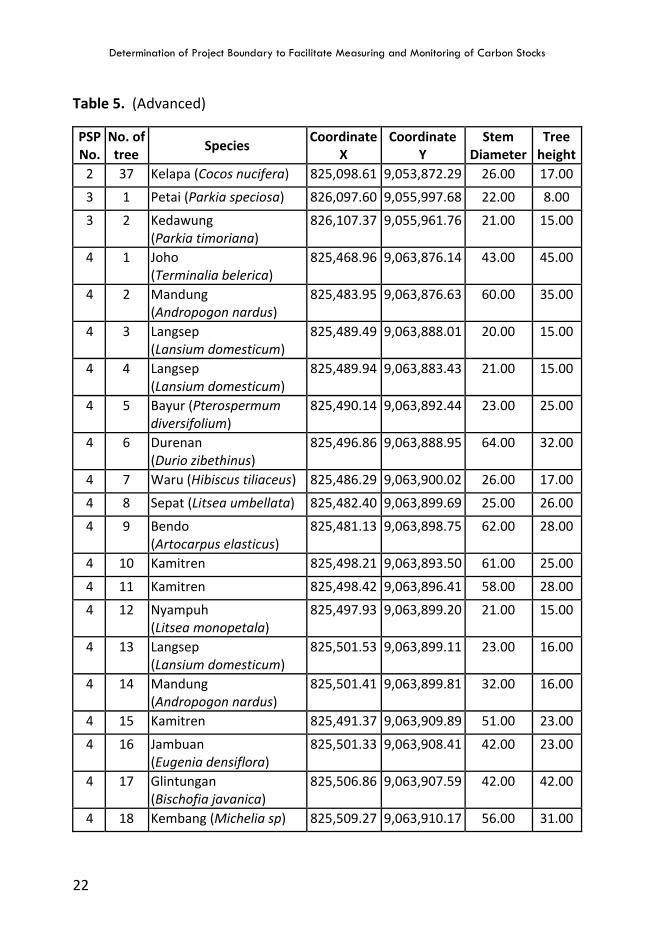
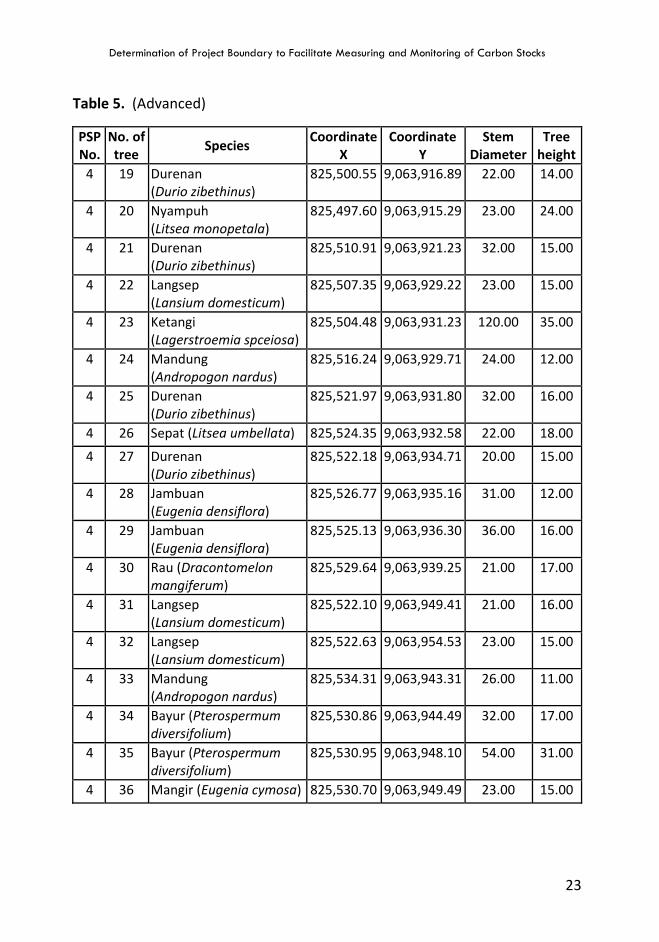
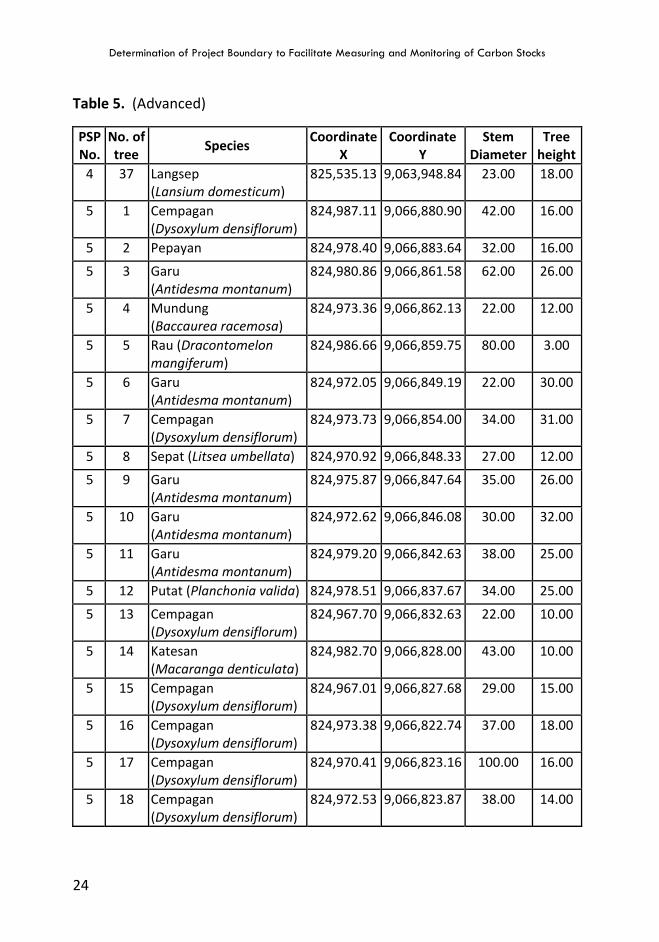
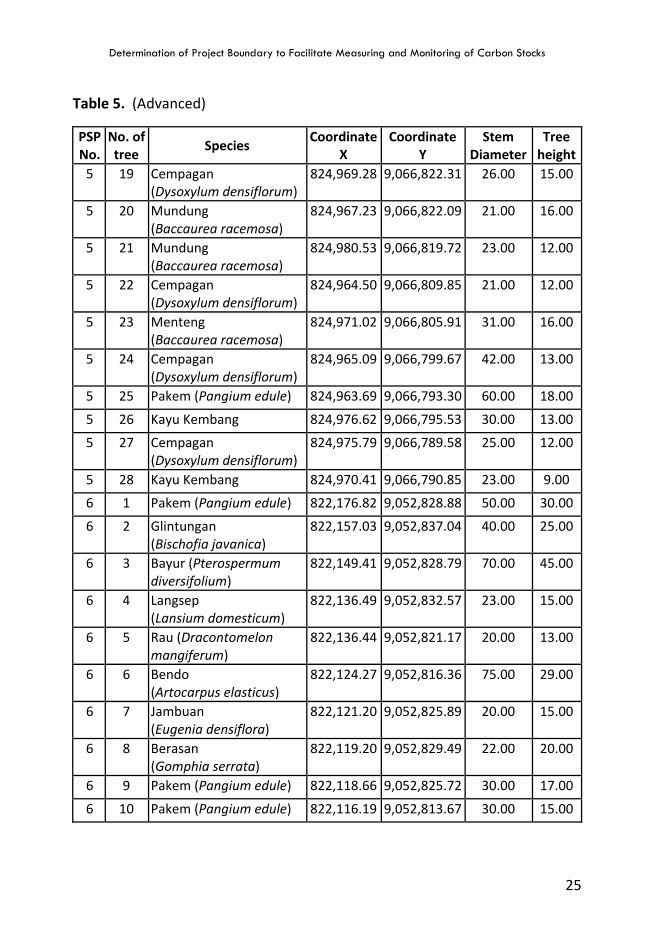
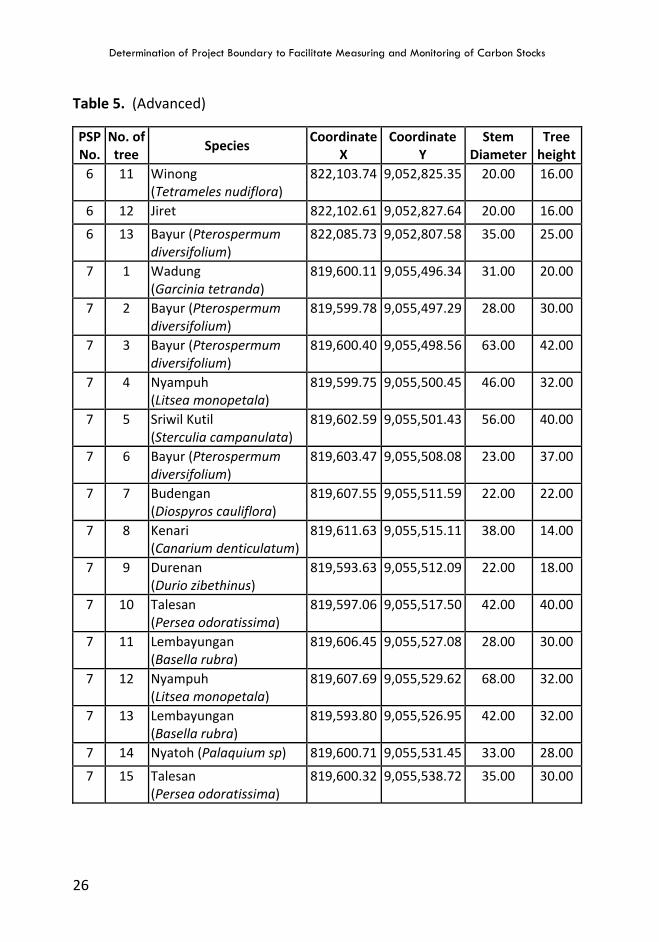
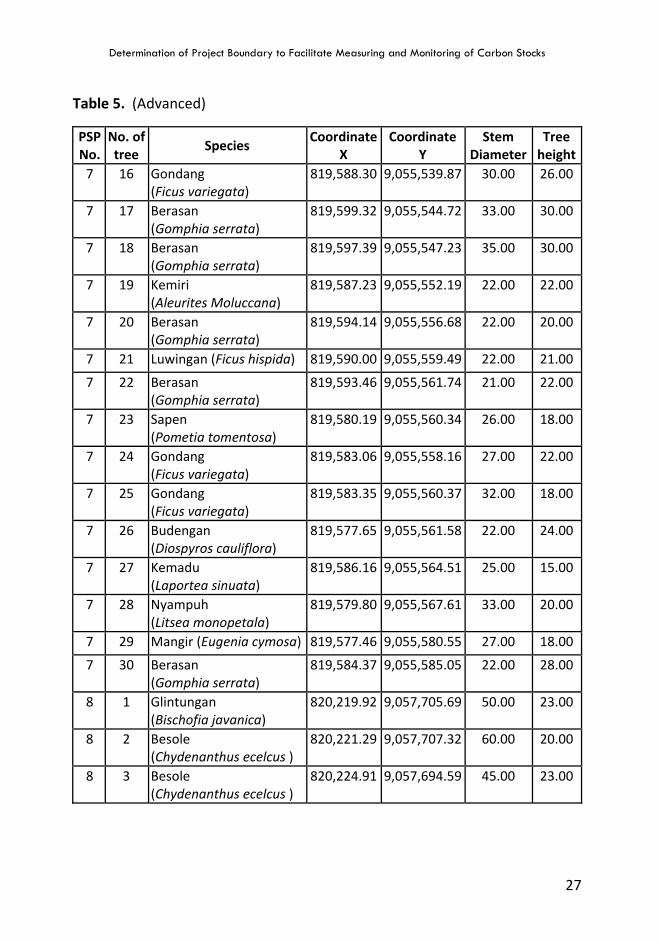
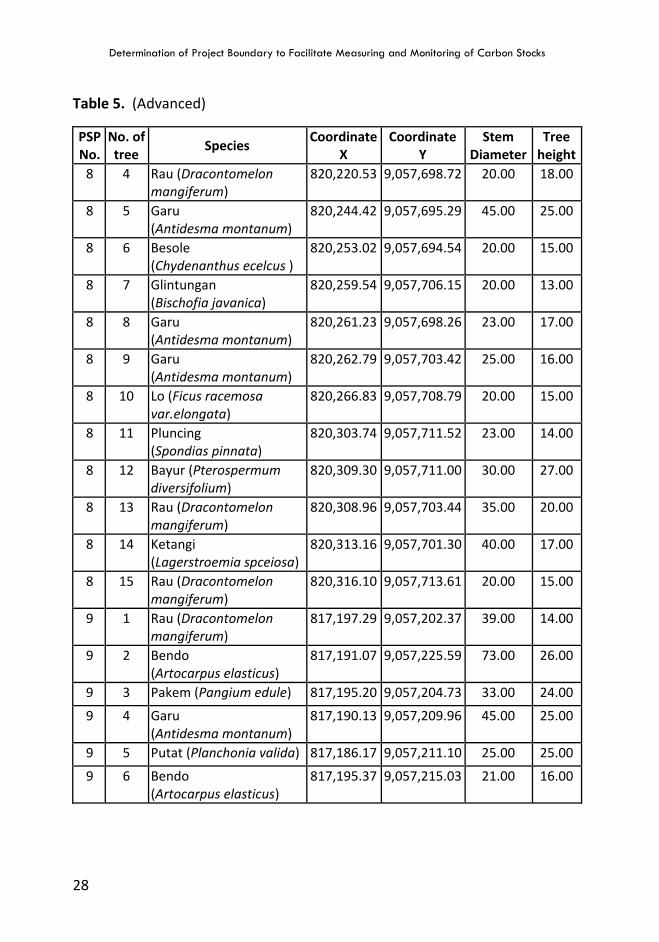
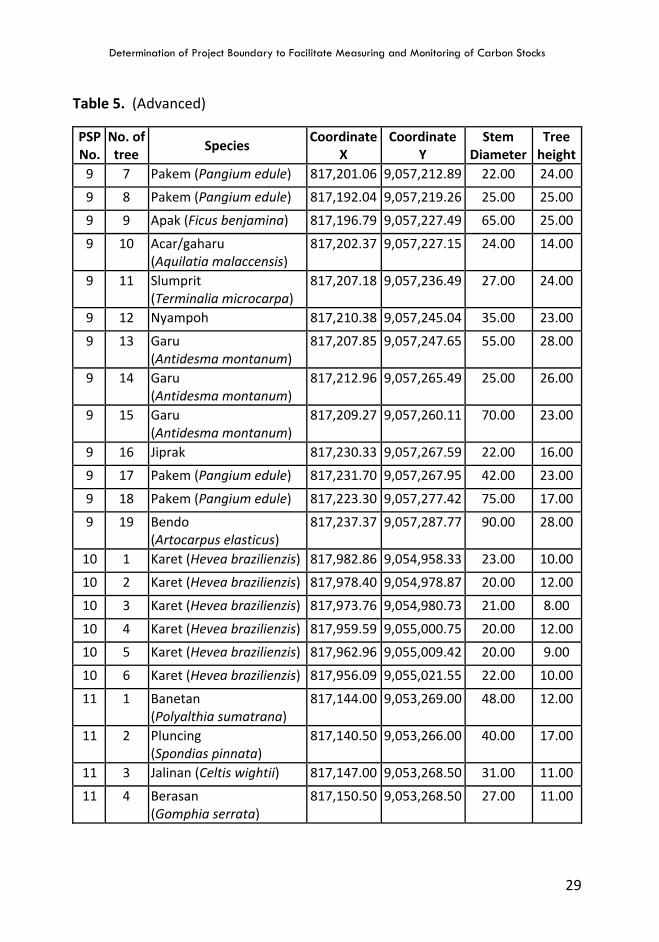
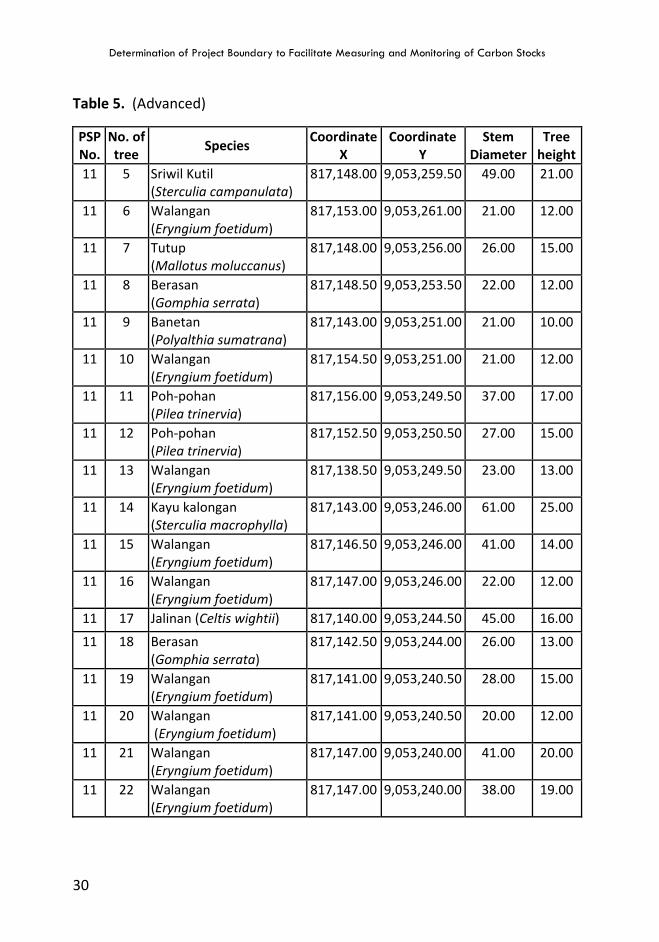
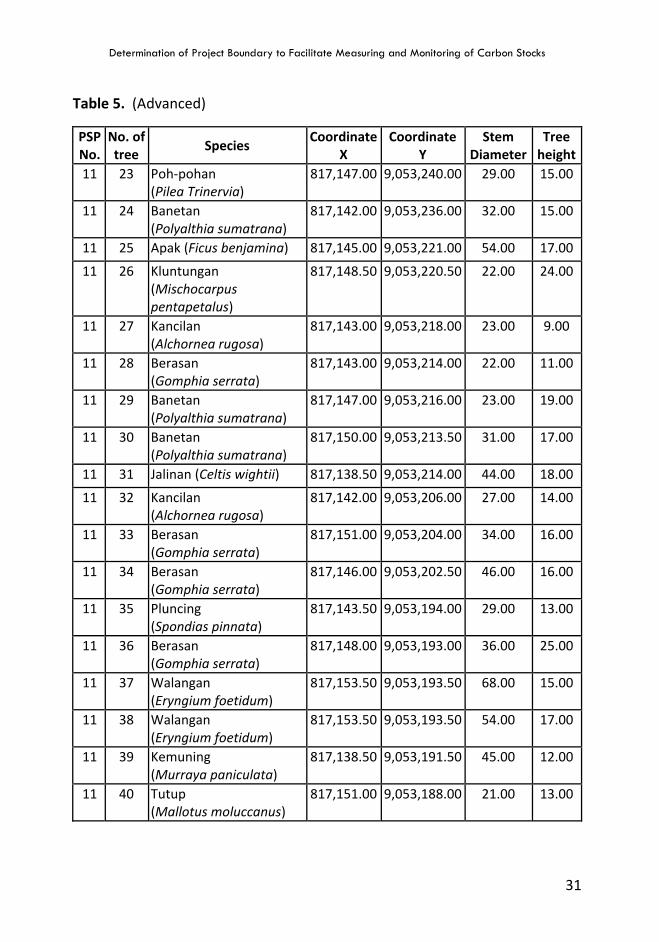
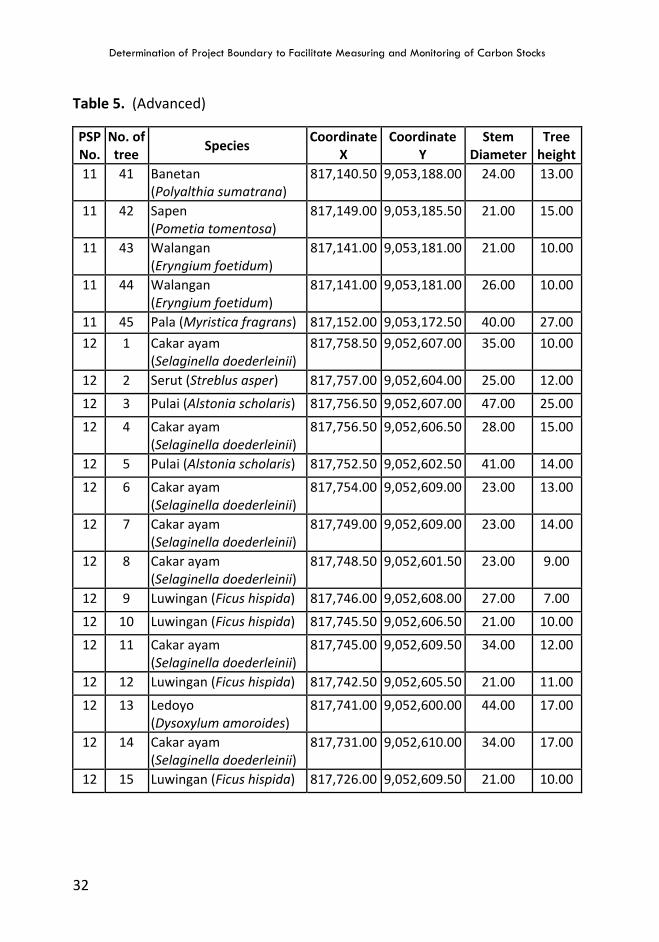
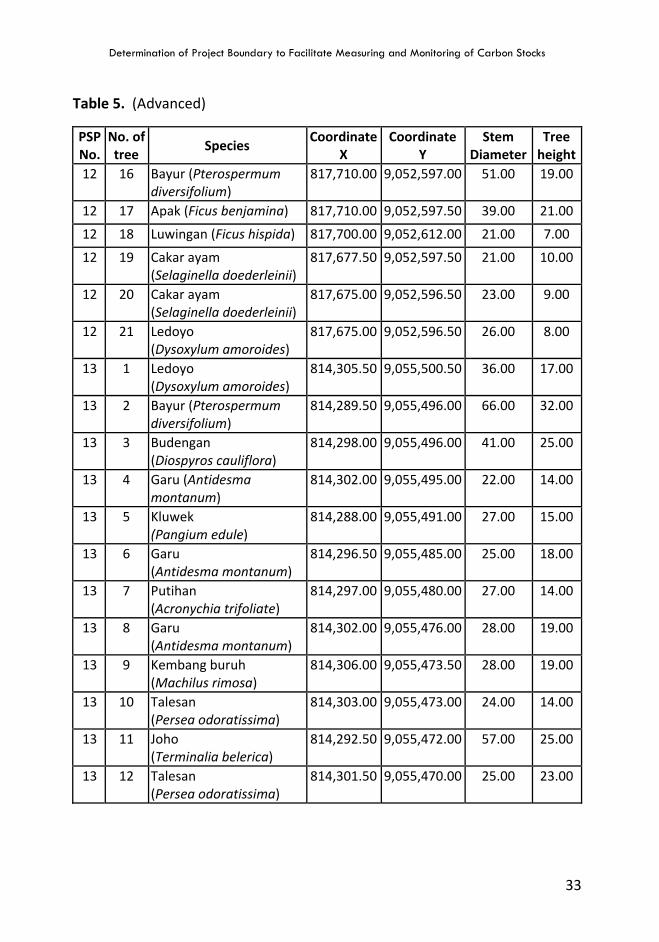
5.3. Initial Data on PSP
Based on field measurement, initial information of PSP is shown in following
Tables. Note that these data are to be used for calculation of C-stock for the
baseline works.
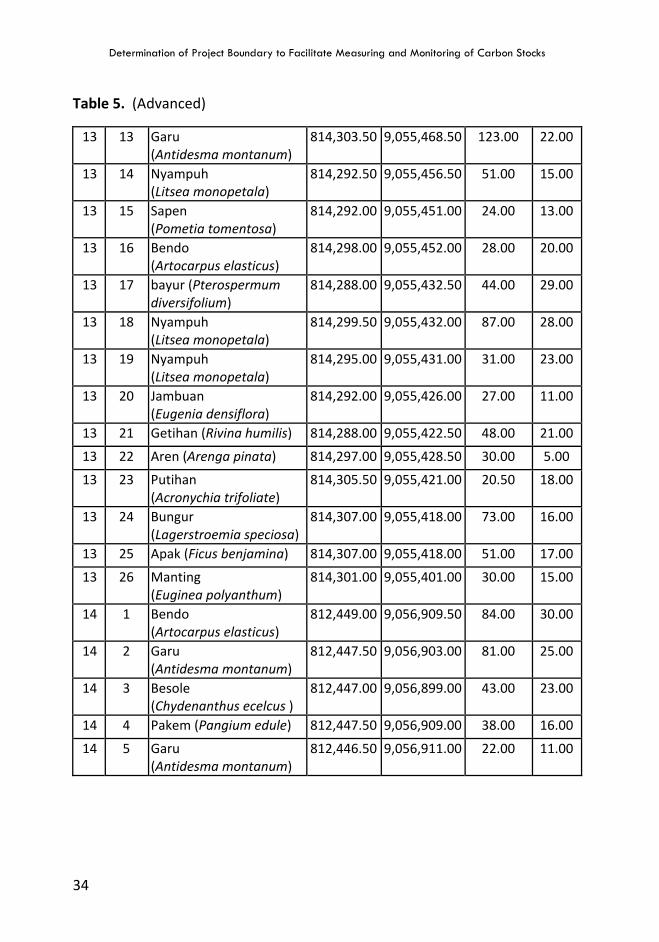
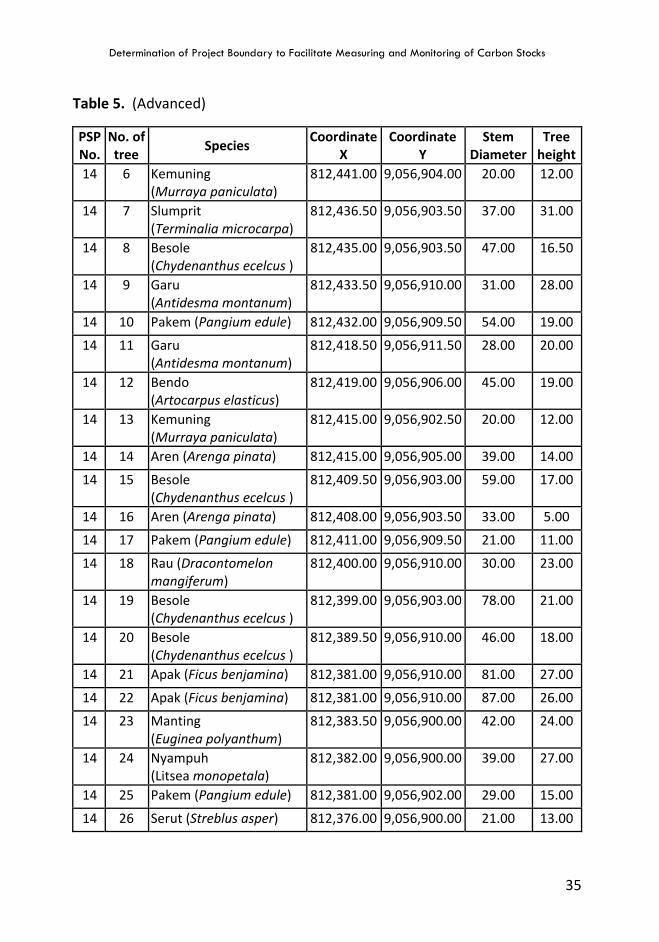
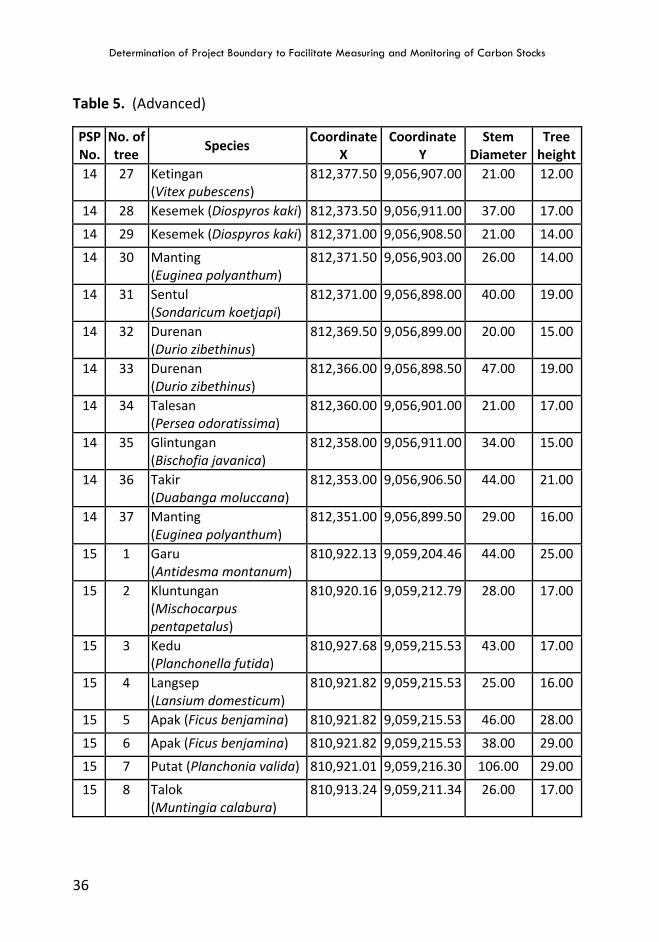
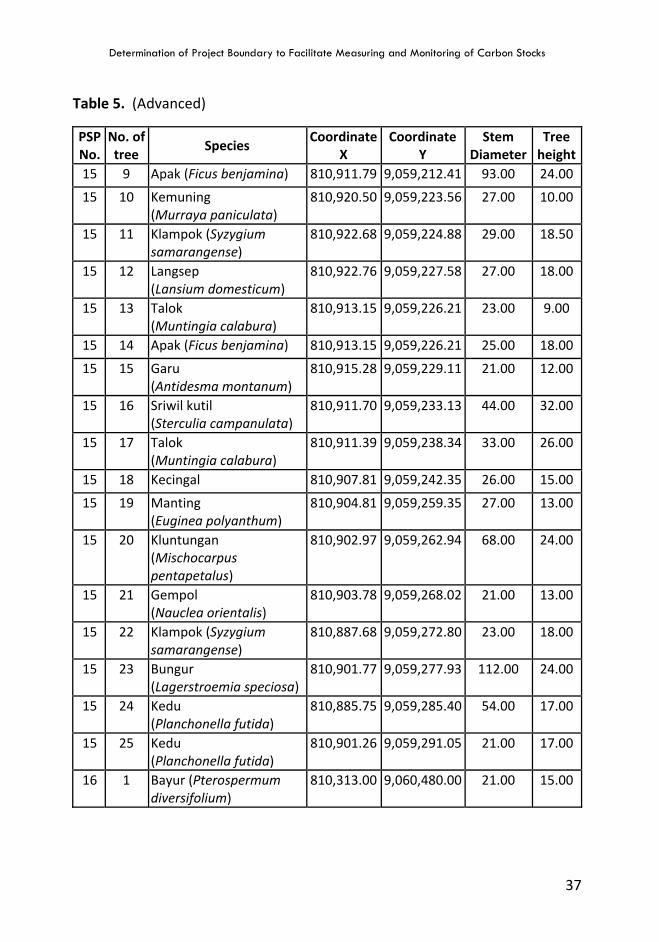
Table 5. Data of pole/tree on each PSP
PSP No.
No. of tree
Species Coordinate
X Coordinate
Y Stem
Diameter Tree
height
1 1 Nipah (Nypa fructicans) 825,566.65 9,052,115.93 3.00 1.60
1 2 Nipah (Nypa fructicans) 825,573.90 9,052,113.48 3.00 1.80
1 3 Nipah (Nypa fructicans) 825,567.65 9,052,117.67 3.25 2.00
1 4 Nipah (Nypa fructicans) 825,566.10 9,052,117.98 3.00 1.90
1 5 Nipah (Nypa fructicans) 825,574.83 9,052,114.10 3.25 2.30
1 6 Nipah (Nypa fructicans) 825,569.63 9,052,117.10 2.50 1.70
1 7 Nipah (Nypa fructicans) 825,567.90 9,052,118.10 2.50 1.60
1 8 Nipah (Nypa fructicans) 825,572.30 9,052,116.71 3.25 2.00
1 9 Nipah (Nypa fructicans) 825,573.37 9,052,119.56 3.25 2.30
1 10 Nipah (Nypa fructicans) 825,569.22 9,052,121.38 3.25 1.90
1 11 Nipah (Nypa fructicans) 825,570.77 9,052,121.06 3.25 2.70
1 12 Nipah (Nypa fructicans) 825,572.32 9,052,120.75 3.25 2.20
1 13 Nipah (Nypa fructicans) 825,575.78 9,052,118.75 3.00 2.90
1 14 Nipah (Nypa fructicans) 825,575.67 9,052,120.54 3.25 1.40
1 15 Nipah (Nypa fructicans) 825,576.96 9,052,119.79 2.50 2.20
1 16 Nipah (Nypa fructicans) 825,577.83 9,052,119.29 3.00 2.50
1 17 Nipah (Nypa fructicans) 825,571.33 9,052,123.04 3.25 2.10
1 18 Nipah (Nypa fructicans) 825,569.85 9,052,124.48 3.25 1.70
1 19 Nipah (Nypa fructicans) 825,574.68 9,052,122.84 3.00 1.90
1 20 Nipah (Nypa fructicans) 825,573.02 9,052,124.96 3.25 2.00
1 21 Nipah (Nypa fructicans) 825,571.97 9,052,126.14 3.25 2.40
1 22 Nipah (Nypa fructicans) 825,575.07 9,052,125.51 3.00 1.60
1 23 Nipah (Nypa fructicans) 825,577.92 9,052,124.44 3.25 1.80
1 24 Nipah (Nypa fructicans) 825,574.04 9,052,130.72 3.25 2.30
Determination of Project Boundary to Facilitate Measuring and Monitoring of Carbon Stocks
19
Table 5. (Advanced)
PSP No.
No. of tree
Species Coordinate
X Coordinate
Y Stem
Diameter Tree
height
1 25 Nipah (Nypa fructicans) 825,575.58 9,052,130.41 2.50 2.10
1 26 Nipah (Nypa fructicans) 825,582.15 9,052,127.77 3.00 2.40
1 27 Nipah (Nypa fructicans) 825,583.40 9,052,129.94 3.00 1.80
1 28 Nipah (Nypa fructicans) 825,579.93 9,052,131.94 3.00 2.00
1 29 Nipah (Nypa fructicans) 825,577.15 9,052,134.12 3.00 2.50
1 30 Nipah (Nypa fructicans) 825,576.60 9,052,136.17 3.25 2.70
1 31 Nipah (Nypa fructicans) 825,580.13 9,052,135.28 3.25 1.70
1 32 Nipah (Nypa fructicans) 825,582.67 9,052,132.67 3.00 1.60
1 33 Nipah (Nypa fructicans) 825,583.23 9,052,134.65 3.25 1.90
1 34 Nipah (Nypa fructicans) 825,580.70 9,052,137.27 3.25 2.00
1 35 Nipah (Nypa fructicans) 825,578.79 9,052,138.95 3.25 2.00
1 36 Nipah (Nypa fructicans) 825,586.21 9,052,135.82 3.25 2.30
1 37 Nipah (Nypa fructicans) 825,585.30 9,052,139.23 3.25 2.20
1 38 Nipah (Nypa fructicans) 825,584.00 9,052,139.98 3.00 1.80
1 39 Nipah (Nypa fructicans) 825,582.45 9,052,140.30 3.25 2.80
1 40 Nipah (Nypa fructicans) 825,580.10 9,052,142.23 3.25 2.30
1 41 Nipah (Nypa fructicans) 825,582.90 9,052,144.08 3.25 2.00
1 42 Nipah (Nypa fructicans) 825,585.75 9,052,143.01 3.25 3.00
1 43 Nipah (Nypa fructicans) 825,588.28 9,052,140.40 3.25 2.80
1 44 Nipah (Nypa fructicans) 825,589.83 9,052,140.08 3.00 1.80
1 45 Nipah (Nypa fructicans) 825,583.10 9,052,147.43 3.25 1.80
1 46 Nipah (Nypa fructicans) 825,586.38 9,052,146.11 3.25 1.90
1 47 Nipah (Nypa fructicans) 825,589.17 9,052,143.93 3.25 2.50
1 48 Nipah (Nypa fructicans) 825,589.30 9,052,146.16 3.25 2.40
1 49 Nipah (Nypa fructicans) 825,592.15 9,052,145.09 3.00 2.00
1 50 Nipah (Nypa fructicans) 825,587.63 9,052,148.27 3.25 1.70
1 51 Nipah (Nypa fructicans) 825,585.04 9,052,149.77 3.25 2.70
1 52 Nipah (Nypa fructicans) 825,592.53 9,052,147.76 3.25 2.20
Determination of Project Boundary to Facilitate Measuring and Monitoring of Carbon Stocks
20
Table 5. (Advanced)
PSP No.
No. of tree
Species Coordinate
X Coordinate
Y Stem
Diameter Tree
height
1 53 Nipah (Nypa fructicans) 825,589.07 9,052,149.76 3.25 1.80
1 54 Nipah (Nypa fructicans) 825,585.85 9,052,152.19 3.25 1.70
1 55 Nipah (Nypa fructicans) 825,588.77 9,052,152.24 3.25 1.90
1 56 Nipah (Nypa fructicans) 825,591.37 9,052,150.74 3.25 2.00
1 57 Nipah (Nypa fructicans) 825,593.53 9,052,149.49 3.25 1.60
1 58 Nipah (Nypa fructicans) 825,587.35 9,052,154.79 2.50 1.80
1 59 Nipah (Nypa fructicans) 825,593.05 9,052,152.65 3.25 2.20
1 60 Nipah (Nypa fructicans) 825,595.46 9,052,151.84 3.25 2.80
1 61 Nipah (Nypa fructicans) 825,591.63 9,052,155.20 3.25 1.80
1 62 Nipah (Nypa fructicans) 825,589.65 9,052,155.77 3.25 1.60
1 63 Nipah (Nypa fructicans) 825,588.35 9,052,156.52 3.00 2.40
1 64 Nipah (Nypa fructicans) 825,593.18 9,052,154.89 2.50 2.50
1 65 Nipah (Nypa fructicans) 825,594.67 9,052,153.45 3.00 1.80
1 66 Nipah (Nypa fructicans) 825,595.85 9,052,154.50 3.25 1.90
1 67 Nipah (Nypa fructicans) 825,590.22 9,052,157.75 3.25 2.30
2 1 Petai (Parkia speciosa) 825,119.73 9,053,855.69 30.00 16.00
2 2 Kelapa (Cocos nucifera) 825,117.79 9,053,854.11 32.00 35.00
2 3 Kelapa (Cocos nucifera) 825,106.99 9,053,854.23 30.00 35.00
2 4 Kelapa (Cocos nucifera) 825,108.32 9,053,859.56 30.00 37.00
2 5 Kelapa (Cocos nucifera) 825,096.92 9,053,861.38 27.00 31.00
2 6 Kelapa (Cocos nucifera) 825,090.13 9,053,863.07 28.00 30.00
2 7 Nangka (Artocapus integra)
825,090.01 9,053,860.52 22.00 25.00
2 8 Kelapa (Cocos nucifera) 825,088.92 9,053,858.22 31.00 32.00
2 9 Kelapa (Cocos nucifera) 825,078.97 9,053,863.79 34.00 38.00
2 10 Kelapa (Cocos nucifera) 825,071.45 9,053,870.82 29.00 29.00
2 11 Kelapa (Cocos nucifera) 825,070.85 9,053,862.21 32.00 20.00
2 12 Jati (Tectona grandis) 825,066.12 9,053,865.97 38.00 35.00
2 13 Kelapa (Cocos nucifera) 825,059.81 9,053,869.60 30.00 33.00
Determination of Project Boundary to Facilitate Measuring and Monitoring of Carbon Stocks
21
Table 5. (Advanced)
PSP No.
No. of tree
Species Coordinate
X Coordinate
Y Stem
Diameter Tree
height 2 14 Kelapa (Cocos nucifera) 825,051.32 9,053,872.75 31.00 29.00
2 15 Mahoni (Swietenia macrophylla)
825,048.77 9,053,870.80 20.00 35.00
2 16 Kelapa (Cocos nucifera) 825,050.11 9,053,867.90 35.00 26.00
2 17 Mahoni (Swietenia macrophylla)
825,045.98 9,053,876.14 29.00 17.00
2 18 Mahoni (Swietenia macrophylla)
825,045.50 9,053,874.20 22.00 32.00
2 19 Mahoni (Swietenia macrophylla)
825,045.13 9,053,872.74 21.00 37.00
2 20 Mahoni (Swietenia macrophylla)
825,044.65 9,053,870.80 24.00 39.00
2 21 Kelapa (Cocos nucifera) 825,031.06 9,053,878.31 24.00 21.00
2 22 Kelapa (Cocos nucifera) 825,048.52 9,053,884.27 22.00 8.00
2 23 Mahoni (Swietenia macrophylla)
825,049.49 9,053,881.96 24.00 17.00
2 24 Mahoni (Swietenia macrophylla)
825,050.58 9,053,884.27 26.00 13.00
2 25 Kelapa (Cocos nucifera) 825,056.65 9,053,881.72 30.00 17.00
2 26 Nangka (Artocapus integra)
825,055.19 9,053,884.15 27.00 21.00
2 27 Kelapa (Cocos nucifera) 825,061.26 9,053,879.54 31.00 25.00
2 28 Mahoni (Swietenia macrophylla)
825,061.75 9,053,877.36 21.00 13.00
2 29 Kelapa (Cocos nucifera) 825,076.30 9,053,877.86 31.00 31.00
2 30 Kelapa (Cocos nucifera) 825,081.52 9,053,871.92 34.00 32.00
2 31 Kelapa (Cocos nucifera) 825,083.33 9,053,877.13 37.00 31.00
2 32 Jati (Tectona grandis) 825,081.76 9,053,874.95 26.00 38.00
2 33 Jati (Tectona grandis) 825,087.94 9,053,877.01 38.00 39.00
2 34 Kelapa (Cocos nucifera) 825,090.85 9,053,874.23 26.00 28.00
2 35 Kelapa (Cocos nucifera) 825,115.84 9,053,862.84 24.00 19.00
2 36 Petai (Parkia speciosa) 825,112.80 9,053,869.27 22.00 31.00
Determination of Project Boundary to Facilitate Measuring and Monitoring of Carbon Stocks
22
Table 5. (Advanced)
PSP No.
No. of tree
Species Coordinate
X Coordinate
Y Stem
Diameter Tree
height 2 37 Kelapa (Cocos nucifera) 825,098.61 9,053,872.29 26.00 17.00
3 1 Petai (Parkia speciosa) 826,097.60 9,055,997.68 22.00 8.00
3 2 Kedawung (Parkia timoriana)
826,107.37 9,055,961.76 21.00 15.00
4 1 Joho (Terminalia belerica)
825,468.96 9,063,876.14 43.00 45.00
4 2 Mandung (Andropogon nardus)
825,483.95 9,063,876.63 60.00 35.00
4 3 Langsep (Lansium domesticum)
825,489.49 9,063,888.01 20.00 15.00
4 4 Langsep (Lansium domesticum)
825,489.94 9,063,883.43 21.00 15.00
4 5 Bayur (Pterospermum diversifolium)
825,490.14 9,063,892.44 23.00 25.00
4 6 Durenan (Durio zibethinus)
825,496.86 9,063,888.95 64.00 32.00
4 7 Waru (Hibiscus tiliaceus) 825,486.29 9,063,900.02 26.00 17.00
4 8 Sepat (Litsea umbellata) 825,482.40 9,063,899.69 25.00 26.00
4 9 Bendo (Artocarpus elasticus)
825,481.13 9,063,898.75 62.00 28.00
4 10 Kamitren 825,498.21 9,063,893.50 61.00 25.00
4 11 Kamitren 825,498.42 9,063,896.41 58.00 28.00
4 12 Nyampuh (Litsea monopetala)
825,497.93 9,063,899.20 21.00 15.00
4 13 Langsep (Lansium domesticum)
825,501.53 9,063,899.11 23.00 16.00
4 14 Mandung (Andropogon nardus)
825,501.41 9,063,899.81 32.00 16.00
4 15 Kamitren 825,491.37 9,063,909.89 51.00 23.00
4 16 Jambuan (Eugenia densiflora)
825,501.33 9,063,908.41 42.00 23.00
4 17 Glintungan (Bischofia javanica)
825,506.86 9,063,907.59 42.00 42.00
4 18 Kembang (Michelia sp) 825,509.27 9,063,910.17 56.00 31.00
Determination of Project Boundary to Facilitate Measuring and Monitoring of Carbon Stocks
23
Table 5. (Advanced)
PSP No.
No. of tree
Species Coordinate
X Coordinate
Y Stem
Diameter Tree
height 4 19 Durenan
(Durio zibethinus) 825,500.55 9,063,916.89 22.00 14.00
4 20 Nyampuh (Litsea monopetala)
825,497.60 9,063,915.29 23.00 24.00
4 21 Durenan (Durio zibethinus)
825,510.91 9,063,921.23 32.00 15.00
4 22 Langsep (Lansium domesticum)
825,507.35 9,063,929.22 23.00 15.00
4 23 Ketangi (Lagerstroemia spceiosa)
825,504.48 9,063,931.23 120.00 35.00
4 24 Mandung (Andropogon nardus)
825,516.24 9,063,929.71 24.00 12.00
4 25 Durenan (Durio zibethinus)
825,521.97 9,063,931.80 32.00 16.00
4 26 Sepat (Litsea umbellata) 825,524.35 9,063,932.58 22.00 18.00
4 27 Durenan (Durio zibethinus)
825,522.18 9,063,934.71 20.00 15.00
4 28 Jambuan (Eugenia densiflora)
825,526.77 9,063,935.16 31.00 12.00
4 29 Jambuan (Eugenia densiflora)
825,525.13 9,063,936.30 36.00 16.00
4 30 Rau (Dracontomelon mangiferum)
825,529.64 9,063,939.25 21.00 17.00
4 31 Langsep (Lansium domesticum)
825,522.10 9,063,949.41 21.00 16.00
4 32 Langsep (Lansium domesticum)
825,522.63 9,063,954.53 23.00 15.00
4 33 Mandung (Andropogon nardus)
825,534.31 9,063,943.31 26.00 11.00
4 34 Bayur (Pterospermum diversifolium)
825,530.86 9,063,944.49 32.00 17.00
4 35 Bayur (Pterospermum diversifolium)
825,530.95 9,063,948.10 54.00 31.00
4 36 Mangir (Eugenia cymosa) 825,530.70 9,063,949.49 23.00 15.00
Determination of Project Boundary to Facilitate Measuring and Monitoring of Carbon Stocks
24
Table 5. (Advanced)
PSP No.
No. of tree
Species Coordinate
X Coordinate
Y Stem
Diameter Tree
height 4 37 Langsep
(Lansium domesticum) 825,535.13 9,063,948.84 23.00 18.00
5 1 Cempagan (Dysoxylum densiflorum)
824,987.11 9,066,880.90 42.00 16.00
5 2 Pepayan 824,978.40 9,066,883.64 32.00 16.00
5 3 Garu (Antidesma montanum)
824,980.86 9,066,861.58 62.00 26.00
5 4 Mundung (Baccaurea racemosa)
824,973.36 9,066,862.13 22.00 12.00
5 5 Rau (Dracontomelon mangiferum)
824,986.66 9,066,859.75 80.00 3.00
5 6 Garu (Antidesma montanum)
824,972.05 9,066,849.19 22.00 30.00
5 7 Cempagan (Dysoxylum densiflorum)
824,973.73 9,066,854.00 34.00 31.00
5 8 Sepat (Litsea umbellata) 824,970.92 9,066,848.33 27.00 12.00
5 9 Garu (Antidesma montanum)
824,975.87 9,066,847.64 35.00 26.00
5 10 Garu (Antidesma montanum)
824,972.62 9,066,846.08 30.00 32.00
5 11 Garu (Antidesma montanum)
824,979.20 9,066,842.63 38.00 25.00
5 12 Putat (Planchonia valida) 824,978.51 9,066,837.67 34.00 25.00
5 13 Cempagan (Dysoxylum densiflorum)
824,967.70 9,066,832.63 22.00 10.00
5 14 Katesan (Macaranga denticulata)
824,982.70 9,066,828.00 43.00 10.00
5 15 Cempagan (Dysoxylum densiflorum)
824,967.01 9,066,827.68 29.00 15.00
5 16 Cempagan (Dysoxylum densiflorum)
824,973.38 9,066,822.74 37.00 18.00
5 17 Cempagan (Dysoxylum densiflorum)
824,970.41 9,066,823.16 100.00 16.00
5 18 Cempagan (Dysoxylum densiflorum)
824,972.53 9,066,823.87 38.00 14.00
Determination of Project Boundary to Facilitate Measuring and Monitoring of Carbon Stocks
25
Table 5. (Advanced)
PSP No.
No. of tree
Species Coordinate
X Coordinate
Y Stem
Diameter Tree
height 5 19 Cempagan
(Dysoxylum densiflorum) 824,969.28 9,066,822.31 26.00 15.00
5 20 Mundung (Baccaurea racemosa)
824,967.23 9,066,822.09 21.00 16.00
5 21 Mundung (Baccaurea racemosa)
824,980.53 9,066,819.72 23.00 12.00
5 22 Cempagan (Dysoxylum densiflorum)
824,964.50 9,066,809.85 21.00 12.00
5 23 Menteng (Baccaurea racemosa)
824,971.02 9,066,805.91 31.00 16.00
5 24 Cempagan (Dysoxylum densiflorum)
824,965.09 9,066,799.67 42.00 13.00
5 25 Pakem (Pangium edule) 824,963.69 9,066,793.30 60.00 18.00
5 26 Kayu Kembang 824,976.62 9,066,795.53 30.00 13.00
5 27 Cempagan (Dysoxylum densiflorum)
824,975.79 9,066,789.58 25.00 12.00
5 28 Kayu Kembang 824,970.41 9,066,790.85 23.00 9.00
6 1 Pakem (Pangium edule) 822,176.82 9,052,828.88 50.00 30.00
6 2 Glintungan (Bischofia javanica)
822,157.03 9,052,837.04 40.00 25.00
6 3 Bayur (Pterospermum diversifolium)
822,149.41 9,052,828.79 70.00 45.00
6 4 Langsep (Lansium domesticum)
822,136.49 9,052,832.57 23.00 15.00
6 5 Rau (Dracontomelon mangiferum)
822,136.44 9,052,821.17 20.00 13.00
6 6 Bendo (Artocarpus elasticus)
822,124.27 9,052,816.36 75.00 29.00
6 7 Jambuan (Eugenia densiflora)
822,121.20 9,052,825.89 20.00 15.00
6 8 Berasan (Gomphia serrata)
822,119.20 9,052,829.49 22.00 20.00
6 9 Pakem (Pangium edule) 822,118.66 9,052,825.72 30.00 17.00
6 10 Pakem (Pangium edule) 822,116.19 9,052,813.67 30.00 15.00
Determination of Project Boundary to Facilitate Measuring and Monitoring of Carbon Stocks
26
Table 5. (Advanced)
PSP No.
No. of tree
Species Coordinate
X Coordinate
Y Stem
Diameter Tree
height 6 11 Winong
(Tetrameles nudiflora) 822,103.74 9,052,825.35 20.00 16.00
6 12 Jiret 822,102.61 9,052,827.64 20.00 16.00
6 13 Bayur (Pterospermum diversifolium)
822,085.73 9,052,807.58 35.00 25.00
7 1 Wadung (Garcinia tetranda)
819,600.11 9,055,496.34 31.00 20.00
7 2 Bayur (Pterospermum diversifolium)
819,599.78 9,055,497.29 28.00 30.00
7 3 Bayur (Pterospermum diversifolium)
819,600.40 9,055,498.56 63.00 42.00
7 4 Nyampuh (Litsea monopetala)
819,599.75 9,055,500.45 46.00 32.00
7 5 Sriwil Kutil (Sterculia campanulata)
819,602.59 9,055,501.43 56.00 40.00
7 6 Bayur (Pterospermum diversifolium)
819,603.47 9,055,508.08 23.00 37.00
7 7 Budengan (Diospyros cauliflora)
819,607.55 9,055,511.59 22.00 22.00
7 8 Kenari (Canarium denticulatum)
819,611.63 9,055,515.11 38.00 14.00
7 9 Durenan (Durio zibethinus)
819,593.63 9,055,512.09 22.00 18.00
7 10 Talesan (Persea odoratissima)
819,597.06 9,055,517.50 42.00 40.00
7 11 Lembayungan (Basella rubra)
819,606.45 9,055,527.08 28.00 30.00
7 12 Nyampuh (Litsea monopetala)
819,607.69 9,055,529.62 68.00 32.00
7 13 Lembayungan (Basella rubra)
819,593.80 9,055,526.95 42.00 32.00
7 14 Nyatoh (Palaquium sp) 819,600.71 9,055,531.45 33.00 28.00
7 15 Talesan (Persea odoratissima)
819,600.32 9,055,538.72 35.00 30.00
Determination of Project Boundary to Facilitate Measuring and Monitoring of Carbon Stocks
27
Table 5. (Advanced)
PSP No.
No. of tree
Species Coordinate
X Coordinate
Y Stem
Diameter Tree
height 7 16 Gondang
(Ficus variegata) 819,588.30 9,055,539.87 30.00 26.00
7 17 Berasan (Gomphia serrata)
819,599.32 9,055,544.72 33.00 30.00
7 18 Berasan (Gomphia serrata)
819,597.39 9,055,547.23 35.00 30.00
7 19 Kemiri (Aleurites Moluccana)
819,587.23 9,055,552.19 22.00 22.00
7 20 Berasan (Gomphia serrata)
819,594.14 9,055,556.68 22.00 20.00
7 21 Luwingan (Ficus hispida) 819,590.00 9,055,559.49 22.00 21.00
7 22 Berasan (Gomphia serrata)
819,593.46 9,055,561.74 21.00 22.00
7 23 Sapen (Pometia tomentosa)
819,580.19 9,055,560.34 26.00 18.00
7 24 Gondang (Ficus variegata)
819,583.06 9,055,558.16 27.00 22.00
7 25 Gondang (Ficus variegata)
819,583.35 9,055,560.37 32.00 18.00
7 26 Budengan (Diospyros cauliflora)
819,577.65 9,055,561.58 22.00 24.00
7 27 Kemadu (Laportea sinuata)
819,586.16 9,055,564.51 25.00 15.00
7 28 Nyampuh (Litsea monopetala)
819,579.80 9,055,567.61 33.00 20.00
7 29 Mangir (Eugenia cymosa) 819,577.46 9,055,580.55 27.00 18.00
7 30 Berasan (Gomphia serrata)
819,584.37 9,055,585.05 22.00 28.00
8 1 Glintungan (Bischofia javanica)
820,219.92 9,057,705.69 50.00 23.00
8 2 Besole (Chydenanthus ecelcus )
820,221.29 9,057,707.32 60.00 20.00
8 3 Besole (Chydenanthus ecelcus )
820,224.91 9,057,694.59 45.00 23.00
Determination of Project Boundary to Facilitate Measuring and Monitoring of Carbon Stocks
28
Table 5. (Advanced)
PSP No.
No. of tree
Species Coordinate
X Coordinate
Y Stem
Diameter Tree
height 8 4 Rau (Dracontomelon
mangiferum) 820,220.53 9,057,698.72 20.00 18.00
8 5 Garu (Antidesma montanum)
820,244.42 9,057,695.29 45.00 25.00
8 6 Besole (Chydenanthus ecelcus )
820,253.02 9,057,694.54 20.00 15.00
8 7 Glintungan (Bischofia javanica)
820,259.54 9,057,706.15 20.00 13.00
8 8 Garu (Antidesma montanum)
820,261.23 9,057,698.26 23.00 17.00
8 9 Garu (Antidesma montanum)
820,262.79 9,057,703.42 25.00 16.00
8 10 Lo (Ficus racemosa var.elongata)
820,266.83 9,057,708.79 20.00 15.00
8 11 Pluncing (Spondias pinnata)
820,303.74 9,057,711.52 23.00 14.00
8 12 Bayur (Pterospermum diversifolium)
820,309.30 9,057,711.00 30.00 27.00
8 13 Rau (Dracontomelon mangiferum)
820,308.96 9,057,703.44 35.00 20.00
8 14 Ketangi (Lagerstroemia spceiosa)
820,313.16 9,057,701.30 40.00 17.00
8 15 Rau (Dracontomelon mangiferum)
820,316.10 9,057,713.61 20.00 15.00
9 1 Rau (Dracontomelon mangiferum)
817,197.29 9,057,202.37 39.00 14.00
9 2 Bendo (Artocarpus elasticus)
817,191.07 9,057,225.59 73.00 26.00
9 3 Pakem (Pangium edule) 817,195.20 9,057,204.73 33.00 24.00
9 4 Garu (Antidesma montanum)
817,190.13 9,057,209.96 45.00 25.00
9 5 Putat (Planchonia valida) 817,186.17 9,057,211.10 25.00 25.00
9 6 Bendo (Artocarpus elasticus)
817,195.37 9,057,215.03 21.00 16.00
Determination of Project Boundary to Facilitate Measuring and Monitoring of Carbon Stocks
29
Table 5. (Advanced)
PSP No.
No. of tree
Species Coordinate
X Coordinate
Y Stem
Diameter Tree
height 9 7 Pakem (Pangium edule) 817,201.06 9,057,212.89 22.00 24.00
9 8 Pakem (Pangium edule) 817,192.04 9,057,219.26 25.00 25.00
9 9 Apak (Ficus benjamina) 817,196.79 9,057,227.49 65.00 25.00
9 10 Acar/gaharu (Aquilatia malaccensis)
817,202.37 9,057,227.15 24.00 14.00
9 11 Slumprit (Terminalia microcarpa)
817,207.18 9,057,236.49 27.00 24.00
9 12 Nyampoh 817,210.38 9,057,245.04 35.00 23.00
9 13 Garu (Antidesma montanum)
817,207.85 9,057,247.65 55.00 28.00
9 14 Garu (Antidesma montanum)
817,212.96 9,057,265.49 25.00 26.00
9 15 Garu (Antidesma montanum)
817,209.27 9,057,260.11 70.00 23.00
9 16 Jiprak 817,230.33 9,057,267.59 22.00 16.00
9 17 Pakem (Pangium edule) 817,231.70 9,057,267.95 42.00 23.00
9 18 Pakem (Pangium edule) 817,223.30 9,057,277.42 75.00 17.00
9 19 Bendo (Artocarpus elasticus)
817,237.37 9,057,287.77 90.00 28.00
10 1 Karet (Hevea brazilienzis) 817,982.86 9,054,958.33 23.00 10.00
10 2 Karet (Hevea brazilienzis) 817,978.40 9,054,978.87 20.00 12.00
10 3 Karet (Hevea brazilienzis) 817,973.76 9,054,980.73 21.00 8.00
10 4 Karet (Hevea brazilienzis) 817,959.59 9,055,000.75 20.00 12.00
10 5 Karet (Hevea brazilienzis) 817,962.96 9,055,009.42 20.00 9.00
10 6 Karet (Hevea brazilienzis) 817,956.09 9,055,021.55 22.00 10.00
11 1 Banetan (Polyalthia sumatrana)
817,144.00 9,053,269.00 48.00 12.00
11 2 Pluncing (Spondias pinnata)
817,140.50 9,053,266.00 40.00 17.00
11 3 Jalinan (Celtis wightii) 817,147.00 9,053,268.50 31.00 11.00
11 4 Berasan (Gomphia serrata)
817,150.50 9,053,268.50 27.00 11.00
Determination of Project Boundary to Facilitate Measuring and Monitoring of Carbon Stocks
30
Table 5. (Advanced)
PSP No.
No. of tree
Species Coordinate
X Coordinate
Y Stem
Diameter Tree
height 11 5 Sriwil Kutil
(Sterculia campanulata) 817,148.00 9,053,259.50 49.00 21.00
11 6 Walangan (Eryngium foetidum)
817,153.00 9,053,261.00 21.00 12.00
11 7 Tutup (Mallotus moluccanus)
817,148.00 9,053,256.00 26.00 15.00
11 8 Berasan (Gomphia serrata)
817,148.50 9,053,253.50 22.00 12.00
11 9 Banetan (Polyalthia sumatrana)
817,143.00 9,053,251.00 21.00 10.00
11 10 Walangan (Eryngium foetidum)
817,154.50 9,053,251.00 21.00 12.00
11 11 Poh-pohan (Pilea trinervia)
817,156.00 9,053,249.50 37.00 17.00
11 12 Poh-pohan (Pilea trinervia)
817,152.50 9,053,250.50 27.00 15.00
11 13 Walangan (Eryngium foetidum)
817,138.50 9,053,249.50 23.00 13.00
11 14 Kayu kalongan (Sterculia macrophylla)
817,143.00 9,053,246.00 61.00 25.00
11 15 Walangan (Eryngium foetidum)
817,146.50 9,053,246.00 41.00 14.00
11 16 Walangan (Eryngium foetidum)
817,147.00 9,053,246.00 22.00 12.00
11 17 Jalinan (Celtis wightii) 817,140.00 9,053,244.50 45.00 16.00
11 18 Berasan (Gomphia serrata)
817,142.50 9,053,244.00 26.00 13.00
11 19 Walangan (Eryngium foetidum)
817,141.00 9,053,240.50 28.00 15.00
11 20 Walangan (Eryngium foetidum)
817,141.00 9,053,240.50 20.00 12.00
11 21 Walangan (Eryngium foetidum)
817,147.00 9,053,240.00 41.00 20.00
11 22 Walangan (Eryngium foetidum)
817,147.00 9,053,240.00 38.00 19.00
Determination of Project Boundary to Facilitate Measuring and Monitoring of Carbon Stocks
31
Table 5. (Advanced)
PSP No.
No. of tree
Species Coordinate
X Coordinate
Y Stem
Diameter Tree
height 11 23 Poh-pohan
(Pilea Trinervia) 817,147.00 9,053,240.00 29.00 15.00
11 24 Banetan (Polyalthia sumatrana)
817,142.00 9,053,236.00 32.00 15.00
11 25 Apak (Ficus benjamina) 817,145.00 9,053,221.00 54.00 17.00
11 26 Kluntungan (Mischocarpus pentapetalus)
817,148.50 9,053,220.50 22.00 24.00
11 27 Kancilan (Alchornea rugosa)
817,143.00 9,053,218.00 23.00 9.00
11 28 Berasan (Gomphia serrata)
817,143.00 9,053,214.00 22.00 11.00
11 29 Banetan (Polyalthia sumatrana)
817,147.00 9,053,216.00 23.00 19.00
11 30 Banetan (Polyalthia sumatrana)
817,150.00 9,053,213.50 31.00 17.00
11 31 Jalinan (Celtis wightii) 817,138.50 9,053,214.00 44.00 18.00
11 32 Kancilan (Alchornea rugosa)
817,142.00 9,053,206.00 27.00 14.00
11 33 Berasan (Gomphia serrata)
817,151.00 9,053,204.00 34.00 16.00
11 34 Berasan (Gomphia serrata)
817,146.00 9,053,202.50 46.00 16.00
11 35 Pluncing (Spondias pinnata)
817,143.50 9,053,194.00 29.00 13.00
11 36 Berasan (Gomphia serrata)
817,148.00 9,053,193.00 36.00 25.00
11 37 Walangan (Eryngium foetidum)
817,153.50 9,053,193.50 68.00 15.00
11 38 Walangan (Eryngium foetidum)
817,153.50 9,053,193.50 54.00 17.00
11 39 Kemuning (Murraya paniculata)
817,138.50 9,053,191.50 45.00 12.00
11 40 Tutup (Mallotus moluccanus)
817,151.00 9,053,188.00 21.00 13.00
Determination of Project Boundary to Facilitate Measuring and Monitoring of Carbon Stocks
32
Table 5. (Advanced)
PSP No.
No. of tree
Species Coordinate
X Coordinate
Y Stem
Diameter Tree
height 11 41 Banetan
(Polyalthia sumatrana) 817,140.50 9,053,188.00 24.00 13.00
11 42 Sapen (Pometia tomentosa)
817,149.00 9,053,185.50 21.00 15.00
11 43 Walangan (Eryngium foetidum)
817,141.00 9,053,181.00 21.00 10.00
11 44 Walangan (Eryngium foetidum)
817,141.00 9,053,181.00 26.00 10.00
11 45 Pala (Myristica fragrans) 817,152.00 9,053,172.50 40.00 27.00
12 1 Cakar ayam (Selaginella doederleinii)
817,758.50 9,052,607.00 35.00 10.00
12 2 Serut (Streblus asper) 817,757.00 9,052,604.00 25.00 12.00
12 3 Pulai (Alstonia scholaris) 817,756.50 9,052,607.00 47.00 25.00
12 4 Cakar ayam (Selaginella doederleinii)
817,756.50 9,052,606.50 28.00 15.00
12 5 Pulai (Alstonia scholaris) 817,752.50 9,052,602.50 41.00 14.00
12 6 Cakar ayam (Selaginella doederleinii)
817,754.00 9,052,609.00 23.00 13.00
12 7 Cakar ayam (Selaginella doederleinii)
817,749.00 9,052,609.00 23.00 14.00
12 8 Cakar ayam (Selaginella doederleinii)
817,748.50 9,052,601.50 23.00 9.00
12 9 Luwingan (Ficus hispida) 817,746.00 9,052,608.00 27.00 7.00
12 10 Luwingan (Ficus hispida) 817,745.50 9,052,606.50 21.00 10.00
12 11 Cakar ayam (Selaginella doederleinii)
817,745.00 9,052,609.50 34.00 12.00
12 12 Luwingan (Ficus hispida) 817,742.50 9,052,605.50 21.00 11.00
12 13 Ledoyo (Dysoxylum amoroides)
817,741.00 9,052,600.00 44.00 17.00
12 14 Cakar ayam (Selaginella doederleinii)
817,731.00 9,052,610.00 34.00 17.00
12 15 Luwingan (Ficus hispida) 817,726.00 9,052,609.50 21.00 10.00
Determination of Project Boundary to Facilitate Measuring and Monitoring of Carbon Stocks
33
Table 5. (Advanced)
PSP No.
No. of tree
Species Coordinate
X Coordinate
Y Stem
Diameter Tree
height 12 16 Bayur (Pterospermum
diversifolium) 817,710.00 9,052,597.00 51.00 19.00
12 17 Apak (Ficus benjamina) 817,710.00 9,052,597.50 39.00 21.00
12 18 Luwingan (Ficus hispida) 817,700.00 9,052,612.00 21.00 7.00
12 19 Cakar ayam (Selaginella doederleinii)
817,677.50 9,052,597.50 21.00 10.00
12 20 Cakar ayam (Selaginella doederleinii)
817,675.00 9,052,596.50 23.00 9.00
12 21 Ledoyo (Dysoxylum amoroides)
817,675.00 9,052,596.50 26.00 8.00
13 1 Ledoyo (Dysoxylum amoroides)
814,305.50 9,055,500.50 36.00 17.00
13 2 Bayur (Pterospermum diversifolium)
814,289.50 9,055,496.00 66.00 32.00
13 3 Budengan (Diospyros cauliflora)
814,298.00 9,055,496.00 41.00 25.00
13 4 Garu (Antidesma montanum)
814,302.00 9,055,495.00 22.00 14.00
13 5 Kluwek (Pangium edule)
814,288.00 9,055,491.00 27.00 15.00
13 6 Garu (Antidesma montanum)
814,296.50 9,055,485.00 25.00 18.00
13 7 Putihan (Acronychia trifoliate)
814,297.00 9,055,480.00 27.00 14.00
13 8 Garu (Antidesma montanum)
814,302.00 9,055,476.00 28.00 19.00
13 9 Kembang buruh (Machilus rimosa)
814,306.00 9,055,473.50 28.00 19.00
13 10 Talesan (Persea odoratissima)
814,303.00 9,055,473.00 24.00 14.00
13 11 Joho (Terminalia belerica)
814,292.50 9,055,472.00 57.00 25.00
13 12 Talesan (Persea odoratissima)
814,301.50 9,055,470.00 25.00 23.00
Determination of Project Boundary to Facilitate Measuring and Monitoring of Carbon Stocks
34
Table 5. (Advanced)
13 13 Garu (Antidesma montanum)
814,303.50 9,055,468.50 123.00 22.00
13 14 Nyampuh (Litsea monopetala)
814,292.50 9,055,456.50 51.00 15.00
13 15 Sapen (Pometia tomentosa)
814,292.00 9,055,451.00 24.00 13.00
13 16 Bendo (Artocarpus elasticus)
814,298.00 9,055,452.00 28.00 20.00
13 17 bayur (Pterospermum diversifolium)
814,288.00 9,055,432.50 44.00 29.00
13 18 Nyampuh (Litsea monopetala)
814,299.50 9,055,432.00 87.00 28.00
13 19 Nyampuh (Litsea monopetala)
814,295.00 9,055,431.00 31.00 23.00
13 20 Jambuan (Eugenia densiflora)
814,292.00 9,055,426.00 27.00 11.00
13 21 Getihan (Rivina humilis) 814,288.00 9,055,422.50 48.00 21.00
13 22 Aren (Arenga pinata) 814,297.00 9,055,428.50 30.00 5.00
13 23 Putihan (Acronychia trifoliate)
814,305.50 9,055,421.00 20.50 18.00
13 24 Bungur (Lagerstroemia speciosa)
814,307.00 9,055,418.00 73.00 16.00
13 25 Apak (Ficus benjamina) 814,307.00 9,055,418.00 51.00 17.00
13 26 Manting (Euginea polyanthum)
814,301.00 9,055,401.00 30.00 15.00
14 1 Bendo (Artocarpus elasticus)
812,449.00 9,056,909.50 84.00 30.00
14 2 Garu (Antidesma montanum)
812,447.50 9,056,903.00 81.00 25.00
14 3 Besole (Chydenanthus ecelcus )
812,447.00 9,056,899.00 43.00 23.00
14 4 Pakem (Pangium edule) 812,447.50 9,056,909.00 38.00 16.00
14 5 Garu (Antidesma montanum)
812,446.50 9,056,911.00 22.00 11.00
Determination of Project Boundary to Facilitate Measuring and Monitoring of Carbon Stocks
35
Table 5. (Advanced)
PSP No.
No. of tree
Species Coordinate
X Coordinate
Y Stem
Diameter Tree
height 14 6 Kemuning
(Murraya paniculata) 812,441.00 9,056,904.00 20.00 12.00
14 7 Slumprit (Terminalia microcarpa)
812,436.50 9,056,903.50 37.00 31.00
14 8 Besole (Chydenanthus ecelcus )
812,435.00 9,056,903.50 47.00 16.50
14 9 Garu (Antidesma montanum)
812,433.50 9,056,910.00 31.00 28.00
14 10 Pakem (Pangium edule) 812,432.00 9,056,909.50 54.00 19.00
14 11 Garu (Antidesma montanum)
812,418.50 9,056,911.50 28.00 20.00
14 12 Bendo (Artocarpus elasticus)
812,419.00 9,056,906.00 45.00 19.00
14 13 Kemuning (Murraya paniculata)
812,415.00 9,056,902.50 20.00 12.00
14 14 Aren (Arenga pinata) 812,415.00 9,056,905.00 39.00 14.00
14 15 Besole (Chydenanthus ecelcus )
812,409.50 9,056,903.00 59.00 17.00
14 16 Aren (Arenga pinata) 812,408.00 9,056,903.50 33.00 5.00
14 17 Pakem (Pangium edule) 812,411.00 9,056,909.50 21.00 11.00
14 18 Rau (Dracontomelon mangiferum)
812,400.00 9,056,910.00 30.00 23.00
14 19 Besole (Chydenanthus ecelcus )
812,399.00 9,056,903.00 78.00 21.00
14 20 Besole (Chydenanthus ecelcus )
812,389.50 9,056,910.00 46.00 18.00
14 21 Apak (Ficus benjamina) 812,381.00 9,056,910.00 81.00 27.00
14 22 Apak (Ficus benjamina) 812,381.00 9,056,910.00 87.00 26.00
14 23 Manting (Euginea polyanthum)
812,383.50 9,056,900.00 42.00 24.00
14 24 Nyampuh (Litsea monopetala)
812,382.00 9,056,900.00 39.00 27.00
14 25 Pakem (Pangium edule) 812,381.00 9,056,902.00 29.00 15.00
14 26 Serut (Streblus asper) 812,376.00 9,056,900.00 21.00 13.00
Determination of Project Boundary to Facilitate Measuring and Monitoring of Carbon Stocks
36
Table 5. (Advanced)
PSP No.
No. of tree
Species Coordinate
X Coordinate
Y Stem
Diameter Tree
height 14 27 Ketingan
(Vitex pubescens) 812,377.50 9,056,907.00 21.00 12.00
14 28 Kesemek (Diospyros kaki) 812,373.50 9,056,911.00 37.00 17.00
14 29 Kesemek (Diospyros kaki) 812,371.00 9,056,908.50 21.00 14.00
14 30 Manting (Euginea polyanthum)
812,371.50 9,056,903.00 26.00 14.00
14 31 Sentul (Sondaricum koetjapi)
812,371.00 9,056,898.00 40.00 19.00
14 32 Durenan (Durio zibethinus)
812,369.50 9,056,899.00 20.00 15.00
14 33 Durenan (Durio zibethinus)
812,366.00 9,056,898.50 47.00 19.00
14 34 Talesan (Persea odoratissima)
812,360.00 9,056,901.00 21.00 17.00
14 35 Glintungan (Bischofia javanica)
812,358.00 9,056,911.00 34.00 15.00
14 36 Takir (Duabanga moluccana)
812,353.00 9,056,906.50 44.00 21.00
14 37 Manting (Euginea polyanthum)
812,351.00 9,056,899.50 29.00 16.00
15 1 Garu (Antidesma montanum)
810,922.13 9,059,204.46 44.00 25.00
15 2 Kluntungan (Mischocarpus pentapetalus)
810,920.16 9,059,212.79 28.00 17.00
15 3 Kedu (Planchonella futida)
810,927.68 9,059,215.53 43.00 17.00
15 4 Langsep (Lansium domesticum)
810,921.82 9,059,215.53 25.00 16.00
15 5 Apak (Ficus benjamina) 810,921.82 9,059,215.53 46.00 28.00
15 6 Apak (Ficus benjamina) 810,921.82 9,059,215.53 38.00 29.00
15 7 Putat (Planchonia valida) 810,921.01 9,059,216.30 106.00 29.00
15 8 Talok (Muntingia calabura)
810,913.24 9,059,211.34 26.00 17.00
Determination of Project Boundary to Facilitate Measuring and Monitoring of Carbon Stocks
37
Table 5. (Advanced)
PSP No.
No. of tree
Species Coordinate
X Coordinate
Y Stem
Diameter Tree
height 15 9 Apak (Ficus benjamina) 810,911.79 9,059,212.41 93.00 24.00
15 10 Kemuning (Murraya paniculata)
810,920.50 9,059,223.56 27.00 10.00
15 11 Klampok (Syzygium samarangense)
810,922.68 9,059,224.88 29.00 18.50
15 12 Langsep (Lansium domesticum)
810,922.76 9,059,227.58 27.00 18.00
15 13 Talok (Muntingia calabura)
810,913.15 9,059,226.21 23.00 9.00
15 14 Apak (Ficus benjamina) 810,913.15 9,059,226.21 25.00 18.00
15 15 Garu (Antidesma montanum)
810,915.28 9,059,229.11 21.00 12.00
15 16 Sriwil kutil (Sterculia campanulata)
810,911.70 9,059,233.13 44.00 32.00
15 17 Talok (Muntingia calabura)
810,911.39 9,059,238.34 33.00 26.00
15 18 Kecingal 810,907.81 9,059,242.35 26.00 15.00
15 19 Manting (Euginea polyanthum)
810,904.81 9,059,259.35 27.00 13.00
15 20 Kluntungan (Mischocarpus pentapetalus)
810,902.97 9,059,262.94 68.00 24.00
15 21 Gempol (Nauclea orientalis)
810,903.78 9,059,268.02 21.00 13.00
15 22 Klampok (Syzygium samarangense)
810,887.68 9,059,272.80 23.00 18.00
15 23 Bungur (Lagerstroemia speciosa)
810,901.77 9,059,277.93 112.00 24.00
15 24 Kedu (Planchonella futida)
810,885.75 9,059,285.40 54.00 17.00
15 25 Kedu (Planchonella futida)
810,901.26 9,059,291.05 21.00 17.00
16 1 Bayur (Pterospermum diversifolium)
810,313.00 9,060,480.00 21.00 15.00
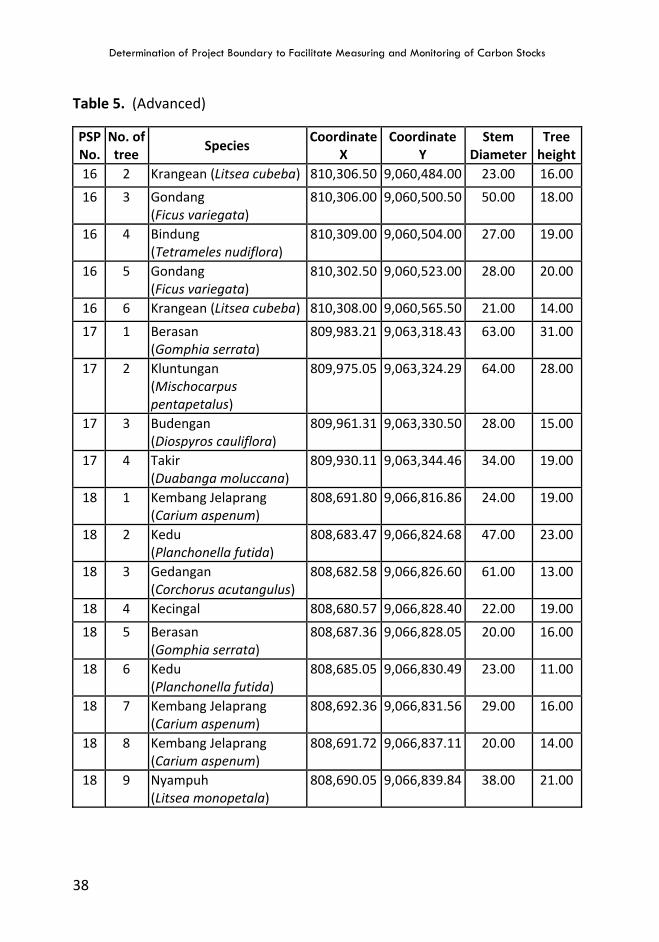
Determination of Project Boundary to Facilitate Measuring and Monitoring of Carbon Stocks
38
Table 5. (Advanced)
PSP No.
No. of tree
Species Coordinate
X Coordinate
Y Stem
Diameter Tree
height 16 2 Krangean (Litsea cubeba) 810,306.50 9,060,484.00 23.00 16.00
16 3 Gondang (Ficus variegata)
810,306.00 9,060,500.50 50.00 18.00
16 4 Bindung (Tetrameles nudiflora)
810,309.00 9,060,504.00 27.00 19.00
16 5 Gondang (Ficus variegata)
810,302.50 9,060,523.00 28.00 20.00
16 6 Krangean (Litsea cubeba) 810,308.00 9,060,565.50 21.00 14.00
17 1 Berasan (Gomphia serrata)
809,983.21 9,063,318.43 63.00 31.00
17 2 Kluntungan (Mischocarpus pentapetalus)
809,975.05 9,063,324.29 64.00 28.00
17 3 Budengan (Diospyros cauliflora)
809,961.31 9,063,330.50 28.00 15.00
17 4 Takir (Duabanga moluccana)
809,930.11 9,063,344.46 34.00 19.00
18 1 Kembang Jelaprang (Carium aspenum)
808,691.80 9,066,816.86 24.00 19.00
18 2 Kedu (Planchonella futida)
808,683.47 9,066,824.68 47.00 23.00
18 3 Gedangan (Corchorus acutangulus)
808,682.58 9,066,826.60 61.00 13.00
18 4 Kecingal 808,680.57 9,066,828.40 22.00 19.00
18 5 Berasan (Gomphia serrata)
808,687.36 9,066,828.05 20.00 16.00
18 6 Kedu (Planchonella futida)
808,685.05 9,066,830.49 23.00 11.00
18 7 Kembang Jelaprang (Carium aspenum)
808,692.36 9,066,831.56 29.00 16.00
18 8 Kembang Jelaprang (Carium aspenum)
808,691.72 9,066,837.11 20.00 14.00
18 9 Nyampuh (Litsea monopetala)
808,690.05 9,066,839.84 38.00 21.00
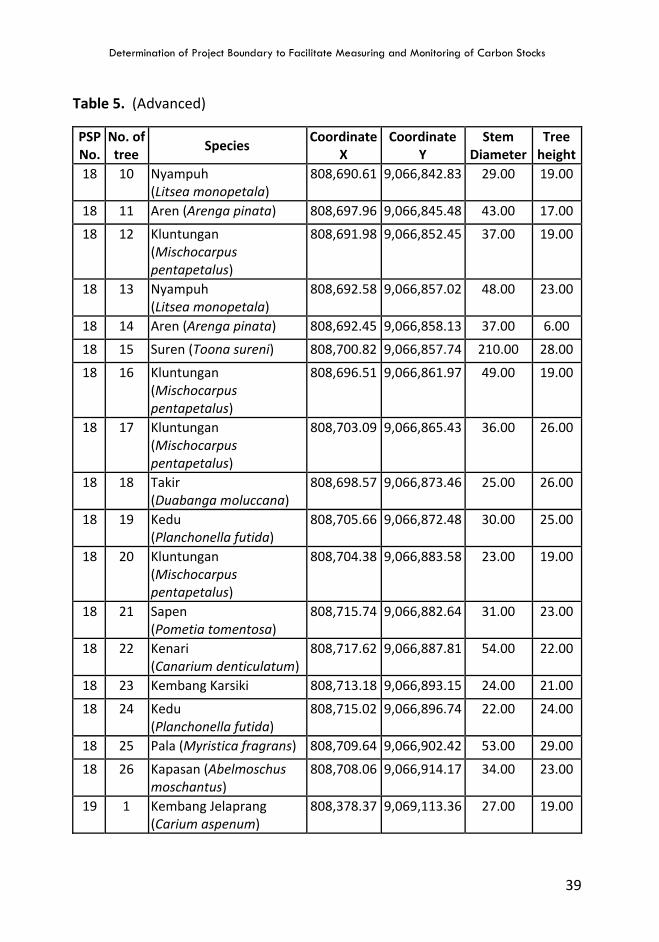
Determination of Project Boundary to Facilitate Measuring and Monitoring of Carbon Stocks
39
Table 5. (Advanced)
PSP No.
No. of tree
Species Coordinate
X Coordinate
Y Stem
Diameter Tree
height 18 10 Nyampuh
(Litsea monopetala) 808,690.61 9,066,842.83 29.00 19.00
18 11 Aren (Arenga pinata) 808,697.96 9,066,845.48 43.00 17.00
18 12 Kluntungan (Mischocarpus pentapetalus)
808,691.98 9,066,852.45 37.00 19.00
18 13 Nyampuh (Litsea monopetala)
808,692.58 9,066,857.02 48.00 23.00
18 14 Aren (Arenga pinata) 808,692.45 9,066,858.13 37.00 6.00
18 15 Suren (Toona sureni) 808,700.82 9,066,857.74 210.00 28.00
18 16 Kluntungan (Mischocarpus pentapetalus)
808,696.51 9,066,861.97 49.00 19.00
18 17 Kluntungan (Mischocarpus pentapetalus)
808,703.09 9,066,865.43 36.00 26.00
18 18 Takir (Duabanga moluccana)
808,698.57 9,066,873.46 25.00 26.00
18 19 Kedu (Planchonella futida)
808,705.66 9,066,872.48 30.00 25.00
18 20 Kluntungan (Mischocarpus pentapetalus)
808,704.38 9,066,883.58 23.00 19.00
18 21 Sapen (Pometia tomentosa)
808,715.74 9,066,882.64 31.00 23.00
18 22 Kenari (Canarium denticulatum)
808,717.62 9,066,887.81 54.00 22.00
18 23 Kembang Karsiki 808,713.18 9,066,893.15 24.00 21.00
18 24 Kedu (Planchonella futida)
808,715.02 9,066,896.74 22.00 24.00
18 25 Pala (Myristica fragrans) 808,709.64 9,066,902.42 53.00 29.00
18 26 Kapasan (Abelmoschus moschantus)
808,708.06 9,066,914.17 34.00 23.00
19 1 Kembang Jelaprang (Carium aspenum)
808,378.37 9,069,113.36 27.00 19.00
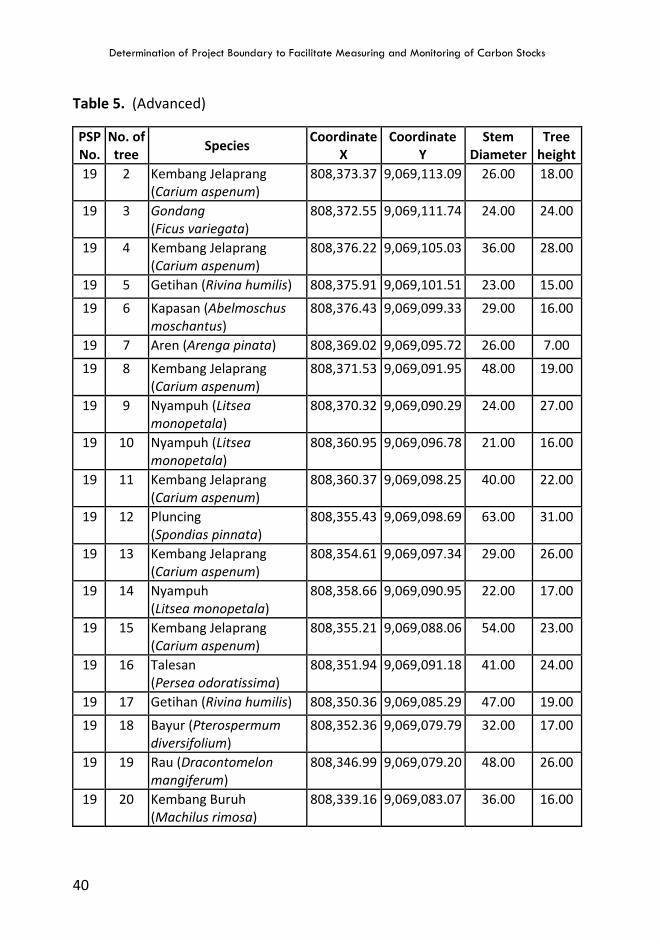
Determination of Project Boundary to Facilitate Measuring and Monitoring of Carbon Stocks
40
Table 5. (Advanced)
PSP No.
No. of tree
Species Coordinate
X Coordinate
Y Stem
Diameter Tree
height 19 2 Kembang Jelaprang
(Carium aspenum) 808,373.37 9,069,113.09 26.00 18.00
19 3 Gondang (Ficus variegata)
808,372.55 9,069,111.74 24.00 24.00
19 4 Kembang Jelaprang (Carium aspenum)
808,376.22 9,069,105.03 36.00 28.00
19 5 Getihan (Rivina humilis) 808,375.91 9,069,101.51 23.00 15.00
19 6 Kapasan (Abelmoschus moschantus)
808,376.43 9,069,099.33 29.00 16.00
19 7 Aren (Arenga pinata) 808,369.02 9,069,095.72 26.00 7.00
19 8 Kembang Jelaprang (Carium aspenum)
808,371.53 9,069,091.95 48.00 19.00
19 9 Nyampuh (Litsea monopetala)
808,370.32 9,069,090.29 24.00 27.00
19 10 Nyampuh (Litsea monopetala)
808,360.95 9,069,096.78 21.00 16.00
19 11 Kembang Jelaprang (Carium aspenum)
808,360.37 9,069,098.25 40.00 22.00
19 12 Pluncing (Spondias pinnata)
808,355.43 9,069,098.69 63.00 31.00
19 13 Kembang Jelaprang (Carium aspenum)
808,354.61 9,069,097.34 29.00 26.00
19 14 Nyampuh (Litsea monopetala)
808,358.66 9,069,090.95 22.00 17.00
19 15 Kembang Jelaprang (Carium aspenum)
808,355.21 9,069,088.06 54.00 23.00
19 16 Talesan (Persea odoratissima)
808,351.94 9,069,091.18 41.00 24.00
19 17 Getihan (Rivina humilis) 808,350.36 9,069,085.29 47.00 19.00
19 18 Bayur (Pterospermum diversifolium)
808,352.36 9,069,079.79 32.00 17.00
19 19 Rau (Dracontomelon mangiferum)
808,346.99 9,069,079.20 48.00 26.00
19 20 Kembang Buruh (Machilus rimosa)
808,339.16 9,069,083.07 36.00 16.00
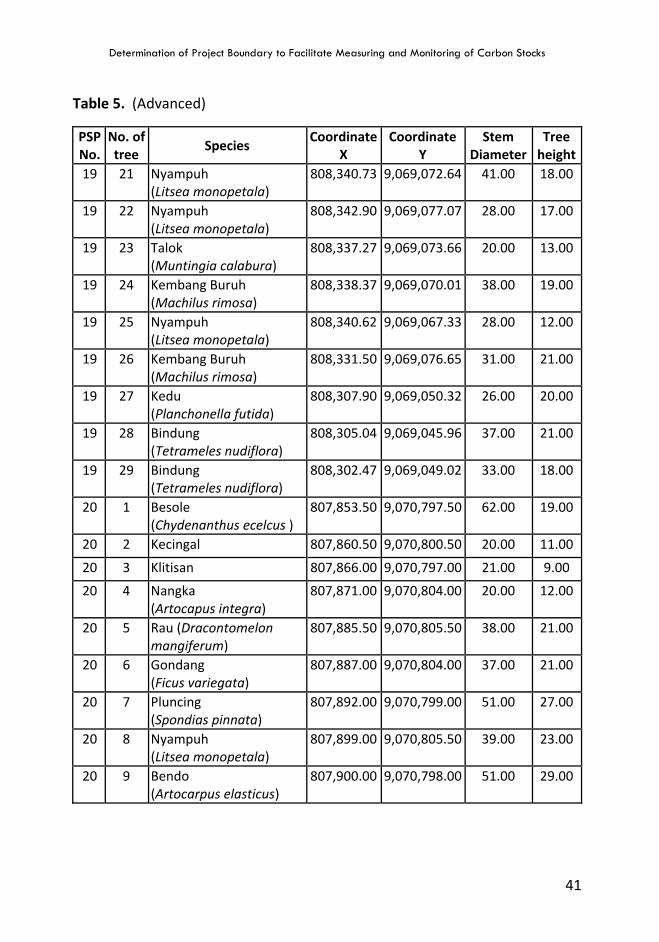
Determination of Project Boundary to Facilitate Measuring and Monitoring of Carbon Stocks
41
Table 5. (Advanced)
PSP No.
No. of tree
Species Coordinate
X Coordinate
Y Stem
Diameter Tree
height 19 21 Nyampuh
(Litsea monopetala) 808,340.73 9,069,072.64 41.00 18.00
19 22 Nyampuh (Litsea monopetala)
808,342.90 9,069,077.07 28.00 17.00
19 23 Talok (Muntingia calabura)
808,337.27 9,069,073.66 20.00 13.00
19 24 Kembang Buruh (Machilus rimosa)
808,338.37 9,069,070.01 38.00 19.00
19 25 Nyampuh (Litsea monopetala)
808,340.62 9,069,067.33 28.00 12.00
19 26 Kembang Buruh (Machilus rimosa)
808,331.50 9,069,076.65 31.00 21.00
19 27 Kedu (Planchonella futida)
808,307.90 9,069,050.32 26.00 20.00
19 28 Bindung (Tetrameles nudiflora)
808,305.04 9,069,045.96 37.00 21.00
19 29 Bindung (Tetrameles nudiflora)
808,302.47 9,069,049.02 33.00 18.00
20 1 Besole (Chydenanthus ecelcus )
807,853.50 9,070,797.50 62.00 19.00
20 2 Kecingal 807,860.50 9,070,800.50 20.00 11.00
20 3 Klitisan 807,866.00 9,070,797.00 21.00 9.00
20 4 Nangka (Artocapus integra)
807,871.00 9,070,804.00 20.00 12.00
20 5 Rau (Dracontomelon mangiferum)
807,885.50 9,070,805.50 38.00 21.00
20 6 Gondang (Ficus variegata)
807,887.00 9,070,804.00 37.00 21.00
20 7 Pluncing (Spondias pinnata)
807,892.00 9,070,799.00 51.00 27.00
20 8 Nyampuh (Litsea monopetala)
807,899.00 9,070,805.50 39.00 23.00
20 9 Bendo (Artocarpus elasticus)
807,900.00 9,070,798.00 51.00 29.00
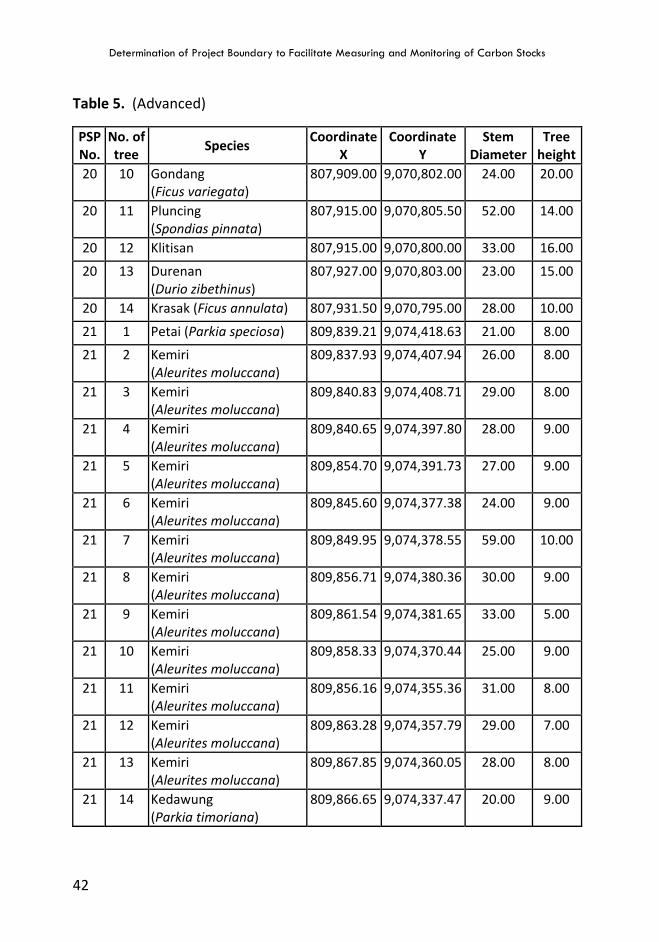
Determination of Project Boundary to Facilitate Measuring and Monitoring of Carbon Stocks
42
Table 5. (Advanced)
PSP No.
No. of tree
Species Coordinate
X Coordinate
Y Stem
Diameter Tree
height 20 10 Gondang
(Ficus variegata) 807,909.00 9,070,802.00 24.00 20.00
20 11 Pluncing (Spondias pinnata)
807,915.00 9,070,805.50 52.00 14.00
20 12 Klitisan 807,915.00 9,070,800.00 33.00 16.00
20 13 Durenan (Durio zibethinus)
807,927.00 9,070,803.00 23.00 15.00
20 14 Krasak (Ficus annulata) 807,931.50 9,070,795.00 28.00 10.00
21 1 Petai (Parkia speciosa) 809,839.21 9,074,418.63 21.00 8.00
21 2 Kemiri (Aleurites moluccana)
809,837.93 9,074,407.94 26.00 8.00
21 3 Kemiri (Aleurites moluccana)
809,840.83 9,074,408.71 29.00 8.00
21 4 Kemiri (Aleurites moluccana)
809,840.65 9,074,397.80 28.00 9.00
21 5 Kemiri (Aleurites moluccana)
809,854.70 9,074,391.73 27.00 9.00
21 6 Kemiri (Aleurites moluccana)
809,845.60 9,074,377.38 24.00 9.00
21 7 Kemiri (Aleurites moluccana)
809,849.95 9,074,378.55 59.00 10.00
21 8 Kemiri (Aleurites moluccana)
809,856.71 9,074,380.36 30.00 9.00
21 9 Kemiri (Aleurites moluccana)
809,861.54 9,074,381.65 33.00 5.00
21 10 Kemiri (Aleurites moluccana)
809,858.33 9,074,370.44 25.00 9.00
21 11 Kemiri (Aleurites moluccana)
809,856.16 9,074,355.36 31.00 8.00
21 12 Kemiri (Aleurites moluccana)
809,863.28 9,074,357.79 29.00 7.00
21 13 Kemiri (Aleurites moluccana)
809,867.85 9,074,360.05 28.00 8.00
21 14 Kedawung (Parkia timoriana)
809,866.65 9,074,337.47 20.00 9.00
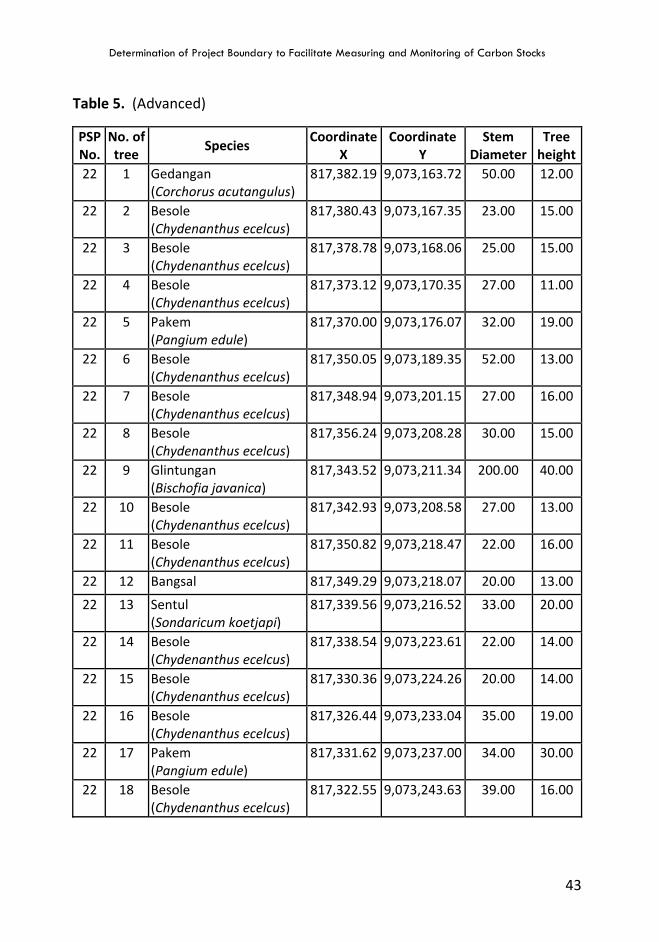
Determination of Project Boundary to Facilitate Measuring and Monitoring of Carbon Stocks
43
Table 5. (Advanced)
PSP No.
No. of tree
Species Coordinate
X Coordinate
Y Stem
Diameter Tree
height 22 1 Gedangan
(Corchorus acutangulus) 817,382.19 9,073,163.72 50.00 12.00
22 2 Besole (Chydenanthus ecelcus)
817,380.43 9,073,167.35 23.00 15.00
22 3 Besole (Chydenanthus ecelcus)
817,378.78 9,073,168.06 25.00 15.00
22 4 Besole (Chydenanthus ecelcus)
817,373.12 9,073,170.35 27.00 11.00
22 5 Pakem (Pangium edule)
817,370.00 9,073,176.07 32.00 19.00
22 6 Besole (Chydenanthus ecelcus)
817,350.05 9,073,189.35 52.00 13.00
22 7 Besole (Chydenanthus ecelcus)
817,348.94 9,073,201.15 27.00 16.00
22 8 Besole (Chydenanthus ecelcus)
817,356.24 9,073,208.28 30.00 15.00
22 9 Glintungan (Bischofia javanica)
817,343.52 9,073,211.34 200.00 40.00
22 10 Besole (Chydenanthus ecelcus)
817,342.93 9,073,208.58 27.00 13.00
22 11 Besole (Chydenanthus ecelcus)
817,350.82 9,073,218.47 22.00 16.00
22 12 Bangsal 817,349.29 9,073,218.07 20.00 13.00
22 13 Sentul (Sondaricum koetjapi)
817,339.56 9,073,216.52 33.00 20.00
22 14 Besole (Chydenanthus ecelcus)
817,338.54 9,073,223.61 22.00 14.00
22 15 Besole (Chydenanthus ecelcus)
817,330.36 9,073,224.26 20.00 14.00
22 16 Besole (Chydenanthus ecelcus)
817,326.44 9,073,233.04 35.00 19.00
22 17 Pakem (Pangium edule)
817,331.62 9,073,237.00 34.00 30.00
22 18 Besole (Chydenanthus ecelcus)
817,322.55 9,073,243.63 39.00 16.00
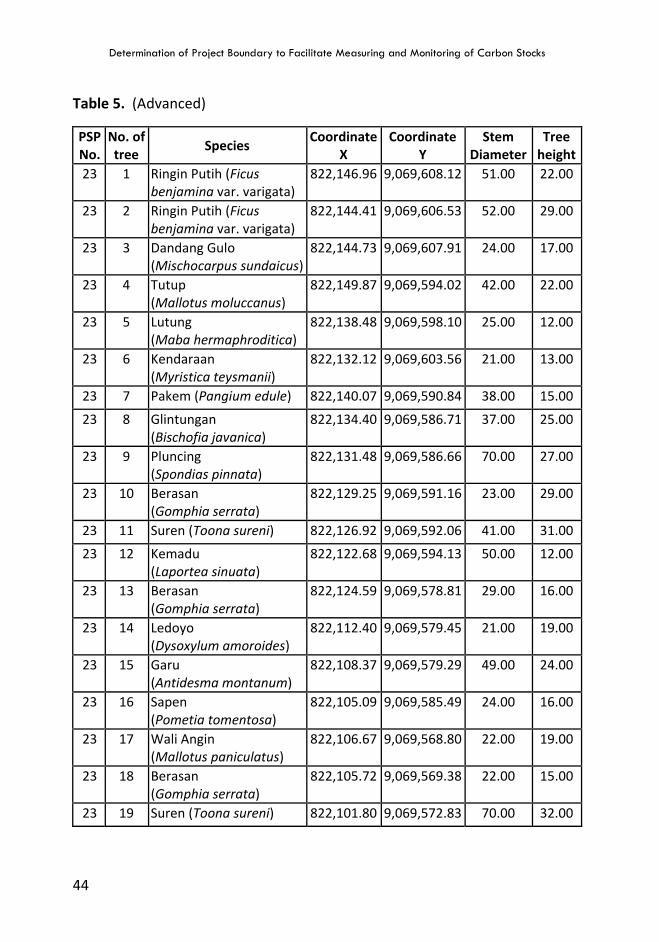
Determination of Project Boundary to Facilitate Measuring and Monitoring of Carbon Stocks
44
Table 5. (Advanced)
PSP No.
No. of tree
Species Coordinate
X Coordinate
Y Stem
Diameter Tree
height 23 1 Ringin Putih (Ficus
benjamina var. varigata) 822,146.96 9,069,608.12 51.00 22.00
23 2 Ringin Putih (Ficus benjamina var. varigata)
822,144.41 9,069,606.53 52.00 29.00
23 3 Dandang Gulo (Mischocarpus sundaicus)
822,144.73 9,069,607.91 24.00 17.00
23 4 Tutup (Mallotus moluccanus)
822,149.87 9,069,594.02 42.00 22.00
23 5 Lutung (Maba hermaphroditica)
822,138.48 9,069,598.10 25.00 12.00
23 6 Kendaraan (Myristica teysmanii)
822,132.12 9,069,603.56 21.00 13.00
23 7 Pakem (Pangium edule) 822,140.07 9,069,590.84 38.00 15.00
23 8 Glintungan (Bischofia javanica)
822,134.40 9,069,586.71 37.00 25.00
23 9 Pluncing (Spondias pinnata)
822,131.48 9,069,586.66 70.00 27.00
23 10 Berasan (Gomphia serrata)
822,129.25 9,069,591.16 23.00 29.00
23 11 Suren (Toona sureni) 822,126.92 9,069,592.06 41.00 31.00
23 12 Kemadu (Laportea sinuata)
822,122.68 9,069,594.13 50.00 12.00
23 13 Berasan (Gomphia serrata)
822,124.59 9,069,578.81 29.00 16.00
23 14 Ledoyo (Dysoxylum amoroides)
822,112.40 9,069,579.45 21.00 19.00
23 15 Garu (Antidesma montanum)
822,108.37 9,069,579.29 49.00 24.00
23 16 Sapen (Pometia tomentosa)
822,105.09 9,069,585.49 24.00 16.00
23 17 Wali Angin (Mallotus paniculatus)
822,106.67 9,069,568.80 22.00 19.00
23 18 Berasan (Gomphia serrata)
822,105.72 9,069,569.38 22.00 15.00
23 19 Suren (Toona sureni) 822,101.80 9,069,572.83 70.00 32.00
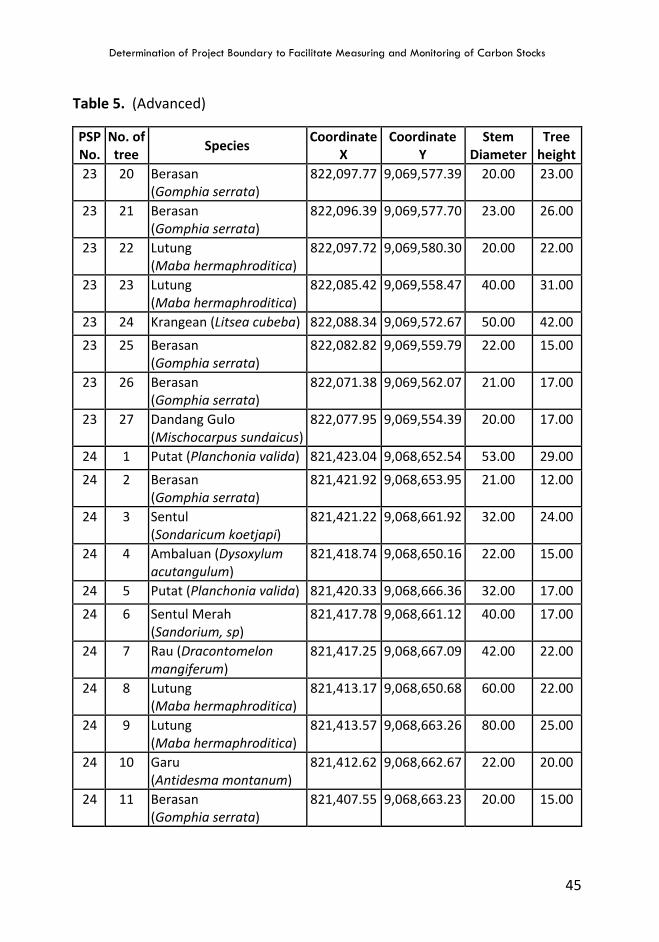
Determination of Project Boundary to Facilitate Measuring and Monitoring of Carbon Stocks
45
Table 5. (Advanced)
PSP No.
No. of tree
Species Coordinate
X Coordinate
Y Stem
Diameter Tree
height 23 20 Berasan
(Gomphia serrata) 822,097.77 9,069,577.39 20.00 23.00
23 21 Berasan (Gomphia serrata)
822,096.39 9,069,577.70 23.00 26.00
23 22 Lutung (Maba hermaphroditica)
822,097.72 9,069,580.30 20.00 22.00
23 23 Lutung (Maba hermaphroditica)
822,085.42 9,069,558.47 40.00 31.00
23 24 Krangean (Litsea cubeba) 822,088.34 9,069,572.67 50.00 42.00
23 25 Berasan (Gomphia serrata)
822,082.82 9,069,559.79 22.00 15.00
23 26 Berasan (Gomphia serrata)
822,071.38 9,069,562.07 21.00 17.00
23 27 Dandang Gulo (Mischocarpus sundaicus)
822,077.95 9,069,554.39 20.00 17.00
24 1 Putat (Planchonia valida) 821,423.04 9,068,652.54 53.00 29.00
24 2 Berasan (Gomphia serrata)
821,421.92 9,068,653.95 21.00 12.00
24 3 Sentul (Sondaricum koetjapi)
821,421.22 9,068,661.92 32.00 24.00
24 4 Ambaluan (Dysoxylum acutangulum)
821,418.74 9,068,650.16 22.00 15.00
24 5 Putat (Planchonia valida) 821,420.33 9,068,666.36 32.00 17.00
24 6 Sentul Merah (Sandorium, sp)
821,417.78 9,068,661.12 40.00 17.00
24 7 Rau (Dracontomelon mangiferum)
821,417.25 9,068,667.09 42.00 22.00
24 8 Lutung (Maba hermaphroditica)
821,413.17 9,068,650.68 60.00 22.00
24 9 Lutung (Maba hermaphroditica)
821,413.57 9,068,663.26 80.00 25.00
24 10 Garu (Antidesma montanum)
821,412.62 9,068,662.67 22.00 20.00
24 11 Berasan (Gomphia serrata)
821,407.55 9,068,663.23 20.00 15.00
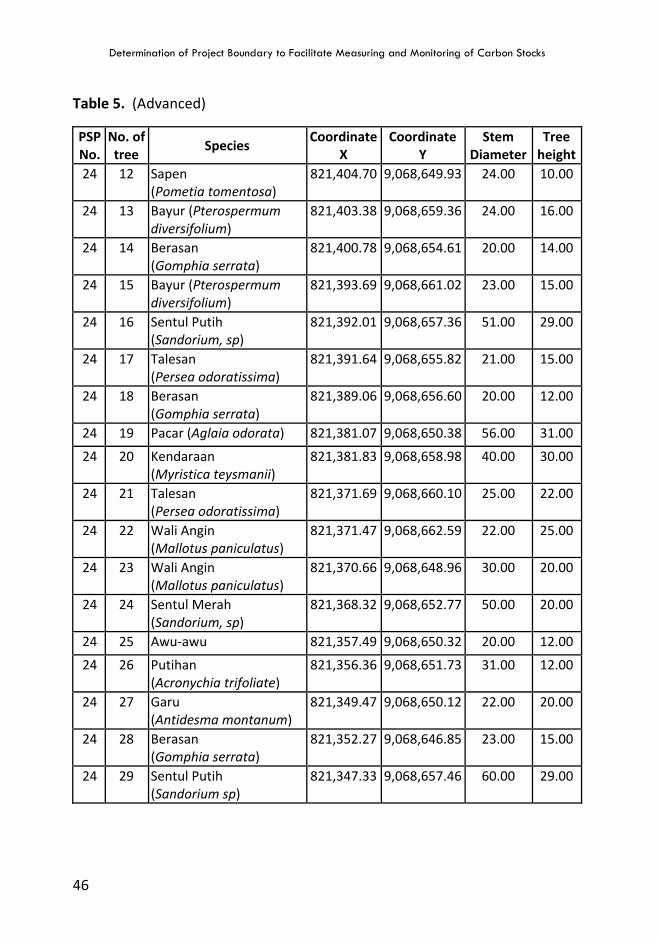
Determination of Project Boundary to Facilitate Measuring and Monitoring of Carbon Stocks
46
Table 5. (Advanced)
PSP No.
No. of tree
Species Coordinate
X Coordinate
Y Stem
Diameter Tree
height 24 12 Sapen
(Pometia tomentosa) 821,404.70 9,068,649.93 24.00 10.00
24 13 Bayur (Pterospermum diversifolium)
821,403.38 9,068,659.36 24.00 16.00
24 14 Berasan (Gomphia serrata)
821,400.78 9,068,654.61 20.00 14.00
24 15 Bayur (Pterospermum diversifolium)
821,393.69 9,068,661.02 23.00 15.00
24 16 Sentul Putih (Sandorium, sp)
821,392.01 9,068,657.36 51.00 29.00
24 17 Talesan (Persea odoratissima)
821,391.64 9,068,655.82 21.00 15.00
24 18 Berasan (Gomphia serrata)
821,389.06 9,068,656.60 20.00 12.00
24 19 Pacar (Aglaia odorata) 821,381.07 9,068,650.38 56.00 31.00
24 20 Kendaraan (Myristica teysmanii)
821,381.83 9,068,658.98 40.00 30.00
24 21 Talesan (Persea odoratissima)
821,371.69 9,068,660.10 25.00 22.00
24 22 Wali Angin (Mallotus paniculatus)
821,371.47 9,068,662.59 22.00 25.00
24 23 Wali Angin (Mallotus paniculatus)
821,370.66 9,068,648.96 30.00 20.00
24 24 Sentul Merah (Sandorium, sp)
821,368.32 9,068,652.77 50.00 20.00
24 25 Awu-awu 821,357.49 9,068,650.32 20.00 12.00
24 26 Putihan (Acronychia trifoliate)
821,356.36 9,068,651.73 31.00 12.00
24 27 Garu (Antidesma montanum)
821,349.47 9,068,650.12 22.00 20.00
24 28 Berasan (Gomphia serrata)
821,352.27 9,068,646.85 23.00 15.00
24 29 Sentul Putih (Sandorium sp)
821,347.33 9,068,657.46 60.00 29.00
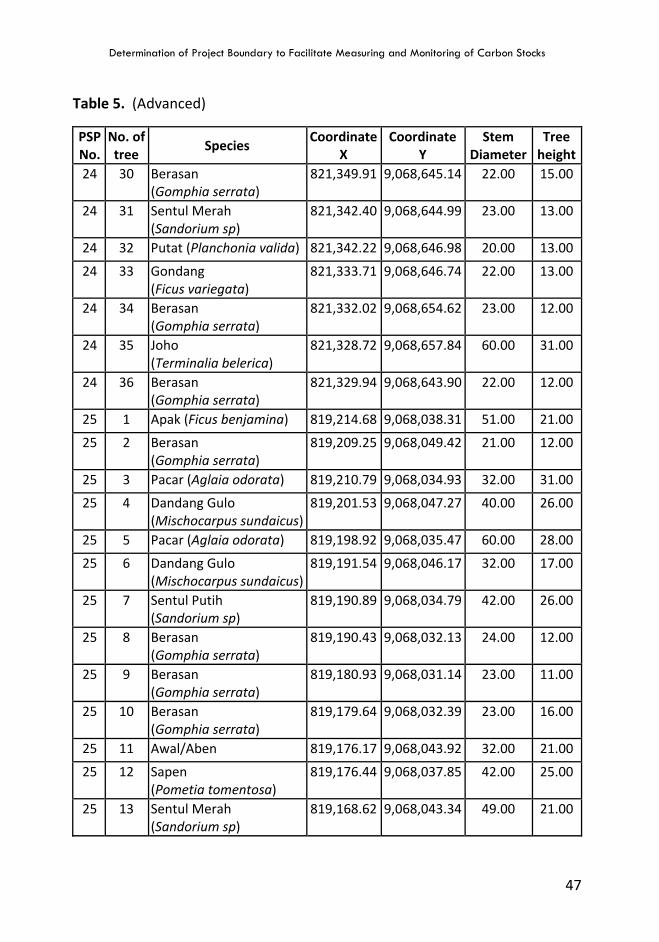
Determination of Project Boundary to Facilitate Measuring and Monitoring of Carbon Stocks
47
Table 5. (Advanced)
PSP No.
No. of tree
Species Coordinate
X Coordinate
Y Stem
Diameter Tree
height 24 30 Berasan
(Gomphia serrata) 821,349.91 9,068,645.14 22.00 15.00
24 31 Sentul Merah (Sandorium sp)
821,342.40 9,068,644.99 23.00 13.00
24 32 Putat (Planchonia valida) 821,342.22 9,068,646.98 20.00 13.00
24 33 Gondang (Ficus variegata)
821,333.71 9,068,646.74 22.00 13.00
24 34 Berasan (Gomphia serrata)
821,332.02 9,068,654.62 23.00 12.00
24 35 Joho (Terminalia belerica)
821,328.72 9,068,657.84 60.00 31.00
24 36 Berasan (Gomphia serrata)
821,329.94 9,068,643.90 22.00 12.00
25 1 Apak (Ficus benjamina) 819,214.68 9,068,038.31 51.00 21.00
25 2 Berasan (Gomphia serrata)
819,209.25 9,068,049.42 21.00 12.00
25 3 Pacar (Aglaia odorata) 819,210.79 9,068,034.93 32.00 31.00
25 4 Dandang Gulo (Mischocarpus sundaicus)
819,201.53 9,068,047.27 40.00 26.00
25 5 Pacar (Aglaia odorata) 819,198.92 9,068,035.47 60.00 28.00
25 6 Dandang Gulo (Mischocarpus sundaicus)
819,191.54 9,068,046.17 32.00 17.00
25 7 Sentul Putih (Sandorium sp)
819,190.89 9,068,034.79 42.00 26.00
25 8 Berasan (Gomphia serrata)
819,190.43 9,068,032.13 24.00 12.00
25 9 Berasan (Gomphia serrata)
819,180.93 9,068,031.14 23.00 11.00
25 10 Berasan (Gomphia serrata)
819,179.64 9,068,032.39 23.00 16.00
25 11 Awal/Aben 819,176.17 9,068,043.92 32.00 21.00
25 12 Sapen (Pometia tomentosa)
819,176.44 9,068,037.85 42.00 25.00
25 13 Sentul Merah (Sandorium sp)
819,168.62 9,068,043.34 49.00 21.00
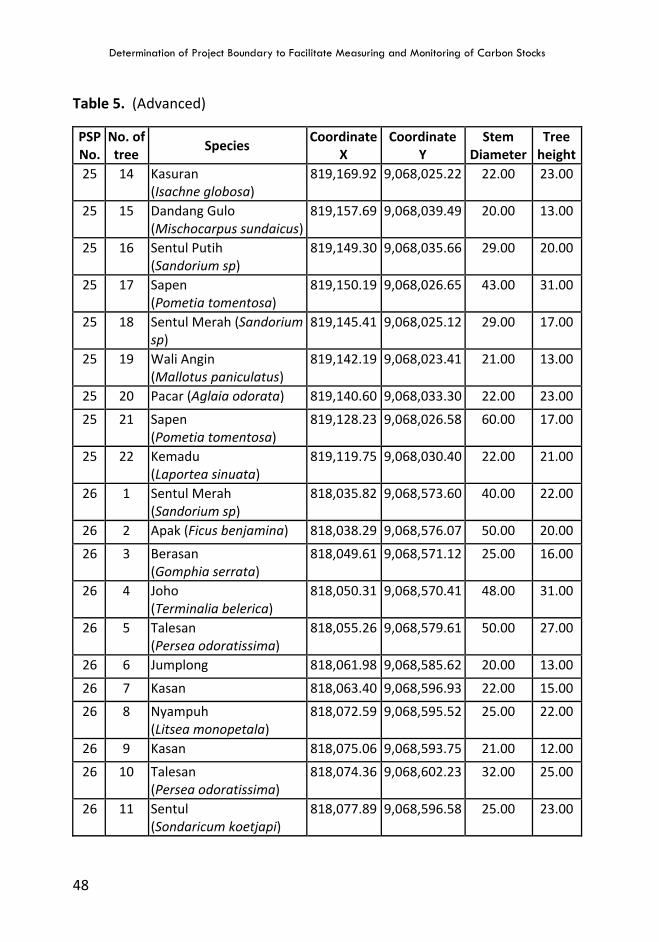
Determination of Project Boundary to Facilitate Measuring and Monitoring of Carbon Stocks
48
Table 5. (Advanced)
PSP No.
No. of tree
Species Coordinate
X Coordinate
Y Stem
Diameter Tree
height 25 14 Kasuran
(Isachne globosa) 819,169.92 9,068,025.22 22.00 23.00
25 15 Dandang Gulo (Mischocarpus sundaicus)
819,157.69 9,068,039.49 20.00 13.00
25 16 Sentul Putih (Sandorium sp)
819,149.30 9,068,035.66 29.00 20.00
25 17 Sapen (Pometia tomentosa)
819,150.19 9,068,026.65 43.00 31.00
25 18 Sentul Merah (Sandorium sp)
819,145.41 9,068,025.12 29.00 17.00
25 19 Wali Angin (Mallotus paniculatus)
819,142.19 9,068,023.41 21.00 13.00
25 20 Pacar (Aglaia odorata) 819,140.60 9,068,033.30 22.00 23.00
25 21 Sapen (Pometia tomentosa)
819,128.23 9,068,026.58 60.00 17.00
25 22 Kemadu (Laportea sinuata)
819,119.75 9,068,030.40 22.00 21.00
26 1 Sentul Merah (Sandorium sp)
818,035.82 9,068,573.60 40.00 22.00
26 2 Apak (Ficus benjamina) 818,038.29 9,068,576.07 50.00 20.00
26 3 Berasan (Gomphia serrata)
818,049.61 9,068,571.12 25.00 16.00
26 4 Joho (Terminalia belerica)
818,050.31 9,068,570.41 48.00 31.00
26 5 Talesan (Persea odoratissima)
818,055.26 9,068,579.61 50.00 27.00
26 6 Jumplong 818,061.98 9,068,585.62 20.00 13.00
26 7 Kasan 818,063.40 9,068,596.93 22.00 15.00
26 8 Nyampuh (Litsea monopetala)
818,072.59 9,068,595.52 25.00 22.00
26 9 Kasan 818,075.06 9,068,593.75 21.00 12.00
26 10 Talesan (Persea odoratissima)
818,074.36 9,068,602.23 32.00 25.00
26 11 Sentul (Sondaricum koetjapi)
818,077.89 9,068,596.58 25.00 23.00
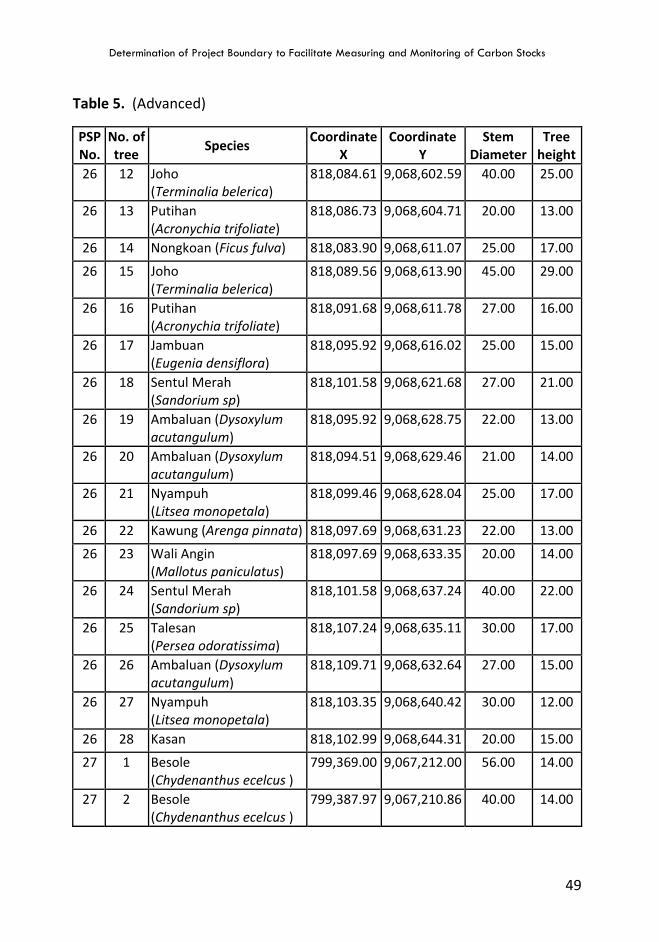
Determination of Project Boundary to Facilitate Measuring and Monitoring of Carbon Stocks
49
Table 5. (Advanced)
PSP No.
No. of tree
Species Coordinate
X Coordinate
Y Stem
Diameter Tree
height 26 12 Joho
(Terminalia belerica) 818,084.61 9,068,602.59 40.00 25.00
26 13 Putihan (Acronychia trifoliate)
818,086.73 9,068,604.71 20.00 13.00
26 14 Nongkoan (Ficus fulva) 818,083.90 9,068,611.07 25.00 17.00
26 15 Joho (Terminalia belerica)
818,089.56 9,068,613.90 45.00 29.00
26 16 Putihan (Acronychia trifoliate)
818,091.68 9,068,611.78 27.00 16.00
26 17 Jambuan (Eugenia densiflora)
818,095.92 9,068,616.02 25.00 15.00
26 18 Sentul Merah (Sandorium sp)
818,101.58 9,068,621.68 27.00 21.00
26 19 Ambaluan (Dysoxylum acutangulum)
818,095.92 9,068,628.75 22.00 13.00
26 20 Ambaluan (Dysoxylum acutangulum)
818,094.51 9,068,629.46 21.00 14.00
26 21 Nyampuh (Litsea monopetala)
818,099.46 9,068,628.04 25.00 17.00
26 22 Kawung (Arenga pinnata) 818,097.69 9,068,631.23 22.00 13.00
26 23 Wali Angin (Mallotus paniculatus)
818,097.69 9,068,633.35 20.00 14.00
26 24 Sentul Merah (Sandorium sp)
818,101.58 9,068,637.24 40.00 22.00
26 25 Talesan (Persea odoratissima)
818,107.24 9,068,635.11 30.00 17.00
26 26 Ambaluan (Dysoxylum acutangulum)
818,109.71 9,068,632.64 27.00 15.00
26 27 Nyampuh (Litsea monopetala)
818,103.35 9,068,640.42 30.00 12.00
26 28 Kasan 818,102.99 9,068,644.31 20.00 15.00
27 1 Besole (Chydenanthus ecelcus )
799,369.00 9,067,212.00 56.00 14.00
27 2 Besole (Chydenanthus ecelcus )
799,387.97 9,067,210.86 40.00 14.00
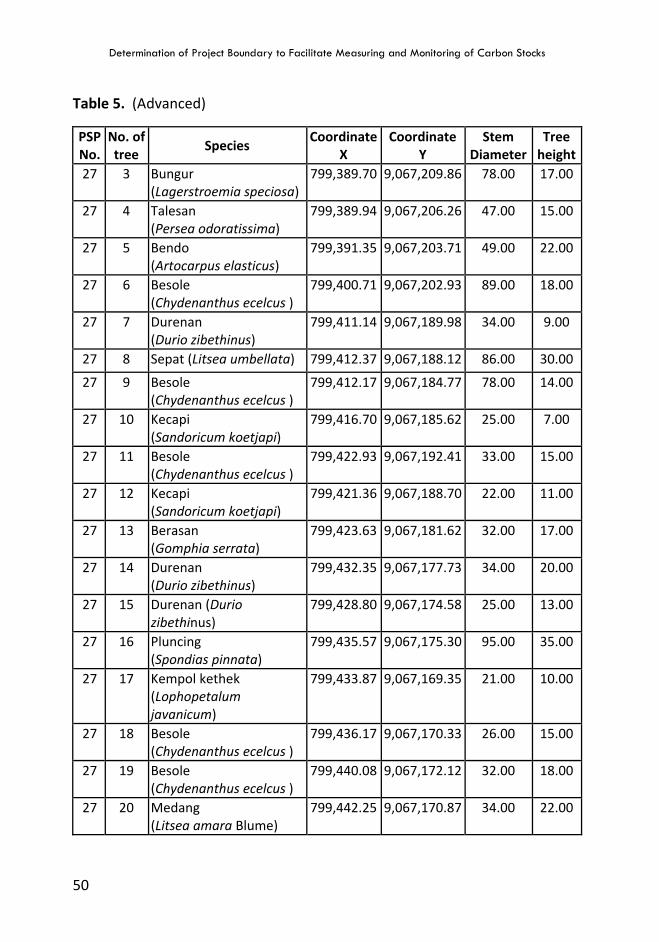
Determination of Project Boundary to Facilitate Measuring and Monitoring of Carbon Stocks
50
Table 5. (Advanced)
PSP No.
No. of tree
Species Coordinate
X Coordinate
Y Stem
Diameter Tree
height 27 3 Bungur
(Lagerstroemia speciosa)799,389.70 9,067,209.86 78.00 17.00
27 4 Talesan (Persea odoratissima)
799,389.94 9,067,206.26 47.00 15.00
27 5 Bendo (Artocarpus elasticus)
799,391.35 9,067,203.71 49.00 22.00
27 6 Besole (Chydenanthus ecelcus )
799,400.71 9,067,202.93 89.00 18.00
27 7 Durenan (Durio zibethinus)
799,411.14 9,067,189.98 34.00 9.00
27 8 Sepat (Litsea umbellata) 799,412.37 9,067,188.12 86.00 30.00
27 9 Besole (Chydenanthus ecelcus )
799,412.17 9,067,184.77 78.00 14.00
27 10 Kecapi (Sandoricum koetjapi)
799,416.70 9,067,185.62 25.00 7.00
27 11 Besole (Chydenanthus ecelcus )
799,422.93 9,067,192.41 33.00 15.00
27 12 Kecapi (Sandoricum koetjapi)
799,421.36 9,067,188.70 22.00 11.00
27 13 Berasan (Gomphia serrata)
799,423.63 9,067,181.62 32.00 17.00
27 14 Durenan (Durio zibethinus)
799,432.35 9,067,177.73 34.00 20.00
27 15 Durenan (Durio zibethinus)
799,428.80 9,067,174.58 25.00 13.00
27 16 Pluncing (Spondias pinnata)
799,435.57 9,067,175.30 95.00 35.00
27 17 Kempol kethek (Lophopetalum javanicum)
799,433.87 9,067,169.35 21.00 10.00
27 18 Besole (Chydenanthus ecelcus )
799,436.17 9,067,170.33 26.00 15.00
27 19 Besole (Chydenanthus ecelcus )
799,440.08 9,067,172.12 32.00 18.00
27 20 Medang (Litsea amara Blume)
799,442.25 9,067,170.87 34.00 22.00
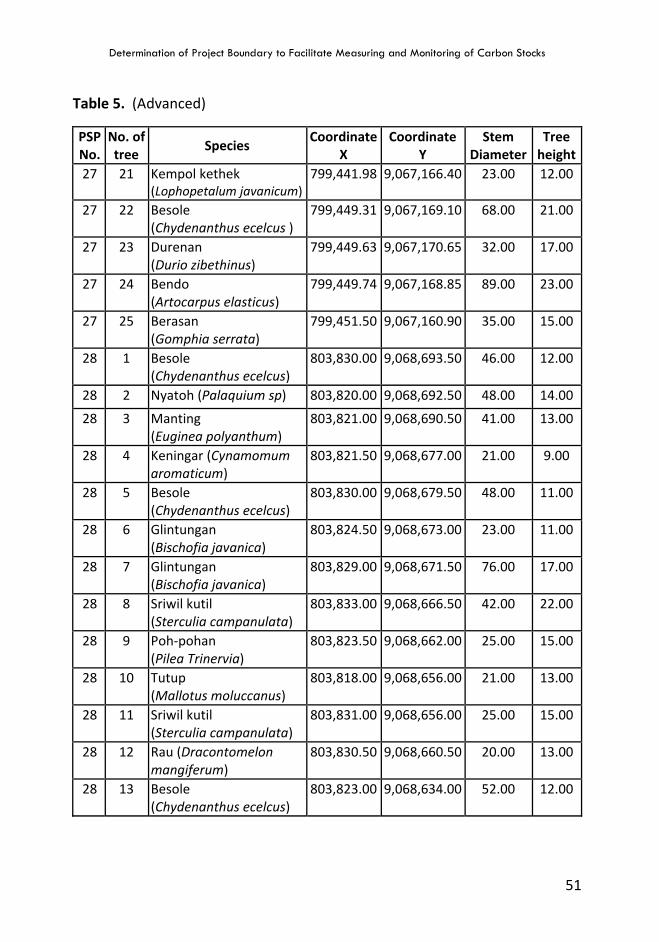
Determination of Project Boundary to Facilitate Measuring and Monitoring of Carbon Stocks
51
Table 5. (Advanced)
PSP No.
No. of tree
Species Coordinate
X Coordinate
Y Stem
Diameter Tree
height 27 21 Kempol kethek
(Lophopetalum javanicum)799,441.98 9,067,166.40 23.00 12.00
27 22 Besole (Chydenanthus ecelcus )
799,449.31 9,067,169.10 68.00 21.00
27 23 Durenan (Durio zibethinus)
799,449.63 9,067,170.65 32.00 17.00
27 24 Bendo (Artocarpus elasticus)
799,449.74 9,067,168.85 89.00 23.00
27 25 Berasan (Gomphia serrata)
799,451.50 9,067,160.90 35.00 15.00
28 1 Besole (Chydenanthus ecelcus)
803,830.00 9,068,693.50 46.00 12.00
28 2 Nyatoh (Palaquium sp) 803,820.00 9,068,692.50 48.00 14.00
28 3 Manting (Euginea polyanthum)
803,821.00 9,068,690.50 41.00 13.00
28 4 Keningar (Cynamomum aromaticum)
803,821.50 9,068,677.00 21.00 9.00
28 5 Besole (Chydenanthus ecelcus)
803,830.00 9,068,679.50 48.00 11.00
28 6 Glintungan (Bischofia javanica)
803,824.50 9,068,673.00 23.00 11.00
28 7 Glintungan (Bischofia javanica)
803,829.00 9,068,671.50 76.00 17.00
28 8 Sriwil kutil (Sterculia campanulata)
803,833.00 9,068,666.50 42.00 22.00
28 9 Poh-pohan (Pilea Trinervia)
803,823.50 9,068,662.00 25.00 15.00
28 10 Tutup (Mallotus moluccanus)
803,818.00 9,068,656.00 21.00 13.00
28 11 Sriwil kutil (Sterculia campanulata)
803,831.00 9,068,656.00 25.00 15.00
28 12 Rau (Dracontomelon mangiferum)
803,830.50 9,068,660.50 20.00 13.00
28 13 Besole (Chydenanthus ecelcus)
803,823.00 9,068,634.00 52.00 12.00
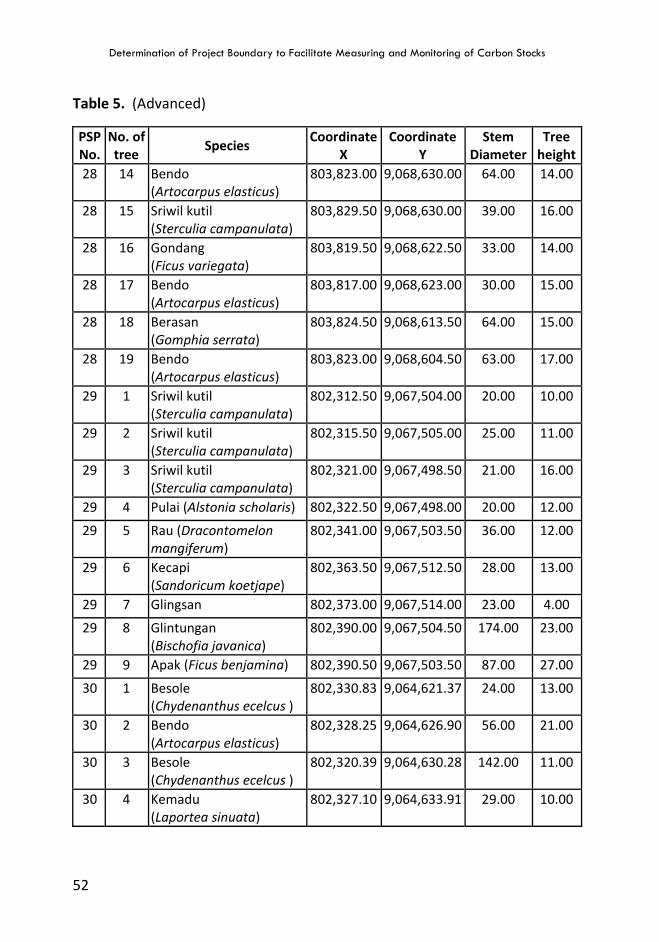
Determination of Project Boundary to Facilitate Measuring and Monitoring of Carbon Stocks
52
Table 5. (Advanced)
PSP No.
No. of tree
Species Coordinate
X Coordinate
Y Stem
Diameter Tree
height 28 14 Bendo
(Artocarpus elasticus) 803,823.00 9,068,630.00 64.00 14.00
28 15 Sriwil kutil (Sterculia campanulata)
803,829.50 9,068,630.00 39.00 16.00
28 16 Gondang (Ficus variegata)
803,819.50 9,068,622.50 33.00 14.00
28 17 Bendo (Artocarpus elasticus)
803,817.00 9,068,623.00 30.00 15.00
28 18 Berasan (Gomphia serrata)
803,824.50 9,068,613.50 64.00 15.00
28 19 Bendo (Artocarpus elasticus)
803,823.00 9,068,604.50 63.00 17.00
29 1 Sriwil kutil (Sterculia campanulata)
802,312.50 9,067,504.00 20.00 10.00
29 2 Sriwil kutil (Sterculia campanulata)
802,315.50 9,067,505.00 25.00 11.00
29 3 Sriwil kutil (Sterculia campanulata)
802,321.00 9,067,498.50 21.00 16.00
29 4 Pulai (Alstonia scholaris) 802,322.50 9,067,498.00 20.00 12.00
29 5 Rau (Dracontomelon mangiferum)
802,341.00 9,067,503.50 36.00 12.00
29 6 Kecapi (Sandoricum koetjape)
802,363.50 9,067,512.50 28.00 13.00
29 7 Glingsan 802,373.00 9,067,514.00 23.00 4.00
29 8 Glintungan (Bischofia javanica)
802,390.00 9,067,504.50 174.00 23.00
29 9 Apak (Ficus benjamina) 802,390.50 9,067,503.50 87.00 27.00
30 1 Besole (Chydenanthus ecelcus )
802,330.83 9,064,621.37 24.00 13.00
30 2 Bendo (Artocarpus elasticus)
802,328.25 9,064,626.90 56.00 21.00
30 3 Besole (Chydenanthus ecelcus )
802,320.39 9,064,630.28 142.00 11.00
30 4 Kemadu (Laportea sinuata)
802,327.10 9,064,633.91 29.00 10.00
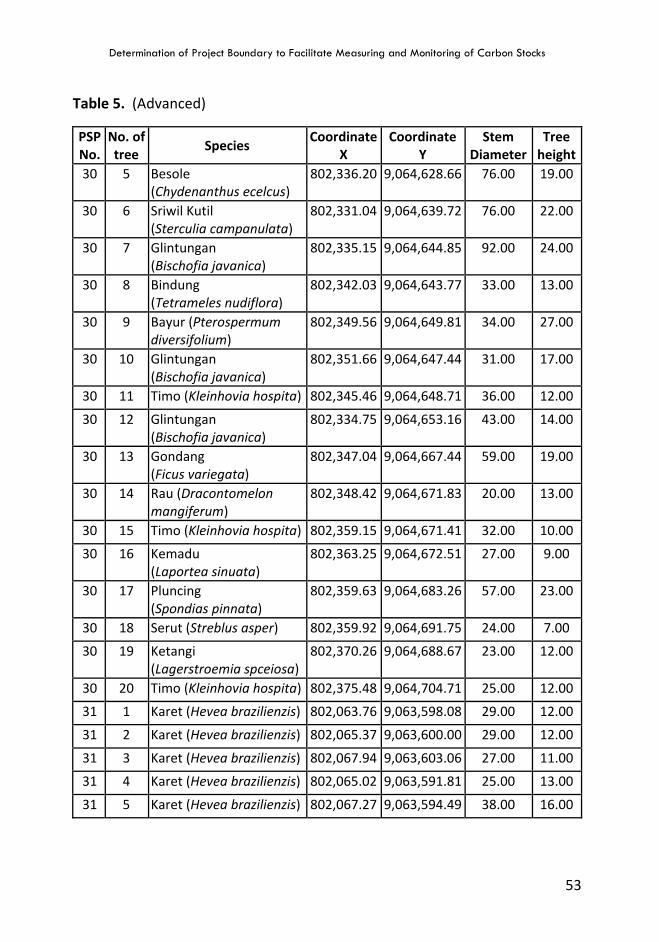
Determination of Project Boundary to Facilitate Measuring and Monitoring of Carbon Stocks
53
Table 5. (Advanced)
PSP No.
No. of tree
Species Coordinate
X Coordinate
Y Stem
Diameter Tree
height 30 5 Besole
(Chydenanthus ecelcus) 802,336.20 9,064,628.66 76.00 19.00
30 6 Sriwil Kutil (Sterculia campanulata)
802,331.04 9,064,639.72 76.00 22.00
30 7 Glintungan (Bischofia javanica)
802,335.15 9,064,644.85 92.00 24.00
30 8 Bindung (Tetrameles nudiflora)
802,342.03 9,064,643.77 33.00 13.00
30 9 Bayur (Pterospermum diversifolium)
802,349.56 9,064,649.81 34.00 27.00
30 10 Glintungan (Bischofia javanica)
802,351.66 9,064,647.44 31.00 17.00
30 11 Timo (Kleinhovia hospita) 802,345.46 9,064,648.71 36.00 12.00
30 12 Glintungan (Bischofia javanica)
802,334.75 9,064,653.16 43.00 14.00
30 13 Gondang (Ficus variegata)
802,347.04 9,064,667.44 59.00 19.00
30 14 Rau (Dracontomelon mangiferum)
802,348.42 9,064,671.83 20.00 13.00
30 15 Timo (Kleinhovia hospita) 802,359.15 9,064,671.41 32.00 10.00
30 16 Kemadu (Laportea sinuata)
802,363.25 9,064,672.51 27.00 9.00
30 17 Pluncing (Spondias pinnata)
802,359.63 9,064,683.26 57.00 23.00
30 18 Serut (Streblus asper) 802,359.92 9,064,691.75 24.00 7.00
30 19 Ketangi (Lagerstroemia spceiosa)
802,370.26 9,064,688.67 23.00 12.00
30 20 Timo (Kleinhovia hospita) 802,375.48 9,064,704.71 25.00 12.00
31 1 Karet (Hevea brazilienzis) 802,063.76 9,063,598.08 29.00 12.00
31 2 Karet (Hevea brazilienzis) 802,065.37 9,063,600.00 29.00 12.00
31 3 Karet (Hevea brazilienzis) 802,067.94 9,063,603.06 27.00 11.00
31 4 Karet (Hevea brazilienzis) 802,065.02 9,063,591.81 25.00 13.00
31 5 Karet (Hevea brazilienzis) 802,067.27 9,063,594.49 38.00 16.00
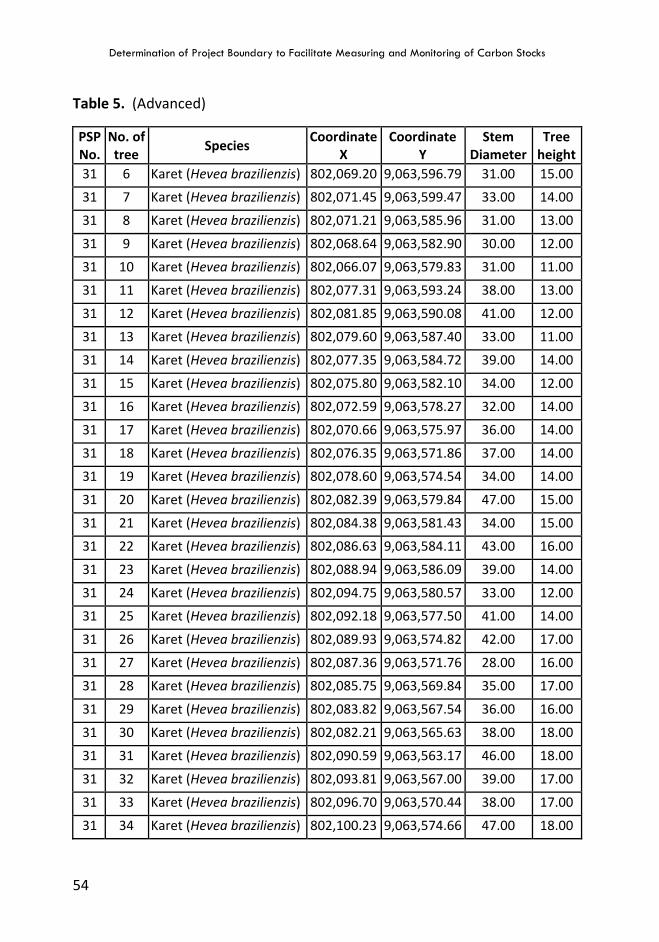
Determination of Project Boundary to Facilitate Measuring and Monitoring of Carbon Stocks
54
Table 5. (Advanced)
PSP No.
No. of tree
Species Coordinate
X Coordinate
Y Stem
Diameter Tree
height 31 6 Karet (Hevea brazilienzis) 802,069.20 9,063,596.79 31.00 15.00
31 7 Karet (Hevea brazilienzis) 802,071.45 9,063,599.47 33.00 14.00
31 8 Karet (Hevea brazilienzis) 802,071.21 9,063,585.96 31.00 13.00
31 9 Karet (Hevea brazilienzis) 802,068.64 9,063,582.90 30.00 12.00
31 10 Karet (Hevea brazilienzis) 802,066.07 9,063,579.83 31.00 11.00
31 11 Karet (Hevea brazilienzis) 802,077.31 9,063,593.24 38.00 13.00
31 12 Karet (Hevea brazilienzis) 802,081.85 9,063,590.08 41.00 12.00
31 13 Karet (Hevea brazilienzis) 802,079.60 9,063,587.40 33.00 11.00
31 14 Karet (Hevea brazilienzis) 802,077.35 9,063,584.72 39.00 14.00
31 15 Karet (Hevea brazilienzis) 802,075.80 9,063,582.10 34.00 12.00
31 16 Karet (Hevea brazilienzis) 802,072.59 9,063,578.27 32.00 14.00
31 17 Karet (Hevea brazilienzis) 802,070.66 9,063,575.97 36.00 14.00
31 18 Karet (Hevea brazilienzis) 802,076.35 9,063,571.86 37.00 14.00
31 19 Karet (Hevea brazilienzis) 802,078.60 9,063,574.54 34.00 14.00
31 20 Karet (Hevea brazilienzis) 802,082.39 9,063,579.84 47.00 15.00
31 21 Karet (Hevea brazilienzis) 802,084.38 9,063,581.43 34.00 15.00
31 22 Karet (Hevea brazilienzis) 802,086.63 9,063,584.11 43.00 16.00
31 23 Karet (Hevea brazilienzis) 802,088.94 9,063,586.09 39.00 14.00
31 24 Karet (Hevea brazilienzis) 802,094.75 9,063,580.57 33.00 12.00
31 25 Karet (Hevea brazilienzis) 802,092.18 9,063,577.50 41.00 14.00
31 26 Karet (Hevea brazilienzis) 802,089.93 9,063,574.82 42.00 17.00
31 27 Karet (Hevea brazilienzis) 802,087.36 9,063,571.76 28.00 16.00
31 28 Karet (Hevea brazilienzis) 802,085.75 9,063,569.84 35.00 17.00
31 29 Karet (Hevea brazilienzis) 802,083.82 9,063,567.54 36.00 16.00
31 30 Karet (Hevea brazilienzis) 802,082.21 9,063,565.63 38.00 18.00
31 31 Karet (Hevea brazilienzis) 802,090.59 9,063,563.17 46.00 18.00
31 32 Karet (Hevea brazilienzis) 802,093.81 9,063,567.00 39.00 17.00
31 33 Karet (Hevea brazilienzis) 802,096.70 9,063,570.44 38.00 17.00
31 34 Karet (Hevea brazilienzis) 802,100.23 9,063,574.66 47.00 18.00
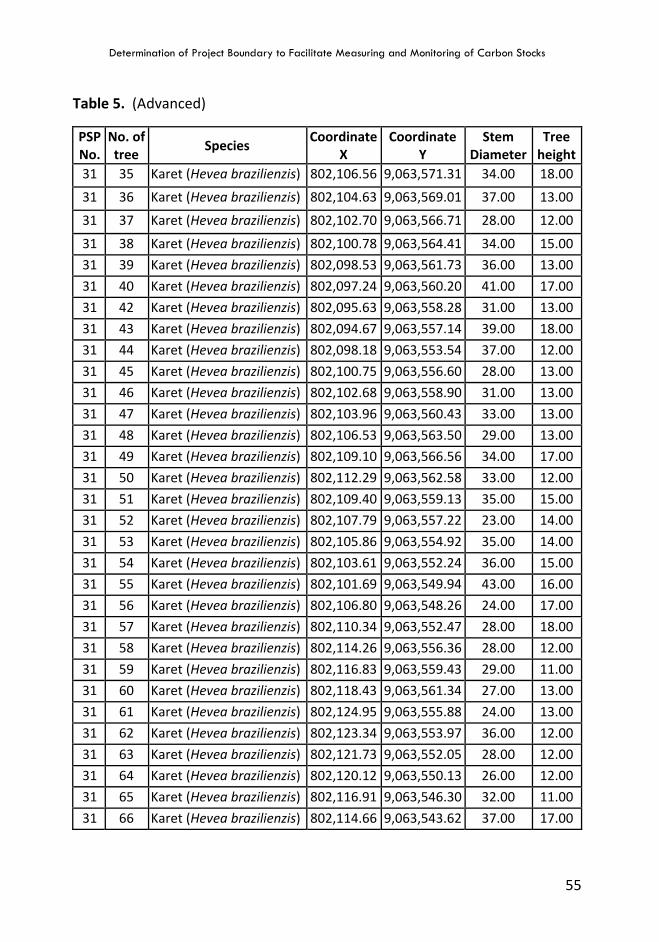
Determination of Project Boundary to Facilitate Measuring and Monitoring of Carbon Stocks
55
Table 5. (Advanced)
PSP No.
No. of tree
Species Coordinate
X Coordinate
Y Stem
Diameter Tree
height 31 35 Karet (Hevea brazilienzis) 802,106.56 9,063,571.31 34.00 18.00
31 36 Karet (Hevea brazilienzis) 802,104.63 9,063,569.01 37.00 13.00
31 37 Karet (Hevea brazilienzis) 802,102.70 9,063,566.71 28.00 12.00
31 38 Karet (Hevea brazilienzis) 802,100.78 9,063,564.41 34.00 15.00
31 39 Karet (Hevea brazilienzis) 802,098.53 9,063,561.73 36.00 13.00
31 40 Karet (Hevea brazilienzis) 802,097.24 9,063,560.20 41.00 17.00
31 42 Karet (Hevea brazilienzis) 802,095.63 9,063,558.28 31.00 13.00
31 43 Karet (Hevea brazilienzis) 802,094.67 9,063,557.14 39.00 18.00
31 44 Karet (Hevea brazilienzis) 802,098.18 9,063,553.54 37.00 12.00
31 45 Karet (Hevea brazilienzis) 802,100.75 9,063,556.60 28.00 13.00
31 46 Karet (Hevea brazilienzis) 802,102.68 9,063,558.90 31.00 13.00
31 47 Karet (Hevea brazilienzis) 802,103.96 9,063,560.43 33.00 13.00
31 48 Karet (Hevea brazilienzis) 802,106.53 9,063,563.50 29.00 13.00
31 49 Karet (Hevea brazilienzis) 802,109.10 9,063,566.56 34.00 17.00
31 50 Karet (Hevea brazilienzis) 802,112.29 9,063,562.58 33.00 12.00
31 51 Karet (Hevea brazilienzis) 802,109.40 9,063,559.13 35.00 15.00
31 52 Karet (Hevea brazilienzis) 802,107.79 9,063,557.22 23.00 14.00
31 53 Karet (Hevea brazilienzis) 802,105.86 9,063,554.92 35.00 14.00
31 54 Karet (Hevea brazilienzis) 802,103.61 9,063,552.24 36.00 15.00
31 55 Karet (Hevea brazilienzis) 802,101.69 9,063,549.94 43.00 16.00
31 56 Karet (Hevea brazilienzis) 802,106.80 9,063,548.26 24.00 17.00
31 57 Karet (Hevea brazilienzis) 802,110.34 9,063,552.47 28.00 18.00
31 58 Karet (Hevea brazilienzis) 802,114.26 9,063,556.36 28.00 12.00
31 59 Karet (Hevea brazilienzis) 802,116.83 9,063,559.43 29.00 11.00
31 60 Karet (Hevea brazilienzis) 802,118.43 9,063,561.34 27.00 13.00
31 61 Karet (Hevea brazilienzis) 802,124.95 9,063,555.88 24.00 13.00
31 62 Karet (Hevea brazilienzis) 802,123.34 9,063,553.97 36.00 12.00
31 63 Karet (Hevea brazilienzis) 802,121.73 9,063,552.05 28.00 12.00
31 64 Karet (Hevea brazilienzis) 802,120.12 9,063,550.13 26.00 12.00
31 65 Karet (Hevea brazilienzis) 802,116.91 9,063,546.30 32.00 11.00
31 66 Karet (Hevea brazilienzis) 802,114.66 9,063,543.62 37.00 17.00
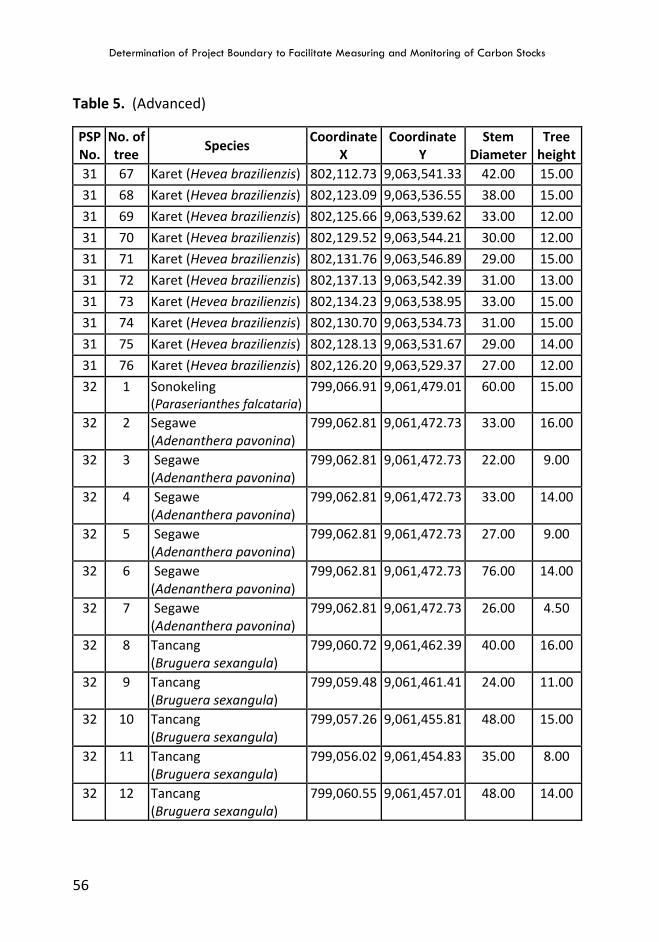
Determination of Project Boundary to Facilitate Measuring and Monitoring of Carbon Stocks
56
Table 5. (Advanced)
PSP No.
No. of tree
Species Coordinate
X Coordinate
Y Stem
Diameter Tree
height 31 67 Karet (Hevea brazilienzis) 802,112.73 9,063,541.33 42.00 15.00
31 68 Karet (Hevea brazilienzis) 802,123.09 9,063,536.55 38.00 15.00
31 69 Karet (Hevea brazilienzis) 802,125.66 9,063,539.62 33.00 12.00
31 70 Karet (Hevea brazilienzis) 802,129.52 9,063,544.21 30.00 12.00
31 71 Karet (Hevea brazilienzis) 802,131.76 9,063,546.89 29.00 15.00
31 72 Karet (Hevea brazilienzis) 802,137.13 9,063,542.39 31.00 13.00
31 73 Karet (Hevea brazilienzis) 802,134.23 9,063,538.95 33.00 15.00
31 74 Karet (Hevea brazilienzis) 802,130.70 9,063,534.73 31.00 15.00
31 75 Karet (Hevea brazilienzis) 802,128.13 9,063,531.67 29.00 14.00
31 76 Karet (Hevea brazilienzis) 802,126.20 9,063,529.37 27.00 12.00
32 1 Sonokeling (Paraserianthes falcataria)
799,066.91 9,061,479.01 60.00 15.00
32 2 Segawe (Adenanthera pavonina)
799,062.81 9,061,472.73 33.00 16.00
32 3 Segawe (Adenanthera pavonina)
799,062.81 9,061,472.73 22.00 9.00
32 4 Segawe (Adenanthera pavonina)
799,062.81 9,061,472.73 33.00 14.00
32 5 Segawe (Adenanthera pavonina)
799,062.81 9,061,472.73 27.00 9.00
32 6 Segawe (Adenanthera pavonina)
799,062.81 9,061,472.73 76.00 14.00
32 7 Segawe (Adenanthera pavonina)
799,062.81 9,061,472.73 26.00 4.50
32 8 Tancang (Bruguera sexangula)
799,060.72 9,061,462.39 40.00 16.00
32 9 Tancang (Bruguera sexangula)
799,059.48 9,061,461.41 24.00 11.00
32 10 Tancang (Bruguera sexangula)
799,057.26 9,061,455.81 48.00 15.00
32 11 Tancang (Bruguera sexangula)
799,056.02 9,061,454.83 35.00 8.00
32 12 Tancang (Bruguera sexangula)
799,060.55 9,061,457.01 48.00 14.00
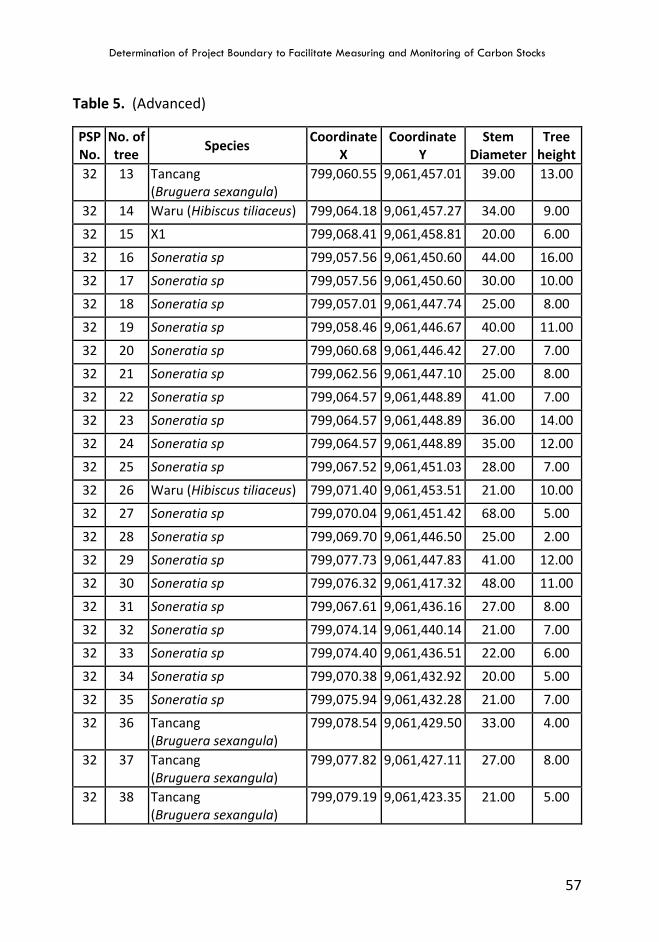
Determination of Project Boundary to Facilitate Measuring and Monitoring of Carbon Stocks
57
Table 5. (Advanced)
PSP No.
No. of tree
Species Coordinate
X Coordinate
Y Stem
Diameter Tree
height 32 13 Tancang
(Bruguera sexangula) 799,060.55 9,061,457.01 39.00 13.00
32 14 Waru (Hibiscus tiliaceus) 799,064.18 9,061,457.27 34.00 9.00
32 15 X1 799,068.41 9,061,458.81 20.00 6.00
32 16 Soneratia sp 799,057.56 9,061,450.60 44.00 16.00
32 17 Soneratia sp 799,057.56 9,061,450.60 30.00 10.00
32 18 Soneratia sp 799,057.01 9,061,447.74 25.00 8.00
32 19 Soneratia sp 799,058.46 9,061,446.67 40.00 11.00
32 20 Soneratia sp 799,060.68 9,061,446.42 27.00 7.00
32 21 Soneratia sp 799,062.56 9,061,447.10 25.00 8.00
32 22 Soneratia sp 799,064.57 9,061,448.89 41.00 7.00
32 23 Soneratia sp 799,064.57 9,061,448.89 36.00 14.00
32 24 Soneratia sp 799,064.57 9,061,448.89 35.00 12.00
32 25 Soneratia sp 799,067.52 9,061,451.03 28.00 7.00
32 26 Waru (Hibiscus tiliaceus) 799,071.40 9,061,453.51 21.00 10.00
32 27 Soneratia sp 799,070.04 9,061,451.42 68.00 5.00
32 28 Soneratia sp 799,069.70 9,061,446.50 25.00 2.00
32 29 Soneratia sp 799,077.73 9,061,447.83 41.00 12.00
32 30 Soneratia sp 799,076.32 9,061,417.32 48.00 11.00
32 31 Soneratia sp 799,067.61 9,061,436.16 27.00 8.00
32 32 Soneratia sp 799,074.14 9,061,440.14 21.00 7.00
32 33 Soneratia sp 799,074.40 9,061,436.51 22.00 6.00
32 34 Soneratia sp 799,070.38 9,061,432.92 20.00 5.00
32 35 Soneratia sp 799,075.94 9,061,432.28 21.00 7.00
32 36 Tancang (Bruguera sexangula)
799,078.54 9,061,429.50 33.00 4.00
32 37 Tancang (Bruguera sexangula)
799,077.82 9,061,427.11 27.00 8.00
32 38 Tancang (Bruguera sexangula)
799,079.19 9,061,423.35 21.00 5.00
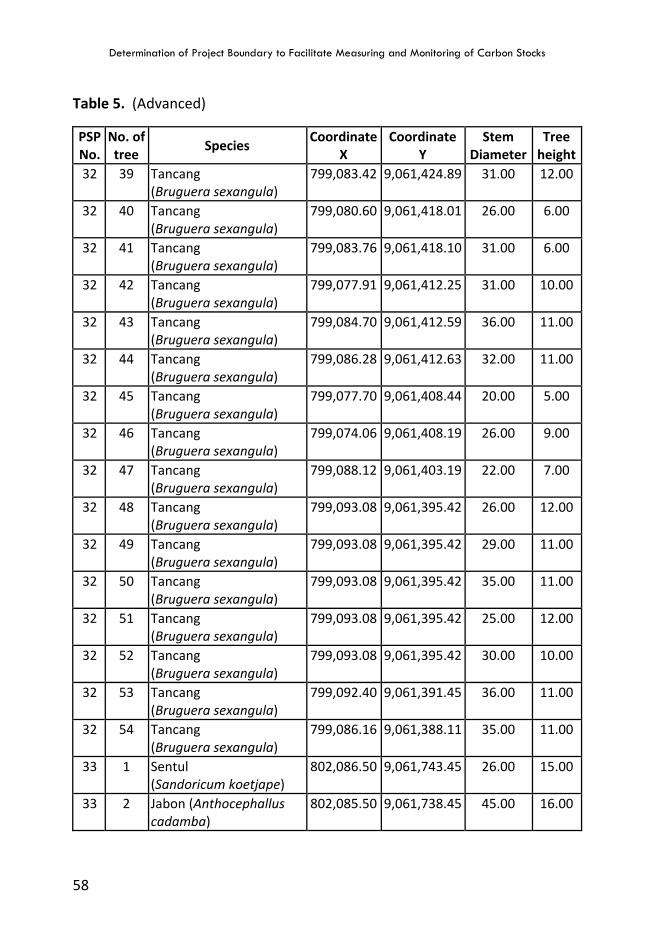
Determination of Project Boundary to Facilitate Measuring and Monitoring of Carbon Stocks
58
Table 5. (Advanced)
PSP No.
No. of tree
Species Coordinate
X Coordinate
Y Stem
Diameter Tree
height 32 39 Tancang
(Bruguera sexangula) 799,083.42 9,061,424.89 31.00 12.00
32 40 Tancang (Bruguera sexangula)
799,080.60 9,061,418.01 26.00 6.00
32 41 Tancang (Bruguera sexangula)
799,083.76 9,061,418.10 31.00 6.00
32 42 Tancang (Bruguera sexangula)
799,077.91 9,061,412.25 31.00 10.00
32 43 Tancang (Bruguera sexangula)
799,084.70 9,061,412.59 36.00 11.00
32 44 Tancang (Bruguera sexangula)
799,086.28 9,061,412.63 32.00 11.00
32 45 Tancang (Bruguera sexangula)
799,077.70 9,061,408.44 20.00 5.00
32 46 Tancang (Bruguera sexangula)
799,074.06 9,061,408.19 26.00 9.00
32 47 Tancang (Bruguera sexangula)
799,088.12 9,061,403.19 22.00 7.00
32 48 Tancang (Bruguera sexangula)
799,093.08 9,061,395.42 26.00 12.00
32 49 Tancang (Bruguera sexangula)
799,093.08 9,061,395.42 29.00 11.00
32 50 Tancang (Bruguera sexangula)
799,093.08 9,061,395.42 35.00 11.00
32 51 Tancang (Bruguera sexangula)
799,093.08 9,061,395.42 25.00 12.00
32 52 Tancang (Bruguera sexangula)
799,093.08 9,061,395.42 30.00 10.00
32 53 Tancang (Bruguera sexangula)
799,092.40 9,061,391.45 36.00 11.00
32 54 Tancang (Bruguera sexangula)
799,086.16 9,061,388.11 35.00 11.00
33 1 Sentul (Sandoricum koetjape)
802,086.50 9,061,743.45 26.00 15.00
33 2 Jabon (Anthocephallus cadamba)
802,085.50 9,061,738.45 45.00 16.00
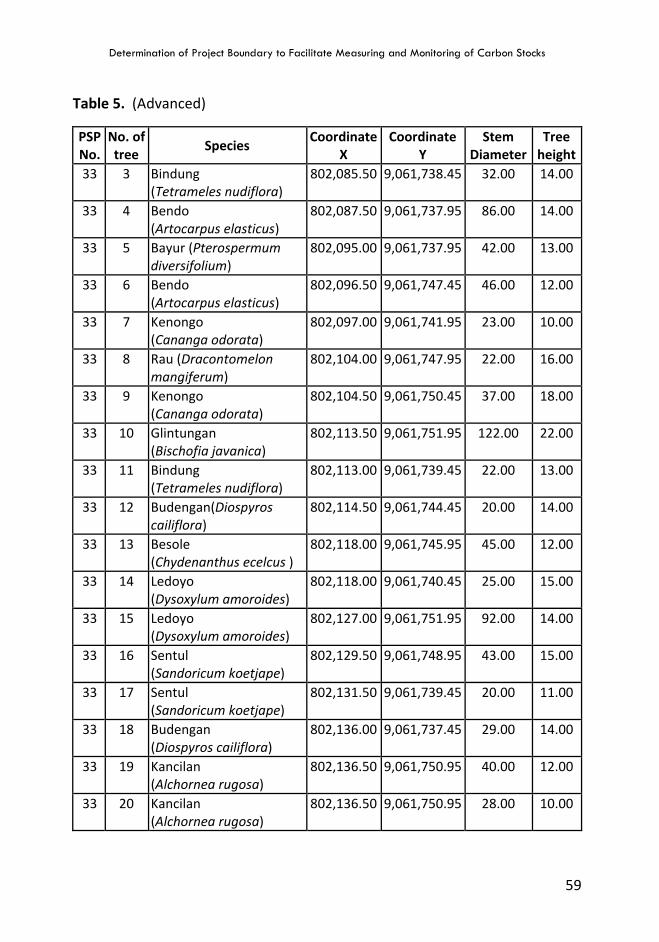
Determination of Project Boundary to Facilitate Measuring and Monitoring of Carbon Stocks
59
Table 5. (Advanced)
PSP No.
No. of tree
Species Coordinate
X Coordinate
Y Stem
Diameter Tree
height 33 3 Bindung
(Tetrameles nudiflora) 802,085.50 9,061,738.45 32.00 14.00
33 4 Bendo (Artocarpus elasticus)
802,087.50 9,061,737.95 86.00 14.00
33 5 Bayur (Pterospermum diversifolium)
802,095.00 9,061,737.95 42.00 13.00
33 6 Bendo (Artocarpus elasticus)
802,096.50 9,061,747.45 46.00 12.00
33 7 Kenongo (Cananga odorata)
802,097.00 9,061,741.95 23.00 10.00
33 8 Rau (Dracontomelon mangiferum)
802,104.00 9,061,747.95 22.00 16.00
33 9 Kenongo (Cananga odorata)
802,104.50 9,061,750.45 37.00 18.00
33 10 Glintungan (Bischofia javanica)
802,113.50 9,061,751.95 122.00 22.00
33 11 Bindung (Tetrameles nudiflora)
802,113.00 9,061,739.45 22.00 13.00
33 12 Budengan(Diospyros cailiflora)
802,114.50 9,061,744.45 20.00 14.00
33 13 Besole (Chydenanthus ecelcus )
802,118.00 9,061,745.95 45.00 12.00
33 14 Ledoyo (Dysoxylum amoroides)
802,118.00 9,061,740.45 25.00 15.00
33 15 Ledoyo (Dysoxylum amoroides)
802,127.00 9,061,751.95 92.00 14.00
33 16 Sentul (Sandoricum koetjape)
802,129.50 9,061,748.95 43.00 15.00
33 17 Sentul (Sandoricum koetjape)
802,131.50 9,061,739.45 20.00 11.00
33 18 Budengan (Diospyros cailiflora)
802,136.00 9,061,737.45 29.00 14.00
33 19 Kancilan (Alchornea rugosa)
802,136.50 9,061,750.95 40.00 12.00
33 20 Kancilan (Alchornea rugosa)
802,136.50 9,061,750.95 28.00 10.00
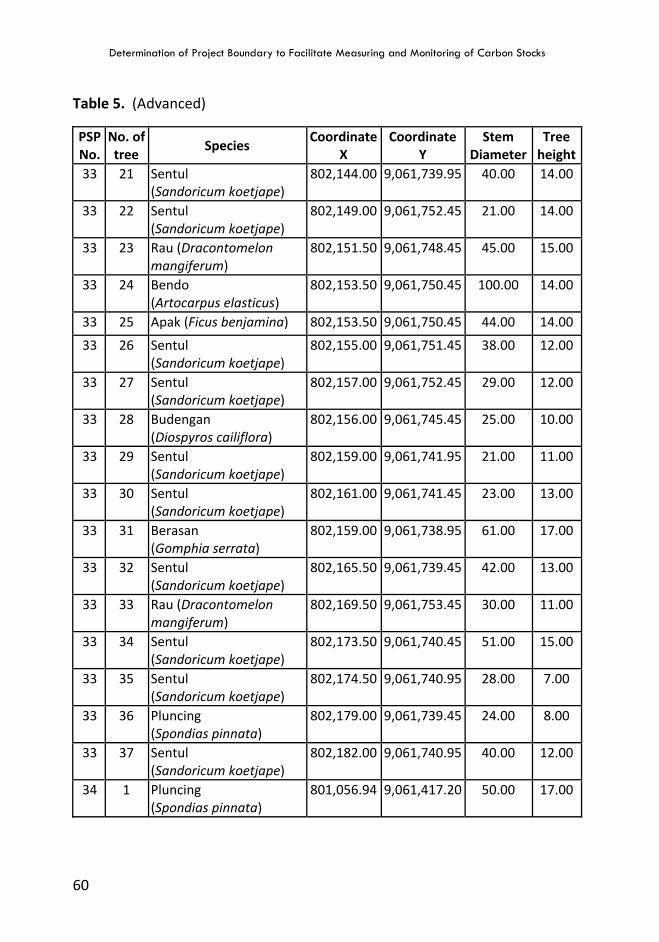
Determination of Project Boundary to Facilitate Measuring and Monitoring of Carbon Stocks
60
Table 5. (Advanced)
PSP No.
No. of tree
Species Coordinate
X Coordinate
Y Stem
Diameter Tree
height 33 21 Sentul
(Sandoricum koetjape) 802,144.00 9,061,739.95 40.00 14.00
33 22 Sentul (Sandoricum koetjape)
802,149.00 9,061,752.45 21.00 14.00
33 23 Rau (Dracontomelon mangiferum)
802,151.50 9,061,748.45 45.00 15.00
33 24 Bendo (Artocarpus elasticus)
802,153.50 9,061,750.45 100.00 14.00
33 25 Apak (Ficus benjamina) 802,153.50 9,061,750.45 44.00 14.00
33 26 Sentul (Sandoricum koetjape)
802,155.00 9,061,751.45 38.00 12.00
33 27 Sentul (Sandoricum koetjape)
802,157.00 9,061,752.45 29.00 12.00
33 28 Budengan (Diospyros cailiflora)
802,156.00 9,061,745.45 25.00 10.00
33 29 Sentul (Sandoricum koetjape)
802,159.00 9,061,741.95 21.00 11.00
33 30 Sentul (Sandoricum koetjape)
802,161.00 9,061,741.45 23.00 13.00
33 31 Berasan (Gomphia serrata)
802,159.00 9,061,738.95 61.00 17.00
33 32 Sentul (Sandoricum koetjape)
802,165.50 9,061,739.45 42.00 13.00
33 33 Rau (Dracontomelon mangiferum)
802,169.50 9,061,753.45 30.00 11.00
33 34 Sentul (Sandoricum koetjape)
802,173.50 9,061,740.45 51.00 15.00
33 35 Sentul (Sandoricum koetjape)
802,174.50 9,061,740.95 28.00 7.00
33 36 Pluncing (Spondias pinnata)
802,179.00 9,061,739.45 24.00 8.00
33 37 Sentul (Sandoricum koetjape)
802,182.00 9,061,740.95 40.00 12.00
34 1 Pluncing (Spondias pinnata)
801,056.94 9,061,417.20 50.00 17.00
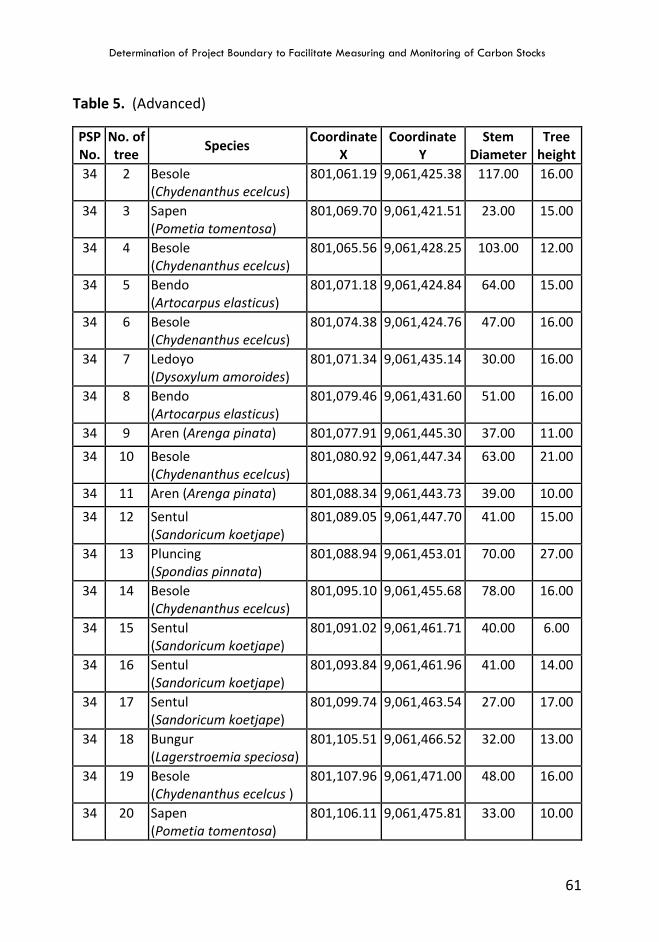
Determination of Project Boundary to Facilitate Measuring and Monitoring of Carbon Stocks
61
Table 5. (Advanced)
PSP No.
No. of tree
Species Coordinate
X Coordinate
Y Stem
Diameter Tree
height 34 2 Besole
(Chydenanthus ecelcus) 801,061.19 9,061,425.38 117.00 16.00
34 3 Sapen (Pometia tomentosa)
801,069.70 9,061,421.51 23.00 15.00
34 4 Besole (Chydenanthus ecelcus)
801,065.56 9,061,428.25 103.00 12.00
34 5 Bendo (Artocarpus elasticus)
801,071.18 9,061,424.84 64.00 15.00
34 6 Besole (Chydenanthus ecelcus)
801,074.38 9,061,424.76 47.00 16.00
34 7 Ledoyo (Dysoxylum amoroides)
801,071.34 9,061,435.14 30.00 16.00
34 8 Bendo (Artocarpus elasticus)
801,079.46 9,061,431.60 51.00 16.00
34 9 Aren (Arenga pinata) 801,077.91 9,061,445.30 37.00 11.00
34 10 Besole (Chydenanthus ecelcus)
801,080.92 9,061,447.34 63.00 21.00
34 11 Aren (Arenga pinata) 801,088.34 9,061,443.73 39.00 10.00
34 12 Sentul (Sandoricum koetjape)
801,089.05 9,061,447.70 41.00 15.00
34 13 Pluncing (Spondias pinnata)
801,088.94 9,061,453.01 70.00 27.00
34 14 Besole (Chydenanthus ecelcus)
801,095.10 9,061,455.68 78.00 16.00
34 15 Sentul (Sandoricum koetjape)
801,091.02 9,061,461.71 40.00 6.00
34 16 Sentul (Sandoricum koetjape)
801,093.84 9,061,461.96 41.00 14.00
34 17 Sentul (Sandoricum koetjape)
801,099.74 9,061,463.54 27.00 17.00
34 18 Bungur (Lagerstroemia speciosa)
801,105.51 9,061,466.52 32.00 13.00
34 19 Besole (Chydenanthus ecelcus )
801,107.96 9,061,471.00 48.00 16.00
34 20 Sapen (Pometia tomentosa)
801,106.11 9,061,475.81 33.00 10.00
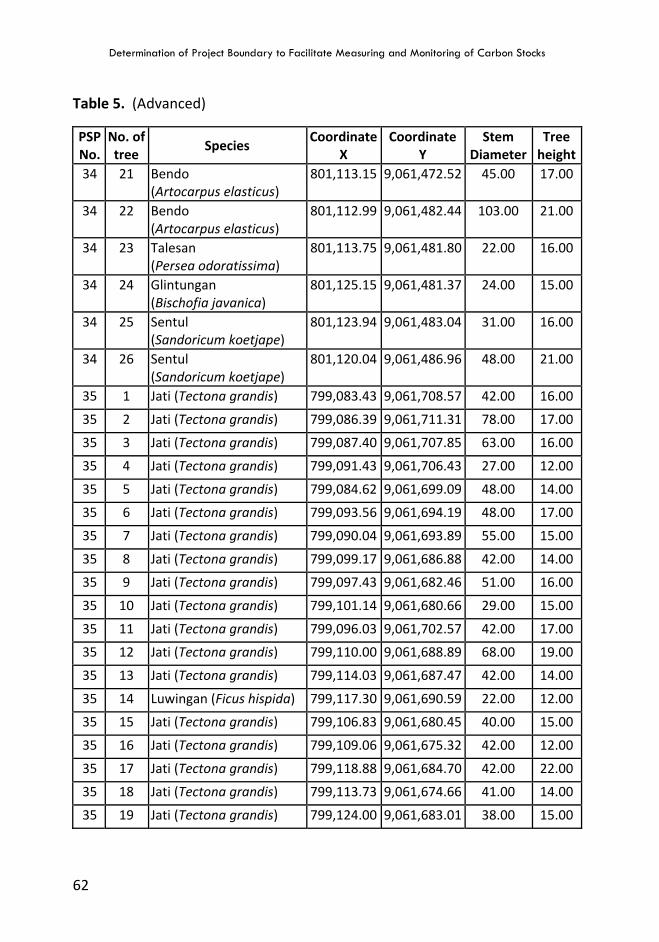
Determination of Project Boundary to Facilitate Measuring and Monitoring of Carbon Stocks
62
Table 5. (Advanced)
PSP No.
No. of tree
Species Coordinate
X Coordinate
Y Stem
Diameter Tree
height 34 21 Bendo
(Artocarpus elasticus) 801,113.15 9,061,472.52 45.00 17.00
34 22 Bendo (Artocarpus elasticus)
801,112.99 9,061,482.44 103.00 21.00
34 23 Talesan (Persea odoratissima)
801,113.75 9,061,481.80 22.00 16.00
34 24 Glintungan (Bischofia javanica)
801,125.15 9,061,481.37 24.00 15.00
34 25 Sentul (Sandoricum koetjape)
801,123.94 9,061,483.04 31.00 16.00
34 26 Sentul (Sandoricum koetjape)
801,120.04 9,061,486.96 48.00 21.00
35 1 Jati (Tectona grandis) 799,083.43 9,061,708.57 42.00 16.00
35 2 Jati (Tectona grandis) 799,086.39 9,061,711.31 78.00 17.00
35 3 Jati (Tectona grandis) 799,087.40 9,061,707.85 63.00 16.00
35 4 Jati (Tectona grandis) 799,091.43 9,061,706.43 27.00 12.00
35 5 Jati (Tectona grandis) 799,084.62 9,061,699.09 48.00 14.00
35 6 Jati (Tectona grandis) 799,093.56 9,061,694.19 48.00 17.00
35 7 Jati (Tectona grandis) 799,090.04 9,061,693.89 55.00 15.00
35 8 Jati (Tectona grandis) 799,099.17 9,061,686.88 42.00 14.00
35 9 Jati (Tectona grandis) 799,097.43 9,061,682.46 51.00 16.00
35 10 Jati (Tectona grandis) 799,101.14 9,061,680.66 29.00 15.00
35 11 Jati (Tectona grandis) 799,096.03 9,061,702.57 42.00 17.00
35 12 Jati (Tectona grandis) 799,110.00 9,061,688.89 68.00 19.00
35 13 Jati (Tectona grandis) 799,114.03 9,061,687.47 42.00 14.00
35 14 Luwingan (Ficus hispida) 799,117.30 9,061,690.59 22.00 12.00
35 15 Jati (Tectona grandis) 799,106.83 9,061,680.45 40.00 15.00
35 16 Jati (Tectona grandis) 799,109.06 9,061,675.32 42.00 12.00
35 17 Jati (Tectona grandis) 799,118.88 9,061,684.70 42.00 22.00
35 18 Jati (Tectona grandis) 799,113.73 9,061,674.66 41.00 14.00
35 19 Jati (Tectona grandis) 799,124.00 9,061,683.01 38.00 15.00
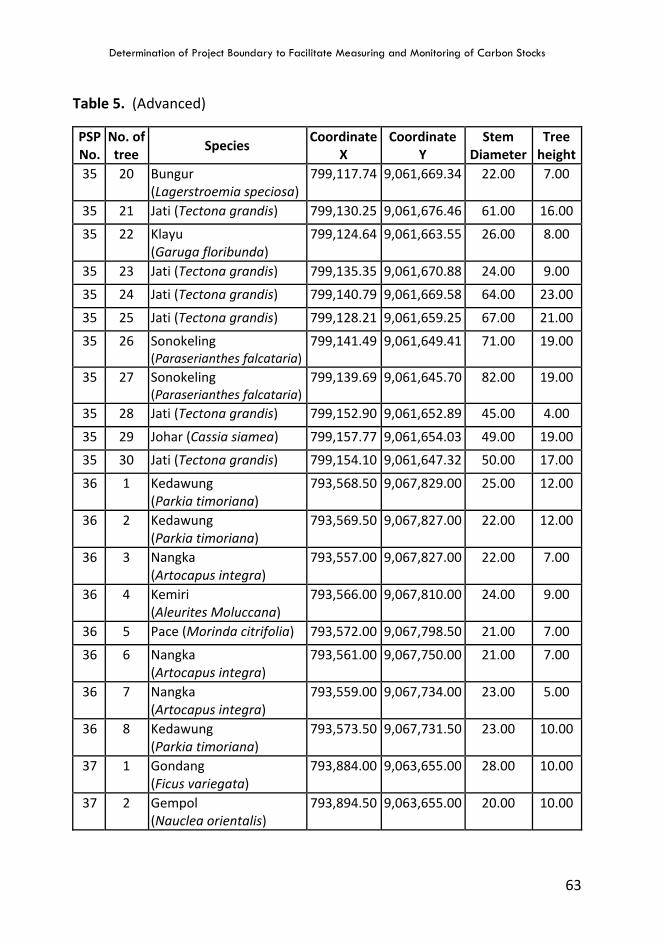
Determination of Project Boundary to Facilitate Measuring and Monitoring of Carbon Stocks
63
Table 5. (Advanced)
PSP No.
No. of tree
Species Coordinate
X Coordinate
Y Stem
Diameter Tree
height 35 20 Bungur
(Lagerstroemia speciosa)799,117.74 9,061,669.34 22.00 7.00
35 21 Jati (Tectona grandis) 799,130.25 9,061,676.46 61.00 16.00
35 22 Klayu (Garuga floribunda)
799,124.64 9,061,663.55 26.00 8.00
35 23 Jati (Tectona grandis) 799,135.35 9,061,670.88 24.00 9.00
35 24 Jati (Tectona grandis) 799,140.79 9,061,669.58 64.00 23.00
35 25 Jati (Tectona grandis) 799,128.21 9,061,659.25 67.00 21.00
35 26 Sonokeling (Paraserianthes falcataria)
799,141.49 9,061,649.41 71.00 19.00
35 27 Sonokeling (Paraserianthes falcataria)
799,139.69 9,061,645.70 82.00 19.00
35 28 Jati (Tectona grandis) 799,152.90 9,061,652.89 45.00 4.00
35 29 Johar (Cassia siamea) 799,157.77 9,061,654.03 49.00 19.00
35 30 Jati (Tectona grandis) 799,154.10 9,061,647.32 50.00 17.00
36 1 Kedawung (Parkia timoriana)
793,568.50 9,067,829.00 25.00 12.00
36 2 Kedawung (Parkia timoriana)
793,569.50 9,067,827.00 22.00 12.00
36 3 Nangka (Artocapus integra)
793,557.00 9,067,827.00 22.00 7.00
36 4 Kemiri (Aleurites Moluccana)
793,566.00 9,067,810.00 24.00 9.00
36 5 Pace (Morinda citrifolia) 793,572.00 9,067,798.50 21.00 7.00
36 6 Nangka (Artocapus integra)
793,561.00 9,067,750.00 21.00 7.00
36 7 Nangka (Artocapus integra)
793,559.00 9,067,734.00 23.00 5.00
36 8 Kedawung (Parkia timoriana)
793,573.50 9,067,731.50 23.00 10.00
37 1 Gondang (Ficus variegata)
793,884.00 9,063,655.00 28.00 10.00
37 2 Gempol (Nauclea orientalis)
793,894.50 9,063,655.00 20.00 10.00
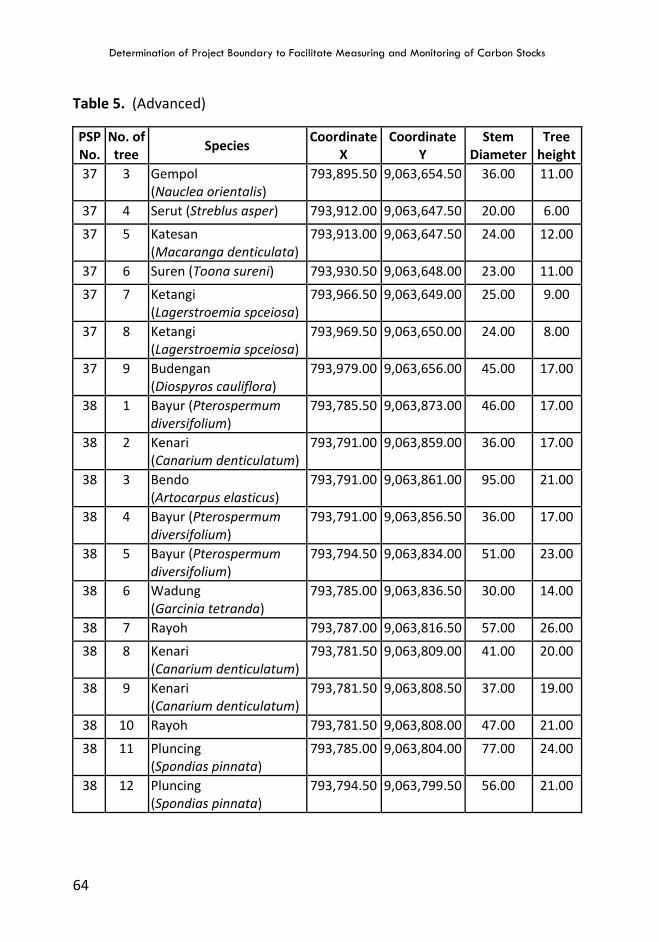
Determination of Project Boundary to Facilitate Measuring and Monitoring of Carbon Stocks
64
Table 5. (Advanced)
PSP No.
No. of tree
Species Coordinate
X Coordinate
Y Stem
Diameter Tree
height 37 3 Gempol
(Nauclea orientalis) 793,895.50 9,063,654.50 36.00 11.00
37 4 Serut (Streblus asper) 793,912.00 9,063,647.50 20.00 6.00
37 5 Katesan (Macaranga denticulata)
793,913.00 9,063,647.50 24.00 12.00
37 6 Suren (Toona sureni) 793,930.50 9,063,648.00 23.00 11.00
37 7 Ketangi (Lagerstroemia spceiosa)
793,966.50 9,063,649.00 25.00 9.00
37 8 Ketangi (Lagerstroemia spceiosa)
793,969.50 9,063,650.00 24.00 8.00
37 9 Budengan (Diospyros cauliflora)
793,979.00 9,063,656.00 45.00 17.00
38 1 Bayur (Pterospermum diversifolium)
793,785.50 9,063,873.00 46.00 17.00
38 2 Kenari (Canarium denticulatum)
793,791.00 9,063,859.00 36.00 17.00
38 3 Bendo (Artocarpus elasticus)
793,791.00 9,063,861.00 95.00 21.00
38 4 Bayur (Pterospermum diversifolium)
793,791.00 9,063,856.50 36.00 17.00
38 5 Bayur (Pterospermum diversifolium)
793,794.50 9,063,834.00 51.00 23.00
38 6 Wadung (Garcinia tetranda)
793,785.00 9,063,836.50 30.00 14.00
38 7 Rayoh 793,787.00 9,063,816.50 57.00 26.00
38 8 Kenari (Canarium denticulatum)
793,781.50 9,063,809.00 41.00 20.00
38 9 Kenari (Canarium denticulatum)
793,781.50 9,063,808.50 37.00 19.00
38 10 Rayoh 793,781.50 9,063,808.00 47.00 21.00
38 11 Pluncing (Spondias pinnata)
793,785.00 9,063,804.00 77.00 24.00
38 12 Pluncing (Spondias pinnata)
793,794.50 9,063,799.50 56.00 21.00
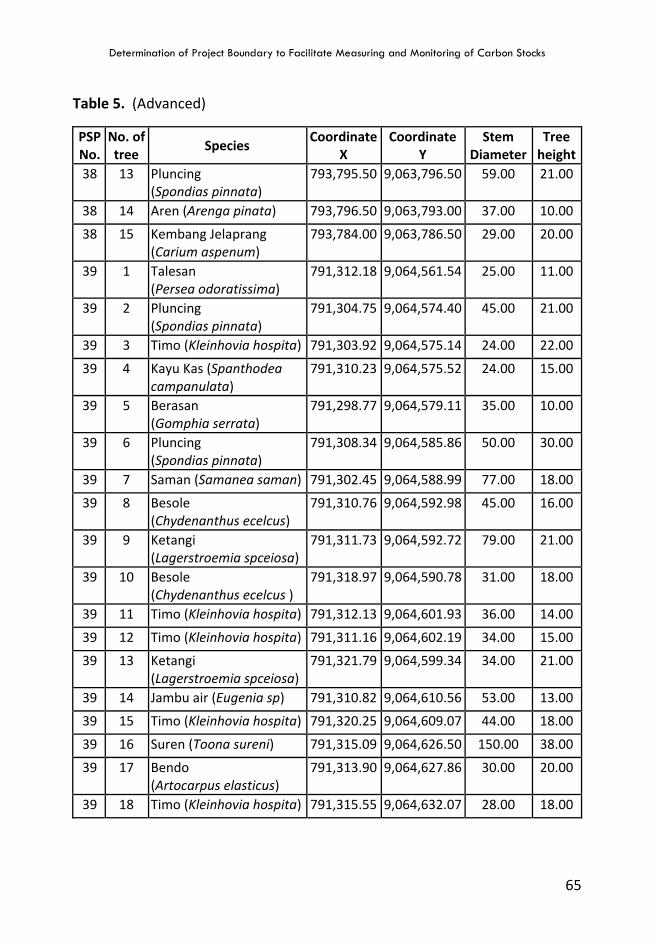
Determination of Project Boundary to Facilitate Measuring and Monitoring of Carbon Stocks
65
Table 5. (Advanced)
PSP No.
No. of tree
Species Coordinate
X Coordinate
Y Stem
Diameter Tree
height 38 13 Pluncing
(Spondias pinnata) 793,795.50 9,063,796.50 59.00 21.00
38 14 Aren (Arenga pinata) 793,796.50 9,063,793.00 37.00 10.00
38 15 Kembang Jelaprang (Carium aspenum)
793,784.00 9,063,786.50 29.00 20.00
39 1 Talesan (Persea odoratissima)
791,312.18 9,064,561.54 25.00 11.00
39 2 Pluncing (Spondias pinnata)
791,304.75 9,064,574.40 45.00 21.00
39 3 Timo (Kleinhovia hospita) 791,303.92 9,064,575.14 24.00 22.00
39 4 Kayu Kas (Spanthodea campanulata)
791,310.23 9,064,575.52 24.00 15.00
39 5 Berasan (Gomphia serrata)
791,298.77 9,064,579.11 35.00 10.00
39 6 Pluncing (Spondias pinnata)
791,308.34 9,064,585.86 50.00 30.00
39 7 Saman (Samanea saman) 791,302.45 9,064,588.99 77.00 18.00
39 8 Besole (Chydenanthus ecelcus)
791,310.76 9,064,592.98 45.00 16.00
39 9 Ketangi (Lagerstroemia spceiosa)
791,311.73 9,064,592.72 79.00 21.00
39 10 Besole (Chydenanthus ecelcus )
791,318.97 9,064,590.78 31.00 18.00
39 11 Timo (Kleinhovia hospita) 791,312.13 9,064,601.93 36.00 14.00
39 12 Timo (Kleinhovia hospita) 791,311.16 9,064,602.19 34.00 15.00
39 13 Ketangi (Lagerstroemia spceiosa)
791,321.79 9,064,599.34 34.00 21.00
39 14 Jambu air (Eugenia sp) 791,310.82 9,064,610.56 53.00 13.00
39 15 Timo (Kleinhovia hospita) 791,320.25 9,064,609.07 44.00 18.00
39 16 Suren (Toona sureni) 791,315.09 9,064,626.50 150.00 38.00
39 17 Bendo (Artocarpus elasticus)
791,313.90 9,064,627.86 30.00 20.00
39 18 Timo (Kleinhovia hospita) 791,315.55 9,064,632.07 28.00 18.00
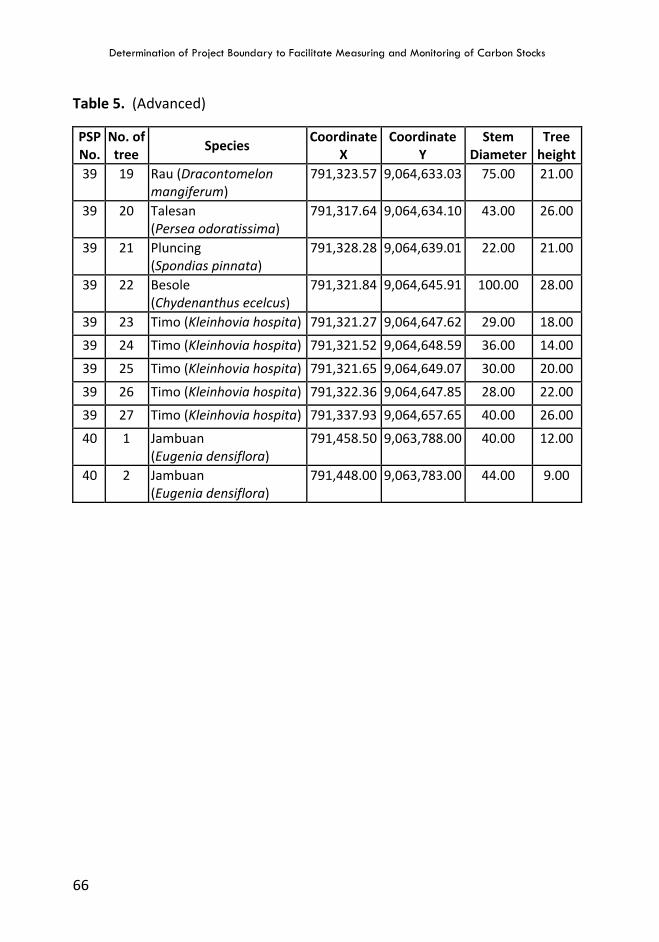
Determination of Project Boundary to Facilitate Measuring and Monitoring of Carbon Stocks
66
Table 5. (Advanced)
PSP No.
No. of tree
Species Coordinate
X Coordinate
Y Stem
Diameter Tree
height 39 19 Rau (Dracontomelon
mangiferum) 791,323.57 9,064,633.03 75.00 21.00
39 20 Talesan (Persea odoratissima)
791,317.64 9,064,634.10 43.00 26.00
39 21 Pluncing (Spondias pinnata)
791,328.28 9,064,639.01 22.00 21.00
39 22 Besole (Chydenanthus ecelcus)
791,321.84 9,064,645.91 100.00 28.00
39 23 Timo (Kleinhovia hospita) 791,321.27 9,064,647.62 29.00 18.00
39 24 Timo (Kleinhovia hospita) 791,321.52 9,064,648.59 36.00 14.00
39 25 Timo (Kleinhovia hospita) 791,321.65 9,064,649.07 30.00 20.00
39 26 Timo (Kleinhovia hospita) 791,322.36 9,064,647.85 28.00 22.00
39 27 Timo (Kleinhovia hospita) 791,337.93 9,064,657.65 40.00 26.00
40 1 Jambuan (Eugenia densiflora)
791,458.50 9,063,788.00 40.00 12.00
40 2 Jambuan (Eugenia densiflora)
791,448.00 9,063,783.00 44.00 9.00
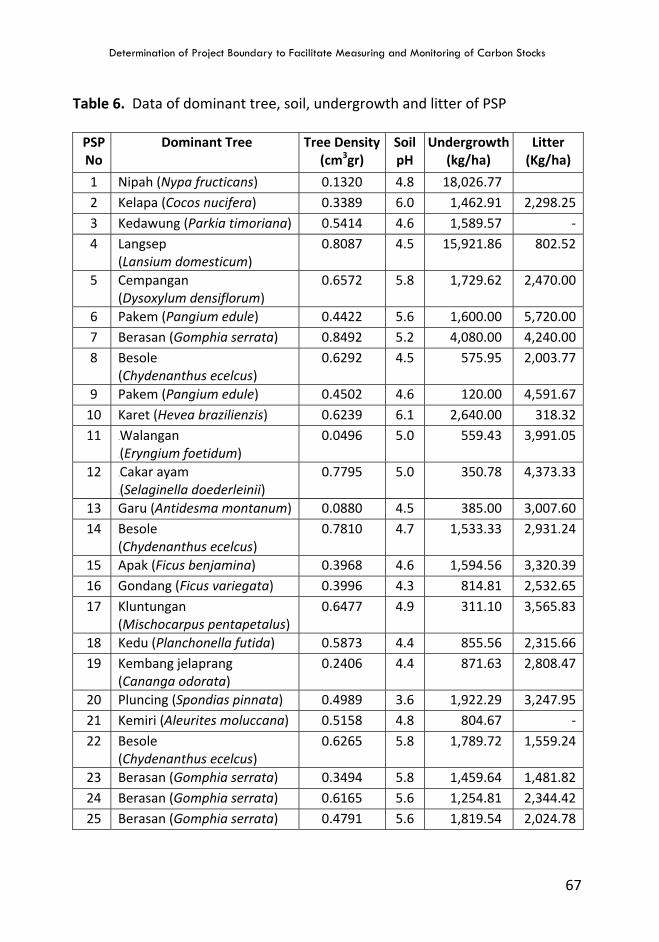
Determination of Project Boundary to Facilitate Measuring and Monitoring of Carbon Stocks
67
Table 6. Data of dominant tree, soil, undergrowth and litter of PSP
PSP No
Dominant Tree Tree Density(cm3gr)
Soil pH
Undergrowth (kg/ha)
Litter (Kg/ha)
1 Nipah (Nypa fructicans) 0.1320 4.8 18,026.77 2 Kelapa (Cocos nucifera) 0.3389 6.0 1,462.91 2,298.25 3 Kedawung (Parkia timoriana) 0.5414 4.6 1,589.57 - 4 Langsep
(Lansium domesticum) 0.8087 4.5 15,921.86 802.52
5 Cempangan (Dysoxylum densiflorum)
0.6572 5.8 1,729.62 2,470.00
6 Pakem (Pangium edule) 0.4422 5.6 1,600.00 5,720.00 7 Berasan (Gomphia serrata) 0.8492 5.2 4,080.00 4,240.00 8 Besole
(Chydenanthus ecelcus) 0.6292 4.5 575.95 2,003.77
9 Pakem (Pangium edule) 0.4502 4.6 120.00 4,591.67 10 Karet (Hevea brazilienzis) 0.6239 6.1 2,640.00 318.32 11 0BWalangan
1B(Eryngium foetidum) 0.0496 5.0 559.43 3,991.05
12 2BCakar ayam 3B(Selaginella doederleinii)
0.7795 5.0 350.78 4,373.33
13 Garu (Antidesma montanum) 0.0880 4.5 385.00 3,007.60 14 Besole
(Chydenanthus ecelcus) 0.7810 4.7 1,533.33 2,931.24
15 Apak (Ficus benjamina) 0.3968 4.6 1,594.56 3,320.39 16 Gondang (Ficus variegata) 0.3996 4.3 814.81 2,532.65 17 Kluntungan
(Mischocarpus pentapetalus) 0.6477 4.9 311.10 3,565.83
18 Kedu (Planchonella futida) 0.5873 4.4 855.56 2,315.66 19 Kembang jelaprang
(Cananga odorata) 0.2406 4.4 871.63 2,808.47
20 Pluncing (Spondias pinnata) 0.4989 3.6 1,922.29 3,247.95 21 Kemiri (Aleurites moluccana) 0.5158 4.8 804.67 - 22 Besole
(Chydenanthus ecelcus) 0.6265 5.8 1,789.72 1,559.24
23 Berasan (Gomphia serrata) 0.3494 5.8 1,459.64 1,481.82 24 Berasan (Gomphia serrata) 0.6165 5.6 1,254.81 2,344.42 25 Berasan (Gomphia serrata) 0.4791 5.6 1,819.54 2,024.78
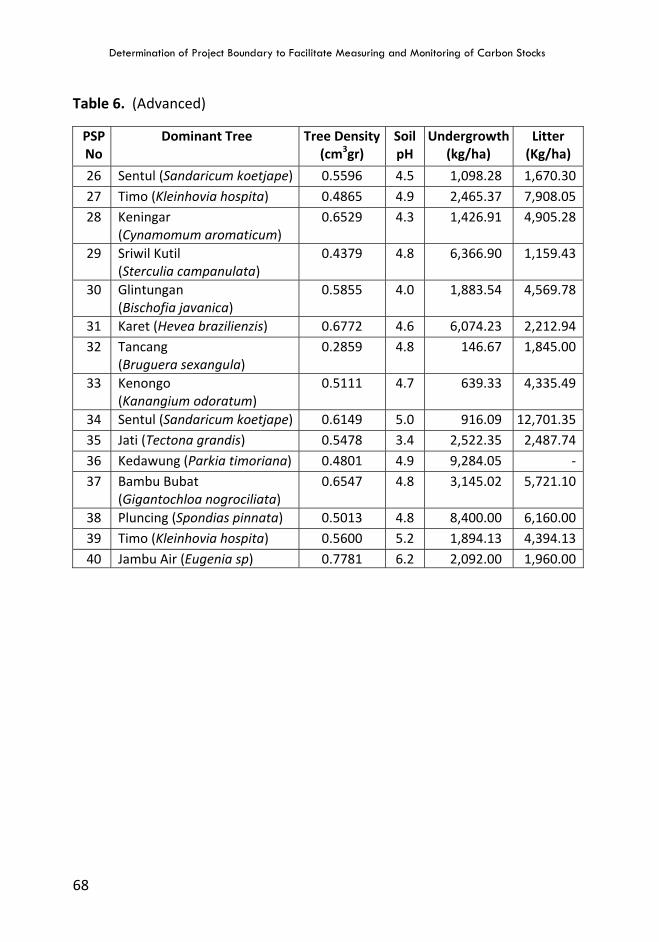
Determination of Project Boundary to Facilitate Measuring and Monitoring of Carbon Stocks
68
Table 6. (Advanced)
PSP No
Dominant Tree Tree Density(cm3gr)
Soil pH
Undergrowth (kg/ha)
Litter (Kg/ha)
26 Sentul (Sandaricum koetjape) 0.5596 4.5 1,098.28 1,670.30 27 Timo (Kleinhovia hospita) 0.4865 4.9 2,465.37 7,908.05 28 Keningar
(Cynamomum aromaticum) 0.6529 4.3 1,426.91 4,905.28
29 Sriwil Kutil (Sterculia campanulata)
0.4379 4.8 6,366.90 1,159.43
30 Glintungan (Bischofia javanica)
0.5855 4.0 1,883.54 4,569.78
31 Karet (Hevea brazilienzis) 0.6772 4.6 6,074.23 2,212.94 32 Tancang
(Bruguera sexangula) 0.2859 4.8 146.67 1,845.00
33 Kenongo (Kanangium odoratum)
0.5111 4.7 639.33 4,335.49
34 Sentul (Sandaricum koetjape) 0.6149 5.0 916.09 12,701.35 35 Jati (Tectona grandis) 0.5478 3.4 2,522.35 2,487.74 36 Kedawung (Parkia timoriana) 0.4801 4.9 9,284.05 - 37 Bambu Bubat
(Gigantochloa nogrociliata) 0.6547 4.8 3,145.02 5,721.10
38 Pluncing (Spondias pinnata) 0.5013 4.8 8,400.00 6,160.00 39 Timo (Kleinhovia hospita) 0.5600 5.2 1,894.13 4,394.13 40 Jambu Air (Eugenia sp) 0.7781 6.2 2,092.00 1,960.00
Determination of Project Boundary to Facilitate Measuring and Monitoring of Carbon Stocks
69
VI. CONCLUSION AND RECOMMENDATION
• Determination of project boundaries and placement of 40 PSPs to
monitor carbon stock are important steps to support REDD DA activities.
These PSPSs would support data and information for the purpose of
measuring, reporting and verifying forest inventory and carbon
accounting in the ground.
• Basic principle to monitoring changes in REDD is by application of wall-to
wall mapping using satellite images and ground truthing through
establishment and measurement of PSPs. This is to ensure that the tier 3
and changes of carbon stock can be monitored accurately by applying
principles of MRV.
• For project boundaries, the whole area of 58.000 ha has been determined
as the area boundaries. However, for the purpose of REDD mechanism
scheme the area would be buffer accordingly.
• Determination of PSP in Project Boundary is made by considering
representativeness of zone and types of vegetation. Placement of PSP
also consider land use categories according to IPCC GL. For this activity 40
PSPs have been made that represent all zones in MBNP, consisting:
17 PSP in nucleus zone, 14 PSP in forest zone, 3 PSP in rehabilitation zone,
4 PSP in buffer zone, and 2 PSP in intensive utilization zone.
• To apply MRV principle, carbon measurement of PSP refers to IPCC
Guideline that measure 5 carbon pools namely above ground biomass,
below ground biomass, necromass, litter and soil. For this activity (activity
2.2), initial measurement has been made to identify carbon pools in PSP
that consist of above ground biomass (tree, pole and undergrowth), litter
(non woody necromass), and soil.

Determination of Project Boundary to Facilitate Measuring and Monitoring of Carbon Stocks
70
• This boundary activity is initial works for the whole project. Further works
will include determination of baseline based on initial data of PSP and
historical data using remote sensing images.
71
REFERENCES
Adinugroho, W.C. 2009. Biomass Allometric Equation and Biomass Expansion Factor (BEF) of Vegetation in Secondary Forest ex Burning at PT. INHUTANI I Batu Ampar, East Kalimantan, Info Hutan (in press)
Asmoro, J.P.P. 2009. Quantification of Carbon Sequestration on Production, Conservation and Protected Forest. Balai Penelitian Kehutanan Manokwari.
Badan Litbang Kehutanan. 1993. Pedoman Pembuatan dan Pengukuran PUP Untuk Pemantauan Pertumbuhan dan Riap Hutan Alam Tanah Kering Bekas Tebangan. Badan Litbang Kehutanan. Jakarta.
Dahlan, I.N. Surati Jaya and Istomo. 2005. Estimasi Karbon Tegakan Acacia mangium Willd Menggunakan Citra Landsat ETM+ dan SPOT-5: Stusi Kasus di BKPH Parung Panjang KPH Bogor. Pertemuan Ilmiah Tahunan MAPIN XIV ”Pemanfaatan Efektif Penginderaan Jauh Untuk Peningkatan Kesejahteraan Bangsa” Gedung Rektorat lt. 3 Kampus Institut Teknologi Sepuluh Nopember Surabaya, 14 – 15 September 2005
GOFC-GOLD, 2009, Reducing greenhouse gas emissions from deforestation and degradation in developing countries: a sourcebook of methods and procedures for monitoring, measuring and reporting, GOFC-GOLD Report version COP14-2, (GOFC-GOLD Project Office, Natural Resources Canada, Alberta, Canada)
Hairiah K., Dewi S., Agus F., van Noordwijk M. and Rahayu S. 2009. Measuring Carbon Stocks Across Land Use Systems: A Manual. Bogor, Indonesia. World Agroforestry Centre (ICRAF), SEA Regional Office, Brawijaya University and ICALRRD (Indonesian Center for Agricultural Land Resources Research and Development). 127 p. DRAFT VERSION.
Hairiah K. and Rahayu S. 2007. Pengukuran ‘karbon tersimpan’ di berbagai macam penggunaan lahan. Bogor. World Agroforestry Centre - ICRAF, SEA Regional Office, University of Brawijaya, Unibraw, Indonesia. 77 p.
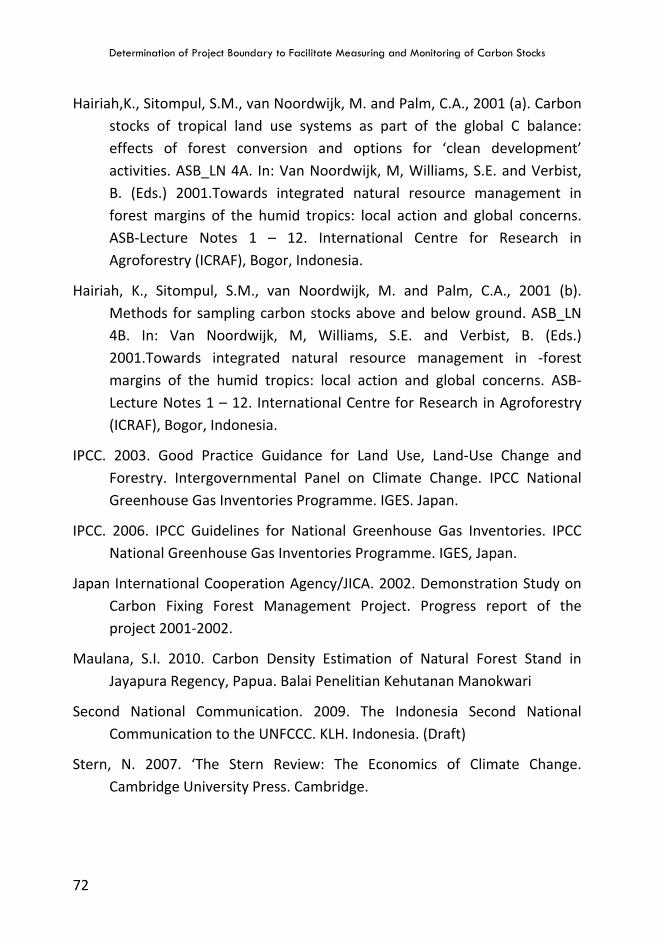
Determination of Project Boundary to Facilitate Measuring and Monitoring of Carbon Stocks
72
Hairiah,K., Sitompul, S.M., van Noordwijk, M. and Palm, C.A., 2001 (a). Carbon stocks of tropical land use systems as part of the global C balance: effects of forest conversion and options for ‘clean development’ activities. ASB_LN 4A. In: Van Noordwijk, M, Williams, S.E. and Verbist, B. (Eds.) 2001.Towards integrated natural resource management in forest margins of the humid tropics: local action and global concerns. ASB-Lecture Notes 1 – 12. International Centre for Research in Agroforestry (ICRAF), Bogor, Indonesia.
Hairiah, K., Sitompul, S.M., van Noordwijk, M. and Palm, C.A., 2001 (b). Methods for sampling carbon stocks above and below ground. ASB_LN 4B. In: Van Noordwijk, M, Williams, S.E. and Verbist, B. (Eds.) 2001.Towards integrated natural resource management in -forest margins of the humid tropics: local action and global concerns. ASB-Lecture Notes 1 – 12. International Centre for Research in Agroforestry (ICRAF), Bogor, Indonesia.
IPCC. 2003. Good Practice Guidance for Land Use, Land-Use Change and Forestry. Intergovernmental Panel on Climate Change. IPCC National Greenhouse Gas Inventories Programme. IGES. Japan.
IPCC. 2006. IPCC Guidelines for National Greenhouse Gas Inventories. IPCC National Greenhouse Gas Inventories Programme. IGES, Japan.
Japan International Cooperation Agency/JICA. 2002. Demonstration Study on Carbon Fixing Forest Management Project. Progress report of the project 2001-2002.
Maulana, S.I. 2010. Carbon Density Estimation of Natural Forest Stand in Jayapura Regency, Papua. Balai Penelitian Kehutanan Manokwari
Second National Communication. 2009. The Indonesia Second National Communication to the UNFCCC. KLH. Indonesia. (Draft)
Stern, N. 2007. ‘The Stern Review: The Economics of Climate Change. Cambridge University Press. Cambridge.
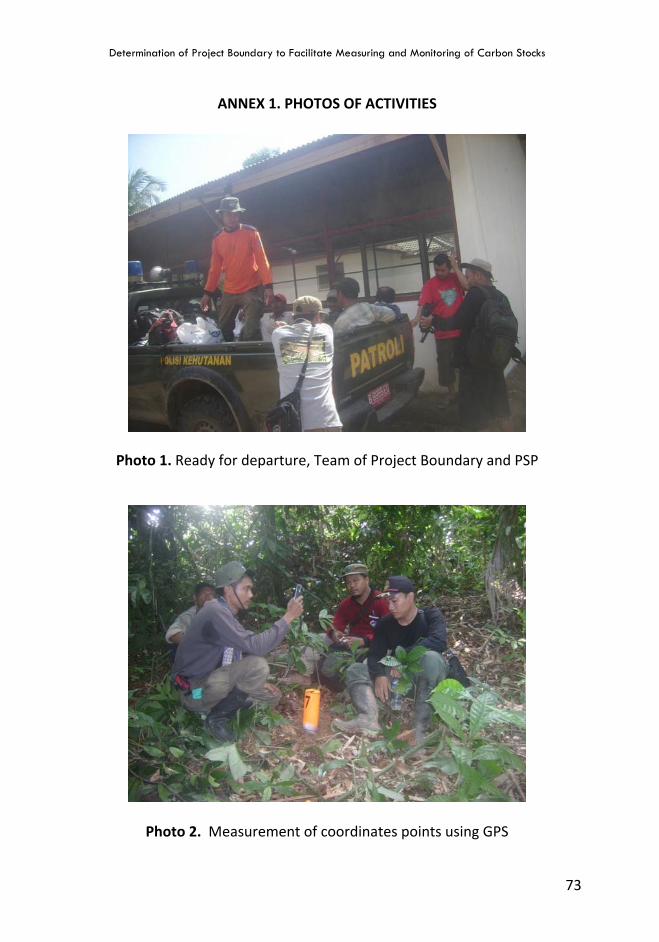
Determination of Project Boundary to Facilitate Measuring and Monitoring of Carbon Stocks
73
ANNEX 1. PHOTOS OF ACTIVITIES
Photo 1. Ready for departure, Team of Project Boundary and PSP
Photo 2. Measurement of coordinates points using GPS
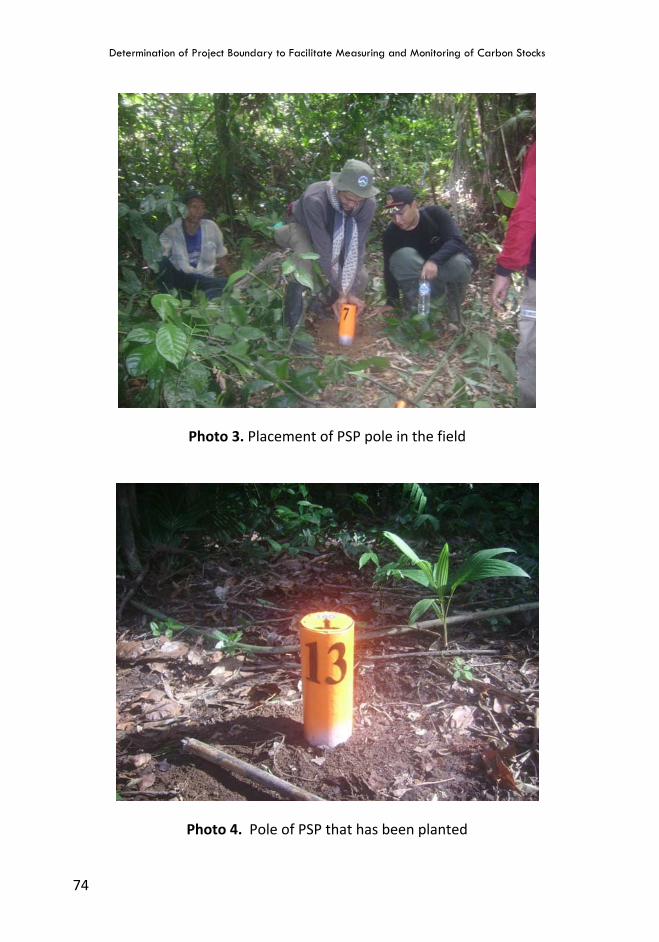
Determination of Project Boundary to Facilitate Measuring and Monitoring of Carbon Stocks
74
Photo 3. Placement of PSP pole in the field
Photo 4. Pole of PSP that has been planted
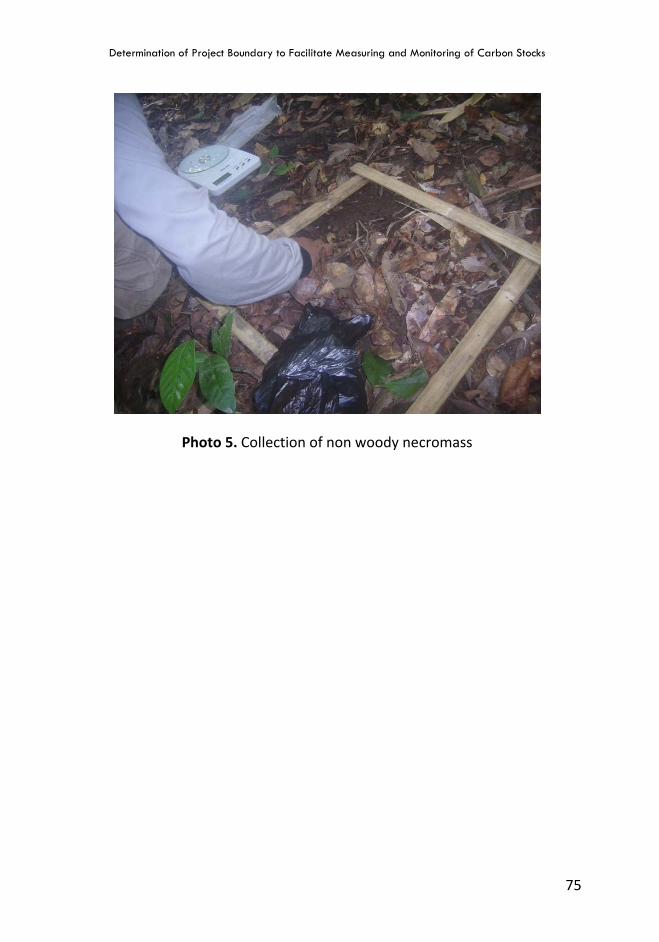
Determination of Project Boundary to Facilitate Measuring and Monitoring of Carbon Stocks
75
Photo 5. Collection of non woody necromass
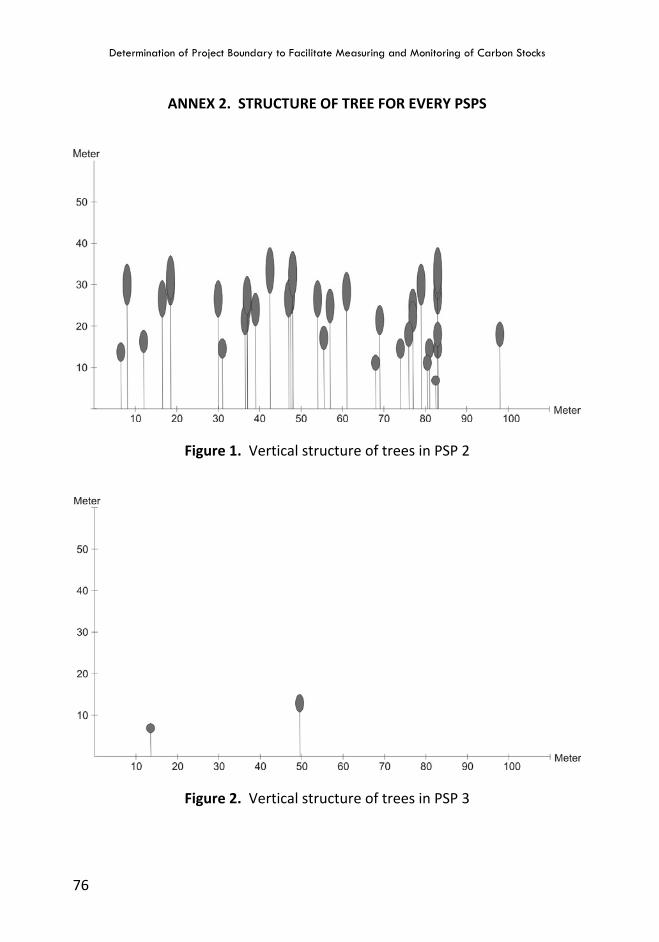
Determination of Project Boundary to Facilitate Measuring and Monitoring of Carbon Stocks
76
ANNEX 2. STRUCTURE OF TREE FOR EVERY PSPS
Figure 1. Vertical structure of trees in PSP 2
Figure 2. Vertical structure of trees in PSP 3
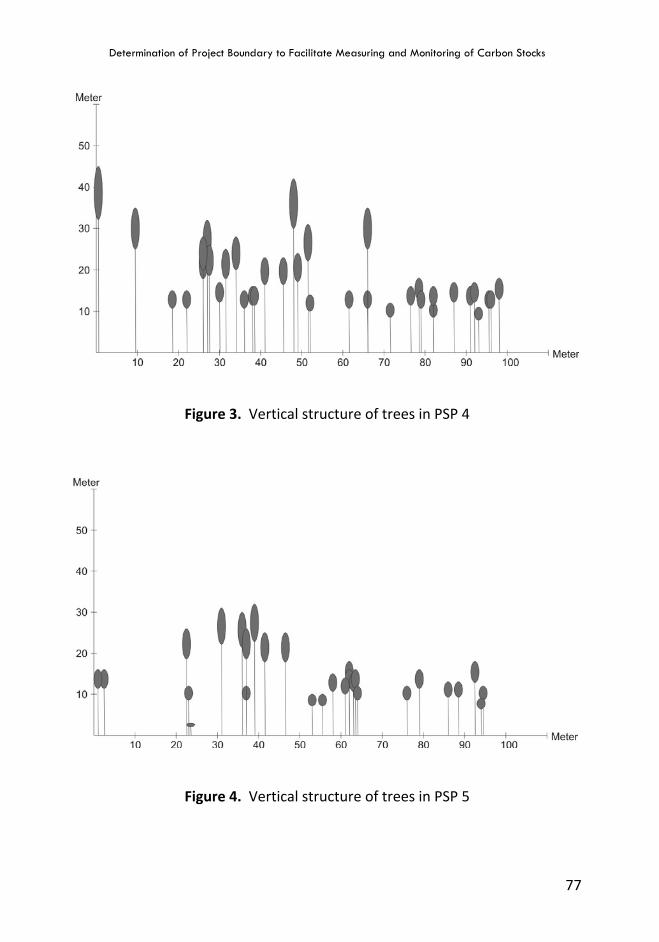
Determination of Project Boundary to Facilitate Measuring and Monitoring of Carbon Stocks
77
Figure 3. Vertical structure of trees in PSP 4
Figure 4. Vertical structure of trees in PSP 5
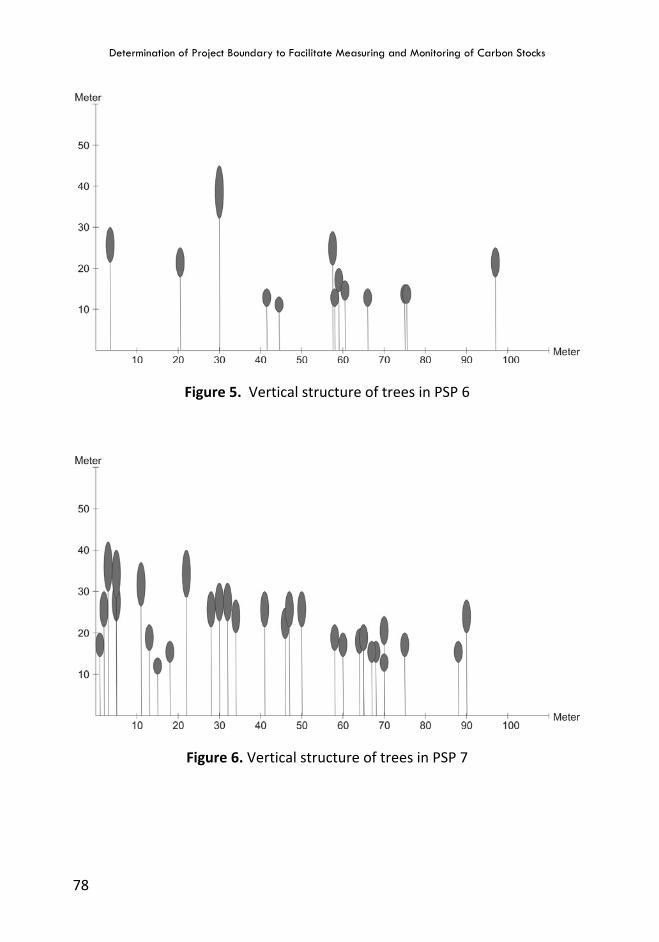
Determination of Project Boundary to Facilitate Measuring and Monitoring of Carbon Stocks
78
Figure 5. Vertical structure of trees in PSP 6
Figure 6. Vertical structure of trees in PSP 7
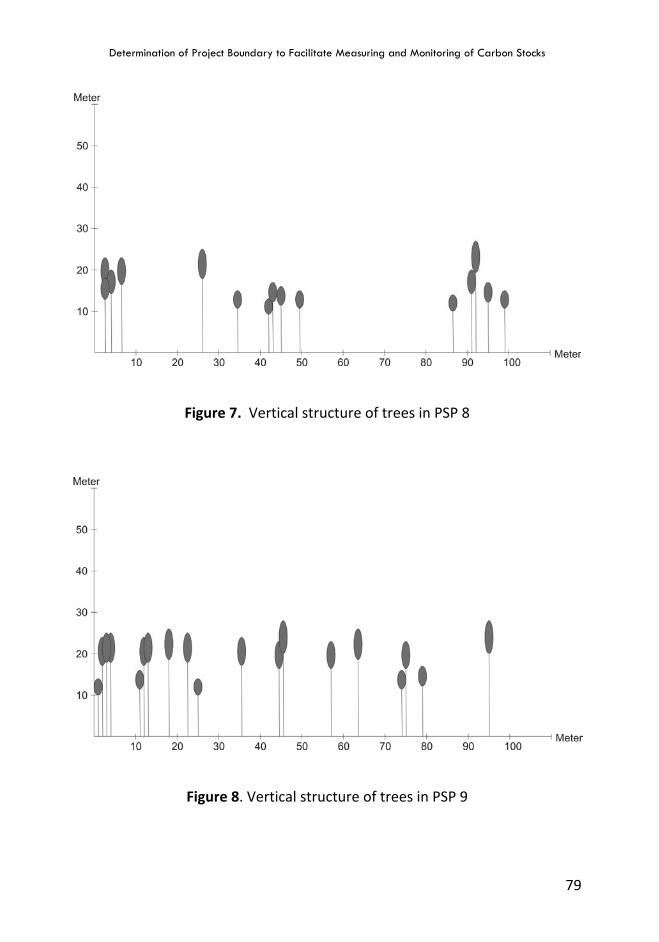
Determination of Project Boundary to Facilitate Measuring and Monitoring of Carbon Stocks
79
Figure 7. Vertical structure of trees in PSP 8
Figure 8. Vertical structure of trees in PSP 9
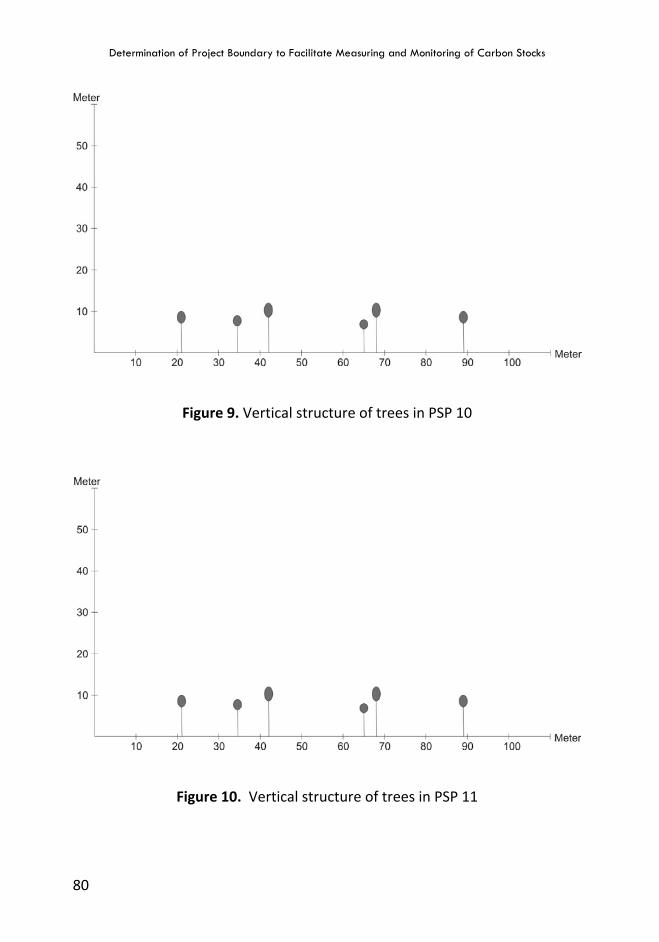
Determination of Project Boundary to Facilitate Measuring and Monitoring of Carbon Stocks
80
Figure 9. Vertical structure of trees in PSP 10
Figure 10. Vertical structure of trees in PSP 11
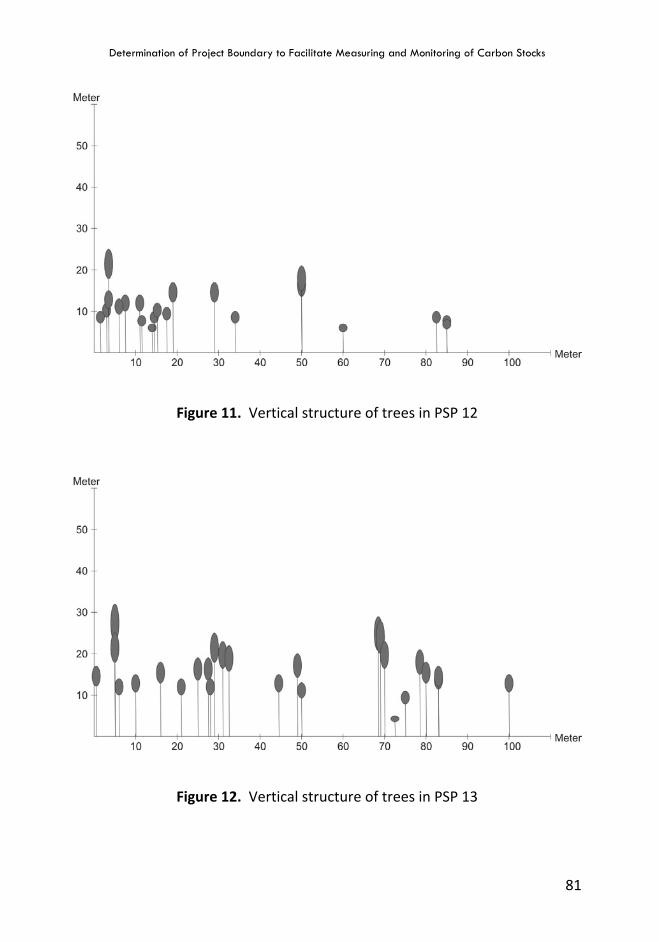
Determination of Project Boundary to Facilitate Measuring and Monitoring of Carbon Stocks
81
Figure 11. Vertical structure of trees in PSP 12
Figure 12. Vertical structure of trees in PSP 13
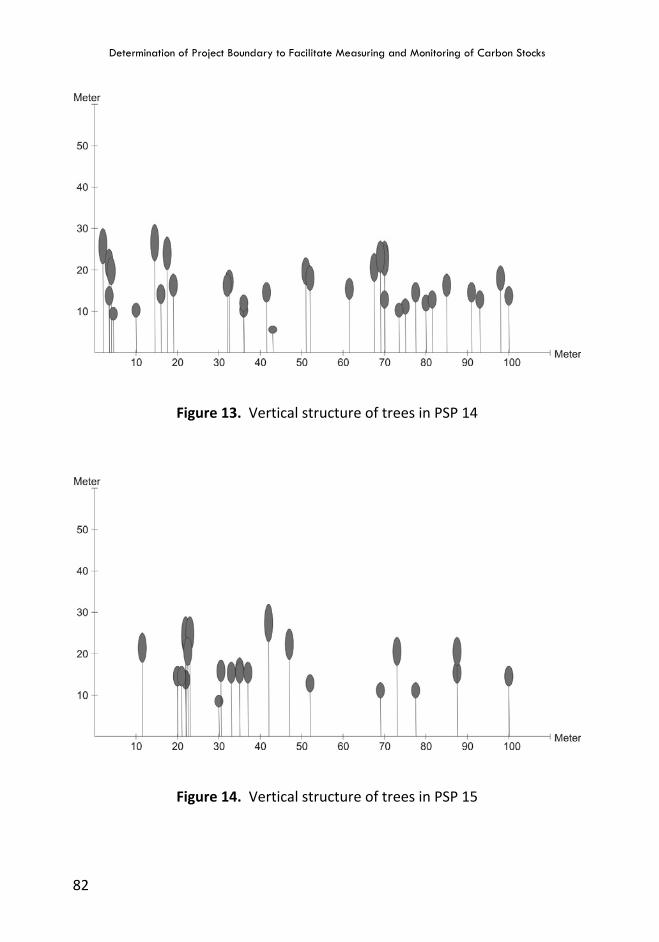
Determination of Project Boundary to Facilitate Measuring and Monitoring of Carbon Stocks
82
Figure 13. Vertical structure of trees in PSP 14
Figure 14. Vertical structure of trees in PSP 15
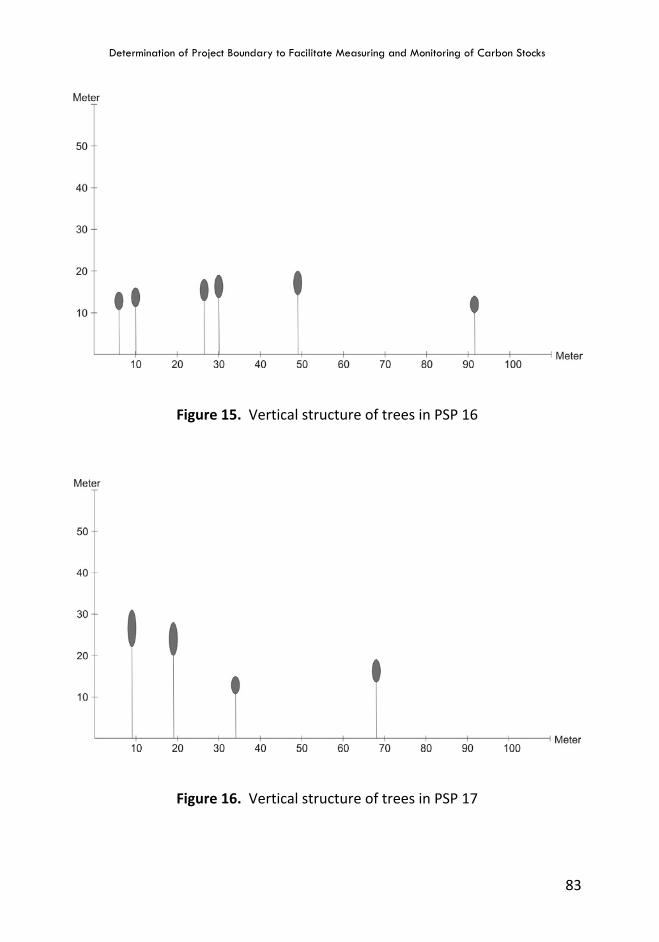
Determination of Project Boundary to Facilitate Measuring and Monitoring of Carbon Stocks
83
Figure 15. Vertical structure of trees in PSP 16
Figure 16. Vertical structure of trees in PSP 17
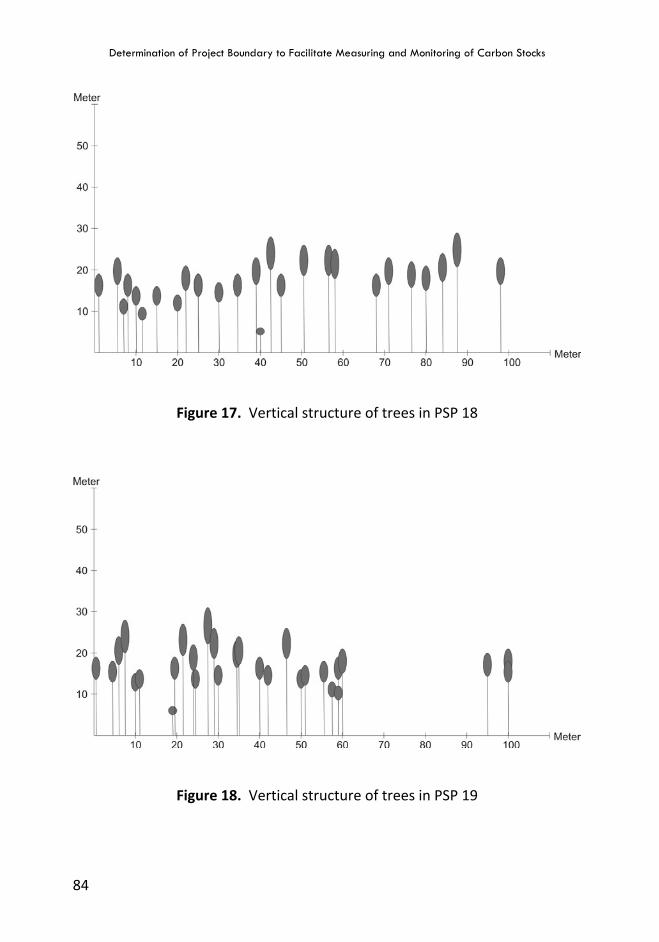
Determination of Project Boundary to Facilitate Measuring and Monitoring of Carbon Stocks
84
Figure 17. Vertical structure of trees in PSP 18
Figure 18. Vertical structure of trees in PSP 19
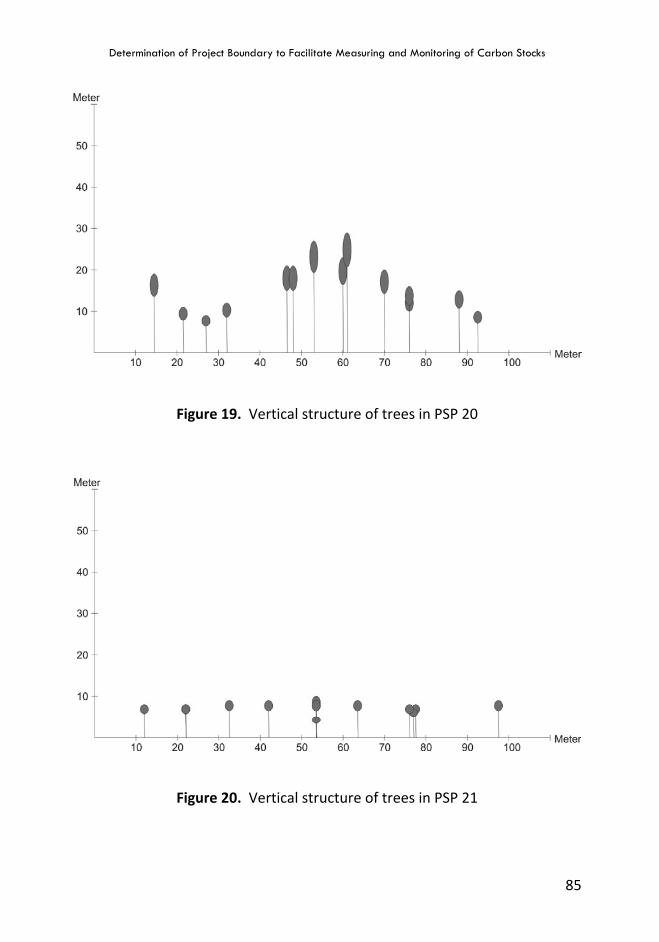
Determination of Project Boundary to Facilitate Measuring and Monitoring of Carbon Stocks
85
Figure 19. Vertical structure of trees in PSP 20
Figure 20. Vertical structure of trees in PSP 21
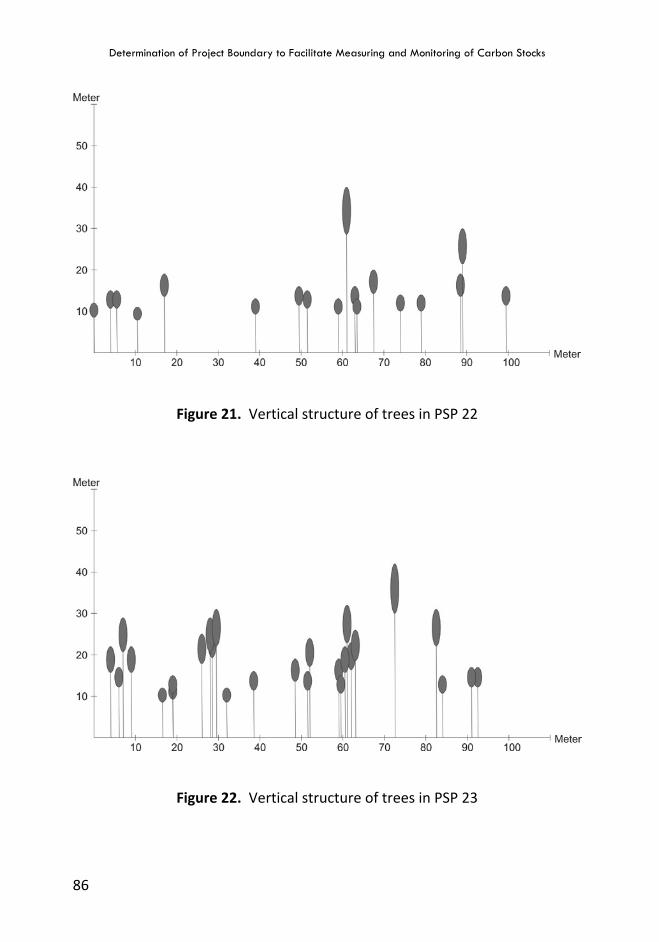
Determination of Project Boundary to Facilitate Measuring and Monitoring of Carbon Stocks
86
Figure 21. Vertical structure of trees in PSP 22
Figure 22. Vertical structure of trees in PSP 23
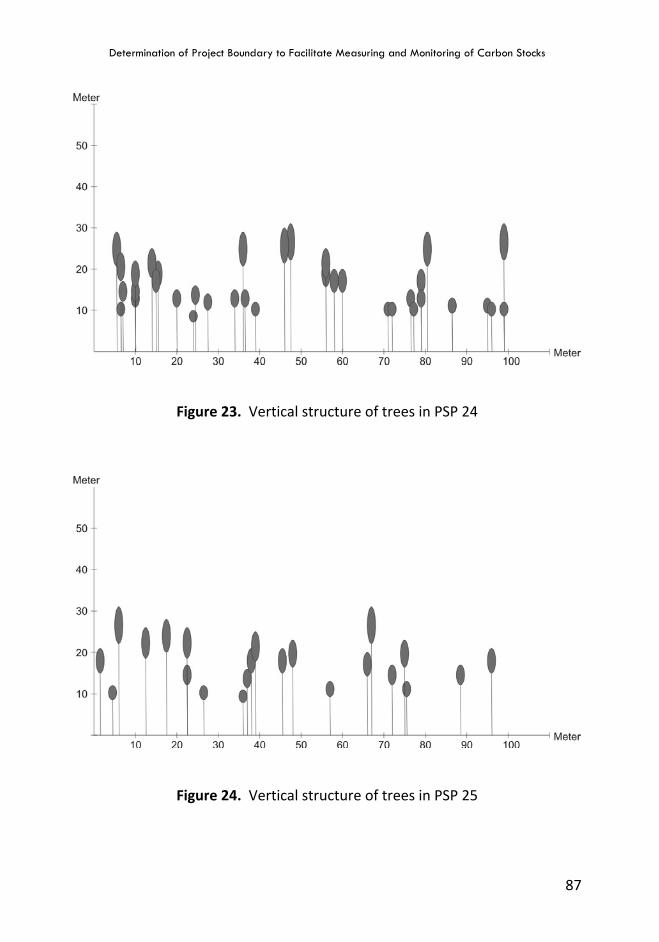
Determination of Project Boundary to Facilitate Measuring and Monitoring of Carbon Stocks
87
Figure 23. Vertical structure of trees in PSP 24
Figure 24. Vertical structure of trees in PSP 25
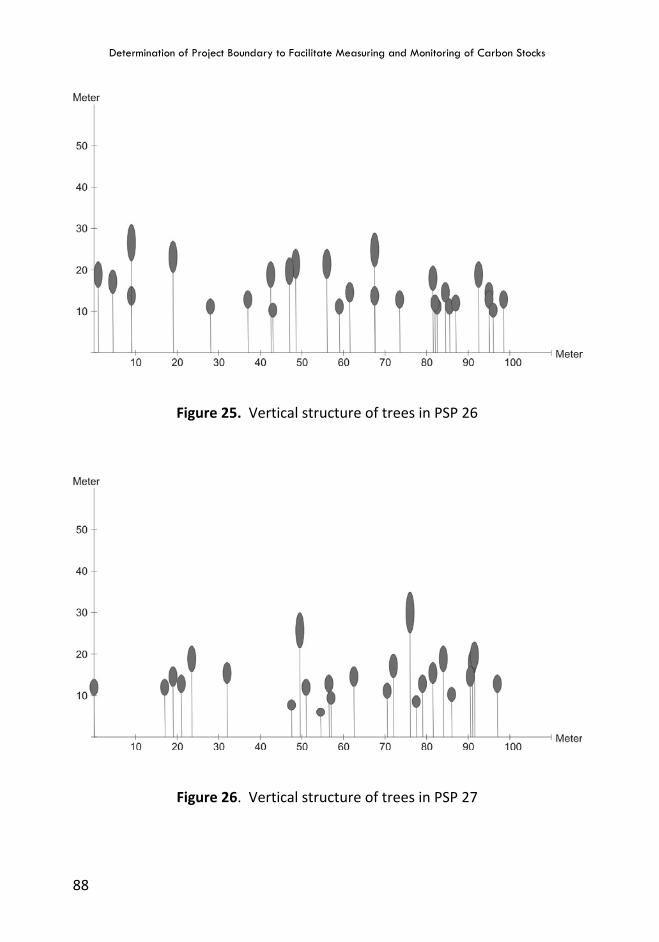
Determination of Project Boundary to Facilitate Measuring and Monitoring of Carbon Stocks
88
Figure 25. Vertical structure of trees in PSP 26
Figure 26. Vertical structure of trees in PSP 27
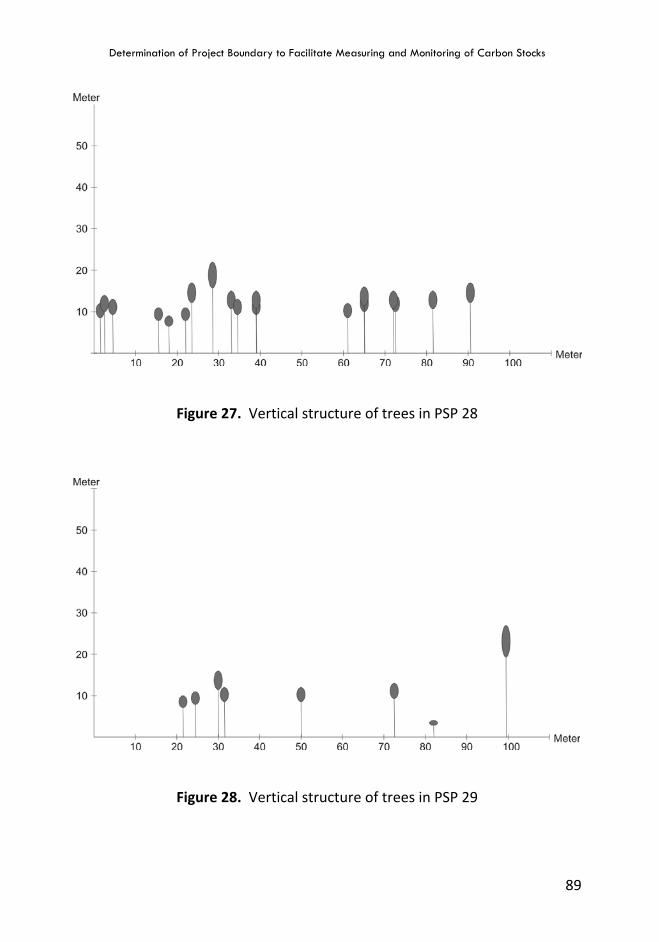
Determination of Project Boundary to Facilitate Measuring and Monitoring of Carbon Stocks
89
Figure 27. Vertical structure of trees in PSP 28
Figure 28. Vertical structure of trees in PSP 29
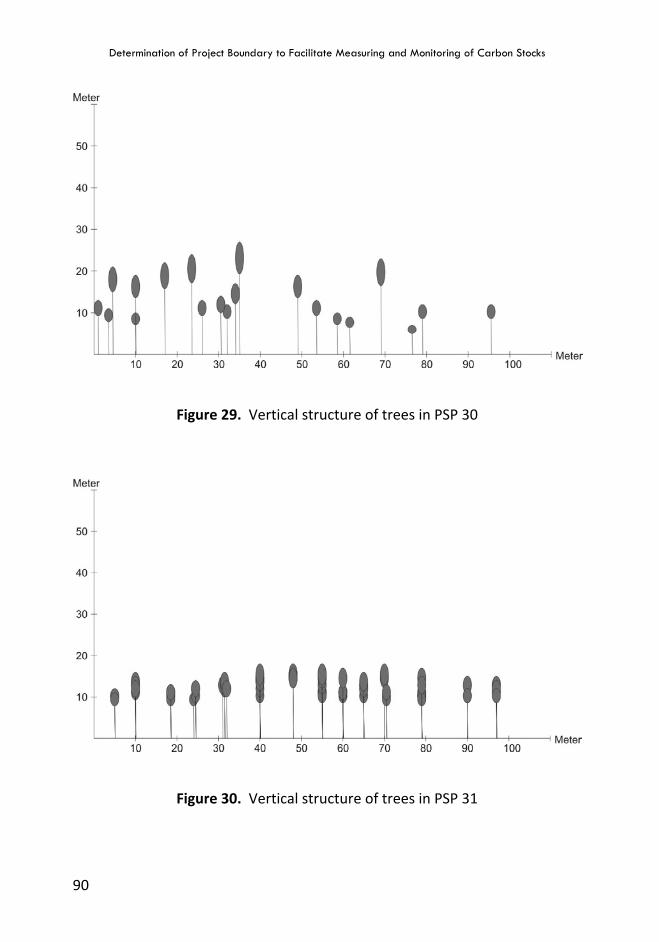
Determination of Project Boundary to Facilitate Measuring and Monitoring of Carbon Stocks
90
Figure 29. Vertical structure of trees in PSP 30
Figure 30. Vertical structure of trees in PSP 31
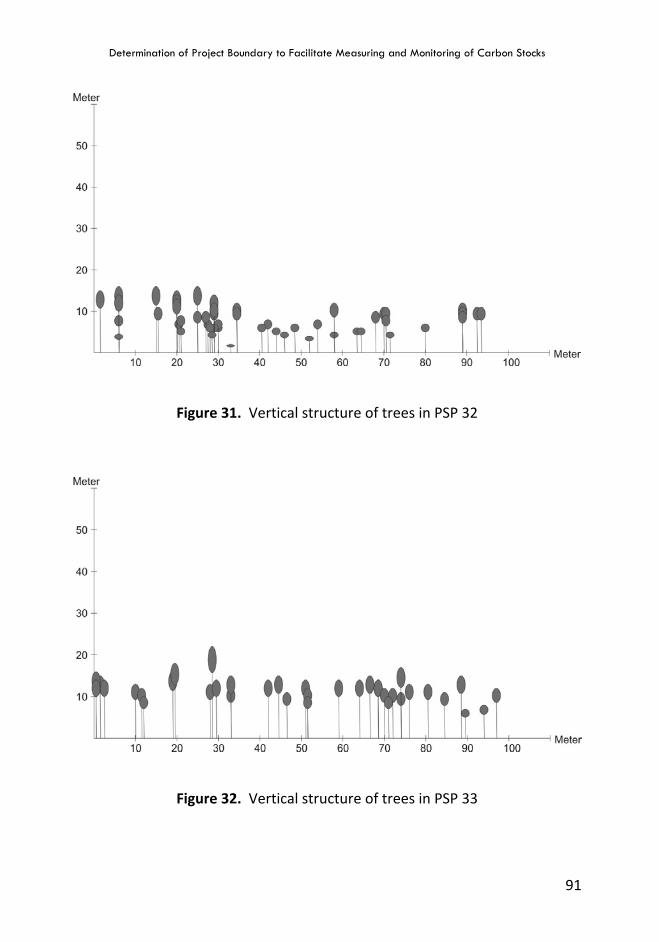
Determination of Project Boundary to Facilitate Measuring and Monitoring of Carbon Stocks
91
Figure 31. Vertical structure of trees in PSP 32
Figure 32. Vertical structure of trees in PSP 33
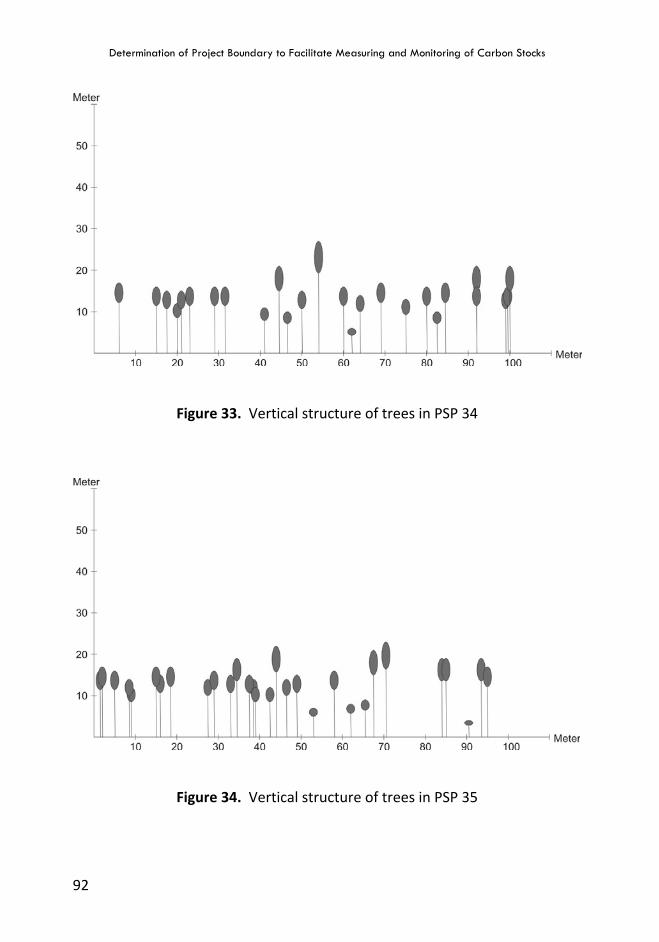
Determination of Project Boundary to Facilitate Measuring and Monitoring of Carbon Stocks
92
Figure 33. Vertical structure of trees in PSP 34
Figure 34. Vertical structure of trees in PSP 35
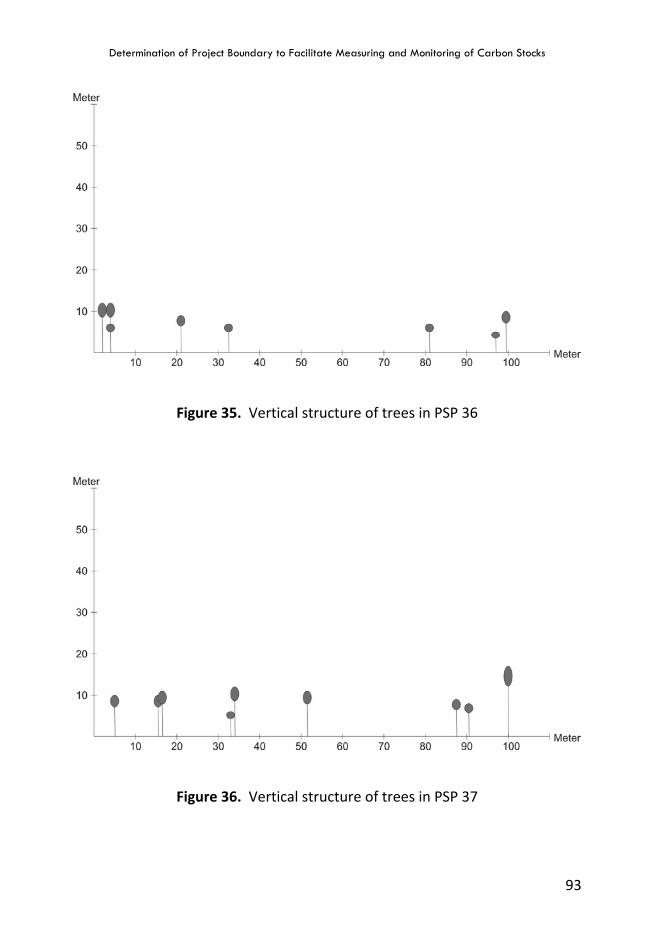
Determination of Project Boundary to Facilitate Measuring and Monitoring of Carbon Stocks
93
Figure 35. Vertical structure of trees in PSP 36
Figure 36. Vertical structure of trees in PSP 37
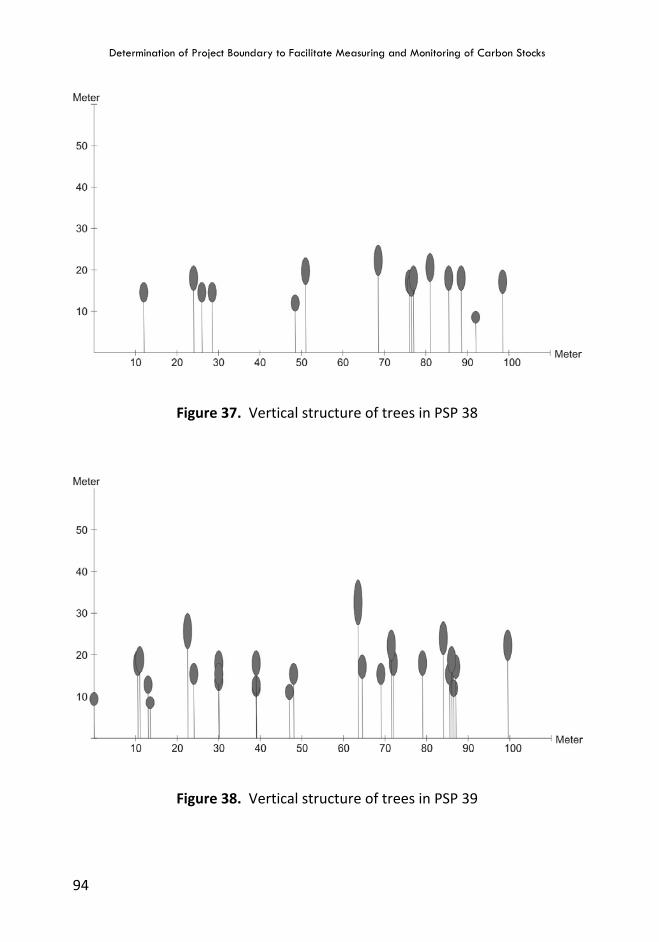
Determination of Project Boundary to Facilitate Measuring and Monitoring of Carbon Stocks
94
Figure 37. Vertical structure of trees in PSP 38
Figure 38. Vertical structure of trees in PSP 39
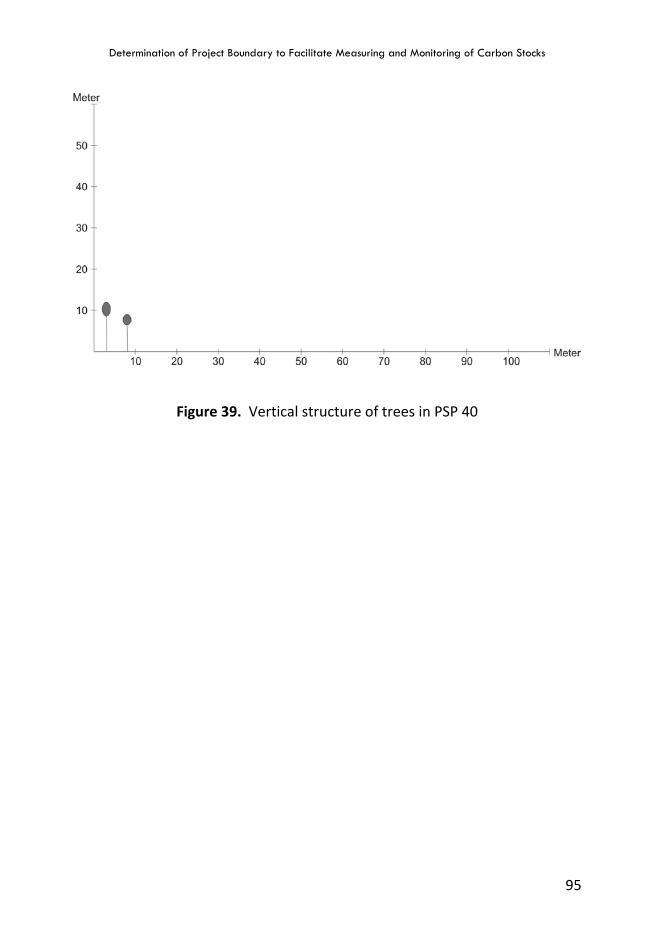
Determination of Project Boundary to Facilitate Measuring and Monitoring of Carbon Stocks
95
Figure 39. Vertical structure of trees in PSP 40
Determination of Project Boundary to Facilitate Measuring and Monitoring of Carbon Stocks
96