Embed Size (px)
Citation preview
GoalTo quantify organic acids in animal feeds by both anion-exchange and ion-exclusion ion chromatography methods
IntroductionOrganic acids and their salts, such as citric acid, malic acid, formic acid, lactic acid, acetic acid, propionic acid, and fumaric acid, are animal feed additives that play an important role in animal feed by improving the animals’ performance and reducing the development of pathogenic microorganisms in the intestine. This is especially important for swine husbandry. According to their functional role, the relevant organic acids can be segmented into groups such as: preservatives, acidity regulators, flavoring compounds, silage additives, or other zoo-technical additives.1 For example, a microencapsulated mixture of citric acid, sorbic acid, and pure botanicals, namely thymol and vanillin, can improve the maturation of the intestinal mucosa and eventually improve the growth of piglets prematurely weaned.2
Authors Jingli Hu and Jeffrey RohrerThermo Fisher ScientificSunnyvale, CA
Keywords Dionex ICS-5000+, Dionex IonPac AS11-HC-4µm column, Dionex IonPac ICE-AS6 ion-exclusion column, suppressed conductivity detection
Determination of organic acids in animal feeds using two ion chromatography methods
APPLICATION NOTE 72438
2
The most important contribution of organic acids is their antimicrobial and pH-lowering effect. In the feed, as well as in the digestive tract of animals, the non-dissociated acid molecules are responsible for the antimicrobial effect because they diffuse across the cell membrane of pathogens and cause pH imbalances and the inhibition of DNA synthesis of the cell. However, in its dissociated form, the acid is responsible for lowering the pH value and reducing the buffer capacity in the feed. As a result, the growth rate of pathogens is decreased and the reduction of the gastric pH value is accelerated. As a consequence, the protein digestion of piglets with a suboptimally developed enzyme system is improved. Organic acids (OAs) have very different effects depending on their degree of dissociation (pKa value).
Several methods have been used to determine organic acids in animal feeds including HPLC with UV detection. However, several organic acids have poor UV absorption and, therefore, lack sufficient sensitivity for detection. In addition, other UV-absorbing components in animal feed may interfere with the detection of organic acids. In contrast, virtually all carboxylic acids ionize sufficiently, therefore, ion chromatography (IC) with suppressed conductivity detection is the technique of choice to separate and detect a large variety of organic acids.
In this application note, the animal feed sample is extracted with water. The extract is filtered or centrifuged and diluted, if necessary. The amounts and types of OAs from the sample are then determined using two IC methods. Method A is based on anion-exchange separation and method B is based on ion-exclusion separation. The two IC methods were evaluated in terms of separation, calibration, limit of quantification, accuracy, and precision.
ExperimentalEquipment and consumablesIC system• Two Thermo Scientific™ Dionex™ ICS-5000+ HPIC
systems including*:
– Dionex ICS-5000+ DP Pump module
– Dionex ICS-5000+ EG Eluent Generator module with high-pressure degasser module
– Dionex ICS-5000+ DC Detector/Chromatography module with CD Conductivity Detector
– Thermo Scientific™ Dionex™ AS-AP Autosampler with sample syringe, 250 µL (P/N 074306) and buffer line 1,200 µL (P/N 074989)
*Either method can be run on a single Dionex ICS-5000+ HPIC system with a Thermo Scientific AXP pump to add the external water for the anion-exchange method or the TBAOH regenerant for the ion-exclusion method.
Software• Thermo Scientific™ Chromeleon™ Chromatography Data
System (CDS) Software, version 7.2 SR4
System A consumables• Thermo Scientific™ Dionex™ EGC 500 KOH Eluent
Generator cartridge (P/N 075778)
• Thermo Scientific™ Dionex™ CR-ATC 500 Electrolytic trap column (P/N 075550)
• Thermo Scientific™ Dionex™ AERS 500 suppressor, 2 mm (P/N 082541)
System B consumables• Thermo Scientific™ Dionex™ ACRS-ICE 500 suppressor,
9 mm (P/N 084715)
3
Reagents and standards• Deionized (DI) water, Type I reagent grade, 18 MΩ∙cm
resistivity or better
• Citric acid monohydrate (Sigma-Aldrich® P/N C7129)
• D-L-Malic acid disodium salt (Sigma-Aldrich P/N M6773-258)
• Formic acid (MP Biomedicals P/N 151162)
• Lactic acid (Fisher Scientific™ A162-500)
• Acetic acid (Sigma-Aldrich P/N A9967)
• Fumaric acid (Fluka® P/N 47900)
• Propionic acid (Fisher Scientific P/N A258-500)
• Succinic acid (Fisher Scientific P/N A294-500)
• Sodium malonate dibasic monohydrate (Sigma-Aldrich P/N M4795)
• Quinic acid (Sigma-Aldrich P/N Q0500)
• Heptafluorobutyric acid (HFBA) (Acros Organics™ P/N 172800250)
• Tetrabutylammonium hydroxide (TBAOH) 55% w/w (Sachem® P/N 355)
• Methanol (CH3OH), Certified ACS (Fisher Scientific P/N A412)
• Sodium and potassium salts, ACS reagent grade or better, for preparing anion standards
Apparatus and consumables• Coffee grinder
• Ultrasonic bath
• Centrifuge
• Syringe 3 mL
• Thermo Scientific™ Nalgene™ 0.45 µm PES syringe membrane filter (Fisher Scientific P/N 09740114)
• Sample vial kit, 10 mL, Polystyrene with Caps and Blue Septa (P/N 074228)
SamplesThree animal feed samples (dog, rabbit, and chicken) were obtained from a local animal feed store.
Conditions
System A (ion-exchange system)
Columns: Thermo Scientific™ Dionex™ IonPac™ AG11-4μm Guard Column, 2 × 50 mm (P/N 078036) Thermo Scientific™ Dionex™ IonPac™ AS11-4μm Analytical Column, 2 × 250 mm (P/N 078035)
Eluent A: DI Water
Eluent B: Methanol (CH3OH)
Eluent Source: Dionex EGC 500 KOH cartridge with Dionex CR-ATC 500
Flow Rate: 0.35 mL/min
Column Temperature: 45°C
Detector Compartment Temperature: 20°C
Detector Temperature: 35°C
Injection Volume: 5 µL (Full loop)
Detection: Suppressed conductivity, Dionex AERS 500 suppressor, 2 mm, external water mode, 149 mA, flow rate equal to the eluent flow rate
Run Time: 45 min
Background Conductance: < 0.4 µS
System Backpressure: ~ 4200 psi
Gradient Time (min) KOH (mM)
-2 1 0 1 10.07 1 24 15 24.01 15 35 27 40 60 44 60 44.01 1 45 1
4
Preparation of solutions and reagents Single organic acid standard stock solutions, 2,500 mg/LWeigh the amount listed in Table 1 into a 100 mL volumetric flask. Dissolve with approximately 80 mL of DI water, mix, and fill to the mark with DI water.
Conditions
System B (ion-exclusion system)
Columns: Thermo Scientific™ Dionex™ IonPac™ NG1 Guard, 4 × 35 mm (P/N 039567) Thermo Scientific™ Dionex™ IonPac™ ICE-AS6, Analytical, 9 × 250 mm (P/N 079798)
Eluent: 0.32 mM HFBA
Flow Rate: 1 mL/min
Column Temperature: 20°C
Detector Compartment Temperature: 30°C
Detector Temperature: 35°C
Injection Volume: 10 µL (Full loop)
Detection: Suppressed Conductivity, Dionex ACRS-ICE 500, 9 mm, external mode
Regenerant: 5 mM Tetrabutylammonium hydroxide (flow rate = 2 mL/min)
Run Time: 40 min
Background Conductance: < 20 µS
System Backpressure: ~ 1100 psi
Conditions (continued)
System A (ion-exchange system)
Multistep Gradient Time (min) %B
-2 0 0 0 10.7 8 20 8 25 15 31 15 33 8 33.01 0 45 0Note: Eluents A (DI water) and B (Methanol) are mixed by the pump and then passed through the EGC KOH cartridge where the KOH gradient is generated
Analyte CompoundAmount
(mg)Acetic acid Acetic acid 250.0
Citric acid Citric acid monohydrate 273.5
Formic acid Formic acid 250.0
Fumaric acid Fumaric acid 250.0
Lactic acid Lactic acid 250.0
Malic acid D-L-Malic acid disodium salt 332.0
Propionic acid Propionic acid 250.0
Malonic acid Malonic acid, disodium salt 355.6
Succinic acid Succinic acid 250.0
Quinic acid Quinic acid 250.0
Table 1. Masses of compounds used to prepare 100 mL of 2500 mg/L organic acid standards.
Single anion stock, 1,000 mg/LWeigh the amount listed in Table 2 into a 100 mL volumetric flask. Dissolve with approximately 80 mL of DI water, mix, and fill to the mark with DI water.
Analyte CompoundAmount
(mg)Fluoride Sodium fluoride (NaF) 221.0
Chloride Sodium chloride (NaCl) 164.9
Nitrite Sodium nitrite (NaNO2) 150.0
Bromide Sodium bromide (NaBr) 128.8
Nitrate Sodium nitrate (NaNO3) 137.1
Sulfate Sodium sulfate (Na2SO4) 147.9
PhosphatePotassium phosphate, monobasic (KH2PO4)
143.3
Table 2. Masses of compounds used to prepare 100 mL of 1000 mg/L anion standards.
System A - Ten mixed organic acid standard solution, 100 mg/L Accurately pipette 4 mL of each single standard stock solution (Table 1) into a 100 mL volumetric flask and fill up to the mark with DI water. The maximum storage time is 2 months at 4°C.
5
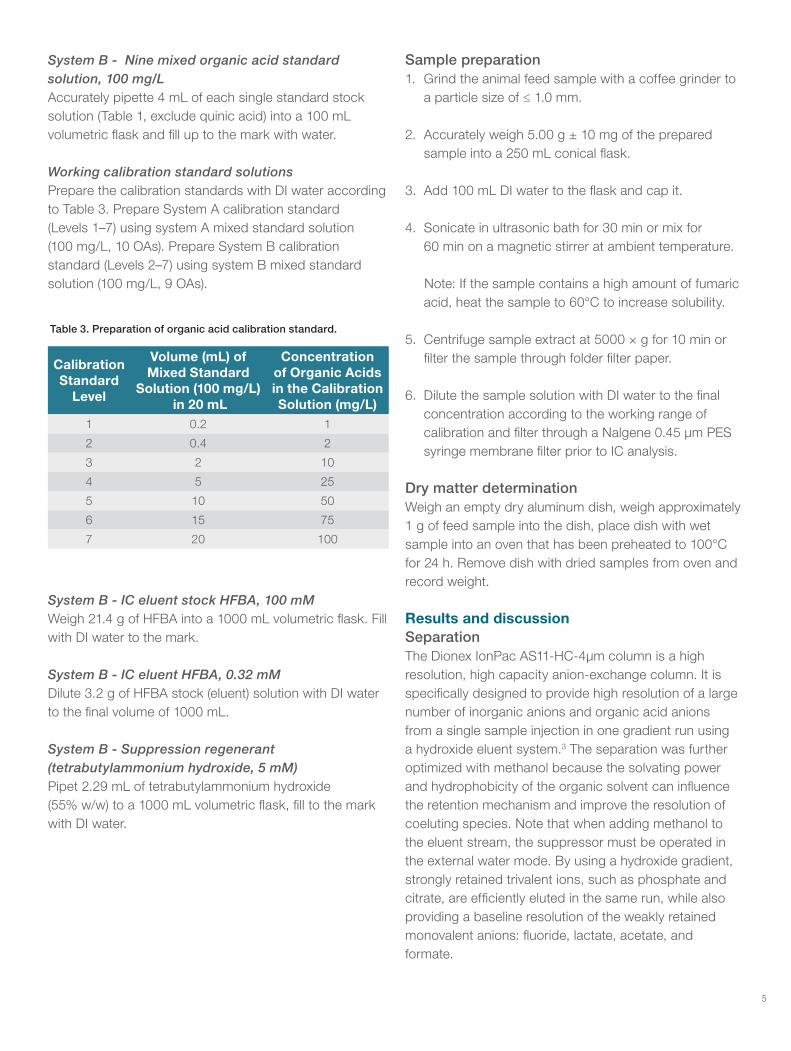
System B - Nine mixed organic acid standard solution, 100 mg/L Accurately pipette 4 mL of each single standard stock solution (Table 1, exclude quinic acid) into a 100 mL volumetric flask and fill up to the mark with water.
Working calibration standard solutionsPrepare the calibration standards with DI water according to Table 3. Prepare System A calibration standard (Levels 1–7) using system A mixed standard solution (100 mg/L, 10 OAs). Prepare System B calibration standard (Levels 2–7) using system B mixed standard solution (100 mg/L, 9 OAs).
Calibration Standard
Level
Volume (mL) of Mixed Standard
Solution (100 mg/L) in 20 mL
Concentration of Organic Acids in the Calibration Solution (mg/L)
1 0.2 1
2 0.4 2
3 2 10
4 5 25
5 10 50
6 15 75
7 20 100
Table 3. Preparation of organic acid calibration standard.
System B - IC eluent stock HFBA, 100 mMWeigh 21.4 g of HFBA into a 1000 mL volumetric flask. Fill with DI water to the mark.
System B - IC eluent HFBA, 0.32 mMDilute 3.2 g of HFBA stock (eluent) solution with DI water to the final volume of 1000 mL.
System B - Suppression regenerant (tetrabutylammonium hydroxide, 5 mM)Pipet 2.29 mL of tetrabutylammonium hydroxide (55% w/w) to a 1000 mL volumetric flask, fill to the mark with DI water.
Sample preparation1. Grind the animal feed sample with a coffee grinder to
a particle size of ≤ 1.0 mm.
2. Accurately weigh 5.00 g ± 10 mg of the prepared sample into a 250 mL conical flask.
3. Add 100 mL DI water to the flask and cap it.
4. Sonicate in ultrasonic bath for 30 min or mix for 60 min on a magnetic stirrer at ambient temperature.
Note: If the sample contains a high amount of fumaric acid, heat the sample to 60°C to increase solubility.
5. Centrifuge sample extract at 5000 × g for 10 min or filter the sample through folder filter paper.
6. Dilute the sample solution with DI water to the final concentration according to the working range of calibration and filter through a Nalgene 0.45 µm PES syringe membrane filter prior to IC analysis.
Dry matter determinationWeigh an empty dry aluminum dish, weigh approximately 1 g of feed sample into the dish, place dish with wet sample into an oven that has been preheated to 100°C for 24 h. Remove dish with dried samples from oven and record weight.
Results and discussionSeparationThe Dionex IonPac AS11-HC-4μm column is a high resolution, high capacity anion-exchange column. It is specifically designed to provide high resolution of a large number of inorganic anions and organic acid anions from a single sample injection in one gradient run using a hydroxide eluent system.3 The separation was further optimized with methanol because the solvating power and hydrophobicity of the organic solvent can influence the retention mechanism and improve the resolution of coeluting species. Note that when adding methanol to the eluent stream, the suppressor must be operated in the external water mode. By using a hydroxide gradient, strongly retained trivalent ions, such as phosphate and citrate, are efficiently eluted in the same run, while also providing a baseline resolution of the weakly retained monovalent anions: fluoride, lactate, acetate, and formate.
6
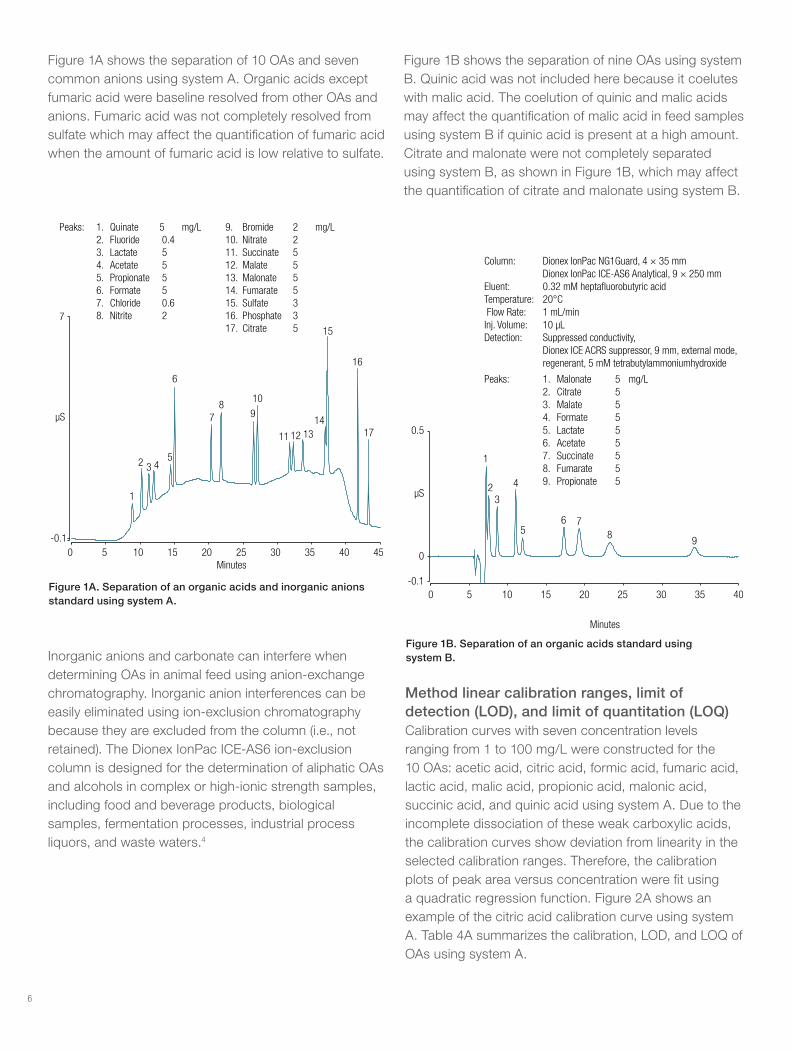
Figure 1A shows the separation of 10 OAs and seven common anions using system A. Organic acids except fumaric acid were baseline resolved from other OAs and anions. Fumaric acid was not completely resolved from sulfate which may affect the quantification of fumaric acid when the amount of fumaric acid is low relative to sulfate.
0 5 10 15 20 25 30 35 40 45-0.1
7
1
2 3 45
6
78
9
10
11 12 1314
15
16
17
Minutes
µS
Peaks: 1. Quinate 5 mg/L 2. Fluoride 0.4 3. Lactate 5 4. Acetate 5 5. Propionate 5 6. Formate 5 7. Chloride 0.6 8. Nitrite 2
9. Bromide 2 mg/L 10. Nitrate 2 11. Succinate 5 12. Malate 5 13. Malonate 5 14. Fumarate 5 15. Sulfate 3 16. Phosphate 3 17. Citrate 5
Figure 1A. Separation of an organic acids and inorganic anions standard using system A.
Inorganic anions and carbonate can interfere when determining OAs in animal feed using anion-exchange chromatography. Inorganic anion interferences can be easily eliminated using ion-exclusion chromatography because they are excluded from the column (i.e., not retained). The Dionex IonPac ICE-AS6 ion-exclusion column is designed for the determination of aliphatic OAs and alcohols in complex or high-ionic strength samples, including food and beverage products, biological samples, fermentation processes, industrial process liquors, and waste waters.4
Figure 1B shows the separation of nine OAs using system B. Quinic acid was not included here because it coelutes with malic acid. The coelution of quinic and malic acids may affect the quantification of malic acid in feed samples using system B if quinic acid is present at a high amount. Citrate and malonate were not completely separated using system B, as shown in Figure 1B, which may affect the quantification of citrate and malonate using system B.
0 5 10 15 20 25 30 35 40-0.1
0
0.5
1
23
4
56 7
89
µS
Column: Dionex IonPac NG1Guard, 4 × 35 mm Dionex IonPac ICE-AS6 Analytical, 9 × 250 mm Eluent: 0.32 mM heptafluorobutyric acidTemperature: 20°C Flow Rate: 1 mL/minInj. Volume: 10 µL Detection: Suppressed conductivity, Dionex ICE ACRS suppressor, 9 mm, external mode, regenerant, 5 mM tetrabutylammoniumhydroxide
Peaks: 1. Malonate 5 mg/L 2. Citrate 5 3. Malate 5 4. Formate 5 5. Lactate 5 6. Acetate 5 7. Succinate 5 8. Fumarate 5 9. Propionate 5
Minutes
Figure 1B. Separation of an organic acids standard using system B.
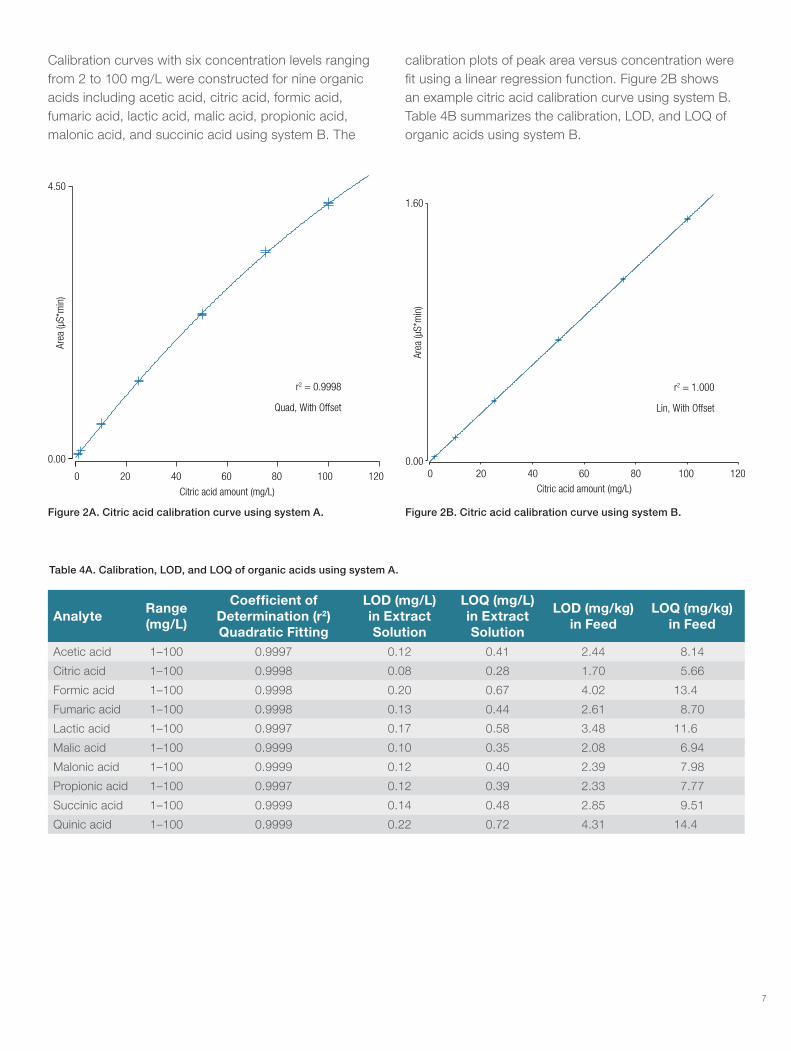
Method linear calibration ranges, limit of detection (LOD), and limit of quantitation (LOQ)Calibration curves with seven concentration levels ranging from 1 to 100 mg/L were constructed for the 10 OAs: acetic acid, citric acid, formic acid, fumaric acid, lactic acid, malic acid, propionic acid, malonic acid, succinic acid, and quinic acid using system A. Due to the incomplete dissociation of these weak carboxylic acids, the calibration curves show deviation from linearity in the selected calibration ranges. Therefore, the calibration plots of peak area versus concentration were fit using a quadratic regression function. Figure 2A shows an example of the citric acid calibration curve using system A. Table 4A summarizes the calibration, LOD, and LOQ of OAs using system A.
7
0 20 40 60 80 100 120
Citric acid amount (mg/L)
0.00
4.50
Area
(µS*
min
)
r2 = 0.9998
Quad, With Offset
Table 4A. Calibration, LOD, and LOQ of organic acids using system A.
AnalyteRange (mg/L)
Coefficient of Determination (r2) Quadratic Fitting
LOD (mg/L) in Extract Solution
LOQ (mg/L) in Extract Solution
LOD (mg/kg) in Feed
LOQ (mg/kg) in Feed
Acetic acid 1–100 0.9997 0.12 0.41 2.44 8.14
Citric acid 1–100 0.9998 0.08 0.28 1.70 5.66
Formic acid 1–100 0.9998 0.20 0.67 4.02 13.4
Fumaric acid 1–100 0.9998 0.13 0.44 2.61 8.70
Lactic acid 1–100 0.9997 0.17 0.58 3.48 11.6
Malic acid 1–100 0.9999 0.10 0.35 2.08 6.94
Malonic acid 1–100 0.9999 0.12 0.40 2.39 7.98
Propionic acid 1–100 0.9997 0.12 0.39 2.33 7.77
Succinic acid 1–100 0.9999 0.14 0.48 2.85 9.51
Quinic acid 1–100 0.9999 0.22 0.72 4.31 14.4
Calibration curves with six concentration levels ranging from 2 to 100 mg/L were constructed for nine organic acids including acetic acid, citric acid, formic acid, fumaric acid, lactic acid, malic acid, propionic acid, malonic acid, and succinic acid using system B. The
Figure 2A. Citric acid calibration curve using system A.
calibration plots of peak area versus concentration were fit using a linear regression function. Figure 2B shows an example citric acid calibration curve using system B. Table 4B summarizes the calibration, LOD, and LOQ of organic acids using system B.
0 20 40 60 80 100 1200.00
1.60
Citric acid amount (mg/L)
Area
(µS*
min
)
r2 = 1.000
Lin, With Offset
Figure 2B. Citric acid calibration curve using system B.
8
Table 4B. Calibration, LOD, and LOQ of organic acids using system B.
AnalyteRange (mg/L)
Coefficient of Determination (r2)
Linear Fitting
LOD (mg/L)
LOQ (mg/L)
LOD (mg/kg) in
Feed
LOQ (mg/kg) in
FeedAcetic acid 2–100 1.0000 0.16 0.52 3.15 10.5
Citric acid 2–100 1.0000 0.26 0.85 5.13 17.1
Formic acid 2–100 1.0000 0.28 0.92 5.50 18.3
Fumaric acid 2–100 1.0000 0.30 1.00 6.00 20.0
Lactic acid 2–100 1.0000 0.24 0.80 4.79 16.0
Malic acid 2–100 1.0000 0.14 0.47 2.85 9.49
Malonic acid 2–100 1.0000 0.36 1.20 7.18 23.9
Propionic acid 2–100 1.0000 0.39 1.31 7.86 26.2
Succinic acid 2–100 1.0000 0.28 0.95 5.69 19.0
To determine the limit of detection (LOD) and limit of quantification (LOQ), the baseline noise was first determined by measuring the peak-to-peak noise in a representative 1 min segment of the baseline where no peaks elute, but close to the peak of interest. The LOD and LOQ were then calculated from the average peak height of three injections of standard mixture (0.25, 0.5, or 1 ppm). The LOD and LOQ in the feed sample were calculated on the basis of the sample weight (5 g) and extraction volume (100 mL).
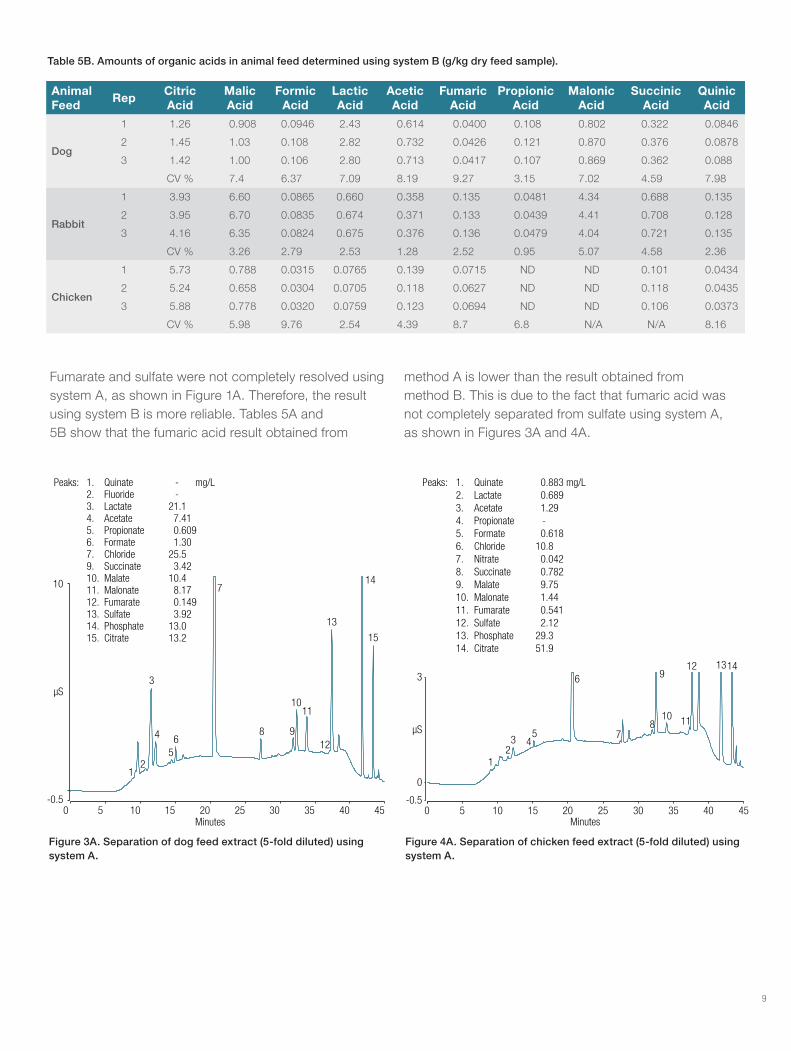
Analysis of animal feed samplesThree animal feed samples were extracted and analyzed using the two IC methods described above. The concentrations of OAs were accurately quantified from their respective calibration curves. The concentrations of all the anions were estimated using the anion mixture. Tables 5A and 5B summarize the results of OAs using systems A and B, respectively. In dog feed, citric, malic, and lactic acids are the three major OAs. In rabbit feed, citric, malic, and malonic acids are the three major OAs. In chicken, citric acid and malic acid are the two major OAs.
Table 5A. Amounts of organic acids in animal feed determined using system A (g/kg dry feed sample).
Animal Feed
RepCitric Acid
Malic Acid
Formic Acid
Lactic Acid
Acetic Acid
Fumaric Acid
Propionic Acid
Malonic Acid
Succinic Acid
Quinic Acid
Dog
1 1.19 0.966 0.108 1.99 0.671 0.0221 0.108 0.834 0.336 0.0846
2 1.42 1.12 0.120 2.25 0.797 0.0264 0.115 0.938 0.374 0.0878
3 1.42 1.11 0.127 2.28 0.807 0.0246 0.118 0.933 0.371 0.088
CV % 9.93 8.05 8.30 7.43 9.96 9.05 4.37 6.51 5.93 9.93
Rabbit
1 3.56 6.52 0.0717 0.588 0.437 0.0981 0.0499 5.07 0.630 0.135
2 3.60 6.60 0.0731 0.610 0.420 0.0920 0.0554 4.98 0.667 0.128
3 3.82 6.75 0.0820 0.585 0.462 0.108 0.0487 5.10 0.623 0.135
CV % 3.76 1.78 7.40 2.26 4.88 8.10 6.95 1.28 3.70 3.23
Chicken
1 5.60 0.919 0.0341 0.0690 0.120 0.0504 N/A 0.158 0.0989 0.0434
2 5.27 0.871 0.0318 0.0752 0.111 0.0557 N/A 0.164 0.0974 0.0435
3 5.71 1.00 0.0325 0.0760 0.108 0.0592 N/A 0.169 0.0995 0.0373
CV % 4.19 7.18 3.57 5.17 5.59 8.07 N/A 3.26 1.12 8.59
9
Table 5B. Amounts of organic acids in animal feed determined using system B (g/kg dry feed sample).
Animal Feed
RepCitric Acid
Malic Acid
Formic Acid
Lactic Acid
Acetic Acid
Fumaric Acid
Propionic Acid
Malonic Acid
Succinic Acid
Quinic Acid
Dog
1 1.26 0.908 0.0946 2.43 0.614 0.0400 0.108 0.802 0.322 0.0846
2 1.45 1.03 0.108 2.82 0.732 0.0426 0.121 0.870 0.376 0.0878
3 1.42 1.00 0.106 2.80 0.713 0.0417 0.107 0.869 0.362 0.088
CV % 7.4 6.37 7.09 8.19 9.27 3.15 7.02 4.59 7.98
Rabbit
1 3.93 6.60 0.0865 0.660 0.358 0.135 0.0481 4.34 0.688 0.135
2 3.95 6.70 0.0835 0.674 0.371 0.133 0.0439 4.41 0.708 0.128
3 4.16 6.35 0.0824 0.675 0.376 0.136 0.0479 4.04 0.721 0.135
CV % 3.26 2.79 2.53 1.28 2.52 0.95 5.07 4.58 2.36
Chicken
1 5.73 0.788 0.0315 0.0765 0.139 0.0715 ND ND 0.101 0.0434
2 5.24 0.658 0.0304 0.0705 0.118 0.0627 ND ND 0.118 0.0435
3 5.88 0.778 0.0320 0.0759 0.123 0.0694 ND ND 0.106 0.0373
CV % 5.98 9.76 2.54 4.39 8.7 6.8 N/A N/A 8.16
Fumarate and sulfate were not completely resolved using system A, as shown in Figure 1A. Therefore, the result using system B is more reliable. Tables 5A and 5B show that the fumaric acid result obtained from
0 5 10 15 20 25 30 35 40 45-0.5
10
12
3
4
56
7
8 9
1011
12
13
15
Minutes
µS
14
Peaks: 1. Quinate - mg/L 2. Fluoride - 3. Lactate 21.1 4. Acetate 7.41 5. Propionate 0.609 6. Formate 1.30 7. Chloride 25.5 9. Succinate 3.42 10. Malate 10.4 11. Malonate 8.17 12. Fumarate 0.149 13. Sulfate 3.92 14. Phosphate 13.0 15. Citrate 13.2
method A is lower than the result obtained from method B. This is due to the fact that fumaric acid was not completely separated from sulfate using system A, as shown in Figures 3A and 4A.
Figure 3A. Separation of dog feed extract (5-fold diluted) using system A.
Figure 4A. Separation of chicken feed extract (5-fold diluted) using system A.
0 5 10 15 20 25 30 35 40 45-0.5
0
3
Minutes
µS
12
3 45
6
78
9
10 11
12 1314
Peaks: 1. Quinate 0.883 mg/L 2. Lactate 0.689 3. Acetate 1.29 4. Propionate - 5. Formate 0.618 6. Chloride 10.8 7. Nitrate 0.042 8. Succinate 0.782 9. Malate 9.75 10. Malonate 1.44 11. Fumarate 0.541 12. Sulfate 2.12 13. Phosphate 29.3 14. Citrate 51.9
10
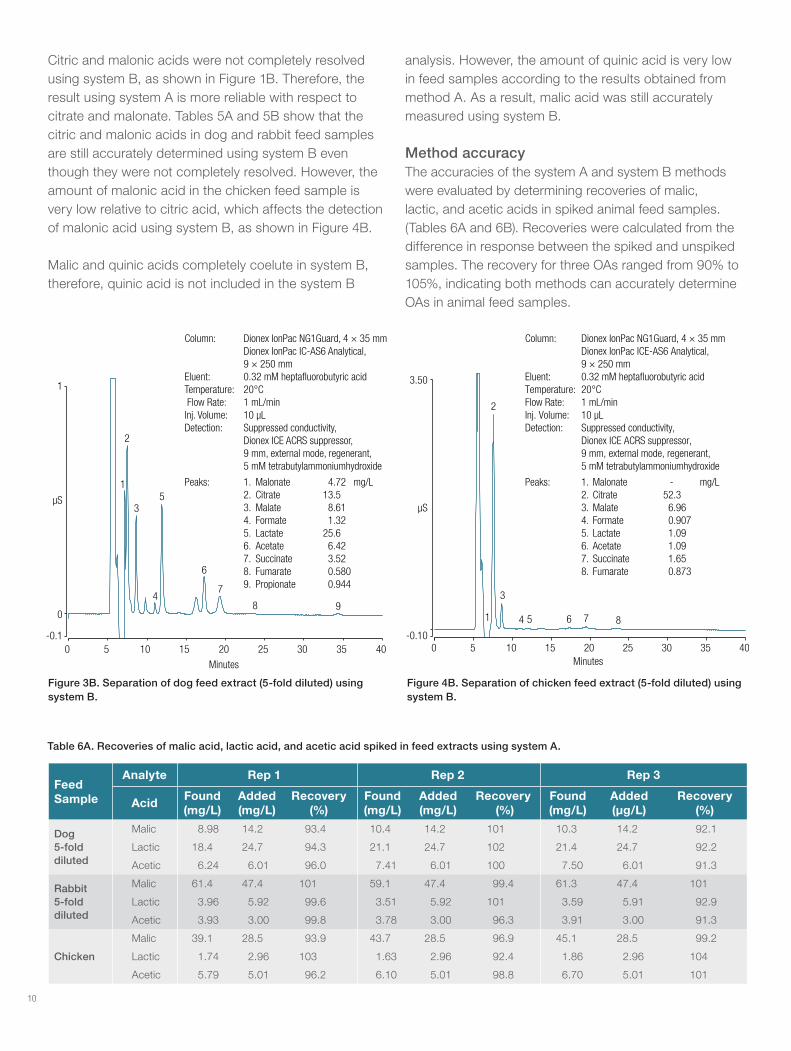
Citric and malonic acids were not completely resolved using system B, as shown in Figure 1B. Therefore, the result using system A is more reliable with respect to citrate and malonate. Tables 5A and 5B show that the citric and malonic acids in dog and rabbit feed samples are still accurately determined using system B even though they were not completely resolved. However, the amount of malonic acid in the chicken feed sample is very low relative to citric acid, which affects the detection of malonic acid using system B, as shown in Figure 4B.
Malic and quinic acids completely coelute in system B, therefore, quinic acid is not included in the system B
Figure 3B. Separation of dog feed extract (5-fold diluted) using system B.
Figure 4B. Separation of chicken feed extract (5-fold diluted) using system B.
0 5 10 15 20 25 30 35 40-0.1
0
1
Minutes
µS
1
2
3
4
5
6
7
8 9
Column: Dionex IonPac NG1Guard, 4 × 35 mm Dionex IonPac IC-AS6 Analytical, 9 × 250 mm Eluent: 0.32 mM heptafluorobutyric acidTemperature: 20°C Flow Rate: 1 mL/minInj. Volume: 10 µL Detection: Suppressed conductivity, Dionex ICE ACRS suppressor, 9 mm, external mode, regenerant, 5 mM tetrabutylammoniumhydroxide
Peaks: 1. Malonate 4.72 mg/L 2. Citrate 13.5 3. Malate 8.61 4. Formate 1.32 5. Lactate 25.6 6. Acetate 6.42 7. Succinate 3.52 8. Fumarate 0.580 9. Propionate 0.944
analysis. However, the amount of quinic acid is very low in feed samples according to the results obtained from method A. As a result, malic acid was still accurately measured using system B.
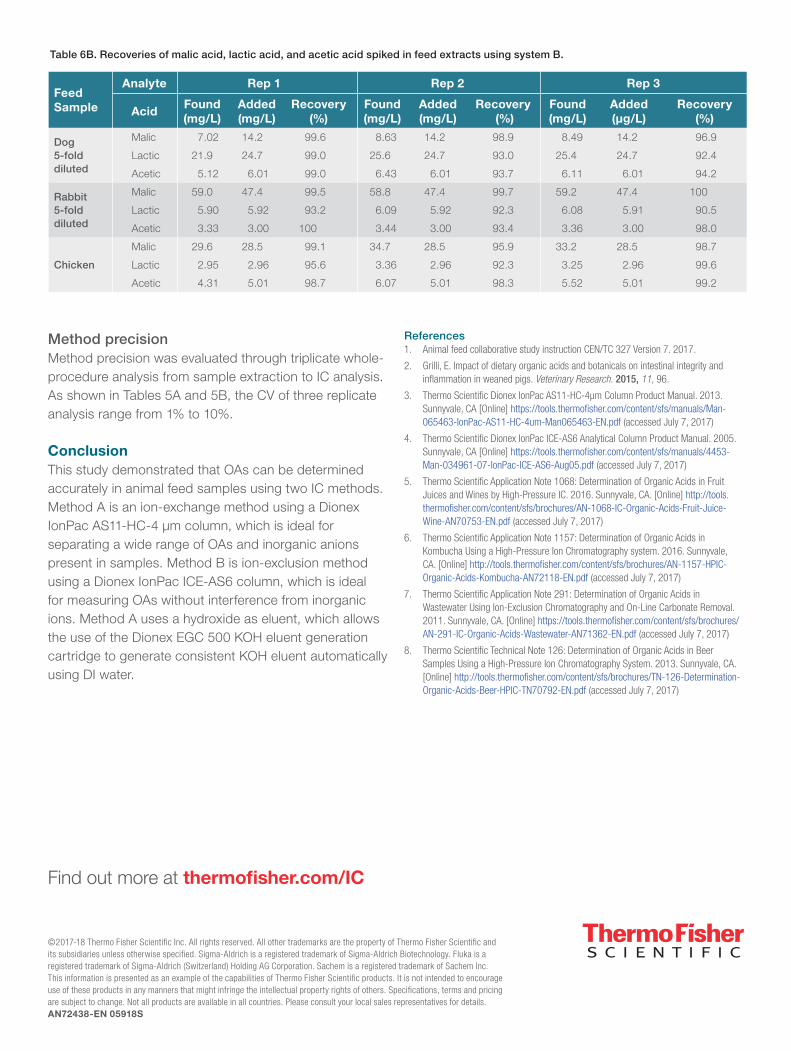
Method accuracy The accuracies of the system A and system B methods were evaluated by determining recoveries of malic, lactic, and acetic acids in spiked animal feed samples. (Tables 6A and 6B). Recoveries were calculated from the difference in response between the spiked and unspiked samples. The recovery for three OAs ranged from 90% to 105%, indicating both methods can accurately determine OAs in animal feed samples.
Table 6A. Recoveries of malic acid, lactic acid, and acetic acid spiked in feed extracts using system A.
Feed Sample
Analyte Rep 1 Rep 2 Rep 3
AcidFound (mg/L)
Added (mg/L)
Recovery (%)
Found (mg/L)
Added (mg/L)
Recovery (%)
Found (mg/L)
Added (µg/L)
Recovery (%)
Dog 5-fold diluted
Malic 8.98 14.2 93.4 10.4 14.2 101 10.3 14.2 92.1
Lactic 18.4 24.7 94.3 21.1 24.7 102 21.4 24.7 92.2
Acetic 6.24 6.01 96.0 7.41 6.01 100 7.50 6.01 91.3
Rabbit 5-fold diluted
Malic 61.4 47.4 101 59.1 47.4 99.4 61.3 47.4 101
Lactic 3.96 5.92 99.6 3.51 5.92 101 3.59 5.91 92.9
Acetic 3.93 3.00 99.8 3.78 3.00 96.3 3.91 3.00 91.3
Chicken
Malic 39.1 28.5 93.9 43.7 28.5 96.9 45.1 28.5 99.2
Lactic 1.74 2.96 103 1.63 2.96 92.4 1.86 2.96 104
Acetic 5.79 5.01 96.2 6.10 5.01 98.8 6.70 5.01 101
0 5 10 15 20 25 30 35 40-0.10
3.50
Minutes
µS
1
2
3
4 5 6 7 8
Column: Dionex IonPac NG1Guard, 4 × 35 mm Dionex IonPac ICE-AS6 Analytical, 9 × 250 mm Eluent: 0.32 mM heptafluorobutyric acidTemperature: 20°CFlow Rate: 1 mL/minInj. Volume: 10 µL Detection: Suppressed conductivity, Dionex ICE ACRS suppressor, 9 mm, external mode, regenerant, 5 mM tetrabutylammoniumhydroxide
Peaks: 1. Malonate - mg/L 2. Citrate 52.3 3. Malate 6.96 4. Formate 0.907 5. Lactate 1.09 6. Acetate 1.09 7. Succinate 1.65 8. Fumarate 0.873
©2017-18 Thermo Fisher Scientific Inc. All rights reserved. All other trademarks are the property of Thermo Fisher Scientific and its subsidiaries unless otherwise specified. Sigma-Aldrich is a registered trademark of Sigma-Aldrich Biotechnology. Fluka is a registered trademark of Sigma-Aldrich (Switzerland) Holding AG Corporation. Sachem is a registered trademark of Sachem Inc. This information is presented as an example of the capabilities of Thermo Fisher Scientific products. It is not intended to encourage use of these products in any manners that might infringe the intellectual property rights of others. Specifications, terms and pricing are subject to change. Not all products are available in all countries. Please consult your local sales representatives for details. AN72438-EN 05918S
Find out more at thermofisher.com/IC
References1. Animal feed collaborative study instruction CEN/TC 327 Version 7. 2017.
2. Grilli, E. Impact of dietary organic acids and botanicals on intestinal integrity and inflammation in weaned pigs. Veterinary Research. 2015, 11, 96.
3. Thermo Scientific Dionex IonPac AS11-HC-4μm Column Product Manual. 2013. Sunnyvale, CA [Online] https://tools.thermofisher.com/content/sfs/manuals/Man-065463-IonPac-AS11-HC-4um-Man065463-EN.pdf (accessed July 7, 2017)
4. Thermo Scientific Dionex IonPac ICE-AS6 Analytical Column Product Manual. 2005. Sunnyvale, CA [Online] https://tools.thermofisher.com/content/sfs/manuals/4453-Man-034961-07-IonPac-ICE-AS6-Aug05.pdf (accessed July 7, 2017)
5. Thermo Scientific Application Note 1068: Determination of Organic Acids in Fruit Juices and Wines by High-Pressure IC. 2016. Sunnyvale, CA. [Online] http://tools.thermofisher.com/content/sfs/brochures/AN-1068-IC-Organic-Acids-Fruit-Juice-Wine-AN70753-EN.pdf (accessed July 7, 2017)
6. Thermo Scientific Application Note 1157: Determination of Organic Acids in Kombucha Using a High-Pressure Ion Chromatography system. 2016. Sunnyvale, CA. [Online] http://tools.thermofisher.com/content/sfs/brochures/AN-1157-HPIC-Organic-Acids-Kombucha-AN72118-EN.pdf (accessed July 7, 2017)
7. Thermo Scientific Application Note 291: Determination of Organic Acids in Wastewater Using Ion-Exclusion Chromatography and On-Line Carbonate Removal. 2011. Sunnyvale, CA. [Online] https://tools.thermofisher.com/content/sfs/brochures/AN-291-IC-Organic-Acids-Wastewater-AN71362-EN.pdf (accessed July 7, 2017)
8. Thermo Scientific Technical Note 126: Determination of Organic Acids in Beer Samples Using a High-Pressure Ion Chromatography System. 2013. Sunnyvale, CA. [Online] http://tools.thermofisher.com/content/sfs/brochures/TN-126-Determination-Organic-Acids-Beer-HPIC-TN70792-EN.pdf (accessed July 7, 2017)
Method precisionMethod precision was evaluated through triplicate whole-procedure analysis from sample extraction to IC analysis.As shown in Tables 5A and 5B, the CV of three replicate analysis range from 1% to 10%.
ConclusionThis study demonstrated that OAs can be determined accurately in animal feed samples using two IC methods. Method A is an ion-exchange method using a Dionex IonPac AS11-HC-4 µm column, which is ideal for separating a wide range of OAs and inorganic anions present in samples. Method B is ion-exclusion method using a Dionex IonPac ICE-AS6 column, which is ideal for measuring OAs without interference from inorganic ions. Method A uses a hydroxide as eluent, which allows the use of the Dionex EGC 500 KOH eluent generation cartridge to generate consistent KOH eluent automatically using DI water.
Table 6B. Recoveries of malic acid, lactic acid, and acetic acid spiked in feed extracts using system B.
Feed Sample
Analyte Rep 1 Rep 2 Rep 3
AcidFound (mg/L)
Added (mg/L)
Recovery (%)
Found (mg/L)
Added (mg/L)
Recovery (%)
Found (mg/L)
Added (µg/L)
Recovery (%)
Dog 5-fold diluted
Malic 7.02 14.2 99.6 8.63 14.2 98.9 8.49 14.2 96.9
Lactic 21.9 24.7 99.0 25.6 24.7 93.0 25.4 24.7 92.4
Acetic 5.12 6.01 99.0 6.43 6.01 93.7 6.11 6.01 94.2
Rabbit 5-fold diluted
Malic 59.0 47.4 99.5 58.8 47.4 99.7 59.2 47.4 100
Lactic 5.90 5.92 93.2 6.09 5.92 92.3 6.08 5.91 90.5
Acetic 3.33 3.00 100 3.44 3.00 93.4 3.36 3.00 98.0
Chicken
Malic 29.6 28.5 99.1 34.7 28.5 95.9 33.2 28.5 98.7
Lactic 2.95 2.96 95.6 3.36 2.96 92.3 3.25 2.96 99.6
Acetic 4.31 5.01 98.7 6.07 5.01 98.3 5.52 5.01 99.2


![Acids and Bases: Titration #1 Determination of [NaOH] by](https://img.pdfslide.us/doc/110x75/5868ef411a28abc92d8b909a/acids-and-bases-titration-1-determination-of-naoh-by-.jpg)