Embed Size (px)
Citation preview
RIGHT:
URL:
CITATION:
AUTHOR(S):
ISSUE DATE:
TITLE:
Determination of Very Weak Acidsand Bases by Means of ElectrolyticConductivity Measurements
Horiba, Shinkichi
Horiba, Shinkichi. Determination of Very Weak Acids and Bases by Means of ElectrolyticConductivity Measurements. Memoirs of the College of Science, Kyoto Imperial University1914, 1(1): 35-47
1914-10-10
http://hdl.handle.net/2433/256424
Determination of Very Weak Acids and Bases by Means of Electrolytic Conductivity
Measurements.
BY
Shinkichi Horiba.
(Received July 6, 1914.)
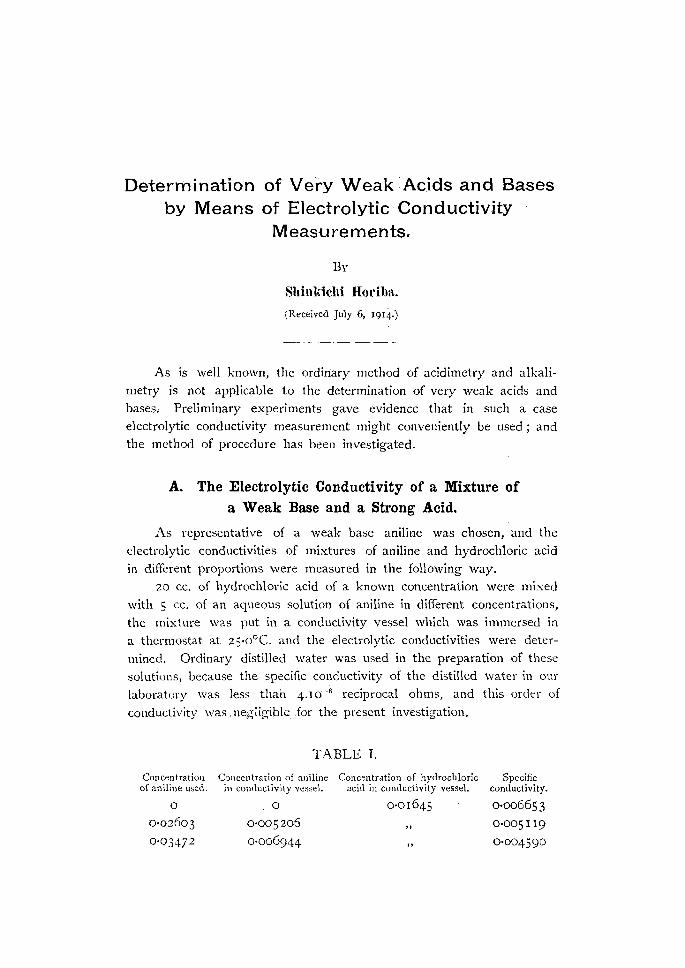
As is well known, the ordinary method of acidirnetry and alkali
metry is not applicable to the determination of very weak acids and
bases. Preliminary experiments gave evidence that in such a case
electrolytic conductivity measurement might conveniently be used; and the method of procedure has been investigated.
A. The Electrolytic Conductivity of a Mixture of a Weak Base and a Strong Acid.
As representative of a weak base aniline was chosen, and the
electrolytic conductivities of mixtures of aniline and hydrochloric acid
in different proportions were measured in the following way.
20 cc. of hydrochloric acid of a known concentration were mixed
with 5 cc. of an aqueous solution of aniline in different concentrations,
the mixture was put in a conductivity vessel which was immersed in
a thermostat at 25,0°C. and the electrolytic conductivities were deter
mined. Ordinary distilled water was used in the preparation of these
solutions, because the specific conductivity of the distilled water in our
laboratory was less thai1 4.10-6 reciprocal ohms, and this order of
conductivity was negligible for the present investigation.
TABLE I.
Concentration Concentration of aniline Concentration of hydrochloric Specific of aniline used. in conductivity vessel. acid in conductivity vessel. conductivity.
0 0 0-01645 o'.006653 o,026o3 0-005206
" 0·005II9 0,03472 0-006944 " 0-004590
0-04166
0-05207
0-05946
0-07.425 0-07680
0-09670
0•1485
Shzi1kichi Horiba.
0-008332 0•01041
0•01 I 89
0•01485 0-01536
0-01934 0-0297
" " "
"
0•004156
0-003505 0,003077 0,002284
0•002150 0-001730
0-001697
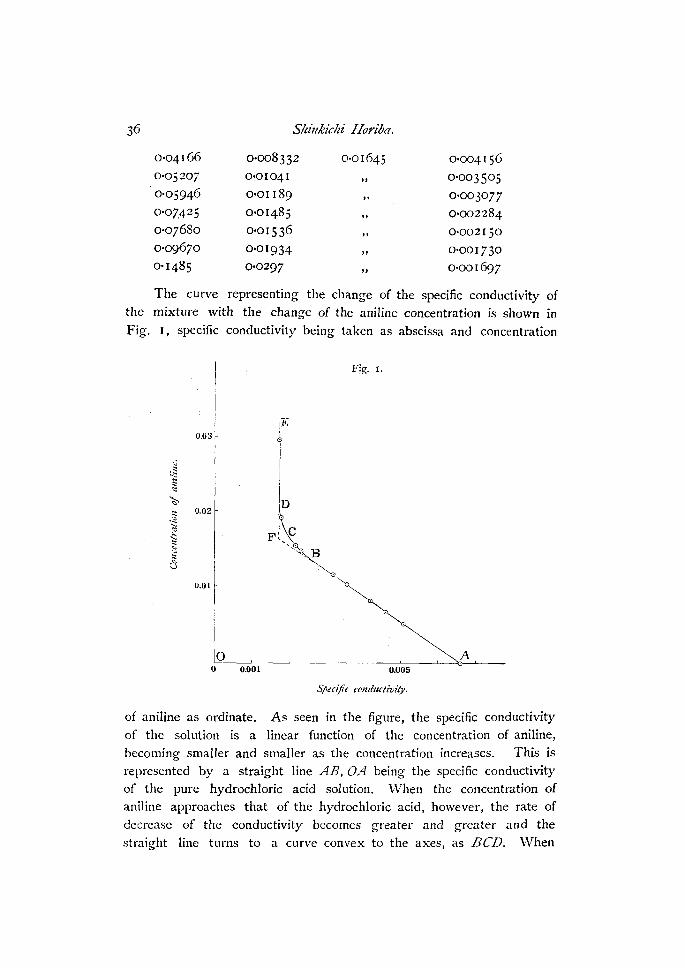
The curve representing the change of the specific conductivity of the mixture with the change of the aniline concentration is shown in
Fig. I, specific conductivity being taken as abscissa and concentration
0.03
~ :g
I ~ ~
""[ ~ -~ ~ .: " a
0.01
lo 0 0.001
Fig. 1.
rE <h
~ Fl~
',C\,._
-~ 0
0.005
Specific conductivity.
A
of aniline as ordinate. As seen in the figure, the specific conductivity of the solution is a linear function of the concentration of aniline, becoming smaller and smaller as the concentration increases. This is
represented by a straight line AB, OA being the specific conductivity of the pure hydrochloric acid solution. When the concentration of aniline approaches that of the hydrochloric acid, however, the rate of
decrease of the conductivity becomes greater and greater and the straight line turns to a curve convex to the axes, as BCD. \Vhen
Determination of Very Weak Acids and Bases etc. 37
aniline is present in excess, the specific conductiyity varies very slightly with its concentration; and .the .. relation;! is .again represented by a straight line DE, which is almost parallel to the ordinate axis. The point F, the intersection of the elongations of the two straight lines AB and DE, is the point corresponding to a concentration of aniline
exactly equivalent to the hydrochloric acid in the solution.
Now let Xm and x,. be respectively ~he specific conductivities of the mixture and the pure acid solution, and Cb be the concentration of the base added; then the straight line AB in Fig. r .. may be represented
by an equation as follows :
X,n = PC,,+ X0 (r)
where P is a ~onstant. It is easily seen that the change of the conductivity of the solution with the addition of aniline· is due to two
different causes, firstly the conductivity is decreased by the gradual disappearance of free hydrochl6;ic ac'id arid secondly it is increaied by
the gradual formation of the neutral salt. Thus the factor P must consist of the two parts corresponding to these two terms.
Since hydrochloric acid and its neutral salt may be taken as having the same dissociation degree in dilute solutions, we have the following equations:
(2)
where Xa and C,. denote respectively the specific conductivity of hydrochloric acid and the concentration of the acid and r1.a is a constant for hodrochloric acid.
Similarly we have the following expression for the neutral salt,
x, = a, C: (3)
when any hydrolysis of the salt is negligible. If the relations (2) and (3) hold, the coefficiertt P can be dissolv
ed into two terms such as,
then, we have
This equation was derived under the assumption that no hydrolytic dissociation took place, but in fact it becomes remarkable only
when the free acid is greatly decreased and the curved part BCD of Fig. I is the result. When aniline is present in excess, the conduc-
Sltinki'c//£ Hori't-a.
tivity is almost entirely due to the neutral salt in the solution, and the
conductivity, due to the free weak base itself in the presence of its
neutral salt, may be neglected. This explains the fact that an excess of aniline has no noticeable, effect on the conductivity of the solution.
Calcuiati'on of t!te Factor 11,,.
Concentration of hydrochloric acid.
0-03296
0•0I 645 0•0l028
0-00685
TABLE II.
Specific ia conductivity. C(a=~·,
Ca.
0•0131.4 0-400
0-006635 0-405 0-004190 0-408
o-co2819 0-412
Concentration of hydrochloric acid (calc.).
0-0325 2
0-01643
0·01037 0-00698
The factor r1.a changes a little with the concentration of the acid ;
but taking r1.a as a constant, say r1.a : 0-404, the calculated values of
the concentrations from the observed specific conductivities :ire not very
different from the actual values, as shown in the 4th,column of Table II. For equation (4), however; the observed value and not 0·-J.04 x Cn must be used, because a small error in xa will remarkably affect the cal
culated concentration of the base.
Calculation o/ tlze Factor rt.8 •
If the relation (4) holds for the point F, which is the intersection
of the two straight lines., and represents concentration of aniline equi
valent to the hydrochloric acid in the mixture, we get the follo'wing
relation:
and the equation (4) becomes:
As the straight line EF is almost parallel to the ordinate axis, the
conductivity of the mixture may be put equal to x,,, in the above
equation when large excess of aniline is present, and thus the value
of a". is easily found. The specific conductivity of the mixture formed from 20 cc. ot
hydrochloric acid of 0-02056 norm. and S cc. of aqueous solution of
aniline of 0,09676 norm. was 0•00 17 3 reciprocal ohms, therefore we have

Determination of Very Weak Acids and Bases etc. 39
0•02056 X 4 0•00173 = a.,
5
a.,= 0•105.
Again, the specific conductivity of the mixture formed from 20 cc. of hydrochloric acid of 0•05 120 norm. and 5 cc. of aqueous aniline solution of 0-1934 norm. was 0•00349 reciprocal ohms, therefore we have
o•oo 349 = a" 0·04 I ;o x 4
as = 0•106.
Thus we may put as the mean
then
Lastly we have the equation:
The Experimental Verification of the Equation.
TABLE III.
The concentration of hydrochloric acid used : 0,04120.
The concentration of hydrochloric acid in the conductivity vessel :
__±_ X 0•04120=0•03296. 5
The specific conductivity of the acid : 0•0I 314.
Therefore
Concentration of Concentration of Specific Concentration of Error. aniline used. aniline in cond. vessel. conductivity; aniline ( calc. ),
0•09670 0•01934 0-007345 0-01942 +0-00006
0-06447 0-01289 0-009224 0•01306 +0°00017

40 Shinkichi Horiba.
TABLE IV.
The concentration of hydrochloric acid used : 0-02056.
The concentration of hydrochloric acid in the conductivity vessel :
__±_ X 0•02056=0•0I645. 5
The specific conductivity of the acid: 0-006635•
Therefore
Concentration of Concentration of aniline Specific Concentration of Error. aniline used. in cond. vessel. conductivity. aniline (calc.)
0•02603 0-005206 0•005 I 19 0•005140 -0•000066
0-03472 0-006944 0-004590 0•00691 I -0.000033
0-04166 0-008332 0-004156 0-008366 +0-000034
0-05207 0•0I0--1-14 0-003505 o-oro54 +0-00013
As seen from the above tables, the agreements between observed and calculated values are quite satisfactory.
Application in Chemical Analysis.
From the above experiments, it is evident that a weak base such as aniline, which can not be determined by the ordinary method of alkalimetry, may easily be estimated by the measurement of the conductivity of mixtures of the aniline solution and hydrochloric acid.
Let c be the concentration of the aniline and x be the specific conductivity of this mixture, then
C =
m which the observed value of xa is to be used. This equation is
valid, with the constant factor 0-2895, between the limit - 1- _ -2__
50 50 norm. of hydrochloric acid, in excess of aniline. It is to be remarked here that the solution may contain some indifferent substances such as chloroform, without affecting the result.
Calculation of the Degree of tlte Hydrolysis.
We can calculate the degree of the hydrolysis of a salt by means of equation (4).

Determination of Very Weak Acids and Bases etc. 41
If we have the following data:
the concentration of hydrochloric acid in the conductivity vessel : I
5 xo•08234,
I the concentration of aniline in the conductivity vessel: - x 0-07425, 5
the specific conductivity of this mixture : 0-002284,
then 0•002284 = -0•2985 C + 0•006635
I C = 0•07316 X -.
5 Therefore we have :
the concentration of aniline hydrochloride m the mixture : I
0•07316x-, 5
I the concentration of free aniline: (o-07425-0-07316) x -,
5 I
the concentration of free hydrocnloric acid : ( 0-082 34- 0•07 3 I 6) x - . 5
If K be the constant of the hydrolysis, then
K = [Base][Acid] _ (0•07425-0-07316)(0•08234-0•07316) [Salt] - sxo-07316
= 2•74X I0-5.
Moreever the following results were obtained.
Concentration of hydrochloric acid.
I 0•08234x-
5
Concentration of aniline.
I 0•0768ox-
5
Specific conductivity.
0•002150
Concentration of aniline hydrochloride ( calc. ).
I 0•1522 X -5 I
0•07543 X -s
K
2•26X I0-5
The constant of the hydrolysis of aniline hydrochloride at 25-0°C.
given in literature is as follows :
2•25 X I0-5
2•29X I0-5
2•I6X I0-5
1 Zs. physik. Chem., 13, 322 (1894). 2 J. Chem. Soc., 89, 1008 (1906). 3 lbzi!., 93, 48 (1908).
Bredig1
Denison and Steele1
Denham'1
42 Slzzitkiclti Horiba.
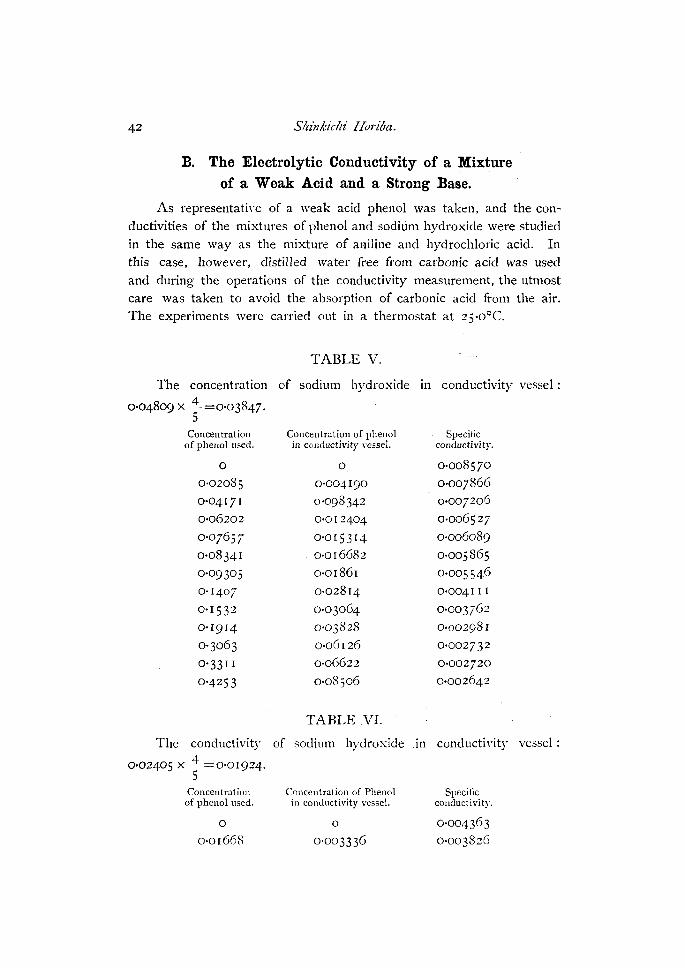
B. The Electrolytic Conductivity of a Mixture of a Weak Acid and a Strong Base.
As representati\·e of a weak acid phenol was taken, and the con
ductivities of the mixtures of phenol and sodium hydroxide were studied
in the same way as the mixture of aniline and hydrochloric acid. In this case, however, distilled water free from carbonic acid was used
and during the operations of the conductivity measurement, the utmost
care was taken to avoid the absorption of carbonic acid from the air.
The experiments were carried out in a thermostat at 25-0°C.
TABLE V.
The concentration of sodium hydroxide in conductivity vessel :
0•04809 X j_=0•03847. 5
Concentration Concentration of phenol Specitic of phenol used. in conductivity ,·essel. conductivity.
0 0 0-008570 0-02085 0-004190 0-007866
0-04171 0-098342 0•007206
0•06202 0-012404 0-006527
0-07657 o-or 5 3 r4 0-006089
0•08341 0•016682 0-005865
0-09305 0-01861 0•005 546
0-1407 0-02814 0•0041 I l
0•l 532 0-03064 0-003762
0-1914 0•03828 0•002981
0-3063 0-06126 0-002732
0• 33 l l 0-06622 0-002720
0-4253 0-08506 0-002642
TABLE VI.
The conductivity of sodium hydroxide in conductivity vessel :
0•02405 X _-1 =O•OI924. 5
Concentration Concentration of Phenol Specific of phenol used. in conductivity vessel. conductivity.
0 0 0-004363 0-01668 0-003336 o-00382G
Determination of Very TVeaf., Acids and Bases etc. 43
0-02085 0,04171
0-04652
0-07657 0-09303
0-1407 0•33l I 0-5683
0-004170 0-008342
0-009304
0·0I 5314 0•01861
0-002814 0-06622
0• l I 366
0•003673 0-003034 0-002844
0·00195 I
0·001599 0-001437 0-001405 0,001396
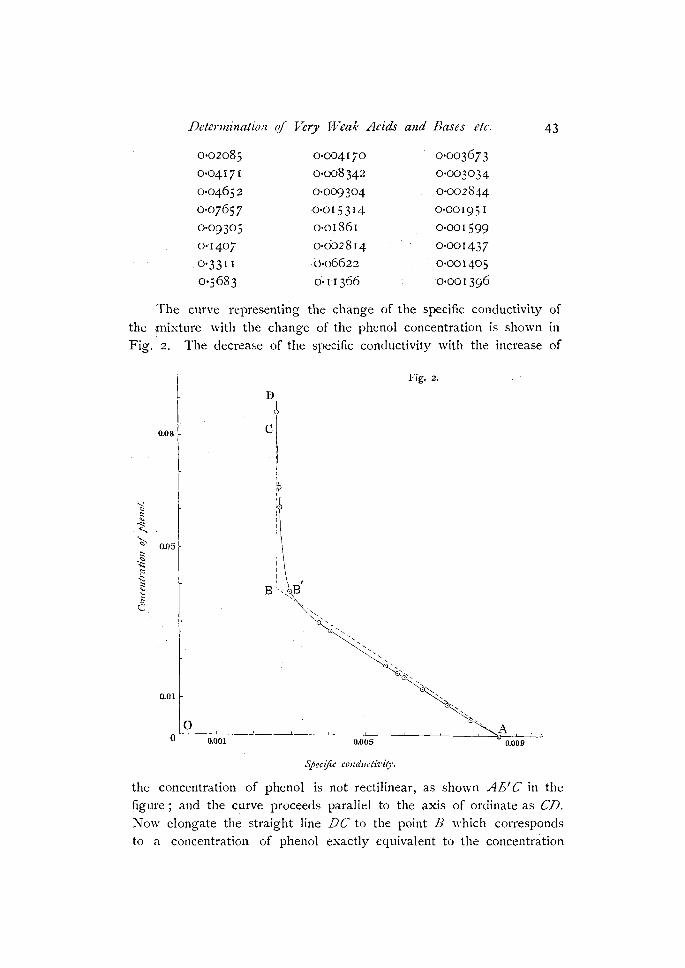
The curve representing the change of the specific conductivity of
the ,mixture with the change of the phenol concentration is shown in Fig. 2. The decrease of the specific conductivity with the increase of
l Fig. 2.
D 6
0.08 cl ii 'I :? ,,
Specific conducth'ity.
the concentration of phenol is not rectilinear, as shown AE' C in the figure ; and the curve proceeds parallel to the axis of ordinate as CD. Now elongate the straight line DC to the point B \\·hich corresponds to a concentration of phenol exactly equivalent to the concentration
44 Shinki'chi Horiba.
of sodium hydroxide in the mixture, and connect the points B and A; then it will be seen that the conductivity curve AB' C deviates from the line AB at first to the left and then to the right as the concentration of phenol increases. These deviations may perhaps be ascribed to two causes, namely the hydrolysis of sodium phenolate and the slightness of the electrolytic dissociation of sodium phenolate in an excess of the hydroxide, compared to that of the free base. From an assumption that the hydrolysis is negligible, we can derive a formula for the conductivity of the mixture as follows :
where x,n
Ca: c;, : X •
b •
denotes the specific conductivity of the mixture, the concentration of phenol, the concentration of sodium hydroxide, the specific conductivity of sodium hydroxide alone,
P : a factor for this mixture,
(s)
and p is a factor for the dissociation degree of sodium hydroxide
solution.
Calculation of the Factor P.
If the concentrations of phenol and sodium hydroxide be the same in the mixture, the expression (S) may be written,
(6)
In that ca~e, the value of xni, the specific conductivity of pure sodium phenolate, will be given from the specific conductivity of a mixture containing a large excess of phenol. From the data of Table V, the factor P can be calculated as follows:
From Table VI
0-002640 = Pxo,03847+0•008570
p = -0-154.
0,001400 = Px 0•01924 + 0•004363
P= -0,154.
Therefore we can put P= -o• 1 54 in the case where sodium hydro
xide of ~ - - 1- norm. is used.
50 50
Determination of Very Weak Acids and Bases etc. 45
The Experimental Verification.
In the equation (S), if Ca be smaller than C0, we can expand the factor (C0 - Cal according the binomial theorem; and, neglecting the higher terms, we obtain approximately,
or
I Put n = 2 , and /1= 0•0433, then from table V
C, _ _ Xm-0•008570
a - 0•154 + 0•0433 X 0•03848~
- x,,, - 0•008 5 70 --- 0-1625
Concentration Specific Concentration of Error. of phenol. conductivity. phenol ( calc. ).
0-004190 0-007866 0-004332 +0-00014
0-008342 0-007206 0-008396 +0-000054
0-012404 0-006527 0-01257 + 0•00017
0-015314 0,006089 O•OI 527 -0•00004
0•016682 0-005865 0-01665 -0-050017
0-01861 0-005546 O·Ol 861
From Table VI, we have
Ca=_ Xm-0•004363 0•154 + 0•0433 X 0•01924½
Concentration of phenol.
0-003336
0,004170
0-008342
0-009304
=- x,,,-0•004363 0-160
Specific Concentration of conductivity. phenol ( calc. ).
0-003826 0-003357
0-003673 0•0043 I I
0•003034 0-008310
0•002844 0-009493
±o•o
Error.
+0.000021
+0•00014
-0-000032
+0-00019
(7)
The agreements of the observed and calculated values are quite satisfactry, and therefore, if it is desired to estimate the concentration

Shinkic!ti Horiba.
of a dilute phenol solution, the conductivity of the mixture of the
phenol solution and sodium hydroxide solution may be determined,
and the concentration required calculated by the forrnula,
2 I where C,, must lie between the limit ~- -- norm. and the concen-50 50
tration of phenal be less than ~ c;, 2
Calculation ef lite Degree ef tlte Hydrolysis.
By the graphical representations of Table V and VI, the specific
conductivities of equivalent solutions of phenol and sodium hydroxide are found.
\Vhen the concentration of sodium hydroxide is
0-03877: x,,,=0•00290.
ii ·when the concentration of sodium hydroxide is 0•01024: x,,,,=0•00158.
From equation (6), we get
ii
Ca= O•Oo290-o-008570 = 0-00368, -0•154
Therefore the concentrations of free alkali and phenol are altogether
II
0-03877-0•00368 = 0•00020,
O•OI924-0•00l80 = 0•000124.
Then the constant of the hydrolytic dissociation is
II
(0-00020) 2 6 -,
68 = I•O X IO ,
0·003
The degrees of the hydrolysis of sodium phenolate at 25-0°C.
given in literature are as follows :
Determination of Very Weak Acids and Bases etc. 47
Dilution. Degree of hydrolysis.
32! ca. 6% Hantzsch1
10! ,, 3 o/o Walker2
From these data the constant of the hydrolytic dissociation is given respectively:
J{ = I·20X 10-4,
K =093x 10-\
Summary.
(I) The conductivities of the mixture of aniline and hydrochloric acid,
and of phenol and sodium hydroxide have been determined, and the empirical formula! to represent the change of conductivity with con
centrations derived. (2) A method of analysis of a weak base or acid by conductivity
measurements has been described. (3) The constants of the hydrolytic dissociation of aniline hydrochlo
ride and sodium phenolate has been calculated.
1 Ber. D. chem. Ges., 32, 3084 ( 1899).
:! Zs. physik. Chem., 32, 189 (1900).