Embed Size (px)
Citation preview
RMRC Research Project No. 15FINAL REPORT
DETERMINATION OF NDESIGNFOR CIR MIXTURES USING THESUPERPAVE GYRATORYCOMPACTOR
by
Stephen A. CrossAssociate ProfessorUniversity of KansasLawrence, Kansas
April 2002
DETERMINATION OF NDESIGN FOR CIR MIXTURES
USING THE SUPERPAVE GYRATORY
COMPACTOR
Final Report
by
Stephen A. Cross, P.E.
Associate Professor
University of Kansas
A Report on Research Sponsored by
THE RECYCLED MATERIALS RESOURCE CENTER
FHWA AGREEMENT No. DTFH61-98-X-00095
RMRC Research Project No. 15
UNIVERSITY OF KANSAS CENTER FOR RESEARCH, INC.
LAWRENCE, KANSAS
April 2002
iii
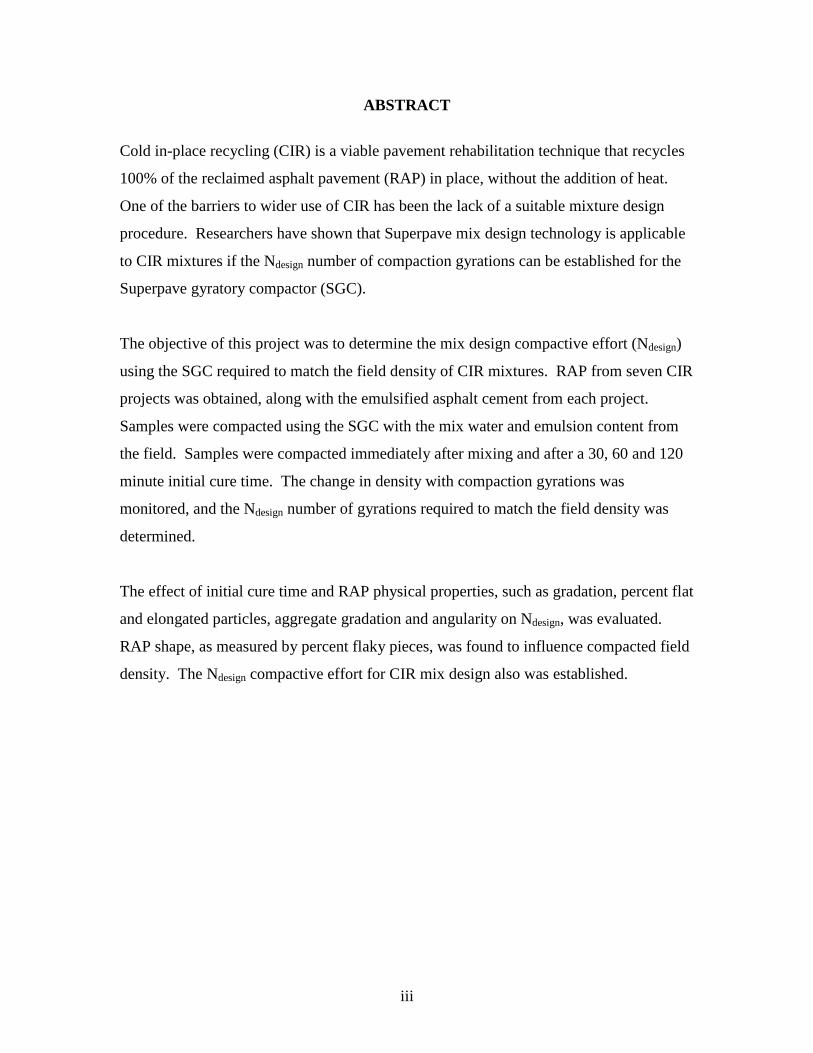
ABSTRACT
Cold in-place recycling (CIR) is a viable pavement rehabilitation technique that recycles
100% of the reclaimed asphalt pavement (RAP) in place, without the addition of heat.
One of the barriers to wider use of CIR has been the lack of a suitable mixture design
procedure. Researchers have shown that Superpave mix design technology is applicable
to CIR mixtures if the Ndesign number of compaction gyrations can be established for the
Superpave gyratory compactor (SGC).
The objective of this project was to determine the mix design compactive effort (Ndesign)
using the SGC required to match the field density of CIR mixtures. RAP from seven CIR
projects was obtained, along with the emulsified asphalt cement from each project.
Samples were compacted using the SGC with the mix water and emulsion content from
the field. Samples were compacted immediately after mixing and after a 30, 60 and 120
minute initial cure time. The change in density with compaction gyrations was
monitored, and the Ndesign number of gyrations required to match the field density was
determined.
The effect of initial cure time and RAP physical properties, such as gradation, percent flat
and elongated particles, aggregate gradation and angularity on Ndesign, was evaluated.
RAP shape, as measured by percent flaky pieces, was found to influence compacted field
density. The Ndesign compactive effort for CIR mix design also was established.
iv
ACKNOWLEDGMENTS
This study was funded by the Federal Highway Administration (FHWA) through
Cooperative Agreement No. DTFH61-98-X-00095 with the University of New
Hampshire, Durham, New Hampshire. The Recycled Materials Research Center
(RMRC) at the University of New Hampshire under subcontract number 00-374
sponsored the research project. The Kansas Department of Transportation, Brown &
Brown Contractors, Inc. and Gorman Brothers, Inc. co-sponsored this project.
The author wishes to acknowledge the members of the Expert Technical Group (ETG);
John Huffman, Brown & Brown Contractors, Inc.; Edward Kearney, Gorman Brothers,
Inc.; Jason Harrington, FHWA; Jerry Geib, Minnesota Department of Transportation and
Wayne Lee, University of Rhode Island. The author would like to express his gratitude
to the members of the ETG for their significant contributions to this study.
v
TABLE OF CONTENTS
page
Chapter 1 INTRODUCTION 1
INTRODUCTION 1
OBJECTIVE 2
SCOPE 3
Chapter 2 FIELD OBSERVATIONS 5
GENERAL OBSERVATIONS 5
SITE DESCRIPTIONS 5
Site 1 5
Site 2 8
Site 3 8
Site 4 11
Site 5 11
Site 6 12
Site 7 12
Chapter 3 LABORATORY TEST PROCEDURES 13
RAP 13
MIXING, COMPACTION AND CURING OF
LABORATORY SAMPLES 15
Mixing 15
Initial Curing 15
Compaction and Final Curing 16
LABORATORY TESTING 16
Bulk Specific Gravity 16
Permanent Deformation 17
Indirect Tensile Strength 17
vi
TABLE OF CONTENTS (Continued)
page
Chapter 4 TEST RESULTS 19
AGENCY REPORTED COMPACTION 19
Typical Compaction Procedures 19
Reported Agency Compaction Results 19
Site 1 19
Site 2 20
Site 3 20
Site 4 20
Site 5 21
Site 6 21
Site 7 21
FIELD TEST RESULTS 21
LABORATORY TEST RESULTS 24
RAP and Aggregate Properties 24
Compaction of Samples 34
Permanent Deformation 36
Indirect Tensile Strength 38
Chapter 5 ANALYSIS OF TEST RESULTS 41
BULK SPECIFIC GRAVITY 41
CURE TIME VERSUS COMPACTED DENSITY 41
GYRATIONS TO FIELD DENSITY 47
FACTORS THAT AFFECT Ndesign 52
PERFORMANCE TESTING 54
Indirect Tensile Strength 54
Permanent Deformation 54
Chapter 6 CONCLUSIONS AND RECOMMENDATIONS 57
CONCLUSIONS 57
vii
TABLE OF CONTENTS (Continued)
page
RECOMMENDATIONS 57
APPENDIX – COMPACTION DATA 59
REFERENCES 75

viii
LIST OF FIGURES
page
Figure 1 Location of Test Sites 6
Figure 2 CIR Process, Site 1, US-283 9
Figure 3 CIR Compaction, Site 2, US-24 9
Figure 4 CIR Process With Add-Stone, Site 3, US-11 10
Figure 5 Field Density Determination 22
Figure 6 RAP and Extracted Aggregate Gradation, Site 1 27
Figure 7 RAP and Extracted Aggregate Gradation, Site 2 28
Figure 8 RAP and Extracted Aggregate Gradation, Site 3 29
Figure 9 RAP and Extracted Aggregate Gradation, Site 4 30
Figure 10 RAP and Extracted Aggregate Gradation, Site 5 31
Figure 11 RAP and Extracted Aggregate Gradation, Site 6 32
Figure 12 RAP and Extracted Aggregate Gradation, Site 7 33
Figure 13 Cure Time versus Bulk Specific Gravity, Site 1 43
Figure 14 Cure Time versus Bulk Specific Gravity, Site 2 43
Figure 15 Cure Time versus Bulk Specific Gravity, Site 3 44
Figure 16 Cure Time versus Bulk Specific Gravity, Site 4 44
Figure 17 Cure Time versus Bulk Specific Gravity, Site 5 45
Figure 18 Cure Time versus Bulk Specific Gravity, Site 6 45
Figure 19 Cure Time versus Bulk Specific Gravity, Site 7 46
Figure 20 Compactive Effort versus Percent Gmm, Site 1 48
Figure 21 Compactive Effort versus Percent Gmm, Site 2 48
Figure 22 Compactive Effort versus Percent Gmm, Site 3 49
Figure 23 Compactive Effort versus Percent Gmm, Site 4 49
Figure 24 Compactive Effort versus Percent Gmm, Site 5 50
Figure 25 Compactive Effort versus Percent Gmm, Site 6 50
Figure 26 Compactive Effort versus Percent Gmm, Site 7 51
Figure 27 Compactive Effort versus 3:1 Flaky RAP Particles 53
Figure 28 APA Dry Rut Depths 55
ix
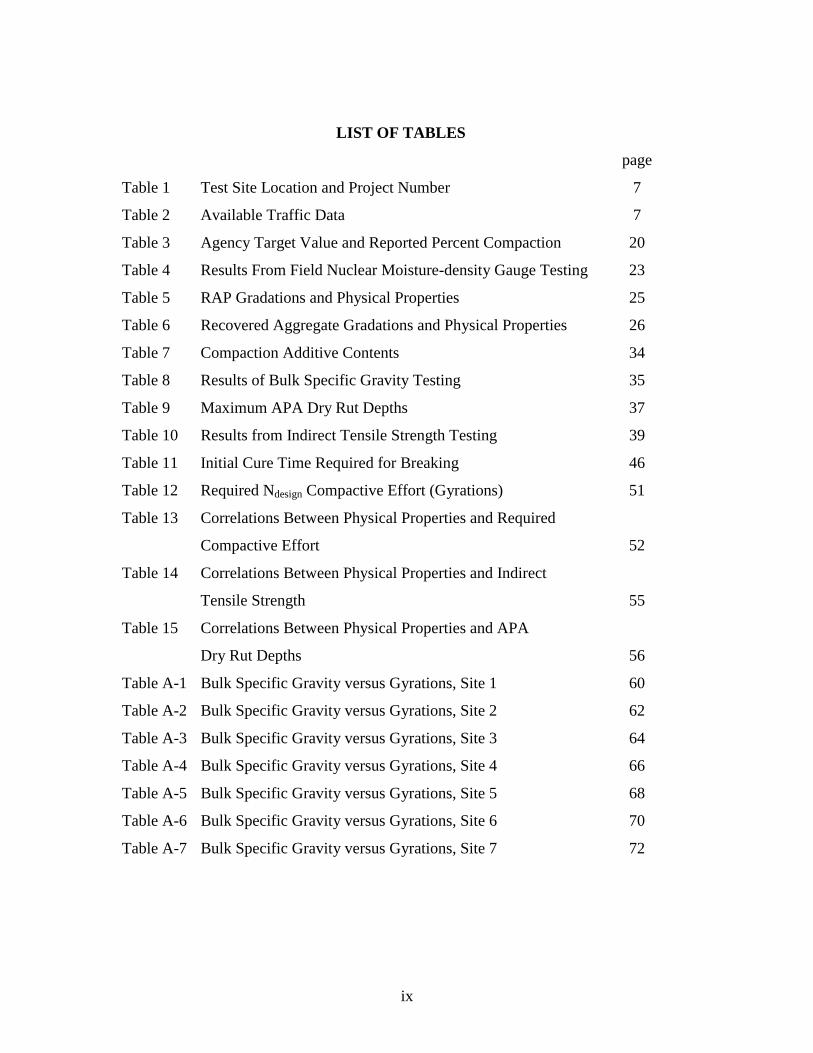
LIST OF TABLES
page
Table 1 Test Site Location and Project Number 7
Table 2 Available Traffic Data 7
Table 3 Agency Target Value and Reported Percent Compaction 20
Table 4 Results From Field Nuclear Moisture-density Gauge Testing 23
Table 5 RAP Gradations and Physical Properties 25
Table 6 Recovered Aggregate Gradations and Physical Properties 26
Table 7 Compaction Additive Contents 34
Table 8 Results of Bulk Specific Gravity Testing 35
Table 9 Maximum APA Dry Rut Depths 37
Table 10 Results from Indirect Tensile Strength Testing 39
Table 11 Initial Cure Time Required for Breaking 46
Table 12 Required Ndesign Compactive Effort (Gyrations) 51
Table 13 Correlations Between Physical Properties and Required
Compactive Effort 52
Table 14 Correlations Between Physical Properties and Indirect
Tensile Strength 55
Table 15 Correlations Between Physical Properties and APA
Dry Rut Depths 56
Table A-1 Bulk Specific Gravity versus Gyrations, Site 1 60
Table A-2 Bulk Specific Gravity versus Gyrations, Site 2 62
Table A-3 Bulk Specific Gravity versus Gyrations, Site 3 64
Table A-4 Bulk Specific Gravity versus Gyrations, Site 4 66
Table A-5 Bulk Specific Gravity versus Gyrations, Site 5 68
Table A-6 Bulk Specific Gravity versus Gyrations, Site 6 70
Table A-7 Bulk Specific Gravity versus Gyrations, Site 7 72
1
Chapter 1
INTRODUCTION
INTRODUCTION
There are currently many tons of asphalt pavements milled each year by various state and
local highway agencies. The majority of the millings are not recycled, but are disposed
of in landfills. These asphalt millings, or reclaimed asphalt pavement (RAP), contain
reusable natural resources of asphalt cement and mineral aggregates. Cold in-place
recycling (CIR) is a viable pavement rehabilitation technique that recycles 100 percent of
the RAP in place, resulting in no valuable resources being buried in landfills and
considerable savings of dollars and energy.
Researchers at the University of Rhode Island (URI) have shown that the Superpave
gyratory compactor (SGC) can be used to determine optimum moisture and asphalt
emulsion content of CIR mixtures.(1) The URI study evaluated a volumetric mix design
procedure for CIR mixtures using two different compactors, a Marshall compaction
hammer and the SGC. Compaction using the Marshall hammer was based on the work of
Task Force 38, Report on Cold Recycling of Asphalt Pavements,(2) which recommended
50-blow compaction. The URI study recommended the use of the SGC; however, the
number of compaction revolutions was not definitively established and needs to be
established based on the achievable field density for CIR pavements.
One of the fundamental principles behind a volumetric mix design is the selection of an
appropriate compactive effort. The mix design compactive effort must produce a test
sample with void properties similar to those that the same mix would experience in the
field. Historically, 50-blow Marshall compactive effort has been used by a majority of
highway agencies for CIR mixture design.(2) A recent study by Cross has shown that
compaction to 75 blows per side at 43.3oC (110oF) was necessary to replicate the field
density of a CIR mixture in Kansas.(3)
2
Others have evaluated the use of the SGC for cold mix design as well. Lauter and
Corbett (4) evaluated the Ndesign number of gyrations required to reproduce field densities
for CIR mixtures in Ottawa-Carleton, Canada. The authors reported a wide range in
required Ndesign gyrations and that a single compactive effort could not be established.
Mallick (5, 6) has recommended 50 and 75 gyrations be used for mix design of full depth
reclamation mixes. However, his recommendations were based on only one RAP
gradation. The effect of cure time on CIR mix design compactive effort has not been
fully established either.
Preliminary mix design results using the SGC and the Marshall hammer are available
from the URI study for two mixes, one in Kansas and one in Ontario.(1) The Marshall
mix design was a 50-blow mix design and the Superpave mix design used 50 gyrations.
The differences in density between SGC and Marshall compacted samples were
approximately 160 kg/m3 (10 pcf). This relates to a difference in voids total mix (VTM)
of approximately six percent. The SGC samples had a compacted density much higher
than typically encountered in the field. Laboratory compacted density is often used
during construction quality control testing as a target value to ensure adequate field
compaction with 95 percent of the target value typically required. The use of
inappropriate mix design compactive effort (Ndesign) can result in target values being set
unrealistically high, thus making contractor compliance difficult using conventional
compaction techniques. Setting unreasonable compaction target values could result in
numerous failed test results from otherwise acceptable CIR pavements.
OBJECTIVE
The main objective of this study was to determine the Ndesign number of compaction
revolutions for CIR mix design required to duplicate the field density of CIR mixtures. A
second objective was to evaluate the effect of initial cure time on mix design compactive
effort.
3
SCOPE
RAP from seven projects was obtained, along with the emulsified asphalt cement used on
the project. Samples were compacted using the SGC with the mix water and emulsion
content obtained from the field test sites. Samples were compacted immediately after
mixing and after a 30, 60 and 120 minute initial cure time. The change in bulk specific
gravity with compaction gyrations was monitored. The Ndesign number of gyrations
required to match field density was determined by comparing SGC compacted density to
the field compacted density. The effect of initial cure time on the Ndesign number of
gyrations was evaluated as well.
5
Chapter 2
FIELD OBSERVATIONS
GENERAL OBSERVATIONS
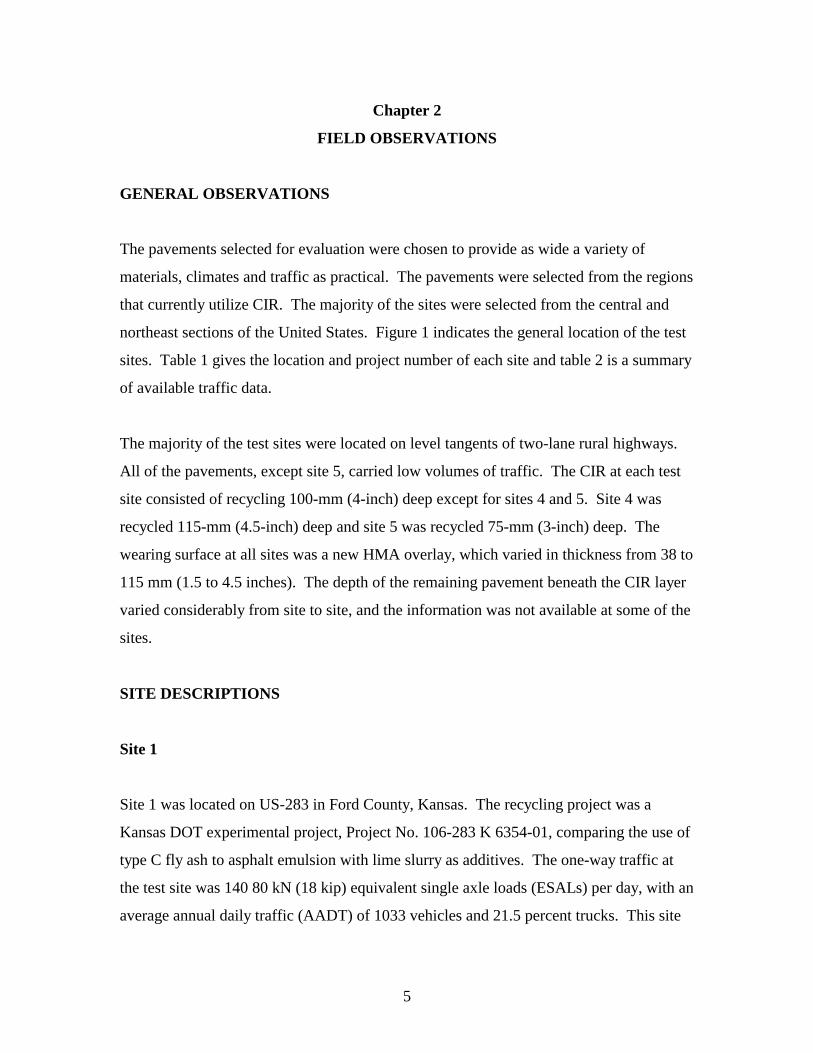
The pavements selected for evaluation were chosen to provide as wide a variety of
materials, climates and traffic as practical. The pavements were selected from the regions
that currently utilize CIR. The majority of the sites were selected from the central and
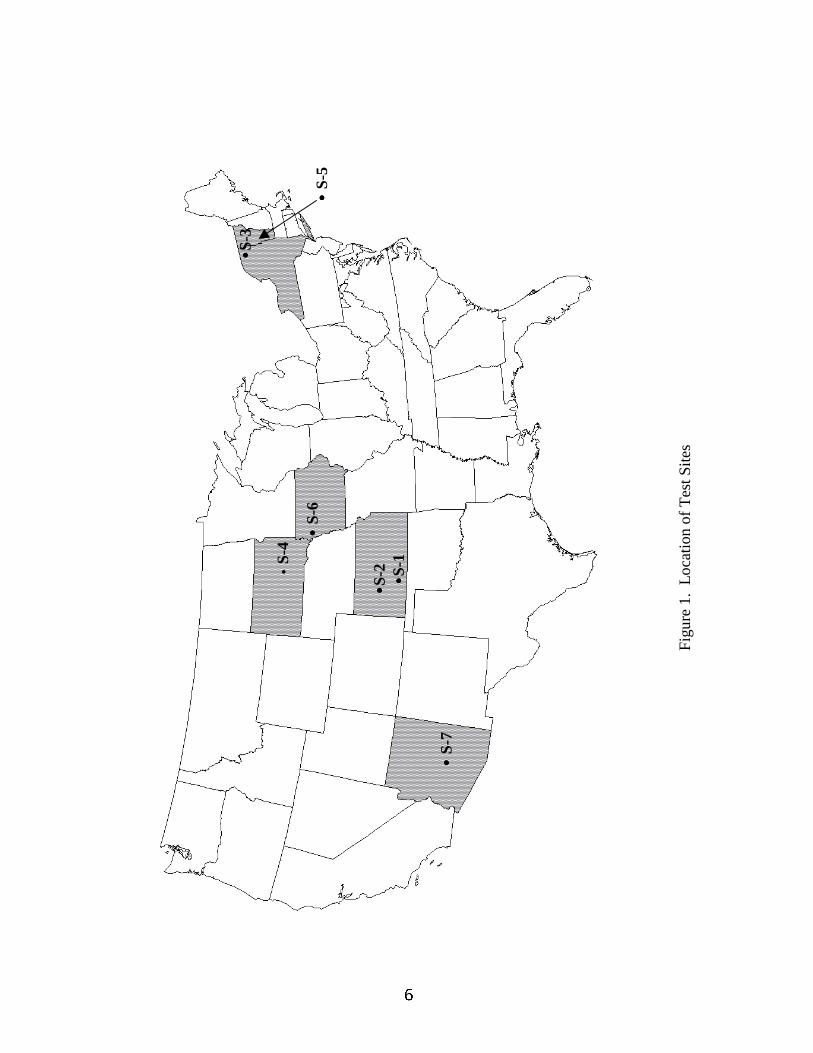
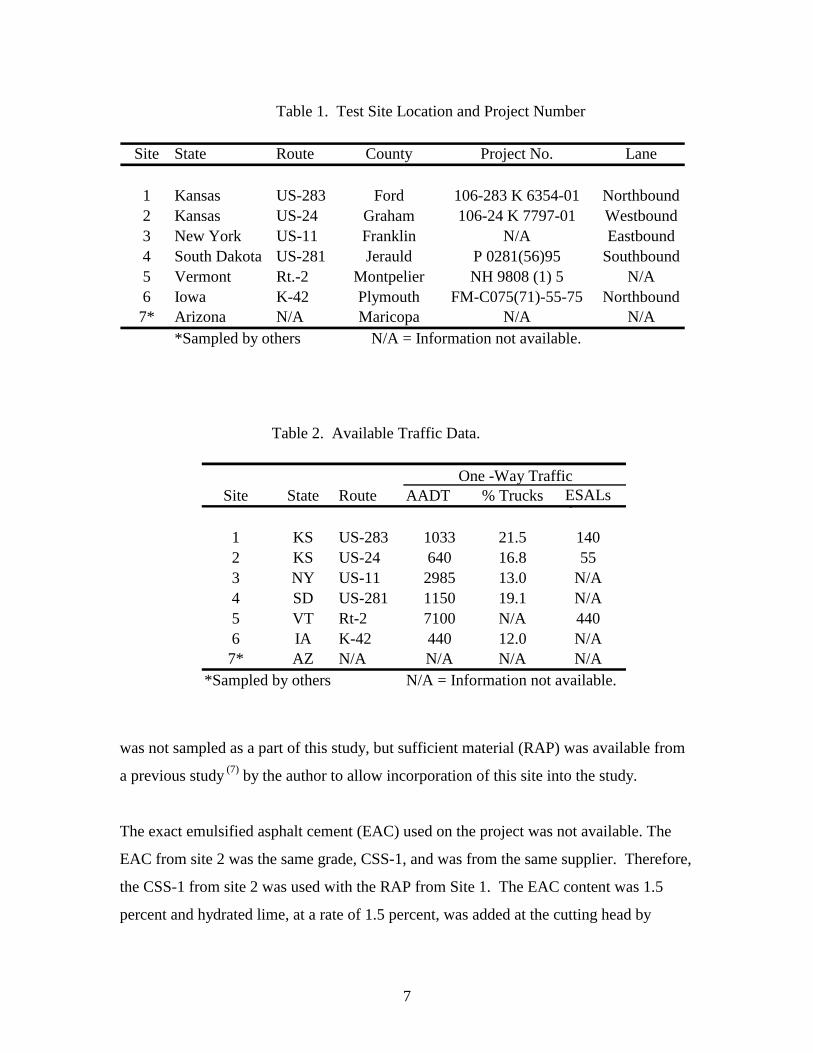
northeast sections of the United States. Figure 1 indicates the general location of the test
sites. Table 1 gives the location and project number of each site and table 2 is a summary
of available traffic data.
The majority of the test sites were located on level tangents of two-lane rural highways.
All of the pavements, except site 5, carried low volumes of traffic. The CIR at each test
site consisted of recycling 100-mm (4-inch) deep except for sites 4 and 5. Site 4 was
recycled 115-mm (4.5-inch) deep and site 5 was recycled 75-mm (3-inch) deep. The
wearing surface at all sites was a new HMA overlay, which varied in thickness from 38 to
115 mm (1.5 to 4.5 inches). The depth of the remaining pavement beneath the CIR layer
varied considerably from site to site, and the information was not available at some of the
sites.
SITE DESCRIPTIONS
Site 1
Site 1 was located on US-283 in Ford County, Kansas. The recycling project was a
Kansas DOT experimental project, Project No. 106-283 K 6354-01, comparing the use of
type C fly ash to asphalt emulsion with lime slurry as additives. The one-way traffic at
the test site was 140 80 kN (18 kip) equivalent single axle loads (ESALs) per day, with an
average annual daily traffic (AADT) of 1033 vehicles and 21.5 percent trucks. This site
Figu
re 1
. Lo
catio
n of
Tes
t Site
s
• •••S-1
• •••S-2
• •••S-3
• ••• S-
5
• S-4
• •••S-
6
• ••• S-
7
7
was not sampled as a part of this study, but sufficient material (RAP) was available from
a previous study (7) by the author to allow incorporation of this site into the study.
The exact emulsified asphalt cement (EAC) used on the project was not available. The
EAC from site 2 was the same grade, CSS-1, and was from the same supplier. Therefore,
the CSS-1 from site 2 was used with the RAP from Site 1. The EAC content was 1.5
percent and hydrated lime, at a rate of 1.5 percent, was added at the cutting head by
Table 2. Available Traffic Data.
Site State Route AADT % Trucks ESALsd
1 KS US-283 1033 21.5 1402 KS US-24 640 16.8 553 NY US-11 2985 13.0 N/A4 SD US-281 1150 19.1 N/A5 VT Rt-2 7100 N/A 4406 IA K-42 440 12.0 N/A7* AZ N/A N/A N/A N/A
*Sampled by others N/A = Information not available.
One -Way Traffic
Table 1. Test Site Location and Project Number
Site State Route County Project No. Lane
1 Kansas US-283 Ford 106-283 K 6354-01 Northbound2 Kansas US-24 Graham 106-24 K 7797-01 Westbound3 New York US-11 Franklin N/A Eastbound4 South Dakota US-281 Jerauld P 0281(56)95 Southbound5 Vermont Rt.-2 Montpelier NH 9808 (1) 5 N/A6 Iowa K-42 Plymouth FM-C075(71)-55-75 Northbound7* Arizona N/A Maricopa N/A N/A
*Sampled by others N/A = Information not available.
8
injecting 4.5 percent slaked quicklime slurry, both by weight of the RAP. The RAP was
sampled without the slurry or the EAC.
The CIR was placed in 1997, and the pavement consisted of approximately 38 mm (1.5
inches) of HMA as a wearing surface and 100 mm (4 inches) of CIR over an
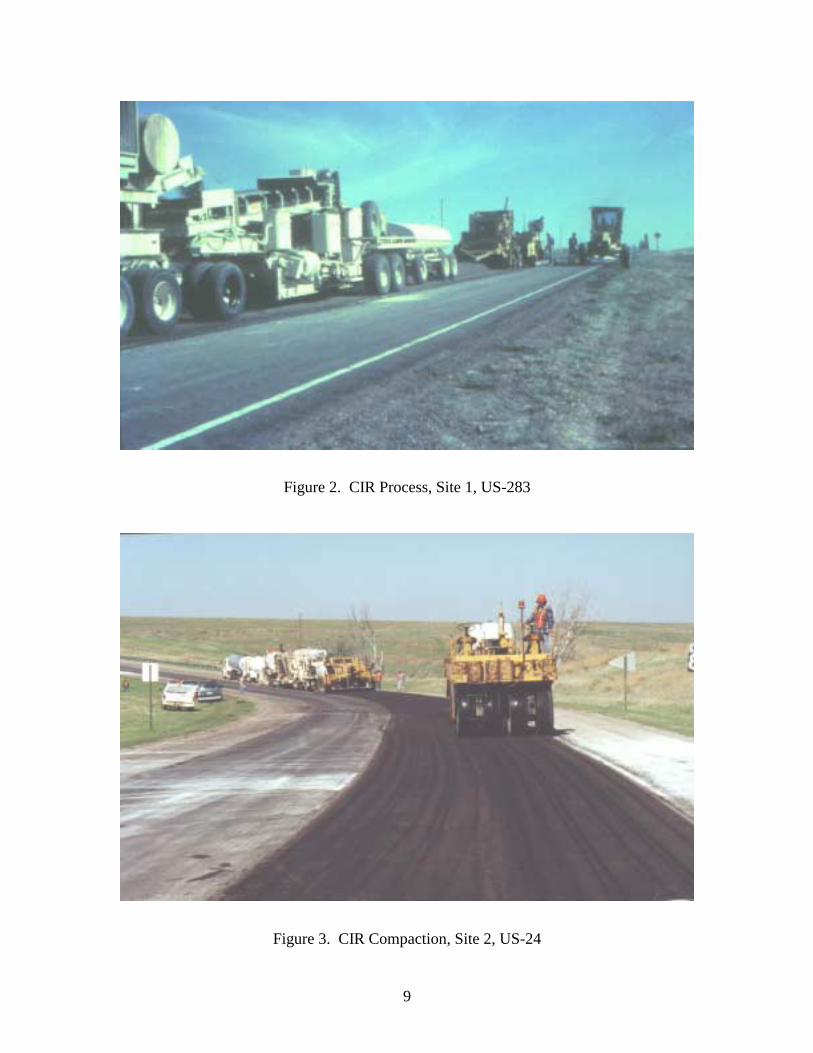
undetermined amount of old pavement. Figure 2 shows the CIR section at site 1.
Site 2
Site 2 was located east of Hill City on US-24 in Graham County, Kansas. The recycling
project was a Kansas DOT project, Project No. 24-33 K 7536-01. The one-way traffic at
the test site was 55 ESALs per day with an AADT of 640 and 16.8 percent trucks. The
recycling consisted of a new 40-mm (1.5-inch) HMA overlay over a 100-mm (4-inch)
CIR mix. Samples of RAP were obtained on May 4, 2000, from the westbound lane. The
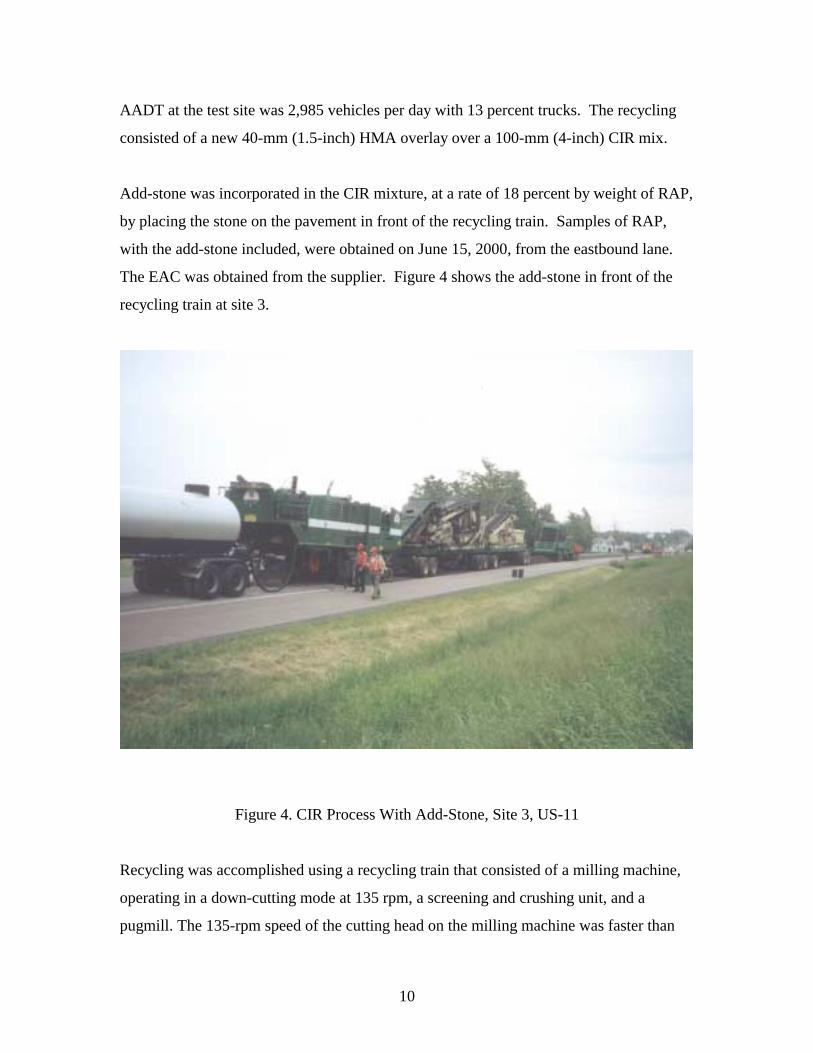
EAC was obtained from the supplier. Figure 3 shows the compaction of the CIR mix at
site 2.
The recycling was accomplished using a recycling train that consisted of a milling
machine operating in an upcutting mode, a screening and crushing unit, and a pugmill.
The RAP was screened to produce 100 percent passing a 31.5-mm (1.25-inch) screen.
The EAC was a CSS-1 applied at a rate of 2.15 percent by weight of the RAP. Hydrated
lime at a rate of 1.6 percent was added at the cutting head by injecting 4.2 percent slaked
quicklime slurry, both by weight of the RAP. The RAP was sampled with the slurry
included but without the EAC.
Site 3
Site 3 was located approximately two miles west of Chateaugay on US-11 in Franklin
County, New York. The recycling project was a New York DOT project. The one-way
9
Figure 2. CIR Process, Site 1, US-283
Figure 3. CIR Compaction, Site 2, US-24
10
AADT at the test site was 2,985 vehicles per day with 13 percent trucks. The recycling
consisted of a new 40-mm (1.5-inch) HMA overlay over a 100-mm (4-inch) CIR mix.
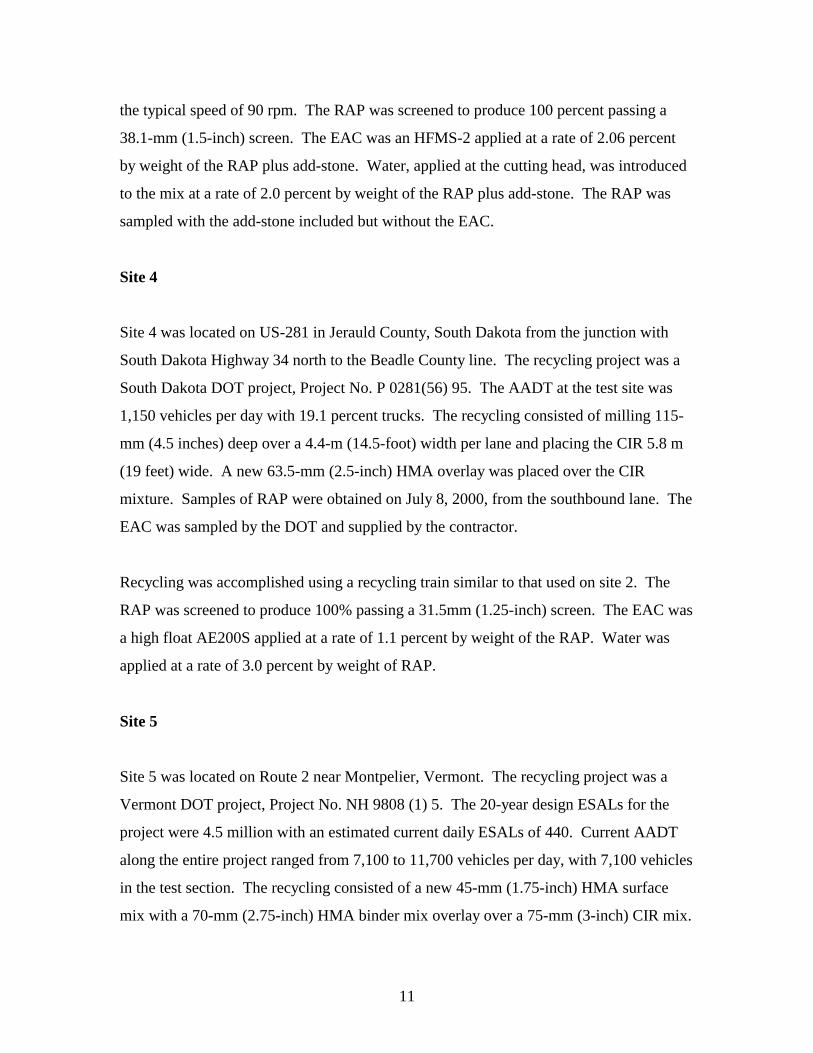
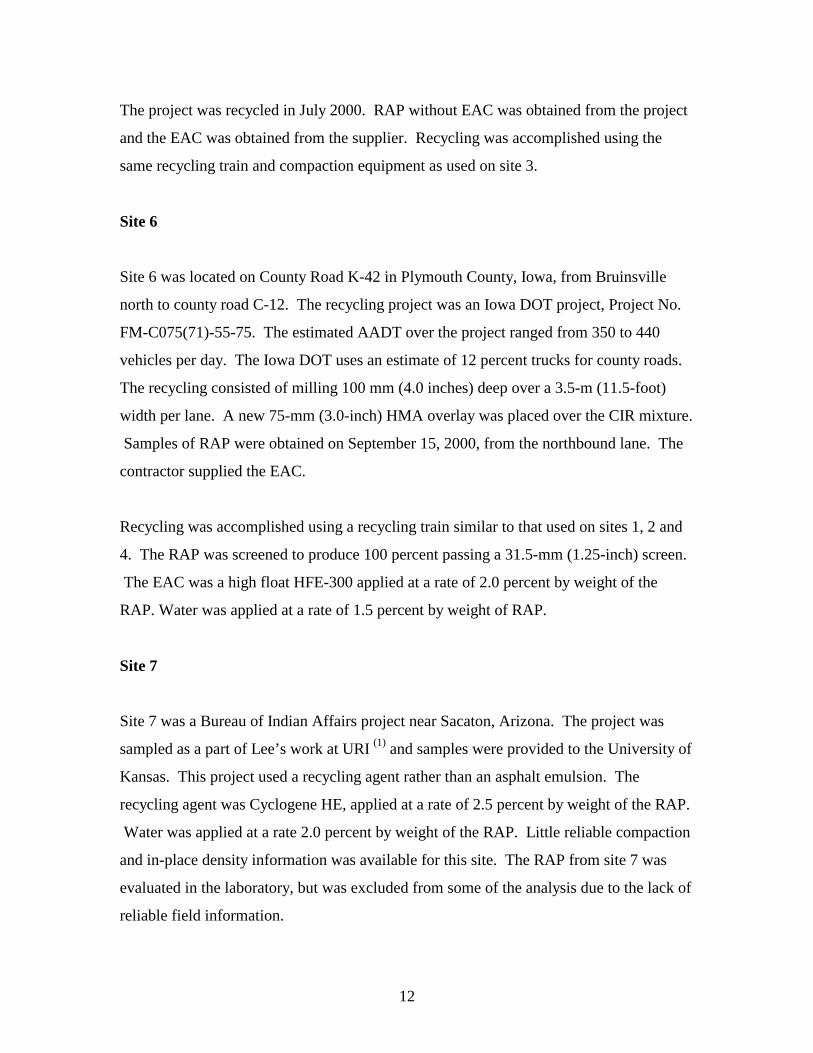
Add-stone was incorporated in the CIR mixture, at a rate of 18 percent by weight of RAP,
by placing the stone on the pavement in front of the recycling train. Samples of RAP,
with the add-stone included, were obtained on June 15, 2000, from the eastbound lane.
The EAC was obtained from the supplier. Figure 4 shows the add-stone in front of the
recycling train at site 3.
Figure 4. CIR Process With Add-Stone, Site 3, US-11
Recycling was accomplished using a recycling train that consisted of a milling machine,
operating in a down-cutting mode at 135 rpm, a screening and crushing unit, and a
pugmill. The 135-rpm speed of the cutting head on the milling machine was faster than
11
the typical speed of 90 rpm. The RAP was screened to produce 100 percent passing a
38.1-mm (1.5-inch) screen. The EAC was an HFMS-2 applied at a rate of 2.06 percent
by weight of the RAP plus add-stone. Water, applied at the cutting head, was introduced
to the mix at a rate of 2.0 percent by weight of the RAP plus add-stone. The RAP was
sampled with the add-stone included but without the EAC.
Site 4
Site 4 was located on US-281 in Jerauld County, South Dakota from the junction with
South Dakota Highway 34 north to the Beadle County line. The recycling project was a
South Dakota DOT project, Project No. P 0281(56) 95. The AADT at the test site was
1,150 vehicles per day with 19.1 percent trucks. The recycling consisted of milling 115-
mm (4.5 inches) deep over a 4.4-m (14.5-foot) width per lane and placing the CIR 5.8 m
(19 feet) wide. A new 63.5-mm (2.5-inch) HMA overlay was placed over the CIR
mixture. Samples of RAP were obtained on July 8, 2000, from the southbound lane. The
EAC was sampled by the DOT and supplied by the contractor.
Recycling was accomplished using a recycling train similar to that used on site 2. The
RAP was screened to produce 100% passing a 31.5mm (1.25-inch) screen. The EAC was
a high float AE200S applied at a rate of 1.1 percent by weight of the RAP. Water was
applied at a rate of 3.0 percent by weight of RAP.
Site 5
Site 5 was located on Route 2 near Montpelier, Vermont. The recycling project was a
Vermont DOT project, Project No. NH 9808 (1) 5. The 20-year design ESALs for the
project were 4.5 million with an estimated current daily ESALs of 440. Current AADT
along the entire project ranged from 7,100 to 11,700 vehicles per day, with 7,100 vehicles
in the test section. The recycling consisted of a new 45-mm (1.75-inch) HMA surface
mix with a 70-mm (2.75-inch) HMA binder mix overlay over a 75-mm (3-inch) CIR mix.
12
The project was recycled in July 2000. RAP without EAC was obtained from the project
and the EAC was obtained from the supplier. Recycling was accomplished using the
same recycling train and compaction equipment as used on site 3.
Site 6
Site 6 was located on County Road K-42 in Plymouth County, Iowa, from Bruinsville
north to county road C-12. The recycling project was an Iowa DOT project, Project No.
FM-C075(71)-55-75. The estimated AADT over the project ranged from 350 to 440
vehicles per day. The Iowa DOT uses an estimate of 12 percent trucks for county roads.
The recycling consisted of milling 100 mm (4.0 inches) deep over a 3.5-m (11.5-foot)
width per lane. A new 75-mm (3.0-inch) HMA overlay was placed over the CIR mixture.
Samples of RAP were obtained on September 15, 2000, from the northbound lane. The
contractor supplied the EAC.
Recycling was accomplished using a recycling train similar to that used on sites 1, 2 and
4. The RAP was screened to produce 100 percent passing a 31.5-mm (1.25-inch) screen.
The EAC was a high float HFE-300 applied at a rate of 2.0 percent by weight of the
RAP. Water was applied at a rate of 1.5 percent by weight of RAP.
Site 7
Site 7 was a Bureau of Indian Affairs project near Sacaton, Arizona. The project was
sampled as a part of Lee’s work at URI (1) and samples were provided to the University of
Kansas. This project used a recycling agent rather than an asphalt emulsion. The
recycling agent was Cyclogene HE, applied at a rate of 2.5 percent by weight of the RAP.
Water was applied at a rate 2.0 percent by weight of the RAP. Little reliable compaction
and in-place density information was available for this site. The RAP from site 7 was
evaluated in the laboratory, but was excluded from some of the analysis due to the lack of
reliable field information.
13
Chapter 3
LABORATORY TEST PROCEDURES
RAP
Contractor personnel obtained samples of RAP for sites 2-7. All samples of RAP were
obtained without the emulsified asphalt cement (EAC). Approximately 100-150 kg (220-
330 lbs.) of RAP was obtained from each site. The RAP samples for site 1 came from a
previous project by the author.(7) For the remaining sites, the RAP was generally sampled
off the conveyor belt from the crushing screening unit prior to entering the pugmill. The
CIR mix from site 2 contained slaked lime slurry, which was added at the cutting head.
The RAP from this site was obtained from the windrow deposited by the pugmill. EAC
was not introduced into the pugmill where the RAP sample was obtained.
The gradation of the RAP, as received, was determined in general accordance with
AASHTO T 27. Approximately half of the RAP from each site was placed in large flat
pans and placed in a forced draft oven at 60oC (140oF) for 24 hours to remove surface
moisture. The material was then sieved over a 38.1-mm (1.5-inch) sieve through 2.36-
mm (No. 8) sieve, inclusive, and the material separated into sizes for batching. The
gradation was determined and if the percentage of material passing the 2.36-mm (No. 8)
sieve exceeded 25% of the total, the material passing the 2.36-mm (No. 8) sieve was
sieved over the 1.18-mm (No. 16) sieve. This material was separated into sizes, and the
gradation recalculated. To determine the gradation of the RAP through the 0.075-mm
(No. 200) sieve, two 1,000-g samples of the material retained in the pan (passing 2.36
mm or 1.18 mm) were sieved over the 2.38-mm (No. 8) sieve through the 0.075-mm (No.
200) sieve, inclusive. The gradation of the entire RAP was then calculated.
From the complete gradation of the RAP, the fineness modulus was determined in
accordance with AASHTO T 27. The fineness modulus is a parameter used to evaluate
sands for use in Portland cement concrete and does not include the material passing the
14
0.150-mm (No. 100) sieve. HMA mixtures can contain 10-20 percent passing the 0.015-
mm (No. 100) sieve; therefore, Hudson’s A coefficient was determined. Hudson’s A
coefficient is very similar to the fineness modulus except it uses percent passing, rather
than percent retained, and uses the 0.075-mm (No. 200) sieve. Hudson’s A coefficient
has been shown to better quantify bituminous mixture performance than the fineness
modulus.(8) The surface area of the RAP was determined using Hveem’s surface area
factors as presented in the Asphalt Institute’s MS-2, Mix Design Methods for Asphalt
Concrete.(9) RAP has very little material passing the 0.300-mm (No. 50) sieve; therefore,
the gradations have very little surface area when compared to conventional HMA
mixtures.
RAP millings tend to be flaky in shape. To quantify the flakiness of the RAP, the percent
flaky particles were determined by comparing the largest dimension to the smallest
dimension, in general accordance with ASTM D 4791. This is neither a flat nor
elongated particle as described by ASTM in their test method D 4791. Elongated
particles are defined as the ratio of length to width and flat particles as the ratio of width
to thickness. Flakiness, for the purpose of this study, is defined as the ratio of the length
to thickness or largest dimension to smallest dimension.
Two 2,000-g samples of the RAP from each site were batched to the appropriate
gradation and the physical properties determined. The theoretical maximum density
(Gmm) was determined in accordance with AASHTO T 209. Next, the asphalt content
was determined using the ignition furnace in accordance with AASHTO T 308. The
gradation of the recovered aggregate was determined in accordance with AASHTO T 30.
The crushed face count of the recovered coarse aggregate was determined in accordance
with ASTM D 5821. The fine aggregate angularity of the recovered aggregate was
determined in accordance with Kansas DOT Test Method KT-50.(10) KT-50 is similar to
AASHTO T 304, except the volume of the aggregate is measured directly using a 200-ml
flask rather than indirectly using the bulk specific gravity. The surface area, fineness
15
modulus and Hudson’s A coefficient were determined for the extracted aggregate in the
same manner as with the RAP.
MIXING, COMPACTION, AND CURING OF LABORATORY SAMPLES
Mixing
All samples were mixed in general accordance with the recommendations of Lee.(1)
Samples of RAP were batched to 4,000 grams. The appropriate amount of water was
added to the RAP and mixed for 30 seconds. The EAC was added and the material was
mixed for an additional 90 seconds. All samples were mixed using a mechanical mixer.
The RAP, compaction molds and mix water were at room temperatures, approximately
25oC (77oF). The EAC was heated to 65oC (150o F). EAC and mixing water contents
were those used in the field.
Initial Curing
Typical laboratory compaction procedure for cold mixes entails compacting samples after
the EAC breaks. However, not everyone does this and some owner/agencies compact
samples immediately after mixing. One indication of the breaking of an EAC is a change
in color from brown to black. In the field, CIR mixtures are usually compacted just when
the outside of the windrow turns from brown to black. However, the majority of the EAC
in the CIR mixture in the windrow has not broken. In the laboratory it was difficult to
determine when the EAC broke. This was due, in part, to the low emulsion contents, less
than 3.0 percent, the black color of the RAP, and fluorescent lighting. To overcome this,
samples were compacted immediately after mixing and 30, 60 and 120 minutes after
mixing. The samples were placed in a flat pan to cure and/or break for the allotted time.
16
Compaction and Final Curing
After the initial cure time, the samples were compacted using the Superpave Gyratory
Compactor (SGC). Samples were compacted to 50 gyrations in accordance with the
proposed method outlined by Lee (1) and AASHTO TP 4. Samples were compacted at
ambient temperatures, 25oC (77oF). The height of the samples were monitored and
recorded continuously during compaction. After compaction, the samples were extruded
from the compaction mold and placed in a forced draft oven at 60oC (140oF) for 48 hours
for final curing.
LABORATORY TESTING
Bulk Specific Gravity
After the 48-hour oven cure, the samples were removed from the oven and allowed to
cool to room temperature. Next, the bulk specific gravity was determined in accordance
with AASHTO T 166. Based on the recorded heights and final bulk specific gravity, the
bulk specific gravity with each compaction revolution was calculated as specified in
AASHTO TP 4.
It was anticipated that some of the samples would have high air void contents, well in
excess of eight percent. Previous research on HMA has shown that Marshall compacted
samples with air voids over eight percent had significantly different bulk specific
gravities when determined using AASHTO T 166 and when using parafilm coated
samples.(11) Therefore, some of the samples were tested for bulk specific gravity using
the CoreLokTM procedure,(12) a proposed replacement for AASHTO T 275. The test was
performed in accordance with the manufacturer’s recommendations.(12)
17
Permanent Deformation
Two SGC compacted samples from each of the four curing conditions were tested for
resistance to permanent deformation using an Asphalt Pavement Analyzer (APA) in the
dry mode. The test was performed in accordance with the manufacturer’s
recommendations.(13) The test temperature was selected to represent approximately the
85 percent reliability of the maximum anticipated pavement temperature for each mix.
The pavement mix temperature was determined using the formula developed from the
LTPP database in LTPPBind version 2.1.(14) The test temperature was reduced one PG
grade to account for the presence of a surface mix over the CIR layer. The APA test
parameters were as follows:
Hose Pressure: 690 kN/m2 (100 psi)
Wheel Load: 0.44 kN (100 lbs.)
Total Cycles: 8,000
Sample Preconditioning: 6 hours in air at test temperature.
Indirect Tensile Strength
The samples that were not tested in the APA were tested for indirect tensile strength in
accordance with ASTM D 4123.
19
Chapter 4
TEST RESULTS
AGENCY REPORTED COMPACTION
Typical Compaction Procedures
All of the sites were recycled using a recycling train as previously described in chapter 2.
Compaction of the CIR layer was accomplished using heavy pneumatic rollers and static
and vibratory steel wheel rollers. Typical compaction procedures consisted of initial
rolling with a 11.4 Mg (12.5 ton) static steel wheel roller followed by eight to 10 passes
with a pneumatic roller. Pneumatic rollers were typically seven-tired rollers weighted to
27.3 Mg (30 tons) with 620 kPa (90 psi) tire pressure. Finish rolling consisted of two to
three vibratory passes of the 11.4 Mg (12.5 ton) vibratory steel wheel roller followed by
the same number of passes with the same roller in the static mode. Figure 3 showed
typical CIR compaction equipment.
Reported Agency Compaction Results
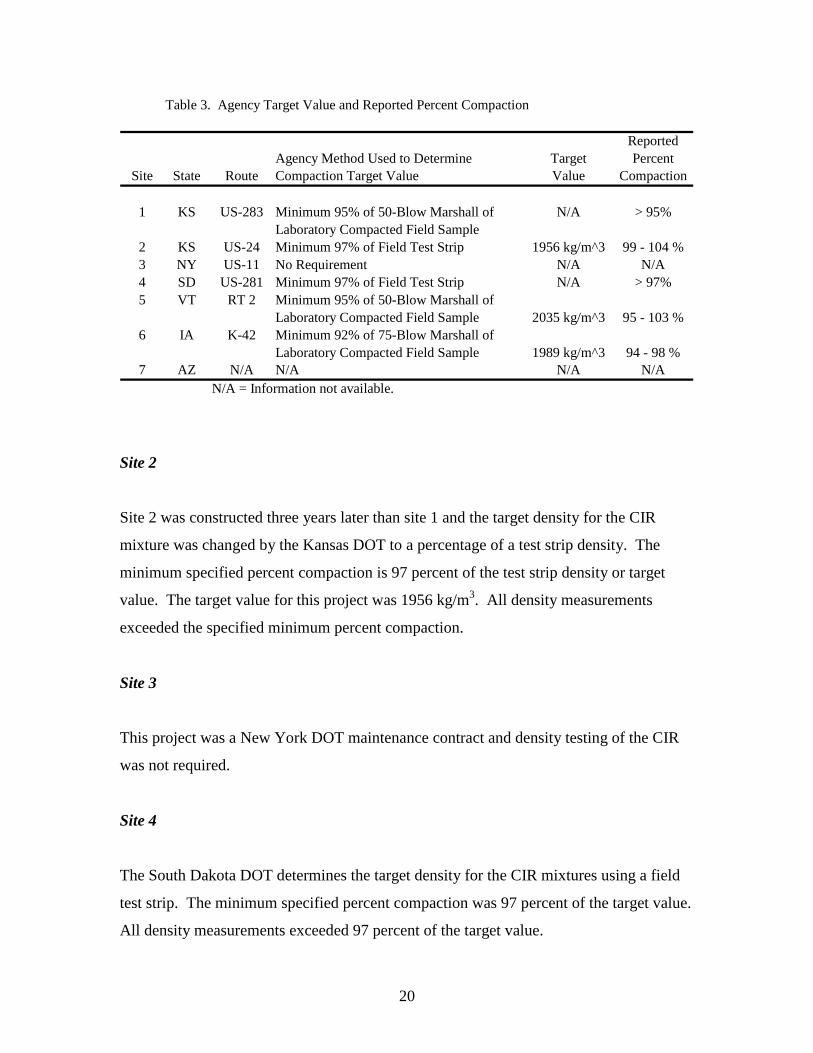
Table 3 shows the agency methodology used to determine the target value for compaction
control and the target value for each site, if available. Agencies typically used nuclear
moisture-density meters and field moisture content samples to monitor percent
compaction. The results in table 3 indicate that the projects met the minimum percent
compaction requirements. A brief description of the agency reported compaction control
procedures and results are provided below.
Site 1
The target density for this CIR mixture was determined by the Kansas DOT using field
produced samples. Compaction control was a minimum of 95% of a 50-blow Marshall
compacted sample. Compaction was reported as exceeding minimum requirements.
20
Site 2
Site 2 was constructed three years later than site 1 and the target density for the CIR
mixture was changed by the Kansas DOT to a percentage of a test strip density. The
minimum specified percent compaction is 97 percent of the test strip density or target
value. The target value for this project was 1956 kg/m3. All density measurements
exceeded the specified minimum percent compaction.
Site 3
This project was a New York DOT maintenance contract and density testing of the CIR
was not required.
Site 4
The South Dakota DOT determines the target density for the CIR mixtures using a field
test strip. The minimum specified percent compaction was 97 percent of the target value.
All density measurements exceeded 97 percent of the target value.
Table 3. Agency Target Value and Reported Percent Compaction
ReportedAgency Method Used to Determine Target Percent
Site State Route Compaction Target Value Value Compaction
1 KS US-283 Minimum 95% of 50-Blow Marshall of N/A > 95%Laboratory Compacted Field Sample
2 KS US-24 Minimum 97% of Field Test Strip 1956 kg/m^3 99 - 104 %3 NY US-11 No Requirement N/A N/A4 SD US-281 Minimum 97% of Field Test Strip N/A > 97%5 VT RT 2 Minimum 95% of 50-Blow Marshall of
Laboratory Compacted Field Sample 2035 kg/m^3 95 - 103 %6 IA K-42 Minimum 92% of 75-Blow Marshall of
Laboratory Compacted Field Sample 1989 kg/m^3 94 - 98 %7 AZ N/A N/A N/A N/A
N/A = Information not available.
21
Site 5
Vermont DOT specifications require a minimum compaction for CIR of 95 percent of a
target density. The target density is determined from a 50-blow Marshall laboratory
compacted sample. The target density was 2035.3 kg/m3 (127.0 pcf) with a minimum
field compacted unit weight of 1934.3 kg/m3 (120.7 pcf). Compaction exceeded the
required minimum.
Site 6
Target densities for county road projects in Iowa are a minimum of 92 percent of a
laboratory compacted sample. A field sample is obtained each day and transported to an
Iowa DOT district materials laboratory where it is immediately compacted to 75 blows
per side with a Marshall hammer. The laboratory compacted dry density for September
15, 2000, was 1988.8 kg/m3 (124.1 pcf), with a minimum compacted density of 1830.1
kg/m3 (114.2 pcf). All density tests in the test section exceeded the minimum density
requirement.
Site 7
The project was sampled as a part of Lee’s work at URI (1) and samples were provided to
the University of Kansas. Agency compaction requirements and results were not
available.
FIELD TEST RESULTS
Sites 2-6 were sampled as a part of this research project and followed a field sampling
and testing plan. Site 1 was previously sampled under a different project by the author.(7)
Site 7 was a part of project by URI (1) and samples were supplied to the University of
Kansas.
For sites 2-6, a 30-m long test section was generally laid out for sampling and testing.
After placement and compaction, the in-place density was determined using a nuclear
22
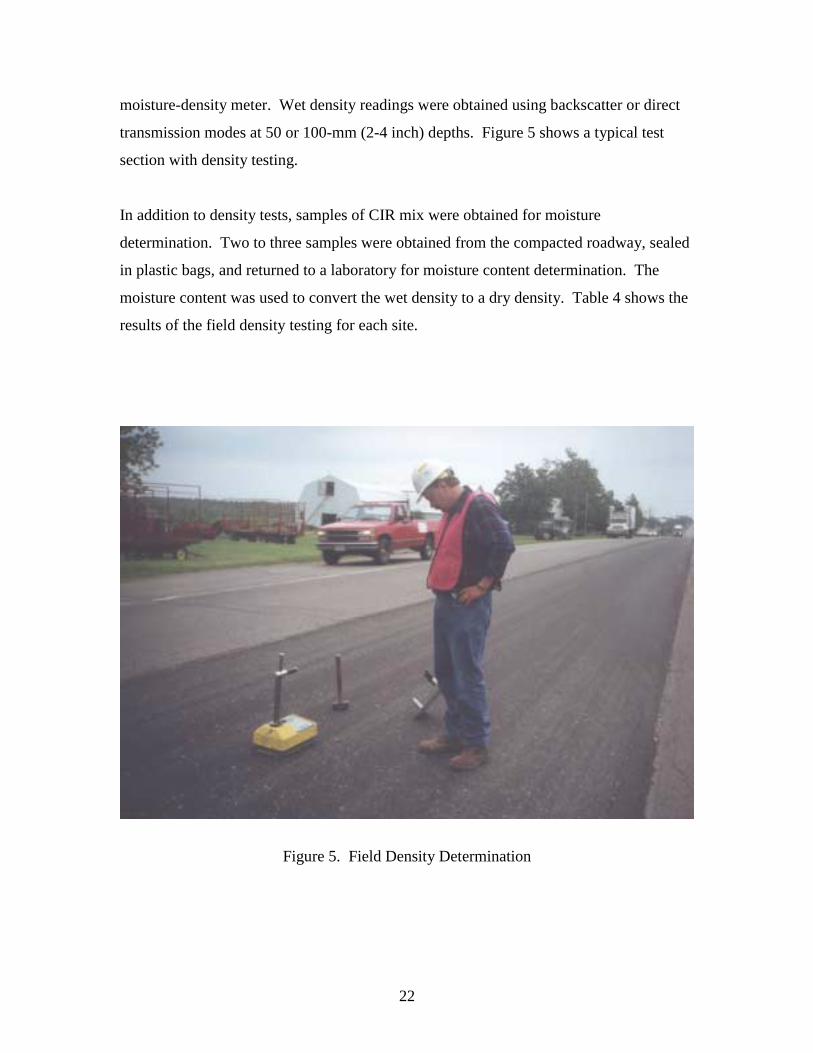
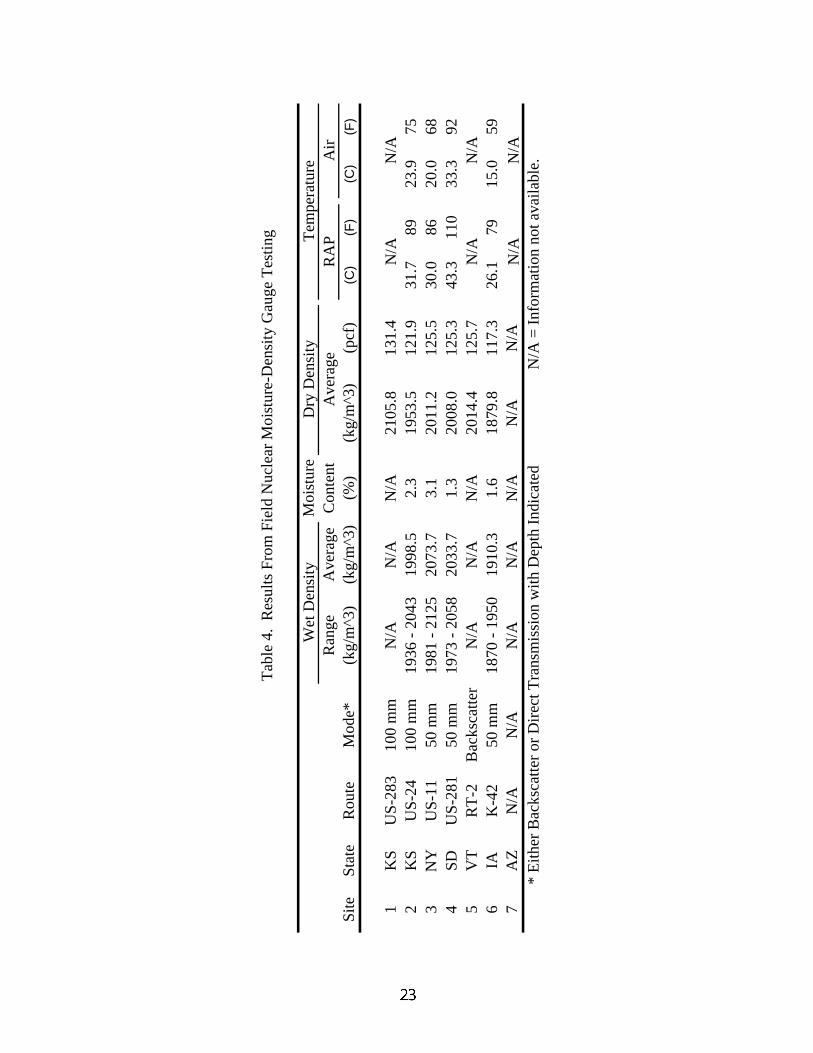
moisture-density meter. Wet density readings were obtained using backscatter or direct
transmission modes at 50 or 100-mm (2-4 inch) depths. Figure 5 shows a typical test
section with density testing.
In addition to density tests, samples of CIR mix were obtained for moisture
determination. Two to three samples were obtained from the compacted roadway, sealed
in plastic bags, and returned to a laboratory for moisture content determination. The
moisture content was used to convert the wet density to a dry density. Table 4 shows the
results of the field density testing for each site.
Figure 5. Field Density Determination
Tabl
e 4.
Res
ults
Fro
m F
ield
Nuc
lear
Moi
stur
e-D
ensi
ty G
auge
Tes
ting
Moi
stur
eR
ange
Ave
rage
Con
tent
Site
Stat
eR
oute
Mod
e*(k
g/m
^3)
(kg/
m^3
)(%
)(k
g/m
^3)
(pcf
)(C
)(F
)(C
)(F
)
1K
SU
S-28
310
0 m
mN
/AN
/AN
/A21
05.8
131.
42
KS
US-
2410
0 m
m19
36 -
2043
1998
.52.
319
53.5
121.
931
.789
23.9
753
NY
US-
1150
mm
1981
- 21
2520
73.7
3.1
2011
.212
5.5
30.0
8620
.068
4SD
US-
281
50 m
m19
73 -
2058
2033
.71.
320
08.0
125.
343
.311
033
.392
5V
TR
T-2
Bac
ksca
tter
N/A
N/A
N/A
2014
.412
5.7
6IA
K-4
250
mm
1870
- 19
5019
10.3
1.6
1879
.811
7.3
26.1
7915
.059
7A
ZN
/AN
/AN
/AN
/AN
/AN
/AN
/A*
Eith
er B
acks
catte
r or D
irect
Tra
nsm
issi
on w
ith D
epth
Indi
cate
dN
/A =
Info
rmat
ion
not a
vaila
ble.
Wet
Den
sity
Ave
rage
Dry
Den
sity
RA
PTem
pera
ture
N/A
N/A
N/A
Air
N/A
N/A
N/A
24
LABORATORY TEST RESULTS
RAP and Aggregate Properties
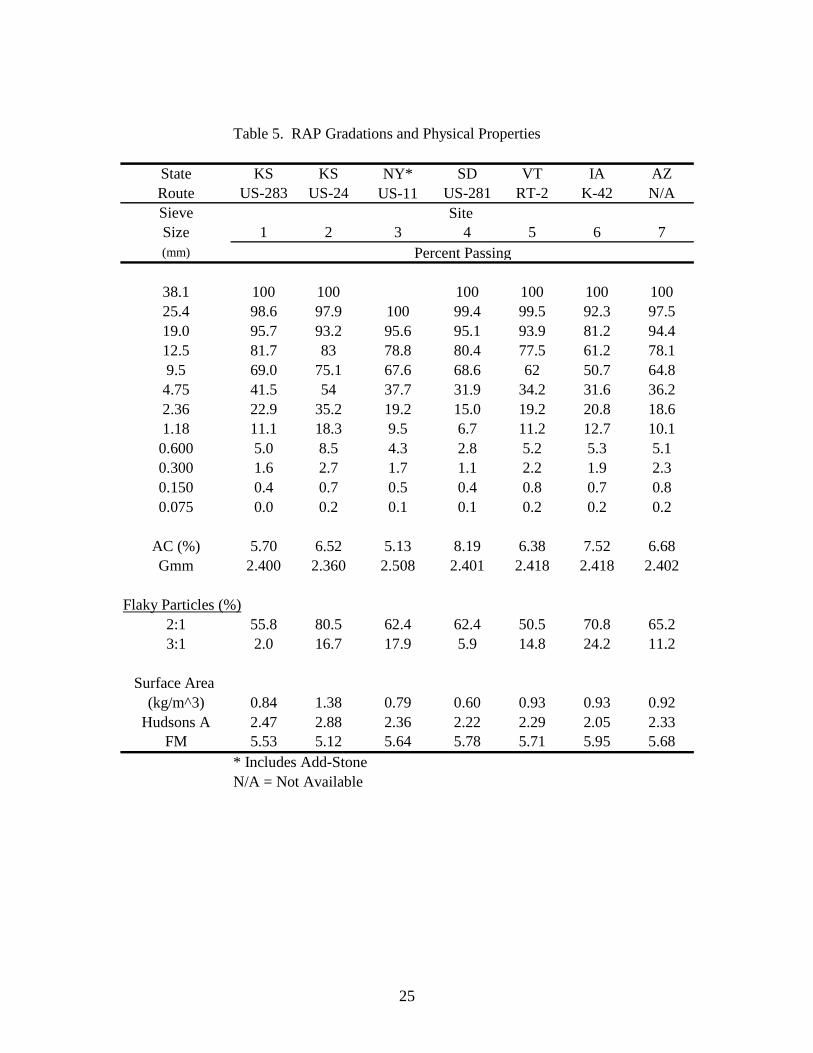
The gradation of the RAP, as received, was determined in accordance with AASHTO T
27. From the complete gradation of the RAP, the fineness modulus (FM) and Hudson’s
A coefficient were determined. The FM was determined in accordance with AASHTO T
27. The surface area of the RAP was determined using Hveem’s surface area factors.(9)
The percent flaky particles of the RAP were determined by comparing the largest
dimension to the smallest dimension, in general accordance with ASTM D 4791. The
properties of the RAP are shown in table 5.
Two 2,000-g samples of the RAP from each site were batched to the appropriate
gradation and the physical properties determined. The theoretical maximum density
(Gmm) was determined in accordance with AASHTO T 209. Next, the asphalt content
was determined using the ignition furnace in accordance with AASHTO T 308. These
properties are also shown in table 5.
The aggregate was recovered from the ignition furnace and the gradation determined in
accordance with AASHTO T 30. The crushed face count of the recovered coarse
aggregate was determined in accordance with ASTM D 5821. The fine aggregate
angularity (FAA) of the recovered aggregate was determined in accordance with Kansas
DOT Test Method KT-50.(10) The surface area, FM and Hudson’s A coefficient was
determined for the extracted aggregate in the same manner as with the RAP. The results
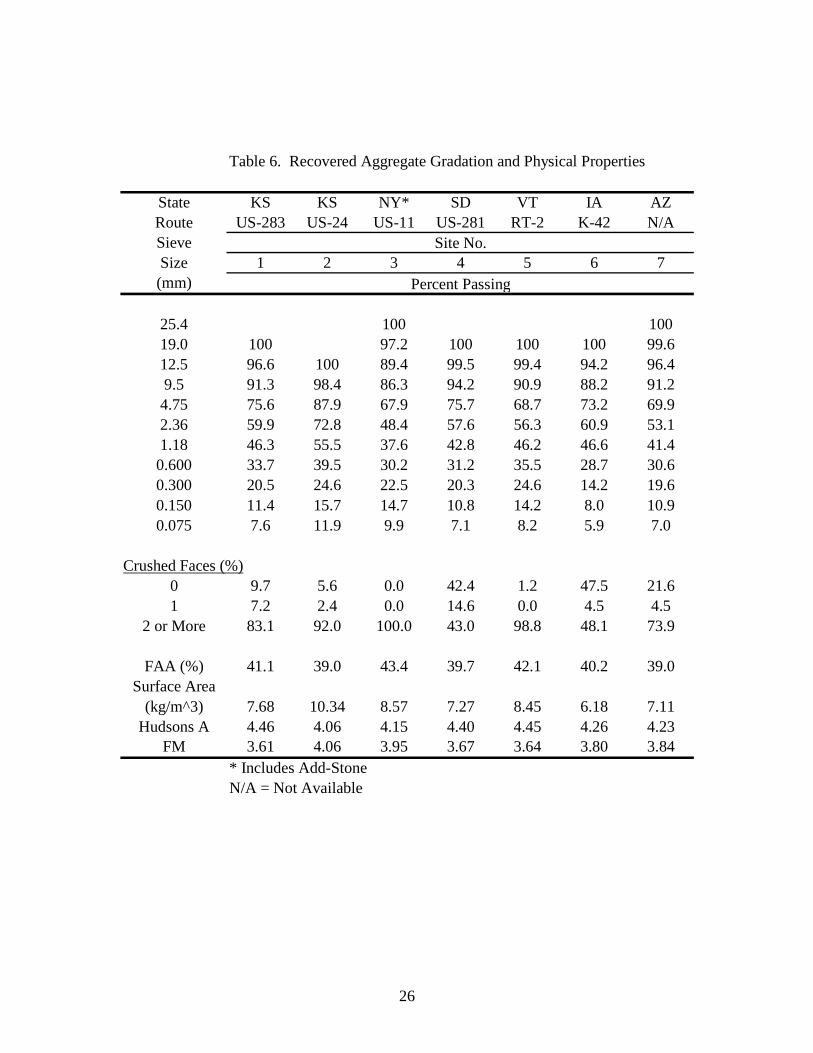
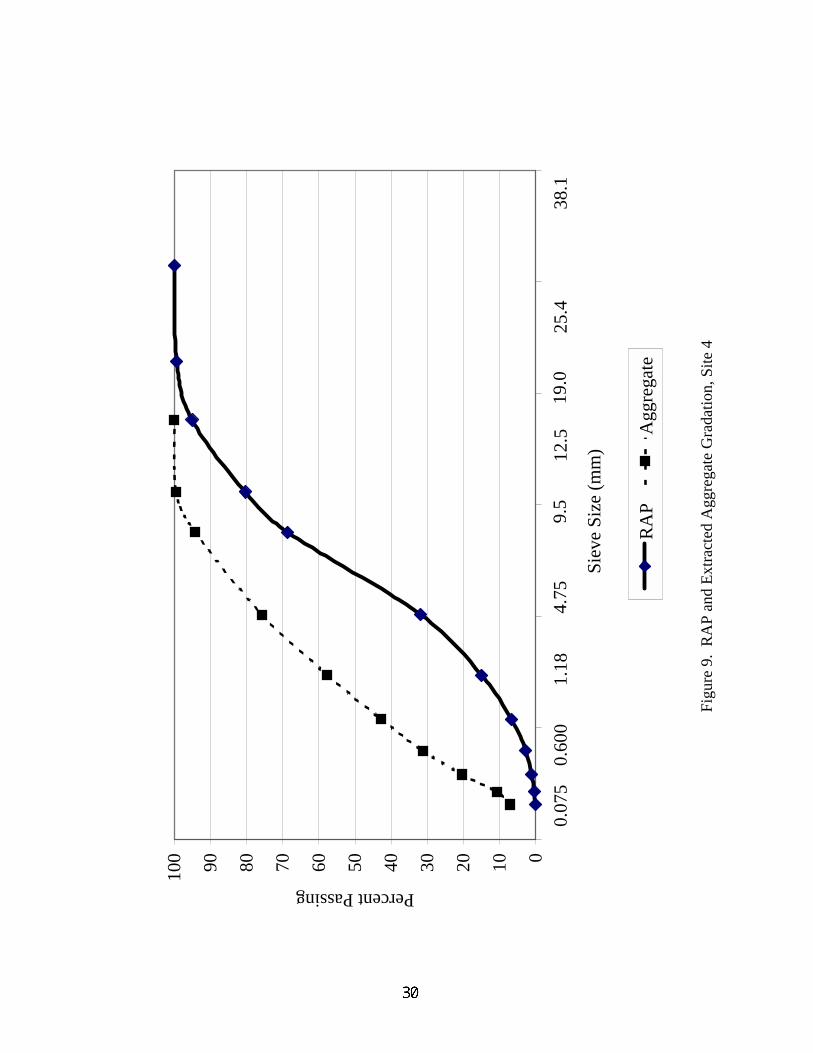
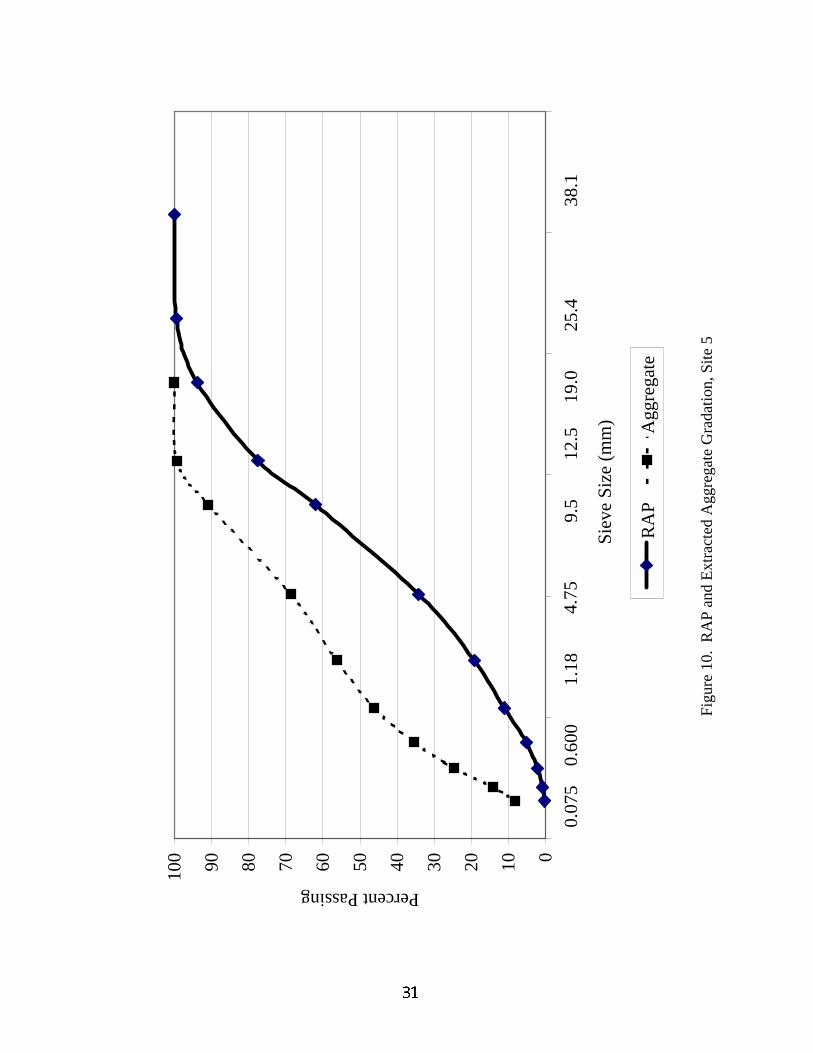
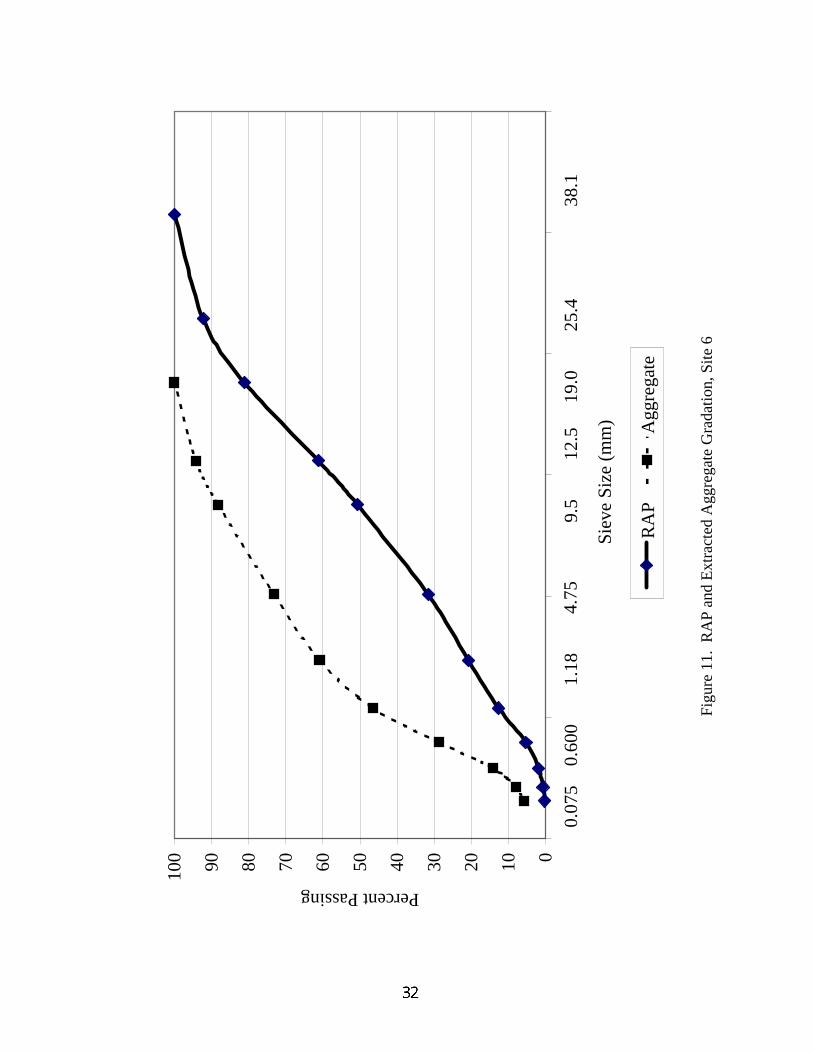
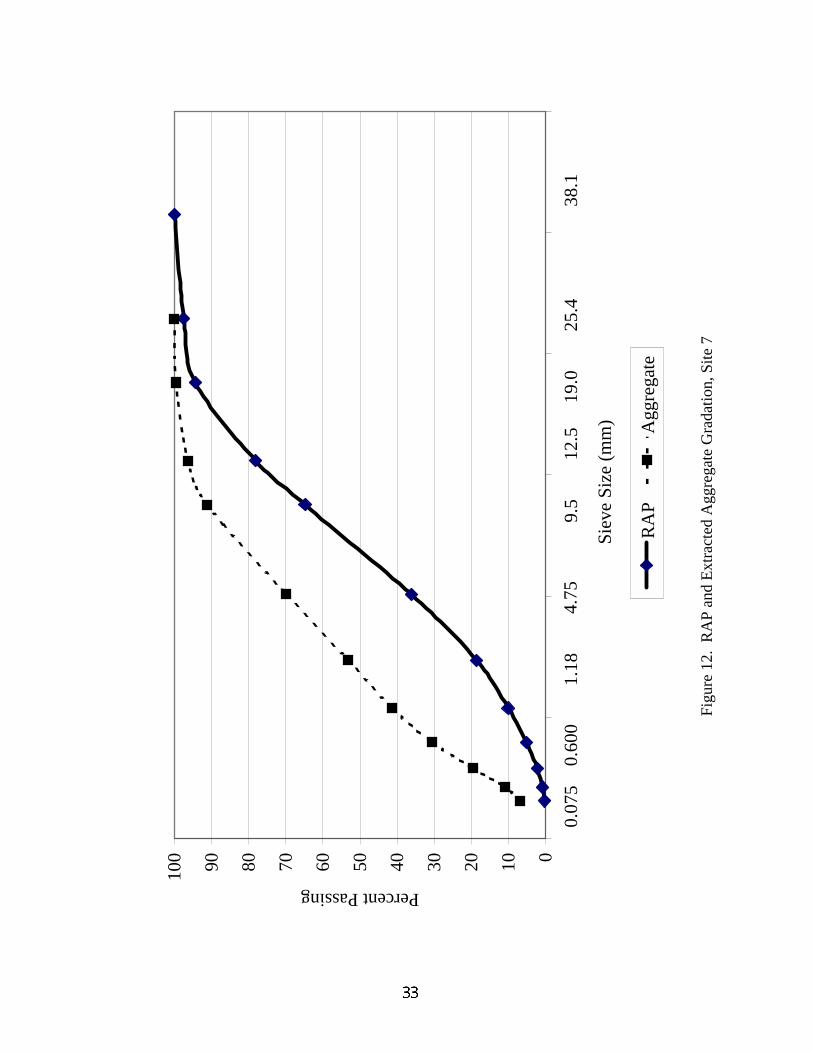
are shown in table 6. Figures 6-12 are plots of the RAP and aggregate gradations.
25
Table 5. RAP Gradations and Physical Properties
State KS KS SD VT IA AZRoute US-283 US-24 US-281 RT-2 K-42 N/ASieveSize 1 2 3 4 5 6 7(mm)
38.1 100 100 100 100 100 10025.4 98.6 97.9 100 99.4 99.5 92.3 97.519.0 95.7 93.2 95.6 95.1 93.9 81.2 94.412.5 81.7 83 78.8 80.4 77.5 61.2 78.19.5 69.0 75.1 67.6 68.6 62 50.7 64.84.75 41.5 54 37.7 31.9 34.2 31.6 36.22.36 22.9 35.2 19.2 15.0 19.2 20.8 18.61.18 11.1 18.3 9.5 6.7 11.2 12.7 10.10.600 5.0 8.5 4.3 2.8 5.2 5.3 5.10.300 1.6 2.7 1.7 1.1 2.2 1.9 2.30.150 0.4 0.7 0.5 0.4 0.8 0.7 0.80.075 0.0 0.2 0.1 0.1 0.2 0.2 0.2
AC (%) 5.70 6.52 5.13 8.19 6.38 7.52 6.68Gmm 2.400 2.360 2.508 2.401 2.418 2.418 2.402
Flaky Particles (%)2:1 55.8 80.5 62.4 62.4 50.5 70.8 65.23:1 2.0 16.7 17.9 5.9 14.8 24.2 11.2
Surface Area (kg/m^3) 0.84 1.38 0.79 0.60 0.93 0.93 0.92
Hudsons A 2.47 2.88 2.36 2.22 2.29 2.05 2.33FM 5.53 5.12 5.64 5.78 5.71 5.95 5.68
* Includes Add-StoneN/A = Not Available
Percent Passing
Site US-11NY*
26
Table 6. Recovered Aggregate Gradation and Physical Properties
State KS KS NY* SD VT IA AZRoute US-283 US-24 US-11 US-281 RT-2 K-42 N/ASieveSize 1 2 3 4 5 6 7(mm)
25.4 100 10019.0 100 97.2 100 100 100 99.612.5 96.6 100 89.4 99.5 99.4 94.2 96.49.5 91.3 98.4 86.3 94.2 90.9 88.2 91.2
4.75 75.6 87.9 67.9 75.7 68.7 73.2 69.92.36 59.9 72.8 48.4 57.6 56.3 60.9 53.11.18 46.3 55.5 37.6 42.8 46.2 46.6 41.4
0.600 33.7 39.5 30.2 31.2 35.5 28.7 30.60.300 20.5 24.6 22.5 20.3 24.6 14.2 19.60.150 11.4 15.7 14.7 10.8 14.2 8.0 10.90.075 7.6 11.9 9.9 7.1 8.2 5.9 7.0
Crushed Faces (%)0 9.7 5.6 0.0 42.4 1.2 47.5 21.61 7.2 2.4 0.0 14.6 0.0 4.5 4.5
2 or More 83.1 92.0 100.0 43.0 98.8 48.1 73.9
FAA (%) 41.1 39.0 43.4 39.7 42.1 40.2 39.0Surface Area
(kg/m^3) 7.68 10.34 8.57 7.27 8.45 6.18 7.11Hudsons A 4.46 4.06 4.15 4.40 4.45 4.26 4.23
FM 3.61 4.06 3.95 3.67 3.64 3.80 3.84* Includes Add-StoneN/A = Not Available
Site No.
Percent Passing
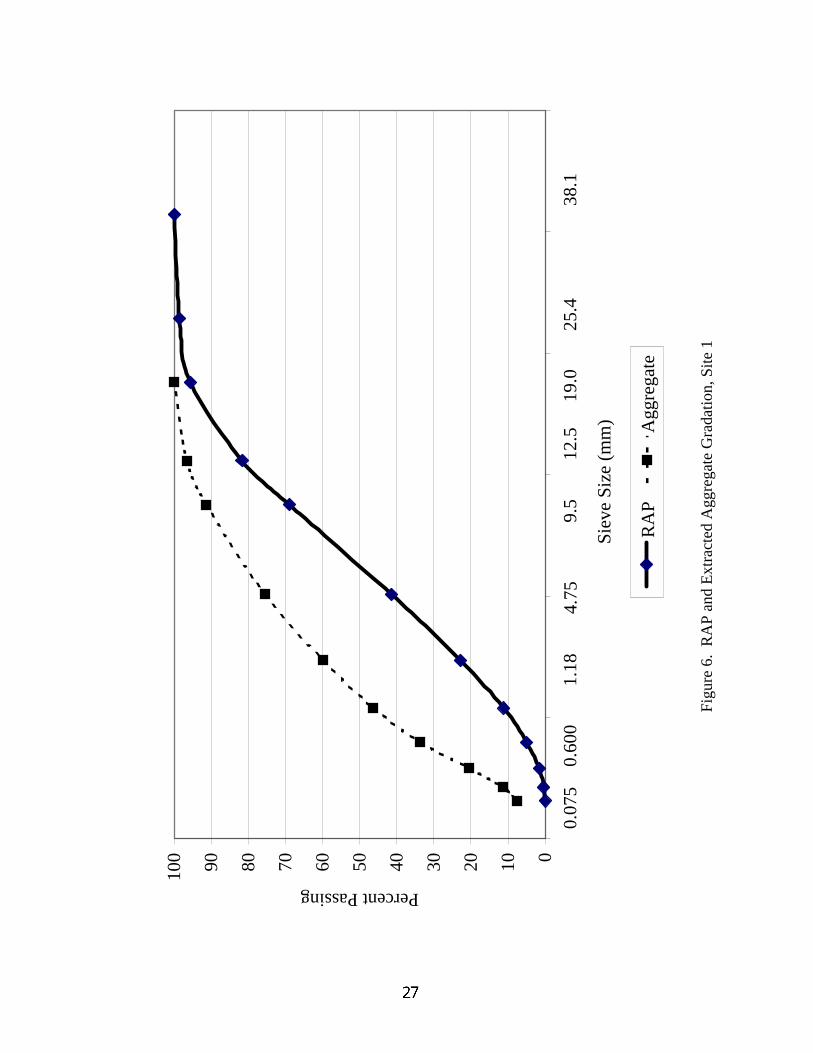
Figu
re 6
. R
AP
and
Extra
cted
Agg
rega
te G
rada
tion,
Site
1
0102030405060708090100
Siev
e Si
ze (m
m)
Percent Passing
RA
PA
ggre
gate
0.07
50.
600
4.75
19.0
1.18
25.4
38.1
9.5
12.5
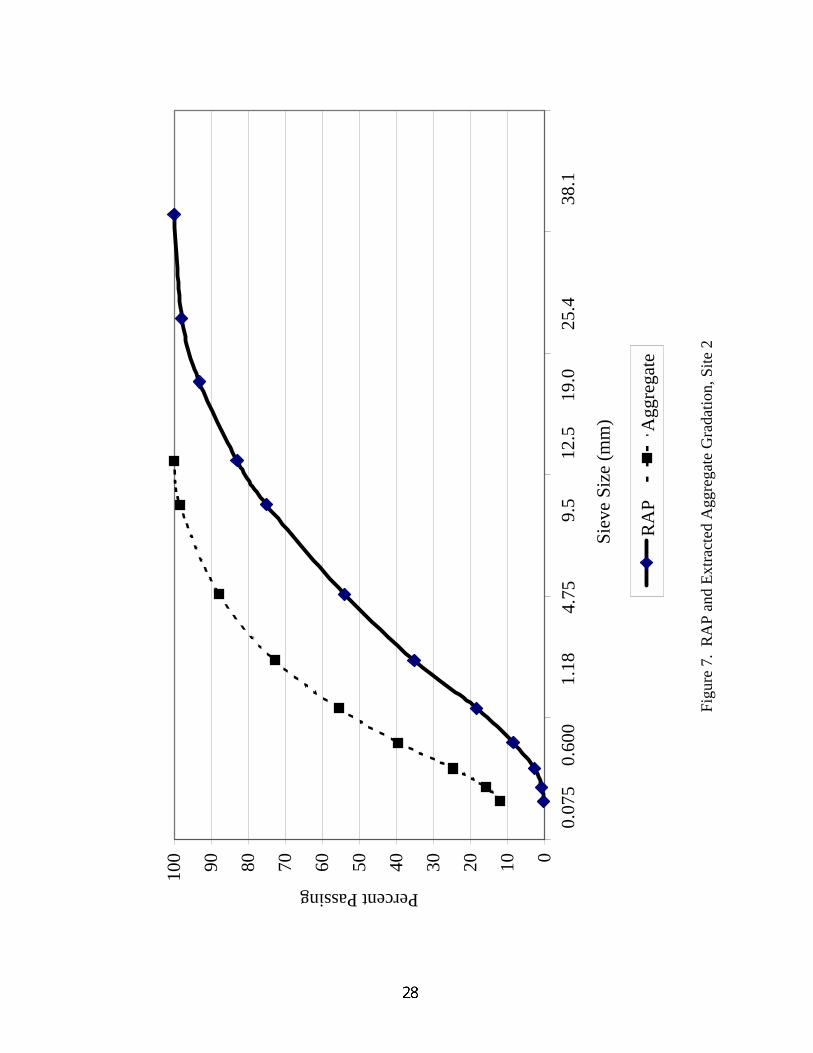
Figu
re 7
. R
AP
and
Extra
cted
Agg
rega
te G
rada
tion,
Site
2
0102030405060708090100
Siev
e Si
ze (m
m)
Percent Passing
RA
PA
ggre
gate
0.07
50.
600
4.75
19.0
1.18
25.4
38.1
9.5
12.5
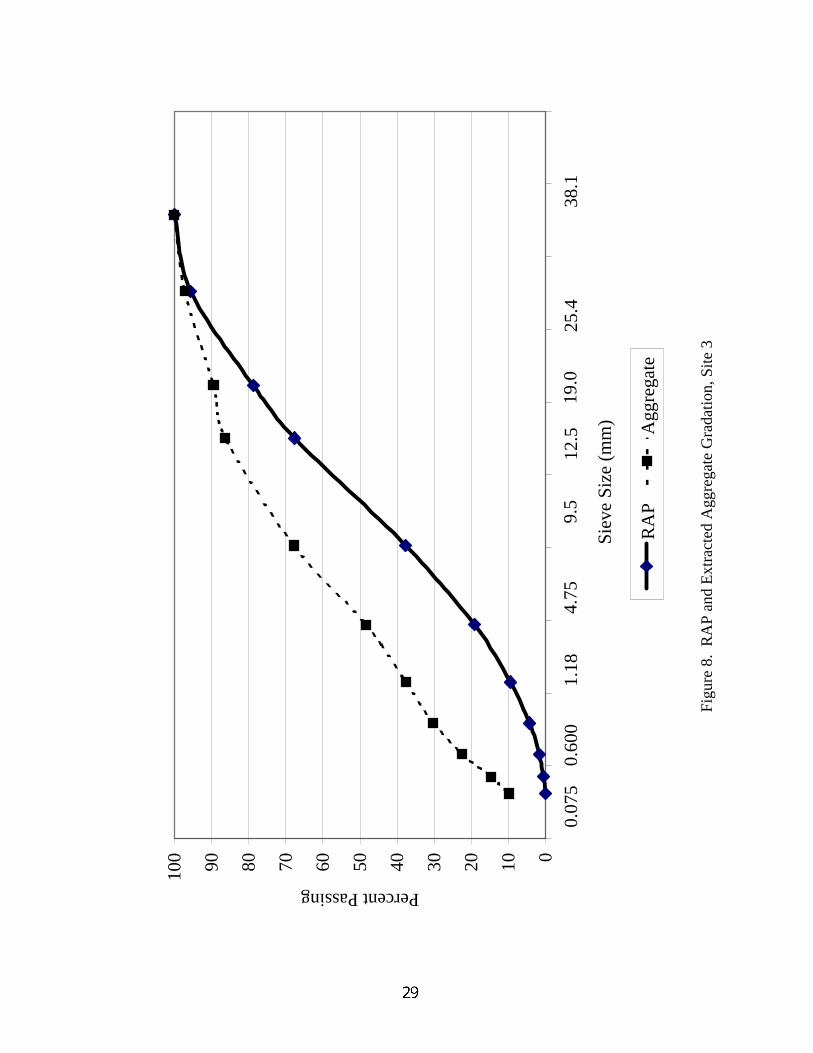
Figu
re 8
. R
AP
and
Extra
cted
Agg
rega
te G
rada
tion,
Site
3
0102030405060708090100
Siev
e Si
ze (m
m)
Percent Passing
RA
PA
ggre
gate
0.07
50.
600
4.75
19.0
1.18
25.4
38.1
9.5
12.5
Figu
re 9
. R
AP
and
Extra
cted
Agg
rega
te G
rada
tion,
Site
4
0102030405060708090100
Siev
e Si
ze (m
m)
Percent Passing
RA
PA
ggre
gate
0.07
50.
600
4.75
19.0
1.18
25.4
38.1
9.5
12.5
Figu
re 1
0. R
AP
and
Extra
cted
Agg
rega
te G
rada
tion,
Site
5
0102030405060708090100
Siev
e Si
ze (m
m)
Percent Passing
RA
PA
ggre
gate
0.07
50.
600
4.75
19.0
1.18
25.4
38.1
9.5
12.5
Figu
re 1
1. R
AP
and
Extra
cted
Agg
rega
te G
rada
tion,
Site
6
0102030405060708090100
Siev
e Si
ze (m
m)
Percent Passing
RA
PA
ggre
gate
0.07
50.
600
4.75
19.0
1.18
25.4
38.1
9.5
12.5
Figu
re 1
2. R
AP
and
Extra
cted
Agg
rega
te G
rada
tion,
Site
7
0102030405060708090100
Siev
e Si
ze (m
m)
Percent Passing
RA
PA
ggre
gate
0.07
50.
600
4.75
19.0
1.18
25.4
38.1
9.5
12.5
34
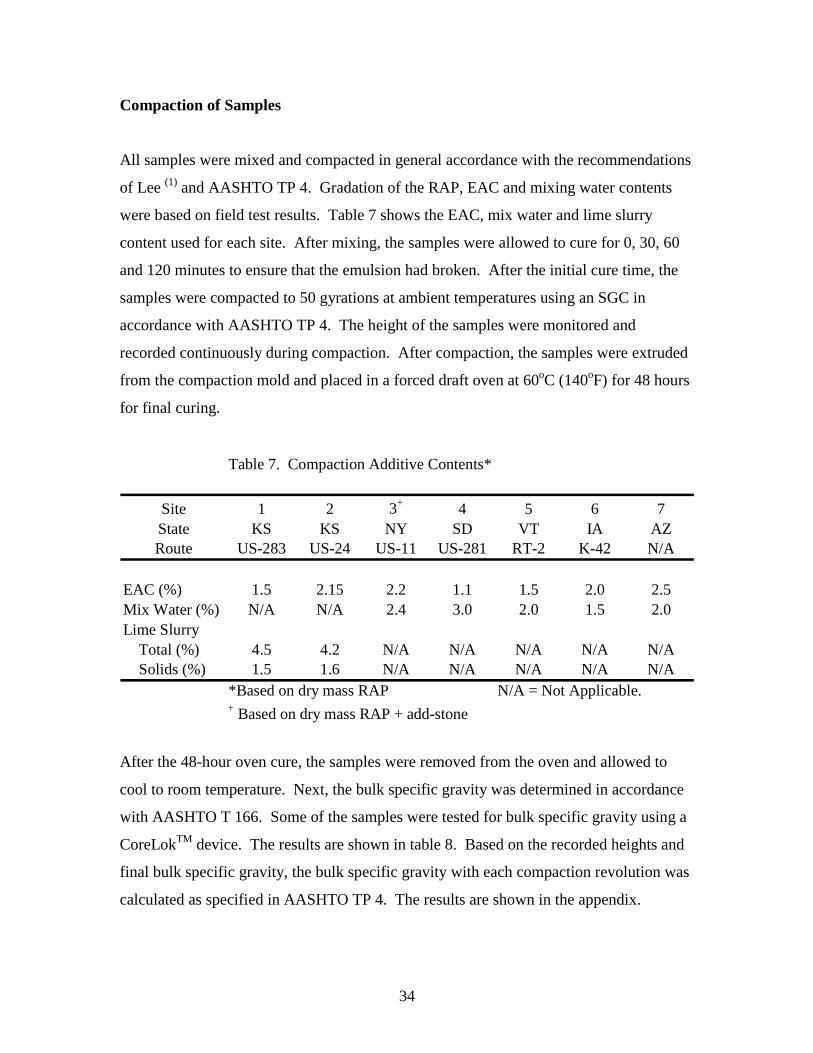
Compaction of Samples
All samples were mixed and compacted in general accordance with the recommendations
of Lee (1) and AASHTO TP 4. Gradation of the RAP, EAC and mixing water contents
were based on field test results. Table 7 shows the EAC, mix water and lime slurry
content used for each site. After mixing, the samples were allowed to cure for 0, 30, 60
and 120 minutes to ensure that the emulsion had broken. After the initial cure time, the
samples were compacted to 50 gyrations at ambient temperatures using an SGC in
accordance with AASHTO TP 4. The height of the samples were monitored and
recorded continuously during compaction. After compaction, the samples were extruded
from the compaction mold and placed in a forced draft oven at 60oC (140oF) for 48 hours
for final curing.
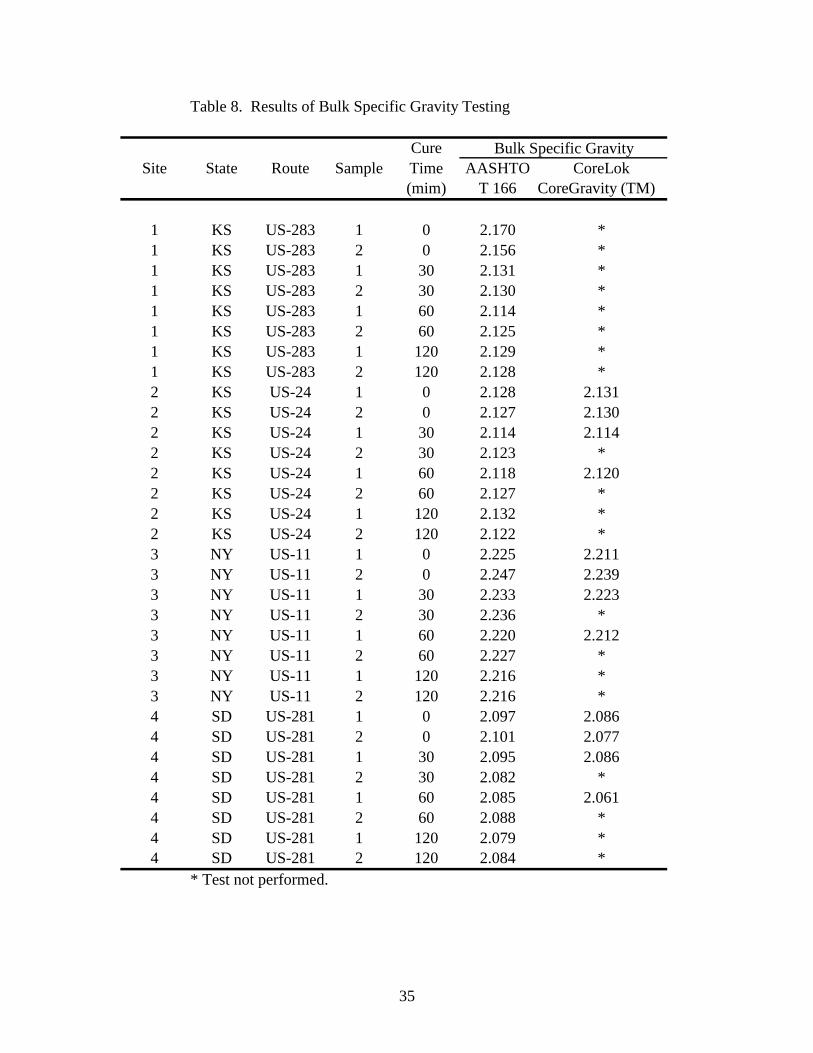
After the 48-hour oven cure, the samples were removed from the oven and allowed to
cool to room temperature. Next, the bulk specific gravity was determined in accordance
with AASHTO T 166. Some of the samples were tested for bulk specific gravity using a
CoreLokTM device. The results are shown in table 8. Based on the recorded heights and
final bulk specific gravity, the bulk specific gravity with each compaction revolution was
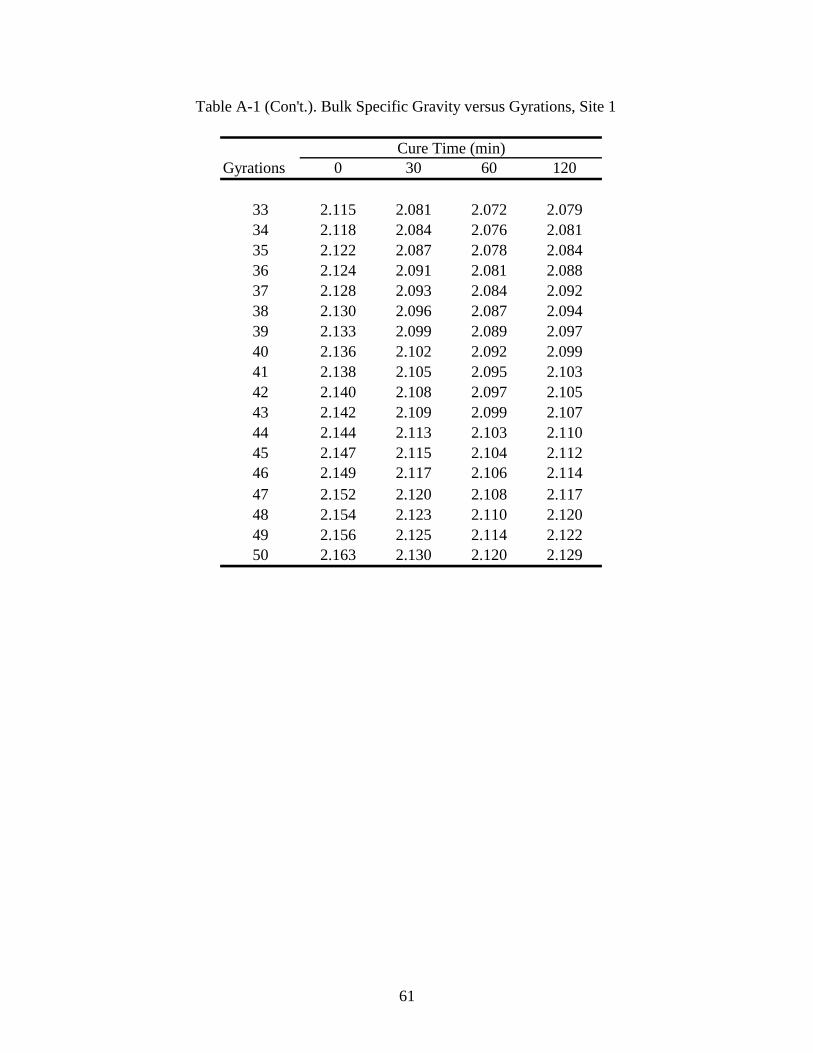
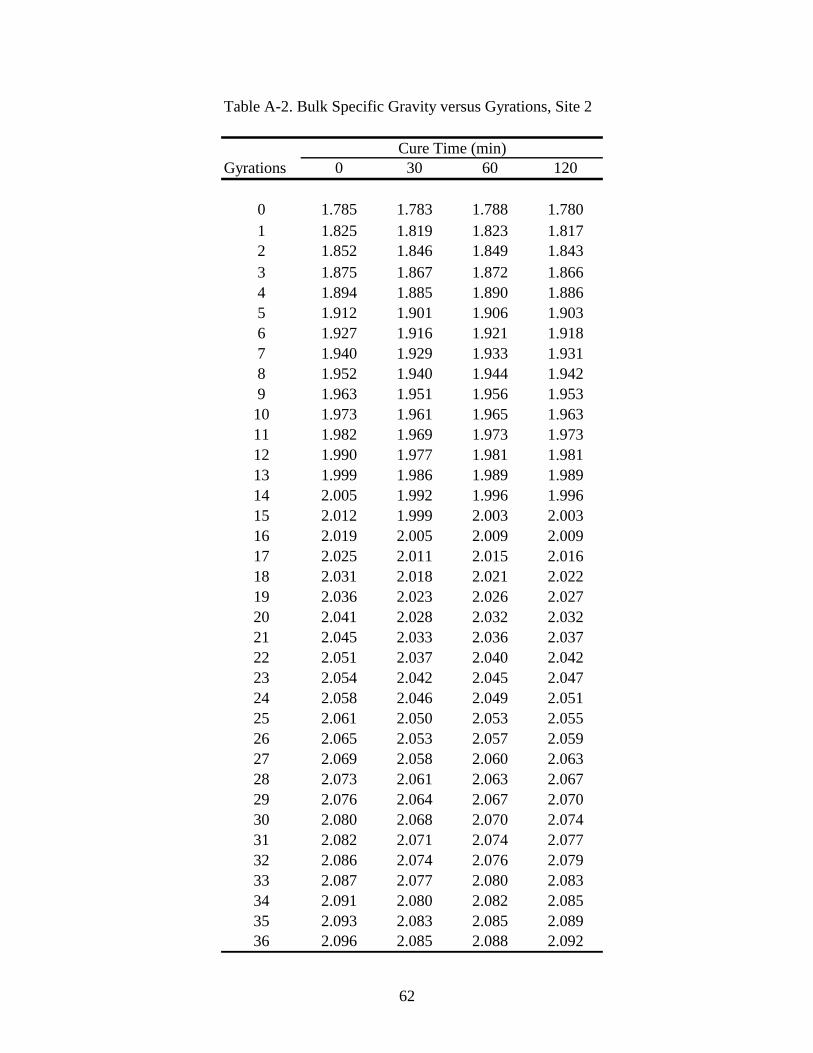
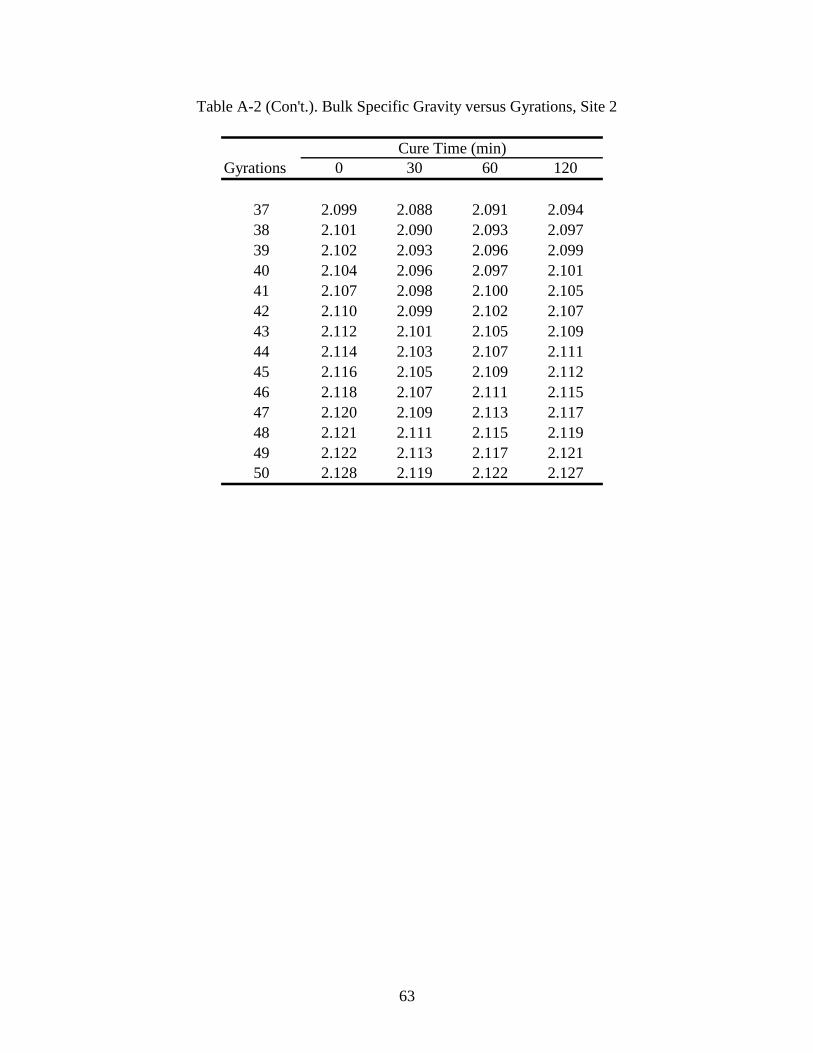
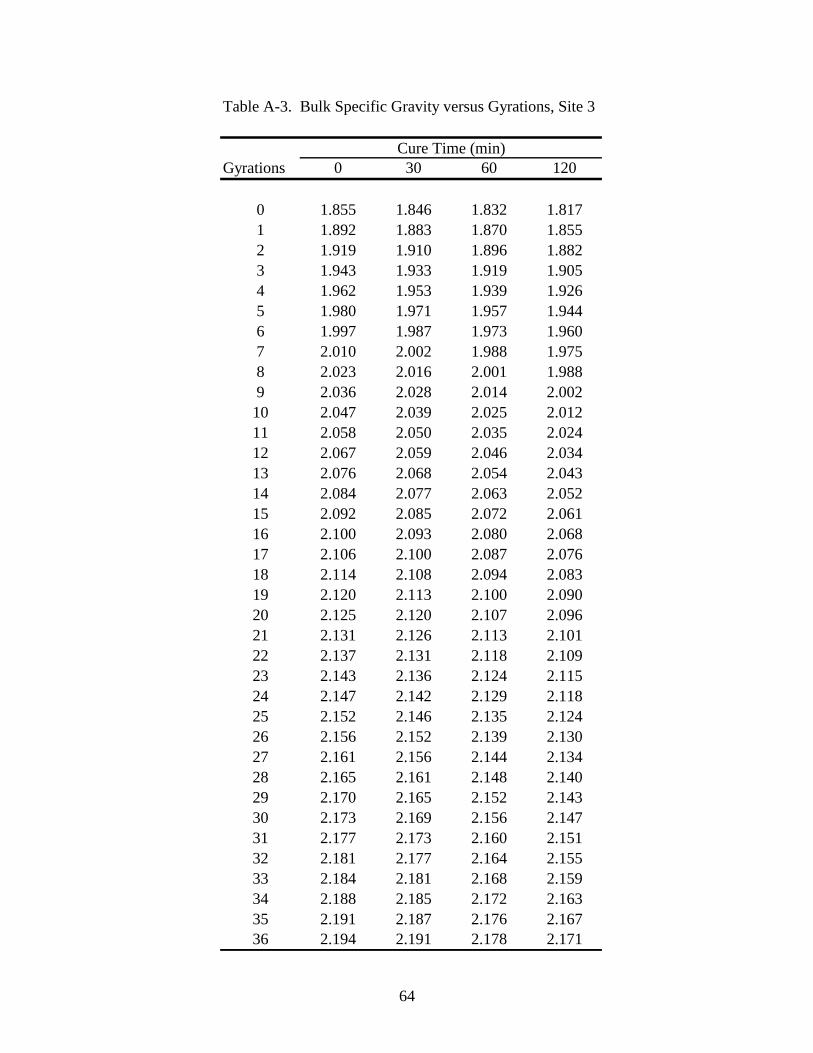
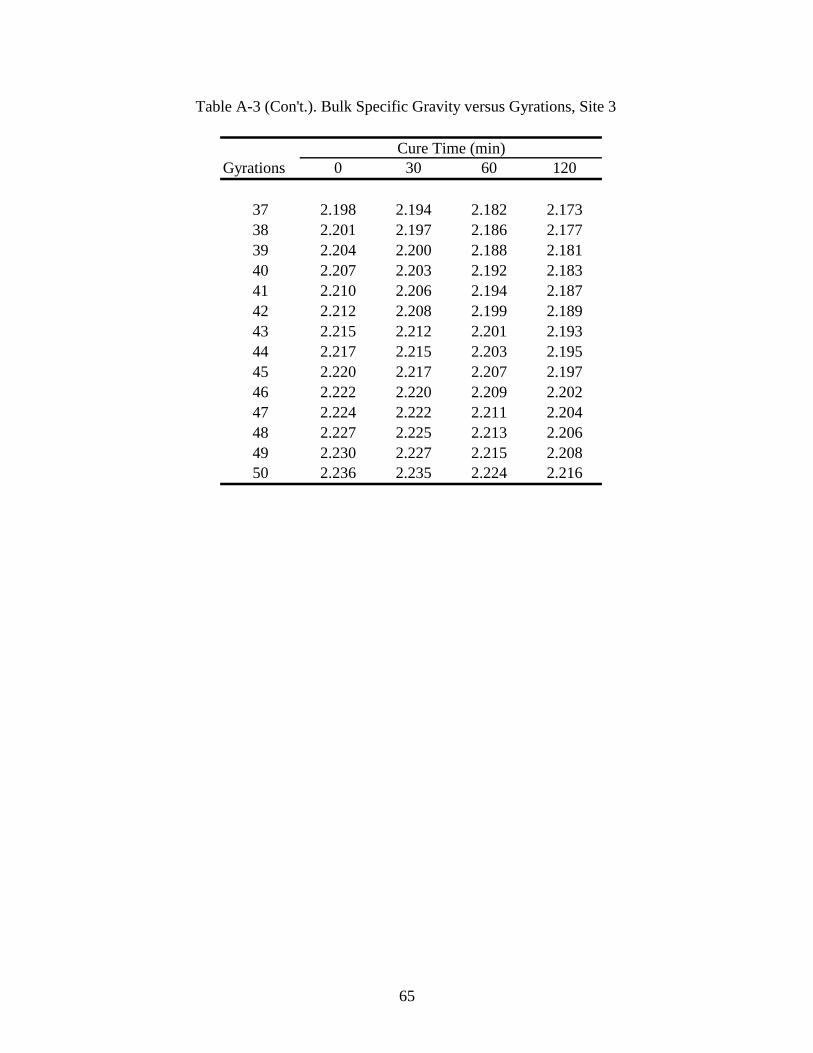
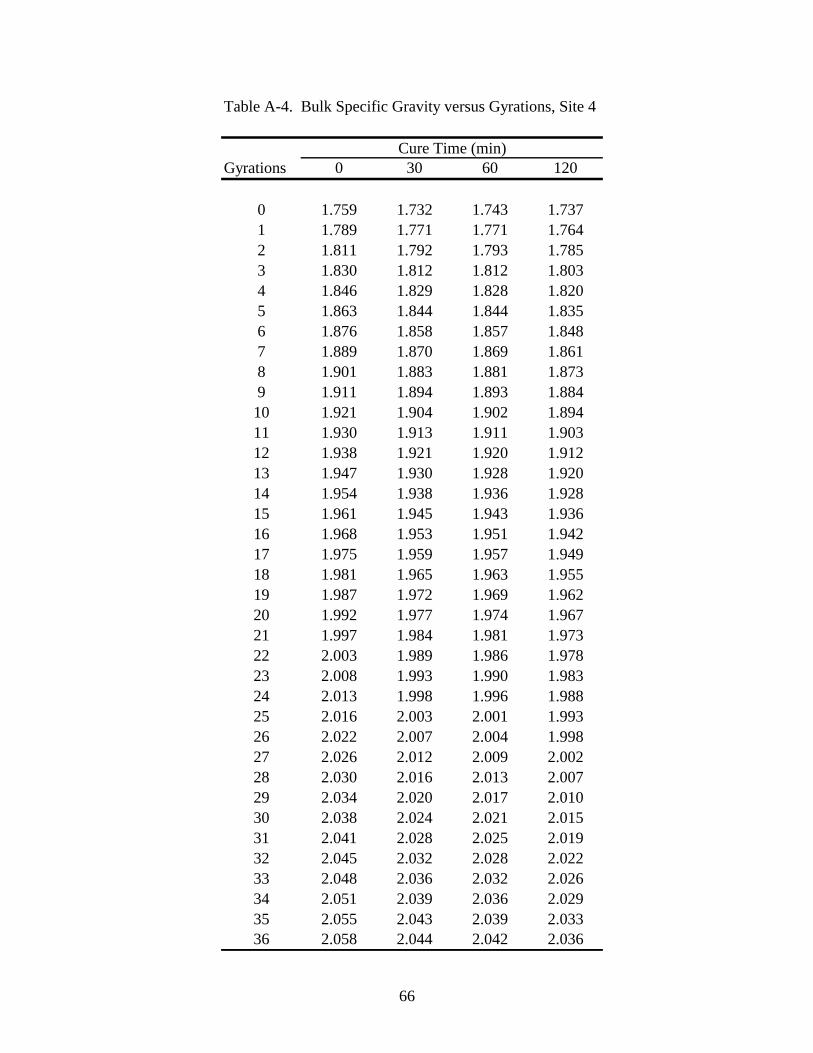
calculated as specified in AASHTO TP 4. The results are shown in the appendix.
Table 7. Compaction Additive Contents*
Site 1 2 3+ 4 5 6 7State KS KS NY SD VT IA AZRoute US-283 US-24 US-11 US-281 RT-2 K-42 N/A
EAC (%) 1.5 2.15 2.2 1.1 1.5 2.0 2.5Mix Water (%) N/A N/A 2.4 3.0 2.0 1.5 2.0Lime Slurry Total (%) 4.5 4.2 N/A N/A N/A N/A N/A Solids (%) 1.5 1.6 N/A N/A N/A N/A N/A
*Based on dry mass RAP N/A = Not Applicable.+ Based on dry mass RAP + add-stone
35
Table 8. Results of Bulk Specific Gravity Testing
CureSite State Route Sample Time AASHTO CoreLok
(mim) T 166 CoreGravity (TM)
1 KS US-283 1 0 2.170 *1 KS US-283 2 0 2.156 *1 KS US-283 1 30 2.131 *1 KS US-283 2 30 2.130 *1 KS US-283 1 60 2.114 *1 KS US-283 2 60 2.125 *1 KS US-283 1 120 2.129 *1 KS US-283 2 120 2.128 *2 KS US-24 1 0 2.128 2.1312 KS US-24 2 0 2.127 2.1302 KS US-24 1 30 2.114 2.1142 KS US-24 2 30 2.123 *2 KS US-24 1 60 2.118 2.1202 KS US-24 2 60 2.127 *2 KS US-24 1 120 2.132 *2 KS US-24 2 120 2.122 *3 NY US-11 1 0 2.225 2.2113 NY US-11 2 0 2.247 2.2393 NY US-11 1 30 2.233 2.2233 NY US-11 2 30 2.236 *3 NY US-11 1 60 2.220 2.2123 NY US-11 2 60 2.227 *3 NY US-11 1 120 2.216 *3 NY US-11 2 120 2.216 *4 SD US-281 1 0 2.097 2.0864 SD US-281 2 0 2.101 2.0774 SD US-281 1 30 2.095 2.0864 SD US-281 2 30 2.082 *4 SD US-281 1 60 2.085 2.0614 SD US-281 2 60 2.088 *4 SD US-281 1 120 2.079 *4 SD US-281 2 120 2.084 *
* Test not performed.
Bulk Specific Gravity
36
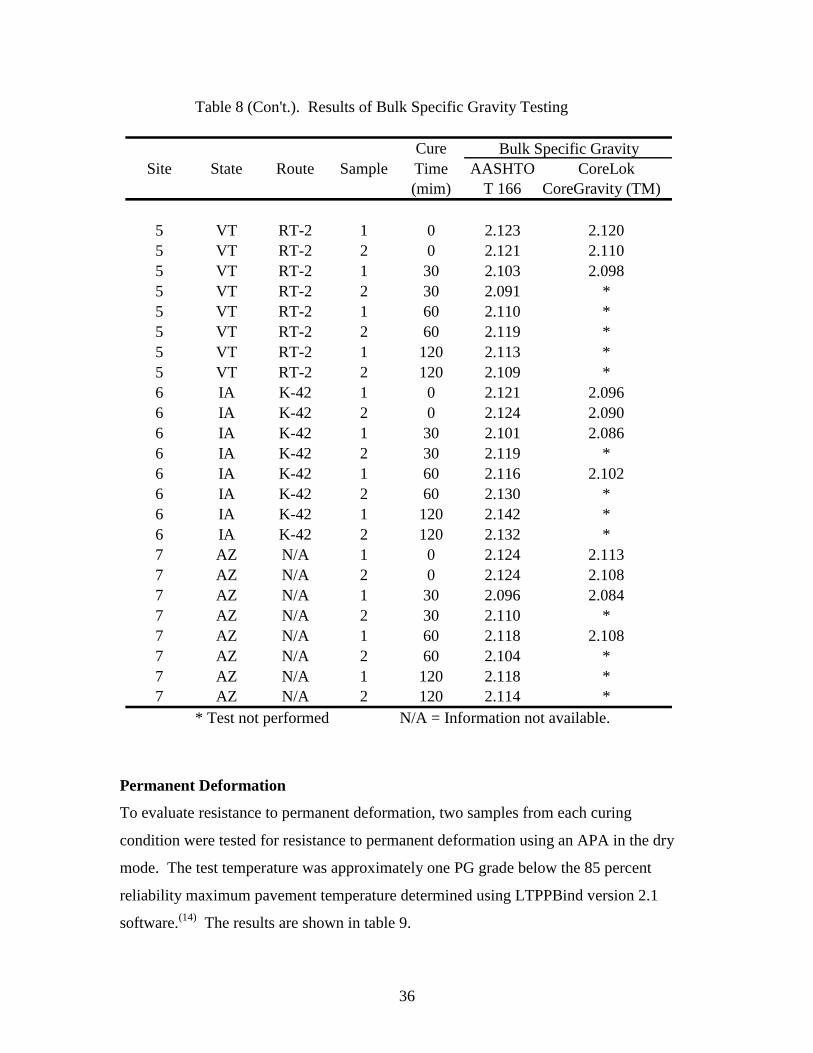
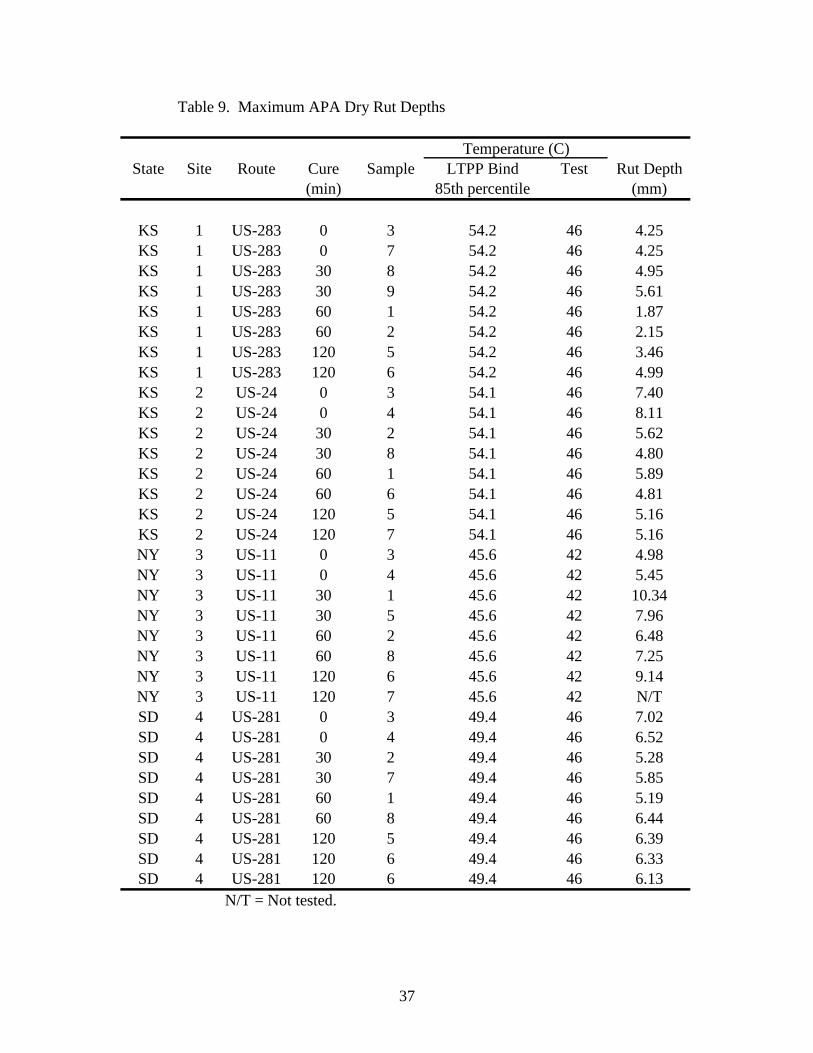
Permanent Deformation
To evaluate resistance to permanent deformation, two samples from each curing
condition were tested for resistance to permanent deformation using an APA in the dry
mode. The test temperature was approximately one PG grade below the 85 percent
reliability maximum pavement temperature determined using LTPPBind version 2.1
software.(14) The results are shown in table 9.
Table 8 (Con't.). Results of Bulk Specific Gravity Testing
CureSite State Route Sample Time AASHTO CoreLok
(mim) T 166 CoreGravity (TM)
5 VT RT-2 1 0 2.123 2.1205 VT RT-2 2 0 2.121 2.1105 VT RT-2 1 30 2.103 2.0985 VT RT-2 2 30 2.091 *5 VT RT-2 1 60 2.110 *5 VT RT-2 2 60 2.119 *5 VT RT-2 1 120 2.113 *5 VT RT-2 2 120 2.109 *6 IA K-42 1 0 2.121 2.0966 IA K-42 2 0 2.124 2.0906 IA K-42 1 30 2.101 2.0866 IA K-42 2 30 2.119 *6 IA K-42 1 60 2.116 2.1026 IA K-42 2 60 2.130 *6 IA K-42 1 120 2.142 *6 IA K-42 2 120 2.132 *7 AZ N/A 1 0 2.124 2.1137 AZ N/A 2 0 2.124 2.1087 AZ N/A 1 30 2.096 2.0847 AZ N/A 2 30 2.110 *7 AZ N/A 1 60 2.118 2.1087 AZ N/A 2 60 2.104 *7 AZ N/A 1 120 2.118 *7 AZ N/A 2 120 2.114 *
* Test not performed N/A = Information not available.
Bulk Specific Gravity
37
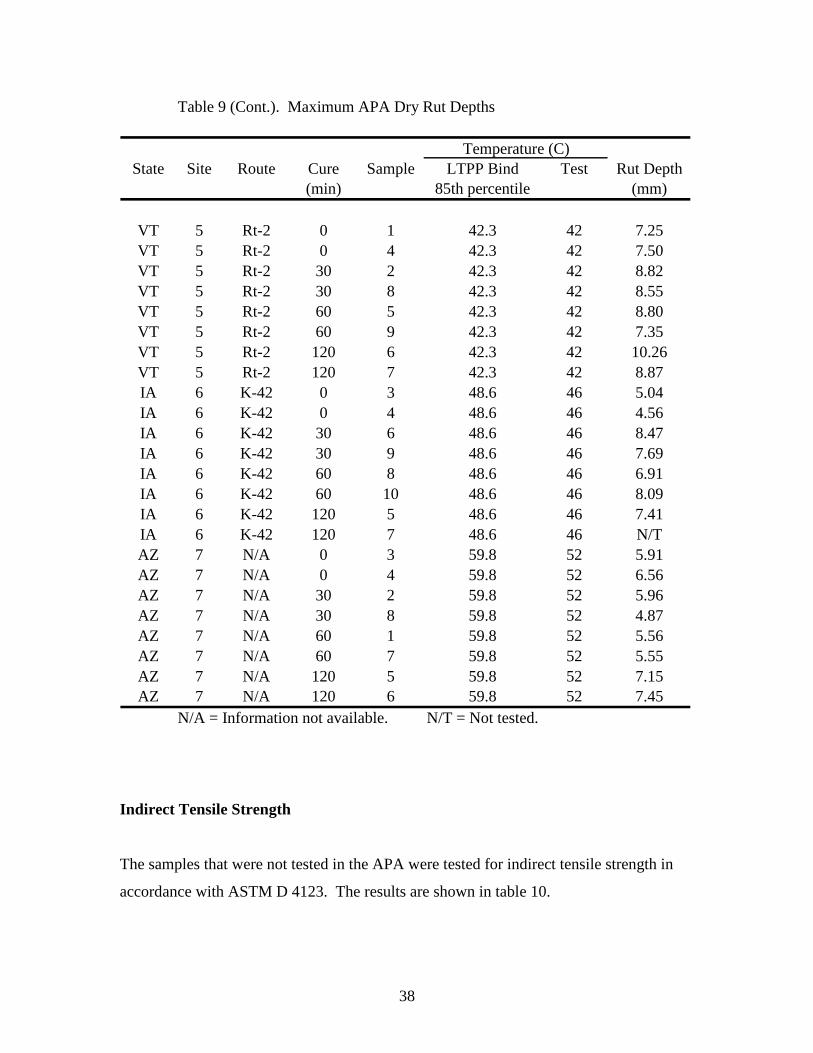
Table 9. Maximum APA Dry Rut Depths
State Site Route Cure Sample LTPP Bind Test Rut Depth(min) 85th percentile (mm)
KS 1 US-283 0 3 54.2 46 4.25KS 1 US-283 0 7 54.2 46 4.25KS 1 US-283 30 8 54.2 46 4.95KS 1 US-283 30 9 54.2 46 5.61KS 1 US-283 60 1 54.2 46 1.87KS 1 US-283 60 2 54.2 46 2.15KS 1 US-283 120 5 54.2 46 3.46KS 1 US-283 120 6 54.2 46 4.99KS 2 US-24 0 3 54.1 46 7.40KS 2 US-24 0 4 54.1 46 8.11KS 2 US-24 30 2 54.1 46 5.62KS 2 US-24 30 8 54.1 46 4.80KS 2 US-24 60 1 54.1 46 5.89KS 2 US-24 60 6 54.1 46 4.81KS 2 US-24 120 5 54.1 46 5.16KS 2 US-24 120 7 54.1 46 5.16NY 3 US-11 0 3 45.6 42 4.98NY 3 US-11 0 4 45.6 42 5.45NY 3 US-11 30 1 45.6 42 10.34NY 3 US-11 30 5 45.6 42 7.96NY 3 US-11 60 2 45.6 42 6.48NY 3 US-11 60 8 45.6 42 7.25NY 3 US-11 120 6 45.6 42 9.14NY 3 US-11 120 7 45.6 42 N/TSD 4 US-281 0 3 49.4 46 7.02SD 4 US-281 0 4 49.4 46 6.52SD 4 US-281 30 2 49.4 46 5.28SD 4 US-281 30 7 49.4 46 5.85SD 4 US-281 60 1 49.4 46 5.19SD 4 US-281 60 8 49.4 46 6.44SD 4 US-281 120 5 49.4 46 6.39SD 4 US-281 120 6 49.4 46 6.33SD 4 US-281 120 6 49.4 46 6.13
N/T = Not tested.
Temperature (C)
38
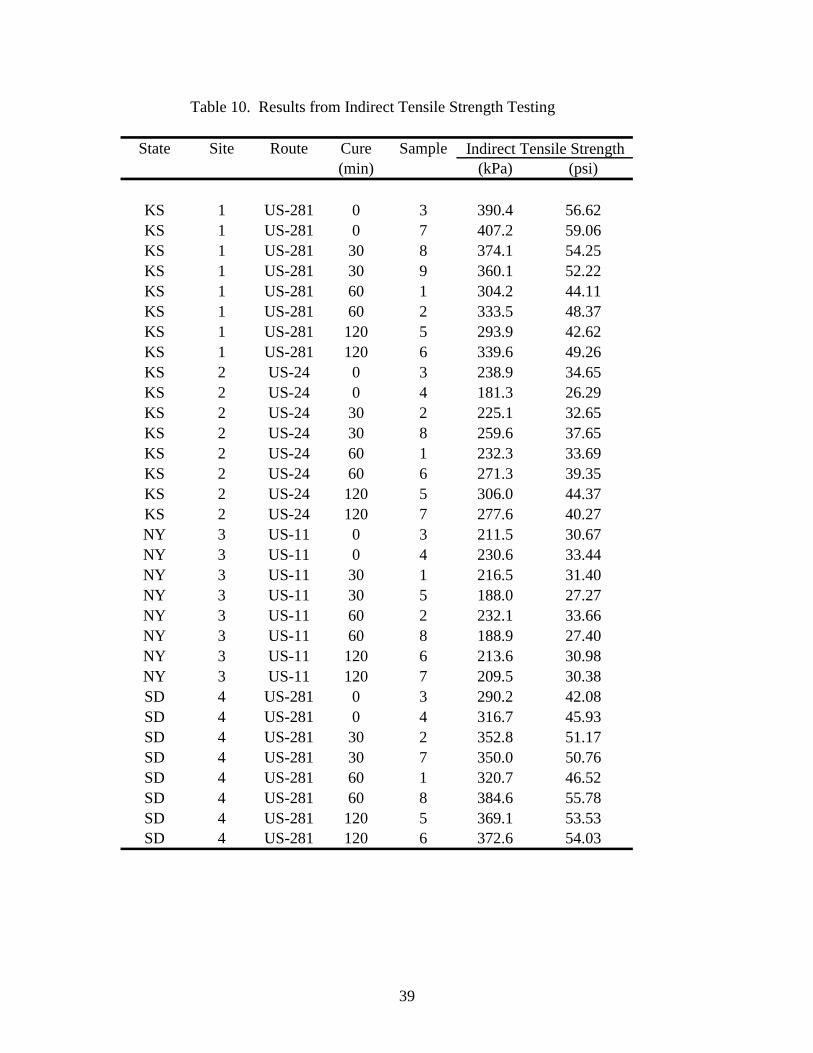
Indirect Tensile Strength
The samples that were not tested in the APA were tested for indirect tensile strength in
accordance with ASTM D 4123. The results are shown in table 10.
Table 9 (Cont.). Maximum APA Dry Rut Depths
State Site Route Cure Sample LTPP Bind Test Rut Depth(min) 85th percentile (mm)
VT 5 Rt-2 0 1 42.3 42 7.25VT 5 Rt-2 0 4 42.3 42 7.50VT 5 Rt-2 30 2 42.3 42 8.82VT 5 Rt-2 30 8 42.3 42 8.55VT 5 Rt-2 60 5 42.3 42 8.80VT 5 Rt-2 60 9 42.3 42 7.35VT 5 Rt-2 120 6 42.3 42 10.26VT 5 Rt-2 120 7 42.3 42 8.87IA 6 K-42 0 3 48.6 46 5.04IA 6 K-42 0 4 48.6 46 4.56IA 6 K-42 30 6 48.6 46 8.47IA 6 K-42 30 9 48.6 46 7.69IA 6 K-42 60 8 48.6 46 6.91IA 6 K-42 60 10 48.6 46 8.09IA 6 K-42 120 5 48.6 46 7.41IA 6 K-42 120 7 48.6 46 N/TAZ 7 N/A 0 3 59.8 52 5.91AZ 7 N/A 0 4 59.8 52 6.56AZ 7 N/A 30 2 59.8 52 5.96AZ 7 N/A 30 8 59.8 52 4.87AZ 7 N/A 60 1 59.8 52 5.56AZ 7 N/A 60 7 59.8 52 5.55AZ 7 N/A 120 5 59.8 52 7.15AZ 7 N/A 120 6 59.8 52 7.45
N/A = Information not available. N/T = Not tested.
Temperature (C)
39
Table 10. Results from Indirect Tensile Strength Testing
State Site Route Cure Sample(min) (kPa) (psi)
KS 1 US-281 0 3 390.4 56.62KS 1 US-281 0 7 407.2 59.06KS 1 US-281 30 8 374.1 54.25KS 1 US-281 30 9 360.1 52.22KS 1 US-281 60 1 304.2 44.11KS 1 US-281 60 2 333.5 48.37KS 1 US-281 120 5 293.9 42.62KS 1 US-281 120 6 339.6 49.26KS 2 US-24 0 3 238.9 34.65KS 2 US-24 0 4 181.3 26.29KS 2 US-24 30 2 225.1 32.65KS 2 US-24 30 8 259.6 37.65KS 2 US-24 60 1 232.3 33.69KS 2 US-24 60 6 271.3 39.35KS 2 US-24 120 5 306.0 44.37KS 2 US-24 120 7 277.6 40.27NY 3 US-11 0 3 211.5 30.67NY 3 US-11 0 4 230.6 33.44NY 3 US-11 30 1 216.5 31.40NY 3 US-11 30 5 188.0 27.27NY 3 US-11 60 2 232.1 33.66NY 3 US-11 60 8 188.9 27.40NY 3 US-11 120 6 213.6 30.98NY 3 US-11 120 7 209.5 30.38SD 4 US-281 0 3 290.2 42.08SD 4 US-281 0 4 316.7 45.93SD 4 US-281 30 2 352.8 51.17SD 4 US-281 30 7 350.0 50.76SD 4 US-281 60 1 320.7 46.52SD 4 US-281 60 8 384.6 55.78SD 4 US-281 120 5 369.1 53.53SD 4 US-281 120 6 372.6 54.03
Indirect Tensile Strength
40
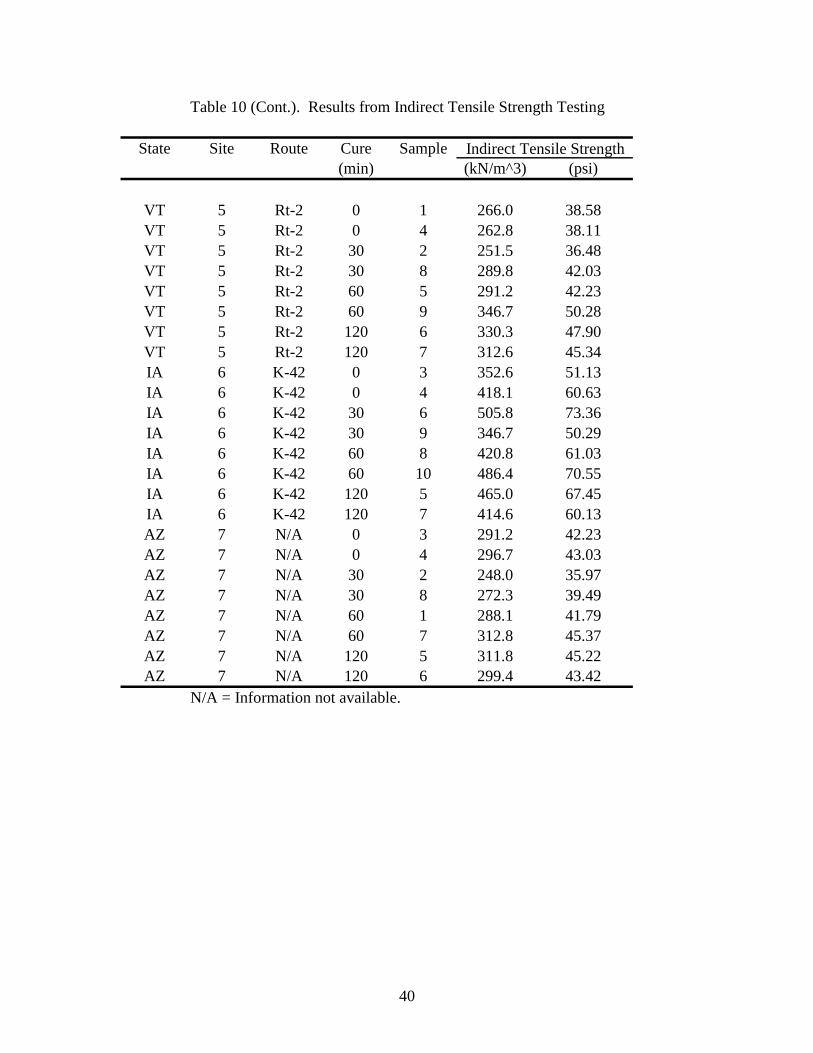
Table 10 (Cont.). Results from Indirect Tensile Strength Testing
State Site Route Cure Sample(min) (kN/m^3) (psi)
VT 5 Rt-2 0 1 266.0 38.58VT 5 Rt-2 0 4 262.8 38.11VT 5 Rt-2 30 2 251.5 36.48VT 5 Rt-2 30 8 289.8 42.03VT 5 Rt-2 60 5 291.2 42.23VT 5 Rt-2 60 9 346.7 50.28VT 5 Rt-2 120 6 330.3 47.90VT 5 Rt-2 120 7 312.6 45.34IA 6 K-42 0 3 352.6 51.13IA 6 K-42 0 4 418.1 60.63IA 6 K-42 30 6 505.8 73.36IA 6 K-42 30 9 346.7 50.29IA 6 K-42 60 8 420.8 61.03IA 6 K-42 60 10 486.4 70.55IA 6 K-42 120 5 465.0 67.45IA 6 K-42 120 7 414.6 60.13AZ 7 N/A 0 3 291.2 42.23AZ 7 N/A 0 4 296.7 43.03AZ 7 N/A 30 2 248.0 35.97AZ 7 N/A 30 8 272.3 39.49AZ 7 N/A 60 1 288.1 41.79AZ 7 N/A 60 7 312.8 45.37AZ 7 N/A 120 5 311.8 45.22AZ 7 N/A 120 6 299.4 43.42
N/A = Information not available.
Indirect Tensile Strength
41
Chapter 5
ANALYSIS OF TEST RESULTS
BULK SPECIFIC GRAVITY
The bulk specific gravity of all gyratory compacted samples was determined in
accordance with AASHTO T 166. In addition, some of the samples were tested for bulk
specific gravity using the CoreLokTM device in accordance with the manufacturer’s
recommendations.(12) The results were shown in table 8. AASHTO T 166 recommends
those samples that absorb more than two percent moisture be tested in accordance with
AASHTO T 275 using paraffin-coated specimens. Paraffin coating renders the sample
useless for further testing; therefore, other methods have been proposed, including the use
of parafilm, a shrink-wrap plastic, and the CoreLokTM device. Previous research by the
author indicated significantly different bulk specific gravity results for HMA mixtures
between AASHTO T 166 and parafilm wrapped samples when the air voids were above
eight percent, regardless of the percent absorption.(11)
To determine if the CoreLokTM device would yield significantly different bulk specific
gravity values from AASHTO T 166, some of the samples were tested for bulk specific
gravity using the CoreLokTM device and a paired t-test was performed. The results of the
paired t-test indicated no significant difference in the means at a confidence limit of 99
percent (α = 0.01). The absorption of the samples using AASHTO T 166 was generally
less than two percent, even though the air voids were above eight percent. The SGC
generally produces a sample with smooth sides, reducing the absorption, regardless of air
void content.
CURE TIME VERSUS COMPACTED DENSITY
There are several mix design methods for cold mixes and all are slightly different.(2) One
of the major differences between the methods involves the initial cure time between
mixing and compaction. In the field, the mix is usually placed and compacted when only
42
the material on the outside of the windrow has broken, the material on the inside of the
windrow has not broken. Most methods require that the mix break before compacting,
while others recommend compacting samples immediately. One of the objectives of this
study was to evaluate the effect of this initial curing on the mix design compactive effort
(Ndesign).
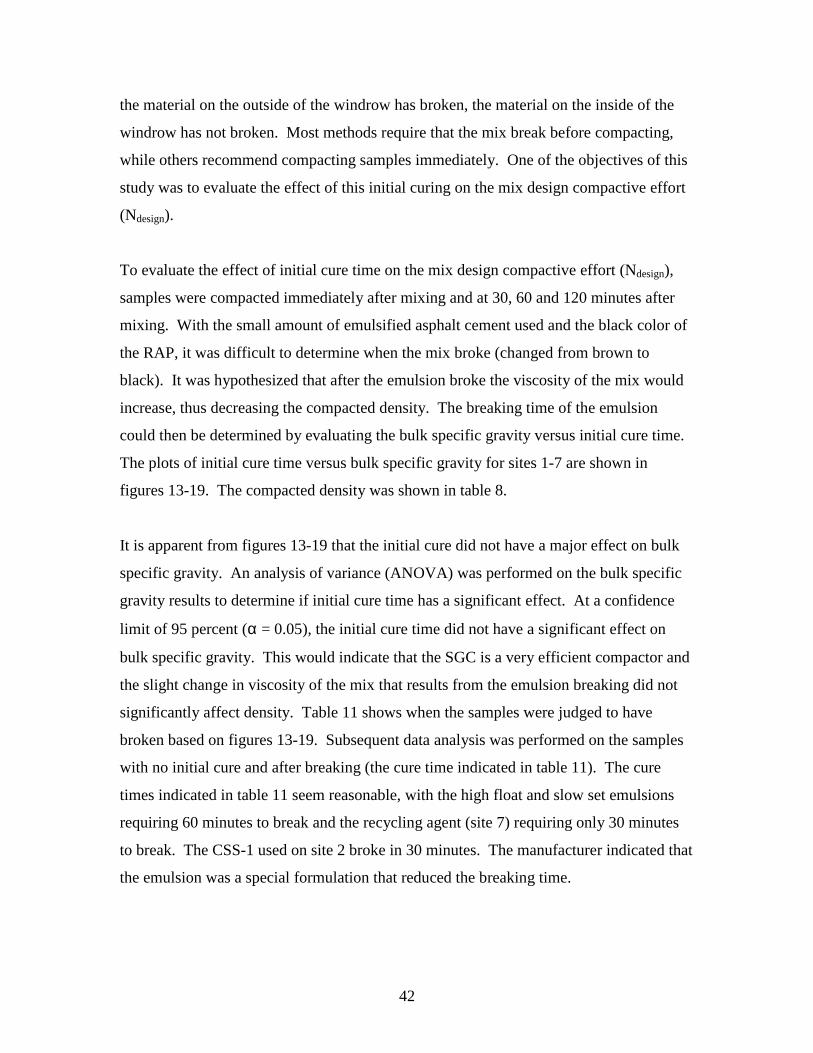
To evaluate the effect of initial cure time on the mix design compactive effort (Ndesign),
samples were compacted immediately after mixing and at 30, 60 and 120 minutes after
mixing. With the small amount of emulsified asphalt cement used and the black color of
the RAP, it was difficult to determine when the mix broke (changed from brown to
black). It was hypothesized that after the emulsion broke the viscosity of the mix would
increase, thus decreasing the compacted density. The breaking time of the emulsion
could then be determined by evaluating the bulk specific gravity versus initial cure time.
The plots of initial cure time versus bulk specific gravity for sites 1-7 are shown in
figures 13-19. The compacted density was shown in table 8.
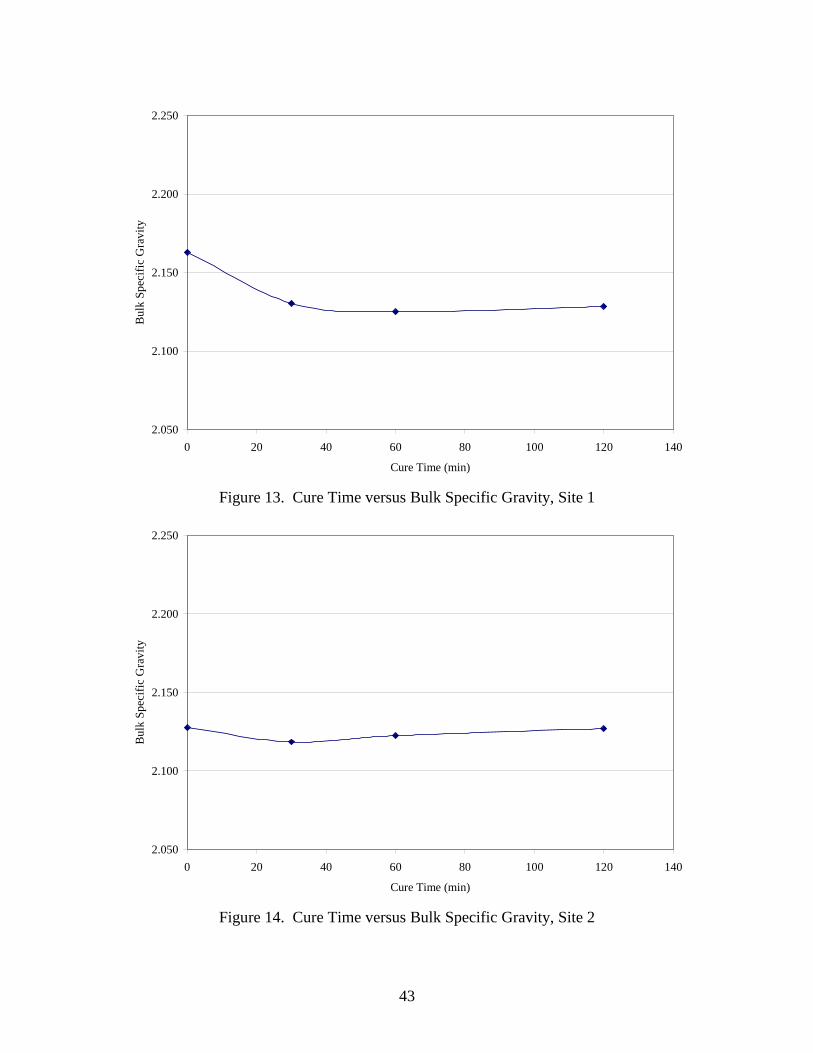
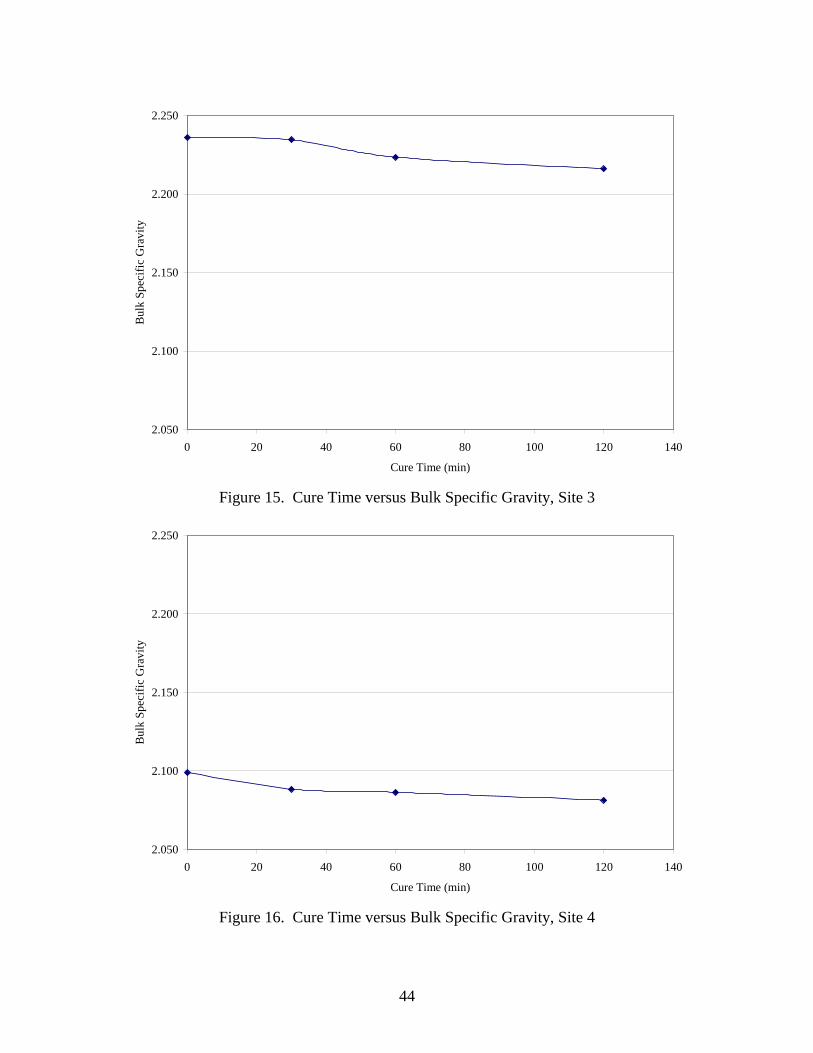
It is apparent from figures 13-19 that the initial cure did not have a major effect on bulk
specific gravity. An analysis of variance (ANOVA) was performed on the bulk specific
gravity results to determine if initial cure time has a significant effect. At a confidence
limit of 95 percent (α = 0.05), the initial cure time did not have a significant effect on
bulk specific gravity. This would indicate that the SGC is a very efficient compactor and
the slight change in viscosity of the mix that results from the emulsion breaking did not
significantly affect density. Table 11 shows when the samples were judged to have
broken based on figures 13-19. Subsequent data analysis was performed on the samples
with no initial cure and after breaking (the cure time indicated in table 11). The cure
times indicated in table 11 seem reasonable, with the high float and slow set emulsions
requiring 60 minutes to break and the recycling agent (site 7) requiring only 30 minutes
to break. The CSS-1 used on site 2 broke in 30 minutes. The manufacturer indicated that
the emulsion was a special formulation that reduced the breaking time.
43
Figure 13. Cure Time versus Bulk Specific Gravity, Site 1
Figure 14. Cure Time versus Bulk Specific Gravity, Site 2
2.050
2.100
2.150
2.200
2.250
0 20 40 60 80 100 120 140
Cure Time (min)
Bul
k Sp
ecifi
c G
ravi
ty
2.050
2.100
2.150
2.200
2.250
0 20 40 60 80 100 120 140
Cure Time (min)
Bul
k Sp
ecifi
c G
ravi
ty
44
Figure 15. Cure Time versus Bulk Specific Gravity, Site 3
Figure 16. Cure Time versus Bulk Specific Gravity, Site 4
2.050
2.100
2.150
2.200
2.250
0 20 40 60 80 100 120 140
Cure Time (min)
Bul
k Sp
ecifi
c G
ravi
ty
2.050
2.100
2.150
2.200
2.250
0 20 40 60 80 100 120 140
Cure Time (min)
Bul
k Sp
ecifi
c G
ravi
ty

45
Figure 17. Cure Time versus Bulk Specific Gravity, Site 5
Figure 18. Cure Time versus Bulk Specific Gravity, Site 6
2.050
2.100
2.150
2.200
2.250
0 20 40 60 80 100 120 140
Cure Time (min)
Bul
k Sp
ecifi
c G
ravi
ty
2.050
2.100
2.150
2.200
2.250
0 20 40 60 80 100 120 140
Cure Time (min)
Bul
k Sp
ecifi
c G
ravi
ty
46
Figure 19. Cure Time versus Bulk Specific Gravity, Site 7
2.050
2.100
2.150
2.200
2.250
0 20 40 60 80 100 120 140
Cure Time (min)
Bul
k Sp
ecifi
c G
ravi
ty
Table 11. Initial Cure Time Required for Breaking
CureSite State Route Emulsion Time
(min)
1 KS US-283 CSS-1 602 KS US-24 CSS-1 303 NY US-11 HFMS-2 604 SD US-281 AE200S 605 VT Rt-2 HFMS-2 606 IA K-42 HFE-300 307 AZ N/A Cyclogene HE 30
N/A = Not available.
47
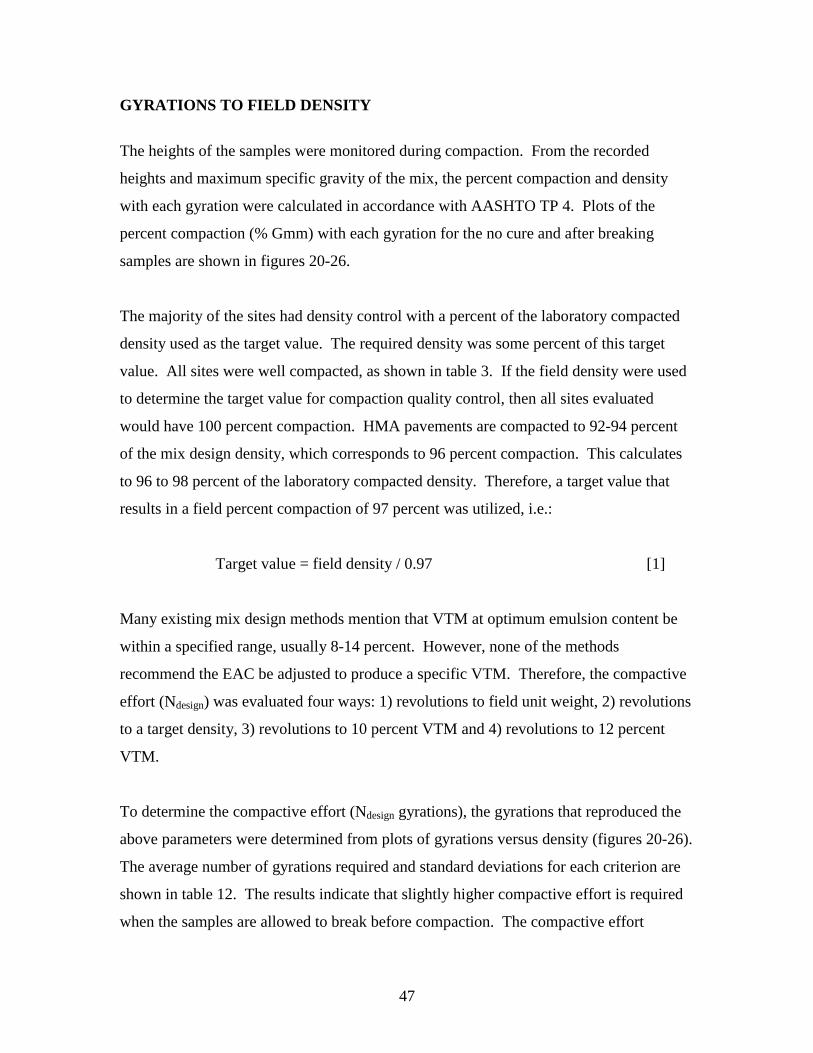
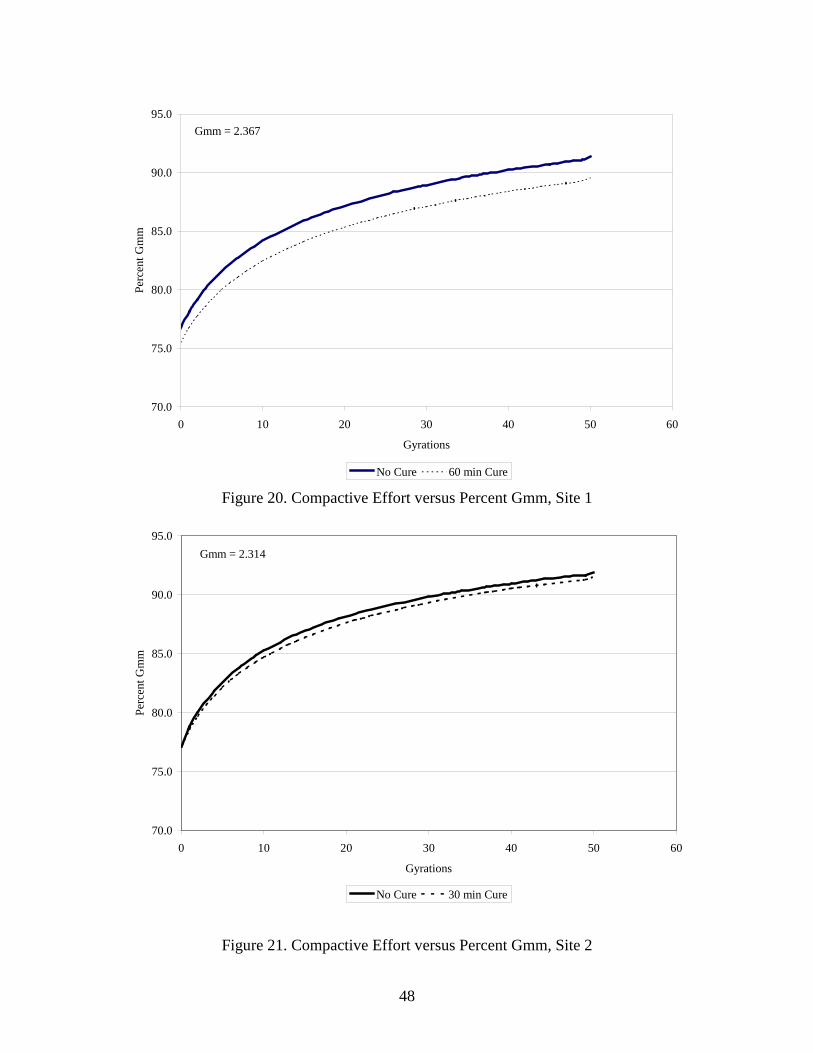
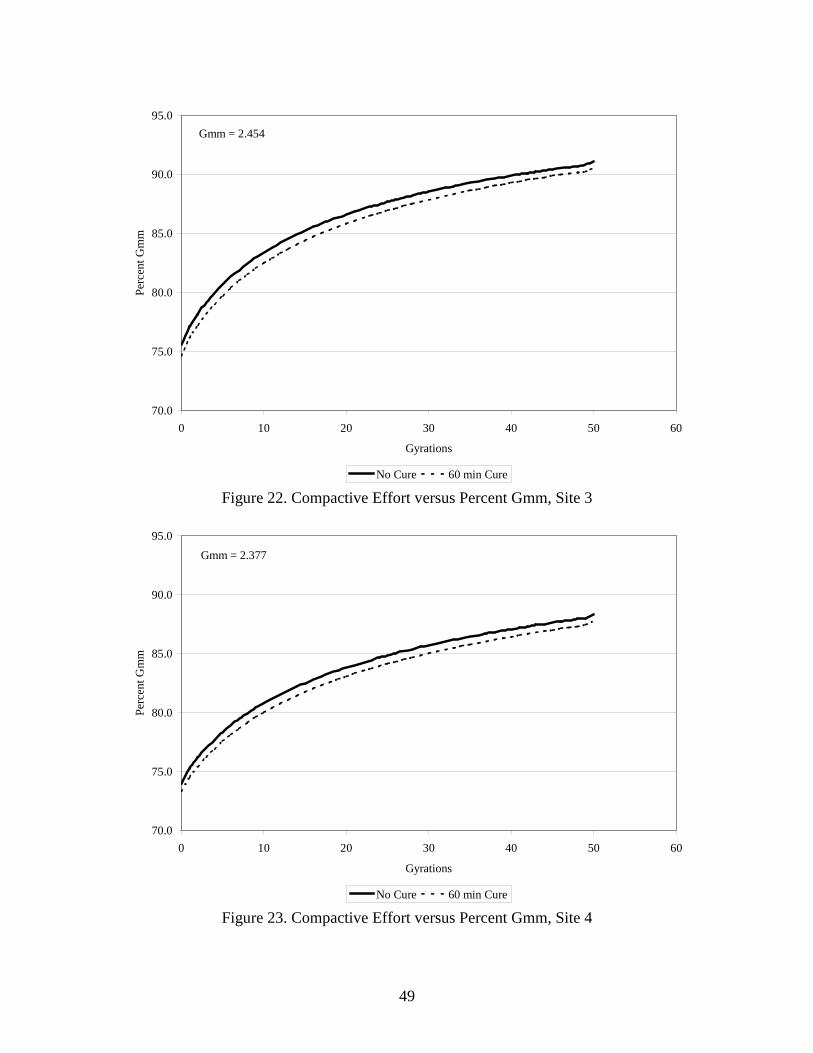
GYRATIONS TO FIELD DENSITY
The heights of the samples were monitored during compaction. From the recorded
heights and maximum specific gravity of the mix, the percent compaction and density
with each gyration were calculated in accordance with AASHTO TP 4. Plots of the
percent compaction (% Gmm) with each gyration for the no cure and after breaking
samples are shown in figures 20-26.
The majority of the sites had density control with a percent of the laboratory compacted
density used as the target value. The required density was some percent of this target
value. All sites were well compacted, as shown in table 3. If the field density were used
to determine the target value for compaction quality control, then all sites evaluated
would have 100 percent compaction. HMA pavements are compacted to 92-94 percent
of the mix design density, which corresponds to 96 percent compaction. This calculates
to 96 to 98 percent of the laboratory compacted density. Therefore, a target value that
results in a field percent compaction of 97 percent was utilized, i.e.:
Target value = field density / 0.97 [1]
Many existing mix design methods mention that VTM at optimum emulsion content be
within a specified range, usually 8-14 percent. However, none of the methods
recommend the EAC be adjusted to produce a specific VTM. Therefore, the compactive
effort (Ndesign) was evaluated four ways: 1) revolutions to field unit weight, 2) revolutions
to a target density, 3) revolutions to 10 percent VTM and 4) revolutions to 12 percent
VTM.
To determine the compactive effort (Ndesign gyrations), the gyrations that reproduced the
above parameters were determined from plots of gyrations versus density (figures 20-26).
The average number of gyrations required and standard deviations for each criterion are
shown in table 12. The results indicate that slightly higher compactive effort is required
when the samples are allowed to break before compaction. The compactive effort
48
Figure 20. Compactive Effort versus Percent Gmm, Site 1
Figure 21. Compactive Effort versus Percent Gmm, Site 2
70.0
75.0
80.0
85.0
90.0
95.0
0 10 20 30 40 50 60
Gyrations
Perc
ent G
mm
No Cure 60 min Cure
Gmm = 2.367
70.0
75.0
80.0
85.0
90.0
95.0
0 10 20 30 40 50 60
Gyrations
Perc
ent G
mm
No Cure 30 min Cure
Gmm = 2.314
49
Figure 22. Compactive Effort versus Percent Gmm, Site 3
Figure 23. Compactive Effort versus Percent Gmm, Site 4
70.0
75.0
80.0
85.0
90.0
95.0
0 10 20 30 40 50 60
Gyrations
Perc
ent G
mm
No Cure 60 min Cure
Gmm = 2.454
70.0
75.0
80.0
85.0
90.0
95.0
0 10 20 30 40 50 60
Gyrations
Perc
ent G
mm
No Cure 60 min Cure
Gmm = 2.377
50
Figure 24. Compactive Effort versus Percent Gmm, Site 5
Figure 25. Compactive Effort versus Percent Gmm, Site 6
70.0
75.0
80.0
85.0
90.0
95.0
0 10 20 30 40 50 60
Gyrations
Perc
ent G
mm
No Cure 60 min Cure
Gmm = 2.385
70.0
75.0
80.0
85.0
90.0
95.0
0 10 20 30 40 50 60
Gyrations
Perc
ent G
mm
No Cure 30 min Cure
Gmm = 2.374
51
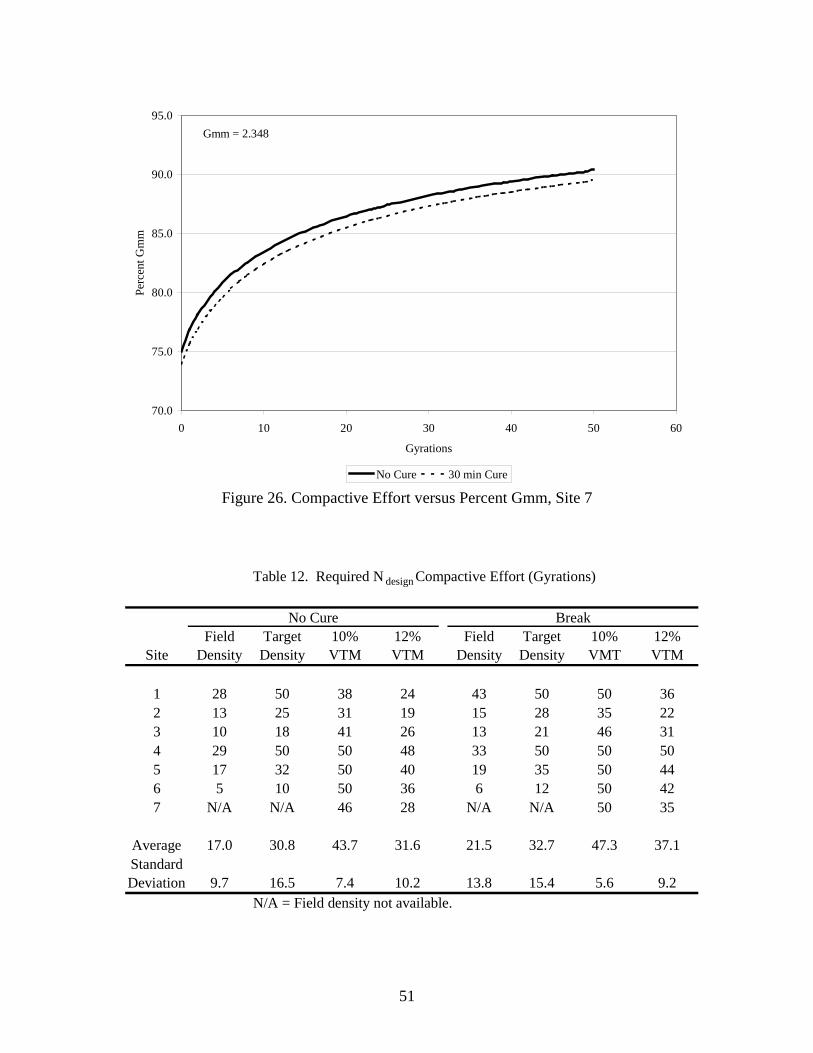
Figure 26. Compactive Effort versus Percent Gmm, Site 7
70.0
75.0
80.0
85.0
90.0
95.0
0 10 20 30 40 50 60
Gyrations
Perc
ent G
mm
No Cure 30 min Cure
Gmm = 2.348
Table 12. Required N design Compactive Effort (Gyrations)
Field Target 10% 12% Field Target 10% 12%Site Density Density VTM VTM Density Density VMT VTM
1 28 50 38 24 43 50 50 362 13 25 31 19 15 28 35 223 10 18 41 26 13 21 46 314 29 50 50 48 33 50 50 505 17 32 50 40 19 35 50 446 5 10 50 36 6 12 50 427 N/A N/A 46 28 N/A N/A 50 35
Average 17.0 30.8 43.7 31.6 21.5 32.7 47.3 37.1StandardDeviation 9.7 16.5 7.4 10.2 13.8 15.4 5.6 9.2
N/A = Field density not available.
No Cure Break
52
required to reproduce the target density and 12 percent VTM were similar, 31 and 32
gyrations, respectively, for the samples compacted without an initial cure, and 33 and 37
for the samples allowed to break. Therefore, it appears reasonable to use a Ndesign
compactive effort of 30 gyration for mix design samples that are compacted immediately
after mixing and 35 gyrations for samples compacted after breaking.
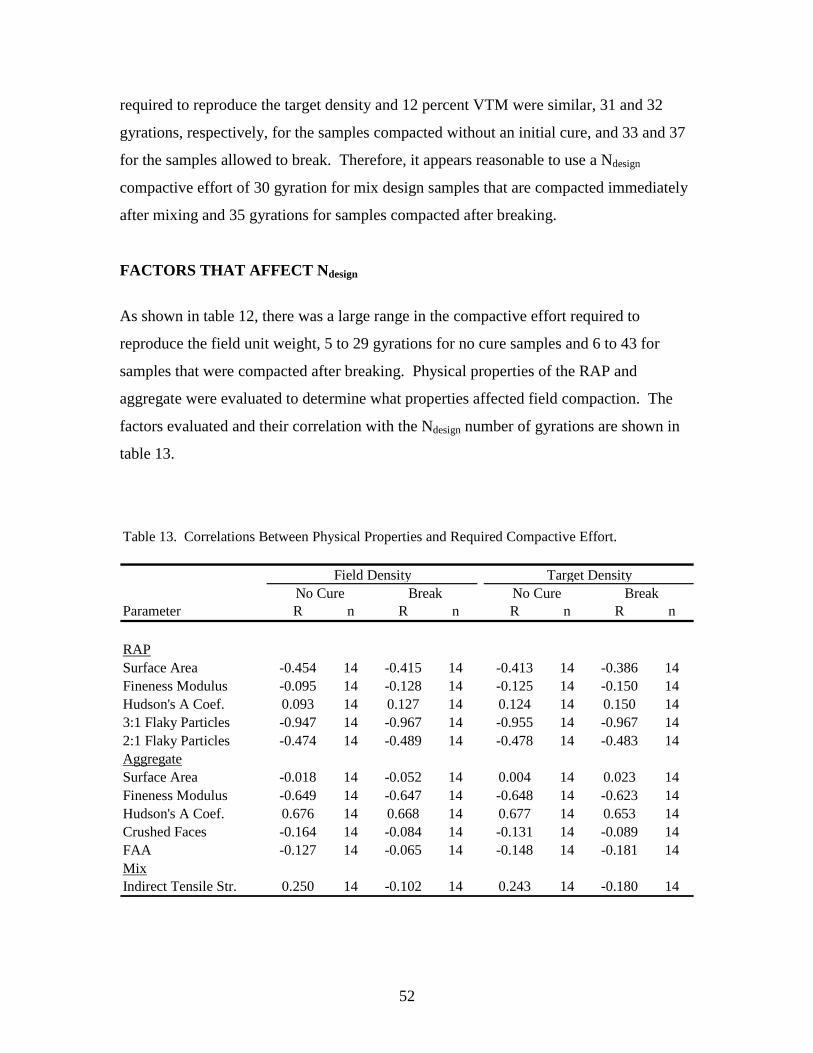
FACTORS THAT AFFECT Ndesign
As shown in table 12, there was a large range in the compactive effort required to
reproduce the field unit weight, 5 to 29 gyrations for no cure samples and 6 to 43 for
samples that were compacted after breaking. Physical properties of the RAP and
aggregate were evaluated to determine what properties affected field compaction. The
factors evaluated and their correlation with the Ndesign number of gyrations are shown in
table 13.
Table 13. Correlations Between Physical Properties and Required Compactive Effort.
Parameter R n R n R n R n
RAPSurface Area -0.454 14 -0.415 14 -0.413 14 -0.386 14Fineness Modulus -0.095 14 -0.128 14 -0.125 14 -0.150 14Hudson's A Coef. 0.093 14 0.127 14 0.124 14 0.150 143:1 Flaky Particles -0.947 14 -0.967 14 -0.955 14 -0.967 142:1 Flaky Particles -0.474 14 -0.489 14 -0.478 14 -0.483 14AggregateSurface Area -0.018 14 -0.052 14 0.004 14 0.023 14Fineness Modulus -0.649 14 -0.647 14 -0.648 14 -0.623 14Hudson's A Coef. 0.676 14 0.668 14 0.677 14 0.653 14Crushed Faces -0.164 14 -0.084 14 -0.131 14 -0.089 14FAA -0.127 14 -0.065 14 -0.148 14 -0.181 14MixIndirect Tensile Str. 0.250 14 -0.102 14 0.243 14 -0.180 14
Field DensityNo Cure Break
Target DensityNo Cure Break
53
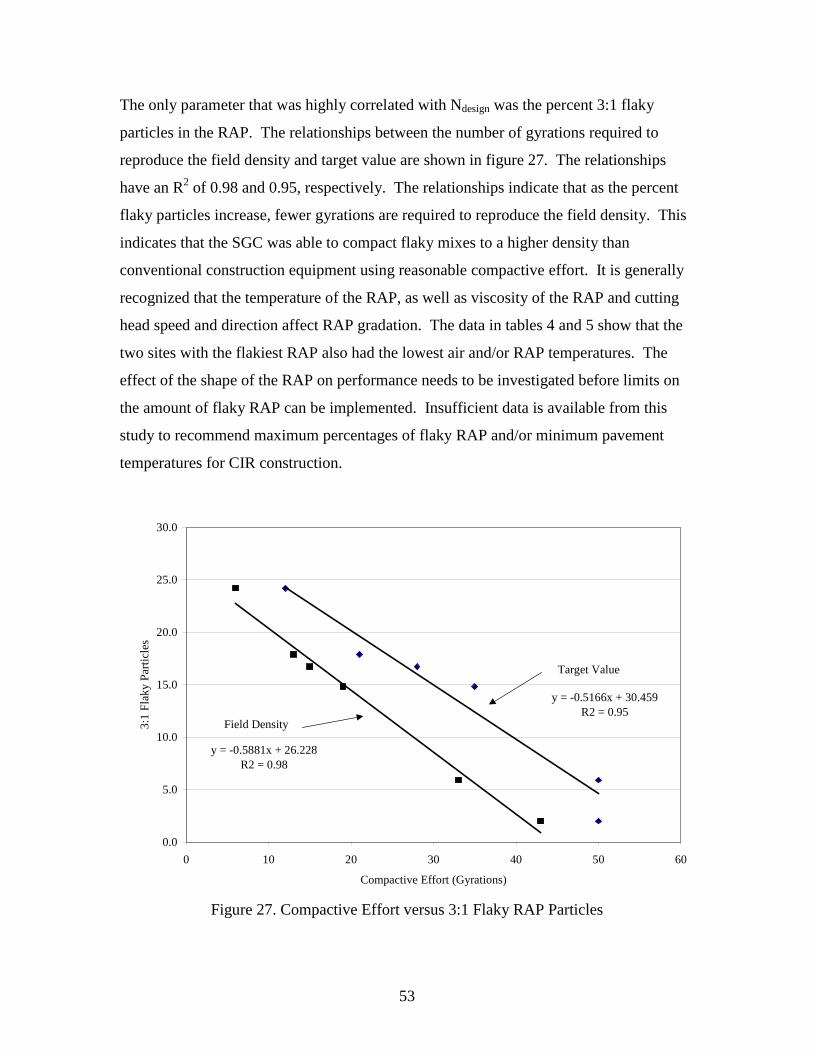
The only parameter that was highly correlated with Ndesign was the percent 3:1 flaky
particles in the RAP. The relationships between the number of gyrations required to
reproduce the field density and target value are shown in figure 27. The relationships
have an R2 of 0.98 and 0.95, respectively. The relationships indicate that as the percent
flaky particles increase, fewer gyrations are required to reproduce the field density. This
indicates that the SGC was able to compact flaky mixes to a higher density than
conventional construction equipment using reasonable compactive effort. It is generally
recognized that the temperature of the RAP, as well as viscosity of the RAP and cutting
head speed and direction affect RAP gradation. The data in tables 4 and 5 show that the
two sites with the flakiest RAP also had the lowest air and/or RAP temperatures. The
effect of the shape of the RAP on performance needs to be investigated before limits on
the amount of flaky RAP can be implemented. Insufficient data is available from this
study to recommend maximum percentages of flaky RAP and/or minimum pavement
temperatures for CIR construction.
Figure 27. Compactive Effort versus 3:1 Flaky RAP Particles
y = -0.5166x + 30.459R2 = 0.95
y = -0.5881x + 26.228R2 = 0.98
0.0
5.0
10.0
15.0
20.0
25.0
30.0
0 10 20 30 40 50 60
Compactive Effort (Gyrations)
3:1
Flak
y Pa
rticl
es
Field Density
Target Value
54
PERFORMANCE TESTING
The CIR mix samples compacted as a part of this study were tested for indirect tensile
strength and resistance to permanent deformation. The samples evaluated were
compacted to 50 gyrations, not the field density. Sufficient materials were not available
to fabricate additional samples to the field density.
Indirect Tensile Strength
Tensile strength has been related to mixture performance. The results of the indirect
tensile strengths were shown in table 10. The correlation between physical properties and
indirect tensile strength are shown in table 14. None of the properties evaluated were
highly correlated with indirect tensile strength. The initial cure time did not have a
significant effect on indirect tensile strength. From table 10, it is interesting to note that
the site with the largest percentage of 3:1 flaky coarse aggregate, site 6, also had the
highest indirect tensile strength.
Permanent Deformation
The resistance to permanent deformation was determined using the APA in the dry mode.
The samples were tested approximately one PG grade below the 85th percentile maximum
mix temperature for the layer determined using the LTTPBind version 2.1 software.(14)
The test temperature was dropped one PG grade to account for the presence of a surface
mix over the CIR layer.
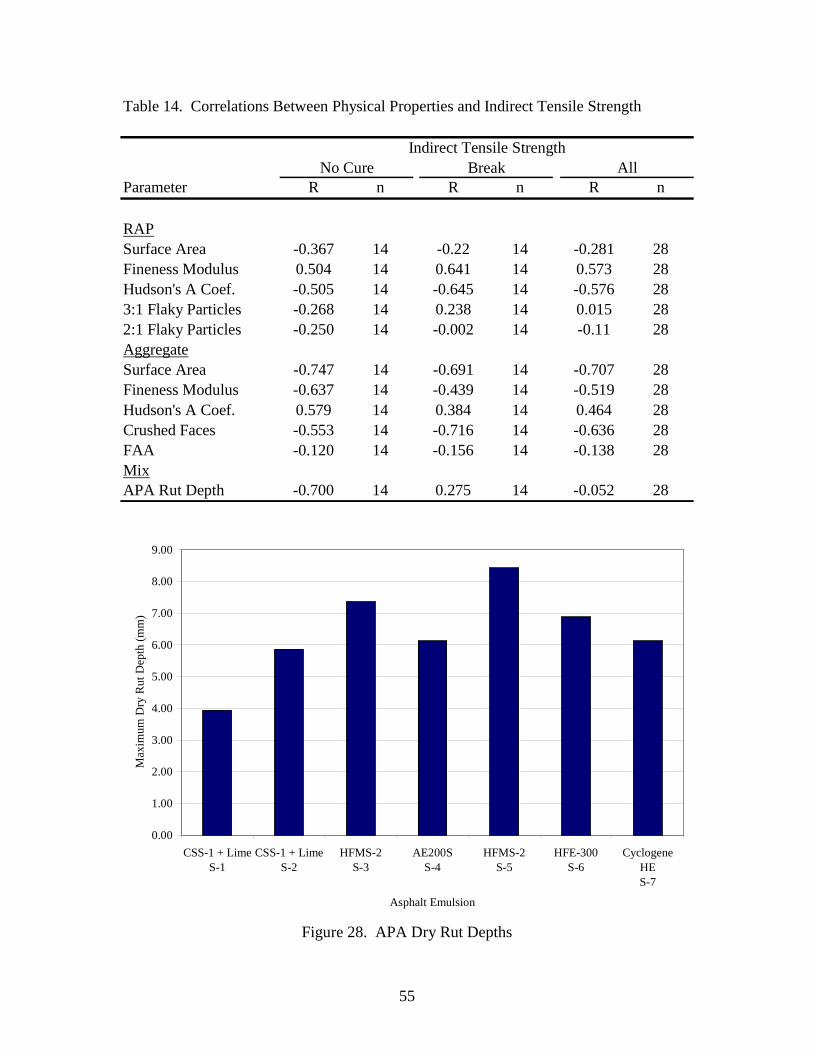
Figure 28 shows the average dry APA rut depths for the seven sites. The results indicate
higher APA rut depths for the mixes made with high float emulsions. High float
emulsions are typically made with softer base asphalts than slow set emulsions. The
mixtures with lime as an additive (site 1 and 2) showed some of the lowest rut depths.
55
Figure 28. APA Dry Rut Depths
0.00
1.00
2.00
3.00
4.00
5.00
6.00
7.00
8.00
9.00
CSS-1 + LimeS-1
CSS-1 + LimeS-2
HFMS-2S-3
AE200SS-4
HFMS-2S-5
HFE-300S-6
CyclogeneHES-7
Asphalt Emulsion
Max
imum
Dry
Rut
Dep
th (m
m)
Table 14. Correlations Between Physical Properties and Indirect Tensile Strength
Parameter R n R n R n
RAPSurface Area -0.367 14 -0.22 14 -0.281 28Fineness Modulus 0.504 14 0.641 14 0.573 28Hudson's A Coef. -0.505 14 -0.645 14 -0.576 283:1 Flaky Particles -0.268 14 0.238 14 0.015 282:1 Flaky Particles -0.250 14 -0.002 14 -0.11 28AggregateSurface Area -0.747 14 -0.691 14 -0.707 28Fineness Modulus -0.637 14 -0.439 14 -0.519 28Hudson's A Coef. 0.579 14 0.384 14 0.464 28Crushed Faces -0.553 14 -0.716 14 -0.636 28FAA -0.120 14 -0.156 14 -0.138 28MixAPA Rut Depth -0.700 14 0.275 14 -0.052 28
Indirect Tensile StrengthAllNo Cure Break
56
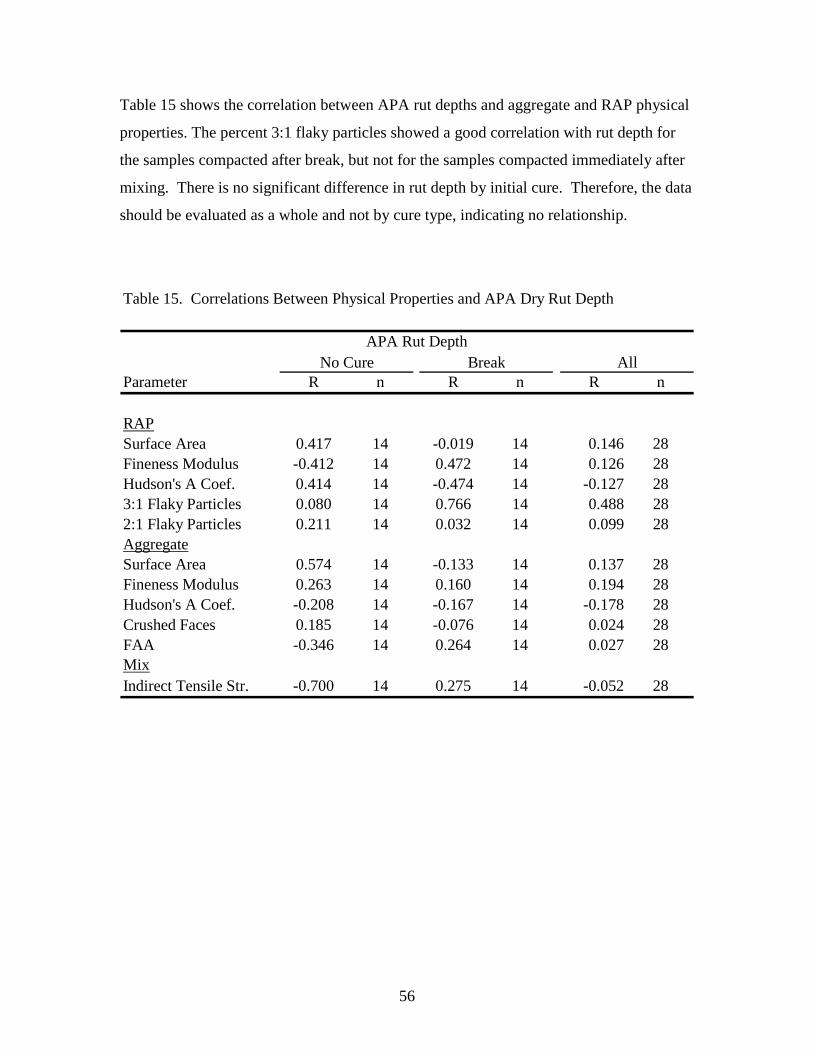
Table 15 shows the correlation between APA rut depths and aggregate and RAP physical
properties. The percent 3:1 flaky particles showed a good correlation with rut depth for
the samples compacted after break, but not for the samples compacted immediately after
mixing. There is no significant difference in rut depth by initial cure. Therefore, the data
should be evaluated as a whole and not by cure type, indicating no relationship.
Table 15. Correlations Between Physical Properties and APA Dry Rut Depth
Parameter R n R n R n
RAPSurface Area 0.417 14 -0.019 14 0.146 28Fineness Modulus -0.412 14 0.472 14 0.126 28Hudson's A Coef. 0.414 14 -0.474 14 -0.127 283:1 Flaky Particles 0.080 14 0.766 14 0.488 282:1 Flaky Particles 0.211 14 0.032 14 0.099 28AggregateSurface Area 0.574 14 -0.133 14 0.137 28Fineness Modulus 0.263 14 0.160 14 0.194 28Hudson's A Coef. -0.208 14 -0.167 14 -0.178 28Crushed Faces 0.185 14 -0.076 14 0.024 28FAA -0.346 14 0.264 14 0.027 28MixIndirect Tensile Str. -0.700 14 0.275 14 -0.052 28
AllAPA Rut Depth
No Cure Break
57
Chapter 6
CONCLUSIONS AND RECOMMENDATIONS
CONCLUSIONS
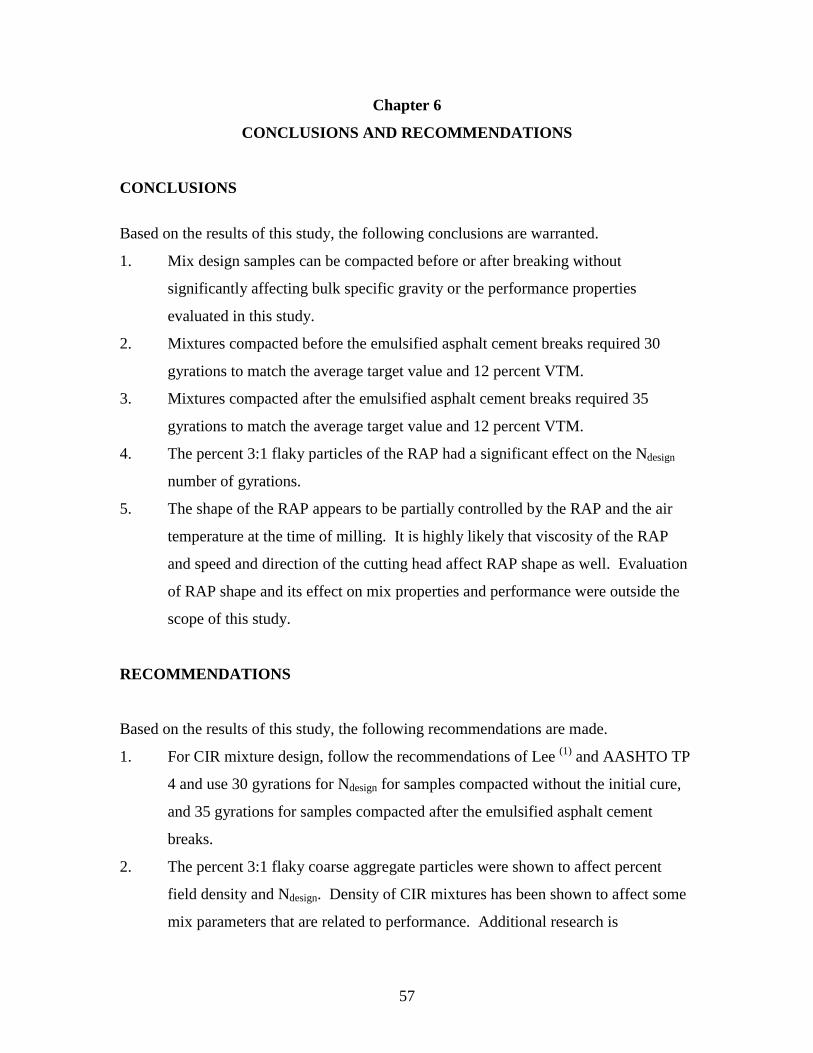
Based on the results of this study, the following conclusions are warranted.
1. Mix design samples can be compacted before or after breaking without
significantly affecting bulk specific gravity or the performance properties
evaluated in this study.
2. Mixtures compacted before the emulsified asphalt cement breaks required 30
gyrations to match the average target value and 12 percent VTM.
3. Mixtures compacted after the emulsified asphalt cement breaks required 35
gyrations to match the average target value and 12 percent VTM.
4. The percent 3:1 flaky particles of the RAP had a significant effect on the Ndesign
number of gyrations.
5. The shape of the RAP appears to be partially controlled by the RAP and the air
temperature at the time of milling. It is highly likely that viscosity of the RAP
and speed and direction of the cutting head affect RAP shape as well. Evaluation
of RAP shape and its effect on mix properties and performance were outside the
scope of this study.
RECOMMENDATIONS
Based on the results of this study, the following recommendations are made.
1. For CIR mixture design, follow the recommendations of Lee (1) and AASHTO TP
4 and use 30 gyrations for Ndesign for samples compacted without the initial cure,
and 35 gyrations for samples compacted after the emulsified asphalt cement
breaks.
2. The percent 3:1 flaky coarse aggregate particles were shown to affect percent
field density and Ndesign. Density of CIR mixtures has been shown to affect some
mix parameters that are related to performance. Additional research is

58
recommended to determine the factors that affect coarse RAP shape and the effect
of coarse RAP shape on CIR mixture performance. If RAP shape is shown to
have a significant detrimental effect on mixture performance, limits on the percent
3:1 flaky coarse RAP particles should be considered.

59
APPENDIX – COMPACTION DATA
60
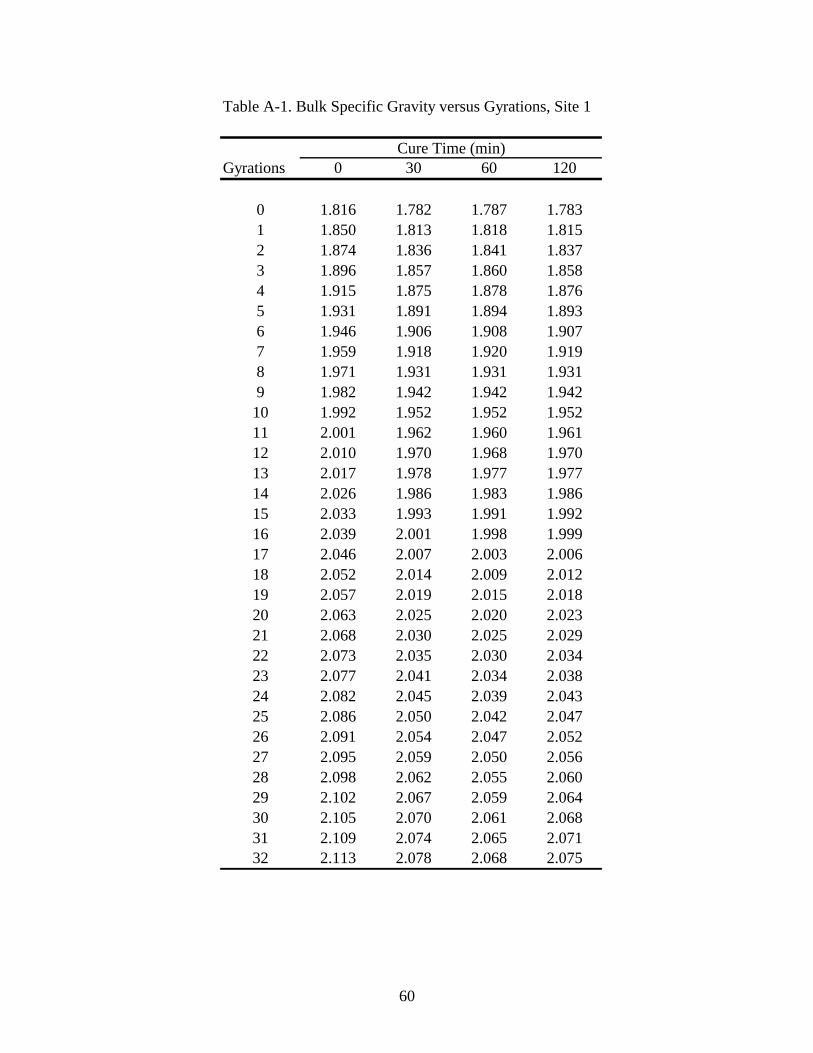
Table A-1. Bulk Specific Gravity versus Gyrations, Site 1
Gyrations 0 30 60 120
0 1.816 1.782 1.787 1.7831 1.850 1.813 1.818 1.8152 1.874 1.836 1.841 1.8373 1.896 1.857 1.860 1.8584 1.915 1.875 1.878 1.8765 1.931 1.891 1.894 1.8936 1.946 1.906 1.908 1.9077 1.959 1.918 1.920 1.9198 1.971 1.931 1.931 1.9319 1.982 1.942 1.942 1.94210 1.992 1.952 1.952 1.95211 2.001 1.962 1.960 1.96112 2.010 1.970 1.968 1.97013 2.017 1.978 1.977 1.97714 2.026 1.986 1.983 1.98615 2.033 1.993 1.991 1.99216 2.039 2.001 1.998 1.99917 2.046 2.007 2.003 2.00618 2.052 2.014 2.009 2.01219 2.057 2.019 2.015 2.01820 2.063 2.025 2.020 2.02321 2.068 2.030 2.025 2.02922 2.073 2.035 2.030 2.03423 2.077 2.041 2.034 2.03824 2.082 2.045 2.039 2.04325 2.086 2.050 2.042 2.04726 2.091 2.054 2.047 2.05227 2.095 2.059 2.050 2.05628 2.098 2.062 2.055 2.06029 2.102 2.067 2.059 2.06430 2.105 2.070 2.061 2.06831 2.109 2.074 2.065 2.07132 2.113 2.078 2.068 2.075
Cure Time (min)
61
Table A-1 (Con't.). Bulk Specific Gravity versus Gyrations, Site 1
Gyrations 0 30 60 120
33 2.115 2.081 2.072 2.07934 2.118 2.084 2.076 2.08135 2.122 2.087 2.078 2.08436 2.124 2.091 2.081 2.08837 2.128 2.093 2.084 2.09238 2.130 2.096 2.087 2.09439 2.133 2.099 2.089 2.09740 2.136 2.102 2.092 2.09941 2.138 2.105 2.095 2.10342 2.140 2.108 2.097 2.10543 2.142 2.109 2.099 2.10744 2.144 2.113 2.103 2.11045 2.147 2.115 2.104 2.11246 2.149 2.117 2.106 2.11447 2.152 2.120 2.108 2.11748 2.154 2.123 2.110 2.12049 2.156 2.125 2.114 2.12250 2.163 2.130 2.120 2.129
Cure Time (min)
62
Table A-2. Bulk Specific Gravity versus Gyrations, Site 2
Gyrations 0 30 60 120
0 1.785 1.783 1.788 1.7801 1.825 1.819 1.823 1.8172 1.852 1.846 1.849 1.8433 1.875 1.867 1.872 1.8664 1.894 1.885 1.890 1.8865 1.912 1.901 1.906 1.9036 1.927 1.916 1.921 1.9187 1.940 1.929 1.933 1.9318 1.952 1.940 1.944 1.9429 1.963 1.951 1.956 1.95310 1.973 1.961 1.965 1.96311 1.982 1.969 1.973 1.97312 1.990 1.977 1.981 1.98113 1.999 1.986 1.989 1.98914 2.005 1.992 1.996 1.99615 2.012 1.999 2.003 2.00316 2.019 2.005 2.009 2.00917 2.025 2.011 2.015 2.01618 2.031 2.018 2.021 2.02219 2.036 2.023 2.026 2.02720 2.041 2.028 2.032 2.03221 2.045 2.033 2.036 2.03722 2.051 2.037 2.040 2.04223 2.054 2.042 2.045 2.04724 2.058 2.046 2.049 2.05125 2.061 2.050 2.053 2.05526 2.065 2.053 2.057 2.05927 2.069 2.058 2.060 2.06328 2.073 2.061 2.063 2.06729 2.076 2.064 2.067 2.07030 2.080 2.068 2.070 2.07431 2.082 2.071 2.074 2.07732 2.086 2.074 2.076 2.07933 2.087 2.077 2.080 2.08334 2.091 2.080 2.082 2.08535 2.093 2.083 2.085 2.08936 2.096 2.085 2.088 2.092
Cure Time (min)
63
Table A-2 (Con't.). Bulk Specific Gravity versus Gyrations, Site 2
Gyrations 0 30 60 120
37 2.099 2.088 2.091 2.09438 2.101 2.090 2.093 2.09739 2.102 2.093 2.096 2.09940 2.104 2.096 2.097 2.10141 2.107 2.098 2.100 2.10542 2.110 2.099 2.102 2.10743 2.112 2.101 2.105 2.10944 2.114 2.103 2.107 2.11145 2.116 2.105 2.109 2.11246 2.118 2.107 2.111 2.11547 2.120 2.109 2.113 2.11748 2.121 2.111 2.115 2.11949 2.122 2.113 2.117 2.12150 2.128 2.119 2.122 2.127
Cure Time (min)
64
Table A-3. Bulk Specific Gravity versus Gyrations, Site 3
Gyrations 0 30 60 120
0 1.855 1.846 1.832 1.8171 1.892 1.883 1.870 1.8552 1.919 1.910 1.896 1.8823 1.943 1.933 1.919 1.9054 1.962 1.953 1.939 1.9265 1.980 1.971 1.957 1.9446 1.997 1.987 1.973 1.9607 2.010 2.002 1.988 1.9758 2.023 2.016 2.001 1.9889 2.036 2.028 2.014 2.00210 2.047 2.039 2.025 2.01211 2.058 2.050 2.035 2.02412 2.067 2.059 2.046 2.03413 2.076 2.068 2.054 2.04314 2.084 2.077 2.063 2.05215 2.092 2.085 2.072 2.06116 2.100 2.093 2.080 2.06817 2.106 2.100 2.087 2.07618 2.114 2.108 2.094 2.08319 2.120 2.113 2.100 2.09020 2.125 2.120 2.107 2.09621 2.131 2.126 2.113 2.10122 2.137 2.131 2.118 2.10923 2.143 2.136 2.124 2.11524 2.147 2.142 2.129 2.11825 2.152 2.146 2.135 2.12426 2.156 2.152 2.139 2.13027 2.161 2.156 2.144 2.13428 2.165 2.161 2.148 2.14029 2.170 2.165 2.152 2.14330 2.173 2.169 2.156 2.14731 2.177 2.173 2.160 2.15132 2.181 2.177 2.164 2.15533 2.184 2.181 2.168 2.15934 2.188 2.185 2.172 2.16335 2.191 2.187 2.176 2.16736 2.194 2.191 2.178 2.171
Cure Time (min)
65
Table A-3 (Con't.). Bulk Specific Gravity versus Gyrations, Site 3
Gyrations 0 30 60 120
37 2.198 2.194 2.182 2.17338 2.201 2.197 2.186 2.17739 2.204 2.200 2.188 2.18140 2.207 2.203 2.192 2.18341 2.210 2.206 2.194 2.18742 2.212 2.208 2.199 2.18943 2.215 2.212 2.201 2.19344 2.217 2.215 2.203 2.19545 2.220 2.217 2.207 2.19746 2.222 2.220 2.209 2.20247 2.224 2.222 2.211 2.20448 2.227 2.225 2.213 2.20649 2.230 2.227 2.215 2.20850 2.236 2.235 2.224 2.216
Cure Time (min)
66
Table A-4. Bulk Specific Gravity versus Gyrations, Site 4
Gyrations 0 30 60 120
0 1.759 1.732 1.743 1.7371 1.789 1.771 1.771 1.7642 1.811 1.792 1.793 1.7853 1.830 1.812 1.812 1.8034 1.846 1.829 1.828 1.8205 1.863 1.844 1.844 1.8356 1.876 1.858 1.857 1.8487 1.889 1.870 1.869 1.8618 1.901 1.883 1.881 1.8739 1.911 1.894 1.893 1.88410 1.921 1.904 1.902 1.89411 1.930 1.913 1.911 1.90312 1.938 1.921 1.920 1.91213 1.947 1.930 1.928 1.92014 1.954 1.938 1.936 1.92815 1.961 1.945 1.943 1.93616 1.968 1.953 1.951 1.94217 1.975 1.959 1.957 1.94918 1.981 1.965 1.963 1.95519 1.987 1.972 1.969 1.96220 1.992 1.977 1.974 1.96721 1.997 1.984 1.981 1.97322 2.003 1.989 1.986 1.97823 2.008 1.993 1.990 1.98324 2.013 1.998 1.996 1.98825 2.016 2.003 2.001 1.99326 2.022 2.007 2.004 1.99827 2.026 2.012 2.009 2.00228 2.030 2.016 2.013 2.00729 2.034 2.020 2.017 2.01030 2.038 2.024 2.021 2.01531 2.041 2.028 2.025 2.01932 2.045 2.032 2.028 2.02233 2.048 2.036 2.032 2.02634 2.051 2.039 2.036 2.02935 2.055 2.043 2.039 2.03336 2.058 2.044 2.042 2.036
Cure Time (min)
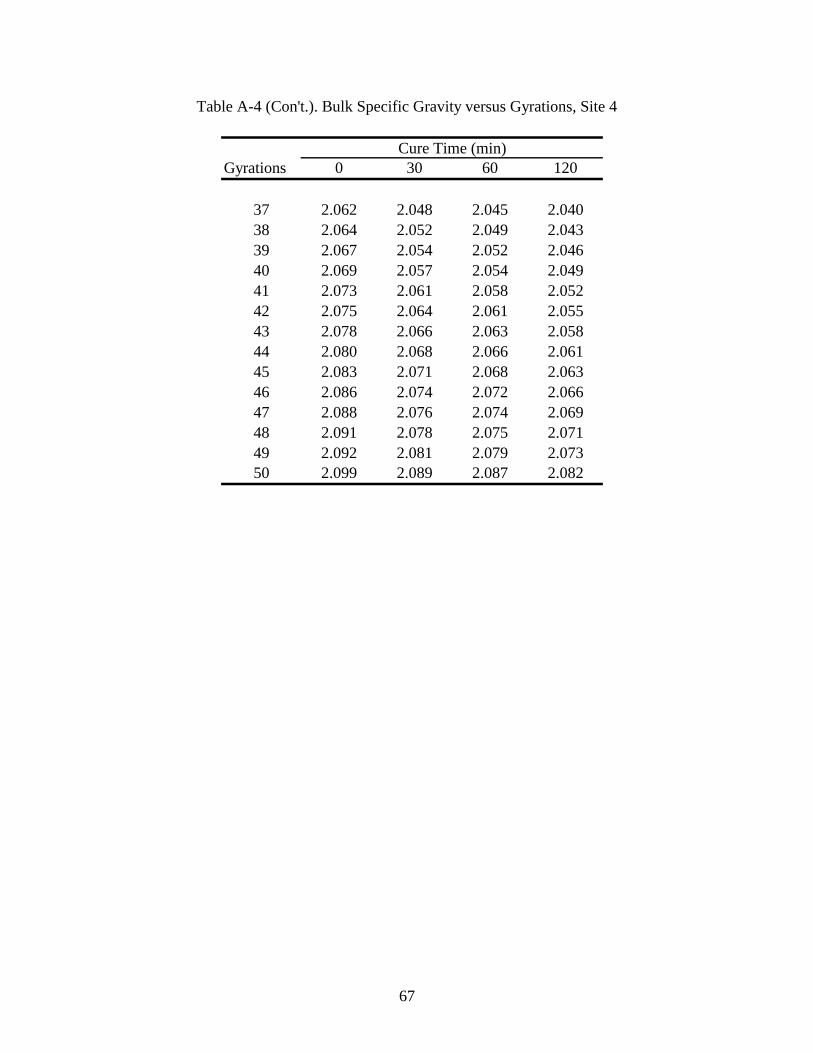
67
Table A-4 (Con't.). Bulk Specific Gravity versus Gyrations, Site 4
Gyrations 0 30 60 120
37 2.062 2.048 2.045 2.04038 2.064 2.052 2.049 2.04339 2.067 2.054 2.052 2.04640 2.069 2.057 2.054 2.04941 2.073 2.061 2.058 2.05242 2.075 2.064 2.061 2.05543 2.078 2.066 2.063 2.05844 2.080 2.068 2.066 2.06145 2.083 2.071 2.068 2.06346 2.086 2.074 2.072 2.06647 2.088 2.076 2.074 2.06948 2.091 2.078 2.075 2.07149 2.092 2.081 2.079 2.07350 2.099 2.089 2.087 2.082
Cure Time (min)

68
Table A-5. Bulk Specific Gravity versus Gyrations, Site 5
Gyrations 0 30 60 120
0 1.786 1.760 1.778 1.7741 1.822 1.796 1.814 1.8082 1.848 1.820 1.839 1.8323 1.868 1.841 1.860 1.8524 1.886 1.859 1.878 1.8705 1.902 1.875 1.895 1.8866 1.917 1.889 1.909 1.9007 1.929 1.901 1.921 1.9138 1.941 1.913 1.933 1.9249 1.951 1.923 1.943 1.93510 1.961 1.933 1.953 1.94411 1.969 1.942 1.962 1.95312 1.978 1.950 1.970 1.96113 1.985 1.958 1.978 1.96914 1.993 1.965 1.985 1.97715 2.001 1.972 1.992 1.98416 2.006 1.978 1.999 1.99017 2.013 1.984 2.004 1.99618 2.018 1.990 2.010 2.00319 2.024 1.995 2.016 2.00820 2.030 2.000 2.021 2.01321 2.034 2.006 2.026 2.01922 2.038 2.010 2.030 2.02223 2.044 2.015 2.035 2.02724 2.047 2.019 2.039 2.03225 2.051 2.024 2.042 2.03626 2.055 2.027 2.047 2.04027 2.059 2.031 2.051 2.04328 2.063 2.035 2.055 2.04829 2.066 2.038 2.058 2.05230 2.070 2.042 2.061 2.05431 2.074 2.045 2.065 2.05832 2.076 2.049 2.068 2.06133 2.079 2.052 2.070 2.06534 2.083 2.054 2.074 2.06835 2.085 2.058 2.076 2.07136 2.089 2.060 2.080 2.073
Cure Time (min)

69
Table A-5 (Con't.). Bulk Specific Gravity versus Gyrations, Site 5
Gyrations 0 30 60 120
37 2.091 2.063 2.082 2.07638 2.092 2.065 2.085 2.07939 2.096 2.069 2.087 2.08240 2.098 2.071 2.089 2.08541 2.100 2.073 2.093 2.08642 2.103 2.076 2.095 2.08943 2.105 2.078 2.096 2.09144 2.108 2.080 2.098 2.09445 2.110 2.082 2.101 2.09646 2.111 2.085 2.103 2.09947 2.114 2.088 2.105 2.10148 2.116 2.089 2.108 2.10249 2.118 2.091 2.110 2.10450 2.122 2.097 2.115 2.111
Cure Time (min)
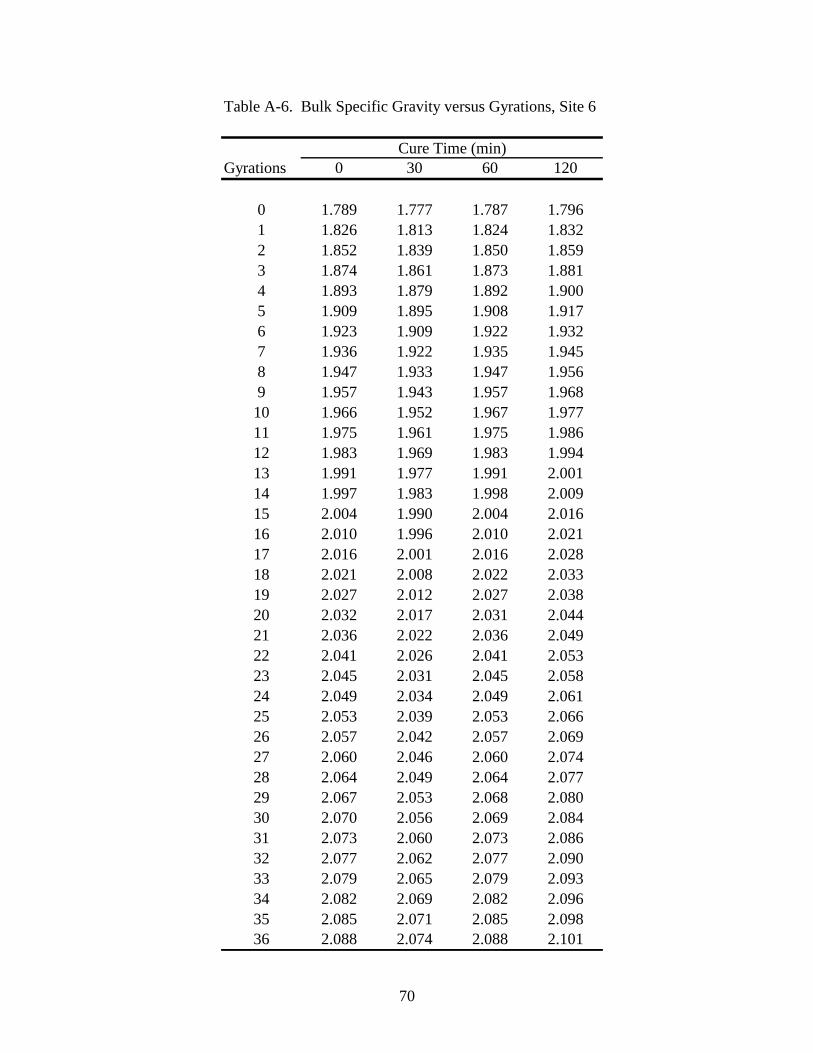
70
Table A-6. Bulk Specific Gravity versus Gyrations, Site 6
Gyrations 0 30 60 120
0 1.789 1.777 1.787 1.7961 1.826 1.813 1.824 1.8322 1.852 1.839 1.850 1.8593 1.874 1.861 1.873 1.8814 1.893 1.879 1.892 1.9005 1.909 1.895 1.908 1.9176 1.923 1.909 1.922 1.9327 1.936 1.922 1.935 1.9458 1.947 1.933 1.947 1.9569 1.957 1.943 1.957 1.96810 1.966 1.952 1.967 1.97711 1.975 1.961 1.975 1.98612 1.983 1.969 1.983 1.99413 1.991 1.977 1.991 2.00114 1.997 1.983 1.998 2.00915 2.004 1.990 2.004 2.01616 2.010 1.996 2.010 2.02117 2.016 2.001 2.016 2.02818 2.021 2.008 2.022 2.03319 2.027 2.012 2.027 2.03820 2.032 2.017 2.031 2.04421 2.036 2.022 2.036 2.04922 2.041 2.026 2.041 2.05323 2.045 2.031 2.045 2.05824 2.049 2.034 2.049 2.06125 2.053 2.039 2.053 2.06626 2.057 2.042 2.057 2.06927 2.060 2.046 2.060 2.07428 2.064 2.049 2.064 2.07729 2.067 2.053 2.068 2.08030 2.070 2.056 2.069 2.08431 2.073 2.060 2.073 2.08632 2.077 2.062 2.077 2.09033 2.079 2.065 2.079 2.09334 2.082 2.069 2.082 2.09635 2.085 2.071 2.085 2.09836 2.088 2.074 2.088 2.101
Cure Time (min)
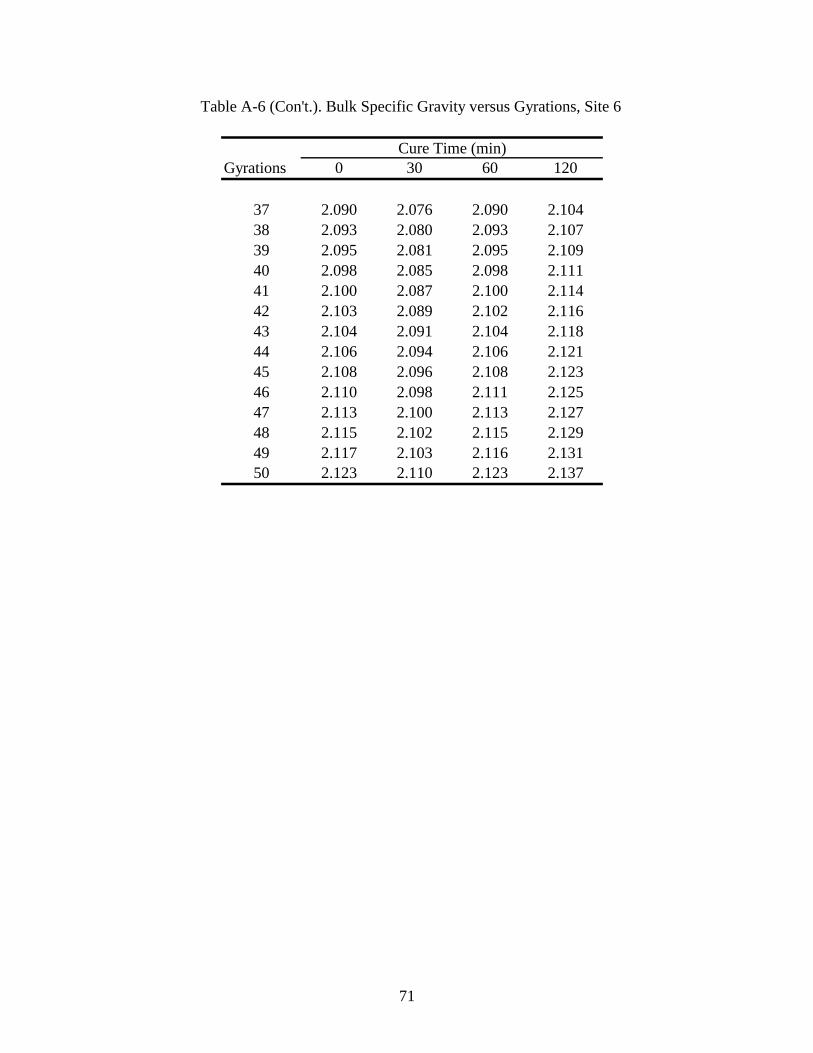
71
Table A-6 (Con't.). Bulk Specific Gravity versus Gyrations, Site 6
Gyrations 0 30 60 120
37 2.090 2.076 2.090 2.10438 2.093 2.080 2.093 2.10739 2.095 2.081 2.095 2.10940 2.098 2.085 2.098 2.11141 2.100 2.087 2.100 2.11442 2.103 2.089 2.102 2.11643 2.104 2.091 2.104 2.11844 2.106 2.094 2.106 2.12145 2.108 2.096 2.108 2.12346 2.110 2.098 2.111 2.12547 2.113 2.100 2.113 2.12748 2.115 2.102 2.115 2.12949 2.117 2.103 2.116 2.13150 2.123 2.110 2.123 2.137
Cure Time (min)

72
Table A-7. Bulk Specific Gravity versus Gyrations, Site 7
Gyrations 0 30 60 120
0 1.761 1.736 1.747 1.7571 1.805 1.777 1.788 1.7972 1.834 1.807 1.818 1.8253 1.859 1.831 1.842 1.8494 1.880 1.852 1.863 1.8705 1.898 1.870 1.881 1.8876 1.913 1.887 1.897 1.9027 1.926 1.901 1.910 1.9168 1.938 1.913 1.924 1.9299 1.949 1.925 1.935 1.94010 1.959 1.935 1.945 1.95011 1.969 1.945 1.955 1.96012 1.977 1.954 1.963 1.96813 1.986 1.962 1.971 1.97614 1.994 1.970 1.979 1.98415 2.001 1.976 1.986 1.99016 2.008 1.983 1.992 1.99717 2.013 1.990 1.999 2.00318 2.020 1.996 2.005 2.00919 2.025 2.002 2.011 2.01520 2.030 2.007 2.016 2.02021 2.035 2.013 2.020 2.02522 2.039 2.018 2.026 2.03023 2.044 2.023 2.031 2.03524 2.048 2.026 2.035 2.03925 2.053 2.031 2.039 2.04326 2.056 2.035 2.042 2.04727 2.060 2.040 2.048 2.05128 2.064 2.043 2.051 2.05429 2.067 2.047 2.055 2.05830 2.071 2.050 2.057 2.06231 2.075 2.054 2.061 2.06532 2.077 2.056 2.065 2.06833 2.080 2.060 2.066 2.07134 2.084 2.063 2.070 2.07435 2.086 2.065 2.074 2.07736 2.089 2.069 2.076 2.080
Cure Time (min)

73
Table A-7 (Con't.). Bulk Specific Gravity versus Gyrations, Site 7
Gyrations 0 30 60 120
37 2.092 2.071 2.078 2.08238 2.095 2.074 2.081 2.08539 2.097 2.076 2.084 2.08840 2.099 2.078 2.086 2.09041 2.101 2.082 2.089 2.09342 2.104 2.084 2.091 2.09543 2.107 2.085 2.093 2.09744 2.109 2.088 2.095 2.09945 2.111 2.090 2.098 2.10246 2.113 2.093 2.100 2.10447 2.114 2.095 2.103 2.10748 2.116 2.096 2.104 2.10849 2.118 2.098 2.106 2.11050 2.124 2.103 2.111 2.116
Cure Time (min)
75
REFERENCES
1. Lee, K.W. et al. “Laboratory Evaluation of Mix-Design Methods for Cold In-Place
Recycling.” Proceedings of the Fifth ASCE Materials Engineering Congress,
Lawrence C. Banks, Ed. American Society of Civil Engineers, Reston, Virginia, May
10-12, 1999, pp.756-769.
2. Task Force 38 Report on Cold Recycling of Asphalt Pavements. AASHTO-AGC-
ARTBA Joint Committee, American Association of State Highway and
Transportation Officials, Washington, D.C., March 1998.
3. Cross, S.A. “Experimental Cold In-Place Recycling with Hydrated Lime.”
Transportation Research Record No. 1684, Transportation Research Board, National
Research Council, Washington, D.C., January 1999.
4. Lauter K.A. and M. A. Corbett. “Developing Gyratory Compactor Guidelines for
Use with Cold In-Place Recycled Material. Proceedings, Canadian Technical
Asphalt Association, Polyscience Publications, Inc., Morin Heights, Quebec, Canada,
1998.
5. Mallick, R.B. et al. “Development of a Rational and Practical Mix Design Method for
Full Depth Reclamation.” Journal, The Association of Asphalt Pavement
Technologists, vol 70, 2001.
6. Mallick, R.B. et al. “Development of a Rational and Practical Mix Design Method for
Full Depth Reclamation.” International Conference on Beneficial Use of Recycled
Materials in Transportation Applications, Air & Waste Management Association,
Pittsburgh, PA 2002.
7. Cross, Stephen A. “Evaluation of Cold In-Place Recycled Mixtures on US-283.”
Report No. KS-99-4, Final Report, Kansas Department of Transportation, Topeka,
Kansas, August 2000.
8. Cross, Stephen A. and E.R. Brown. "Selection of Aggregate Properties to Minimize
Rutting of Heavy Duty Pavements." Effects of Aggregates and Mineral Fillers on
Asphalt Mixture Performance, ASTM STP 1147, Richard C. Meininger, Ed.,
American Society for Testing and Materials, Philadelphia, PA, 1992.
76
9. Mix Design Methods for Asphalt Concrete, MS-2, 6th edition. The Asphalt Institute,
Lexington Kentucky 1993.
10. Kansas Department of Transportation, Construction Manual, Kansas Department of
Transportation, Topeka, Kansas, 1991.
11. Cross, S.A. “Effect of Segregation on Hot Mix Asphalt Using the Asphalt Pavement
Analyzer.” Report No. K-TRAN: KU-98-2, Kansas Department of Transportation,
Topeka, Kansas, April 2000.
12. CoreLokTM Users Manual. Instro Tek, Inc. Raleigh, North Carolina, 2000.
13. Asphalt Pavement Analyzer Users Manual. Pavement Technology, Inc. Covington,
Georgia, 1997.
14. LTPPBIND, version 2.1. Turner-Fairbank Highway Research Center, Federal
Highway Administration, McLean, Virginia, July 1999.