Embed Size (px)
Citation preview
ORIGINAL PAPER - PRODUCTION GEOLOGY
Determination of minimum and maximum stress profiles usingwellbore failure evidences: a case study—a deep oil wellin the southwest of Iran
Abdollah Molaghab1 • Mohammad Hossein Taherynia2 •
Seyed Mahmoud Fatemi Aghda2 • Ahmad Fahimifar3
Received: 20 May 2016 / Accepted: 5 January 2017 / Published online: 24 January 2017
� The Author(s) 2017. This article is published with open access at Springerlink.com
Abstract The main objective of this paper is estimating
the horizontal stresses and calibration of the log-derived
horizontal stress profiles in deep oil wells according to their
wall failure evidences, including both compressive
(breakouts) and tensile failures (drilling-induced tensile
fractures). Estimation of the horizontal stress profiles using
well logs is one of the standard methods in the oil industry.
Another method for estimating horizontal stresses is ana-
lyzing failure evidences in the wellbore wall. By integrat-
ing these two methods, a practical strategy was followed in
this research to determine the horizontal stress profiles. By
this strategy, minimum and maximum horizontal stress
profiles are determined in such a way that the stress con-
centration at the wellbore wall at the tensile fracture
identified depths, exceeds the formation tensile strength,
while at the breakouts identified depths it exceeds the
compressive strength of the formation. An advantage of
this procedure is that does not require to measure in situ
stresses. Also, due to the presence of a large number of
breakouts and the induced fractures detected in different
zones of a deep wellbore, log-derived stress profile cali-
bration is done using the stress state in different zones that
causes to increase the accuracy and reliability of the
obtained horizontal stress profile. The proposed solution
was applied to determine the horizontal stress profiles in a
deep oil well in the southwest of Iran as a real case.
Keywords Stress profile � Wellbore failure � Well logs �Formation strength � Tectonic strains
Introduction
Orientation and magnitude of principal stresses in hydrocar-
bon fields in are considered as a very important information in
Petroleum Engineering. The stress state in the earth’s crust
controls stress concentration around a wellbore and therefore
plays a critical role in wellbore instability, well stimulation
operations, fluid flow in fractured reservoirs, and sand pro-
duction (Bell 1996; Willson et al. 1999). Knowledge of the
stress state is not only important in the petroleum industry, but
it is also vital in geotechnical applications and other solid earth
sciences. Thus, widespread studies have been conducted and
different measurement methods and theories or empirical
relationships have been established for estimating the stress
state in the earth’s crust. The underground stress state, with a
simplifying assumption, can be described by three mutually
orthogonal principal stress components, i.e., a vertical stress
(Sv) and two horizontal principal stresses (SH and Sh). Sv is a
factor due to weight of the overburden, and its magnitude can
be calculated using overburden density log (McGarr and Gay
1978).According to Zoback et al. (2003), hydraulic fracturing
test, leak-off test (LOT), and measurement of pressure while
drilling (PWD) are three common methods for the least
principal stress measurement in the deep wells. The magni-
tude of minimum horizontal stress (Sh) in the normal and
strike-slip faulting regimes can be measured using the men-
tioned methods. Measurement of the maximum horizontal
stress (SH) using the mentioned methods is not directly
& Seyed Mahmoud Fatemi Aghda
1 Department of Geology, National Iranian South Oil
Company, Ahwaz, Iran
2 Department of Engineering Geology, Kharazmi University,
Tehran, Iran
3 Department of Civil and Environmental Engineering,
Amirkabir University of Technology, Tehran, Iran
123
J Petrol Explor Prod Technol (2017) 7:707–715
DOI 10.1007/s13202-017-0323-5
possible (Zoback 2010) and is required to use theoretical and
empirical relationships to estimate SH based on Sh and Svvalues (Binh et al. 2011; Zang et al. 2012). Also, other than
being expensive and time-consuming, these tests cannot
provide continuous horizontal stress profiles (Song and
Hareland 2012; Sone and Zoback 2014). Therefore, devel-
opment of the theoretical relationships for predicting stress
state in deep oil wells is always of interest for the oil industry.
In the following sections, first, the conventional techniques for
determining horizontal stress profiles using the well logs are
introduced. A discussion of the relationship between in situ
stresses and wall rock strength at formation depths of break-
outs and drilling-induced fractures will be given after that.
Next, using a mathematically based strategy, the log-derived
horizontal stress profiles are calibrated using in situ stress
conditions that it can be estimated based on the observed
wellbore wall failures at different depths. Finally, the hori-
zontal stress profiles of a deep oil well in the southwest of Iran
are determined using the introduced strategy and their results
will be checked by analyzing compressive and tensile well-
bore failures.
Determination of stress profiles using the well logs(log-derived stress profile)
One of the applicable methods for estimating horizontal
stresses in the oil wells is to determine the stress profiles
using acoustic and density logs (Blanton and Olson 1999).
The key mechanical properties of wellbore wall rock for
calculation of stress profiles based on the uniaxial strain
theory, such as Poisson’s ratio, overburden and pore pres-
sure, can be determined using acoustic logs including
compressional and shear wave velocities together with
density log. The horizontal minimum stress profile of
wellbores can be calculated using the proposed relationship
based on the uniaxial strain theory, with inclusion of
poroelasticity, as follows (Ahmed et al. 1991):
Sh ¼m
1� mSV � aPPð Þ þ aPP ð1Þ
where v is Poisson’s ratio, SV is vertical total stress, a is
Biot’s poroelastic constant, and PP is pore pressure.
The inconsistency of the horizontal stress profiles cal-
culated from Eq. 1 with the horizontal stresses measured at
different depths, necessitates applying some adjustments in
Eq. 1 in order to improve its results. Tectonic stress is
described by many investigators as one of the main reasons
for the observed differences between calculated and mea-
sured horizontal stresses at different depths (Blanton and
Olson 1999; Brown and Hoek 1978; Fjær et al. 2008; Zang
et al. 2012; Zang and Stephansson 2008). Therefore, by
adding the tectonic stress term, Eq. 1 is modified as follows
(Hareland and Harikrishnan 1996):
Sh ¼m
1� mSV � aPPð Þ þ aPP þ rtect ð2Þ
where rtect is calibration or additional tectonic stress.
By adding the tectonic stress term to Eq. 1, the hori-
zontal stress profile can be displaced and its conformity
with measured in situ stresses can be increased. The adding
tectonic stress value is determined through difference
between the measured value of stress at a specific depth
and the stress calculated by Eq. 1 at the same depth.
Adding a constant value as tectonic stress to the calcu-
lated stress profile yields a good estimation of horizontal
stress in sections of a wellbore that have the same lithology
with the zone in which the in situ stress test has been
carried out. It is worth mentioning that the wellbore wall is
composed of layers with different lithology and elastic
properties, it is a reasonable assumption that the tectonic
stress will be varied in different lithological layers. To
apply the tectonic stress, Blanton and Olson (1999) suggest
assuming constant horizontal strains across all layers of a
geological sequence with different elastic moduli.
According to the study conducted by Blanton and Olson
(1999), magnitude of the horizontal stresses can be com-
puted using the following equations:
SH ¼ m1� m
SV � aPPð Þ þ aPP þEex
1� m2þ mEey1� m2
þ 1þ mE1� m2
atDT ð3Þ
Sh ¼m
1� mSV � aPPð Þ þ aPP þ
Eey1� m2
þ mEex1� m2
þ 1þ mE1� m2
atDT ð4Þ
where ex and ey are tectonic strains in horizontal plane, E is
the Young’s modulus, at is thermal coefficient of expan-
sion, and DT is temperature change (temperature at a par-
ticular depth minus the ambient surface temperature).
Blanton and Olson (1999), for the sake of simplification,
assumed that the horizontal strain in one direction is equal
to zero (i.e., ex or ey = 0). In Eqs. 3 and 4 in addition to
tectonic strain, the effect of temperature was considered in
the calculation of horizontal stresses. There are two
advantages in using the tectonic strain instead of the tec-
tonic stress. The first one is to increase the accuracy of the
minimum horizontal stress (Sh), and the second one is
possibility of calculating the maximum horizontal stress
(SH) profile using well logs.
To achieve a log-derived stress profile with accept-
able accuracy, at the least, the stress state in one point of
well should be defined to calibrate the stress profile, which
is required to carry out an in situ stress test in the well.
Because the in situ stress measurement data are not avail-
able for many of deep oil wells, calibration of the log-
derived horizontal stress profile, and reaching to a reliable
708 J Petrol Explor Prod Technol (2017) 7:707–715
123
estimation of the horizontal stress values are not possible
for all drilled wells.
Wellbore failures analysis
Analyzing failures of the wellbore wall, which can be
detected using wellbore imaging devices, provides valuable
information about the stress state at deep wells (Zoback
et al. 2010). Generally, considering the condition of stress
concentration around a wellbore, there are possibility of
occurrence of compressive failures (breakouts) and/or
tensile failures (drilling-induced tensile fractures) in the
wellbore wall (Gough and Bell 1981, 1982). Stress con-
centration around the wellbore drilled in a stressed elastic
medium can be calculated using equations developed by
Kirsch (1898). Considering the assignability of the stress
concentration and the nature of the created failures at the
wellbore wall, it is possible to extract useful information
about in situ stress magnitudes utilizing a suitable failure
criterion (Zoback et al. 2003). The Mohr–Coulomb and
maximum tensile stress criteria are the most commonly
used failure criteria for analysis of shear failure and tensile
failure, respectively (Rasouli et al. 2011). Zoback et al.
(2003) presented a simple strategy for estimation of hori-
zontal stress state in deep wellbores based on the failure
evidences of wellbore wall and tectonic regime of the
studied field. In this method, the allowable values of hor-
izontal stresses, which are illustrated in a stress polygon, is
obtained using the friction coefficient of the earth’s crust as
follows (Jaeger and Cook 1979):
S1 � PP
S3 � PP
� l2 þ 1� �1=2 þ lh i2
ð5Þ
where l is the coefficient of frictional sliding on an
optimally oriented pre-existing fault. S1 and S3 are the
maximum and minimum principal stresses which can be
corresponded to SH, Sh, or Sv using Anderson’s faulting
theory. Then, the range of allowable values of horizontal
stresses is limited based on non-catastrophic failures of
the wellbore with respect to the rock strength of the
wellbore wall. The most common non-catastrophic
borehole failures are breakouts that formation will be
lead to enlargement of the wellbore cross section (Bell
and Gough 1979). The enlargement of the wellbore is
caused by the development of intersecting conjugate shear
planes, which cause pieces of the borehole wall to spall
off (Reinecker et al. 2003). Therefore, breakouts can be
detected using the (four-arm) caliper log tool that
provides two diameters of the borehole cross section
(Reinecker et al. 2003). The Formation mechanism of the
breakout was first discussed by Gough and Bell (1981)
and later expanded by Zoback et al. (1985). Breakouts are
formed in symmetric zones around the borehole at the
azimuth of least horizontal principal stress (h = 90�,270�) where the circumferential stress (rhh) is the largest
and exceeds the formation compressive strength.
rmaxhh �ðUCSþ Nu� DPÞ ð6Þ
where UCS is the uniaxial compressive strength, DP is the
difference between the wellbore pressure (mud weight, Pm)
and pore pressure (PP), and N/ is calculated using rock
friction angle (/).
N/ ¼ 1þ sin/1� sin/
ð7Þ
Based on Kirsch’s equations, the maximum values of
rhh can be calculated as:
rmaxhh ¼ 3SH � Sh � 2PP � DP� rDT ð8Þ
where rDT represents the thermal stresses arising from the
difference between the mud temperature and formation
temperature (DT), and DP is the difference between the
wellbore pressure (mud weight, Pm) and pore pressure (PP).
Drilling-induced fractures are another common wellbore
failure that appeared as two narrow sharply defined frac-
tures formed on two opposite sides of the wellbore wall.
These longitudinal fractures are sub-parallel or slightly
inclined to the wellbores axis in vertical wells (Tingay
et al. 2008). Drilling-induced tensile fractures are created
when the circumferential stress (rhh) is negative and
exceeds the tensile strength (T0) of the formation (Aadnoy
1990):
rminhh � � T0 ð9Þ
Based on Kirsch’s equations, the circumferential stress
(rhh) around a vertical borehole is minimum in the SHdirection (h = 0, 180) and can be calculated as:
rminhh ¼ 3Sh � SH � 2PP � DP� rDT ð10Þ
Calibration of log-derived stress profiles usingwellbore failure evidences
For estimating the maximum and minimum horizontal
stresses, both mentioned methods have some limitations in
practice. Determining the log-derived stress profiles using
Blanton and Olson (1999) method (Eqs. 3, 4) the stress
state must be known in a depth of the well that is not
available for many deep oil wells. Also, for determination
of a particular range of horizontal stresses using analysis of
the wellbore failure evidences, both breakout and induced
tensile fracture must be available at the same depth of the
wellbore. Thus, application of this method becomes lim-
ited, as in many cases, the breakouts and induced tensile
fractures are not formed at same depths.
J Petrol Explor Prod Technol (2017) 7:707–715 709
123
However, the failure evidences at different depths of a
wellbore can be used for calibration of the horizontal stress
profiles. In this strategy, the stress condition in formation
zones of breakouts and induced tensile fractures at different
depths of a wellbore are related using Eqs. 3 and 4. By
replacing Sh and SH in Eqs. 8 and 10 that, respectively, the
stress condition required to form the breakout and induced
tensile fractures by the equal defined terms from Eqs. 3 and
4, Eqs. 11 and 12 can be obtained as:
Eex1� m2
ð3� mÞ þ Eey1� m2
ð3m� 1Þ þ 2Sh � pf � pmw
� USC� N/� DP� 0
ð11Þ
Eey1� m2
ð3� mÞ þ Eex1� m2
ð3m� 1Þ þ 2Sh � pf � pmw
� rDT þ T0 � 0
ð12Þ
where Sh is the horizontal stress arising from the overbid-
ding loading that is calculated using Eq. 1.
To solve Eqs. 11 and 12, they must be assumed equal to
zero or equal to a certain amount. Breakout incidence in a
wellbore wall indicates that Eq. 11 is equal or greater than
zero. Also, the occurrence of induced fracture suggests that
Eq. 12 is equal or less than zero. These equations can be
considered approximately equal to zero at both end points of
breakouts and induced fractures. Therefore, the data obtained
from these points are used for solving Eqs. 11 and 12. Hence,
in Eqs. 11 and 12, tectonic strain parameters of ex and ey are
the only unknown, using two calibration points, these equa-
tions will be solved and these two unknown parameters can be
determined. With replacing elastic properties of the wall rock
and the other parameters for each end point of a wellbore
failure, an equation will be obtained. However, considering
the inaccuracies and errors in involved data, the use of more
calibration points can be caused to increase the accuracy level
of the results. In many cases, there are several breakouts and
induced fractures at different depths of a wellbore and,
therefore, more than two equations can be obtained. Hence, to
improve the accuracy level of the estimated tectonic strain
parameters, the least-squares approach was used in this study.
Applications and validation of the results
The proposed approach was used to estimate the horizontal
stresses in a deep wellbore in an oil field located in southwest
of Iran. The depth of the studiedwellbore is about 4200 m and
data obtained from 360 m intervals between 3800 m to
4160 m.Byusing full-bore formationmicroimager (FMI) and
caliper logs, several induced fractures and breakouts were
detected in the studied interval. Azimuth of themaximum and
minimum horizontal stresses were established based on the
orientation of breakouts and induced fractures in the studied
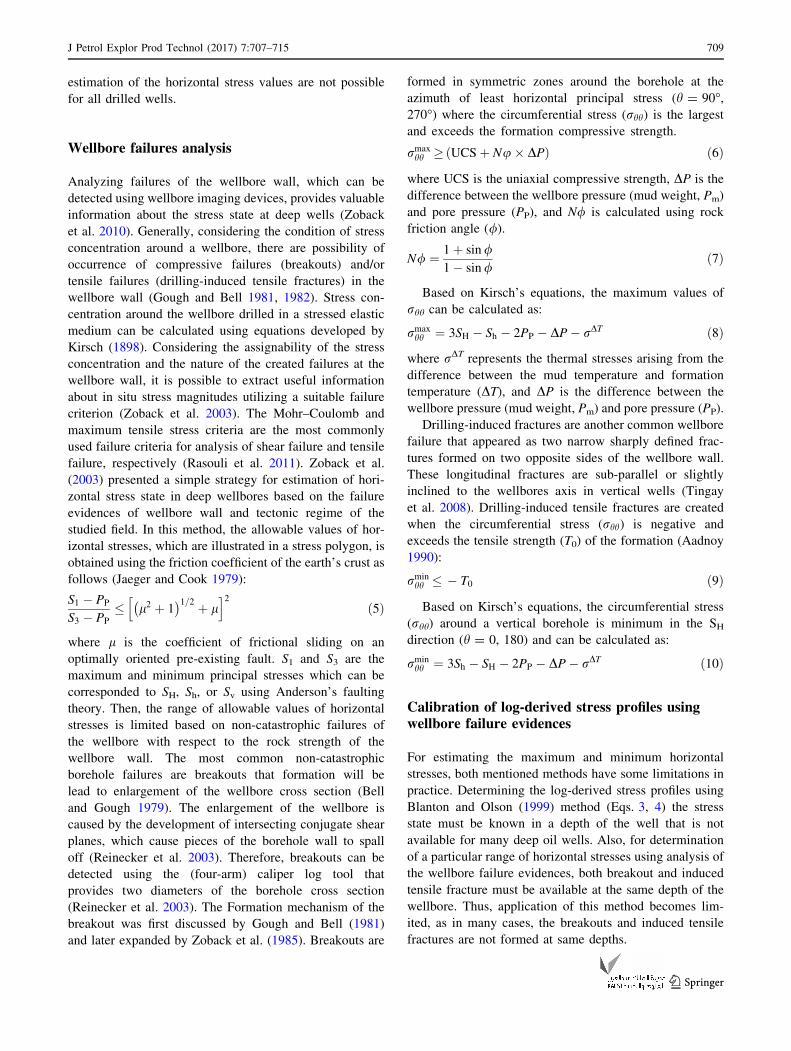
wellbore as shown inFig. 1a.Moreover, Fig. 1b illustrates the
maximum andminimum horizontal stress orientations in Iran.
8
16
24
N
180
ShSH
Breakout Induced tensile Fracture
(a) (b)
Fig. 1 a Azimuth of horizontal stresses based on orientation of wellbore failures in the studied well, b Map of maximum and minimum
horizontal stress orientations in Iran (Zarifi et al. 2013)
710 J Petrol Explor Prod Technol (2017) 7:707–715
123
As shown in Fig. 1, the orientation of borehole break-
outs that indicate azimuth of Sh is about 43� and the ori-
entation of induced fractures that indicate azimuth of SH is
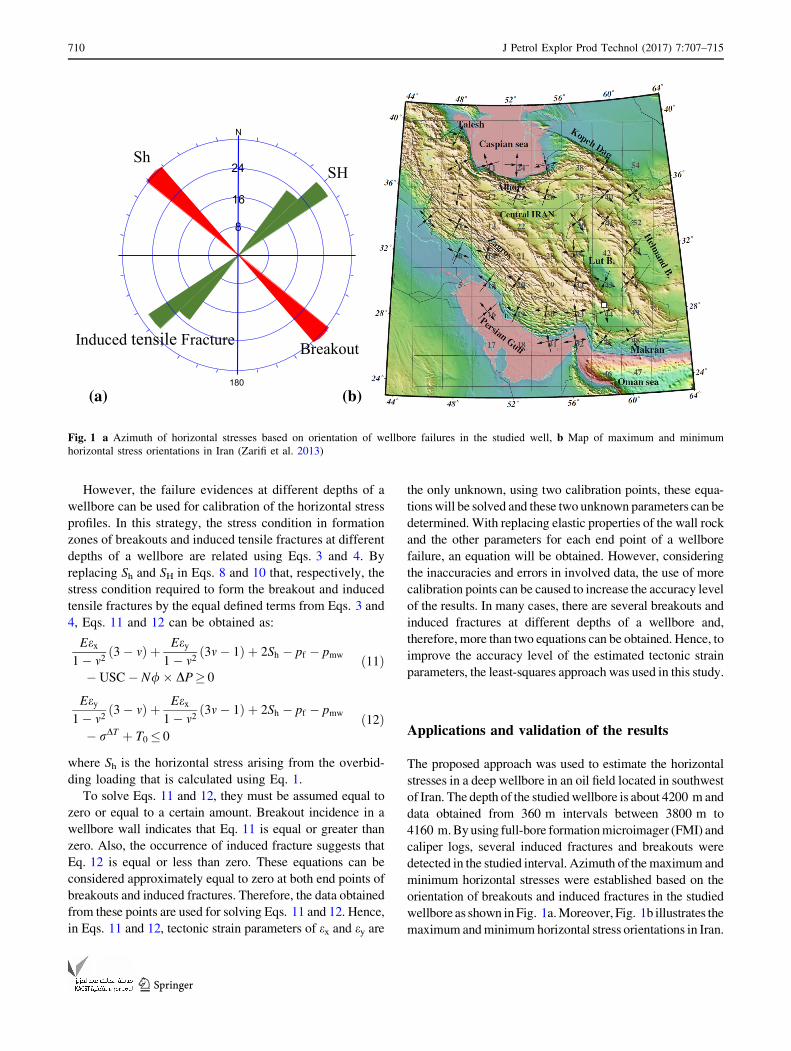
about 133�.Using acoustic (DTS and DTC) and density logs
(Fig. 2), the required parameters to solve Eqs. 11 and 12
were determined. Furthermore, using FMI images, the end
points of breakouts and the induced fractures were selected
as calibration points.
Using FMI images, 24 points, i.e., 12 breakouts and 12
induced fractures, were selected in the studied interval.
On the basis of the proposed solution, the optimum values
for ex and ey (two unknown parameters) with a minimum
error in these 24 points are 5.1e-4 and -6.8e-4,
respectively.
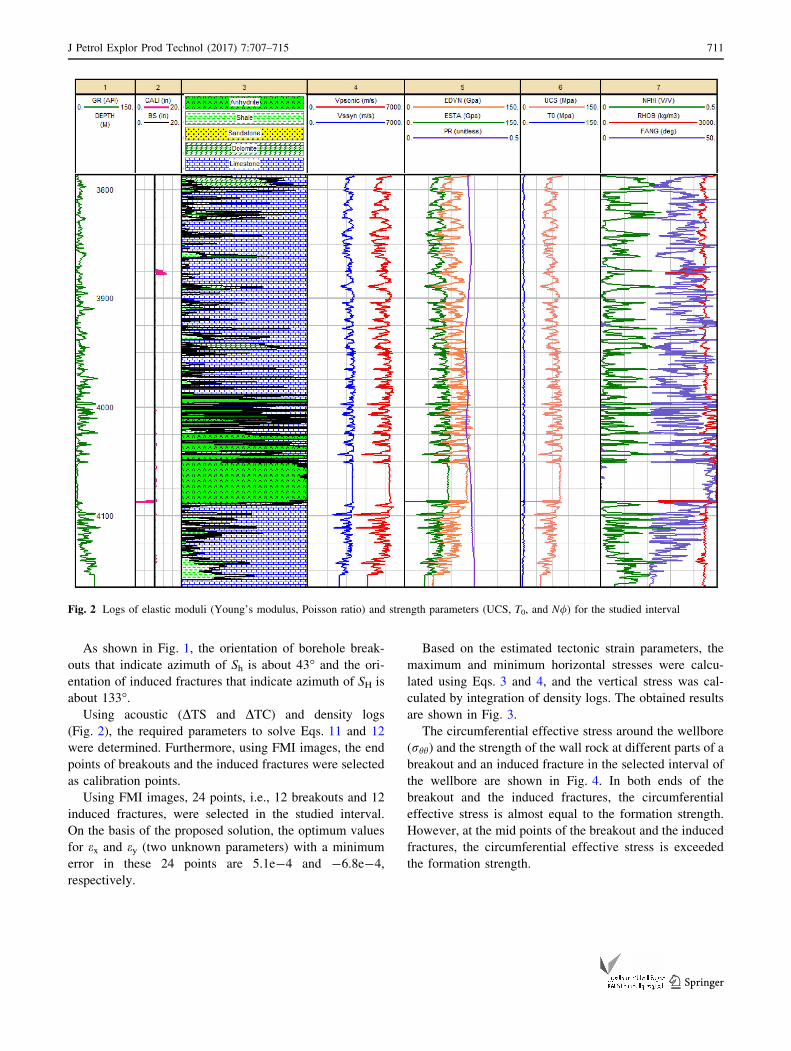
Based on the estimated tectonic strain parameters, the
maximum and minimum horizontal stresses were calcu-
lated using Eqs. 3 and 4, and the vertical stress was cal-
culated by integration of density logs. The obtained results
are shown in Fig. 3.
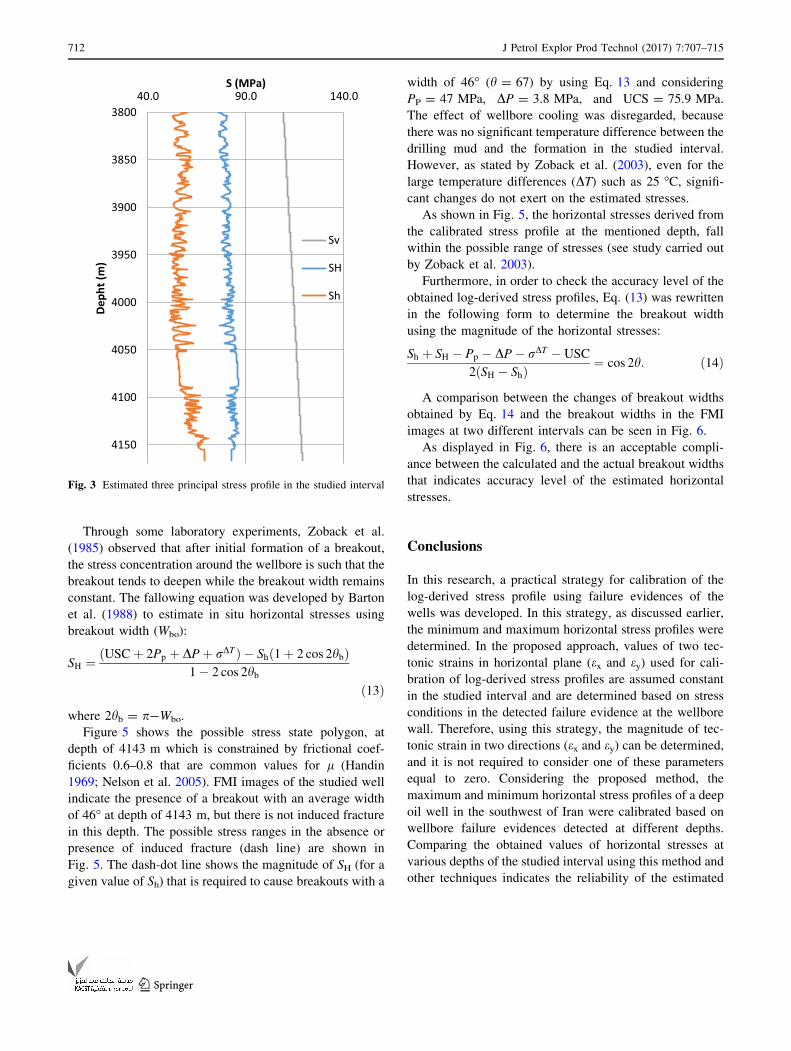
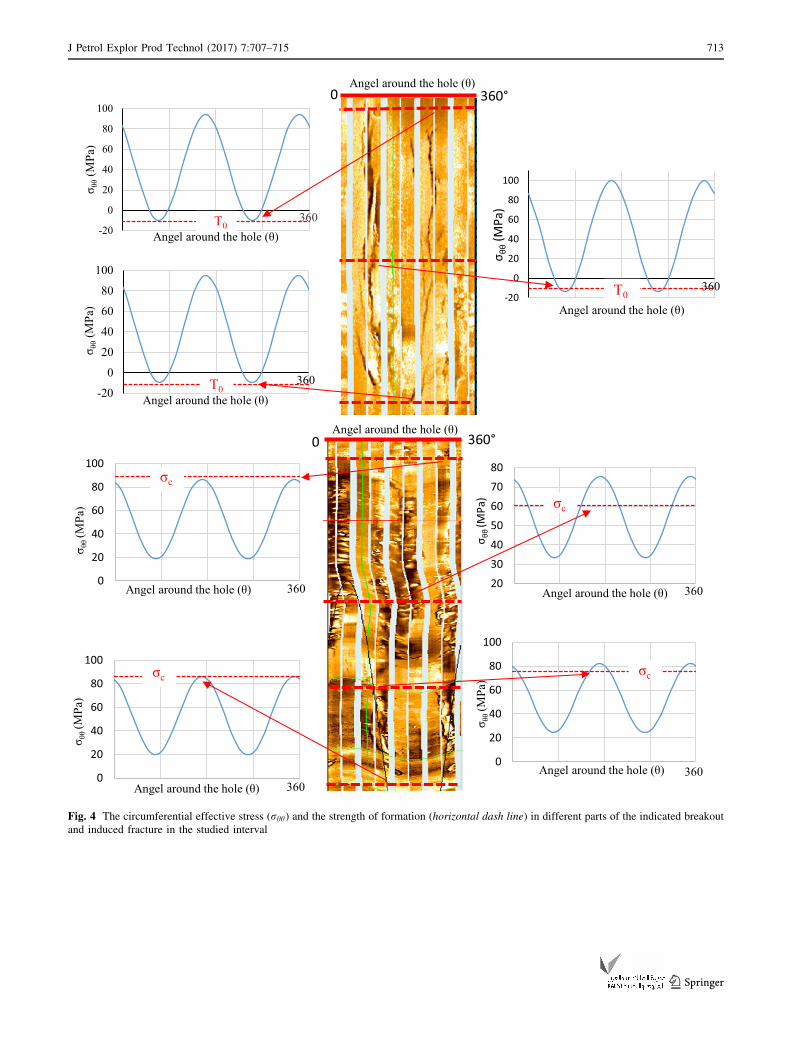
The circumferential effective stress around the wellbore
(rhh) and the strength of the wall rock at different parts of a
breakout and an induced fracture in the selected interval of
the wellbore are shown in Fig. 4. In both ends of the
breakout and the induced fractures, the circumferential
effective stress is almost equal to the formation strength.
However, at the mid points of the breakout and the induced
fractures, the circumferential effective stress is exceeded
the formation strength.
Fig. 2 Logs of elastic moduli (Young’s modulus, Poisson ratio) and strength parameters (UCS, T0, and N/) for the studied interval
J Petrol Explor Prod Technol (2017) 7:707–715 711
123
Through some laboratory experiments, Zoback et al.
(1985) observed that after initial formation of a breakout,
the stress concentration around the wellbore is such that the
breakout tends to deepen while the breakout width remains
constant. The fallowing equation was developed by Barton
et al. (1988) to estimate in situ horizontal stresses using
breakout width (Wbo):
SH ¼ ðUSCþ 2Pp þ DPþ rDTÞ � Shð1þ 2 cos 2hbÞ1� 2 cos 2hb
ð13Þ
where 2hb = p-Wbo.
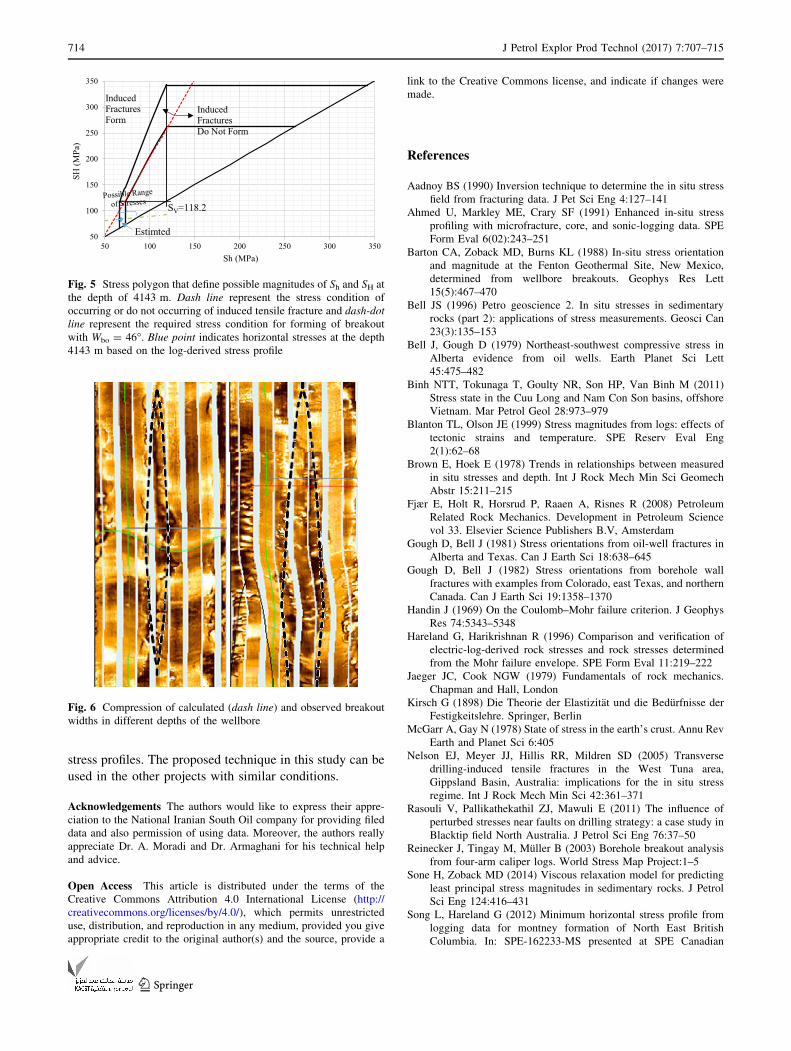
Figure 5 shows the possible stress state polygon, at
depth of 4143 m which is constrained by frictional coef-
ficients 0.6–0.8 that are common values for l (Handin
1969; Nelson et al. 2005). FMI images of the studied well
indicate the presence of a breakout with an average width
of 46� at depth of 4143 m, but there is not induced fracture
in this depth. The possible stress ranges in the absence or
presence of induced fracture (dash line) are shown in
Fig. 5. The dash-dot line shows the magnitude of SH (for a
given value of Sh) that is required to cause breakouts with a
width of 46� (h = 67) by using Eq. 13 and considering
PP = 47 MPa, DP = 3.8 MPa, and UCS = 75.9 MPa.
The effect of wellbore cooling was disregarded, because
there was no significant temperature difference between the
drilling mud and the formation in the studied interval.
However, as stated by Zoback et al. (2003), even for the
large temperature differences (DT) such as 25 �C, signifi-cant changes do not exert on the estimated stresses.
As shown in Fig. 5, the horizontal stresses derived from
the calibrated stress profile at the mentioned depth, fall
within the possible range of stresses (see study carried out
by Zoback et al. 2003).
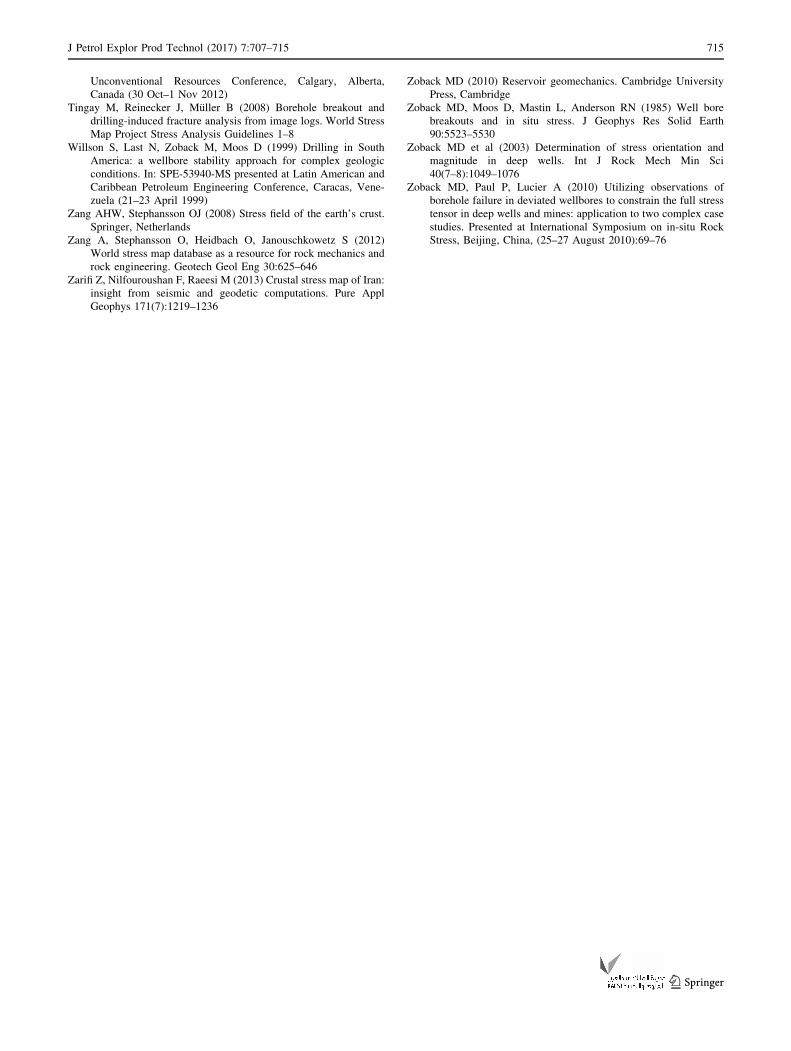
Furthermore, in order to check the accuracy level of the
obtained log-derived stress profiles, Eq. (13) was rewritten
in the following form to determine the breakout width
using the magnitude of the horizontal stresses:
Sh þ SH � Pp � DP� rDT � USC
2ðSH � ShÞ¼ cos 2h: ð14Þ
A comparison between the changes of breakout widths
obtained by Eq. 14 and the breakout widths in the FMI
images at two different intervals can be seen in Fig. 6.
As displayed in Fig. 6, there is an acceptable compli-
ance between the calculated and the actual breakout widths
that indicates accuracy level of the estimated horizontal
stresses.
Conclusions
In this research, a practical strategy for calibration of the
log-derived stress profile using failure evidences of the
wells was developed. In this strategy, as discussed earlier,
the minimum and maximum horizontal stress profiles were
determined. In the proposed approach, values of two tec-
tonic strains in horizontal plane (ex and ey) used for cali-
bration of log-derived stress profiles are assumed constant
in the studied interval and are determined based on stress
conditions in the detected failure evidence at the wellbore
wall. Therefore, using this strategy, the magnitude of tec-
tonic strain in two directions (ex and ey) can be determined,
and it is not required to consider one of these parameters
equal to zero. Considering the proposed method, the
maximum and minimum horizontal stress profiles of a deep
oil well in the southwest of Iran were calibrated based on
wellbore failure evidences detected at different depths.
Comparing the obtained values of horizontal stresses at
various depths of the studied interval using this method and
other techniques indicates the reliability of the estimated
3800
3850
3900
3950
4000
4050
4100
4150
40.0 90.0 140.0De
pht (
m)
S (MPa)
Sv
SH
Sh
Fig. 3 Estimated three principal stress profile in the studied interval
712 J Petrol Explor Prod Technol (2017) 7:707–715
123
0
20
40
60
80
100
σ θθ(M
Pa)
Angel around the hole (θ) 360
σc
20304050607080
σ θθ(M
Pa)
Angel around the hole (θ) 360
σc
0
20
40
60
80
100
σ θθ(M
Pa)
Angel around the hole (θ) 360
σc
0
20
40
60
80
100
σ θθ(M
Pa)
Angel around the hole (θ)
σc
360
0 360°
-20
0
20
40
60
80
100
σ θθ
(MPa
)
Angel around the hole (θ) T0
360
-20
0
20
40
60
80
100
σ θθ(M
Pa)
Angel around the hole (θ) T0
360
-20
0
20
40
60
80
100
σ θθ
(MPa
)
Angel around the hole (θ) T0
360
0 360°Angel around the hole (θ)
Angel around the hole (θ)
Fig. 4 The circumferential effective stress (rhh) and the strength of formation (horizontal dash line) in different parts of the indicated breakout
and induced fracture in the studied interval
J Petrol Explor Prod Technol (2017) 7:707–715 713
123
stress profiles. The proposed technique in this study can be
used in the other projects with similar conditions.
Acknowledgements The authors would like to express their appre-
ciation to the National Iranian South Oil company for providing filed
data and also permission of using data. Moreover, the authors really
appreciate Dr. A. Moradi and Dr. Armaghani for his technical help
and advice.
Open Access This article is distributed under the terms of the
Creative Commons Attribution 4.0 International License (http://
creativecommons.org/licenses/by/4.0/), which permits unrestricted
use, distribution, and reproduction in any medium, provided you give
appropriate credit to the original author(s) and the source, provide a
link to the Creative Commons license, and indicate if changes were
made.
References
Aadnoy BS (1990) Inversion technique to determine the in situ stress
field from fracturing data. J Pet Sci Eng 4:127–141
Ahmed U, Markley ME, Crary SF (1991) Enhanced in-situ stress
profiling with microfracture, core, and sonic-logging data. SPE
Form Eval 6(02):243–251
Barton CA, Zoback MD, Burns KL (1988) In-situ stress orientation
and magnitude at the Fenton Geothermal Site, New Mexico,
determined from wellbore breakouts. Geophys Res Lett
15(5):467–470
Bell JS (1996) Petro geoscience 2. In situ stresses in sedimentary
rocks (part 2): applications of stress measurements. Geosci Can
23(3):135–153
Bell J, Gough D (1979) Northeast-southwest compressive stress in
Alberta evidence from oil wells. Earth Planet Sci Lett
45:475–482
Binh NTT, Tokunaga T, Goulty NR, Son HP, Van Binh M (2011)
Stress state in the Cuu Long and Nam Con Son basins, offshore
Vietnam. Mar Petrol Geol 28:973–979
Blanton TL, Olson JE (1999) Stress magnitudes from logs: effects of
tectonic strains and temperature. SPE Reserv Eval Eng
2(1):62–68
Brown E, Hoek E (1978) Trends in relationships between measured
in situ stresses and depth. Int J Rock Mech Min Sci Geomech
Abstr 15:211–215
Fjær E, Holt R, Horsrud P, Raaen A, Risnes R (2008) Petroleum
Related Rock Mechanics. Development in Petroleum Science
vol 33. Elsevier Science Publishers B.V, Amsterdam
Gough D, Bell J (1981) Stress orientations from oil-well fractures in
Alberta and Texas. Can J Earth Sci 18:638–645
Gough D, Bell J (1982) Stress orientations from borehole wall
fractures with examples from Colorado, east Texas, and northern
Canada. Can J Earth Sci 19:1358–1370
Handin J (1969) On the Coulomb–Mohr failure criterion. J Geophys
Res 74:5343–5348
Hareland G, Harikrishnan R (1996) Comparison and verification of
electric-log-derived rock stresses and rock stresses determined
from the Mohr failure envelope. SPE Form Eval 11:219–222
Jaeger JC, Cook NGW (1979) Fundamentals of rock mechanics.
Chapman and Hall, London
Kirsch G (1898) Die Theorie der Elastizitat und die Bedurfnisse der
Festigkeitslehre. Springer, Berlin
McGarr A, Gay N (1978) State of stress in the earth’s crust. Annu Rev
Earth and Planet Sci 6:405
Nelson EJ, Meyer JJ, Hillis RR, Mildren SD (2005) Transverse
drilling-induced tensile fractures in the West Tuna area,
Gippsland Basin, Australia: implications for the in situ stress
regime. Int J Rock Mech Min Sci 42:361–371
Rasouli V, Pallikathekathil ZJ, Mawuli E (2011) The influence of
perturbed stresses near faults on drilling strategy: a case study in
Blacktip field North Australia. J Petrol Sci Eng 76:37–50
Reinecker J, Tingay M, Muller B (2003) Borehole breakout analysis
from four-arm caliper logs. World Stress Map Project:1–5
Sone H, Zoback MD (2014) Viscous relaxation model for predicting
least principal stress magnitudes in sedimentary rocks. J Petrol
Sci Eng 124:416–431
Song L, Hareland G (2012) Minimum horizontal stress profile from
logging data for montney formation of North East British
Columbia. In: SPE-162233-MS presented at SPE Canadian
50
100
150
200
250
300
350
50 100 150 200 250 300 350
SH (M
Pa)
Sh (MPa)
Induced FracturesDo Not Form
Induced Fractures Form
Estimted
SV=118.2
Fig. 5 Stress polygon that define possible magnitudes of Sh and SH at
the depth of 4143 m. Dash line represent the stress condition of
occurring or do not occurring of induced tensile fracture and dash-dot
line represent the required stress condition for forming of breakout
with Wbo = 46�. Blue point indicates horizontal stresses at the depth
4143 m based on the log-derived stress profile
Fig. 6 Compression of calculated (dash line) and observed breakout
widths in different depths of the wellbore
714 J Petrol Explor Prod Technol (2017) 7:707–715
123
Unconventional Resources Conference, Calgary, Alberta,
Canada (30 Oct–1 Nov 2012)
Tingay M, Reinecker J, Muller B (2008) Borehole breakout and
drilling-induced fracture analysis from image logs. World Stress
Map Project Stress Analysis Guidelines 1–8
Willson S, Last N, Zoback M, Moos D (1999) Drilling in South
America: a wellbore stability approach for complex geologic
conditions. In: SPE-53940-MS presented at Latin American and
Caribbean Petroleum Engineering Conference, Caracas, Vene-
zuela (21–23 April 1999)
Zang AHW, Stephansson OJ (2008) Stress field of the earth’s crust.
Springer, Netherlands
Zang A, Stephansson O, Heidbach O, Janouschkowetz S (2012)
World stress map database as a resource for rock mechanics and
rock engineering. Geotech Geol Eng 30:625–646
Zarifi Z, Nilfouroushan F, Raeesi M (2013) Crustal stress map of Iran:
insight from seismic and geodetic computations. Pure Appl
Geophys 171(7):1219–1236
Zoback MD (2010) Reservoir geomechanics. Cambridge University
Press, Cambridge
Zoback MD, Moos D, Mastin L, Anderson RN (1985) Well bore
breakouts and in situ stress. J Geophys Res Solid Earth
90:5523–5530
Zoback MD et al (2003) Determination of stress orientation and
magnitude in deep wells. Int J Rock Mech Min Sci
40(7–8):1049–1076
Zoback MD, Paul P, Lucier A (2010) Utilizing observations of
borehole failure in deviated wellbores to constrain the full stress
tensor in deep wells and mines: application to two complex case
studies. Presented at International Symposium on in-situ Rock
Stress, Beijing, China, (25–27 August 2010):69–76
J Petrol Explor Prod Technol (2017) 7:707–715 715
123