Embed Size (px)
Citation preview
Dissertations and Theses
4-2015
Determination of Factors That Influence Passengers’ Airline Determination of Factors That Influence Passengers’ Airline
Selection: A Study of Low Cost Carriers in Thailand Selection: A Study of Low Cost Carriers in Thailand
Thapanat Buaphiban Embry-Riddle Aeronautical University - Daytona Beach
Follow this and additional works at: https://commons.erau.edu/edt
Part of the Management and Operations Commons, and the Tourism and Travel Commons
Scholarly Commons Citation Scholarly Commons Citation Buaphiban, Thapanat, "Determination of Factors That Influence Passengers’ Airline Selection: A Study of Low Cost Carriers in Thailand" (2015). Dissertations and Theses. 157. https://commons.erau.edu/edt/157
This Dissertation - Open Access is brought to you for free and open access by Scholarly Commons. It has been accepted for inclusion in Dissertations and Theses by an authorized administrator of Scholarly Commons. For more information, please contact [email protected].

Determination of Factors That Influence Passengers’ Airline Selection: A Study of
Low Cost Carriers in Thailand
by
Thapanat Buaphiban
A Dissertation Submitted to the College of Aviation
in Partial Fulfillment of the Requirements for the Degree of
Doctor of Philosophy in Aviation
Embry-Riddle Aeronautical University
Daytona Beach, Florida
April 2015

© 2015 Thapanat Buaphiban
All Rights Reserved
iii
ABSTRACT
Researcher: Thapanat Buaphiban
Title: Determination of Factors That Influence Passengers’ Airline Selection: A
Study of Low Cost Carriers in Thailand
Institution: Embry Riddle Aeronautical University
Degree: Doctor of Philosophy in Aviation
Year: 2015
This research examined the factors that influenced the airline selection of Low Cost
Carriers (LCCs) in Thailand. The research was justified based on the rapid growth of
LCC travel in Thailand, particularly in domestic and regional travel. There is a relative
lack of successful explanation of the choice of LCCs in Thailand, with only a few studies
addressing topics like passenger satisfaction and perceptions of service quality.
Following an extensive literature review, the author used a theoretical framework based
on the Theory of Planned Behavior (TPB) (Ajzen, 1991) in order to explain passenger
behavioral intentions. This framework was supplemented by airline operational and
marketing factors identified from the literature, including Price, Service Quality, Airline
Reputation, Airline Safety, Route Availability and Convenience, and Frequent Flier
Programs. A large scaled survey was sent to Thai LCC passengers at major airports in
Thailand. The final sample (n = 781) was predominantly working-age, female, highly
educated, and with average incomes. In general, they flew frequently (two to three times
a year or more). In order to test the relationship among the external factors, TPB factors,
behavioral intentions, and actual behavior, Structural Equation Modeling (SEM) was
iv
conducted. Results showed that Subjective Norms, Perceived Behavioral Control, Airline
Reputation, Price, and Service Quality had a positive impact on Behavioral Intentions,
while Behavioral Intentions positively influenced Buying Behavior. This research has
important implications both in academia and industry. It indicates that LCC passengers
are not merely driven by price as concluded by economic studies in LCC selection.
Instead, factors like service quality, airline reputation, and social acceptability implied by
subjective norms play a significant role in the choice of LCCs over Full Service Carriers
(FSCs). Additionally, the results of this research provide LCCs with useful guidance to
form appropriate strategies to attract more passengers: protecting price leadership,
improving service quality, enhancing public image, and maintaining route diversity.

v
DEDICATION
I dedicate this dissertation to my belove family (mom, dad, Gammy, and Golf)
and dear friends (Mason, Patoo, Jeerasak, Waragorn, and Chanchai) who always support
and encourage me. I would also like to dedicate my dissertation to all faculty members,
my advisor (Dr.Truong), and classmates who have supported me throughout the process.

vi

vii
ACKNOWLEDGEMENTS
I would like to thank my committee members for the guidance and
encouragement. And I would like to give a special thank to Dr.Truong who is my
committee chair. Without his help, this dissertation would have been impossible.
viii
TABLE OF CONTENTS
Page
Committee Signature Page ................................................................................................. ii
Abstract .............................................................................................................................. iii
Dedication ........................................................................................................................... v
Acknowledgements ............................................................................................................ vi
List of Tables ..................................................................................................................... xi
List of Figures ................................................................................................................... xii
Chapter I Introduction .............................................................................................. 1
Background of the Study ................................................................ 2
Statement of the Problem ................................................................ 7
Purpose Statement ........................................................................... 8
Research Question .......................................................................... 8
Significance of the Study .............................................................. 10
Delimitations ................................................................................. 11
Limitations and Assumptions ....................................................... 12
Definition of Terms ....................................................................... 13
List of Acronyms .......................................................................... 14
Chapter II Review of the Relevant Literature .......................................................... 15
Low Cost Carriers ......................................................................... 15
Low Cost Carriers and Airline Selection ...................................... 17
Foundational Theories .................................................................. 20
ix
Consumer Decision and Buying Behavior ........................ 21
Theory of Planned Behavior (TPB) .................................. 24
History and Development of the TPB ............................... 25
Purpose of TPB ................................................................. 26
Components and relationships of the TPB ........................ 27
Effectiveness of the TPB .................................................. 29
Application of the TPB to This Study ............................... 29
Previous Studies of TPB ................................................... 30
Airline Choice-Related Studies ............................. 30
Other Related Studies ........................................... 31
Airline Characteristics Influencing Passengers’ Selection ........... 34
Price .................................................................................. 35
Service Quality .................................................................. 38
Airline Reputation ............................................................. 41
Airline Safety .................................................................... 43
Route Availability and Convenience ................................ 45
Frequent Flier Programs ................................................... 46
Summary of Airline Selection Factors .............................. 47
Research Theoretical Framework and Hypotheses ....................... 48
Summary ....................................................................................... 55
Chapter III Methodology ......................................................................................... 57
Research Approach ....................................................................... 57

x
Research Strategy and Design....................................................... 58
Population and Sampling .............................................................. 60
Data Collection ............................................................................. 63
Research Instrument .......................................................... 66
Pilot Test ........................................................................... 66
Data Analysis ................................................................................ 68
Ethical Considerations .................................................................. 71
Limitation of the Method .............................................................. 72
Chapter IV Results ................................................................................................... 74
Respondent Demographics ........................................................... 75
Travel Experience ......................................................................... 80
Descriptive Statistics ..................................................................... 84
Passenger ........................................................................... 84
Airline ............................................................................... 86
Buying Intention and Buying Behavior ............................ 89
Reliability and Validity ................................................................. 90
Hypothesis Testing ........................................................................ 93
Model fitting and adjustment ............................................ 94
Summary of hypothesis outcomes .................................. 101
Chapter Summary ....................................................................... 106
Chapter V Discussion, Conclusions and Recommendations ................................. 108
Discussion ................................................................................... 108
xi
Theory of Planned Behavior ........................................... 109
External Factors .............................................................. 113
Conclusion .................................................................................. 122
Recommendations ....................................................................... 123
Contribution to the literature ........................................... 124
Limitations of the study .................................................. 126
Practical Implications ...................................................... 128
Recommendations for Future Research ...................................... 132
References………………………. .................................................................................. 137
Appendices
A TPB Characteristics ............................................................................. 150
B Factors in Airline Selection ................................................................. 148
C Variables Definition and Items ............................................................ 153
D Questionnaire ....................................................................................... 156
E IRB Approval Exempt Determination ................................................. 163
xii
LIST OF TABLES
Page
Table
1 Summary of AOT transport statistics ..................................................................... 6
2 Operational definitions of study constructs .......................................................... 49
3 Low-cost airlines included in the sample .............................................................. 65
4 Operational definitions of study constructs .......................................................... 79
5 Descriptive statistics - attitude scale ..................................................................... 85
6 Descriptive statistics – subjective norms scale ..................................................... 85
7 Descriptive statistics – perceived behavioral control scale ................................... 85
8 Descriptive statistics - price scale ......................................................................... 87
9 Descriptive statistics – service quality scale. ........................................................ 87
10 Descriptive statistics – airline reputation scale ..................................................... 87
11 Descriptive statistics – airline safety scale ............................................................ 88
12 Descriptive statistics – route availability and convenience scale ......................... 88
13 Descriptive statistics – frequent flier programs scale ........................................... 88
14 Descriptive statistics – buying intention scale ...................................................... 89
15 Descriptive statistics – buying behavior scale ...................................................... 89
16 Cronbach’s alpha test outcomes ............................................................................ 91
17 Factor loading test outcomes ................................................................................ 92
18 CR and AVE scores of CFA before adjustment ................................................... 97
19 CR and AVE scores of CFA after adjustment .................................................... 100
xiii
20 Hypothesis testing results summary .................................................................... 102
21 Summay definition of TPB characteristics ......................................................... 150
22 Summay of factors in airline selection ................................................................ 151
23 Variable operational definitions and items ......................................................... 153
xiv
LIST OF FIGURES
Page
Figure
1 Summary of business models for LCCs and FSCs ................................................. 3
2 The five-stage consumer decision model .............................................................. 23
3 Components and relationships of the TPB ............................................................ 28
4 Research theoretical framework and hypotheses .................................................. 50
5 Gender of respondents .......................................................................................... 76
6 Age of respondents ............................................................................................... 77
7 Education level ...................................................................................................... 78
8 Monthly income of respondents ............................................................................ 79
9 Frequency of travel via LCC ................................................................................. 80
10 Destinations where respondents normally fly using LCCs ................................... 81
11 Main purpose of travelling by LCC ...................................................................... 82
12 Information channels used by respondents for information about airlines. .......... 83
13 Purchasing channels for LCC tickets. ................................................................... 84
14 CFA model prior to adjustment ............................................................................ 96
15 CFA model following adjustment ......................................................................... 99
16 Final SEM model ................................................................................................ 103
17 Further Recommened Model .............................................................................. 136
1
CHAPTER I
INTRODUCTION
This research focused on examining factors that influence a passenger’s decision
to select a low-cost carrier (LCC) for travel. An LCC, or no-frills carrier, is an airline that
differentiates itself in the market through reduced ticket prices (Civil Aviation Authority,
2006). The low-cost carrier manages to reduce ticket prices below competitors through a
variety of strategies such as: fuel efficiency, careful management of revenue, and yield
management. Revenue management and yield management are strategies that use ticket
pricing to achieve higher load factors and/or the achievement of specific earnings targets.
However, the typical low-cost carrier also offers a different package of goods and
services to those of traditional carriers including a single service class, charging for in-air
amenities such as: checked baggage, seat selection, on-board refreshments, and reduced
ground services (e.g., eliminating business or premium lounges and reducing, or even
eliminating staffed check-in areas) (Civil Aviation Authority, 2006). These service
changes reduce operational costs and allow the airline to pass on this reduction in the
form of a cheaper ticket which, in turn, allows passengers to choose between a higher
service level and lower ticket price. These airlines have grown increasingly popular,
especially on regional and secondary routes in Europe and Asia since the 1990s (Civil
Aviation Authority, 2006).
This chapter introduces the topic of the study and provides background
information on the LCC industry, both around the world and in Thailand, and discusses
the significance of this study in terms of its contribution to the academic and aviation
industries. The chapter then summarizes the literature gap and reasons for conducting the

2
study. The final section presents the study’s statement of purpose, research questions,
delimitations, limitations and scope, and definitions of terms used in the study.
Background of the Study
The LCC business model is one of the most recent changes in the general business
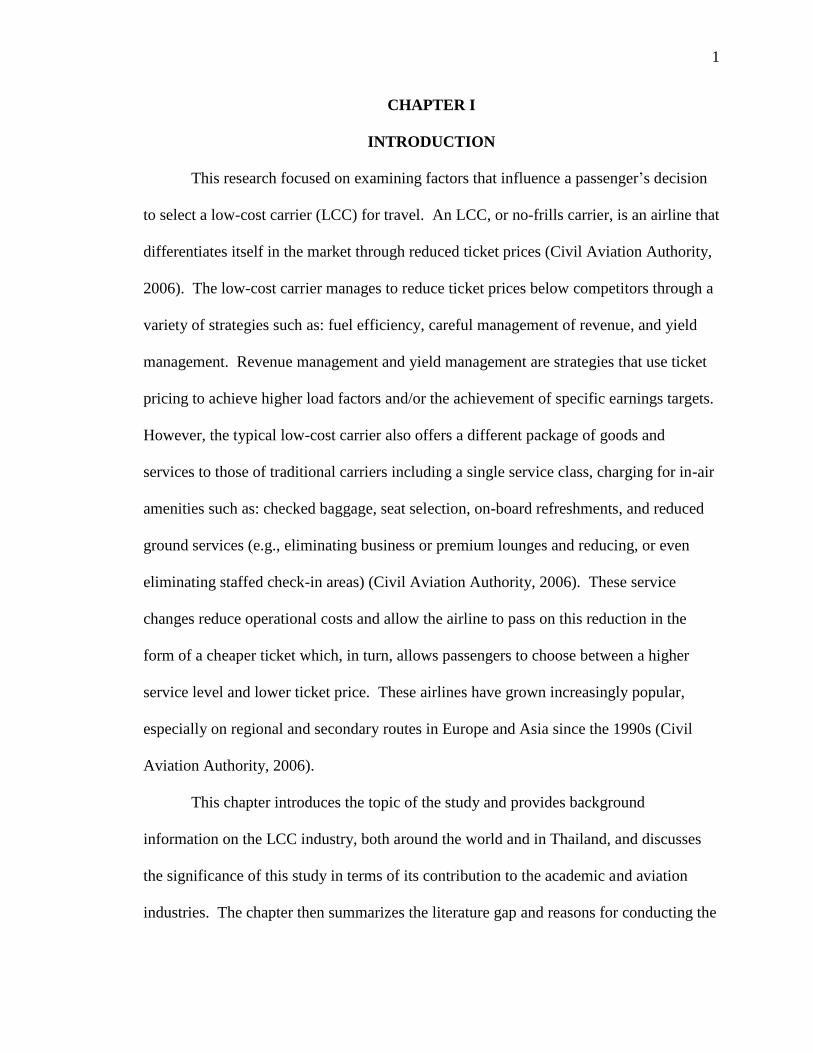
model of airlines (Sabre, 2010). Figure 1 shows a comparison of the business models
between an LCC and full-service carrier (FSC). It appears that LCCs use short-haul
flights (usually point-to-point among secondary destinations), a flat and straightforward
fare and class structure, no partnerships, direct sales, and new, single-model aircraft fleets
(Sabre, 2010). In contrast, FSCs use a hub-and-spoke network, complex fare structures,
and price discrimination (including multiple service classes), partnerships with other
airlines such as code sharing, multiple sales channels, and mixed aircraft fleets (Sabre,
2010). LCCs and FSCs also offer different service levels (Civil Aviation Authority,
2006). For example, an FSC will offer a two-class or three-class service (including
economy, business, and first class), while most LCCs only offer a single class of service.
These two fundamentally different business models attract different types of travelers.
Moreover, LCCs may be more likely to attract infrequent or leisure travelers traveling
domestically or regionally, while business travelers and long-haul travelers may be more
likely to choose a FSC (Fourie & Lubbe, 2006).
3
Figure 1. Summary of business models for LCCs and FSCs. Source: Adapted from
Sabre (2010).
The LCC business model has proven to be strong competition for the traditional
full-service model. Although the impact varies globally, evidence shows that the LCC
segment has been growing substantially and has an important effect on the airline
industry. A report on annual airline traffic from Europe found that in 2012, the total
number of flights fell 2.67% from 2011 but the low-cost segment grew by 1.4%
(Eurocontrol, 2013). The low-cost carrier segment, with an average 6,537 flights a day
within the European Union, totaled 25% of the total market share in 2012 (Eurocontrol,
4
2013). Similar growth has been seen in the Asian market (Harbison, 2013). The total
LCC capacity share (percentage of total seats in the market) has grown from 3.3% in
2001 to 57.6% in October 2013 (Harbison, 2013). This includes a relatively small but
growing low-cost, long-haul segment, which is not common in Europe. Thailand, along
with the Philippines, is considered to be one of the friendliest countries for LCC operation
and is projected to be a major growth market (Teng & Perry, 2013).
Questions have been raised about whether the LCC segment is actually delivering
lower costs to consumers. While passengers perceive the costs of LCCs are lower
because of the advertised fares, typically LCCs use a fare structure that includes only a
few tickets at this price (Vidovic, Steiner, & Babic, 2006). Thus, only a few passengers
actually receive the very low prices advertised. Nonetheless, it is clear that the LCC
segment has grown significantly in the European market. The same is also true in Asia,
where the cost gap between full-service airlines and LCCs was 60% to 70% (substantially
higher than the 36% gap in U.S. carriers and 40% to 50% in European carriers) (Smyth &
Pearce, 2006). Currently, the biggest LCCs operating in Southeast Asia are AirAsia
(which has operations around Asia, including Thailand) and Indonesia’s LionAir (Bland,
2014). Conditions in countries including Indonesia, Malaysia, and Thailand are
considered ideal for the expansion of LCCs because of a growing middle class and a
densely populated (though international) geography, with few land transportation options
(Bland, 2014). The total number of planes operating for low-cost carriers in the region is
expected to more than double in 2012 based on current aircraft orders, which total 1,200
aircraft, compared to 1,050 currently operating in the Southeast Asian region (Bland,
2014).
5
While the LCC model promises lower costs than the full-service model, LCCs
may be losing this cost advantage over time as FSCs become more efficient, and LCCs
come up against the limits of cost controls (KPMG, 2013). This narrowing of the gap
between carriers is not likely to be reduced much further, according to KPMG (2013);
however, the fact remains that LCCs will need to be more aggressive in the future in
order to maintain their competitive nature. This raises the question of understanding why
passengers select LCCs, and what kinds of characteristics passengers value, which will
provide more insight into how LCCs can continue to compete. Understanding
perceptions and behaviors of LCC passengers will help carriers improve their services
and offerings, thus improving the passenger experience.
The passenger experience and LCC competitiveness is important because of the
size and growth of LCCs in Thailand. Statistics indicate that the LCC segment in
Thailand is very strong. Airports of Thailand (AOT) is a government approved body
which controls domestic commercial airports in Thailand and publishes airline statistics
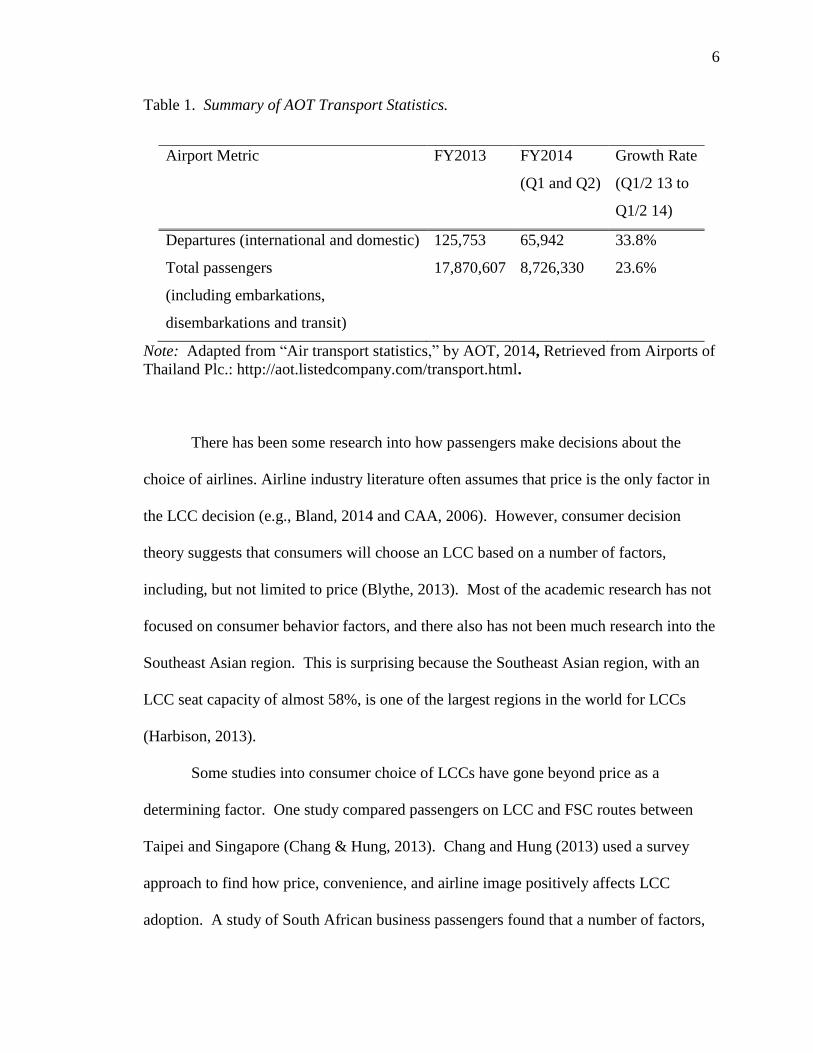
for the region. Table 1 summarizes key statistics for LCCs in Thailand in FY2013 and
Q1/Q2 2014. According to AOT statistics, LCC traffic accounted for 20.9% of the traffic
at Thailand’s airports. A majority of LCC passenger arrivals (57.4%) are from domestic
flights. Table 1 shows the growth rate between the first half of 2013 and 2014,
demonstrating significant growth in the market.
6
Table 1. Summary of AOT Transport Statistics.
Airport Metric FY2013 FY2014
(Q1 and Q2)
Growth Rate
(Q1/2 13 to
Q1/2 14)
Departures (international and domestic) 125,753 65,942 33.8%
Total passengers
(including embarkations,
disembarkations and transit)
17,870,607 8,726,330 23.6%
Note: Adapted from “Air transport statistics,” by AOT, 2014, Retrieved from Airports of
Thailand Plc.: http://aot.listedcompany.com/transport.html.
There has been some research into how passengers make decisions about the
choice of airlines. Airline industry literature often assumes that price is the only factor in
the LCC decision (e.g., Bland, 2014 and CAA, 2006). However, consumer decision
theory suggests that consumers will choose an LCC based on a number of factors,
including, but not limited to price (Blythe, 2013). Most of the academic research has not
focused on consumer behavior factors, and there also has not been much research into the
Southeast Asian region. This is surprising because the Southeast Asian region, with an
LCC seat capacity of almost 58%, is one of the largest regions in the world for LCCs
(Harbison, 2013).
Some studies into consumer choice of LCCs have gone beyond price as a
determining factor. One study compared passengers on LCC and FSC routes between
Taipei and Singapore (Chang & Hung, 2013). Chang and Hung (2013) used a survey
approach to find how price, convenience, and airline image positively affects LCC
adoption. A study of South African business passengers found that a number of factors,
7
like seat comfort, schedule, frequency of flights, and high cancellation charges (negative
effect), influenced carrier choice (Diggines, 2010). A third study has also confirmed that
price was a major factor in LCC selection, especially for family travel (Davison & Riley,
2010). The study by Davison and Riley (2010), conducted in the English West Midlands,
confirmed the importance of price, especially for family travelers seeking interesting
locations on limited budgets. However, it also identified factors in the choice of airlines
such as location, which demonstrates that there are other elements of the decision that
need to be considered.
Statement of the Problem
This research studied the problem of how consumers choose low-cost carriers and
what factors play a role in that decision. The study is meant to fill a gap in understanding
of the Asian LCC market. Research on LCCs in Southeast Asia is limited to a few
noteworthy examples. One study has been conducted in Thailand on passenger
satisfaction for LCC passengers (Saha & Theingi, 2009). This study examined service
quality as one of the determinants of passenger satisfaction as well as indirect influences
on word of mouth and feedback. The study found that elements of service, including
tangibles (plane, seats, and air condition system), schedule, flight attendants, and ground
staff, were factors in the consumer decision. This study is helpful in that it identifies the
importance of key service variables for Thai LCC passengers. However, it does not
explain why an LCC was the initial choice. The study is also older (with data collected in
2006), which could mean the findings are somewhat out of date.
8
The research on LCCs suggests that low price is an important factor in the choice
of LCC rather than FSC carrier. LCC passengers are price-sensitive and value low priced
tickets. However, a number of other factors also may play a role in the choice of LCC
such as service level, safety programs, and safety evidence. These factors can be an
inhibiting factor in the choice of LCC since consumers may perceive them to be less ideal
than FSCs. However, no prior research has directly examined and empirically tested all
of these factors. In order to fully understand how passengers decide to choose an LCC, it
is important to study the issue from a multi-dimensional point of view, although it is not
realistic to cover all possible factors since the number of possible decision points is far
too large. Finally, despite the rapid growth of LCCs in South East Asia and especially
Thailand, adequate studies have not been conducted in this growing market.
Purpose Statement
The purpose of this research was to investigate factors influencing the selection of
airlines in Thailand from the passenger point of view based on research at Suvarnabhumi
International Airport (BKK) and Don Mueng International Airport (the airport only for
LCCs).
Research Questions
The specific research questions include:
What factors influence passengers’ airline selection toward LCCs in
Thailand’s airports?
9
How do these factors affect passengers’ airline selection toward LCCs in
Thailand’s airports?
Hypotheses
H1: Consumer’s attitude is positively related to consumer buying intention
toward LCCs.
H2: Social norms are positively related to consumer buying intention toward
LCCs.
H3: Perceived behavioral control is positively related to consumer buying
intention toward LCCs.
H4: Airline reputation has a positive influence on consumer‘s attitude.
H5: Airline reputation has a positive influence on consumer buying intention
toward LCCs.
H6: Price has a positive influence on consumer buying intention toward
LCCs.
H7: Airline service quality has a positive influence on consumer buying
intention toward LCCs
H8: Airline safety has a positive influence on consumer buying intention
toward LCCs.
H9: Route availability and convenience has a positive influence on consumer
buying intention toward LCCs.
H10: Frequent flier programs have positive influence on consumer buying
intention toward LCCs.
10
H11: Buying intention is positively related to consumer buying behavior
toward LCCs.
Significance of the Study
This research has significant contributions for academic and business readers,
specifically contributing to knowledge about consumer motivations of low-cost carriers.
The main focus of this study was to examine consumer views on LCCs and factors that
lead to their decision to select an LCC. Under a rational economic model, the only reason
for the consumer to accept the reduced package of services associated with the LCC is the
reduction in price. Many airlines operate on that assumption as well and attempt to
compete solely on price (Civil Aviation Authority, 2006). However, passengers make
their LCC selection decision based on various factors.
By examining the factors in the choice of LCC selection in Thailand, this research
also helps show what factors play a role for consumers in developing countries. It is
already known that LCC passengers are not always entirely driven by price differences –
for example, a comparison of factors for Irish and Malaysian LCCs and FSCs showed that
price was more important for passengers on the Irish airlines (O'Connell & Williams,
2005). It is reasonable to consider the idea that Asian passengers and passengers in
developing countries may have different decision processes or a different set of factors
than those in Western countries, where most such research has been performed. This is
one of the main gaps in the research, despite the predominance of low-cost carriers in
developing countries. Thus, this research could potentially be of value to the academic
literature since most extant literature focuses on the economic decision (price), while
ignoring the other consumer decision factors involved. The results of this study may also
11
be useful for airlines operating in Thailand by helping to identify issues and factors in the
passenger selection of LCCs. This information could be used to refine services and
business practices, potentially making companies more competitive. It could also help
new entrants into the market through the description of consumer requirements for LCCs.
Delimitations
The research collected data from Thailand because this limits the effect of route
and destination issues and airline availability. Airline passengers face a two-stage
decision process. The first stage beings points of origin and destination, and the second
stage being the choice of airline (Hess & Polak, 2006). Since all passengers leaving from
Suvarnabhumi International Airport (BKK) have the same choice of airlines and routes,
this reduces the influence of the two-stage choice process by ensuring one stage (the
destination point) is already decided. The research included passengers on domestic and
international flights to all destinations originating from BKK.
Several choices could have been made in this study that were not examined. The
target respondent was a traveler departing from Bangkok, including both international and
domestic passengers of all nationalities. This limitation was placed for practical reasons,
namely to facilitate data collection since it is the country’s largest airport and handles the
largest bulk of Thailand’s air travel (AOT, 2014). BKK is likely to yield the most
generalized and pertinent information while controlling travel costs.
The literature review only focused on the factors involved in LCC travel and not
those involved in all air travel. The body of knowledge regarding full-service airline
travel is deeper in the literature, owing to it being an older business model. However, it
12
does not take into account the relatively recent introduction of LCCs, which could have
changed the consumer decision process. As a result, only more recent literature was
included that dates from the formation of LCCs.
Limitations and Assumptions
There were a number of assumptions that were made when conducting this
research. One of these assumptions was that consumers in Thailand have similar
consumer decision processes to those described in the literature (especially those in other
domains of consumer study in Thailand and other countries in Southeast Asia). This was
a reasonable assumption considering the research surrounding the theory of planned
behavior (TPB), which forms the basis of the theoretical model of this research.
Specifically, the TPB has been shown to be an accurate representation of decision-making
in different cultures (Ajzen, 2005). A second assumption was that consumers have
mainly made their own travel decisions, and thus they were responsible for the choice of
an LCC. This may not have applied in some cases, such as business travelers whose
tickets are booked by third parties, but since LCCs do not use secondary sales channels
(Sabre, 2010), most consumers will have made an active choice for an LCC.
The cross-sectional nature of the research could be a limitation given the rapid
growth of the LCC sector in Thailand. However, this was only likely to affect the study
after some years, so it would need to be repeated but does not present an immediate
challenge to generalizability. A second limitation was that this study does not compare
the factors in the choice of LCCs to the choice of FSCs. This limitation was outside the
13
scope of this research (as explained in the delimitations above), but it did mean that only
a limited number of assertions could be made.
Definition of Terms
Brand reputation is the position a company brand occupies.
Consumer attitude refers to individual motivation which can be positive or
negative (Ajzen, 1991).
Consumer buying intention refers to the individuals’ intentions to perform a
certain behavior (Ajzen, 2005).
Perceived behavioral control refers to the person’s perception of the ease or
difficulty of performing a particular action (Ajzen, 1991).
Price is the amount of money expected, required, or given in payment for
something (Business Dictionary, 2014).
Safety system is the managerial system for managing, monitoring, and controlling
safety and security throughout the firm (Galotti et al., 2006).
Service quality refers to the difference between the level of service that is
expected from consumers and the perception of the service that is actually
received (Caruana, 2002).
Subjective norms refers to impacts or pressures from social group of references
such as friends, family, and people around them toward their intention (Ajzen,
1991).
Theory of planned behavior is a model that can be used to examine the intention
of a person to engage in a specific behavior (Ajzen, 1991).

14
List of Acronyms
AOT Airport Authority of Thailand
BI Buying intention
CFA Confirmatory factor analysis
EFA Exploratory factor analysis
FAA Federal Aviation Administration (USA)
FNSA Full network service airline
FSC Full service carrier
ICAO International Civil Aviation Organization
LCC Low cost carrier
PBC Perceived behavioral control
PCE Perceived consumer effectiveness
RQ Relationship quality
SEM Structural equation modeling
SN Subjective norms
TAM Technology Acceptance Model
TPB Theory of Planned Behavior
TRA Theory of Reasoned Action

15
CHAPTER II
REVIEW OF THE RELEVANT LITERATURE
This chapter includes four key sections. First, the basic idea of LCCs is examined
followed by previous studies on selection of LCCs. Next, the theoretical basis of the
research (consumer decisions and the theory of planned behavior) is discussed. The bulk
of the chapter is devoted to identifying key factors in airline selection based on previous
research. Finally, this literature is brought together to state hypotheses and propose a
research framework for use in the present study.
Low-cost carriers (LCCs)
The main industry sector in this study is the LCC. LCCs are no-frills airlines that
focus on cost leadership, rather than a service experience, for short-haul and medium-haul
routes (Vidovic, Stimac, & Vince, 2013). This can be contrasted to the full network
service airlines (FNSAs) which typically operate hub-and-spoke network services,
coordinate with other carriers, and offer higher and differentiated service classes.
Vidovic et al. (2013) identify the third major airline business model as the charter airline,
which offers unscheduled (charter) services to various destinations, typically in
conjunction with holiday or tour operators.
The LCC business model is typified by several cost reduction strategies (Vidovic
et al., 2013). One cost reduction strategy is using a new, homogeneous fleet of medium-
range, medium-size aircraft (like Airbus A320 or Boeing 737), which enables the airline
to reduce its operational and maintenance costs as well as realizing economies of scale.
Other cost reduction and increased revenues include increased seat density, single-class
16
service, elimination of on-board amenities such as free food and drink, and charging for
ground amenities like check-in or checked baggage. Furthermore, the LCC typically
operates short-haul or medium-haul routes directly between destinations and often uses
secondary destinations, such as smaller airports within a city or smaller cities located near
major cities (Vidovic et al., 2013). These differences can result in 50% reduction in per-
passenger costs, which are then passed on in the form of lower fares.
Asia is one of the fastest-growing regions for LCCs with fierce competition
between national and regional competitors such as LionAir (Indonesia) and AirAsia
(Bland, 2014). Part of this growth can be attributed to current under-service of large parts
of Asia, despite its large population. However, the price of LCCs is also attractive in the
region, with FNLCs rapidly losing ground to their lower-priced competitors (Bland,
2014). This has resulted in rapid growth of LCCs in many countries, including Thailand.
Thai LCC passengers (including international and domestic flights) have increased from
about 10 million in 2009 to more than 20 million in 2012 (AOT, 2014). This market
grew even more rapidly in 2013, with a recorded of more than 26 million passenger in the
LCC segment (CAPA, 2014). Major LCCs in Thailand include Thai AirAsia, Nok Air,
and Thai Lion Air (CAPA, 2014). Thai AirAsia reached 10.5 million passengers in 2013,
including 4.1 million international and 6.5 million domestic passengers (CAPA, 2014).
Currently, political unrest is causing uncertainty in the LCC market, but the market is still
expected to keep growing (CAPA, 2014).
17
LCCs and Airline Selection
Some previous studies have been conducted on consumer choice of low-cost
carriers. However, since most of these studies focus on price and service quality as well
as Western LCC passengers, this research area still has room for improvement. In
particular, few studies of LCCs and passenger choice in Thailand have been conducted.
This section expands on the brief discussion of the existing literature in Chapter 1, further
examining the methods and findings of the studies reported earlier.
Some studies have focused on perceptions of LCCs, often in comparison to their
perception of full-service airlines, and the impact of perceptions on airline choice. One
study examined cross-cultural perceptions across four airlines: Ryanair, Aer Lingus,
AirAsia and Malaysia Airlines (O'Connell & Williams, 2005). The authors used a survey
of LCC and full-service passengers. The main reason for choosing an LCC (65%) was
the lower price of LCCs compared to full-service airlines. However, 65% of LCC
passengers also did not check the cost of the ticket, which suggests that the LCC’s lower
cost may be perceived instead of actual. An exploratory study in China suggested that
perception of the service levels of the airline influenced the choice of a full-service airline
but had much less influence on the LCC (Chiou & Chen, 2010). Instead, Chinese LCC
passengers preferred service value perceptions (Chiou & Chen, 2010). A study in South
Africa suggests that these perceptions may be limited in their usefulness (Diggines,
2010). This study used a questionnaire of airport passengers in Cape Town and
Johannesburg. It found that most passengers actually do not perceive much difference
between LCCs and FSCs except for price. One study compared passengers on LCC and
FSC routes between Taipei and Singapore (Chang & Hung, 2013). Chang and Hung
18
(2013) (n = 338 business passengers) used a survey approach to collect data about the
factors that encouraged and discouraged the consumer selection of LCCs. Price was
found to be a significant positive factor in the selection of LCCs, with the lower cost
associated with LCCs encouraging selection. Convenient booking also influences the
selection of LCCs. However, the safety considerations factor can reduce the intention to
select LCCs (along with airline image). Another group of authors studied passenger LCC
choice in Turkey (Atalık & Özel, 2007). This study surveyed passengers of Pegasus
Airlines (n = 100). It found that the most important factors in choice of LCC included
price, schedule convenience, on-time performance, and safety. Factors that were not as
important were found to be travel agent recommendations, type of aircraft, and food and
drink (Atalık & Özel, 2007). Factors including the origin-destination pair, the need to
transfer, the duration of the trip, and weekend travel can also influence the choice of
LCCs (Castillo-Manzano & Marchena-Gómez, 2010). A study from Malaysia had
similar findings (Ong & Tan, 2010). This study found that desire to control routes and
bookings as well as journey purpose and booking method were determining factors in
choice of LCC.
Some studies have examined consumer behavior in regard to LCCs and full-
service airlines. For example, one study examined records held by the U.S. Department
of Transportation and determined that LCC passengers were actually less likely to
complain about service quality than full-service airlines passengers (Wittman, 2014). The
authors attributed this to lower service expectations, lack of information about how to
complain, or differences in qualitative service perceptions (Wittman, 2014). Another
study found that LCC passengers were more price-sensitive than full-service passengers;

19
while LCC passengers would readily switch airlines for a cheaper ticket; this was not the
case for full-service passengers (Diggines, 2010). A third study found that price offered
the highest utility for airline passengers, while direct itineraries between destinations was
the second most important (van Eggermond, 2007). This study used a complex
methodology and a sociological framework (network analysis and actor network theory),
making it difficult to directly apply the method used in this study. Finally, a study of
passenger loyalty for German full-service airlines and LCCs identified two key factors in
the formation of passenger loyalty for both airline business models: service quality and
price satisfaction (Mikulic & Prebezak, 2011).
One area that has not been successful is demographic variable profiling. For
example, an attempt to profile LCC passengers in Spain did not find any significant
demographic or behavioral differences from full-service airlines passengers except
nationality (non-Spanish) and frequent travelers who have taken more than 12 flight in
one year (Castillo-Manzano & Marchena-Gómez, 2010). This was also true for
passengers traveling on AirAsia and Malaysia Airlines from Penang International Airport
in Malaysia (Ong & Tan, 2010).
This research has shown both an active area of research and some research gaps.
Some of the most important issues in terms of research gap are an over-intensive focus on
price and a lack of focus on Asian carriers (especially Thai carriers). As one study has
shown, Asian passengers view price as a less important factor in the choice of LCC over
full-service airlines than European passengers (O'Connell & Williams, 2005). However,
the reasons for these perceptions have not been examined in detail. Additionally, the
LCC choice for Thai passengers has not been investigated. The lack of empirical
20
information on LCC choice generally, as well as in Thai passengers, indicates that referral
to theories of consumer choice and consumer decision-making would be helpful. The
following section identifies critical theories and how they apply to the current study.
Foundational Theories
The summary of empirical studies in the preceding section has provided a wide-
ranging and seemingly disparate selection of factors in the choice of LCCs, including
price, consumer demographics (though this area is under-examined), perceptions of safety
and service, and so on. In order to draw a unifying theme between these theories, the
literature has been examined to identify foundational theories that can explain consumer
choice in the domain of LCCs. A theoretical basis will help make sure the study is
grounded in a broader understanding of the context and individual and social processes
that inform consumer decisions.
Two foundational theories are relevant for this research. These theories include 1)
the consumer decision model and buying behavior, and 2) the TPB. Theories related to
the consumer decision and buying behavior were selected because the choice of LCC is a
consumer decision, and, therefore, is expected to be consistent with other, similar
consumer decisions. The TPB was selected because it has been shown to be generally
reliable for understanding the decision-making process in consumer and other domains
(Ajzen, 2005). These two theories are related because while the consumer decision and
buying behavior model explains the type of decision to be made, the TPB explains the
process by which consumer decisions are made (Bray, 2008). Both the consumer
decision process model and the TPB are cognitive models, which relate the external
21
situation and stimuli of the consumer, their internal processes and previous learning
(cognition), and the eventual outcomes (Bray, 2008). By using both models, it is possible
to take into account the external stimuli (from the buying behavior process) and the
consumers’ internal cognitions and emotional states as well as prior learning (through the
TPB) to understand the full decision. These foundational theories are discussed next.
Consumer decision and buying behavior. The basis of this research is the
consumer decision. The consumer decision can be understood first as the choice to
purchase goods or services, and then as the choice of which of a set of available goods or
services will meet the consumer’s needs (Lantos, 2010). While this evaluation may be
simple if the need is relatively straightforward, in other situations it becomes highly
complex (Lantos, 2010). For example, situations where the purchase is high-involvement
(expensive, heavily loaded with social or emotional meaning, or complex and requiring a
lot of assessment and/or technical understanding) are typically situations where the
consumer decision becomes far more complicated (Dahlen, Lange, & Smith, 2010). Most
purchases are low-involvement, meaning they are inexpensive, simple, habitual, and do
not have any particular social or status implications (Dahlen et al., 2010). Other factors
can influence the consumer buying decision, such as culture and income (Lantos, 2010).
Other factors, like availability of alternatives, price, and other external factors, can also
affect the consumer decision.
Although consumer decision processes vary, a common model of the decision
process is a five-stage model (Lantos, 2010). The stages of this model include:
22
Problem recognition: The consumer identifies a problem or a gap between their
current state and their desired state. This gap can be caused by needs (such as use
or wear and tear on an existing item, boredom with existing items, or changed
financial status) or opportunities (such as release of a new class of product, life
changes, or reaction to external stimulus).
Search for solution: The consumer searches out solutions that could fill the need.
They may rely on what they already know or products they already own (internal
search), or seek recommendations, marketing, or reviews (external search).
Alternative evaluation: The consumer evaluates the alternatives identified against
a set of criteria (such as price, aesthetics, previous satisfaction, and social and
status meanings) to determine how well each alternative will fill his or her need.
Selection and purchase: The consumer selects the best alternative and purchases.
Often, the consumer may be satisficing rather than satisfying their need – that is,
choosing the solution that is “good enough” rather than holding out for a perfect
solution.
Post-purchase evaluation and action: The consumer assesses the outcome of the
purchase against the ideal state. If there is still a gap, he or she may be
dissatisfied and make actions like complaining or making a different purchase. If
the gap is filled, he or she is likely to be satisfied and make actions like
recommending and repurchasing.
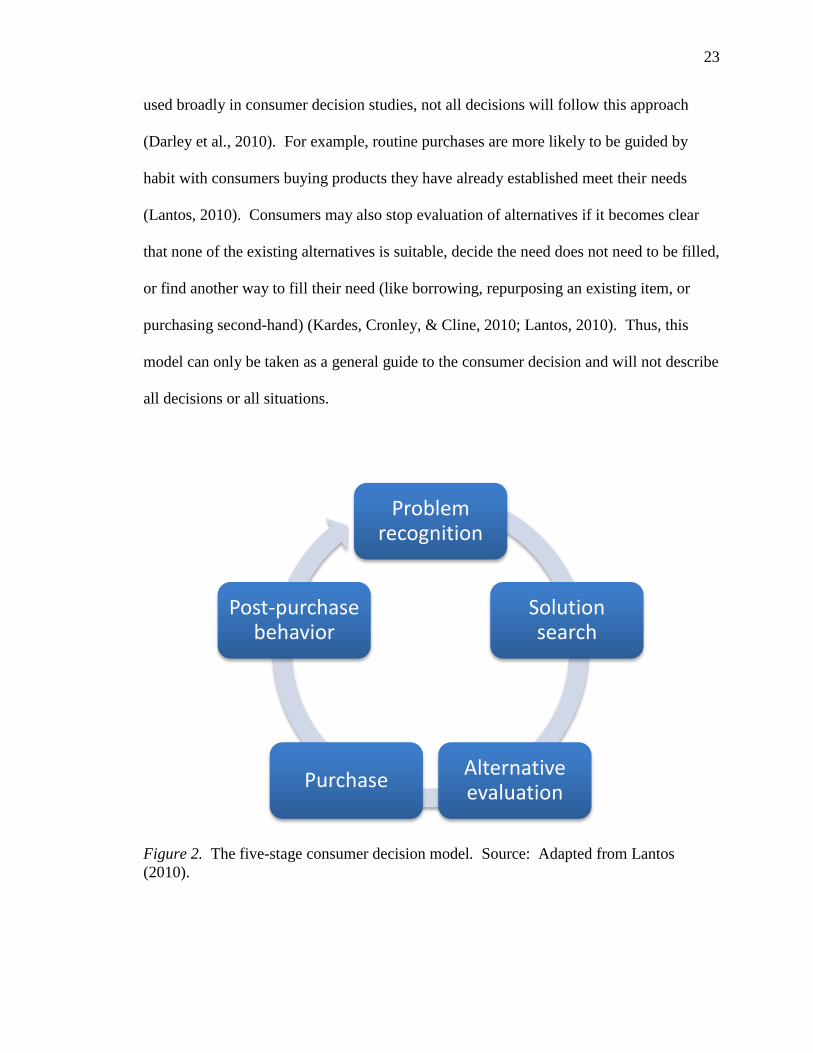
Figure 2 summarizes the five-stage model. However, it should be noted that this
is an idealized model, rather than an explanatory model for every purchase (Darley,
Blankson, & Luethge, 2010). This means that although the model is widely accepted and
23
used broadly in consumer decision studies, not all decisions will follow this approach
(Darley et al., 2010). For example, routine purchases are more likely to be guided by
habit with consumers buying products they have already established meet their needs
(Lantos, 2010). Consumers may also stop evaluation of alternatives if it becomes clear
that none of the existing alternatives is suitable, decide the need does not need to be filled,
or find another way to fill their need (like borrowing, repurposing an existing item, or
purchasing second-hand) (Kardes, Cronley, & Cline, 2010; Lantos, 2010). Thus, this
model can only be taken as a general guide to the consumer decision and will not describe
all decisions or all situations.
Figure 2. The five-stage consumer decision model. Source: Adapted from Lantos
(2010).
Problem recognition
Solution search
Alternative evaluation
Purchase
Post-purchase behavior

24
The consumer decision model is relevant for this research because the decision to
purchase an airline ticket (as well as which airline ticket to purchase) is a consumer
decision. In this case, it may be understood as a high-involvement decision since it
involves a potentially risky activity, can be expensive, and requires some research and
pre-planning, which are characteristics of high-involvement decisions (Lantos, 2010).
Since this is the case, it is likely that consumers will go through all five stages of the
consumer decision unless they are frequent travelers who already have established airline
preferences (Kardes et al., 2010). This makes the consumer decision model relevant
because it identifies the issues and factors involved in the consumer decision, including
the external factors as well as internal cognitive processes of decision-making (Lantos,
2010). This makes it a highly relevant model for understanding the consumer decision
for LCCs. However, the stage model is not in itself enough to understand the consumer
decision because it only addresses the process associated with the decision. It is also
necessary to take into account the external and internal stimuli that cause the consumer to
make a decision at all, as well as to make a particular decision (Bray, 2008). This dual
approach is acknowledged to be highly useful for understanding the consumer decision.
Consideration of external stimuli and internal states is the reason for including the TPB,
which is a prescriptive model that identifies these specific factors (Bray, 2008). The use
of both models will add depth and explanatory power, while the use of only one will
eliminate some of the possible insights that could be gained.
TPB. The theoretical basis for understanding the consumer decision for LCCs is
the TPB. The TPB is an attitude-behavioral model, which explains individual behaviors
25
as a result of attitudes (Ajzen, 2005). Attitude can be a difficult concept to define, and in
fact the definition has changed significantly during the period the TPB and its predecessor
models have been in place (Ostrom, 2014). Today, attitude can be defined as “a person’s
evaluation of an object of thought” (Pratkanis, 2014, p. 72). This evaluation can occur on
a number of different bases including external information, previous experience, or
application of related experience. Attitudes can also be formed through cognitive
(thought) or affective (emotion) processes or through social influences (Pratkanis, 2014).
The TPB model states that various kinds of attitudes are one of the main factors in
individuals forming behavioral intentions, which are then followed by behaviors (Ajzen,
2005).
In this section, the history and development of the TPB model is discussed,
followed by an assessment of its purpose and components and relationships. This is
followed by an assessment of its effectiveness and discussion of application to this study
and an examination of the use of TPB in related areas. External variables will then be
identified that can be included to improve the predictive capability of the model.
History and development of the TPB. The TPB was developed from earlier
attitude-behavioral models developed throughout the 20th century. Attitude-behavioral
models have a long history beginning with theorists such as Allport (1935, cited in
Ostrom, 2014), who argued that attitudes were precipitating factors to encourage specific
actions. However, the main relationships that the TPB uses were established with
formalization of attitudinal-behavior models in the 1960s and 1970s (Ajzen & Fishbein,
1977). The definition of attitude in use at the time, as well as a lack of additional
26
variables, meant that the early attitude-behavioral models only had strong predictive
power in situations that tended to provoke very strong attitudes (Ajzen & Fishbein, 1977).
The theory of reasoned action (TRA) was proposed during the late 1970s in order
to try to improve the explanatory and predictive power of attitude-behavioral actions
(Ajzen & Fishbein, 1980). The TRA added subjective norms (SN), which introduced the
problem of social attitudes rather than the purely internal individual attitudes. It also
added the behavioral intention as an intermediate outcome; the reasoning for this is that
the important factor is formation of behavioral intentions which might not be followed by
actual actions for a number of reasons (Ajzen & Fishbein, 1980).
The TPB was proposed as an extension to the TRA, maintaining the existing
components relationships and adding a third variable of perceived behavioral control
(PCB) (Ajzen, 1991). PCB was modeled to affect both outcomes (behavioral intentions
and actual intentions). A meta-analysis of the earliest research showed that the TPB did
increase predictive power compared to the TRA, especially when the decision-maker had
a significant control issue or potential control issue (Madden, Ellen, & Ajzen, 1992). The
TPB was also designed to be readily extensible, allowing researchers to add external
variables to improve predictive capability (Ajzen, 2005).
Purpose of TPB. The purpose of the TPB is to explain actual behaviors of
individuals with respect to behavioral intentions they form (Ajzen, 2005). In turn, these
behavioral intentions are influenced by various kinds of cognitions and emotions related
to attitudes, understanding of social practices and rules (social norms), and how much
control the consumer believes they exercise over the situation (perceived behavioral
27
control) (Ajzen, 2005). The TPB was designed initially to explain health and social
behaviors, but has since been extended to consumer, technology-related, and relational
decisions (Ajzen, 2005). This flexibility is allowed by the model’s open framework. The
TPB allows for ready extension through inclusion of context-appropriate external
variables, which increase the predictive and explanatory value of the model (Ajzen,
2005). Some other models can be used for specific decision processes, such as
technology adoption (Technology Acceptance Model or TAM), and health decisions
(Bosworth et al., 2007; Ho, Hung, & Chen, 2012). TAM is a model that helps investigate
factors that lead to technology adoption such as perceive usefulness, perceived ease of
use, and attitude toward the technology (Ho, Hung, & Chen, 2012). This means that the
main purpose of the TPB is to explain more general decisions, though they can and have
been used for technology and health situations (Ajzen, 2005). This flexibility is the
reason the TPB has been selected for use in this study.
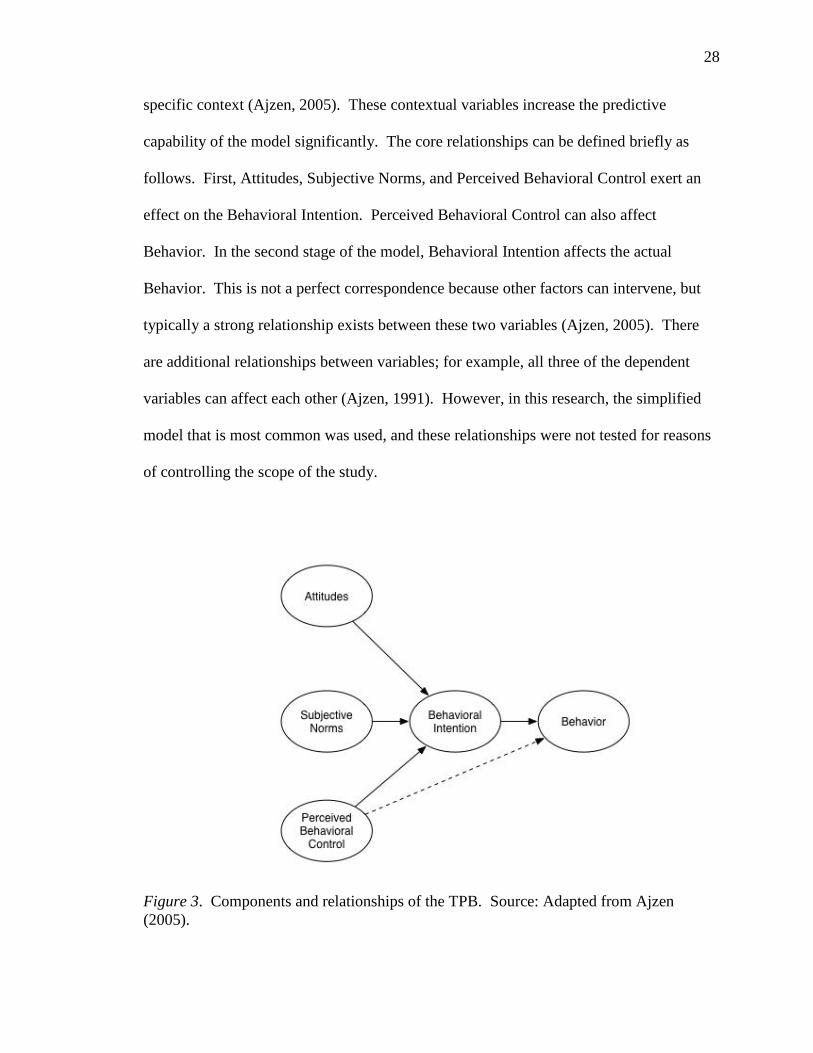
Components and relationships of the TPB. The classical TPB model consists
of five components. Attitudes, Subjective Norms, and Perceived Behavioral Control are
the independent variables, while Behavioral Intention is an intermediate variable (Ajzen,
2005). Behavioral Intention is the outcome variable for the three attitude-related
variables, while it is the predictor variable for the Behavior. See Table 22 in Appendix B
for a brief definition of these components.
Figure 3 shows the relationships between the components in the TPB model.
These are derived from Ajzen (1991, 2005). This model is typically used as the
framework for other studies in the TPB, usually with external variables that provide
28
specific context (Ajzen, 2005). These contextual variables increase the predictive
capability of the model significantly. The core relationships can be defined briefly as
follows. First, Attitudes, Subjective Norms, and Perceived Behavioral Control exert an
effect on the Behavioral Intention. Perceived Behavioral Control can also affect
Behavior. In the second stage of the model, Behavioral Intention affects the actual
Behavior. This is not a perfect correspondence because other factors can intervene, but
typically a strong relationship exists between these two variables (Ajzen, 2005). There
are additional relationships between variables; for example, all three of the dependent
variables can affect each other (Ajzen, 1991). However, in this research, the simplified
model that is most common was used, and these relationships were not tested for reasons
of controlling the scope of the study.
Figure 3. Components and relationships of the TPB. Source: Adapted from Ajzen
(2005).
29
Effectiveness of the TPB. Different rates of effectiveness are associated with the
TPB depending on the situation it is measured within. For example, a general study of
TPB studies showed effectiveness rates between 27% and 39% in predicting actual
behaviors (Armitage & Conner, 2001). A meta-analysis on environmental behaviors
suggested a stronger effect (Klöckner, 2013). This study showed that 36% of general
environmental behavior was predicted by the TPB variables, although the author did state
that more specific behaviors had stronger correlations (Klöckner, 2013). Although some
studies have found up to 70% prediction of the behavioral intention, this usually translates
to somewhat lower actual behavior (around 30% to 40%) (Ajzen, 2005). However, some
studies showed weaker effects. A meta-analysis of studies of health behaviors found that
the rate of behavioral prediction varied between 13.8% and 23.9% on average, depending
on the health behavior tested (McEachan, Conner, Taylor, & Lawton, 2011).
Studies have also compared the TPB to other models. One study already
mentioned found that the TPB had a higher effectiveness rate than the TRA (Madden et
al., 1992). Another study compared the TPB and TAM for online tax services, finding
the additional factors used by the TPB increased predictive outcomes (even though the
TAM is nominally designed to test technology adoption) (Wu & Chen, 2005). Thus,
although the predictive outcomes vary, the TPB is moderately to highly predictive and
often (though not always) outperforms alternative models.
Application of the TPB to this study. The TPB is the appropriate model for this
study because it is a highly-accepted, general-purpose model for predicting behavior
based on existing attitudes and perceptions. Its relatively high predictive value can be
30
increased by adding additional variables that relate to the area of study, as well as
carefully formulating the measured attitudes (Ajzen, 2005). Thus, the already relatively
high predictive capability (perhaps as high as 40%) was enhanced by including additional
external variables. As the next section will show, this model has been used in other
studies related to the subject matter. As a result, the next section of the chapter examines
the literature on airline selection and identifies some of the factors that could be applied
as external variables.
Previous studies of TPB. A wide range of studies have applied the TPB to
various consumer decision situations. In this section, a selection of these studies that
demonstrated a range of techniques and approaches to using the model are shown. While
a preference for airline selection-related studies was used for selection, there were
actually relatively few studies in this area. As a result, the studies used also include
related areas of consumer decision.
Airline choice-related studies. A few studies were strongly related to airline
choice or related areas. One study related to the purchase of airline tickets online (Bigné,
Sanz, Ruiz, & Aldás, 2010). This study used a quantitative study of Internet users who do
not purchase their airline tickets online. It compares the TAM and TPB models and also
included two additional variables (trust and perceived risk). The authors used regression
analysis to identify the relationship between these variables. It found that the TPB
variables including subjective norms and attitudes had a significant impact on the
purchase intention, which was then translated to not buying a ticket online. Perceived
31
behavioral control, as well as perceived risk and trust had an indirect effect on behavioral
intentions through attitudes. This study generally showed that the choice of where to
purchase the airline ticket can be modeled through the use of the TPB.
Other related studies. Since airline choice is a high-involvement decision, other
high-involvement purchases were also examined. One study examined the deliberate
choice of counterfeit luxury consumer products (Penz & Stöttinger, 2005). This study
sampled Austrian consumers (n = 1040), examining why consumers chose to deliberately
buy counterfeit copies of high-involvement luxury goods (such as fashion items). The
study used the TPB as the framework for understanding this choice. It used additional
factors including Self-identity and Personality Traits in order to extend the model. The
authors also distinguished by price, with one scenario using a slightly cheaper bag, and
the other using a significantly cheaper one. They found that Attitudes (Counterfeit
Defender, Embarrassment, and Smart Shopper), Subjective Norms, Perceived Behavioral
Control, and Access to Counterfeits had a significant impact on the decision to purchase a
significantly cheaper counterfeit. A slightly cheaper counterfeit purchase was also
influenced by Self-consciousness but not by Embarrassment.
Another study used the TPB as the basis for examining the attitude-behavior gap
in consumption of sustainable food (Vermeir & Verbeke, 2006). This area is known to be
one where the TPB and other attitude-behavioral models do not work well because a
significant gap exists between positive attitudes and actual intentions. The authors used a
survey (n = 465) to test their model. They found that availability of sustainable food
negatively affected the intention to buy sustainable food, while attitudes and involvement
32
with sustainable food, certainty, and perceived consumer effectiveness (PCE) (a
formulation of perceived behavioral control) positively affected positive decisions. This
study is valuable because it shows some of the reasons the TPB may not be effective,
such as lack of perceived availability. A related study has been conducted on sustainable
tourism behavior, since this area also has a similar attitude-behavior gap (Budeanu,
2007). This study used a secondary approach to examining the existing literature on
attitudes and their effects on consumer behavior. Results revealed a number of different
attitudes related to the choice of decisions. They found that attitudes about holidays (such
as enjoyment and escape) were generally stronger in their impact on holiday destination
choice than environmental sustainability behaviors. However, the authors also noted that
the intention to protect holiday locations (in terms of environment) and intention to visit
are not the same behavioral intention. Thus, the attitude-intention gap could suffer from
some inconsistent measurement of attitudes and other values.
Another study examined the use of credit cards using the TPB (Rutherford &
DeVaney, 2009). This study used a national study (n = 3,476) to test the impact of
attitudes and norms on the credit card convenience users (who pay their credit cards off
immediately). This study identified a number of attitudinal differences between non-
convenience users and convenience users. For example, convenience users were more
likely to plan longer, have higher incomes and believe holding credit was a bad idea.
Revolvers (who carry a balance month to month) have poor risk tolerance and were more
likely to take advice from others and to be late with payments. The study by Rutherford
and DeVaney (2009) is valuable because it shows the importance of having specific
attitudes to measure that are related to the study.
33
A third study used the TPB to examine apparel purchasing behavior (De Canniere,
De Pelsmacker, & Geuens, 2009). The research used a questionnaire distributed in a
popular Belgian apparel retailer and by mail (n = 1,226) in order to test the TPB variables
and the importance of Relationship Quality (RQ) to the purchase decision. RQ variables
tested included Trust, Commitment, and Satisfaction. The outcome showed that the RQ
variables and TPB variables were both important. This study demonstrated the
importance of integrating context-appropriate external variables. It also demonstrated the
ways that additional conceptual frameworks could be integrated into the TPB in order to
increase its predictive capability. Finally, the inclusion of mail respondents showed the
importance of collecting a balanced sample.
A final study examined student intentions for car commuting based on the TPB
(Kerr, Lennon, & Watson, 2010). This study distributed a questionnaire to university
students in Australia (n = 186) about commuting to campus by car. The questionnaire
found that behavioral intention and previous habit were the strongest predictors of actual
car commuting. Subjective norms (especially descriptive norms) and perceived
behavioral control (whether or not the consumer could make another choice) were
significant in the relationship to behavioral intentions, but attitudes were not. This study
is important because it shows that attitudes are not always the strongest factor in the
behavioral decision. However, subjective norms and PCB were still significant
predictors. Thus, it cannot be assumed in the present study that the standard hierarchy of
TPB predictors beginning with attitude will hold; instead, it must be tested independently.
34
Airline Characteristics Influencing Passengers’ Airline Selection
The TPB is a prescriptive model of the consumer decision which addresses the
consumer decision from a particular point of view (Bray, 2008). However, it is widely
acknowledged that the use of prescriptive models needs to take into account the specific
context of the decision being studied, in this case, the specific context of the consumer
decision (Bray, 2008). The TPB is routinely extended with external factors in order to
take into account these external differences in context, which can change the way
consumers respond to specific situations (Ajzen, 2005). This is the point where the five-
stage model of the consumer decision becomes relevant to the study since it posits that
consumers make their decisions based on comparison and analysis of the characteristics
of the choices under consideration (Lantos, 2010). Thus, the inclusion of external
variables is appropriate for extending the TAM and further explaining consumer
behaviors.
The preceding sections above have identified consumer attitudes and behaviors
that influence the passengers’ airline selection. However, it is clear that the consumer
bases this decision on a perception of what the airline itself offers. The consumer
decision process indicates that the airline is assessed and weighed based on its
characteristics and how well these characteristics meet the consumers’ need prior to
making a choice (Lantos, 2010). This decision is made based on congruence between the
consumer’s needs and the airline’s characteristics, although passengers may not demand
full satisfaction on all points (Lantos, 2010). This raises the question of which
characteristics of the airline influence the consumer decision and how this influence can
be measured and studied.
35
The final aspect of this research is identifying factors that influence airline
passenger selection. These factors can come from the academic literature on FSCs or
LCCs, though preference has been given to previous research on LCCs. Evidence from
all regions and countries is included for depth. While not all of these factors were tested
in the current research due to scope considerations and practical limitations, this section
provides an overview of how passengers may select a particular airline, which will inform
and contextualize the remainder of the research. Airline characteristics that have the most
support in the literature include price, service quality, airline reputation, safety, route
availability and convenience, and frequent flier programs. These factors are discussed
next and were included in the research framework. However, some factors were not
included. Specifically, passenger characteristics (demographics) were excluded from the
scope of this study because research has consistently shown that this is only sporadically
important, and with limited effect for airline choice (Castillo-Manzano & Marchena-
Gómez, 2010; Ong & Tan, 2010). These factors were discussed only briefly in order to
demonstrate that they are not likely to be relevant to this study.
Price. The first airline characteristic considered is price. Price is an obvious
candidate for choice of airline, especially given the variance of as much as 50% between
LCCs and FSCs. A theoretical economic study of passenger airline choice showed that
price was one of the main determinants of airline choice (though airlines did not respond
by reducing the cost of airline tickets, but instead by increasing safety and convenience)
(Jou, Ham, Hensher, Chen, & Kuo, 2008). This finding was in the context of additional
market entrants, such as LCCs. Thus, it is particularly relevant for the current study.
36
The theoretical position of price as a major factor in airline choice is also
supported by empirical studies. One study found that it was one of the most important
factors in airline choice (Dolnicar, Grabler, Grun, & Kulnig, 2011). This study, which
surveyed a group of airline passengers (n = 687) found that price was the second most
important factor in the formation of passenger loyalty (or whether or not the passenger
repeatedly chose to fly the same airline). Park (2007) also found that price was one of the
main determining factors of airlines for Korean and Australian passengers, especially as
compared to the perceived service received. A study of airline passengers in multi-airport
regions (Hong Kong) found that price was the most important factor in selection of the
departing airport and destination (Loo, 2008). This study shows that the price of the
ticket can actually be the supportive factor for the first stage of the decision as well as the
second stage (Loo, 2008). Another study of LCCs confirmed the importance of price in
the choice of LCCs (Davison & Ryley, 2010). This sample (n = 361 travelers in the West
Midlands of England) examined destination preferences for LCC travelers. The study
showed that LCC travelers were highly price-sensitive and selected destinations based
partly on the price of the trip and associated destination costs. This price sensitivity is
viewed as being indicative of the need to balance tight household budgets with the desire
for family holidays in interesting destinations.
A recent study on LCC choice examined the impact of low prices and low service
quality promises in Malaysian LCC travelers (Chan, 2014). In this study, the sample had
previously traveled on LCCs. The study examined the impact of two factors, including
low price (non-promotional low prices) and low service quality experience. Chan (2014)
found that quality problems that caused dissatisfaction included cramped cabins, poor
37
seating, and crowding, but dissatisfaction did not persist in the face of low prices. Low
prices were associated with increased satisfaction, and consumer quality expectations
were low and easily met. This suggests that while service quality does influence the
consumer’s choice of LCC, it may not be as strong an influence as price.
Although it might be assumed that price is the determining factor in LCC choice,
in fact this is not always the case. A study of Irish and Malaysian full-service and LCC
airlines found that while price was a major factor for the Irish airlines, this was not the
case for Malaysian airlines (O'Connell & Williams, 2005). Instead, the Malaysian airline
passengers were more driven by factors like service quality (although price was also
important). A study of South African passengers suggested that LCC passengers were
highly price-sensitive and would readily switch to a full-service airline if the price was
lower (Diggines, 2010). However, passengers on full-service airlines were price-
insensitive and were reluctant to switch even in cases where the price was up to 30% less.
This study also showed that LCC passengers did not search out more information or
compare prices before choosing their airline (Diggines, 2010). A second study of South
African passengers revealed that full-service and LCC passengers ranked price as being
about the same level of importance (Fourie & Lubbe, 2006). This finding does contradict
previous studies which indicated that price was a major difference between LCC and full-
service airlines (Fourie & Lubbe, 2006). A study of airline choice in the San Francisco
Bay Area found that fare prices were important, but that these factors were also affected
by the two-stage decision of flight origin (as the region has several major airports) and
route convenience (Hess & Polak, 2006).
38
Additionally, not all kinds of passengers are driven primarily by price in their
ticket selection. For example, business passengers (especially those traveling on centrally
arranged itineraries) may have little knowledge or control over prices of their tickets
(Evangelho, Huse, & Linhares, 2005). Instead, these passengers are likely to select their
flights based on factors like frequent flier programs or schedule convenience. Corporate
cultures, especially in larger organizations, may also encourage business passengers to
select more expensive tickets without regard to cost (Evangelho et al., 2005). This is
contrary to leisure travelers, for whom price is often (though not always) highly
important.
The dominance of price as a factor in airline choice, and a factor in the
differentiation between LCCs and FSCs, means it must be included in the present study.
This is true even though it is a complex relationship and may not actually be the most
important factor for some classes of travelers. However, this is not likely to be the only
factor, and as a result, a number of other factors will also be included, as discussed next.
Service quality. The second airline characteristic that is considered is airline
service quality. A number of aspects of service quality influence airline choice. These
include on-time performance (departure and arrival), ground services (check-in, baggage
handling, and boarding/disembarking), and in-flight services (such as food and drink
service, comfort, and personnel behavior). A study by Jou et al. (2008) suggested that
service comprehensiveness was a major factor in airline passenger choice. Thus, this is
likely to be a more complex measurement than price.
39
Empirical research supports the importance of service quality. A study using the
SERVQUAL model showed that responsiveness is the most important element of service
quality for passenger choice (Huang, 2009). SERVQUAL model is used for measuring
service quality (Huang, 2009). This suggests that airline passengers do have specific
requirements for service quality despite the class of service. However, there are
differences in service quality perceptions among passengers based on their service class,
flight frequency, and airline (Park, 2007). This shows that flight service is a major factor
in airline choice, although as the studies discussed next show, measuring this can be
complicated.
Typically, studies show that a combination of service factors are important. For
example, a study of Pegasus Air (a Turkish LCC) found that on-time service was the
second-most important factor in the choice of airlines (Atalık & Özel, 2007). The authors
also found that in-air services such as food and drink, comfort, and personnel behavior
were moderately important (Atalık & Özel, 2007). A study of Chinese passengers found
that important services included on-time operation (one of the most important factors) and
accurate baggage handling (Zhang, 2011). On-time performance was a significant factor
for business passengers especially, who would pay extra for guaranteed on-time
performance (Zhang, 2011). South African business passengers also found in-flight
service and ground service (especially lounge availability) a major factor in airline
choice, which tended to draw business passengers away from LCCs (Fourie & Lubbe,
2006). Park (2007) showed that in-flight service, airline service, employee service, on-
time operation, and overall service quality were important factors in the choice of airline.
40
Thus, it is not just one kind of service that is important; instead, the consumer considers
the entire range of ground and air services offered by the airline.
Studies have also shown that consumers are willing to pay more for some services
than for others (meaning they are more likely to have an impact on the LCC service
quality perception). For example, one study found that consumers were most willing to
pay extra for meal services, followed by booking flexibility (being able to change their
tickets) (Chen & Wu, 2009). Expanded booking channels and entertainment services
were much less important (Chen & Wu, 2009). A second choice experiment showed that
LCC passengers would pay for service quality enhancements, including food and drink
service, improved seating, and entertainment, above the cost of their ticket (Balcolme,
Fraser, & Harris, 2009). However, a third study on willingness-to-pay suggests that
passenger willingness to pay depends on the price initially paid for the ticket (Martín,
Román, & Espino, 2008). Thus, the extent of willingness-to-pay for increased service
levels may vary depending on the type of airline.
Not all studies support the importance of service quality, especially for LCCs.
Some studies have suggested that the lower cost of LCCs may encourage lower service
quality expectations, although this is not certain (Wittman, 2014). However, other studies
have suggested that LCC passengers also have service expectations that must be met
(Zhang, 2011). Other studies have suggested that previous service failures do not
necessarily influence future airline choice (Suzuki, 2004). However, it should be noted
that this study (Suzuki, 2004) took place in a rural region that is not served by a lot of
airlines, which could limit the amount of consideration passengers can give to service
quality compared to other factors.
41
Although service quality is complex to measure, it is clearly a factor in airline
choice. It also distinguishes between LCCs and FSCs, since LCCs have lower service
offerings than FSCs. For this reason, service quality was included in the final study.
Airline reputation. The third airline characteristic considered in this current
study is airline reputation. Corporate reputation can be defined as the perception of the
consumer about the airline’s general operation, safety, and other factors (Graham &
Bansal, 2007). A number of distinct factors influence the corporate reputation of an
airline. These include (at least) financial performance, safety endorsements (such as the
FAA in the United States), size and age of the airline, and safety record (particularly
recent incidents) (Graham & Bansal, 2007). Of these factors, endorsements, no crashes
within the past year, and financial performance were the strongest factors in a regression
on reputation (r2 = 0.60) in Graham and Bansal’s (2007) study of airline passengers (n =
568). This study also examined consumer willingness to pay based on airline reputation
and it found an increased willingness-to-pay for these aspects of the airline’s reputation.
For example, an FAA operational safety endorsement increased the price the passenger
was willing to pay by $36 (Graham & Bansal, 2007). Overall, a 1% increase in airline
reputation assessment increased the ticket price the consumer was willing to pay by $18
(Graham & Bansal, 2007). Graham and Bansal (2007) did not directly examine the
influence of airline reputation in passenger choice, but since it does determine how much
a consumer is willing to pay, this is likely to be related.
The airline’s public reputation or image contributes to the choice of the airline
according to a number of empirical studies. For example, one study found it was a
42
moderately important factor in airline choice (Atalık & Özel, 2007). A second study
found that reputation (as perceived by social reference groups such as friends and family)
was a major factor in behavioral loyalty or repeated airline choice (Dolnicar et al., 2011).
National carriers, which were perceived to have a better reputation than regional or local
carriers, also increased loyalty based on this study (Dolnicar et al., 2011). However, not
all studies have supported the importance of airline reputation or brand image. For
example, a study of Chinese passengers found that these passengers were far more
concerned about on-time performance than airline reputation otherwise (Zhang, 2011).
This study also found that Chinese domestic carriers did not generally have strong brand
identities or significant public reputations (Zhang, 2011). A study in Saudi Arabia,
however, identified airline reputation as one of a cluster of factors that were related to the
consumer’s airline choice (Bukhari, Ghoneim, & Dennis, 2012). This study focused on a
specific distribution channel (online sales). The authors used airline reputation because it
is one of the main signals passengers have about the airline’s reliability and credibility,
particularly in online sales. Their research model was based on the TAM components,
making it similar to the current study. The authors found that airline reputation was
highly correlated with other factors such as perceived ease of use and perceived
usefulness. Furthermore, airline reputation is also a factor in the selection of package
deals from tour operators regardless of destination or other factors, according to a study
of online travel sales (Chiam & Soutar, 2009). This study revealed that airline reputation
is one of the few external signals available to the passenger about the quality of the tour.
Thus, along with price and some other factors, this is one of the main choice factors for
43
online tour packages. This is consistent with findings from Bukhari et al. (2012) about
the importance of reputation cues in an online world.
Passenger perceptions of the reputation of an airline are integral with its safety
record and procedures, prices, and service quality. The research described previously
highlights the complex relationship between airline reputation and airline choice.
However, the research does generally support the inclusion of this factor in the current
research. This could be particularly important for Thailand (although research in this area
is lacking) because of the widely varying reputation of LCCs in the market, including
some that are considered to have a very poor reputation.
Airline safety. The fourth airline characteristic is airline safety. Airline safety is
a factor in the choice of LCCs. A theoretical study determined that airline safety was one
of the main factors in the choice of airline in the Chinese market (Jou et al., 2008). This
study also showed that airlines responded to safety demands by making safety
improvements and marketing them in order to inform consumers about them (Jou et al.,
2008). Airline safety is also one of the major components of airline reputation (Graham
& Bansal, 2007). In fact, it is one of the most important components, both on its own and
when recognized by external endorsement from a safety agency such as the FAA
(Graham & Bansal, 2007). In general, airline safety is increasing with a reduction in the
rate of accidents despite a significant increase in passenger figures since the 1970s
(Barros, Faria, & Gil-Alana, 2010). This is probably due to improved engineering and
airline safety improvements because of increased competition. Thus, it can be expected
that airline safety will play a role in airline choice.
44
Despite the importance of airline safety, only a few studies have examined it as a
factor in airline choice. This makes it difficult to resolve the discrepancies that do emerge
in this area. One study of Turkish airline Pegasus found it to be the most important factor
of those measured (Atalık & Özel, 2007). Chinese passengers also rated safety as the
most important factor in their choice of airline (Zhang, 2011). Perceptions of airline
safety may also not act in the expected fashion. For example, a study of American
perceptions of airline service quality showed that safety perceptions did not fall after the
September 11th attack, although the perceived risk of air travel did increase substantially
(Cunningham, Young, & Lee, 2004).
Interestingly, airline safety is one of the areas where LCC passengers have
different priorities than full-service airline passengers. One study found that airline safety
was more important to LCC passengers than on-time operation of the flight (another
dimension of service quality) (Mikulic & Prebezak, 2011). In FSCs, this relationship was
reversed, with on-time operation being preferred. This could be because of perceptions of
reduced safety for LCCs compared to FSCs, although the safety records of airlines do not
always bear out this supposition (Mikulic & Prebezak, 2011). A study of airlines in
Malaysia suggests that there may also be a gap between passenger perceptions of airline
safety and airline and regulatory safety assessments (Oyewole, Sankaran, & Choudhury,
2007). This study found that passengers routinely rated airlines as being less safe than
their actual safety records suggested. Thus, passenger perceptions of safety systems may
differ substantially from the actual safety of the airline, but it may still influence the
airline choice.

45
In general, it is clear that airline safety perceptions are part of the decision process
for airline choice. However, the exact role this problem plays is uncertain because of the
lack of specific information about airline safety and perception of airline safety
operations. This is a gap in the research that could be filled by the current study. Thus,
airline safety perceptions was included as part of the research framework for this study.
Route availability and convenience. The fifth factor that is considered is route
availability and convenience. A number of studies have shown that route availability and
convenience is a major factor in the choice of airlines. This is an obvious factor because
of the way airline networks are structured; with only a limited number of airlines
operating from any one airport and with varying routes from that airport, the passenger’s
choice of airlines is actually constrained (Hess & Polak, 2006). Typically, passengers
will have the choice of only one or a few airlines at the origin and desired destination and
may have to accept transfers for some services (Hess & Polak, 2006). Thus, the choice of
airline is actually a two-stage problem, with the origin and destination selected first, and a
choice of satisfying or satisficing (good-enough) airline selected afterward (Hess &
Polak, 2006).
Empirical evidence exists for the importance of these factors. One study showed
that origin/destination pairs, transfer requirements, and departure times were one of the
main reasons for selection of an airline (van Eggermond, 2007). Schedule convenience
was also a factor in a study of Turkish airlines (Atalık & Özel, 2007). Chinese passengers
are known to place a high value on a large network, which maximizes their choices
(Zhang, 2011). Transfers and itineraries can also affect choice; for example, passengers
46
that are highly risk-averse are likely to avoid transfers and short connections if possible
(Theis, Adler, Clarke, & Ben-Akiva, 2006). This is because of the anticipated risk of
missing a flight and the stress of a short connection. A study of South African passengers
indicated that flight frequency was significantly more important for full-service
passengers than LCC passengers (Fourie & Lubbe, 2006). This suggests passengers make
a tradeoff between frequency and price. A study of Spanish passengers showed that route
timings (such as weekend or weekday travel), as well as route availability, were major
factors in the choice between an LCC and a FSC, as was the requirement for a transfer
(Castillo-Manzano & Marchena-Gómez, 2010).
The empirical evidence is highly complex and suggests a number of factors can
influence the importance of route beginning from the two-stage decision and moving
through specifics such as direct flights or transfers, departure and arrival time, and
requirement to transfer, and even down to the time of day. This would be an extremely
difficult problem to examine in this study. For this reason, route availability will not be
examined.
Frequent flier programs. The final airline characteristic included in this study is
frequent flier programs. Frequent flier programs are incentive programs offered by the
airline which offer benefits (such as free tickets, enhanced service levels, or routing and
ticket preferences) to passengers who consistently choose the airline or its partners
(Carlsson & Löfgren, 2006). A frequent flier program influences passenger choice
because it increases the switching costs by introducing opportunity costs for selecting
another airline. Simply put: if a frequent flier chooses a different airline, he or she will
47
not earn frequent flier points and subsequent benefits. This means that where they are
routine, especially in full-service carriers, frequent flier programs are a major factor in the
passenger’s airline choice (Carlsson & Löfgren, 2006). Frequent flier programs are also
known to be a key driver in airline behavioral loyalty or routine selection of the airline by
the passenger (Dolnicar et al., 2011). A study on South African business travelers
indicated that frequent flier programs influenced airline choice as well (Fourie & Lubbe,
2006). However, this loyalty is not absolute since the passenger still selects origin and
destination pairs (Hess & Polak, 2006).
Frequent flier programs could be difficult to analyze in this study because they
affect a number of other factors including price, satisfaction, airline image or reputation,
and airline choice for participants (though not non-participants) (Park, 2010). They also
have different effects depending on implementation, which varies between airlines and
culture (Park, 2010). Furthermore, LCCs do not ordinarily have significant frequent flier
or loyalty programs, although a few do (Vidovic et al., 2013). For these reasons, although
frequent flier programs are generally important for passenger choice, at least for
passengers that belong to the programs, this factor will not be examined in this study.
However, this could be important for future studies in Thailand, especially if Thai LCCs
introduce frequent flier programs.
Summary of airline selection factors. The final task of this section is
operationalizing a definition for the airline characteristics that influence selection. The
factors that were tested in the literature review include price, service quality, airline
reputation, airline safety, route availability, and frequent flier programs. Table 22 (in
48
appendix B) offers a brief description and summary of each of these factors and the
expected relationships to airline selection, as well as the authors whose previous work
supports the relationships. These definitions are all based on perceived assessments of
the airline’s offering, which means that it was assessed on the passenger’s internal view
of how well the offering meets their needs instead of on strictly objective criteria. This is
common in other service measurements including SERVQUAL since consumers do not
have a single set of criteria for assessment (Zeithaml, Parasuraman & Berry, 2010). In
the final section of the chapter, a research framework is developed that expresses the
specific relationships that are expected to emerge in the choice of LCCs.
Research Theoretical Framework and Hypotheses
Following the literature review, a theoretical framework has been established and
a set of hypotheses that can be tested using quantitative research has been stated based on
this framework. The theoretical framework is shown in Figure 4. The rationale of the
theoretical framework is that it combines two distinct views on the consumer decision.
The first set of elements is the consumer decision elements (as expressed within the TPB,
including Attitude, Subjective Norms, and Perceived Behavioral Control). These can be
considered the process elements of the decision, identifying how the consumer made the
decision. The second set of elements is the consumer perception of the airline service
offering (with various dimensions identified through empirical research as discussed
previously, including airline reputation, price, service quality, airline safety, route
availability and convenience, and frequent flier programs). Table 2 provides a summary
operational definition of how these variables are defined.
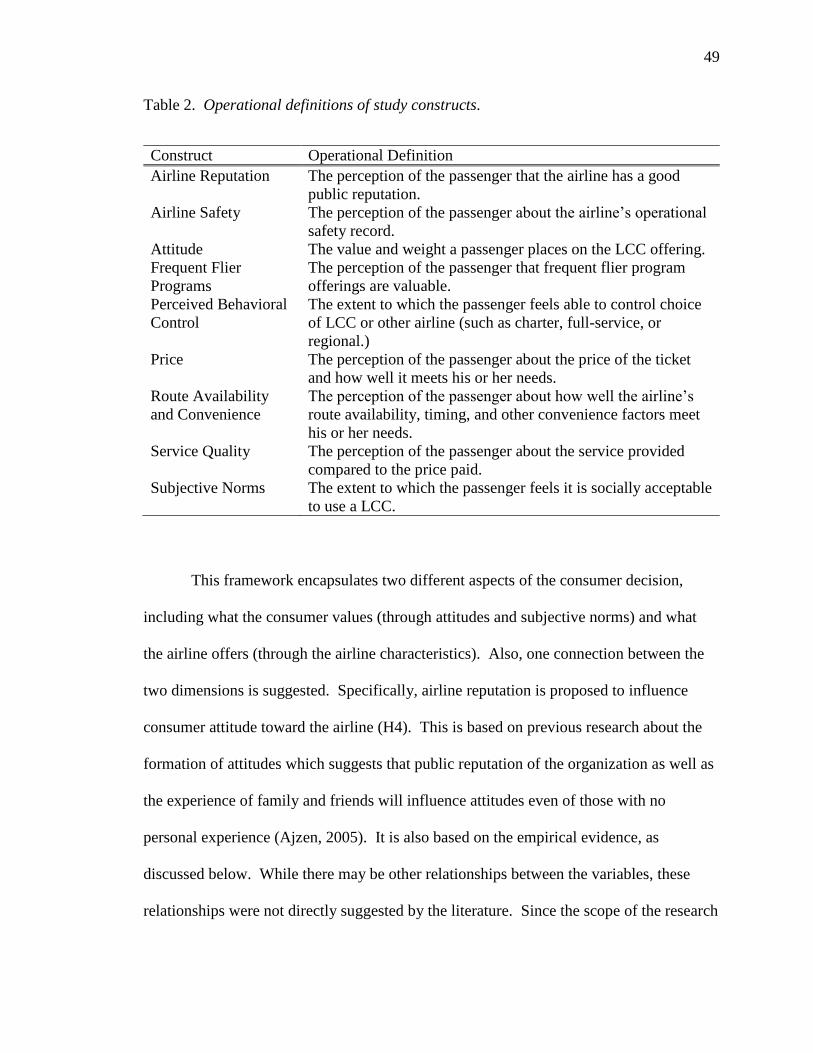
49
Table 2. Operational definitions of study constructs.
Construct Operational Definition
Airline Reputation The perception of the passenger that the airline has a good
public reputation.
Airline Safety The perception of the passenger about the airline’s operational
safety record.
Attitude The value and weight a passenger places on the LCC offering.
Frequent Flier
Programs
The perception of the passenger that frequent flier program
offerings are valuable.
Perceived Behavioral
Control
The extent to which the passenger feels able to control choice
of LCC or other airline (such as charter, full-service, or
regional.)
Price The perception of the passenger about the price of the ticket
and how well it meets his or her needs.
Route Availability
and Convenience
The perception of the passenger about how well the airline’s
route availability, timing, and other convenience factors meet
his or her needs.
Service Quality The perception of the passenger about the service provided
compared to the price paid.
Subjective Norms The extent to which the passenger feels it is socially acceptable
to use a LCC.
This framework encapsulates two different aspects of the consumer decision,
including what the consumer values (through attitudes and subjective norms) and what
the airline offers (through the airline characteristics). Also, one connection between the
two dimensions is suggested. Specifically, airline reputation is proposed to influence
consumer attitude toward the airline (H4). This is based on previous research about the
formation of attitudes which suggests that public reputation of the organization as well as
the experience of family and friends will influence attitudes even of those with no
personal experience (Ajzen, 2005). It is also based on the empirical evidence, as
discussed below. While there may be other relationships between the variables, these
relationships were not directly suggested by the literature. Since the scope of the research
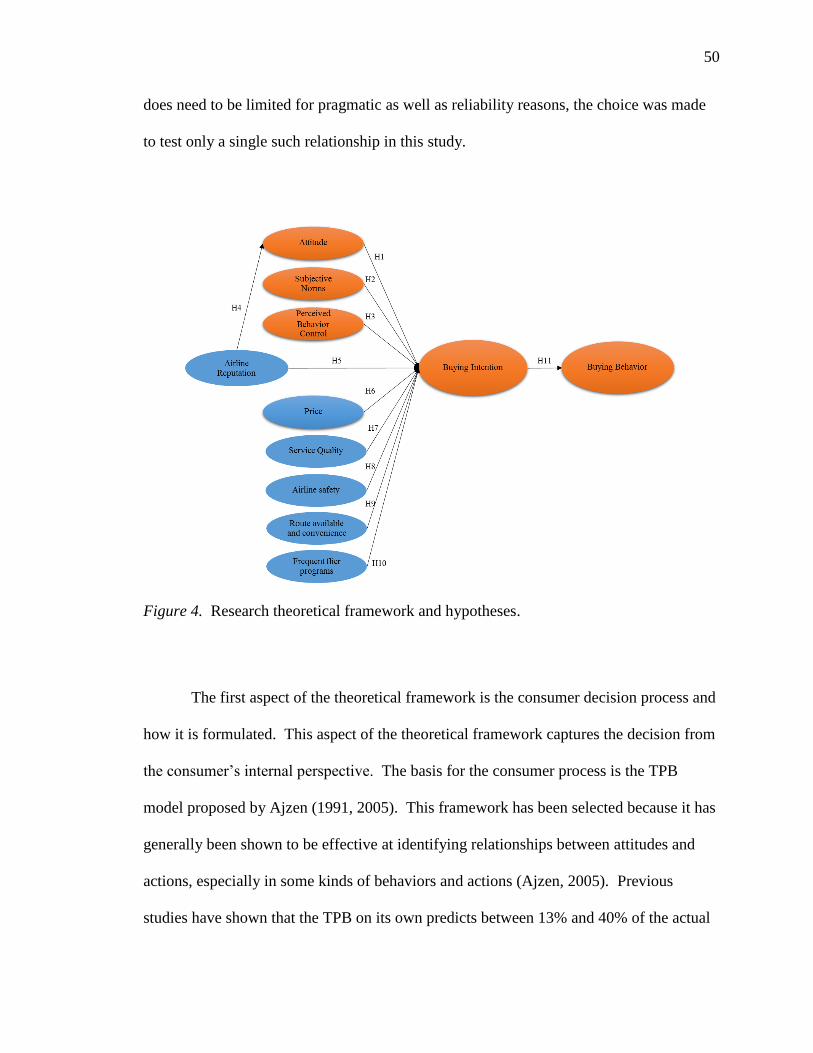
50
does need to be limited for pragmatic as well as reliability reasons, the choice was made
to test only a single such relationship in this study.
Figure 4. Research theoretical framework and hypotheses.
The first aspect of the theoretical framework is the consumer decision process and
how it is formulated. This aspect of the theoretical framework captures the decision from
the consumer’s internal perspective. The basis for the consumer process is the TPB
model proposed by Ajzen (1991, 2005). This framework has been selected because it has
generally been shown to be effective at identifying relationships between attitudes and
actions, especially in some kinds of behaviors and actions (Ajzen, 2005). Previous
studies have shown that the TPB on its own predicts between 13% and 40% of the actual
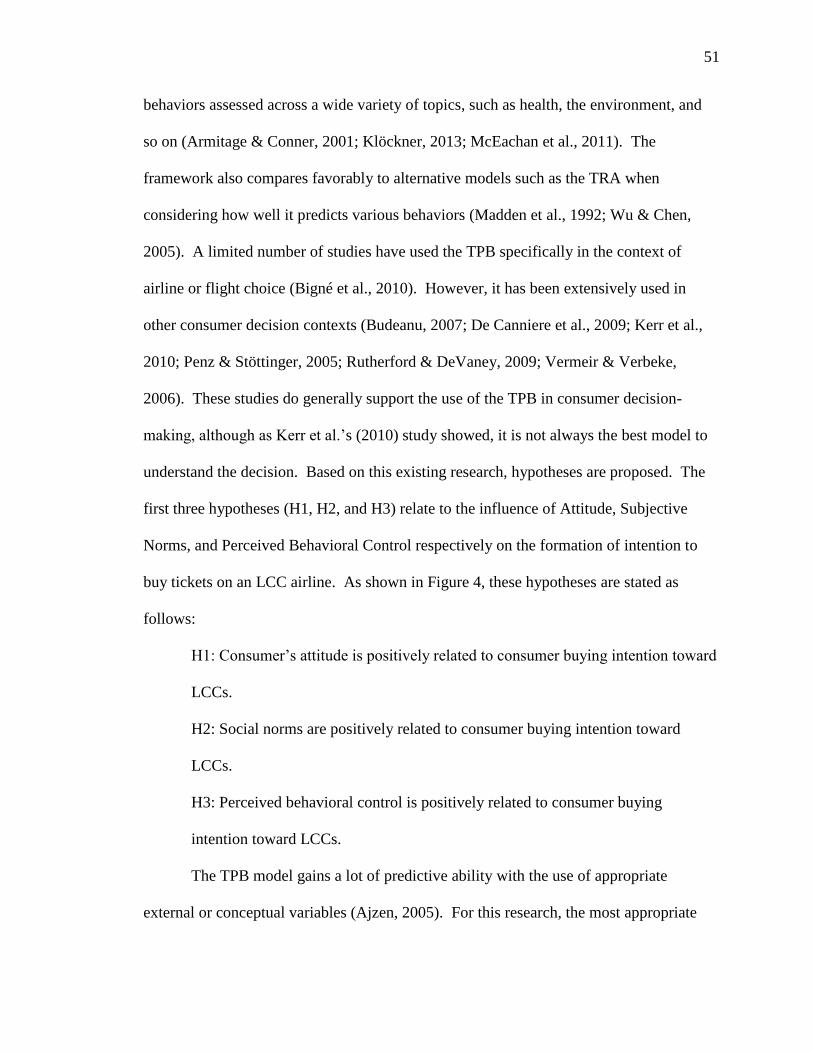
51
behaviors assessed across a wide variety of topics, such as health, the environment, and
so on (Armitage & Conner, 2001; Klöckner, 2013; McEachan et al., 2011). The
framework also compares favorably to alternative models such as the TRA when
considering how well it predicts various behaviors (Madden et al., 1992; Wu & Chen,
2005). A limited number of studies have used the TPB specifically in the context of
airline or flight choice (Bigné et al., 2010). However, it has been extensively used in
other consumer decision contexts (Budeanu, 2007; De Canniere et al., 2009; Kerr et al.,
2010; Penz & Stöttinger, 2005; Rutherford & DeVaney, 2009; Vermeir & Verbeke,
2006). These studies do generally support the use of the TPB in consumer decision-
making, although as Kerr et al.’s (2010) study showed, it is not always the best model to
understand the decision. Based on this existing research, hypotheses are proposed. The
first three hypotheses (H1, H2, and H3) relate to the influence of Attitude, Subjective
Norms, and Perceived Behavioral Control respectively on the formation of intention to
buy tickets on an LCC airline. As shown in Figure 4, these hypotheses are stated as
follows:
H1: Consumer’s attitude is positively related to consumer buying intention toward
LCCs.
H2: Social norms are positively related to consumer buying intention toward
LCCs.
H3: Perceived behavioral control is positively related to consumer buying
intention toward LCCs.
The TPB model gains a lot of predictive ability with the use of appropriate
external or conceptual variables (Ajzen, 2005). For this research, the most appropriate
52
choice of external variables was airline characteristics. While the TPB describes the
process by which the consumer makes her decision, the airline characteristics identified in
the literature are essentially the differences between airlines that the consumers’ decision
is based on. This provides information for the evaluation stage of the consumer decision,
with the consumer choosing among preferences for airline characteristics in order to make
the best choice (Lantos, 2010). Six of these factors are considered in this research,
including: airline reputation, price, airline service quality, airline safety, route availability
and convenience, and frequent flier programs.
The first airline characteristic considered is airline reputation which is tested in H4
and H5. Airline reputation refers to how passengers and the public see the airline in
terms of its financial stability, safety, service quality, and other aspects (Graham &
Bansal, 2007). Previous studies have shown that this is one of the main factors related to
airline choice (Atalık & Özel, 2007; Bukhari et al., 2012; Chiam & Soutar, 2009;
Dolnicar et al., 2011; Zhang, 2011). The theoretical and empirical evidence behind the
TPB also suggests that public image or reputation of companies, practices, and so on also
influence individual attitudes toward the actions (Ajzen, 2005). Thus, airline reputation
can influence the consumer in two possible ways. In this research, two relationships were
studied for this factor, including an indirect relationship (through attitude) as well as a
direct relationship to behavioral intention. These hypotheses are stated as follows:
H4: Airline reputation has a positive influence on consumer’s attitude.
H5: Airline reputation has a positive influence on consumer buying intention
toward LCCs.
53
The second airline characteristic considered in this research is price (especially
ticket price). H6 is related to the price of the ticket. Price is routinely found to be one of
the most important factors in airline and route selection (Dolnicar et al., 2011; Jou et al.,
2008; Loo, 2008; Park, 2007), though some consumers do find it more important than
others (Evangelho et al., 2005; O'Connell & Williams, 2005). Additionally, price is
important for LCC and FSC passengers (Diggines, 2010; Fourie & Lubbe, 2006). Thus,
H6 ia stated as:
H6: Price has a positive influence on consumer buying intention toward LCCs.
The third airline characteristic, airline service quality, is measured in H7. Several
studies have been conducted related to service quality, most of which demonstrate that
service quality is an important factor in airline choice (Atalık & Özel, 2007; Fourie &
Lubbe, 2006; Huang, 2009; Park, 2007; Zhang, 2011). These studies point to three types
of service: Ground service (check-in, baggage handling, embarkation/disembarkation, and
lounges), in-flight service (comfort, entertainment, food and drinks, and general service
quality), and on-time operations. Thus, H7 is stated:
H7: Airline service quality has a positive influence on consumer buying intention
toward LCCs.
Airline safety is the fourth airline characteristic considered in this study. This
characteristic is also identified in the literature as being important to the choice of airline,
as well as being one of the main components in airline reputation (Atalık & Özel, 2007;
Graham & Bansal, 2007; Zhang, 2011). Airline safety may be particularly important for
LCC passengers, since LCCs may be perceived as less safe (Mikulic & Prebezak, 2011).
This makes it worth considering as the last component in this model. H8 is stated:
54
H8: Airline safety has a positive influence on consumer buying intention toward
LCCs.
The fifth airline characteristic considered is route availability and convenience.
This is a two-dimensional characteristic: 1) whether the airline travels between the
desired origin/destination pair or an acceptable alternative route; and 2) the extent of
difficulty the passenger will have with the schedule (for example, early morning or late
evening arrival or departure or requiring rush-hour travel). This is one of the most
fundamental aspects of the consumer decision since it will determine whether the airline
can meet the basic needs of the consumer (Lantos, 2010). It is one of the most supported
factors in the literature surrounding choice of airlines, as well (Atalık & Özel, 2007;
Castillo-Manzano & Marchena-Gómez, 2010; Fourie & Lubbe, 2006; Hess & Polak,
2006; Theis et al., 2006; van Eggermond, 2007; Zhang, 2011). Based on this evidence,
H9 is stated:
H9: Route availability and convenience has a positive influence on consumer
buying intention toward LCCs.
The final airline characteristic is the offering of a frequent flier program. Frequent
flier programs offer incentives such as free travel and special access to services like
passenger lounges depending on how often a passenger chooses to fly with the airline.
Some evidence indicates that the availability of frequent flier programs is one determinant
of LCC choice, particularly for some classes of travelers (such as business travelers)
(Carlsson & Löfgren, 2006; Fourie & Lubbe, 2006; Hess & Polak, 2006; Park, 2010;
Vidovic et al., 2013). While frequent flier programs are not as routinely tested for LCCs,
they may influence the market. Thus, the hypothesis is stated:
55
H10: Frequent flier programs have positive influence on consumer buying
intention toward LCCs.
The final hypothesis (H11) relates to the influence of behavioral intention on the
actual behavior (buying the airline ticket). This hypothesis steps through the influences
on the consumer decision proposed by the TPB as well as the final consumer process
(ticket purchase). The final hypothesis is stated as follow:
H11: Buying intention is positively related to consumer buying behavior toward
LCCs.
Chapter Summary
The LCC segment of the airline industry is increasingly important in most markets
around the world, including Asia. However, this is almost always studied as a function of
cost, with most studies suggesting that selection of a LCC is always because of the lowest
cost. This raises the question of what other factors may influence the choice of airline
carrier for passengers. Even though price may be a significant concern, clearly other
factors may be considered in the choice.
This research takes the theoretical position of consumer decision and the
consumer decision-making process, combining aspects of the consumer decision with
aspects of airline characteristics. The framework that is used to understand the consumer
decision is the TPB. The TPB formulates the consumer decision as the result of attitudes,
social norms, and perceived behavioral control. The TPB model also allows for extension
through external variables that are specific to the decision context. A number of previous
studies have shown how this model can be used effectively to explain and predict
56
consumer decisions. Airline selection factors have been chosen as the most appropriate
way to extend the research.
The final section was an extensive review of studies on airline selection, which
identified external factors related to the consumer decision. Six external variables were
identified for inclusion in the study, including: airline reputation, price, service quality,
airline safety, route availability and convenience, and frequent flier programs. These
were included in the research framework and hypotheses that are tested in the present
study. The next chapter describes the approach used for primary research in order to test
the hypotheses.

57
CHAPTER III
RESEARCH METHODOLOGY
In the previous chapter, a theoretical framework was formulated that related
consumer decision processes (through the TPB model) and airline characteristics and the
consumer decision for LCCs. This theoretical framework was designed for a quantitative
research study. A suitable method was constructed for the study through reference to
other studies that examined similar topics, as well as the literature on research design.
In this chapter, the method used for testing the theoretical framework is presented,
discussed, and critiqued. The chapter includes discussion of the research philosophy and
approach, the research strategy, and specifics of the research including population and
sampling procedures, data collection, and data analysis. The chapter also discusses the
ethical concerns of the study and its methodological limitations. This provides a
comprehensive discussion of the reasons for specific methodological choices, as well as
identifying potential weaknesses and problems in the methodology that could not be
eliminated.
Research Approach
In this research, the purpose was to apply existing theories to a novel situation
(LCC choice in Thailand). As the literature review showed, a theoretical framework
already exists that can be constructed and applied to the research situation; this
framework is explained in detail in Chapter 2. The existing research framework, along
with the positivist philosophy (Grix, 2010), means that the deductive approach was the
most appropriate choice for this research.

58
Structural equation modeling (SEM) was the statistical analysis technique used for
the study. SEM was selected because it is ideal for identifying and confirming full
models of relationships between variables (Bollen, 1989). SEM is a set of techniques
(including factor analysis, path analysis, and other approaches) that are based on the
general linear model (Ullman & Bentler, 2003). SEM was also determined to be
appropriate because it helps to identify latent variables and eliminate irrelevant variables
from the proposed research model (Bollen, 1989). Extraction of latent variables from
observed variables means that SEM can identify the underlying structure of the research
phenomenon (Ullman & Bentler, 2003). This statistical approach was more advanced
than most similar studies which primarily used single or multiple regression in order to
test relationships. However, this provided a more comprehensive analysis than the
simpler analysis techniques by considering all the factors in combination.
Research Strategy and Design
The research strategy is the approach used in the study to collect and analyze data
(Rugg & Petre, 2006). There are three main research strategies that could have been used
for this study. Qualitative research uses non-numeric data and analysis techniques, while
quantitative research uses numeric data and analysis techniques (Creswell, 2009). The
third technique is mixed methods research which combines aspects of qualitative and
quantitative research to examine complex problems.
This research used a quantitative research design. Quantitative research designs
are consistent with deductive research approaches (though they do not have to be used)
(Grix, 2010). They are also appropriate for hypothesis testing, which cannot really be
59
done qualitatively (Creswell, 2009). Quantitative research uses standardized
instrumentation and data collection techniques and established statistical analysis tools to
generate knowledge and draw conclusions (Rugg & Petre, 2006). This is consistent with
the positivist philosophy (Grix, 2010). It is also the only approach where findings can be
generalized to some extent across populations (Trochim & Donnelly, 2006). Quantitative
research is a better approach to testing hypotheses than a qualitative approach (Vogt,
Gardner, & Haeffele, 2012). The choice of quantitative research design did impose some
limitations, but it also helped to ensure the research could be completed on time. Thus,
this was the most appropriate choice.
There are two main research designs that could have been used in the quantitative
study (Saunders, Lewis, & Thornhill, 2009). The first research design is a survey, where
the author measures the dependent and independent variables and tries to relate them
without manipulating them. The second research design is an experiment, where the
author manipulates the independent variable(s) and measures the effect of this
manipulation on the dependent variable. This study used a survey research design, both
for practical reasons and because there was no reasonable way to design an experiment
for the research question. The author also wanted a broader and more generalized view of
the factors involved in LCC choice, which required a larger sample than could be
collected using an experiment. The majority of the existing empirical literature on airline
choice also supported the use of a survey rather than an experiment, as explained in
Chapter 2.
Survey designs are best used when data can be collected directly from respondents
using brief responses, and respondents can answer reliably (Vogt et al., 2012). These
60
conditions were in place in the research population. Response rate adequacy and being
able to use the data are also important criteria for using a survey (Vogt et al., 2012).
Given the extremely common use of surveys in consumer and passenger research and the
existing surveys that implement short answer, structure designs, there was no reason to
believe the first three conditions would not hold. In fact, all three of these conditions
were met during the research. The author designed the survey with the final two criteria
in mind as well in order to prevent problems.
A standardized instrument (questionnaire) was used to collect the data from the
population, which is explained below.
Population and Sampling
The population of interest for this study was travelers departing from Thai airports
using any LCC. This group included international and domestic passengers of all airlines
operating out of the target airports. A sampling frame was placed on the sample in order
to reduce the complexity of data collection. The data collection was limited to include
only Bangkok airports (Suvarnabhumi Airport, which serves mainly international traffic
and Don Mueng Airport, which serves mainly domestic traffic). This limitation on the
sample was placed for pragmatic reasons, since it would be difficult for the author to
travel to multiple airports. Since these two airports account for the majority of air traffic
in Thailand, this was not considered a significant limitation. For example, in the current
fiscal year up to the point of data collection (October 2013 to July 2014), Suvarnabhumi
and Don Mueang together accounted for 74.6% of total passenger movements in Thailand
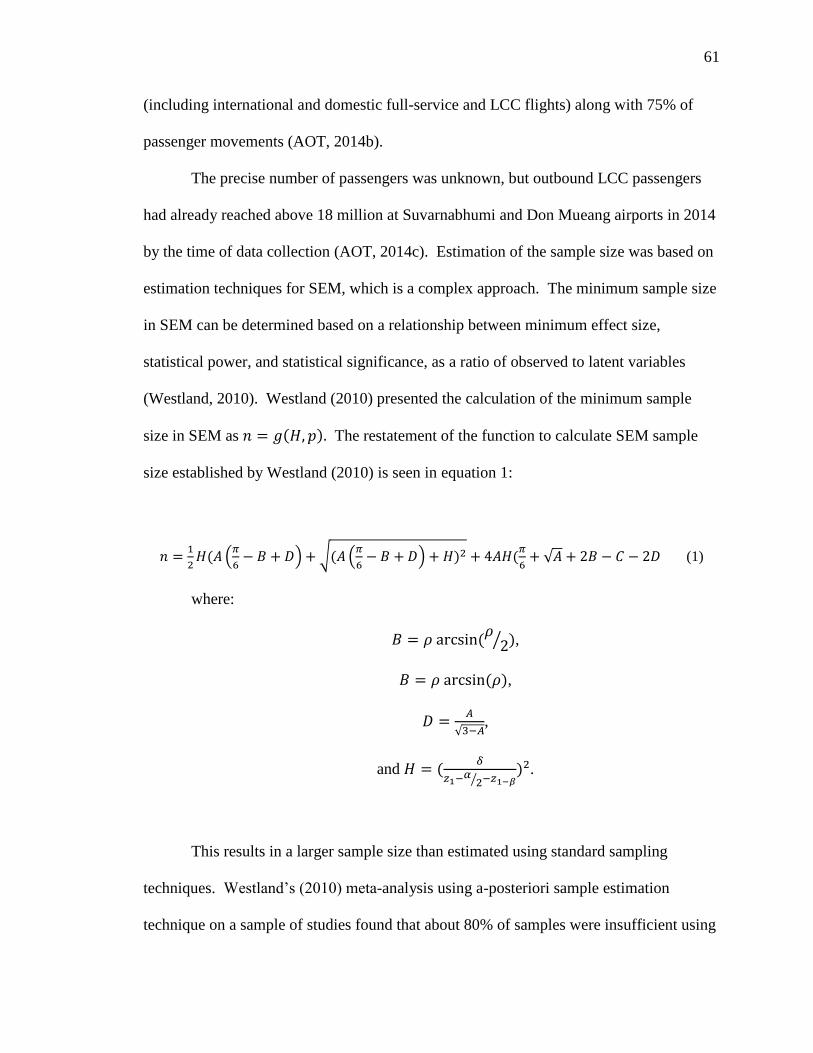
61
(including international and domestic full-service and LCC flights) along with 75% of
passenger movements (AOT, 2014b).
The precise number of passengers was unknown, but outbound LCC passengers
had already reached above 18 million at Suvarnabhumi and Don Mueang airports in 2014
by the time of data collection (AOT, 2014c). Estimation of the sample size was based on
estimation techniques for SEM, which is a complex approach. The minimum sample size
in SEM can be determined based on a relationship between minimum effect size,
statistical power, and statistical significance, as a ratio of observed to latent variables
(Westland, 2010). Westland (2010) presented the calculation of the minimum sample
size in SEM as 𝑛 = 𝑔(𝐻, 𝑝). The restatement of the function to calculate SEM sample
size established by Westland (2010) is seen in equation 1:
𝑛 =1
2𝐻(𝐴 (
𝜋
6− 𝐵 + 𝐷) + √(𝐴 (
𝜋
6− 𝐵 + 𝐷) + 𝐻)2 + 4𝐴𝐻(
𝜋
6+ √𝐴 + 2𝐵 − 𝐶 − 2𝐷 (1)
where:
𝐵 = 𝜌 arcsin (𝜌
2⁄ ),
𝐵 = 𝜌 arcsin (𝜌),
𝐷 =𝐴
√3−𝐴,
and 𝐻 = (𝛿
𝑧1−𝛼2⁄ −𝑧1−𝛽
)2.
This results in a larger sample size than estimated using standard sampling
techniques. Westland’s (2010) meta-analysis using a-posteriori sample estimation
technique on a sample of studies found that about 80% of samples were insufficient using
62
this calculation technique. The average sample size was only about 50% of the lower
bound required to establish statistically reliable results.
Using a sample size calculator based on this equation to determine the appropriate
sample size (the most reliable approach given the complexity of the calculation), with the
assumptions of effect size = 0.1, latent and observed variables = 11, and statistical power
level of 0.8, yielded a desirable minimum sample size of 736 members (Soper, 2014). A
comparison with a standard sampling technique offered by Devore, Farnum and Doi
(2013), which resulted in a sample size of n = 385, shows that Westland’s (2010) estimate
of about 50% of the established sample size from standard a priori techniques is suitable
(with traditional sample 52.3% of the lower bound sample). The larger target sample size
(n = 736) was required for this study in order to ensure statistical significance of the
findings.
The sample was selected using convenience sampling at Suvarnabhumi
International Airport and Don Mueng Airport. Convenience sampling or haphazard
sampling involves selecting participants for the research based on their availability (such
as being in a particular area at the same time as the sampler) (Gravetter & Forzano, 2011).
The convenience sampling approach is a non-random sampling technique and as a result
is one of the weaker sampling techniques that can be used (Gravetter & Forzano, 2011).
However, its advantages (including cost and time advantages) and the lack of knowledge
about the demographics of the population made it the best choice of sampling technique
for this research. The author selected participants from the check-in area of LCCs on a
variety of different days and times from both airports in order to increase the randomness
of the sample. Demographic characteristics were also collected for a clear description of
63
the sample (Gravetter & Forzano, 2011). In order to select participants, the data
collectors chose a position in the check-in areas for LCCs. Using a golf counter, the
collector approached each tenth passer-by to request participation in the survey. This
helped reduce researcher bias, since participants were only selected based on their
sequence of passage.
Data Collection
There are different types of methods that can be used to collect data for a survey
including online questionnaires, telephone questionnaires, self-administered
questionnaires, and structured interviews (Brace, 2008). While all four use structured
instruments, the method of distribution and collection varies. Questionnaires can be
collected online, by telephone, or on paper using self-administration, where the
participant fills out the questionnaire. The questionnaire can also be filled in as part of a
structured interview where the author reads the questions and, if necessary, defines terms
(Brace, 2008). This approach is helpful for situations such as nutrition and health
questionnaires where questions may be complex or where there are impediments to self-
administration such as illiteracy. The self-administered questionnaire was the obvious
choice for this study since the data collection took place in person, and there were no
anticipated barriers or problems with understanding, except for possible language barriers
which could not be overcome. The impact of language barriers was recorded during the
data collection process in order to understand how significant this problem was. The
questionnaire was printed in English and Thai in an easy-to-read format, and the author
asked participants at the collection sites (Don Mueng Airport and Suvarnabhumi
64
International Airport) to complete them. If a participant declined, another participant was
selected. If the respondent did not complete the survey in full, the questionnaire was
discarded and was not counted in the sample.
The questionnaire was distributed using ten team members, with a data collection
period of two days, for a total of 200 hours data collection time spread across the period
of the airports’ operation. There were ten low-cost airlines included in the study that
operate from Thailand, including five departing from Don Mueang and five departing
from Suvarnabhumi. Table 3 summarizes the airlines included in the study. Prior to the
study, the team was trained for data collection and instructions. The training included an
information session and an opportunity for role-playing which was designed to improve
data collection techniques. The training took approximately two hours.
At each airport, a team member was positioned at the airport’s check-in counter.
The team member approached every tenth passenger to ensure the randomness of
selecting passengers. Counters were issued to assist in this task. However, passengers
that appeared to be in a hurry to catch a flight were not approached in order to prevent
potential harm of missing a flight.
Team members approached each selected potential participant after he or she had
completed any business at the check-in; team members then briefly explained the research
and asked whether the selectee wanted to participate. If the selectee did agree to
participate, he or she was given a detailed letter of information that included the purpose
of the survey as well as contact information for the author and supervisor along with the
questionnaire. A pen was provided, if necessary, and the team member explained that he
or she can answer any questions. Participants could not complete the survey, spoil it, or
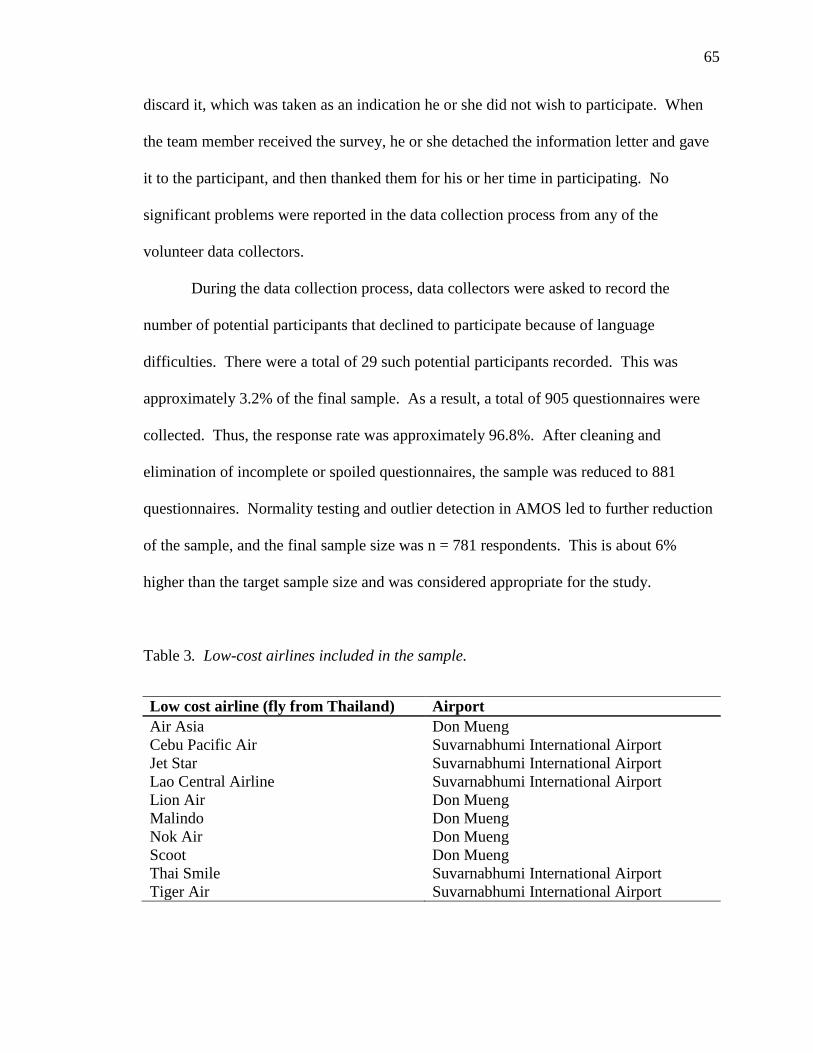
65
discard it, which was taken as an indication he or she did not wish to participate. When
the team member received the survey, he or she detached the information letter and gave
it to the participant, and then thanked them for his or her time in participating. No
significant problems were reported in the data collection process from any of the
volunteer data collectors.
During the data collection process, data collectors were asked to record the
number of potential participants that declined to participate because of language
difficulties. There were a total of 29 such potential participants recorded. This was
approximately 3.2% of the final sample. As a result, a total of 905 questionnaires were
collected. Thus, the response rate was approximately 96.8%. After cleaning and
elimination of incomplete or spoiled questionnaires, the sample was reduced to 881
questionnaires. Normality testing and outlier detection in AMOS led to further reduction
of the sample, and the final sample size was n = 781 respondents. This is about 6%
higher than the target sample size and was considered appropriate for the study.
Table 3. Low-cost airlines included in the sample.
Low cost airline (fly from Thailand) Airport
Air Asia Don Mueng
Cebu Pacific Air Suvarnabhumi International Airport
Jet Star Suvarnabhumi International Airport
Lao Central Airline Suvarnabhumi International Airport
Lion Air Don Mueng
Malindo Don Mueng
Nok Air Don Mueng
Scoot Don Mueng
Thai Smile Suvarnabhumi International Airport
Tiger Air Suvarnabhumi International Airport

66
Research instrument. The research instrument was a questionnaire. It was
developed based on variables presented in Figure 4 (Theoretical Framework). The items
used for each variable are presented in Table 23 (Appendix).
Pilot Test. Because the research instrument was designed for this study, it had to
be tested for reliability and validity prior to use. The reliability and validity tests were
conducted using built-in SPSS tools.
Firstly, face validity and content validity were examined using expert review and
pilot testing. The expert review process involved asking the author’s supervisor as well
as other subject matter experts to review the instrument to make sure it reflected the
intended constructs. This resulted in some suggested adaptations and changes, which
were incorporated into the questionnaire before the survey was distributed for a pilot test.
Participants in the pilot test were asked to fill out a brief questionnaire and identify any
problems with the content, information, or wording.
The translation of the questionnaire between English and Thai was a concern for
the study. The author addressed this problem by splitting the pilot test between English
and Thai respondents to make sure similar results were observed. The author performed
the translation but had it proofread and double-checked by two other translators and an
external member (a professor from Thailand) to ensure its accuracy. A double translation
process, where the author translated the questionnaire to Thai, then had another translator
translate it back to English and compare the results to the original questionnaire, was used
to double-check accuracy and fine-tune the translation (Harkness, Pennell, & Schoua-
67
Glusburg, 2004). This resulted in some modifications to the translation, which were
incorporated into the final questionnaire.
There was a relatively low non-response rate (3.2%), which can mainly be
attributed to language barriers between the passenger and the data collector. Ideally, non-
response bias should have been assessed based on available statistics about air passenger
demographics (Montaquila & Olson, 2012). However, this was not feasible because of
poor data availability, particularly for the LCC segment. Although responses were
compared to the general demographics of the Thai population, this is not a full proxy for
the population since the study included both Thai and international passengers. While a
full non-response bias assessment was not possible, the low non-response rate suggests
that there would not be a major bias.
Next, the reliability of the instrument was tested using Cronbach’s alpha on a
random sample of the completed surveys at Don Mueng Airport (n=30). Cronbach’s
alpha measures internal consistency of a scale; in other words, it measures the extent to
which the items in a scale are measuring the same construct (Hair, Celsi, Money,
Samouel, & Page, 2011). This did not reflect on it measuring the intended construct
(validity), which is measured using factor loading and is addressed next. Items could be
removed from scales based on the Cronbach’s alpha in order to increase internal
consistency reliability. There is no fixed alpha value for acceptance of a scale, although
common values include alpha = 0.6 (for exploratory research) and 0.8 (for explanatory
research) (Gravetter & Forzano, 2011). This study used a basic threshold of 0.8 for
acceptance of scales; if scales did not meet this requirement, they would be adjusted as
needed. The results of Cronbach’s alpha are presented in Chapter 4.
68
The construct validity of the instrument was tested using factor analysis via SPSS.
Factor analysis is a statistical approach for determination of construct validity (Brown,
2012). Construct validity means that the scale or measurement is measuring what it is
designed to measure. Factor analysis determines the extent of internal correlation
between measured variables; a high degree of correlation between multiple measured
variables means that they are all measuring the same underlying latent variable (Brown,
2012). There is no fixed threshold for acceptance, but any items that are out of place are
removed.
Data Analysis
Data analysis was conducted in SPSS using three techniques. The first technique
was descriptive statistics, which was used only as a descriptive profile of respondents and
then compared to a general population. Descriptive statistics are statistics of a single
variable meant to describe characteristics of the sample (Peck, Olsen, & Devote, 2012).
The descriptive statistics calculated were selected based on the data type and intended
characteristic. These included mean and standard deviation (for numerical and Likert
scale variables) and frequency and percent (for categorical variables). These were
presented using charts, graphs, and/or tables as appropriate. Descriptive statistics are
useful for understanding conditions in the sample but do not give any insight into causal
mechanisms or relationships (Peck et al., 2012). As a result, additional techniques were
also needed.
The second technique was confirmatory factor analysis (CFA) available via SPSS
using the AMOS plug-in. In CFA, the author identifies the items that are thought to be

69
measuring the same underlying construct in order to determine factor loadings (indicating
extent of internal correlation) (Brown, 2012). Based on Hair (2012), convergent and
discriminant validity should be tested. Convergent validity was tested using Composite
Reliability (CR), while divergent validity was tested using Average Variance Extracted
(AVE) and Square Correlation Coefficient. In the initial CFA run, the model was not
fitted properly, with acceptable CR value (indicating that convergent validity was
appropriate) but AVE being too low for acceptance for two factors (Attitude and Airline
Safety) and Square Correlation Coefficient being too low for acceptance for six factors
(Buying Behavior, Attitude, Airline Safety, Route, Airline Reputation, and Behavioral
Intention). Initially, the author tried adjusting the model by eliminating low-correlation
items within the scales and then retrying CFA. However, even after several attempts, this
still resulted in a poorly fitted model. Eliminating Airline Safety (one of the factors with
low AVE) from the model entirely improved performance but still did not meet criteria
for the Modification Index. Finally, the author eliminated Attitude as well, which
resulted in a properly fitted model with an appropriate Modification Index. As a result,
moving into the SEM process (the final stage of analysis), the analytical model was
similar to the theoretical framework proposed with the absence of Attitude and Airline
Safety factors.
The third statistical technique for this research was SEM. SEM was performed in
SPSS using the AMOS plug-in, which is designed for Exploratory Factor Analysis (EFA),
CFA, and SEM (Kaplan, 2009). SEM is a statistical tool that is designed to test a
qualitative model of causal assumptions based on the statistical relationships shown in the
research data (Kaplan, 2009). SEM can be used in two ways. First, it can be used in an
70
exploratory fashion to identify statistical relationships within the data and identify
potential causal relationships and causal chains. Second, it can be used in a confirmatory
way to test a causal model specified by the author. In this research, confirmatory SEM is
used. The process of confirmatory SEM requires the author to specify and operationalize
variables (which is performed using factor analysis and Cronbach’s alpha, as described
previously). The author then enters a hypothetical model to be tested against the data.
The SEM model was then identify how well this model fits the outcomes of the data. In
this research, the theoretical framework (Figure 4) was used as the foundation for the
SEM test, which was used in a confirmatory approach with a specified model. However,
the model was adapted as described above following CFA, which demonstrated that there
was poor convergent validity for two items (Attitude and Airline Safety) as indicated by
CR and subsequently poor model fit. This adapted model passed the requirements for
SEM’s model fitting.
Even though simple regression was the most common technique in previous
studies, SEM offered a number of advantages. The SEM approach allows the author to
test a full hypothetical model rather than single hypotheses (Kaplan, 2009), which is an
advantage over a regression model. The approach also allowed the author to determine
the strength of relationships, modify relationships and assumptions, and use latent
variables (Kaplan, 2009). This was much more useful for the present study than the
alternative methods such as regression, which tests only bivariate relationships. It also
allowed the author to eliminate some factors that were not related to the model, as
explained above.
71
There are a number of assumptions of SEM (Kline, 2012). One of these
assumptions is directionality of the relationship, which is defined by the measurement
model. There are also assumptions about the nature of the causal relationship, including
that: The cause (X) occurs before the effect (Y); there is covariation between X and Y;
there is isolation of this covariation (control of other factors that could cause the
relationship); the directionality is established; and the distribution of the data is known
(Kline, 2012). These assumptions were tested within the analysis process, and the model
was adjusted based on the findings of this analysis as discussed above. The outcomes of
the SEM process identified the strength of the relationships and factors associated with
them.
Ethical Considerations
One ethical concern of this study was preventing harm from participation. This
study was anonymous consumer research and, as a result, did not pose any serious
potential harm to the reputation or emotional state of its participants. Identities were not
collected, and the research instrument was designed to not include items that might be
considered private or sensitive. Demographics were only collected as general categories
in order to prevent individual participants from being identified through these
characteristics. Results were only reported in the aggregate, and no information about
individuals was used.
Another possible harm that participants could have encountered is potential
consequences from using the time to complete the research (such as missing their flight).
In order to prevent this, the questionnaire was kept as short as possible, and participants

72
were given a generous estimate of the amount of time that would be required to complete
the survey (15 minutes, which was about 1.5 times as long as the actual completion time
for most participants based on the initial testing). They were informed of the time before
the study and asked if they had time to complete it. Furthermore, data collectors avoided
approaching passengers that appeared to be in a hurry or who headed straight out of the
check-in area in order to prevent harm from delaying passengers who may have been in a
hurry.
Another ethical concern was informed consent. Although there was no particular
harm that might result, it was still important for participants to be informed about the
purpose of the study (Gravetter & Forzano, 2011). The participants were given a two-
sided letter of information that included a brief description of the study on the front and a
fuller description of the study, including contact information for the author and supervisor
on the back. This allowed them to rapidly determine whether they should participate
while still having the required information.
Limitations of the Method
There were some limitations to the method that could not be easily removed
through changing the research design, given the resources available. One of these
limitations was the language of questionnaire distribution (English and Thai). The author
did not have the resources to translate the questionnaires or responses effectively into
other languages. Thus, potential participants who do not speak either language were
excluded, and their numbers were recorded. The impact of this potential exclusion was
expected to be minimal since Thailand’s major trade language is English. The author
73
determined this meant that English and Thai were most likely to be spoken by visitors.
Additionally, adding more languages would be difficult because the data collection team
did not share a consistent third language and could not answer questions or communicate
in other languages routinely. In order to overcome this limitation, the author kept the
survey as simply worded as possible. A deliberate effort was made to include non-native
English speakers and non-Thai speakers in the pilot test to identify any problems. In
practice, this had limited effect, with about 3.2% of potential participants being excluded
for language barriers.

74
CHAPTER IV
RESULTS
The purpose of this chapter is to present the findings of the primary research,
which were derived based on the research methodology described above. The primary
research was based on a theoretical model that integrated the TPB and airline marketing
and service factors (Figure 4).
The study tested 11 hypotheses based on this model using a quantitative passenger
survey conducted at Bangkok’s main airports, Suvarnabhumi International Airport and
Don Mueng Airport. During the data collection process, a total of 905 questionnaires
were collected. Following removal of questionnaires with substantially incomplete or
incorrectly filled out responses, 881 questionnaires remained (a 97.3% inclusion rate). A
second round of data preparation and cleaning involved deletion of 100 questionnaires
based on normality testing and outlier detection in AMOS. The final analysis included
781 questionnaires which was 86.3% of those completed.
The analysis for this research was conducted in several stages using a combination
of standard SPSS tools and AMOS. The analysis began with descriptive analysis of
individual items and scales. This was conducted in order to provide a respondent profile
and demonstrate general trends in the scales. Internal consistency reliability of the
questionnaire was tested using Cronbach’s alpha, which was successful. Convergent
validity was tested using CR and AVE, while discriminant validity was tested using AVE
and squared correlation. This process resulted in elimination of two factors (Attitude and
Airline Safety) from the proposed model. Finally, the remaining hypotheses were tested
75
based on the SEM model. All tests were accepted at a confidence interval of +/-5% (p <
0.05). Other acceptance thresholds were also used depending on the measurement.
Respondent Demographics
Demographic factors were collected during the course of the survey, including
gender, age, education level, monthly income, and occupation. These demographics can
be compared in some cases to the Thai population, though there is no specific
demographic breakdown of LCC passengers in Thailand.
The basic demographic characteristics collected were gender and age. The gender
of the sample (Figure 5) is imbalanced, with 61% of respondents (n = 471) being female.
This is out of proportion with the Thai sex ratio, which is 0.98 males/female (Index
Mundi, 2014), equivalent to a population that is 49% male. However, other studies on
passenger satisfaction have shown similar imbalances; for example, one study showed a
56% female participation rate (Charoensettasilp & Wu, 2013). Since the studies used the
same technique for data collection, it is possible that there could be a difference between
male and female passengers that makes women more likely to respond.

76
Figure 5. Gender of respondents.
The age distribution (Figure 6) shows that the biggest group of respondents is
aged 21 to 30 years (32%) followed by 31 to 40 years (19%). Overall, the population
distribution is roughly similar to Thailand’s age structure, where these are the largest age
groups (Index Mundi, 2014) although the youngest age groups are not represented since
they were not targeted and are unlikely to be travelling on their own. This study had
similar distribution to Charoensettasilp and Wu (2013) for age ranges 21-30 years and
more than 50 years. However, it had a much higher number of younger passengers (15%
compared to 2.5%) with commensurate reductions in travelers aged 31 to 50.
Male, 307, 39%
Female, 472,
61%
Missing
data, 2, 0%
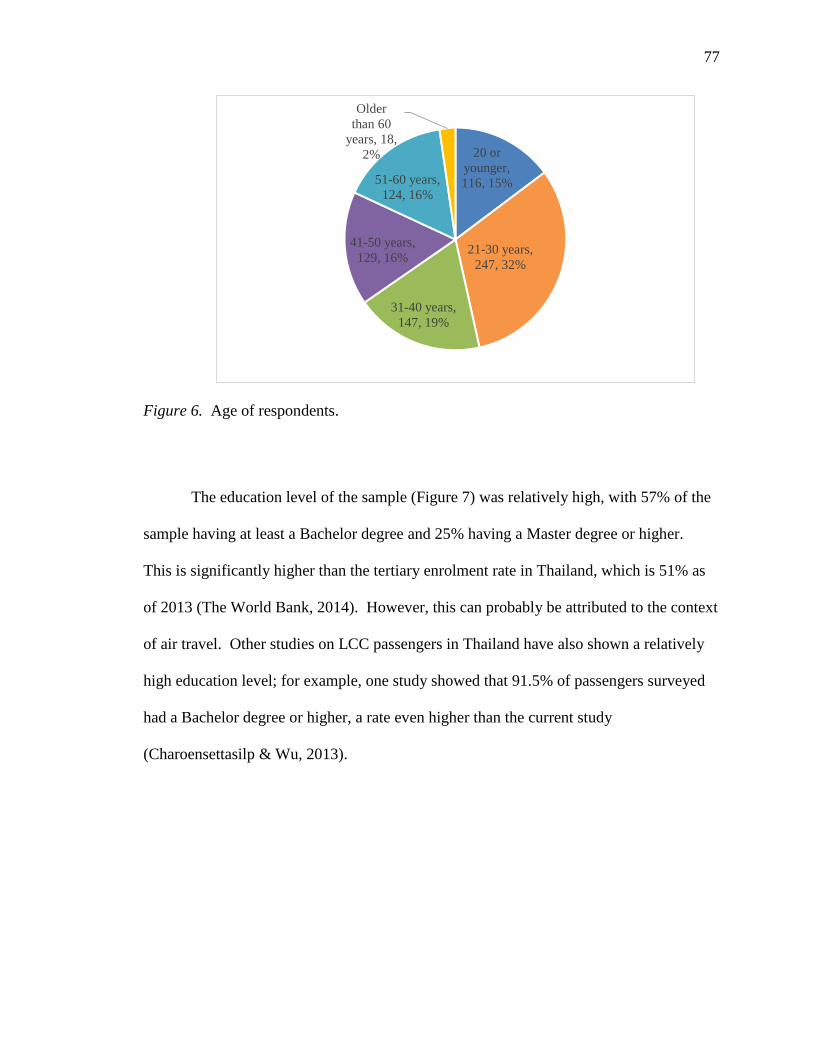
77
Figure 6. Age of respondents.
The education level of the sample (Figure 7) was relatively high, with 57% of the
sample having at least a Bachelor degree and 25% having a Master degree or higher.
This is significantly higher than the tertiary enrolment rate in Thailand, which is 51% as
of 2013 (The World Bank, 2014). However, this can probably be attributed to the context
of air travel. Other studies on LCC passengers in Thailand have also shown a relatively
high education level; for example, one study showed that 91.5% of passengers surveyed
had a Bachelor degree or higher, a rate even higher than the current study
(Charoensettasilp & Wu, 2013).
20 or
younger,
116, 15%
21-30 years,
247, 32%
31-40 years,
147, 19%
41-50 years,
129, 16%
51-60 years,
124, 16%
Older
than 60
years, 18,
2%
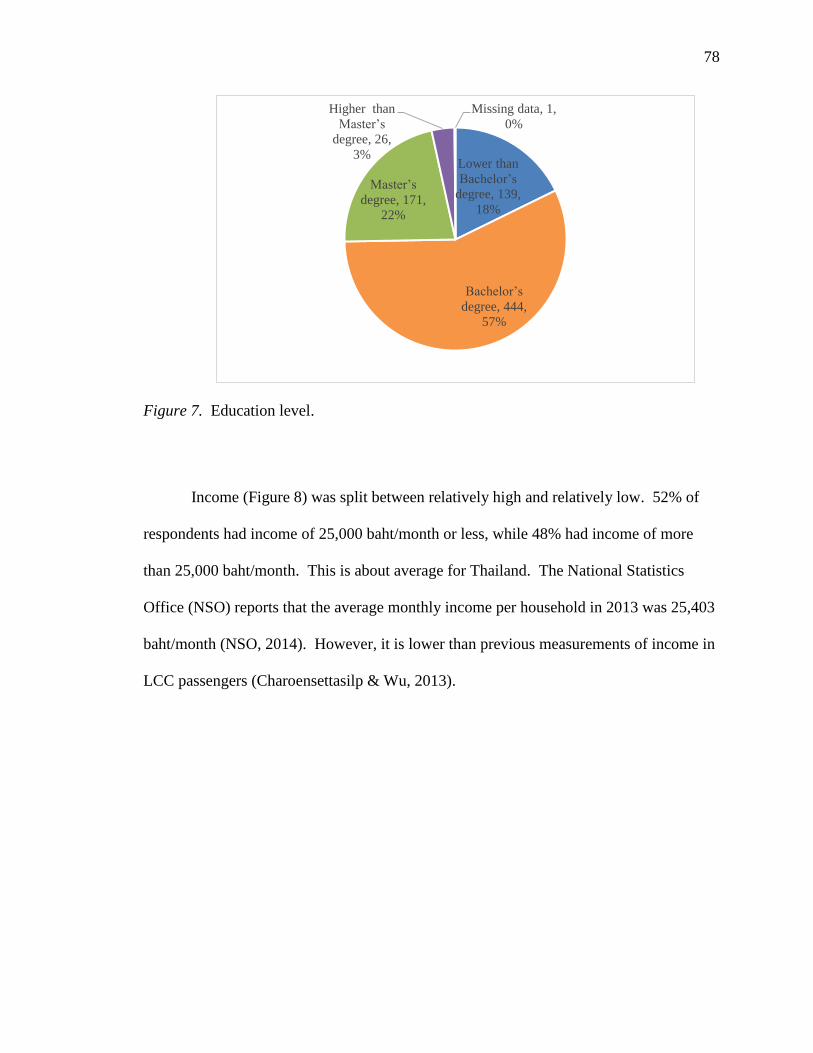
78
Figure 7. Education level.
Income (Figure 8) was split between relatively high and relatively low. 52% of
respondents had income of 25,000 baht/month or less, while 48% had income of more
than 25,000 baht/month. This is about average for Thailand. The National Statistics
Office (NSO) reports that the average monthly income per household in 2013 was 25,403
baht/month (NSO, 2014). However, it is lower than previous measurements of income in
LCC passengers (Charoensettasilp & Wu, 2013).
Lower than
Bachelor’s
degree, 139,
18%
Bachelor’s
degree, 444,
57%
Master’s
degree, 171,
22%
Higher than
Master’s
degree, 26,
3%
Missing data, 1,
0%
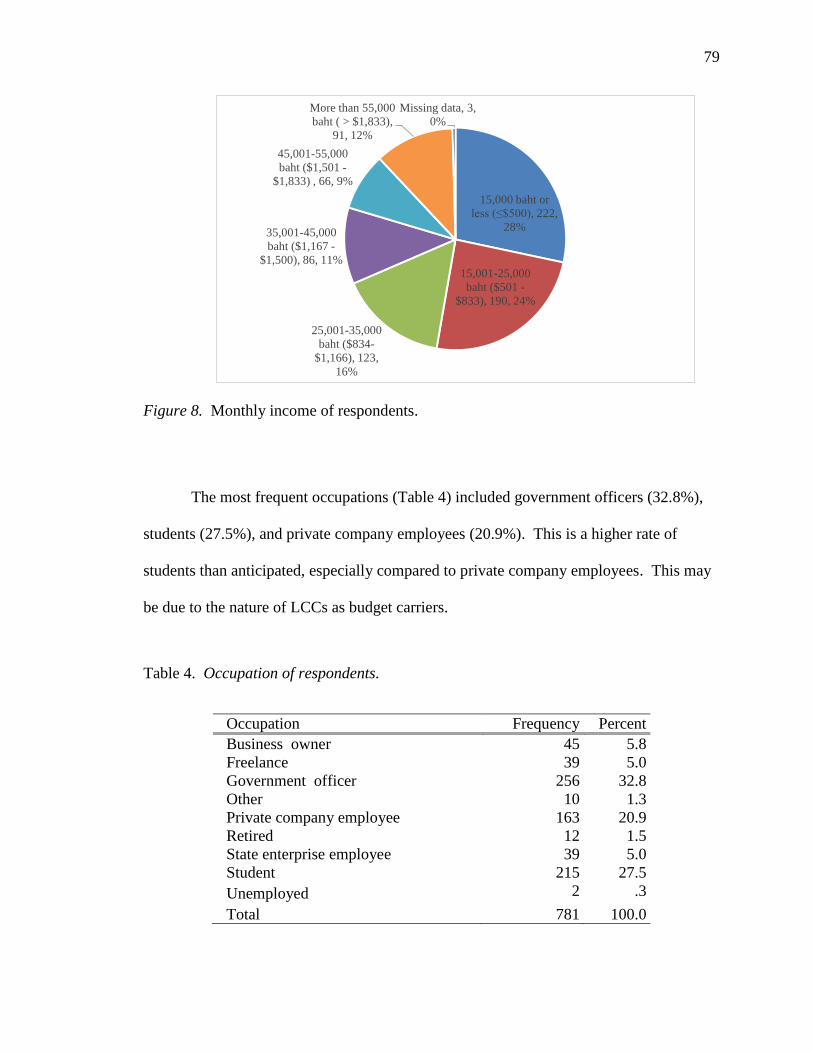
79
Figure 8. Monthly income of respondents.
The most frequent occupations (Table 4) included government officers (32.8%),
students (27.5%), and private company employees (20.9%). This is a higher rate of
students than anticipated, especially compared to private company employees. This may
be due to the nature of LCCs as budget carriers.
Table 4. Occupation of respondents.
Occupation Frequency Percent
Business owner 45 5.8
Freelance 39 5.0
Government officer 256 32.8
Other 10 1.3
Private company employee 163 20.9
Retired 12 1.5
State enterprise employee 39 5.0
Student 215 27.5
Unemployed 2 .3
Total 781 100.0
15,000 baht or
less (≤$500), 222,
28%
15,001-25,000
baht ($501 -
$833), 190, 24%
25,001-35,000
baht ($834-
$1,166), 123,
16%
35,001-45,000
baht ($1,167 -
$1,500), 86, 11%
45,001-55,000
baht ($1,501 -
$1,833) , 66, 9%
More than 55,000
baht ( > $1,833),
91, 12%
Missing data, 3,
0%

80
Travel Experience
Participants were also asked questions about their previous air travel experience,
including frequency of travel by LCC, LCC destinations, the main purpose of travelling
by LCC, and information and purchasing channels for airlines.
Participants were asked how frequently they travelled by LCC (Figure 9). There
was a very wide spread of answers for this question, but the majority of the passengers
travelled more than three times a year (35%) or two to three times a year (25%). The
remaining 40% could be classified as infrequent or first-time LCC passengers.
Figure 9. Frequency of travel via LCCs.
Figure 10 shows the location of LCC flights. Overwhelmingly, travelers used
LCCs for domestic travel (83%), while 12% used LCCs to travel in the South East Asian
region and 5% to the broader Asia Pacific region or Australia. This is a bit higher than
This is my
first time, 96,
12%
Less than once
per year, 111,
14%
Once per
year , 109,
14%2 to 3 times per
year, 194, 25%
More than 3
times per year,
269, 35%
Missing
data, 2, 0%
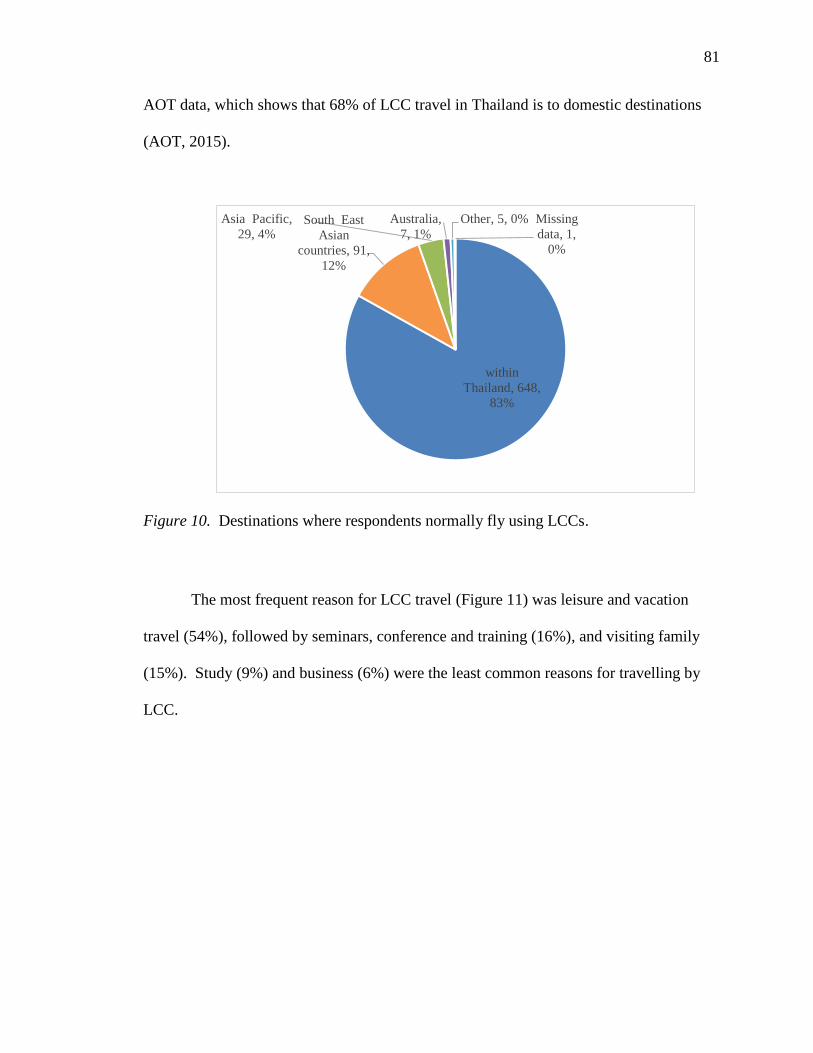
81
AOT data, which shows that 68% of LCC travel in Thailand is to domestic destinations
(AOT, 2015).
Figure 10. Destinations where respondents normally fly using LCCs.
The most frequent reason for LCC travel (Figure 11) was leisure and vacation
travel (54%), followed by seminars, conference and training (16%), and visiting family
(15%). Study (9%) and business (6%) were the least common reasons for travelling by
LCC.
within
Thailand, 648,
83%
South East
Asian
countries, 91,
12%
Asia Pacific,
29, 4%
Australia,
7, 1%
Other, 5, 0% Missing
data, 1,
0%

82
Figure 11. Main purpose of travelling by LCC.
Respondents were asked to select which (if any) information channels they used
for LCC flights (Figure 12). On average, respondents selected 2.36 responses for this
question. The most frequently selected items included company websites (55.1% of
respondents), search engines (54.7% of respondents), social media (36.1% of
respondents), family and friends (33.3% of respondents), and television advertising
(30.1% of respondents).
Leisure /
Vacation, 422,
54%
Seminar/Conference/Trai
ning, 128, 16%
Visiting
family, 107,
14%
Study,
70, 9%
Business, 44, 6%Other, 6, 1%
Medical
treatment, 3, 0%Missing
data, 1,
0%
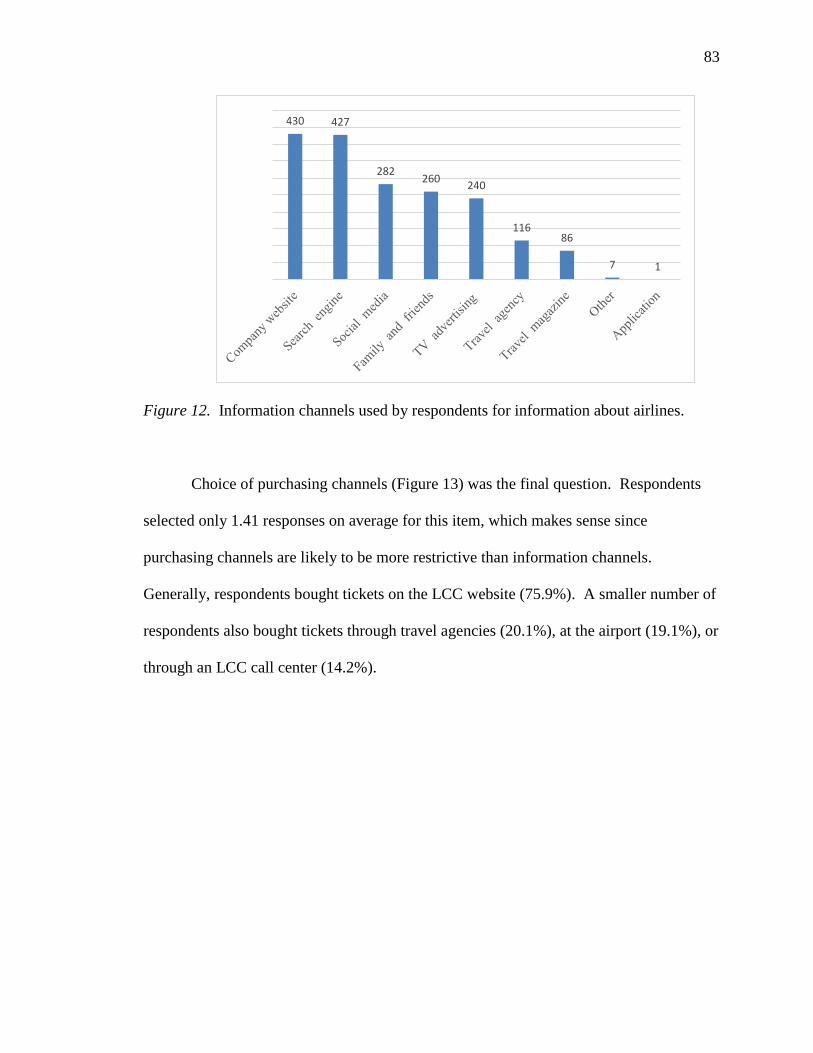
83
Figure 12. Information channels used by respondents for information about airlines.
Choice of purchasing channels (Figure 13) was the final question. Respondents
selected only 1.41 responses on average for this item, which makes sense since
purchasing channels are likely to be more restrictive than information channels.
Generally, respondents bought tickets on the LCC website (75.9%). A smaller number of
respondents also bought tickets through travel agencies (20.1%), at the airport (19.1%), or
through an LCC call center (14.2%).
430 427
282260
240
11686
7 1
84
Figure 13. Purchasing channels for LCC tickets.
Descriptive Statistics
The first findings discussed are the descriptive statistics. Descriptive statistics
were calculated for all constructs (Attitude, Subjective Norms, Perceived Behavioral
Control, Price, Service Quality, Airline Reputation, Airline Safety, Route Availability and
Convenience, Frequent Flier Program, Buying Intention, and Buying Behavior). Mean
and standard deviation were calculated for all individual items in the variable scales.
Mean and standard deviation are presented here for each item.
Passenger. The first group of descriptive statistics is the Passenger constructs.
These variables, derived from the TPB, are related to the passenger’s internal cognition
and existing attitudes and beliefs rather than the offering of the airline directly. They
include the Attitude, Subjective Norms, and Perceived Behavioral Control scales.
593
157 149111
6817 1 1 1
85
Tables 5, 6, and 7 present the descriptive statistics for Attitude, Subjective Norms,
and Perceived Behavioral Control, respectively. These responses range from M = 3.55
(“I fly with low cost airlines because my friends/family recommend it) to M = 4.14 (“Low
cost airlines are another good alternative choice of airline”). In general, results can be
described as moderately positive for all items.
Table 5. Descriptive statistics - attitude scale.
Question items Mean
(N=781)
Std.
Deviation
Low cost airlines are another good
alternative choice of airline. 4.14 .70923
I have a good perception toward low cost
airlines. 3.66 .69092
My overall attitude toward low cost
airlines is positive. 3.80 .65832
Table 6. Descriptive statistics – subjective norms scale.
Question items Mean
(N=781)
Std.
Deviation
I fly with low cost airlines because my
friends/family recommend it. 3.55 .81920
I feel more confident with the service of
low cost airlines because my
friends/family use it.
3.56 .78023
Most of my friends use low cost airlines. 3.77 .80987

86
Table 7. Descriptive statistics – perceived behavioral control scale.
Question items Mean
(N=781)
Std.
Deviation
I have no difficulty buying the ticket
from a low cost airline. 3.89 .82971
The choice of selecting a type of airline
ticket is entirely up to me. 4.00 .73116
I feel the choice of airline selection is
under my control. 3.97 .74963
Airline. The second group of descriptive statistics is the Airline constructs.
These constructs, unlike the previous group, are mostly under the airline’s direct or
indirect control. They include elements of the marketing mix (such as Price, Route
Availability and Convenience, and Frequent Flier Program) as well as service quality and
execution elements (Service Quality, Airline Reputation, and Airline Safety). These
elements may be one of the factors in the formation of the personal factors discussed
above, but this is not directly tested. It is important to note that the measurement of these
variables is not objective but is instead based on passenger perceptions of the programs.
These results are shown in Tables 8 (Price), 9 (Service Quality), 10 (Airline Reputation),
11 (Airline Safety), 12 (Route Availability and Convenience), and 13 (Frequent Flier
Programs).
These results were also generally positive, with the exception of Frequent Flier
Programs, which were noticeably lower than other scores. The results ranged from M =
3.40 (“I think that the frequent flier program offered by low cost airlines is one of the
main reasons to use the service”) to M = 3.92 (“The price of a low cost airline is
reasonable for me”). The gap between Frequent Flier programs and the other factors was
87
not unexpected since, as noted in the literature review, many LCCs actually do not use
frequent flier programs.
Table 8. Descriptive statistics - price scale.
Question items Mean
(N=781)
Std.
Deviation
The price of a low cost airline is
reasonable for me. 3.92 .72006
The price of a low cost airline meets my
needs. 3.81 .74404
I am satisfied with the price of a low cost
airline. 3.85 .73577
Table 9. Descriptive statistics – service quality scale.
Question items Mean
(N=781)
Std.
Deviation
I think service quality provided by a low
cost airline is great compared to the price
they offer.
3.57 .75060
I am satisfied with service quality
provided by low cost airlines. 3.60 .66694
Overall service quality of low cost
airlines is good. 3.73 .65482
Table 10. Descriptive statistics – airline reputation scale.
Question items Mean
(N=781)
Std.
Deviation
I usually perceive good information
about low cost airlines. 3.54 .70148
I believe that low cost airlines have a
good reputation. 3.58 .69037
I think low cost airlines have a good
public republic reputation. 3.70 .69860
88
Table 11. Descriptive statistics – airline safety scale.
Question items Mean
(N=781)
Std.
Deviation
Safety system is the most significant
factor that I consider when buying airline
ticket.
3.90 .80909
I only use the airline that has a good
reputation on its safety system. 3.85 .77689
I believe that low cost airlines have a
good safety system. 3.56 .67604
Table 12. Descriptive statistics – route availability and convenience scale.
Question items Mean
(N=781)
Std.
Deviation
The number of routes is the main reason
that influences me to use airline service. 3.80 .70640
I am satisfied with timing and flight
schedule provided by low cost airlines. 3.73 .66304
The route availability offered by low
cost airlines meets my expectation. 3.68 .66124
Table 13. Descriptive statistics – frequent flier programs scale.
Question items Mean
(N=781)
Std.
Deviation
I think that the frequent flier program
offered by low cost airlines is one of the
main reasons that influence me to use
airline service.
3.40 .82069
I think frequent flier program offerings
are valuable. 3.41 .83019
I buy ticket of this airline because of
benefits of flier program. 3.08 .91900
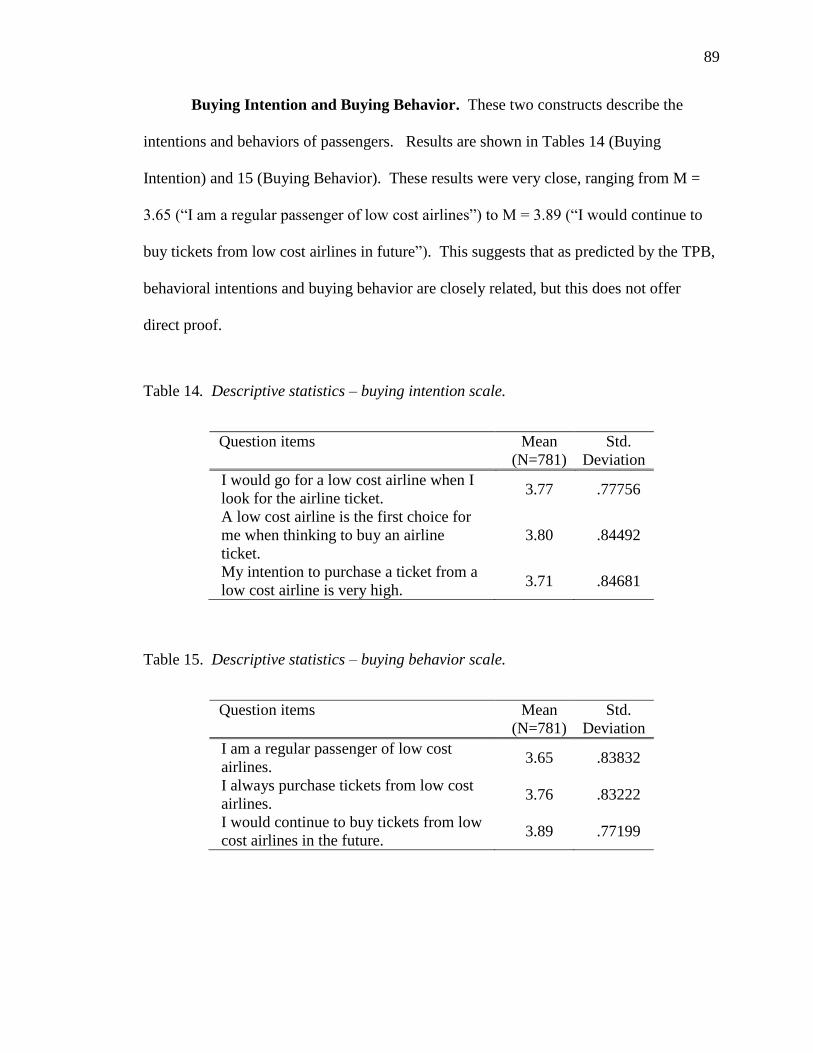
89
Buying Intention and Buying Behavior. These two constructs describe the
intentions and behaviors of passengers. Results are shown in Tables 14 (Buying
Intention) and 15 (Buying Behavior). These results were very close, ranging from M =
3.65 (“I am a regular passenger of low cost airlines”) to M = 3.89 (“I would continue to
buy tickets from low cost airlines in future”). This suggests that as predicted by the TPB,
behavioral intentions and buying behavior are closely related, but this does not offer
direct proof.
Table 14. Descriptive statistics – buying intention scale.
Question items Mean
(N=781)
Std.
Deviation
I would go for a low cost airline when I
look for the airline ticket. 3.77 .77756
A low cost airline is the first choice for
me when thinking to buy an airline
ticket.
3.80 .84492
My intention to purchase a ticket from a
low cost airline is very high. 3.71 .84681
Table 15. Descriptive statistics – buying behavior scale.
Question items Mean
(N=781)
Std.
Deviation
I am a regular passenger of low cost
airlines. 3.65 .83832
I always purchase tickets from low cost
airlines. 3.76 .83222
I would continue to buy tickets from low
cost airlines in the future. 3.89 .77199

90
Reliability and Validity
Prior to conducting the actual questionnaire, 30 sets of pilot questionnaire were
collected. These 30 sets of questionnaire were tested using Cronbach’s alpha to see the
reliability, and factor loading to test validity of the pilot questionnaire before conducting
the actual questionnaire collection.
The Cronbach’s alpha results (Table 16) show that the lowest score is Route
Availability and Convenience (α = 0.814), and the highest score is Frequent Flier
Programs (α = 0.897). All scales fell into the established acceptance band (0.70 < α <
0.95). As a result, all scales were accepted for internal consistency, and no items were
eliminated at this stage.
Table 16. Cronbach’s alpha test outcomes.
Variables Statements Scores
Attitude
A1 Low cost airlines are another good alternative
choice of airline.
.870 A2 I have a good perception toward low cost airlines.
A3 My overall attitude toward low cost airlines is
positive.
Subjective
Norms
S1 I fly with low cost airlines because my
friends/family recommend it.
.862 S2 I feel more confident with the service of low cost
airlines because my friends/family use it.
S3 Most of my friends use low cost airlines.
Perceived
Behavior
Control
PB1 I have no difficulty buying the ticket from a low
cost airline.
.815 PB2 The choice of selecting a type of airline ticket is
entirely up to me.
PB3 I feel the choice of airline selection is under my
control.
Price
P1 The price of a low cost airline is reasonable for
me. .835
P2 The price of a low cost airline meets my needs.
P3 I am satisfied with the price of a low cost airline.
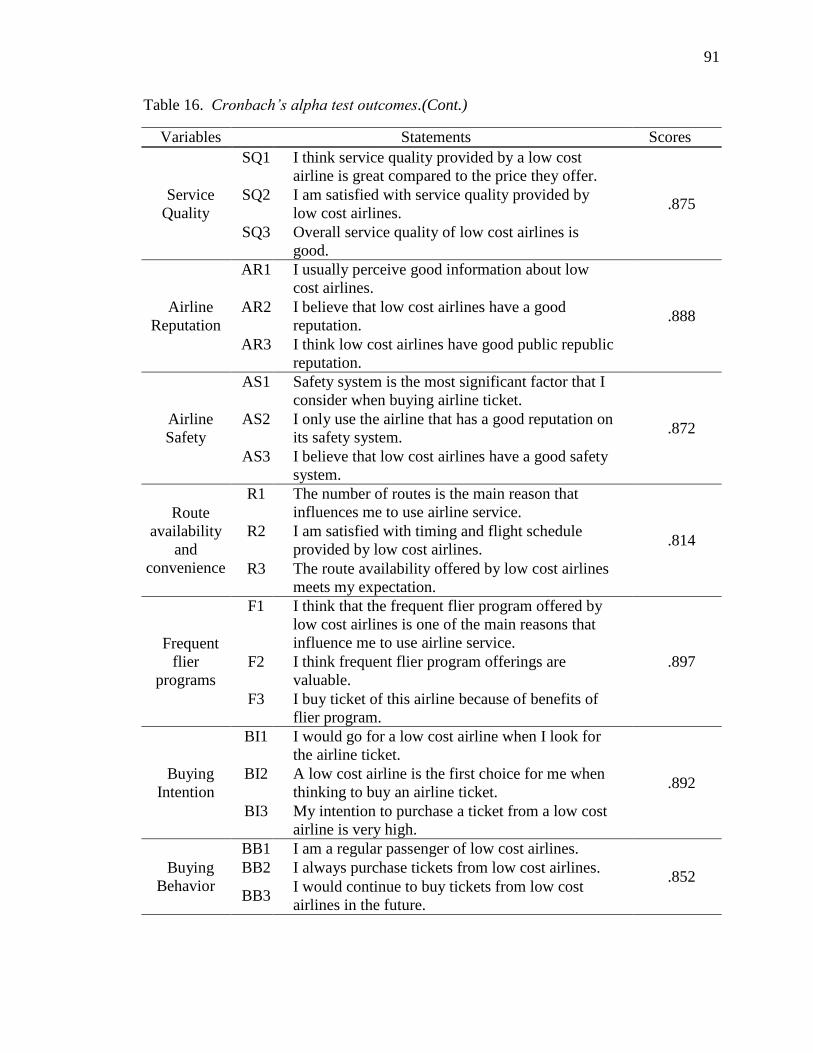
91
Table 16. Cronbach’s alpha test outcomes.(Cont.)
Variables Statements Scores
Service
Quality
SQ1 I think service quality provided by a low cost
airline is great compared to the price they offer.
.875 SQ2 I am satisfied with service quality provided by
low cost airlines.
SQ3 Overall service quality of low cost airlines is
good.
Airline
Reputation
AR1 I usually perceive good information about low
cost airlines.
.888 AR2 I believe that low cost airlines have a good
reputation.
AR3 I think low cost airlines have good public republic
reputation.
Airline
Safety
AS1 Safety system is the most significant factor that I
consider when buying airline ticket.
.872 AS2 I only use the airline that has a good reputation on
its safety system.
AS3 I believe that low cost airlines have a good safety
system.
Route
availability
and
convenience
R1 The number of routes is the main reason that
influences me to use airline service.
.814 R2 I am satisfied with timing and flight schedule
provided by low cost airlines.
R3 The route availability offered by low cost airlines
meets my expectation.
Frequent
flier
programs
F1 I think that the frequent flier program offered by
low cost airlines is one of the main reasons that
influence me to use airline service.
.897 F2 I think frequent flier program offerings are
valuable.
F3 I buy ticket of this airline because of benefits of
flier program.
Buying
Intention
BI1 I would go for a low cost airline when I look for
the airline ticket.
.892 BI2 A low cost airline is the first choice for me when
thinking to buy an airline ticket.
BI3 My intention to purchase a ticket from a low cost
airline is very high.
Buying
Behavior
BB1 I am a regular passenger of low cost airlines.
.852 BB2 I always purchase tickets from low cost airlines.
BB3 I would continue to buy tickets from low cost
airlines in the future.
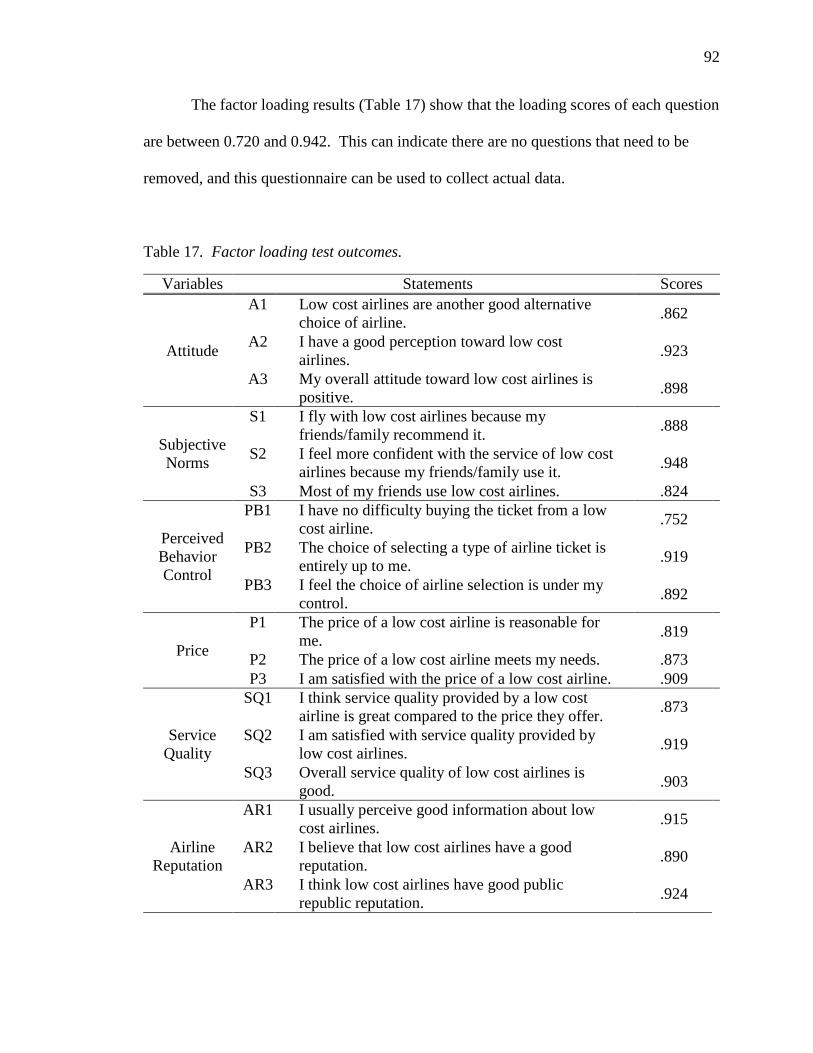
92
The factor loading results (Table 17) show that the loading scores of each question
are between 0.720 and 0.942. This can indicate there are no questions that need to be
removed, and this questionnaire can be used to collect actual data.
Table 17. Factor loading test outcomes.
Variables Statements Scores
Attitude
A1 Low cost airlines are another good alternative
choice of airline. .862
A2 I have a good perception toward low cost
airlines. .923
A3 My overall attitude toward low cost airlines is
positive. .898
Subjective
Norms
S1 I fly with low cost airlines because my
friends/family recommend it. .888
S2 I feel more confident with the service of low cost
airlines because my friends/family use it. .948
S3 Most of my friends use low cost airlines. .824
Perceived
Behavior
Control
PB1 I have no difficulty buying the ticket from a low
cost airline. .752
PB2 The choice of selecting a type of airline ticket is
entirely up to me. .919
PB3 I feel the choice of airline selection is under my
control. .892
Price
P1 The price of a low cost airline is reasonable for
me. .819
P2 The price of a low cost airline meets my needs. .873
P3 I am satisfied with the price of a low cost airline. .909
Service
Quality
SQ1 I think service quality provided by a low cost
airline is great compared to the price they offer. .873
SQ2 I am satisfied with service quality provided by
low cost airlines. .919
SQ3 Overall service quality of low cost airlines is
good. .903
Airline
Reputation
AR1 I usually perceive good information about low
cost airlines. .915
AR2 I believe that low cost airlines have a good
reputation. .890
AR3 I think low cost airlines have good public
republic reputation. .924

93
Table 17. Factor loading test outcomes. (Cont.)
Variables Statements Scores
Airline
Safety
AS1 Safety system is the most significant factor that I
consider when buying airline ticket. .863
AS2 I only use the airline that has a good reputation
on its safety system. .948
AS3 I believe that low cost airlines have a good safety
system. .877
Route
availability
and
convenience
R1 The number of routes is the main reason that
influences me to use airline service. .782
R2 I am satisfied with timing and flight schedule
provided by low cost airlines. .883
R3 The route availability offered by low cost airlines
meets my expectation. .893
Frequent
flier
programs
F1 I think that the frequent flier program offered by
low cost airlines is one of the main reasons that
influence me to use airline service.
.920
F2 I think frequent flier program offerings are
valuable. .902
F3 I buy ticket of this airline because of benefits of
flier program. .911
Buying
Intention
BI1 I would go for a low cost airline when I look for
the airline ticket. .904
BI2 A low cost airline is the first choice for me when
thinking to buy an airline ticket. .941
BI3 My intention to purchase a ticket from a low cost
airline is very high. .889
Buying
Behavior
BB1 I am a regular passenger of low cost airlines. .890
BB2 I always purchase tickets from low cost airlines. .898
BB3 I would continue to buy tickets from low cost
airlines in the future. .882
Hypothesis Testing
The final stage of analysis was hypothesis testing. The hypothesis testing process
was conducted using SEM. SEM was chosen as an analytical tool because it analyzes and
interprets the entire model (Hair, Black, Babin, & Anderson, 2010). This is a better
approach than the alternative of single or multiple regression, which tests pairwise
94
relationships. SEM was conducted in AMOS, an SPSS add-on for relationship-based
analysis. This is the same tool used in the CFA process above.
Model fitting and adjustment. The results of the initial round of SEM indicated
that the model was not fully fitted, based on the CFI (.781) and RMSEA (.094). Based on
Hair, Black, Babin, and Anderson (2010), the CFI value range is 0 to 1, and the suitable
CFI should be higher than 0.9. Moreover, RMSEA should be lower than 0.05 to indicate
a good model fit, and 0.05 to 0.08 indicates a reasonable model fit (Hair, Black, Babin, &
Anderson, 2010). In order to fix this problem, the modification index (MI) was used to
adjust the proposed model until a satisfactory fit was achieved. However, MI did not lead
the model formation, which is an inappropriate use of the tool (Hair, Black, Babin, &
Anderson, 2010). The author then performed CFA to help identify the problem and
adjust the model.
CFA was performed on the entire sample (n = 781). The goal of this analysis was
to test the full model for convergent and discriminant validity. Criteria for acceptance for
models included CR > 0.70 and AVE > 0.5 based on standard acceptance bounds for
reliability (CR) and convergent validity (AVE) (Hair, Black, Babin, & Anderson, 2010).
Discriminant validity was tested by comparing square root of AVE wih the correlation
coefficient of that construct with other constructs (Hair, Black, Babin & Anderson, 2010).
Two further factors were used to determine the fit of the overall model: these included
CFI > 0.90 and RMSEA < 0.06 (Hair, Black, Babin, & Anderson, 2010). In order to
handle potentially unreliable factors or factors that did not pass validity test, it was
determined that all factors must pass the test for reliability (CR > 0.70). Factors that
failed either the convergent validity test (AVE > 0.5) or the discriminant validity test

95
(√𝐴𝑉𝐸 > 𝐶𝑜𝑟𝑟𝑒𝑙𝑎𝑡𝑖𝑜𝑛 𝐶𝑜𝑒𝑓𝑓𝑖𝑐𝑖𝑒𝑛𝑡) would be retained, on the basis that these factors
would be valid on at least one axis. However, any factors that failed both tests would be
eliminated, on the basis that they did not show either of the types of validity that were
required.
Figure 14 and Table 18 show the CFA model prior to adjustment. The overall fit
of the model was acceptable based on the decision criteria (CFI = 0.940, RMSEA =
0.052, GFI = 0.903, NFI = 0.913, CMIN/DF = 3.076, PCLOSE = 0.199). However,
individual factors within the model did not show as much consistency. All of the factors
met the reliability criterion (CR > 0.7), as shown in Table 18. Two factors did not meet
the convergent validity criterion (AVE > 0.5), including Airline Safety (AVE = 0.446)
and Attitude (AVE = 0.476). This indicates that the underlying latent variables for these
two factors are poorly explained by the observed variables (Hair, Black, Babin &
Anderson, 2010). Subjective Norms (AVE = 0.503) was only just over the threshold,
indicating a relatively poor but not invalid fit.
Results for the discriminant validity criterion (√𝐴𝑉𝐸 > Corrlation Coeeficient)
were not as positive. In fact, as Table 18 shows, six factors failed this discriminant
validity test. This indicates that these factors to some extent have problems with latent
variables being explained better by external factors than their own observed variable
(Hair, Black, Babin & Anderson, 2010).
Neither failure of the convergent validity criterion nor the discriminant validity
criterion on its own would require exclusion from this test. However, failure of both
criteria meant that the factors may be too poorly differentiated from other factors and too
poorly explained to contribute to the model. The only factors that failed both tests were
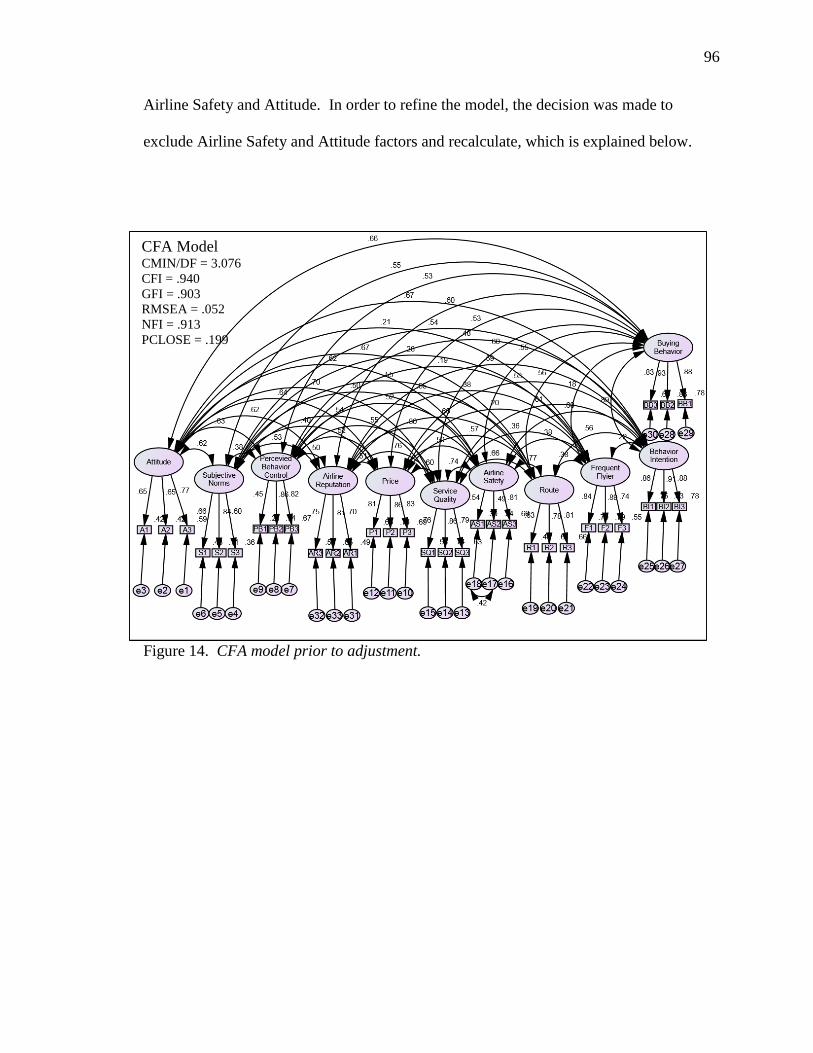
96
Airline Safety and Attitude. In order to refine the model, the decision was made to
exclude Airline Safety and Attitude factors and recalculate, which is explained below.
Figure 14. CFA model prior to adjustment.
CFA Model CMIN/DF = 3.076
CFI = .940
GFI = .903
RMSEA = .052
NFI = .913
PCLOSE = .199
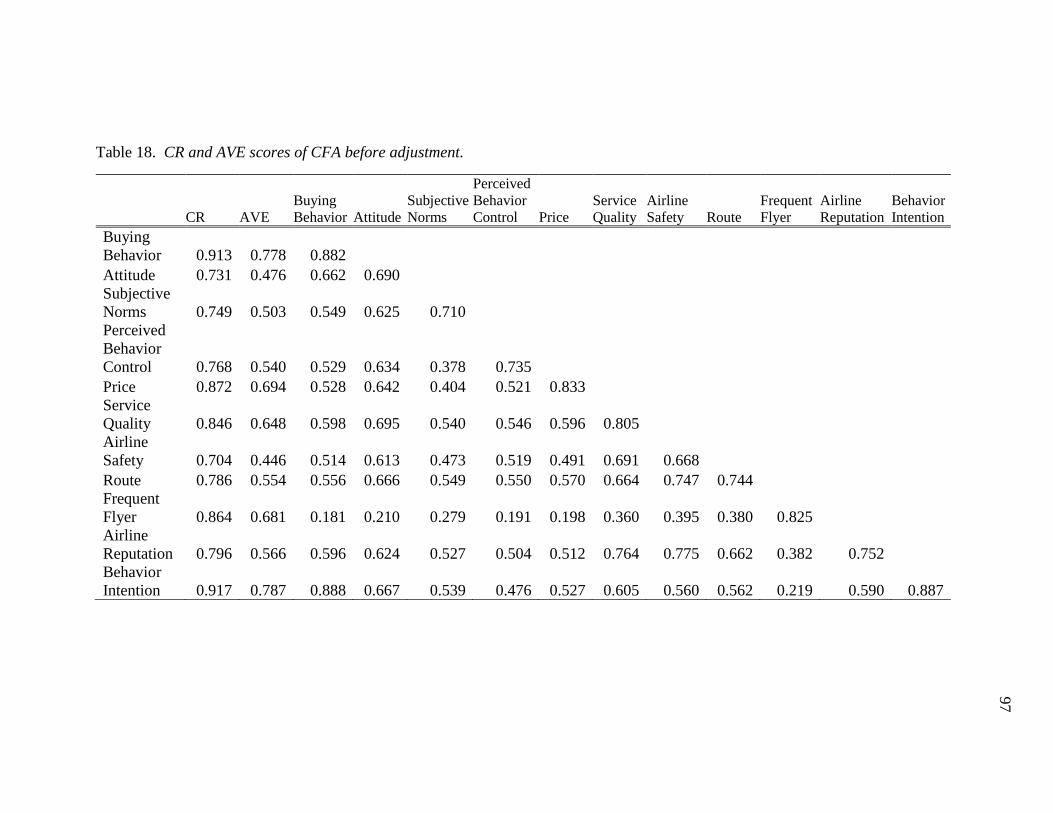
97
Table 18. CR and AVE scores of CFA before adjustment.
CR AVE
Buying
Behavior Attitude
Subjective
Norms
Perceived
Behavior
Control Price
Service
Quality
Airline
Safety Route
Frequent
Flyer
Airline
Reputation
Behavior
Intention
Buying
Behavior 0.913 0.778 0.882
Attitude 0.731 0.476 0.662 0.690
Subjective
Norms 0.749 0.503 0.549 0.625 0.710
Perceived
Behavior
Control 0.768 0.540 0.529 0.634 0.378 0.735
Price 0.872 0.694 0.528 0.642 0.404 0.521 0.833
Service
Quality 0.846 0.648 0.598 0.695 0.540 0.546 0.596 0.805
Airline
Safety 0.704 0.446 0.514 0.613 0.473 0.519 0.491 0.691 0.668
Route 0.786 0.554 0.556 0.666 0.549 0.550 0.570 0.664 0.747 0.744
Frequent
Flyer 0.864 0.681 0.181 0.210 0.279 0.191 0.198 0.360 0.395 0.380 0.825
Airline
Reputation 0.796 0.566 0.596 0.624 0.527 0.504 0.512 0.764 0.775 0.662 0.382 0.752
Behavior
Intention 0.917 0.787 0.888 0.667 0.539 0.476 0.527 0.605 0.560 0.562 0.219 0.590 0.887
98
The initial adjustment process involved eliminating weak items in the constructs,
as determined by inter-item correlations, in order to attempt to improve the model fitting.
Items were removed one at a time in order to improve the fit, and then CFA was re-run.
However, this was unsuccessful at improving the model fitting enough to make it
acceptable based on the established characteristics.
The author then tried removing a single factor (Airline Safety), but this was still
inadequate to improve the model fitting sufficiently. Ultimately, the model fitting desired
could only be achieved by eliminating both of the low-CR factors, Airline Safety and
Attitude.
Figure 15 and Table 19 show the CFA model following adjustment by removal of
Airline Safety and Attitude. This shows that all variables in the adjusted model have
appropriate CR and AVE for the final model. The adjusted model also showed slightly
improved fit characteristics (CFI = 0.957, RMSEA = 0.049) compared to the naïve model
tested above (CFI = 0.940, RMSEA = 0.052). CMIN/DF values changed as well, with
the original model (CMIN/DF = 3.076) being higher than the refined model (CMIN/DF =
2.892). This indicates the model fit was improved, although the refined model is still in
the range that would be considered acceptable but not very good (Hair, Black, Babin &
Anderson, 2010). The final fit value assessed, PCLOSE, also improved. The initial model
(PCLOSE = 0.199) indicated that the model was poorly fitted (PCLOSE ≤ 0.5) (Hair,
Black, Babin & Anderson, 2010). The revised model showed significant improvement
and what is classified as a good fit according to the PCLOSE value (PCLOSE = 0.617).
Thus, the refined model without Airline Safety and Attitude showed significantly better
fit than the naïve model.
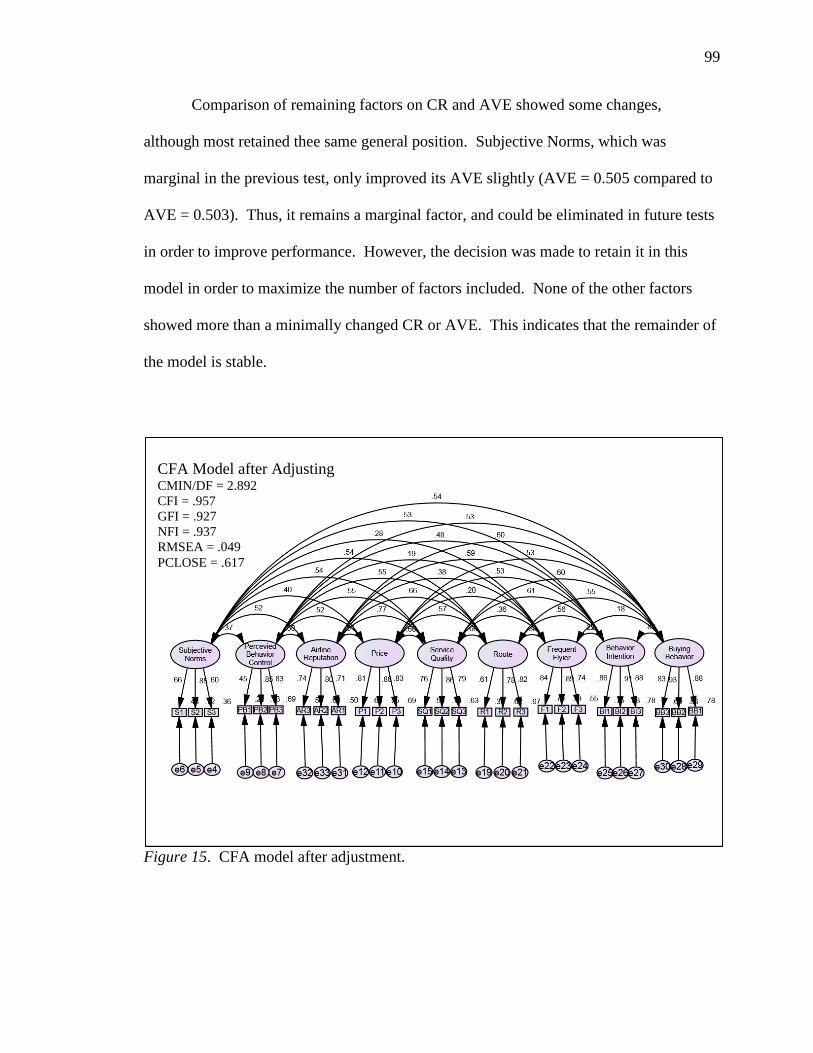
99
Comparison of remaining factors on CR and AVE showed some changes,
although most retained thee same general position. Subjective Norms, which was
marginal in the previous test, only improved its AVE slightly (AVE = 0.505 compared to
AVE = 0.503). Thus, it remains a marginal factor, and could be eliminated in future tests
in order to improve performance. However, the decision was made to retain it in this
model in order to maximize the number of factors included. None of the other factors
showed more than a minimally changed CR or AVE. This indicates that the remainder of
the model is stable.
Figure 15. CFA model after adjustment.
CFA Model after Adjusting CMIN/DF = 2.892
CFI = .957
GFI = .927
NFI = .937
RMSEA = .049
PCLOSE = .617
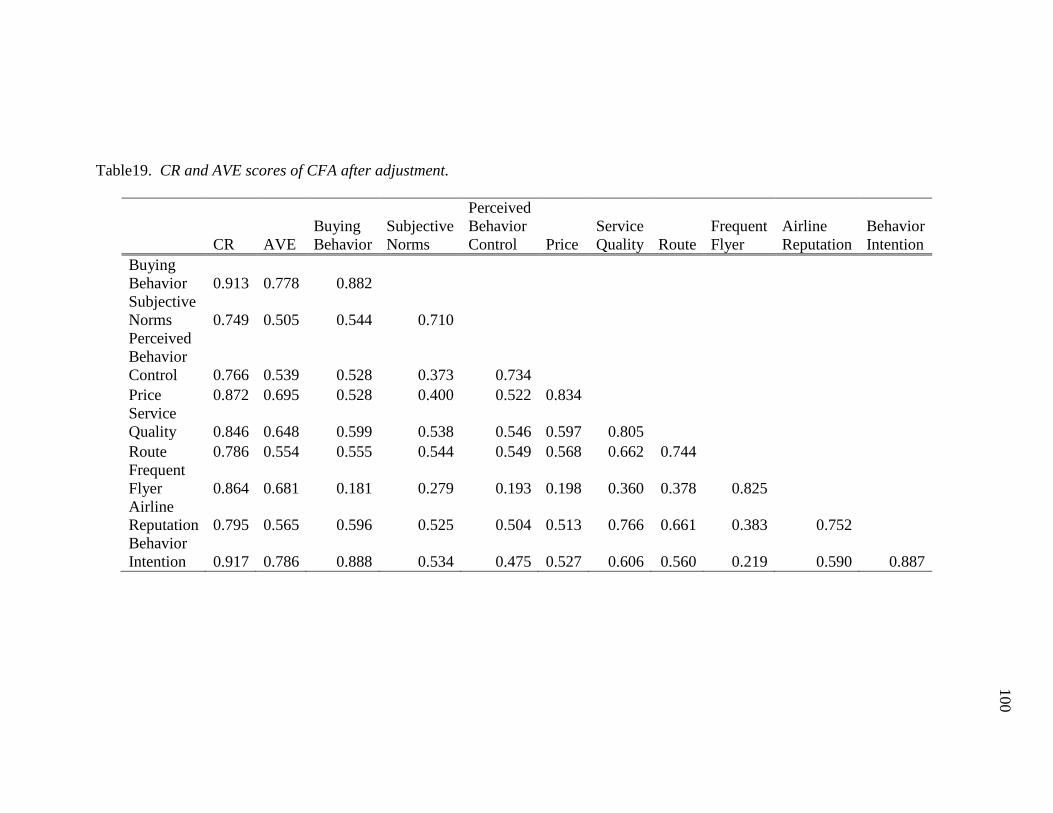
100
Table19. CR and AVE scores of CFA after adjustment.
CR AVE
Buying
Behavior
Subjective
Norms
Perceived
Behavior
Control Price
Service
Quality Route
Frequent
Flyer
Airline
Reputation
Behavior
Intention
Buying
Behavior 0.913 0.778 0.882
Subjective
Norms 0.749 0.505 0.544 0.710
Perceived
Behavior
Control 0.766 0.539 0.528 0.373 0.734
Price 0.872 0.695 0.528 0.400 0.522 0.834
Service
Quality 0.846 0.648 0.599 0.538 0.546 0.597 0.805
Route 0.786 0.554 0.555 0.544 0.549 0.568 0.662 0.744
Frequent
Flyer 0.864 0.681 0.181 0.279 0.193 0.198 0.360 0.378 0.825
Airline
Reputation 0.795 0.565 0.596 0.525 0.504 0.513 0.766 0.661 0.383 0.752
Behavior
Intention 0.917 0.786 0.888 0.534 0.475 0.527 0.606 0.560 0.219 0.590 0.887

101
Based on the improved model fit when Attitude and Airline Safety were removed,
the author has adjusted and proposed a new model for this research. The new model was
tested using the SEM model and adjusted follow Modification Index. The final SEM
model (Figure 16) showed acceptable fit statistics (CFI = 0.957, RMSEA = 0.049) based
on the established thresholds discussed above (Hair, Black, Babin, & Anderson, 2010).
This resulted in a fitted model that reflected the data as well as the theoretical framework.
However, as noted above, two of the variables had already been removed, and as a
result there was some variance between what was proposed for the research and how it
was implemented.
Summary of hypothesis outcomes. Table 20 summarizes the hypotheses that
were proposed in the research and their outcomes. Three of the hypotheses were
eliminated because of the removal of Attitude and Airline Safety from the testing model
following the CFA process, as described above. These hypotheses included Hypothesis
1, Hypothesis 4, and Hypothesis 8. Hypotheses 2, 3, 5, 6, and 7 were supported, as was
Hypothesis 11. Hypotheses 9 and 10 were rejected. The specific outcomes of the
hypothesis tests are discussed below. These outcomes are once again grouped into TPB
variables and airline marketing variables. This grouping allows the author to discuss the
related variables most effectively.
All hypotheses were supported at a level of p < 0.05, as is standard practice for
statistical significance testing. There were no lower limits placed on path coefficients,
which are used only to understand the relative strength and direction of relationships.
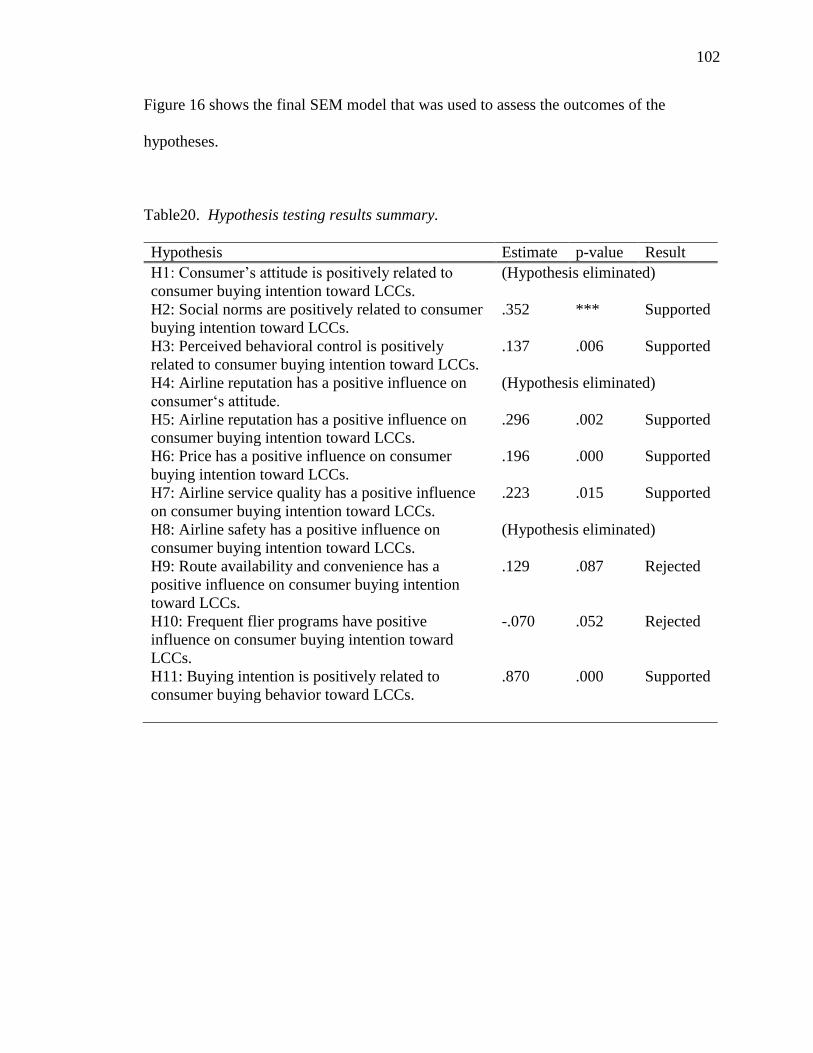
102
Figure 16 shows the final SEM model that was used to assess the outcomes of the
hypotheses.
Table20. Hypothesis testing results summary.
Hypothesis Estimate p-value Result
H1: Consumer’s attitude is positively related to
consumer buying intention toward LCCs.
(Hypothesis eliminated)
H2: Social norms are positively related to consumer
buying intention toward LCCs.
.352 *** Supported
H3: Perceived behavioral control is positively
related to consumer buying intention toward LCCs.
.137 .006 Supported
H4: Airline reputation has a positive influence on
consumer‘s attitude.
(Hypothesis eliminated)
H5: Airline reputation has a positive influence on
consumer buying intention toward LCCs.
.296 .002 Supported
H6: Price has a positive influence on consumer
buying intention toward LCCs.
.196 .000 Supported
H7: Airline service quality has a positive influence
on consumer buying intention toward LCCs.
.223 .015 Supported
H8: Airline safety has a positive influence on
consumer buying intention toward LCCs.
(Hypothesis eliminated)
H9: Route availability and convenience has a
positive influence on consumer buying intention
toward LCCs.
.129 .087 Rejected
H10: Frequent flier programs have positive
influence on consumer buying intention toward
LCCs.
-.070 .052 Rejected
H11: Buying intention is positively related to
consumer buying behavior toward LCCs.
.870 .000 Supported
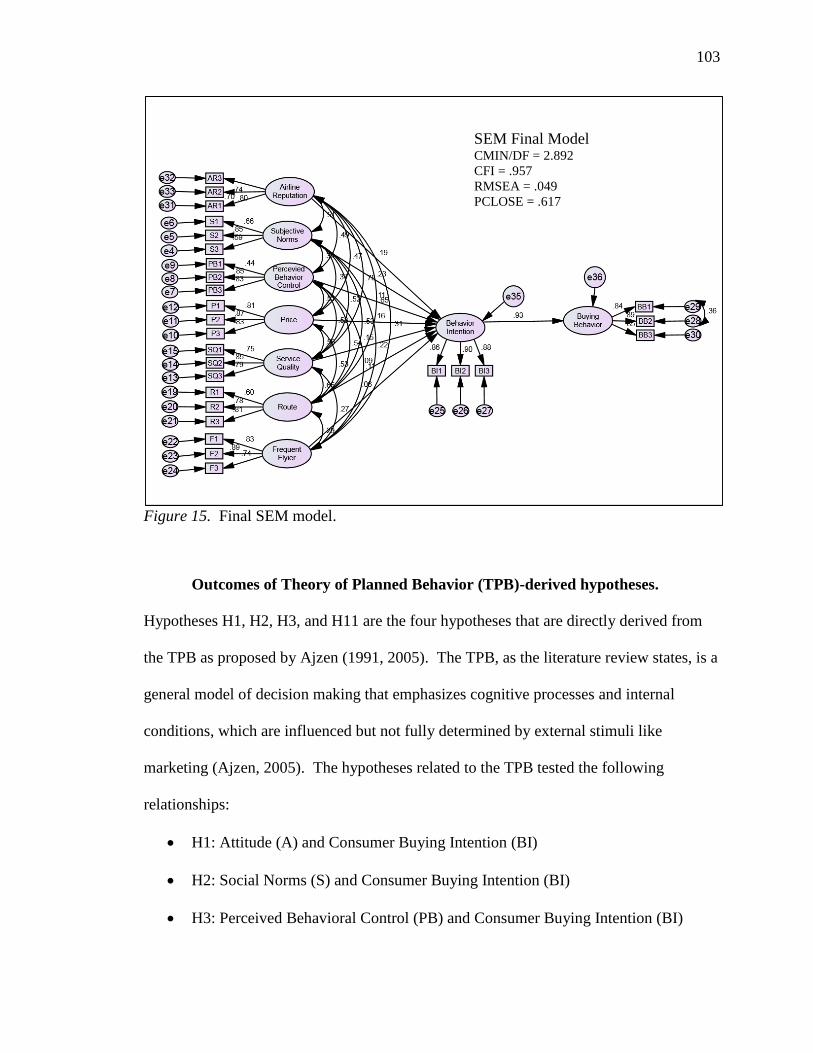
103
Figure 15. Final SEM model.
Outcomes of Theory of Planned Behavior (TPB)-derived hypotheses.
Hypotheses H1, H2, H3, and H11 are the four hypotheses that are directly derived from
the TPB as proposed by Ajzen (1991, 2005). The TPB, as the literature review states, is a
general model of decision making that emphasizes cognitive processes and internal
conditions, which are influenced but not fully determined by external stimuli like
marketing (Ajzen, 2005). The hypotheses related to the TPB tested the following
relationships:
H1: Attitude (A) and Consumer Buying Intention (BI)
H2: Social Norms (S) and Consumer Buying Intention (BI)
H3: Perceived Behavioral Control (PB) and Consumer Buying Intention (BI)
SEM Final Model CMIN/DF = 2.892
CFI = .957
RMSEA = .049
PCLOSE = .617

104
H11: Consumer Buying Intention (BI) and Buying Behavior (BB)
As stated previously, CFA led to the elimination of the Attitude factor, owing to
poor fit indicators into the model. Thus, Hypothesis 1 was not tested. This elimination
was surprising given the usual situation with the TPB, which is that Attitude is the most
consistently related factor (Ajzen, 2005). However, this could be due to the nature of the
airline industry. This outcome is discussed more in the following chapter. Other than the
eliminated hypotheses, all hypotheses related to the TPB were supported.
The relationship between S and BI was relatively strong (PBI,S = 0.76). The
relationship was also shown to be significant (p < .001). Thus, H2 could be supported.
There was a significant relationship between Subjective Norms and Behavioral Intention,
as proposed by the TPB.
The relationship between PB and BI was somewhat weaker than the relationship
in H2 (PBI,PB = 0.65). This relationship was also significant although at a lower level (p =
0.006). Thus, H3 was supported. There was a significant positive relationship between
Perceived Behavioral Control and Behavioral Intention, as suggested by the TPB,
although it was not as strong as the relationship between Subjective Norms and
Behavioral Intention.
The relationship between BI and BB was, not surprisingly, one of the strongest
relationships in the model (PBB,BI = 0.93). This relationship also had one of the strongest
estimates (p < .001): thus, H11 was supported. The final stage in the model – the
relationship between Buying Intention and Buying Behavior – was strong and consistent.
105
With the exception of the elimination of the Attitude variable in the validity
testing stage, the TPB performed well in this test. All relationships were consistent with
the expected outcome.
Outcomes of airline service and marketing-related hypotheses. The second set
of hypotheses was derived from the literature on airline services and marketing. The
hypotheses that were initially tested included the following relationships:
H4: Airline Reputation (AR) and Attitude (A)
H5: Airline Reputation (AR) and Buying Intention (BI)
H6: Price (P) and Buying Intention (BI)
H7: Airline Service Quality (SQ) and Buying Intention (BI)
H8: Airline Safety (AS) and Buying Intention (BI)
H9: Route Availability and Convenience (RA) and Buying Intention (BI)
H10: Frequent Flier Programs (F) and Buying Intention (BI)
The elimination of A and AS during the CFA testing for model validity meant that
hypotheses H4 and H8 could not be tested. Thus, the model only includes tests for
hypotheses H5, H6, H7, H9, and H10.
Testing of H5 showed a relatively low, though positive, path coefficient for the
relationship between AR and BI (PBI,AR = 0.19). However, the significance tests of the
variable did indicate significance (p = 0.002): thus, H5 was supported. Airline Reputation
does play a role, though a relatively small one, in the Buying Intention of consumers for
the airlines’ product.
106
H6 was also supported. Testing of H6 showed a somewhat stronger path
coefficient for the relationship between P and BI (PBI,P = 0.31). Furthermore, the
relationship was highly significant (p < 0.001). Price did have a significant relationship
to buying intention.
Testing of H7 showed a moderate path coefficient for the relationship between SQ
and BI (PBI,SQ = 0.22). The significance testing showed that this relationship was
significant (p = 0.015). This indicated that Service Quality does have a significant,
positive relationship with Buying Intention for the airline, and H7 could be supported.
H9 was not supported. Testing of H9 showed that the path coefficient for the
relationship between RA and BI was small (PBI,R = 0.09). Furthermore, testing showed
that it was not significant (p = 0.087). There are several potential reasons for this
rejection, which is discussed in the next chapter.
H10 was a marginal outcome, with the significance level being very close to the
selected significance level of p < 0.05. Testing of H10’s relationship showed a moderate
path coefficient (PBI,F = 0.27). The significance testing showed this relationship was
insignificant (p = 0.052). Thus, H10 was rejected, since there was not quite a significant
relationship between Frequent Flier Programs and Buying Intention. Unlike RA, the
rejection of F was not surprising given its very low level of agreement in the descriptive
statistics, as well as the nature of the frequent flier program and its relationship to LCCs.
These findings are discussed more in the next chapter.
Chapter Summary
This chapter has discussed in detail the statistical analysis of the findings
generated from the passenger survey. As the demographic analysis shows, it is possible
107
that these results are not fully generalizable to a population of air travelers. However,
they may be more representative of the population of LCC travelers, who may be younger
and have a lower income than travelers generally. This is an issue that needs further
study since there are no general demographic statistics collected.
The most important findings from the combination of reliability and validity
analysis and SEM are as follows. First, the TPB was partially supported but also partly
refuted. This is because the Attitude construct in the TPB was eliminated during the CFA
stage due to insufficient model fit (along with Airline Safety). This is not unprecedented,
as some studies have shown a lack of significance of Attitude, though it is unusual
(Ajzen, 2005). However, it is important, since it suggests that there are more important
issues than personal attitude in the selection of LCCs in Thailand. Second, the potential
factors identified from the literature are also partially supported. The SEM test showed
that factors that are significant include Price, Service Quality, and Airline Reputation, as
well as Social Norms and Perceived Behavioral Control. Insignificant factors included
Route Availability and Convenience and Frequent Flier Programs. These results are
discussed and contextualized with the literature in the following chapter, which also
presents a conclusion to the study and a series of recommendations for airline practice as
well as future research.
108
CHAPTER V
DISCUSSION, CONCLUSIONS AND RECOMMENDATIONS
The purpose of this chapter is to interpret the results and consider the implications
of the findings. The chapter begins with a comparison of the findings to the literature
review and reflects on the findings and how they fit into the existing research. A specific
answer to each of the research questions was offered in the literature review.
Additionally, this chapter addresses the limitations and provide recommendations for
LCC operators and future research.
Discussion
There were two research questions specified for this study:
What factors influence passengers’ airline selection toward LCCs in
Thailand’s airports?
How do these factors affect passengers’ airline selection toward LCCs in
Thailand’s airports?
In order to identify factors that could potentially influence passengers’ airline
selection of LCCs in Thailand, a literature review was used. The literature review yielded
two possible sets of factors, including factors internal to the passenger (as exemplified by
the TPB and external stimuli (airline marketing and service factors). These factors were
each associated with a hypothesis. Each of these factors was tested using the SEM
approach described above, with varying results for each of the identified factors.
109
Theory of Planned Behavior (Hypotheses 1, 2, 3, and 11). Four of the
hypotheses proposed were derived directly from the TPB as proposed by Ajzen (1991),
including H1 (Attitude and Buying Intention), H2 (Subjective Norms and Buying
Intention), H3 (Perceived Behavioral Control and Buying Intention), and H11 (Buying
Intention and Buying Behavior). Of these hypotheses, H1 was not tested because of the
elimination of Attitude from the structural model during the CFA process, where it
indicated insufficient convergent and discriminant validity. H2, H3, and H11 were all
supported. Subjective Norms and Perceived Behavioral Control both had an effect on
Buying Intention, and Buying Intention had a strong relationship to Buying Behavior.
Overall, this offers qualified support for the TPB.
Attitude (H1). The elimination of Attitude from the model was not expected,
given the significance of the Attitude construct in other studies. In the TPB, attitudes are
viewed as the main factor that influences the behavioral decision (Ajzen, 2005).
Furthermore, attitudes are based on a wide variety of different sources, including internal
cognitions and emotions, external information, and previous experience (Pratkanis, 2014).
A previous study on airlines had not eliminated Attitude as a factor in the airline choice
decision, but instead found that it plays a significant role in this decision (Bigné, et al.,
2010). Other studies also found that Attitude played a significant role in the decision (De
Canniere, et al., 2009; Kerr, et al., 2010; Penz & Stöttinger, 2005; Rutherford &
DeVaney, 2009; Vermeir & Verbeke, 2006).
The reason for the exclusion of Attitude could be related to the analytical
technique used, the passengers’ perception of the questions, or how the questions were
110
worded or translated. Previous studies had primarily used single or multiple regression to
test the TPB model. These techniques test the individual relationships between variables
in isolation, rather than providing a test of the full model (Hair, Black, Babin, &
Anderson, 2010). This is in direct contrast to SEM, which attempts a full-model
explanation for the proposed relationship (Hair, et al., 2010). Given that Attitude was
only slightly low in terms of AVE during the CFA process, it could potentially have been
left in. Its exclusion was discretionary, but the poor fit characteristics and the
conservative approach chosen by the author did justify its removal. A recreation of the
study could try manipulating the wording or measurement of the items in order to
improve the validity of the Attitude factor.
There are some alternative explanations as well. One of these explanations is that
the attitudes toward the airline could have been misidentified. This is a known issue with
the TPB, which has different levels of responsiveness depending on the decision type
(Rivis, et al., 2009). For example, emotional and moral attitudes may have a different
response than attitudes about the efficacy of a proposed action (Rivis, et al., 2009).
Another possible explanation is that the increasing dominance of the LCC business
model, particularly in the context of domestic flights, could make attitudes far less
important to decision choice. As AOT (2015) statistics show, a majority of domestic
flights in Thailand are now operated by LCCs, and the number of LCC passengers on
domestic flights is approaching 70%. Given this level of market dominance, which
includes in some cases complete control of smaller domestic airports, it is possible that
passenger attitudes to LCCs are actually not strongly connected to their buying decisions.
111
Simply, there may not be any other way for the passengers to get where they are going
other than an LCC, no matter how they feel about it.
Subjective Norms (H2). It was found that subjective norms had a moderate direct
effect on behavioral intentions. Subjective norms can be difficult to identify exactly,
since they include both injunctive norms and prescriptive norms, and the importance of
norms varies (Rivis & Sheeran, 2003). In the case of the domestic Thai air travel, it is
clear that there is likely to be a prescriptive norm that LCC choice is appropriate, since
nearly 70% of passengers made that choice in 2014 (AOT, 2015). Furthermore, the
choice of an LCC is not a moral or taboo behavior, which may trigger much stronger
subjective norms, especially against a given behavior (Rivis, et al., 2009). These
conditions mean that it makes sense that the consumer would have only a moderate effect
of subjective norms on the buying intention for LCC tickets, since the choice is not
morally enjoined, nor is it uncommon.
Perceived behavioral control (H3). The result of H3 showed that perceived
behavioral control had a stronger impact on buying intentions than subjective norms.
This is not surprising given the nature of perceived behavioral control. For example, in
consumer decisions, perceived behavioral control relates to financial control (whether the
consumer can afford it) as well as availability and cognitive capability of making a choice
(Ajzen, 2005; Chen, et al., 2011). LCCs, with relatively low cost tickets as well as
availability that may be higher than other types of airlines, are very likely to be seen as a
choice that has a high level of perceived behavioral control. Simply, consumers feel they
112
can afford LCC carriers and have access to them, which increases the likelihood that they
will choose LCCs when appropriate. This suggests that this could be a different
relationship for traditional carriers such as Thai Airways, where tickets were more
expensive and perceived as more expensive.
Buying intention and buying behavior (H11). H11 is supported, thus confirming
the relationship between buying intention and buying behavior. This relationship shows
one of the strongest direct effects between the two variables (PBB,BI = 0.93), although
there could also be indirect effects. This is somewhat stronger than the usual relationship
between buying intention and buying behavior. For example, Ajzen (2005) reports that
while some studies have shown up to 70% of buying intention is predicted by the
independent variables, only about 40% of actual behavior is predicted through the model
(a reduction of about 75%). A possible reason for this strength comes from Klöckner
(2013), who reported that specific behaviors did sometimes have stronger relationships
than more general behaviors. One possibility is lack of choice in carriers, for example
between Bangkok and some smaller airports. If passengers were constrained in their
choice of airlines, this could change the impact of the decision path. This is an area for
potential future research, since this study could not take into account the problem of
structural constraints imposed by the airline industry’s operation.
Overall TPB effectiveness. Overall effectiveness rates of the TPB are consistent
with the present study. Previous studies have indicated an effectiveness of 27% to 39% in
predicting actual behavior (Armitage & Connor, 2001). Other reports have indicated up
113
to 70% accuracy in predicting behavioral intention, although actual behavior is lower
(around 40%) (Ajzen, 2005). A more recent meta analysis suggested that 36% of general
environmental behavior was predicted by the TPB (Klöckner, 2013). However, Klöckner
did state that some specific behaviors were likely to have a stronger effect. The present
study does not directly assess the impact of only TPB variables, but the final path
coefficients suggest the majority of the impact on behavioral intention was related to
Subjective Norms and Perceived Behavioral Control. Additionally, there is a strong link
between Buying Intention and Buying Behavior. Thus, the present study is consistent in
effect with previous studies on the TPB in terms of the magnitude of effect, though it
cannot be compared directly. In general, the TPB was a satisfactory model to explain at
least part of the buying intentions and buying behavior of passengers for LCC airlines.
External factors (Hypotheses 4 through 10). In addition to the TPB factors
discussed above, six factors were identified from the literature that acted as external
stimuli or marketing factors. The use of external factors is encouraged in the TPB, since
this improves the contextual relationship and usually increases the predictive capability of
the model (Ajzen, 2005). In the literature review, the most important factors included
airline operations and marketing statements, as well as public reputation and views of the
airline. These factors were operationalized as airline reputation, price, airline service
quality, airline safety, route availability and convenience, and frequent flier programs.
Overall, these external factors had mixed success. While some factors (airline
reputation, price, and service quality) have a significant impact on passenger intention to
use LCCs, others (airline safety, route availability and convenience, and frequent flier
114
programs) do not. Airline safety was removed from the model due to insufficient model
fitting. That could be due to misspecification, but it does raise some interesting questions
about the importance of airline safety. The literature did offer satisfactory explanations
for why route availability and convenience and frequent flier programs were not
significant given the composition of the study in this research. In general, these factors
were useful additions to the TPB model, since they improved the full model fit.
Airline reputation (H4 and H5). Airline reputation is the passenger’s general
perception of the airline based on public knowledge and information, such as its safety
record and news reports (Atalık & Özel, 2007; Bukhari, et al., 2012; Chiam & Soutar,
2009; Dolnicar, et al., 2011; Graham & Bansal, 2007; Zhang, 2011). H4 hypothesizes
that airline reputation would have a direct relationship to attitude. This was not tested
since Attitude was eliminated from the model. H5 is supported, indicating a positive
relationship between Airline Reputation and Buying Intention with a moderate effect
(PBI,AR = 0.19).
Airline reputation is significant for the research because, unlike the other factors
discussed below, it is outside the direct control of the airline and cannot be directly
manipulated. The airline’s reputation is based on a number of different factors, such as
financial performance, safety endorsements, safety record, and size and age of the airline
(Graham & Bansal, 2007). Some of these factors can be mitigated (though not eliminated
completely) by airline operational practices. For example, airlines can manage their
maintenance programs in order to maintain endorsements and safety record. However,
size and age, and to some extent financial performance, cannot be so directly controlled.
115
Airline reputation could be particularly detrimental for LCCs, since older, larger, and
national and international (rather than regional) airlines are likely to have a better
reputation (Dolnicar et al., 2011). Some types of customers, such as package tour
operators, are highly sensitive to airline reputation (Chiam & Soutar, 2009). However,
other studies have suggested this is not so important. For example, Chinese passengers
are far more concerned about on-time operation than airline brand or reputation (Zhang,
2011). Overall, the potential impact of airline reputation is mixed. It is clear that
passengers in the present study were paying attention to it, but at the same time it was not
the most important factor. In general, airline reputation probably cannot be ignored as a
factor in passenger choice of airline even if it is not the most significant factor.
Price (H6). The ticket price of the LCC is considered one of the most important
factors – or indeed the only factor – in the choice of ticket for non-business travelers
(Chan, 2014; Davison & Ryley, 2010; Diggines, 2010; Dolnicar, et al., 2011; Evangelho,
et al., 2005; Fourie & Lubbe, 2006; Hess & Polak, 2006; Jou, et al., 2006; Loo, 2008;
Park, 2007; O’Connell & Williams, 2005). H6 supported a significant impact of Price on
Buying Intention (PBI,P = 0.31).
Other researchers offer some depth to the somewhat obvious finding that price
matters to LCC passengers. From an economic perspective, it is clear that price is the
main factor in the choice of LCCs over full-service carriers (Jou, et al., 2008). This is
because LCC service level offerings are substantially lower than full-service offerings,
which Jou, et al. (2008) deemed to be less preferable. Some studies have supported price
as the most important factor (Dolnicar, et al., 2011; Loo, 2008; Park, 2007). One
116
particularly interesting finding is that LCC passengers tend to be price-sensitive and will
adjust origin/destination pairs and accept less convenient departure and arrival times in
exchange for cheaper tickets (Davison & Ryley, 2010). Furthermore, the low prices of
LCCs also had the effect of adjusting service quality expectations downward and making
them easier to meet (Chan, 2014). Thus, a low priced ticket could actually improve
service quality satisfaction, since it also lowered expectations. Of course, not all
passengers are driven mainly by low prices. Studies of Malaysian passengers and South
African business passengers found that service quality and convenience, respectively,
were more important than price (O'Connell & Williams, 2005; Fourie & Lubbe, 2006).
Furthermore, South African LCC passengers would happily switch to a full-service
carrier if tickets were within 30% of the same price (although the reverse was not true)
(Diggines, 2010). These studies show that while price is important to passengers, it is not
the only consideration, and it may not be enough to encourage non-LCC passengers to try
an LCC. In the present study, price was again not the only consideration, although it was
important.
This study did not directly measure price sensitivity, but it is possible that such a
measure could make a difference in understanding the relevance of price to different
market segments. Price sensitivity has been shown to be different between different
groups of travelers, including those that chose LCCs and those that chose FSCs (Davison
& Ryley, 2010). A detailed study of Thai airline passengers’ price sensitivity and
willingness to pay for specific aspects of their flight may be helpful in future.
117
Airline service quality (H7). The third external factor that was assessed was
airline service quality. Airline service quality is defined as the passenger’s perception of
the service quality received (Zeithaml, et al., 2010). Elements of service quality include
service timeliness, ground services, and in-flight service and comfort (Atalık & Özel,
2007). H7 is supported, indicating that Service Quality has a positive effect on Buying
Intention (PBI,SQ = 0.22).
One of the most pressing practical questions is how airlines can balance price and
service quality, since increased service quality also drives up prices. Service quality is a
complex offering, and completeness of the service offering has been found to be
important to passengers (Jou, et al., 2008). However, it should not be assumed that
service quality is a fixed or objective entity. Park (2007) found differences in LCC and
different fare classes on traditional airlines in their service quality expectations and
assessments.
LCC passengers may have a lower expectation of service quality. Chan (2014)
found that the low prices of LCC tickets had a secondary effect of adjusting the service
quality expectations downward, resulting in improved service quality assessments. This
is an important implication for service providers, since it means that LCCs are not
expected to meet the same level of quality as a full-service carrier. Instead, it must meet
service quality expectations that are set considering its service offering promise and price
levels.
Service quality may be more important for some types of passengers; for example,
Malaysian LCC passengers have been shown to be more concerned with service quality
and comfort than ticket price (O'Connell & Williams, 2005). Furthermore, airlines do
118
have some flexibility in designing their service offering. Studies show that, in general,
passengers do expect as standard on-time operation and accurate baggage handling (Park,
2007; Zhang, 2011). However, passengers were willing to pay for services such as in-
flight food and drink service, improved seating, booking flexibility, and entertainment
(Balcolme, 2009; Chen & Wu, 2009). Thus, even though service quality is important,
LCCs can manage their service offerings to balance perceived service quality and base
ticket prices.
In general, it can be stated that service quality is important for LCC passengers,
but that they may have a different service expectation than FSC passengers. Detailed
study of service quality expectations between these two groups may be useful in the
future.
Airline safety (H8). Perceived airline safety can be defined as the passenger’s
perception of the airline safety record; for example, the extent of incidents and the
airline’s maintenance record. A number of previous studies have supported airline safety
as one of the factors associated with airline choice (Atalık & Özel, 2007; Barros, et al.,
2008; Cunningham, et al., 2004; Graham & Bansal, 2007; Jou, et al., 2008; Mikulic &
Prebezak, 2011; Oyewole, et al., 2007; Zhang, 2011). Some studies have even suggested
that airline safety could be even more important for LCC passengers than traditional full-
service carriers, since LCCs may be perceived as unsafe or less safe than other carriers
(Mikulic & Prebezak, 2011). As a result, it was surprising that the Airline Safety
construct was eliminated during the CFA process.
119
The same methodological issues discussed above under Attitude also apply to
Airline Safety, including that SEM has not often been used in this process, and that the
elimination of this variable was borderline and, thus, a researcher choice. However, it is
also possible that the conditions of constraint apply. Without a wide range of choices
available, especially for transportation to some of Thailand’s rural or border areas, it is
possible that airline safety perceptions may simply be secondary or orthogonal to airline
choice. This is a topic that should be explored further, particularly since airline safety
reputations may differ strongly between airlines. It is possible that it was eliminated from
the research model because of the airlines in question and their safety records, but this
cannot be determined from the data collected. However, it is also possible that Thai
passengers are generally unaware of airline safety records or do not see a significant
amount of difference between LCCs and full-service carriers. It is not possible to
determine which (if any) of these is the situation from the current research.
Route availability and convenience (H9). The fifth external variable is route
availability and convenience. Route availability and convenience measured the extent to
which the airline’s scheduling and route maps suited the passenger’s needs. This factor
was discussed by a number of previous authors and identified as being of some
significance in the travel decision (Atalık & Özel, 2007; Castillo-Manzano & Marchena-
Gómez, 2010; Hess & Polak, 2006; Fourie & Lubbe, 2006; Theis, et al., 2006; van
Eggermond, 2007; Zhang, 2011). In this study, route availability and convenience had a
very small main effect on Behavioral Intention (PBI,R = 0.09), and the coefficient showed
that the effect was not significant, so H9 is not supported.
120
Although it might seem that route availability and convenience would be
paramount for passengers, the literature actually suggests this may not be the case for all
types of passengers. In theory, the airline is selected based on a two-stage selection
process, with passengers first deciding where they want to go and then selecting airlines
from the subset of airlines that can get them there (Hess & Polak, 2006). A number of
studies on airline choice have shown that convenient routes and flight times do make a
difference in the selection of a particular airline (van Eggermond, 2007). This has
included some studies on LCCs, such as the study on Turkish LCCs conducted by Atalık
& Özel (2007). However, not all passengers show the same extent of concern with
specific routings or timings. A study in South Africa showed that LCC passengers are
typically less concerned with precise flight timings or destinations, and they are willing to
satisfice these needs rather than satisfy them (Fourie & Lubbe, 2006). In other words, in
exchange for a lower priced ticket LCC, passengers are willing to accept a less
convenient flight time or destination airport, such as an auxiliary airport like Don Muang
(rather than Suvarnabhumi, Bangkok’s main international airport). A study of Spanish
passengers showed that passengers who required specific flight times or routes, or who
had a complex routing or a long-distance route, were more likely to choose a full-service
carrier rather than an LCC in the first place (Castillo-Manzano & Marchena-Gómez,
2010). In summary, while LCC passengers may be expected to enjoy convenient flight
times or destinations, they are also willing to accept less convenience in exchange for a
lower price. Thai LCC passengers appear to follow this general trend, with no significant
relationship between convenience of flight times or destinations and buying intentions for
the airline.
121
Frequent flier programs (H10). The final factor in the buying intentions for the
LCC airline is frequent flier programs. Frequent flier programs are programs that offer
rewards for loyalty in flight and repeated flights, for example “miles” that can be used to
purchase flights or free upgrades (Carlsson & Löfgren, 2006). Frequent flier programs
are not typically used by LCCs but have been shown to be a factor in airline choice in
other studies ((Carlsson & Löfgren, 2006; Fourie & Lubbe, 2006; Hess & Polak, 2006;
Park, 2010; Vidovic, 2013). Thus, there was a question as to whether the absence of a
frequent flier program would influence the airline choice for the LCC. Frequent flier
programs were ranked substantially lower in importance than other factors in the
descriptive statistics. Despite a relatively strong path coefficient (PBI,F = 0.27), the
significance tests (p = 0.052) was just above the confidence level accepted. Thus, while
H10 was close to acceptance, it was not accepted.
Frequent flier programs may not be as important to LCC passengers as to others.
The frequent flier program is designed to increase switching costs and ensure repeat
travel from the same customers, but it also increases the cost to the airline per passenger
(Carlsson & Löfgren, 2006). Because of these increased costs, LCCs do not typically
operate frequent flier programs, although they sometimes do (Vidovic et al., 2013). Thus,
passengers that routinely chose LCCs may not expect or value the benefits of the frequent
flier program. Additionally, evidence shows that while members of frequent flier
programs are influenced by the program’s offerings in their airline choice (as well as
other choices), non-members are not influenced by these offerings (Park, 2010). Finally,
the main passenger segments that are influenced by frequent flier programs are business
travelers, who fly frequently and are generally price-insensitive and more concerned
122
about convenience and service quality (Dolnicar, et al., 2011; Fourie & & Lubbe, 2006).
Very few of the passengers included in this study were routinely travelling for business,
and instead most of them were travelling for leisure or other purposes. In summary, the
passengers included in this survey are likely to be price-sensitive, travelling for leisure or
to visit friends and family, and do not belong to frequent flier programs already. As a
result, it is not at all surprising that frequent flier programs were not a significant factor in
their choice of airline.
Conclusion
This research was undertaken in order to explain the buying behavior of Thai
airline passengers for LCCs and factors that affect this behavior. The LCC market in
Thailand has grown substantially in recent years, with 53% of total passenger traffic and
61% of domestic passenger traffic being attributed to LCCs in 2014 (AOT, 2015). This is
consistent with the total passenger capacity of LCCs in the Asian region, which has
reached about 57% of total capacity (Harbison, 2013). It is also substantially higher than
even the previous year; for example, in FY2013 and Q1/Q2 2014, LCCs accounted for
about 20% of total traffic at Thailand’s airports (AOT, 2014).
Thailand has been identified as one of the key markets for passenger growth in the
LCC segment, along with the Philippines (Teng & Perry, 2013). It is considered to be a
very friendly market for LCCs, with a growing middle class demanding more travel,
along with densely populated urban areas with few other transportation options (Bland,
2014). However, what has not been studied in detail is what leads Thai passengers to
choose a particular airline. Only one study could be identified that examined LCCs in
123
Thailand, and that study emphasized customer satisfaction rather than initial airline
choice (Saha & Theingi, 2009). Thus, when commencing this study, there was relatively
little information about Thai passengers’ choice of LCCs or what factors were important.
This research was performed in order to fill a gap in the literature surrounding
LCC passenger choice in Thailand. Although similar research had been performed
before, Saha and Theingi’s (2009) research took place before the recent explosion in
domestic, regional, and international LCC travel in Thailand. It was possible that
passenger motivational factors had changed considerably. This research has shown that
there are a number of potential changes in the market, offering support for this idea.
Recommendations
This research was intended to study passenger’s buying decisions for LCC airlines
in Thailand. The study identified several factors in the choice of LCC by passengers.
These factors included subjective norms and perceived behavioral control, as well as
airline reputation, service quality, and price. Airline safety and attitudes toward LCCs
were eliminated in the initial stage of the research, while frequent flier programs and
convenience of the flight schedule and locations were not found to be significant during
the analysis process. In general, these findings were consistent with the literature, which
suggested that LCC passengers do have different preferences and consider different
factors in the buying decision than passengers on FSCs.
Perhaps the most important implication of this study is that it is clear that LCC
passengers are not merely driven by price, as proposed by some economic models of LCC
choice. Instead, factors like service quality and airline reputation, as well as the social
124
acceptability implied by subjective norms, play a significant role in the choice of LCCs
over FSCs. Of course, many passengers will simply select LCCs because they are the
least expensive (or indeed in Thailand sometimes the only) way to get where they want to
go. However, for other passengers, traveling on a good airline with acceptable levels of
customer service will still be important. Thus, there are implications of the study for
airlines, who need to develop their services. This study also suggests that further research
into LCCs is required in order to fully understand what passengers are seeking. Since it is
clear that price alone does not drive the choice of LCC, it is reasonable to conduct further
research into the passenger segment and understand what drives them. The final section
of this chapter develops these implications with recommendations for LCCs serving Thai
passenger and for future researchers.
Contribution to the literature. This study has made several critical
contributions to the literature in places where there were literature gaps. One of these
contributions is in understanding the Thai (and more generally Asian) perspective on
LCCs and LCC choice. Thailand’s LCC growth rates are considerably faster than the
growth rates reported for Europe, where the LCC segment is growing by only 1.4% p.a.
(Eurocontrol, 2013). Europe’s market growth for LCCs is still faster than the general air
traffic growth, which is stagnant (Eurocontrol, 2013). Thailand, as a domestic market, is
now entirely dominated by LCCs, with even Thai Airways, the country’s premier full-
service carrier, entering the market with ventures like Thai Smile and Nok Air. Thus,
understanding the reasons behind the growth of the LCC market in Thailand is important
for understanding the appeal of the LCC segment generally. Since Thailand is one of the
125
most rapidly growing markets, it makes sense to examine what passengers in this market
are looking for.
Another contribution to the literature is that this study complicates the relationship
between price and the LCC. Some previous studies have suggested that price is the only
or the most significant factor in the choice of LCCs (Jou, et al., 2008). Studies have also
characterized LCC passengers as highly price sensitive and willing to give up other
benefits, such as service quality and convenience, in exchange for a cheaper price
(Davison & Ryley, 2010; Dolnicar, et al., 2011; Loo, 2008; Park, 2007). However,
research has also suggested that LCCs may not be as inexpensive as previously thought,
particularly after additional charges such as checked baggage fees are added on (Vidovic,
et al., 2006). While the price gap between LCCs and FSCs has historically been higher in
Asia than in the United States or Europe (Smyth & Pearce, 2006), this is still a
contradiction that needs to be considered. The findings of this study contribute to the
literature surrounding this problem because it demonstrates that price is not the only
factor involved in the passenger’s choice of LCC. Factors including airline reputation,
service quality, and subjective norms (representing the social acceptability of LCC
travel), as well as perceived behavioral control, also play a role. These findings suggest
that the perceived acceptability and accessibility of travel on LCCs, and satisfaction with
the level of service provided and general airline reputation, play as much of a role, and
sometimes more, than the price. This calls for an expansion of consideration of the LCC
business model beyond price and into consideration of other areas. For example, this
could include the fact that LCCs make smaller (potentially more convenient) airports
available, and they bring air travel within the reach of the growing middle classes.
126
This growth in the middle classes is likely to be one of the reasons behind the
rapid expansion of the LCC in Thailand (Bland, 2014; Teng & Perry, 2013). This is one
of the few studies that has explored this topic since the rapid growth of the industry, with
the last study taking place several years ago (Saha & Theingi, 2008). Thus, the final
contribution is an updated look at the habits and practices of Thai LCC passengers.
Limitations of the study. There were several limitations to the study that could
either not be eliminated from the study design or became apparent during the research
process. Overall, these limitations do not reduce the contribution of the study to the
literature. However, they do influence how far the study can be generalized, either to the
Thai population or to others.
Some limitations in the application of the findings come from the study design.
The simplest limitation is that the study was conducted as a cross-sectional design. This
offers a snapshot of the situation when the research was conducted (mid-2014), but does
not offer insight into changing situations or views of passengers. For example, it is
possible that the influence of various factors could change over time as passengers gain
more experience with LCCs in general or a particular LCC. However, this study design
will not reflect those changes. Another limitation is that the results only tested whether or
not specific factors identified were relevant to the buying decision and do not offer insight
into other potential factors that might be relevant. This was a limitation of the scope of
the study.
The elimination of the Airline Safety and Attitude factors also posed a limitation
on the study. This was due to problems with both convergent and discriminant validity,
127
which none of the other factors displayed. Although the researcher could have chosen to
leave these constructs in the study, they were removed to ensure that it had the highest
possible level of validity. The lack of convergent and discriminant validity most likely
occurred because of mis-specification of the observed variables, leading to inconsistency
between the observed and latent variables. This reflects a general problem with
specifying attitudes and perceptions, which the researcher will be aware of in future
research. This is a common problem in attitude-based literature, as it can be difficult to
identify the attitudes that may apply to a particular situation (Ajzen, 2005). The failure of
the Airline Safety construct is less certain, although this construct was marginal and could
have been retained. In future, pre-testing will include discriminant and convergent
validity analysis to ensure that the observed and latent variables are consistent in a test
sample. Another way to improve the outcome of the study is to use a mixed methods
design, with in-depth interviews informing what kinds of attitudes and perceptions of
airline safety as well as other norms airline passengers hold. This could have improved
the convergent and discriminant validity of the questionnaire. These eliminations should
have been avoided if possible. Obviously, not every construct in every study will be
valid, but the elimination of the core construct of Attitudes, which is a major component
of the TPB, does in the researcher’s view limit the generalization of the study and have an
impact on its quality.
There are several limitations in the application of the findings to other
populations. One of these limitations is that the findings may be culturally particular.
Culture is known to be a factor in buying decisions and has been shown to influence
128
airline choice (Lantos, 2010; Park, 2010). As a result, it may not be appropriate to
directly apply these findings to a passenger population from another culture.
Another potential limitation is that the representativeness of the sample is
uncertain. This means it is difficult to generalize the findings across demographic groups.
Although the demographics of the sample did not match the general Thai population,
there are no reliable demographics that can be compared to for LCC passengers. The
potentially non-representative nature of the population should be taken into account when
using these study results. This is both the most important potential limitation and the one
that was the most difficult to resolve, since collecting demographic data at the required
scale would be a significant task.
Practical Implications. The first set of recommendations from the study is for
the LCC industry in Thailand and elsewhere. These recommendations are derived from
the findings of the study as well as the literature. They are designed to improve LCC
performance in the market by improving their appeal to the passengers. The four
recommendations that were identified for this study include: protecting price difference
margins compared to full-service airlines; establishing and protecting their service quality
levels; establishing and protecting public reputation of the airline; and maintaining the
current broad-based route networks.
Protect price leadership. The first recommendation is that LCCs should try to
avoid allowing the pricing of their products to become more expensive. Price was one of
the most significant factors in the findings for this study. The importance of price has

129
been supported for at least some market segments, especially LCC passengers (Chan,
2014; Davison & Ryley, 2010; Diggines, 2010; Dolnicar, et al., 2011; Evangelho, et al.,
2005; Fourie & Lubbe, 2006; Hess & Polak, 2006; Jou, et al., 2006; Loo, 2008; Park,
2007; O’Connell & Williams, 2005). In general, this is true for most passenger segments
except for business travelers, long-haul travelers, and those that require transfers or have
a complex itinerary. In some regions such as the U.S. and Europe, the price difference
between full-service and low-cost carriers is much lower, with the price gap in the U.S.
being only 36% (Smyth & Pearce, 2006). This is important because FSC passengers may
become more willing to switch to LCCs if the price difference is 30% or more (Diggines,
2010). Based on this situation, LCCs in Thailand should try to avoid losing their price
advantage by keeping their prices lower than FSCs, particularly when they are competing
on the same routes. This will help them meet the basic requirements of the LCC
passenger.
Protect service quality. Earlier studies of service quality in LCCs have suggested
that LCC passengers are willing to sacrifice service quality in exchange for an
inexpensive ticket. This includes research in Thailand, which has indicated that
passengers are not generally satisfied with the service quality of Thai LCCs but continue
to buy tickets despite this because of the price (Saha & Theingi, 2009). However, that
study was conducted several years ago when LCCs were not as established as they are
today. In the modern market, with LCCs dominating Thai air traffic and several different
firms being present in the market, service quality cannot be ignored. This research
showed that service quality was a significant factor in buying intentions for LCCs. This
130
suggests that customers do prioritize service quality in areas like the check-in process,
baggage handling, in-air service quality, and so on. Thus, LCCs cannot ignore service
quality in their offerings.
Of course, the importance of service quality for LCCs does not mean that LCCs
have to provide the same level of service as FSCs. Previous research has shown that
different airline travel classes are associated with different service quality expectations
(Park, 2007). Research has also shown that LCC passengers are willing to revise their
service expectations downward because of the price (Chan, 2014). Thus, the important
thing for LCCs is that they determine the expectations of their passengers and meet them.
Following the review of the literature and the findings of this study, the main
recommendation for service quality is that LCCs in Thailand perform customer research
and analysis to determine what customer service quality requirements are and whether
they are meeting them. This can then be used to adapt the customer message and service
provision in order to improve outcomes.
Protect public image. Two out of five of the significant factors for buying
intention were related to the public and social image of the airline and, as a result, its
social acceptability. These factors included subjective norms (part of the TPB factor
cluster) and airline reputation (part of the airline-related factor cluster). These two factors
represent the same underlying idea, which is the social perception of the airline and
whether or not it is considered to be a good company or service. The construction of
subjective norms means that the information from them comes from public information
such as airline reputation, as well as particular information related to social situations and

131
norms (Ajzen, 2005). Thus, the findings of this study have shown that the public image
and reputation of the LCC and the resulting social acceptance of their use are significant
factors in LCC choice. These findings are consistent with a range of other studies on
airline choice, which have also supported the idea that airline reputation plays a role in
the choice of LCCs and other airlines (Atalık & Özel, 2007; Bukhari, et al., 2012; Chiam
& Soutar, 2009; Dolnicar, et al., 2011; Graham & Bansal, 2007; Zhang, 2011).
Based on these two factors, the third recommendation for airlines is that they
should protect their public reputation and image in Thailand. Protecting price and service
quality, as discussed above, will help with public reputation since this will help establish
the LCC as a reliably low-cost and good service carrier. However, there are other factors
in airline reputation that can be managed, including financial performance, safety
endorsements, and safety records (Graham & Bansal, 2007). Age and size of the firm are
also factors in airline reputation, according to Graham and Bansal (2007), but these
cannot be managed directly. By paying attention to their public presentation and service
offering, it will help ensure that the airline can attract LCC passengers directly.
Reputation management will also help the airline become more acceptable in society,
leading to a generalized social norm that LCC travel is acceptable.
Maintain route diversity. This research did not find that route availability and
convenience was a factor in the buying intention for LCCs in general. However, previous
research into the role of LCCs in Thailand has suggested that the diversity of routes
available, including both domestic and international routes, is one of the factors in the
growth of their popularity (Bland, 2014; Teng & Perry, 2013). Thailand has a growing
132
middle class that is increasingly willing to travel, as well as geography and infrastructure
that offers few other options for travelling domestically or regionally. Thus, the LCC is
providing an opportunity for growth through connection of domestic and regional small
and secondary airports, rather than only providing connections to international
destinations and large cities. This means that consumers do not have to consider route
availability, since LCC coverage is readily available on these routes. If LCCs reduced
their routes and destinations significantly, this could become a more significant factor.
Thus, the final recommendation of the research is that LCCs should continue to offer their
current broad range of destinations rather than trying to cut back on the number of
destinations they serve.
Recommendations for Future Research
The final task of this study is to provide recommendations for future academic
research. These recommendations were derived from critical reflection on the findings of
the study and their contextualization in the literature review (discussed above). Any
future research could include modification of the existing model, which is discussed at the
end, in order to improve the otucomes.
Service quality. The first recommendation for further research is service quality
expectations of LCC customers. The current study did show that service quality was a
significant factor in the buying intention for LCCs, but it did not determine precisely what
service quality expectations passengers had or how they could be met. The previous
research into service quality on LCCs in Thailand is very thin and was conducted some

133
years ago (Saha & Theingi, 2009). As a result, there is little guidance for airlines or
academics about the service quality expectations of Thai passengers. Additionally, most
of the previous studies on service quality have focused on full-service passengers or
specific passenger segments such as business passengers. The recommendation for this
research is that service quality surveys of LCCs in Thailand could be useful for
understanding exactly what level of service is expected and received. This study could be
conducted using a standardized measure, for example SERVQUAL, which uses a gap
analysis approach to examining service quality in five dimensions including Reliability,
Assurance, Tangibles, Empathy, and Responsiveness (Zeithaml, et al., 2010). This type
of standardized approach could be helpful since it would allow researchers to compare
directly between airlines, as well as identifying specific gaps between service
expectations and the service offering.
Airline safety perceptions. The second opportunity for future research is airline
safety perceptions. Previous research has shown that airline safety perceptions,
particularly perceptions about the safety record as well as recent incidents and accidents,
have an effect on airline reputation (Graham & Bansal, 2007). However, in this research
it was not found to be significant. This could be because airline safety is less of a concern
in recent years than it has been historically with airlines having a steadily reducing
accident rate (Barros, et al., 2010). However, it could also be for other reasons that were
not determined in this research. For example, it could be because airline safety is one of
the components of airline reputation or because there is relatively little concern about
airline safety, or because there is little difference between available airlines. By studying
134
perceptions of airline safety and the importance of these perceptions, future researchers
could help clarify the significance of airline safety reputations. This research could be
conducted as a qualitative study, in order to provide an exploratory analysis of
perceptions of airline safety. However, it could also be conducted as a mixed methods
study, which would allow descriptive research to support the frequency of airline safety
factors in the population.
Culture and LCCs. The present study highlighted a problem with LCC use, which
is that although there are regional differences in their popularity and prevalence, there has
been little research into what kinds of cultural differences influence or predict their
popularity. In particular, there has been little comparative study of LCC passengers and
their preferences. The only significant study, which compared Irish and Malaysian LCC
passengers, was conducted over a decade ago (O'Connell & Williams, 2005). At that
time, the LCC market was substantially different than today’s industry. This is important
information to know, particularly for LCCs that are trying to build their networks or new
entrants into various markets. The significance of cultural norms for buying intentions in
the present study did demonstrate that there are likely to be cultural differences since
these norms vary by culture (Ajzen, 2005). Thus, the third recommendation from this
study is that researchers should consider the impact of cultural factors on LCCs and
examine how these factors influence the choice of LCCs. This type of research could be
conducted using a cross-national study of passengers from airlines that are similar to each
other or arms of the same airline. For example, in Asian countries, a cross-national
comparison could be conducted on passengers of AirAsia, which has a consistent service

135
offering and domestic flights in several countries. This would help determine whether
there are significantly different perceptions of the airline across cultures.
Price sensitivity. The fourth recommendation for future research is into price
sensitivity of LCCs in the presence of route constraints. One of the important aspects of
the Thai LCC industry is that in many cases, LCCs may be the only feasible travel route
to a particular destination. As a result, it is less certain whether LCC passengers in
Thailand, particularly on domestic or regional routes to secondary destinations, are as
price-sensitive as claimed by authors such as Jou et al. (2008). It would be helpful to
understand whether passengers are in fact as price-sensitive as stated, or whether route
availability plays more of a role in the decision to fly with a particular airline. This type
of research could be conducted as a quantitative survey. However, it might also be
helpful to study this problem using questionnaires or possibly even an experiment, which
could help quantify the extent to which passengers are actually price sensitive. This
research may be important in the future as LCCs begin to increase their prices in response
to increased costs.
Re-specification of existing model. Future research into this area could involve re-
specification of the existing factors, including Airline Safety and Attitude (the eliminated
factors) in order to improve convergent and discriminant validity for all factors. This
could allow the research model to be re-used in future research with improved and
refined findings. It could also provide more information about the specific attitudes and
perceptions that are relevant to LCCs and airline choice. One of the potential changes that
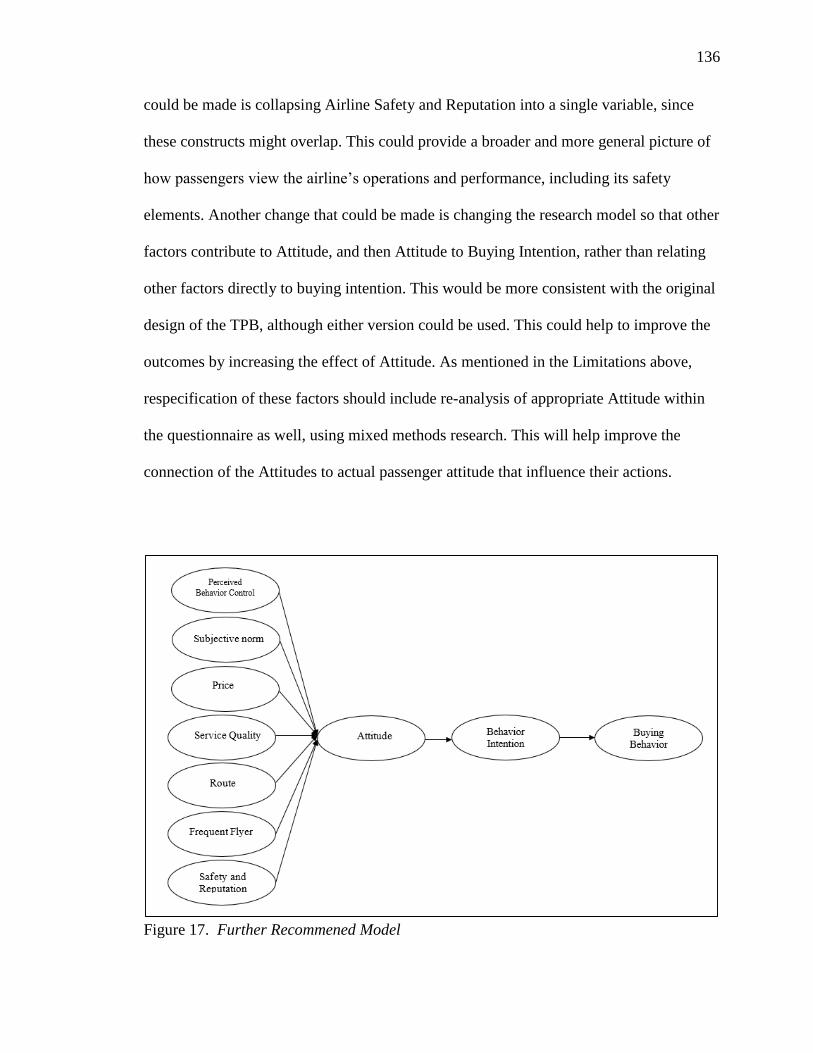
136
could be made is collapsing Airline Safety and Reputation into a single variable, since
these constructs might overlap. This could provide a broader and more general picture of
how passengers view the airline’s operations and performance, including its safety
elements. Another change that could be made is changing the research model so that other
factors contribute to Attitude, and then Attitude to Buying Intention, rather than relating
other factors directly to buying intention. This would be more consistent with the original
design of the TPB, although either version could be used. This could help to improve the
outcomes by increasing the effect of Attitude. As mentioned in the Limitations above,
respecification of these factors should include re-analysis of appropriate Attitude within
the questionnaire as well, using mixed methods research. This will help improve the
connection of the Attitudes to actual passenger attitude that influence their actions.
Figure 17. Further Recommened Model

137
REFERENCES
Ajzen, I. (2005). Attitudes, personality and behavior. Maidenhead, Berkshire: Open
University Press/McGraw-Hill Education.
Ajzen, I. (1991). The theory of planned behavior. Organizational Behavior and Human
Decision Processes, 50, 179-211.
Ajzen, I., & Fishbein, M. (1977). Attitude-behavior relations: A theoretical analysis and
review of empirical research. Psychological Bulletin, 84(5), 888-918.
Ajzen, I., & Fishbein, M. (1980). Understanding attitudes and predicting social behavior.
Englewood Cliffs, NJ: Prentice-Hall.
AOT. (2014). Air transport statistics. Retrieved from http://aot.listedcompany.com/
transport.html
AOT. (2014b). AOT air traffic fiscal year 2014 - 10 months (Oct. 2013-Jul. 2014).
Retrieved from http://aot.listedcompany.com/misc/statistic/20140820-AOT-
FiscalYear-Oct2013-Jul2014-EN-01.pdf
AOT. (2014c). AOT LCCs air traffic fiscal year 2014 (Oct. 2013-Jul. 2014). Retrieved
from http://aot.listedcompany.com/misc/statistic/20140820-AOT-LCCs-
FiscalYear-Oct2013-Jul2014-EN-01.pdf
AOT. (2015). Air transport statistic. Retrieved from http://aot.listedcompany.com/
transport.html
Armitage, C.J., & Conner, M. (2001). Efficacy of the theory of planned behaviour: A
meta-analytic review. British Journal of Social Psychology, 40, 471-499.
138
Atalık, Ö., & Özel, E. (2007). Passenger expectations and factors affecting their choice of
low cost carriers: Pegasus Airlines. Proceedings of the Northeast Business and
Economics Association, 8, 285-288.
Babbie, E. (2013). The basics of social research. Mason, OH: Cengage Learning.
Balcolme, K., Fraser, I., & Harris, L. (2009). Consumer willingness to pay for in-flight
service and comfort levels: A choice experiment. Journal of Air Transport
Management, 15(5), 221-226.
Barros, C.P., Faria, J.R., & Gil-Alana, L.A. (2010). Persistence of airline accidents.
Disasters, 34(4), 1123-1138.
Bigné, E., Sanz, S., Ruiz, C., & Aldás, J. (2010). Information and Communication
Technologies in Tourism 2010. Berlin: Springer.
Bland, B. (2014, February 10). Low-cost airlines stake claims for supremacy in southeast
Asia. Financial Times. Retrieved from http://www.ft.com/cms/s/2/a68252b8-
8502-11e3-8968-00144feab7de.html#axzz31i1oLCDy
Blythe, J. (2013). Consumer behaviour. Thousand Oaks, CA: Sage Publications.
Bosworth, H.B., Olsen, M.K., Dudley, T., Orr, M., Neary, A., Harrelson, M., Adams, M.,
Svetkey, L.P., Dplor, R.J., Oddeone, E.Z. (2007). The take control of your blood
pressure (TCYB) study: Study design and methodology. Contemporary Clinical
Trials, 28(1), 33-47.
Brace, I. (2008). Questionnaire design. Philadelphia, PA: Kogan Page.
Brown, T.A. (2012). Confirmatory factor analysis for applied research. New York:
Guilford Press.
139
Budeanu, A. (2007). Sustainable tourist behaviour - a discussion on opportunities for
change. International Journal of Consumer Studies, 31, 499-508.
Bukhari, S., Ghoneim, A., & Dennis, C. (2012, June). Understanding the factors that
attract travelers to buy airline tickets online in Saudi Arabia. Paper presented at
the European, Mediterranean & Middle Eastern Conference on Information
Systems, Munich, Germany. Retrieved from
http://www.researchgate.net/profile/Saleh_Bukhari/publication/234842291_UND
ERSTANDING_THE_FACTORS_THAT_ATTRACT_TRAVELLERS_TO_BU
Y_AIRLINE_TICKETS_ONLINE_IN_SAUDI_ARABIA/links/0fcfd51025ac3ae
0a6000000.pdf
Business Dictionary (2014). Price. Retrieved from http://www.businessdictionary.
Com/definition/price.html
CAPA. (2014, April 14). Thai AirAsia plans rapid domestic and international growth in
2014 despite challenging conditions. CAPA Centre for Aviation. Retrieved from
http://centreforaviation.com/analysis/thai-airasia-plans-rapid-domestic-and-
international-growth-in-2014-despite-challenging-conditions-162623
Carlsson, F., & Löfgren, A. (2006). Airline choice, switching costs and frequent flier
programmes. Applied Economics, 38(13), 1469-1475.
Caruana, A. (2002). Service quality: The effects of service quality and the mediating role
of customer satisfaction. European Journal of Marketing, 36(7), 811-828.
Castillo-Manzano, J.I., & Marchena-Gómez, M. (2010). Analysis of determinants of
airline choice: Profiling the LCC passenger. Applied Economics Letters, 18(1),
49-53.

140
Chan, J.K.L. (2014). Understanding the meaning of low airfare and satisfaction among
leisure air travelers using Malaysian low-cost airlines. Journal of Vacation
Marketing, 20(3), 211-223.
Chang, L., & Hung, S. (2013). Adoption and loyalty toward low cost carriers: The case of
Taipei-Singapore passengers. Transportation Research Part E: Logistics and
Transportation Review, 50, 29-36.
Charoensettasilp, C., & Wu, C. (2013). Thai passengers' satisfaction after receiving
services from Thailand's domestic low cost airline. International Journal of u- and
e- Service, Science and Technology, 6(6), 107-120.
Chen, C., & Wu, T. (2009). Exploring passenger preferences in airline service attributes:
A note. Journal of Transport Management, 15, 52-53.
Cheng, S., Fu, H., & Tu, L.T. (2011). Examining consumer purchase intentions for
counterfeit products based on a modified theory of planned behavior.
International Journal of Humanities and Social Science, 1(10), 278-284.
Chiam, M., & Soutar, G. (2009). Online and off-line travel packages preferences: A
conjoint analysis. International Journal of Tourism Research, 11(1), 31-40.
Chiou, Y., & Chen, Y. (2010). Factors influencing the intentions of passengers regarding
full service and low cost carriers: A note. Journal of Air Transport Management,
16(4), 226-228.
Civil Aviation Authority. (2006). No-frills carriers: Revolution or evolution? A study by
the Civil Aviation Authorit; CAP 770. Retrieved from http://www.caa.co.uk/
docs/33/CAP770.pdf

141
Creswell, J. W. (2009). Research design: Qualitative, quantitative and mixed methods
approaches. Thousand Oaks, CA: Sage Publications.
Cunningham, L.F., Young, C.E., & Lee, M. (2004). Perceptions of airline service quality
pre- and post-9/11. Public Works Management Policy, 9(1), 10-25.
Dahlen, M., Lange, F., & Smith, T. (2010). Marketing communications: A brand
narrative approach. Hoboken, NJ: John Wiley and Sons.
Darley, W.K., Blankson, C., & Luethge, D.J. (2010). Toward an integrated framework for
online consumer behavior and decision making process: A review. Psychology
and Marketing, 27(2), 94-116.
Davison, L., & Ryley, T. (2010). Tourism destination preferences of low-cost airline
users in the East Midlands. Journal of Transport Geography, 18(3), 458-465.
Dawidowicz, P. (2010). Literature reviews made easy: A quick guide to success.
Charlotte, NC: Information Age Publishing.
De Canniere, M.H., De Pelsmacker, P., & Geuens, M. (2009). Relationship quality and
the theory of planned behavior models of behavioral intentions and purchase
behavior. Journal of Business Research, 62(1), 82-92.
Devore, J., Farnum, N. & Doi, J. (2013) Applied statistics for engineers and scientists.
Mason, OH: Cengage Learning.
Diggines, C. (2010, June). Passenger perceptions and understanding of the low-cost and
full-service airline models in South Africa and the implications for service
strategy. Paper presented at the International Research Symposium in Service
Management, Pointe aux Piments, Mauritius. Retrieved from
http://web.uom.ac.mu/sites/irssm/papers/Diggines%20~%2012.pdf
142
Dodds, W.B., Monroe, K.B., & Grewal, D. (1991). Effect of price, brand and store
information on buyers’ product evaluations. Journal of Marketing Research, 28,
307-19.
Dolnicar, S., Grabler, K., Grun, B., & Kulnig, A. (2011). Key drivers of airline loyalty.
Tourism Management, 32(5), 1020-1026.
Eurocontrol. (2013, February 21). 2012: Overall, traffic falls but growth for low-cost and
charters. Retrieved from https://www.eurocontrol.int/press-releases/2012-overall-
traffic-falls-growth-low-cost-and-charters
Evangelho, F., Huse, C., & Linhares, A. (2005). Market entry of a low cost airline and
impacts on the Brazilian business travelers. Journal of Air Transport
Management, 11(2), 99-105.
Fourie, C., & Lubbe, B. (2006). Determinants of selection of full-service airlines and low-
cost carriers - a note on business travelers in South Africa. Journal of Air
Transport Management, 12(2), 98-102.
Galotti, V. & Maurino, D. (2006). ICAO initiates promotes global approach to SMS
implementation. ICAO Journal, 61, 6-8.
Graham, M.E., & Bansal, P. (2007). Consumers' willingness to pay for corporate
reputation: The context of airline companies. Corporate Reputation Review, 10(3),
189-200.
Gravetter, F., & Forzano, L. (2011). Research methods for the behavioral sciences.
Mason, OH: Cengage Learning.
Grix, J. (2010). The foundations of research. New York: Palgrave Macmillan.
143
Hair, J., Black, W., Babin, B., & Anderson, R. (2010). Multivariable data analysis. Upper
Saddle River, NJ: Prentice-Hall.
Hair, J.F., Celsi, M.W., Money, A. H., Samouel, P., & Page, M.J. (2011). Essentials of
business research methods. Armonk, NY: M.E. Sharpe.
Harbison, P. (2013, November). LCCs in Asia Pacific. Paper presented at the
ICAO/CAAC LCC Symposium, Beijing, China. Retrieved from http://www.
Icao.int/Meetings/Regional-Symposia/LCC-China2013/Documents
/Presentations/1.02.pdf
Harkness, J., Pennell, B., & Schoua-Glusburg, A. (2004). Survey questionnaire
translation and assessment. In S. Presser, et al. (Eds.), Methods for testing and
evaluating survey questionnaires (pp. 453-473). Hoboken, NJ: John Wiley and
Sons.
Harrington, D. (2009). Confirmatory factor analysis. New York: Oxford University Press.
Hess, S., & Polak, J.W. (2006). Airport, airline and access mode choice in the San
Francisco Bay area. Papers in Regional Science, 85(4), 543-567.
Ho, L.H., Hung, C.L., & Chen, H.C. (2012). Examining the acceptance behavior of
mobile phone messaging as a parent-teacher medium based on TAM and UTAUT
models. Advances in Information Sciences and Service Sciences, 4(1). 254-263.
Huang, Y. (2009). The effect of airline service quality on passengers' behavioural
intentions using SERVQUAL scores: A Taiwan case study. Proceedings of the
Eastern Asia Society for Transportation Studies, 7, 427-440.
Index Mundi. (2014). Thailand Demographics Profile 2014. Retrieved from http://www.
indexmundi.com/thailand/demographics_profile.html
144
Jou, R., Ham, S., Hensher, D.A., Chen, C., & Kuo, C. (2008). The effect of service
quality and price on international airline competition. Transportation Research
Part E: Logistics and Transportation Review, 44(4), 580-592.
Kaplan, D. (2009). Structural equation modeling: Foundations and extensions. Thousand
Oaks, CA: Sage Publications.
Kardes, F., Cronley, M., & Cline, T. (2010). Consumer behavior. Mason, OH: Cengage.
Kerr, A., Lennon, A.J., & Watson, B.C. (2010). The call of the road: Factors predicting
students' car travelling intentions and behaviour. Transportation, 37(1), 1-13.
Kline, R.B. (2012). Assumptions in structural equation modeling. In R.H. Hoyle (ed).,
Handbook of structural equation modeling (pp. 111-125). New York: Guilford
Press.
Klöckner, C.A. (2013). A comprehensive model of the psychology of environmental
behaviour - a meta-analysis. Global Environmental Change, 23(5), 1028-1038.
KPMG. (2013). 2013 Airline disclosures handbook. Retrieved from
http://www.kpmg.com/Global/en/IssuesAndInsights/ArticlesPublications/Docume
nts/airline-disclosures-handbook-2013-v2.pdf
Lantos, G.P. (2010). Consumer behavior in action: Real-life applications for marketing
managers. New York: M.E. Sharpe.
Loo, B.P. (2008). Passengers’ airport choice within multi-airport regions (MARs): Some
insights from a stated preference survey at Hong Kong International Airport.
Journal of Transport Geography, 16(2), 117-125.

145
Madden, T.J., Ellen, P.S., & Ajzen, I. (1992). A comparison of the theory of planned
behavior and the theory of reasoned action. Personality and Social Psychology
Bulletin, 18(1), 3-9.
Martín, J.C., Román, C., & Espino, R. (2008). Willingness to pay for airline service
quality. Transport Reviews: A Transnational Transdisciplinary Journal, 28(2),
199-217.
McEachan, R.R., Conner, M., Taylor, N.J., & Lawton, R.J. (2011). Prospective prediction
of health-related behaviours with the Theory of Planned Behaviour: A meta-
analysis. Health Psychology Review, 5(2), 97-144.
Mikulic, J., & Prebezak, D. (2011). What drives passenger loyalty to traditional and low-
cost airlines? A formative partial least squares approach. Journal of Air Transport
Management, 17(4), 237-240.
NSO. (2014). Latest releases. Retrieved from National Statistics Office:
http://web.nso.go.th/
O'Connell, J.F., & Williams, G. (2005). Passengers' perceptions of low cost airlines and
full service carriers: A case study involving Ryanair, Aer Lingus, and Malaysia
Airlines. Journal of Air Transport Management, 11(5), 259-272.
Ong, W.L., & Tan, A.K. (2010). A note on the determinants of airline choice: The case of
Air Asia and Malaysia Airlines. Journal of Air Transport Management, 16(4),
209-212.
Ostrom, T.M. (2014). Interdependence of attitude theory and measurement. In A.R.
Pratkanis, S. Breckler, & A.G. Greenwald (Eds.), Attitude structure and function.
New York: Psychology Press.
146
Oyewole, P., Sankaran, M., & Choudhury, P. (2007). Consumer choice of airlines in
Malaysia: A synthesis of perspectives from participants in the air travel market.
Journal of International Consumer Marketing, 20(1), 19-31.
Park, J. (2007). Passenger perceptions of service quality: Korean and Australian case
studies. Journal of Air Transport Management, 13(4), 238-242.
Park, J. (2010). The effect of frequent flyer programs: A case study of the Korean airline
industry. Journal of Air Transport Management, 16(5), 287-288.
Peck, R., Olsen, C., & Devote, J. (2012). Introduction to statistics and data analysis.
Boston, MA: Brooks/Cole Cengage Learning.
Penz, E., & Stöttinger, B. (2005). Forget the "real" thing - take the copy! An explantory
model for the volitional purchase of counterfeit products. Advances in Consumer
Research, 32, 568-575.
Pratkanis, A.R. (2014). The cognitive representation of attitudes. In A.R. Pratkanis, A.G.
Greenwald, & S.J. Breckler (Eds.), Attitude structure and function. New York:
Psychology Press.
Rivis, A., & Sheeran, P. (2003). Descriptive norms as an additional predictor in the theory
of planned behaviour: A meta-analysis. Current Psychology, 22(3), 218-233.
Rivis, A., Scheeran, P., & Armitage, C.J. (2009). Expanding the affective and normative
components of the theory of planned behavior: A meta-analysis of anticipated
affect and moral norms. Journal of Applied Social Psychology, 39(12), 2985-
3019.
Rugg, G., & Petre, M. (2006). A gentle guide to research methods. New York: Open
University Press.

147
Rutherford, L.G., & DeVaney, S.A. (2009). Utilizing the theory of planned behavior to
understand the convenience use of credit cards. Journal of Financial Counseling
and Planning, 20(2), 48-63.
Sabre. (2010). The evolution of the airline business model. Retrieved from http://
www.sabreairlinesolutions.com/images/uploads/Hybrid_Model_Brochure.pdf
Saha, G.C., & Theingi. (2009). Service quality, satisfaction, and behavioural intentions: A
study of low-cost airline carriers in Thailand. Managing Service Quality, 19(3),
350-372.
Sarstedt, M., & Mooi, E. (2014). A concise guide to market research: The process, data
and methods using IBM SPSS statistics (2nd ed.). New York: Springer.
Saunders, M., Lewis, P., & Thornhill, A. (2009). Research methods for business students.
New York: Pearson Education.
Schreiber, E.S. (2008). Essential knowledge reputation. Retrieved from
http://www2.lebow.drexel.edu/PDF/Docs/CCRM/EssentialKnowledge.pdf
Siragusa, L. & Dixon, K.C. (2009, December). Theory of planned behaviour: Higher
education students' attitudes towards ICT-based learning Interactions. Same
places, different spaces. Proceedings ascilite Auckland 2009. Retrieved from
http://citeseerx.ist.psu.edu/viewdoc/download?doi=10.1.1.412.815&rep=rep1&typ
e=pdf
Soper, D. (2014). A-priori sample size calculator for structural equation modeling.
Retrieved from http://www.danielsoper.com/statcalc3/calc.aspx?id=89
Suzuki, Y. (2004). The impact of airline service failures on travelers' carrier choice: A
case study of Central Iowa. Transportation Journal, 43(2), 26-36.
148
Smyth, M., & Pearce, B. (2006). Airline cost performance (IATA Economics Briefing No.
5). Retrieved from http://www.iata.org/whatwedo/Documents/economics/
airline_cost_performance.pdf
Teng, C., & Perry, M. (2013, May). Asia's low-cost carriers. Retrieved from
https://research.standardchartered.com/configuration/ROW%20Documents/Asia's
_low-cost_carriers__A_comprehensive_study_of_regulation_competition_
and_growth_potential_21_05_13_18_30.pdf
Theis, G., Adler, T., Clarke, J.P., & Ben-Akiva, M. (2006). Risk aversion to short
connections in airline itinerary choice. Transportation Research Record: Journal
of the Transportation Research Board, 1951(1), 28-36.
Trochim, W.M., & Donnelly, J.P. (2006). The research methods knowledge base. Mason,
OH: Atomic Dog Publishing.
van Eggermond, M.A. (2007). Consumer choice behaviour and strategies of air
transportation service providers. Delft, Netherlands: Delft University of
Technology.
Vermeir, I., & Verbeke, W. (2006). Sustainable food consumption: Exploring the
consumer "attitude-behavioral intention" gap. Journal of Agricultural and
Environmental Ethics, 19, 169-194.
Vidovic, A., Steiner, S., & Babic, R.S. (2006). Impact of low-cost airlines on the
European air transport market. Unpublished manuscript. Retrieved from
https://bib.irb.hr/ datoteka/260325.ICTS_06_vidovic.pdf
Vidovic, A., Stimac, I., & Vince, D. (2013). Development of business models of low-cost
airlines. International Journal for Traffic and Transport Engineering, 3(1), 69-81.

149
Westland, J.C. (2010). Lower bounds on sample size in structural equation modeling.
Electronic Commerce Research and Applications, 9(6), 476-487.
Wittman, M.D. (2014). Are low-cost carrier passengers less likely to complain about
service quality? Journal of Air Transport Management, 35, 64-71.
World Bank. (2014). School enrollment, tertiary (% gross). Retrieved from
http://data.worldbank.org/indicator/SE.TER.ENRR/countries
Wu, I., & Chen, J. (2005). An extension of Trust and TAM model with TPB in the initial
adoption of on-line tax: An empirical study. International Journal of Human-
Computer Studies, 62(6), 784-808.
Zeithaml, V.A., Parasuraman, A., & Berry, L.L. (2010). Delivering quality service:
Balancing customer perceptions and expectations. New York: The Free Press.
Zhang, Y. (2011, June-July). What do Chinese passengers expect from domestic airlines?
ATRS 2011: 15th Annual Air Transport Research Society Conference, Sydney,
Australia. Retrieved from http://eprints.usq.edu.au/21230/
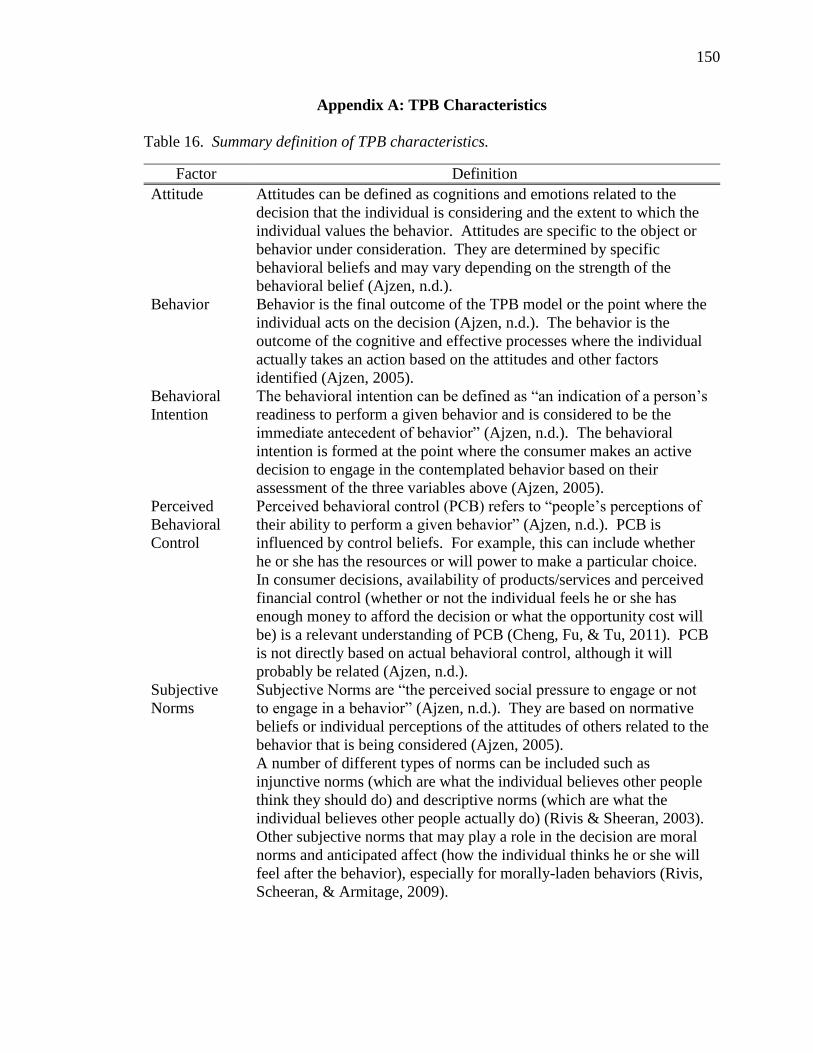
150
Appendix A: TPB Characteristics
Table 16. Summary definition of TPB characteristics.
Factor Definition
Attitude Attitudes can be defined as cognitions and emotions related to the
decision that the individual is considering and the extent to which the
individual values the behavior. Attitudes are specific to the object or
behavior under consideration. They are determined by specific
behavioral beliefs and may vary depending on the strength of the
behavioral belief (Ajzen, n.d.).
Behavior Behavior is the final outcome of the TPB model or the point where the
individual acts on the decision (Ajzen, n.d.). The behavior is the
outcome of the cognitive and effective processes where the individual
actually takes an action based on the attitudes and other factors
identified (Ajzen, 2005).
Behavioral
Intention
The behavioral intention can be defined as “an indication of a person’s
readiness to perform a given behavior and is considered to be the
immediate antecedent of behavior” (Ajzen, n.d.). The behavioral
intention is formed at the point where the consumer makes an active
decision to engage in the contemplated behavior based on their
assessment of the three variables above (Ajzen, 2005).
Perceived
Behavioral
Control
Perceived behavioral control (PCB) refers to “people’s perceptions of
their ability to perform a given behavior” (Ajzen, n.d.). PCB is
influenced by control beliefs. For example, this can include whether
he or she has the resources or will power to make a particular choice.
In consumer decisions, availability of products/services and perceived
financial control (whether or not the individual feels he or she has
enough money to afford the decision or what the opportunity cost will
be) is a relevant understanding of PCB (Cheng, Fu, & Tu, 2011). PCB
is not directly based on actual behavioral control, although it will
probably be related (Ajzen, n.d.).
Subjective
Norms
Subjective Norms are “the perceived social pressure to engage or not
to engage in a behavior” (Ajzen, n.d.). They are based on normative
beliefs or individual perceptions of the attitudes of others related to the
behavior that is being considered (Ajzen, 2005).
A number of different types of norms can be included such as
injunctive norms (which are what the individual believes other people
think they should do) and descriptive norms (which are what the
individual believes other people actually do) (Rivis & Sheeran, 2003).
Other subjective norms that may play a role in the decision are moral
norms and anticipated affect (how the individual thinks he or she will
feel after the behavior), especially for morally-laden behaviors (Rivis,
Scheeran, & Armitage, 2009).

151
Appendix B: Factors in Airline Selection
Table 17. Summary of factors in airline selection.
Factor Description Sources
Airline reputation The perceived reputation of
the airline refers to the
passenger’s general
perception of the airline
based on public knowledge
and information (for
example safety record). An
airline’s public reputation
will influence passenger
choice.
Atalık & Özel (2007) Bukhari, et al. (2012)
Chiam & Soutar (2009)
Dolnicar, et al. (2011)
Graham & Bansal (2007)
Zhang (2011)
Airline safety Perceived safety refers to
the passenger’s impression
of the airline and its general
safety record. An airline’s
safety record, especially a
record of recent accidents,
will influence passenger
choice. For most
passengers, this will be
based on publicly available
information rather than
detailed knowledge of the
airline’s actual safety
record or procedures.
Atalık & Özel (2007) Barros, et al. (2008)
Cunningham, et al. (2004)
Graham & Bansal (2007)
Jou, et al. (2008)
Mikulic & Prebezak (2011)
Oyewole, et al. (2007)
Zhang (2011)
Frequent flier programs Perception of frequent flier
programs refers to the
value consumers place on
the frequent flier program
and its incentives. Airlines
do sometimes use frequent
flier programs to offer
passengers incentives. This
can influence airline
selection, though LCCs do
not ordinarily have these
programs.
Carlsson & Löfgren (2006)
Fourie & Lubbe (2006)
Hess & Polak (2006)
Park (2010)
Vidovic, et al. (2013)
Price Perceived price is the
passenger’s perception of
the price of the ticket based
on their available
information. Price is often
Chan (2014) Davison & Ryley (2010)
Diggines (2010)
Dolnicar, et al. (2011)
Evangelho, et al. (2005)

152
the main factor for LCC
selection. However,
sometimes it is a perception
of low price, rather than a
confirmed low price, that
drives selection. LCC
passengers are more price-
sensitive than FSC
passengers in general.
Fourie & Lubbe (2006)
Hess & Polak (2006)
Jou, et al. (2008)
Loo (2008)
Park (2007)
O'Connell & Williams
(2005)
Route availability and
convenience
Perceived route availability
and convenience refers to
the extent to which the
passenger views the
airline’s schedule and route
offerings as appropriate for
their needs. This factor
includes passenger
preferences for direct route
and, if necessary, ease of
transfer between airlines or
routes.
Atalık & Özel (2007)
Castillo-Manzano &
Marchena-Gómez (2010)
Fourie & Lubbe (2006)
Hess & Polak (2006)
Theis, et al. (2006) van Eggermond (2007)
Zhang (2011)
Service quality Perceived service quality is
the passenger’s perception
of the service quality
received, depending on the
criteria they have
established. Service
quality includes service
timeliness (on-time
departure and arrival),
ground services (check-in,
boarding, and luggage) as
well as in-flight services
(food and drink and service
classes). LCC and full-
service passengers select
airlines based on perceived
service quality, but LCC
passengers may have
reduced expectations for
service.
Atalık & Özel (2007)
Balcolme, et al. (2009)
Chen & Wu (2009)
Fourie & Lubbe (2006)
Huang (2009)
Jou, et al. (2008)
Martín, et al. (2008)
Park (2007)
Suzuki (2004)
Wittman (2014)
Zhang (2011)
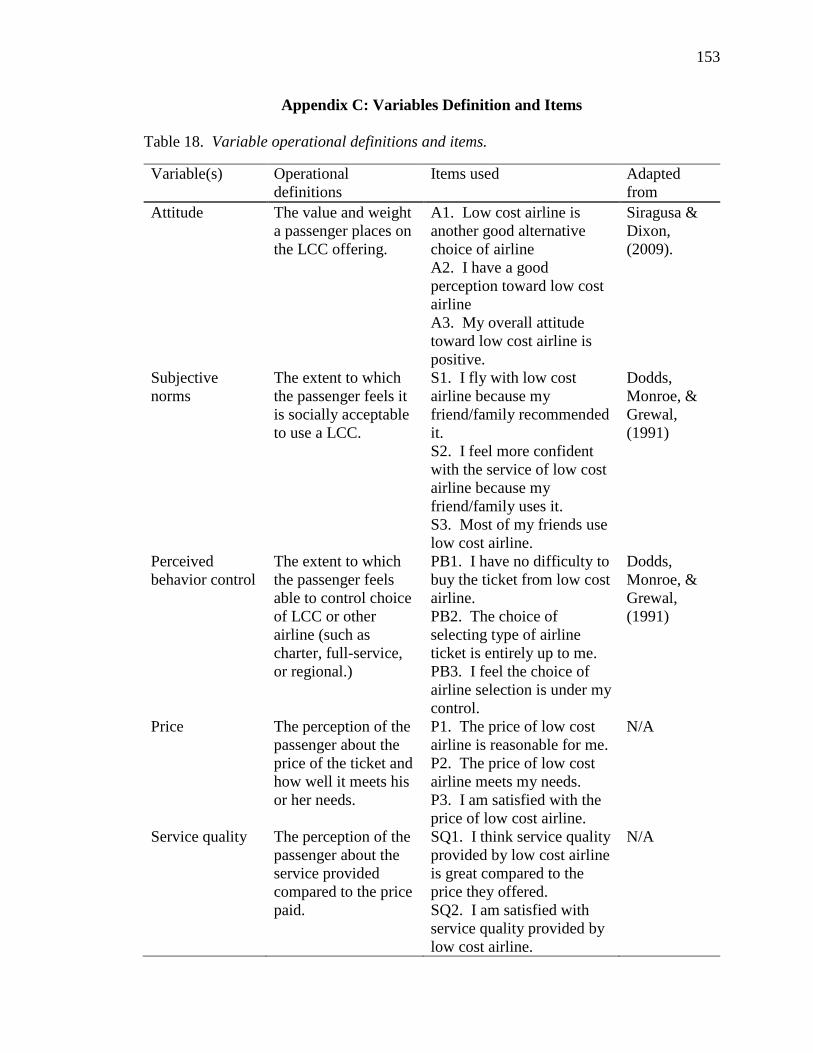
153
Appendix C: Variables Definition and Items
Table 18. Variable operational definitions and items.
Variable(s) Operational
definitions
Items used Adapted
from
Attitude The value and weight
a passenger places on
the LCC offering.
A1. Low cost airline is
another good alternative
choice of airline
A2. I have a good
perception toward low cost
airline
A3. My overall attitude
toward low cost airline is
positive.
Siragusa &
Dixon,
(2009).
Subjective
norms
The extent to which
the passenger feels it
is socially acceptable
to use a LCC.
S1. I fly with low cost
airline because my
friend/family recommended
it.
S2. I feel more confident
with the service of low cost
airline because my
friend/family uses it.
S3. Most of my friends use
low cost airline.
Dodds,
Monroe, &
Grewal,
(1991)
Perceived
behavior control
The extent to which
the passenger feels
able to control choice
of LCC or other
airline (such as
charter, full-service,
or regional.)
PB1. I have no difficulty to
buy the ticket from low cost
airline.
PB2. The choice of
selecting type of airline
ticket is entirely up to me.
PB3. I feel the choice of
airline selection is under my
control.
Dodds,
Monroe, &
Grewal,
(1991)
Price The perception of the
passenger about the
price of the ticket and
how well it meets his
or her needs.
P1. The price of low cost
airline is reasonable for me.
P2. The price of low cost
airline meets my needs.
P3. I am satisfied with the
price of low cost airline.
N/A
Service quality The perception of the
passenger about the
service provided
compared to the price
paid.
SQ1. I think service quality
provided by low cost airline
is great compared to the
price they offered.
SQ2. I am satisfied with
service quality provided by
low cost airline.
N/A

154
SQ3. Overall service
quality of low cost airlines
is good.
Airline
reputation
The perception of the
passenger that the
airline has a good
public reputation.
AR1. I usually perceive
good information about low
cost airline.
AR2. I believe that low
cost airline has a good
reputation.
AR3. I think low cost
airlines have good public
republic reputation.
N/A
Airline safety The perception of the
passenger about the
airline’s operational
safety record.
AS1. Safety system is the
main the most significant
factor that I consider when
buying airline ticket.
AS2. I only use the airline
that has a good reputation
on safety system.
AS3. I believe that low cost
airline has a good safety
system.
N/A
Route
availability and
convenience
The perception of the
passenger about how
well the airline’s
route availability,
timing, and other
convenience factors
meet his or her needs.
R1. The number of routes
is the main reason that
influences me to use airline
service.
R2. I am satisfied with
timing and flight schedule
provided by low cost
airline.
R3. The route availability
offered by low cost airline
meets my expectation.
N/A
Frequent flier
program
The perception of the
passenger that
frequent flier program
offerings are
valuable.
F1. I think that frequent
flier program offered by
low cost airlines is one of
the main reasons that
influences me to use airline
service.
F2. I think frequent flier
program offerings are
valuable.
F3. I buy ticket of this
airlines because of benefits
of flier program.
N/A
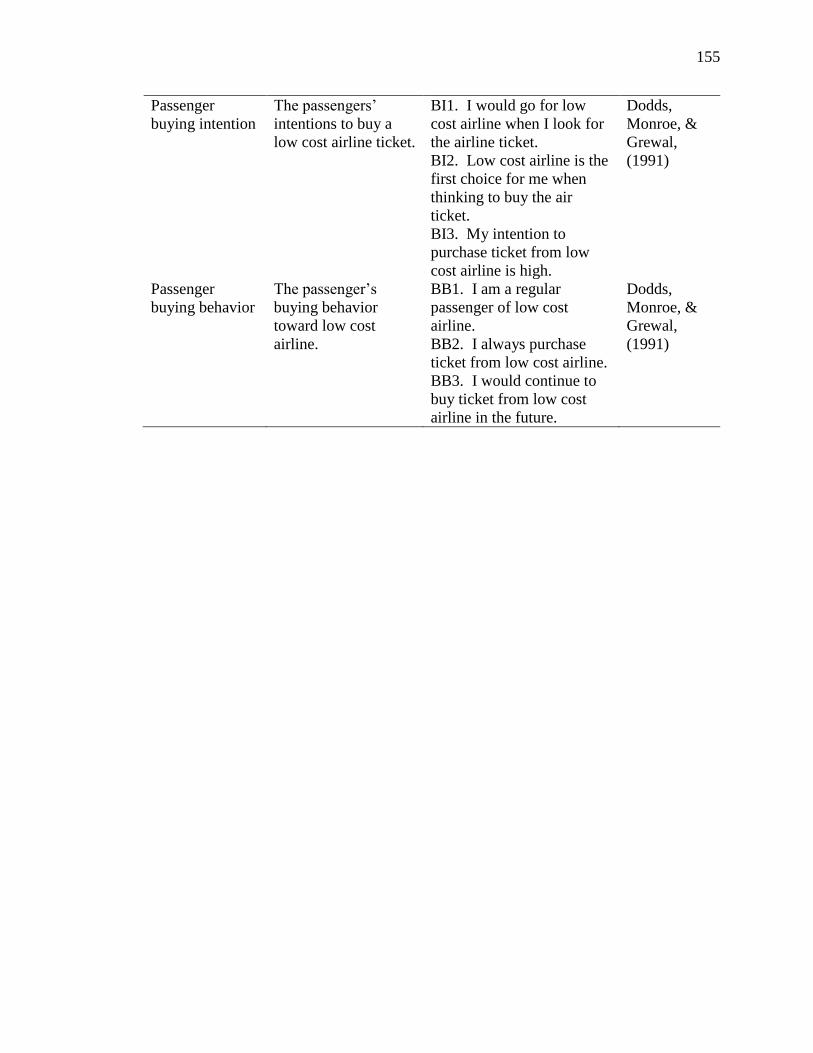
155
Passenger
buying intention
The passengers’
intentions to buy a
low cost airline ticket.
BI1. I would go for low
cost airline when I look for
the airline ticket.
BI2. Low cost airline is the
first choice for me when
thinking to buy the air
ticket.
BI3. My intention to
purchase ticket from low
cost airline is high.
Dodds,
Monroe, &
Grewal,
(1991)
Passenger
buying behavior
The passenger’s
buying behavior
toward low cost
airline.
BB1. I am a regular
passenger of low cost
airline.
BB2. I always purchase
ticket from low cost airline.
BB3. I would continue to
buy ticket from low cost
airline in the future.
Dodds,
Monroe, &
Grewal,
(1991)

156
Appendix D: Questionnaire
“Determination of Factors That Influence Passengers’ Airline Selection:
A Study of Low Cost Carriers in Thailand”
STUDY LEADERSHIP. I am Thapanat Buaphiban, a student in the college of aviation
at Embry Riddle Aeronautical University, Daytona Beach, Florida, USA. I am asking you
to take part in my Ph.D. Dissertation research project. Dothang Truong, Ph.D., a member
of the department, is supervising this study.
PURPOSE. The purpose of this research is to investigate factors influencing the selection
of airlines in Thailand from the passenger point of view based on research at Suvarnabhumi
International Airport (BKK) and Don Mueng International Airport (Operated only LCCs).
ELIGIBILITY. To take part in this study you must be a passenger who departing from a
Thai airport using a low-cost carrier (LCC).
PARTICIPATION. During the study, you will take a survey asking about your travel
experience and demographic questions such as your approximate age and education level.
You will also be asked about your opinions on factors influencing passengers’ airline
selection such as “Low cost airline is another good alternative choice of airline”
(agree/disagree). Completing this questionnaire will take about 15 minutes.
RISKS OF PARTICIPATION. The risks you run by taking part in this study are minimal
and not higher than those faced in everyday life. The risk includes the possibility that you
may be offended by some of the questions in the survey. You are free to skip any questions
that makes you uncomfortable or stop the survey at any time.
BENEFITS OF PARTICIPATION. I do not expect the study to benefit you personally.
This study will benefit me by helping me to finish my PhD. This study is also intended to
benefit academic and business readers, specifically contributing to knowledge about
consumer motivations of low-cost carriers.

157
VOLUNTARY PARTICIPATION. Your participation in this study is completely
voluntary. You may stop or withdraw from the study at any time or refuse to answer any
particular question for any reason without it being held against you. Your decision whether
or not to participate will have no effect on your current or future connection with anyone
at Embry Riddle Aeronautical University.
CONFIDENTIALITY. All information collected from this survey will be kept
confidentially, and raw data will be destroyed as soon as the data is analyzed. The survey
will be in unidentified format, and participant information is anonymous.
CONSENT. Ticking “Yes” below means that you understand the information on this form,
that any questions you may have about this study have been answered, and that you are
eligible and voluntarily agree to participate on this survey. Ticking “No” will end this
survey.
Yes, I am a passenger who is departing from a Thai airport using a low-cost carrier (LCC)
and I would like to participate. (Please start the survey)
No, I do not want to participate. (Please end the survey)
Section 1: Screening Section
1.1 Are you departing from a Thai airport using a low-cost carrier (LCC)?
( ) Yes (Please continue) ( ) No (Please withdraw this
survey)
Section 2: Travel Experience
2.1 How often do you travel by LCCs?
( ) This is my first time ( ) Less than once per year
( ) Once per year ( ) 2 to 3 times per year
158
( ) More than 3 times per year
2.2 Which destinations do you normally fly to from Thailand using LCCs?
( ) within Thailand ( ) South East Asian countries
( ) Asia Pacific ( ) Australia
( ) Other, please specify_____________
2.3 How do you get information about the airline?
( ) Search engine ( ) Social media
( ) Company website ( ) Travel agency
( ) Family and friends ( ) TV advertising
( ) Travel magazine
( ) Other, please specify_____________
2.4 How do you purchase your LCC ticket?
( ) LCC website ( ) LCC Office
( ) LCC call center ( ) At the airport
( ) Travel agency
( ) Other, please specify_____________
2.5 What is the main purpose of travelling by LCC?
( ) Leisure/Vacation ( ) Business
159
( ) Seminar/Conference/Training ( ) Study
( ) Medical treatment ( ) Visiting family
( ) Other, please specify_____________
Section 3: Factors influencing passengers’ airline selection
Statements Strongly
Disagree
Disagree Neutral Agree Strongly
Agree
A1. Low cost airlines are another
good alternative choice of airline.
A2. I have a good perception
toward low cost airlines.
A3. My overall attitude toward low
cost airlines is positive.
S1. I fly with low cost airlines
because my friends/family
recommend it.
S2. I feel more confident with the
service of low cost airlines because
my friends/family uses it.
S3. Most of my friends use low cost
airlines.
PB1. I have no difficulty buying the
ticket from a low cost airline.
PB2. The choice of selecting a type
of airline ticket is entirely up to me.
PB3. I feel the choice of airline
selection is under my control.
P1. The price of a low cost airline is
reasonable for me.
P2. The price of a low cost airline
meets my needs.
P3. I am satisfied with the price of a
low cost airline.
SQ1. I think service quality
provided by a low cost airline is
great compared to the price they
offer.
SQ2. I am satisfied with service
quality provided by low cost
airlines.
160
SQ3. Overall service quality of low
cost airlines is good.
AR1. I usually perceive good
information about low cost airlines.
AR2. I believe that low cost airlines
have a good reputation.
AR3. I think low cost airlines have
good public republic reputation.
AS1. Safety system is the most
significant factor that I consider
when buying airline ticket.
AS2. I only use the airline that has
a good reputation on its safety
system.
AS3. I believe that low cost airlines
have a good safety system.
R1. The number of routes is the
main reason that influences me to
use airline service.
R2. I am satisfied with timing and
flight schedule provided by low cost
airlines.
R3. The route availability offered
by low cost airlines meets my
expectation.
F1. I think that the frequent flier
program offered by low cost airlines
is one of the main reasons that
influence me to use airline service.
F2. I think frequent flier program
offerings are valuable.
F3. I buy ticket of this airlines
because of benefits of flier program.
Section 4: Buying Behavior
Statements Strongly
Disagree
Disagree Neutral Agree Strongly
Agree
BI1. I would go for a low cost
airline when I look for the airline
ticket.
BI2. A Low cost airline is the first
choice for me when thinking to buy
an airline ticket.
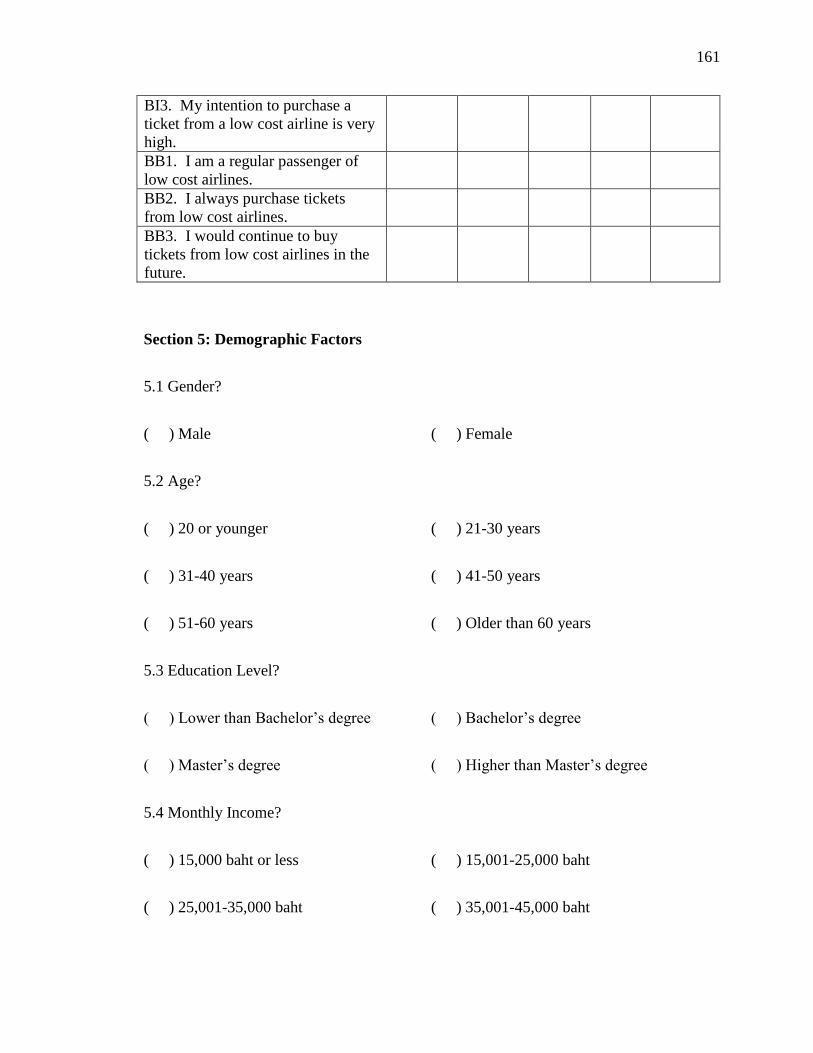
161
BI3. My intention to purchase a
ticket from a low cost airline is very
high.
BB1. I am a regular passenger of
low cost airlines.
BB2. I always purchase tickets
from low cost airlines.
BB3. I would continue to buy
tickets from low cost airlines in the
future.
Section 5: Demographic Factors
5.1 Gender?
( ) Male ( ) Female
5.2 Age?
( ) 20 or younger ( ) 21-30 years
( ) 31-40 years ( ) 41-50 years
( ) 51-60 years ( ) Older than 60 years
5.3 Education Level?
( ) Lower than Bachelor’s degree ( ) Bachelor’s degree
( ) Master’s degree ( ) Higher than Master’s degree
5.4 Monthly Income?
( ) 15,000 baht or less ( ) 15,001-25,000 baht
( ) 25,001-35,000 baht ( ) 35,001-45,000 baht
162
( ) 45,001-55,000 baht ( ) More than 55,000 baht
5.5 Occupation?
( ) Student ( ) Private company employee
( ) Government officer ( ) State enterprise employee
( ) Business owner ( ) Freelance
( ) Retired ( ) Unemployed
( ) Other, please specify_____________
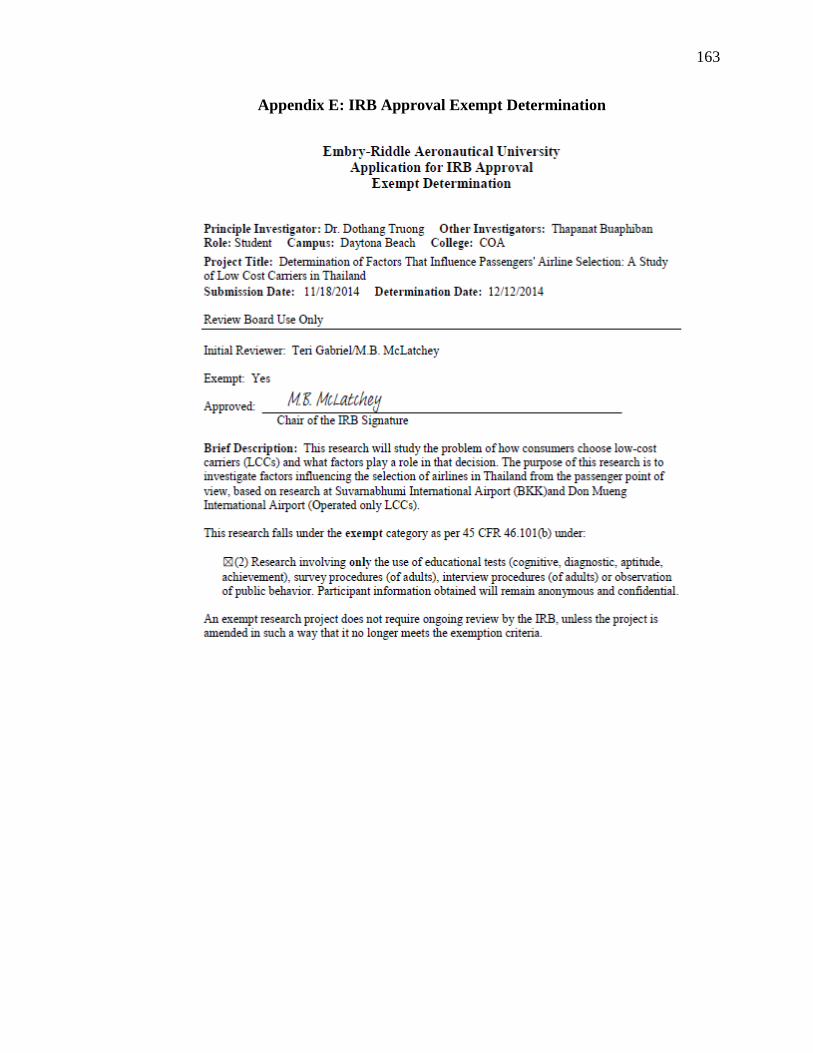
163
Appendix E: IRB Approval Exempt Determination
164

165
166
167
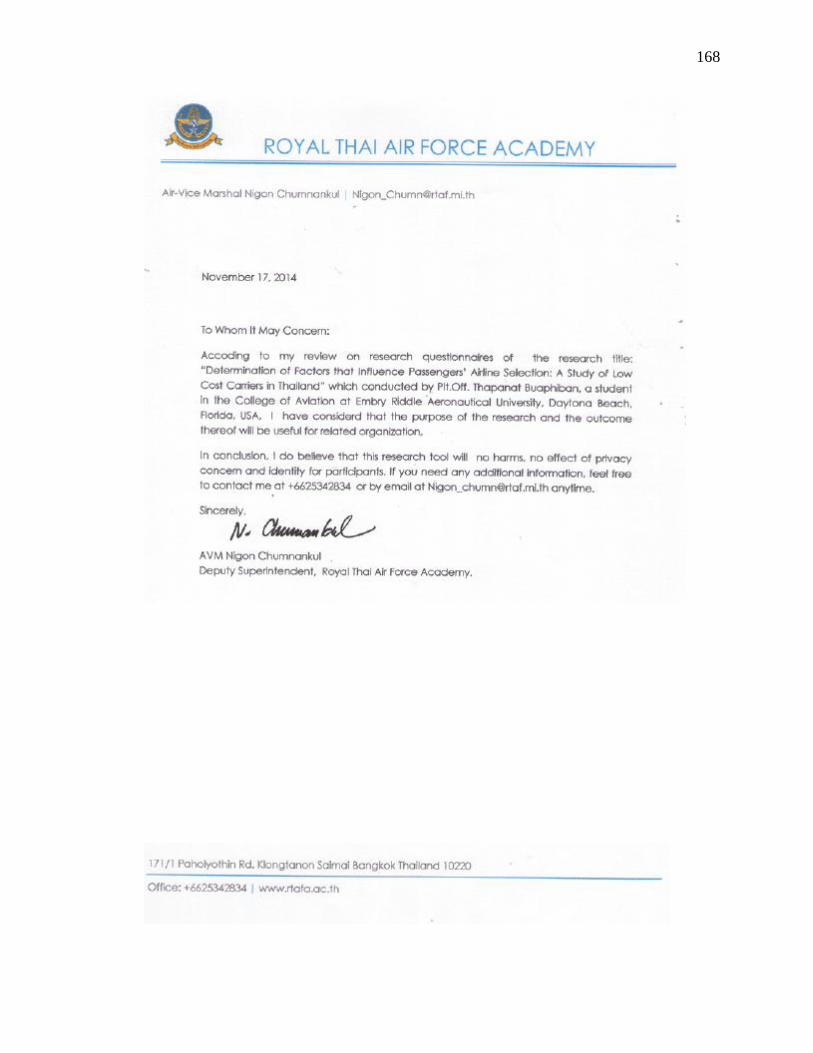
168

169

170
171
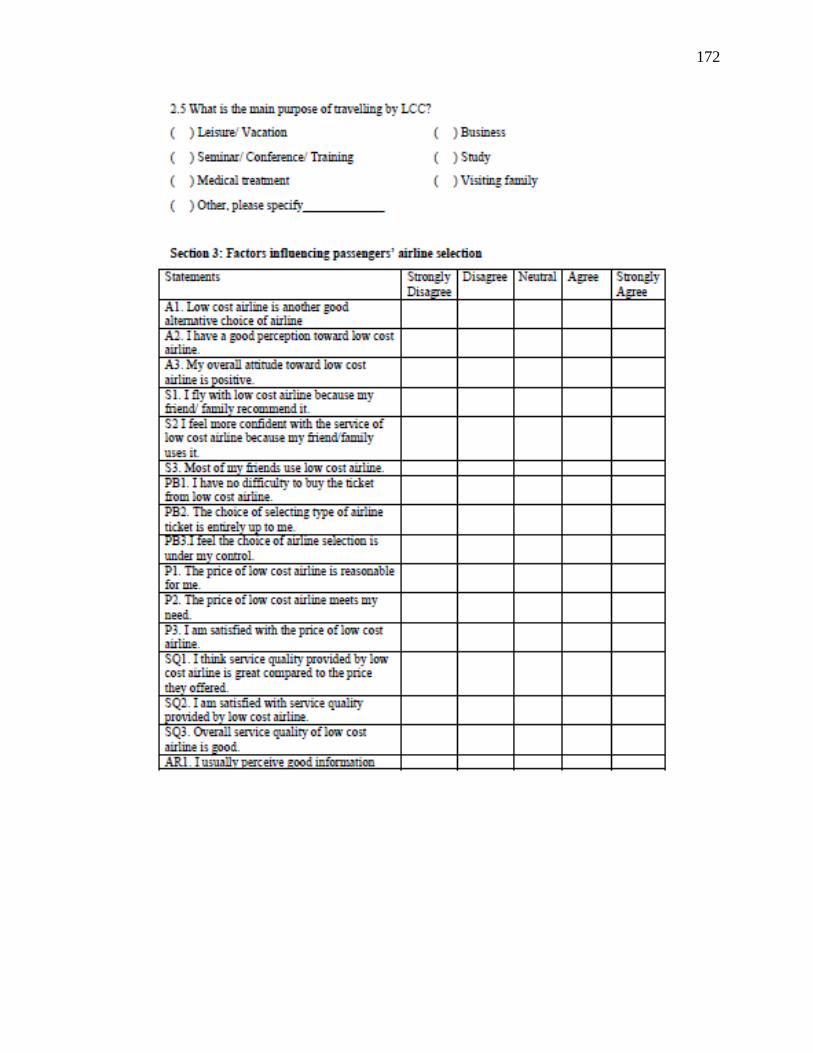
172
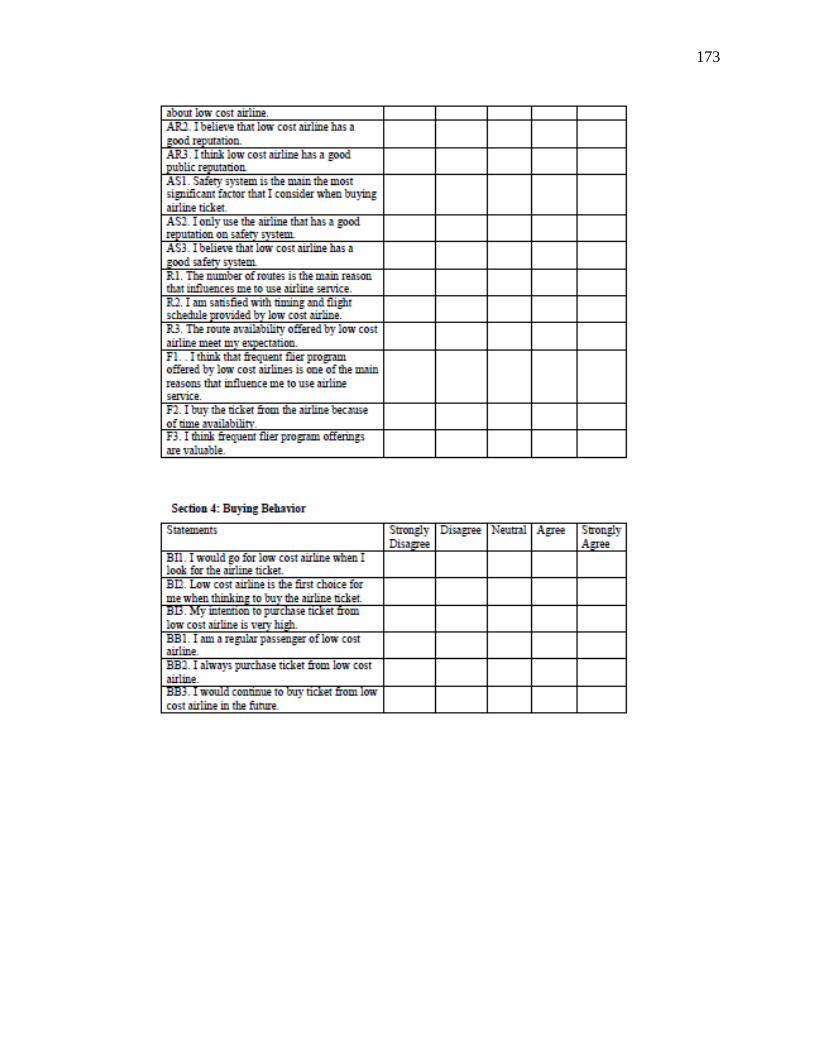
173
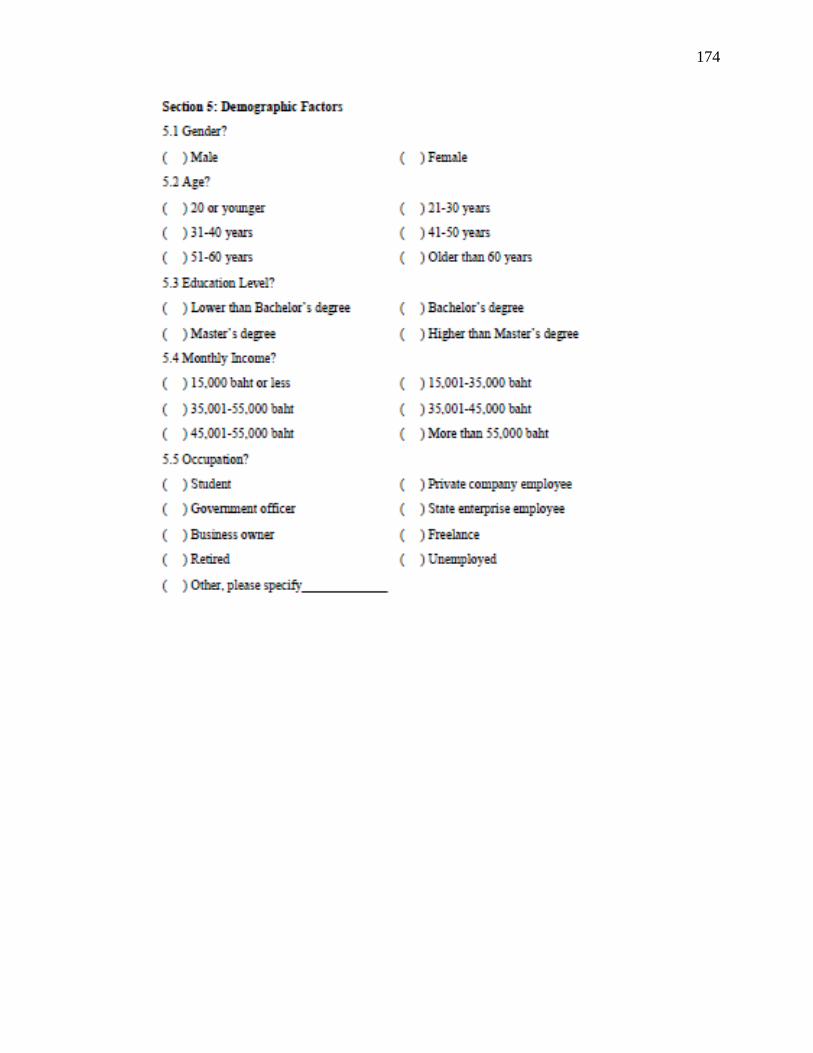
174