Embed Size (px)
Citation preview
Final report prepared for the California Air Resources Boardand the California Environmental Protection Agency
Determination of Elemental Carbon and Organic CarbonConcentrations During the Southern California
Children’s Health Study, 1999-2001
Contract Number 01-309
Lynn G. Salmon, Paul R. Mayo, and Glen R. Cass†
Environmental Science and Engineering
John H. SeinfeldChemical Engineering
California Institute of TechnologyPasadena, CA 91125
March, 2004
†Deceased
Disclaimer
The statements and conclusions in this Report are those of the contractor and notnecessarily those of the California Air Resources Board. The mention of commercialproducts, their source, or their use in connection with material reported herein is not tobe construed as actual or implied endorsement of such products.
Acknowledgments
This Report was submitted in partial fulfillment of ARB contract number 01-309and project title, “Determination of Elemental Carbon and Organic Carbon ConcentrationsDuring the Southern California Children’s Health Study, 1999-2001” by the CaliforniaInstitute of Technology under the sponsorship of the California Air Resources Board. Workwas completed as of January, 2004.
ii
Table of Contents
Acknowledgments . . . . . . . . . . . . . . . . . . . . . . . . . . . . . . . . . . ii
Table of Contents . . . . . . . . . . . . . . . . . . . . . . . . . . . . . . . . . . . iii
List of Figures . . . . . . . . . . . . . . . . . . . . . . . . . . . . . . . . . . . . iv
List of Tables . . . . . . . . . . . . . . . . . . . . . . . . . . . . . . . . . . . . . vi
Abstract . . . . . . . . . . . . . . . . . . . . . . . . . . . . . . . . . . . . . . . . vii
Executive Summary . . . . . . . . . . . . . . . . . . . . . . . . . . . . . . . . . vii
0.1 Background . . . . . . . . . . . . . . . . . . . . . . . . . . . . . . . . . . vii
0.2 Methods . . . . . . . . . . . . . . . . . . . . . . . . . . . . . . . . . . . . viii
0.3 Results . . . . . . . . . . . . . . . . . . . . . . . . . . . . . . . . . . . . . viii
0.4 Conclusions . . . . . . . . . . . . . . . . . . . . . . . . . . . . . . . . . . ix
1 Introduction . . . . . . . . . . . . . . . . . . . . . . . . . . . . . . . . . . . . 1
2 Experimental Procedures . . . . . . . . . . . . . . . . . . . . . . . . . . . .. 3
3 Results and Discussion . . . . . . . . . . . . . . . . . . . . . . . . . . . . . .7
3.1 Leg C PM10 OC/EC concentration data during 1999-2001 . . .. . . . . . 7
3.2 Leg D PM2.2 OC/EC concentration data during 2000-2001 . .. . . . . . . 19
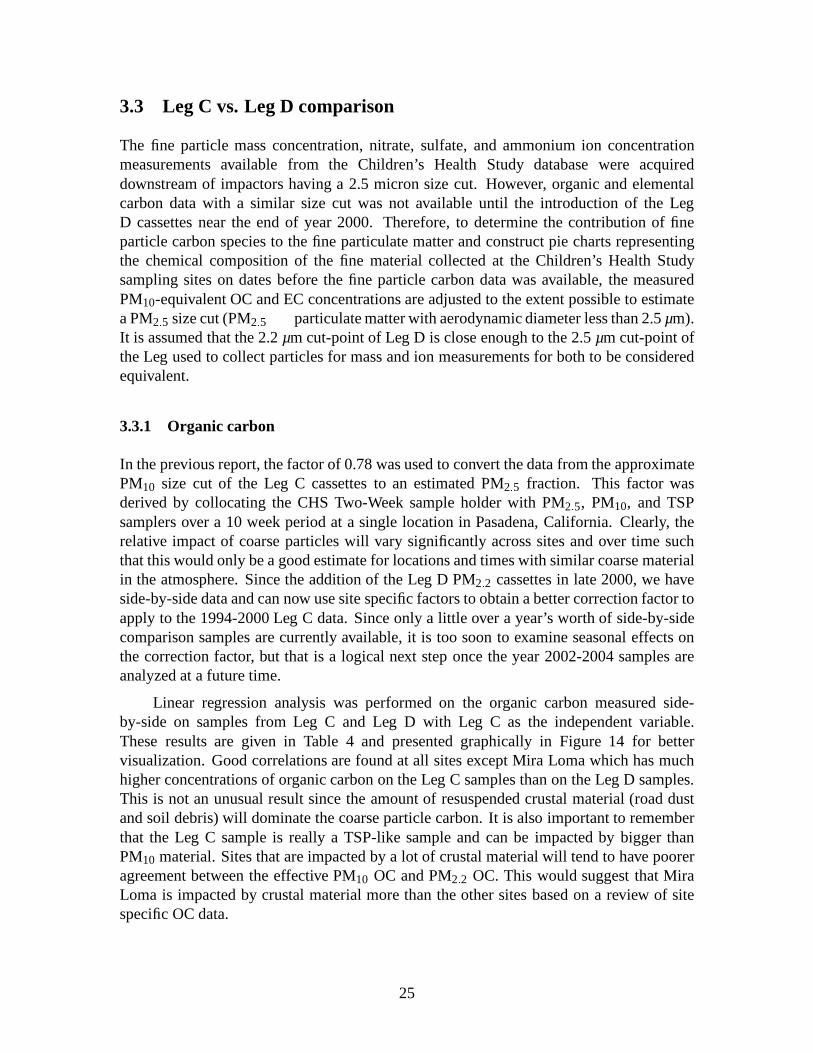
3.3 Leg C vs. Leg D comparison . . . . . . . . . . . . . . . . . . . . . . . . . 25
3.3.1 Organic carbon . . . . . . . . . . . . . . . . . . . . . . . . . . . . 25
3.3.2 Elemental carbon . . . . . . . . . . . . . . . . . . . . . . . . . . . 28
3.4 Mass balance . . . . . . . . . . . . . . . . . . . . . . . . . . . . . . . . . 31
4 Summary and Conclusions . . . . . . . . . . . . . . . . . . . . . . . . . . . . 44
5 References . . . . . . . . . . . . . . . . . . . . . . . . . . . . . . . . . . . . 47
Appendix A – Leg C Data . . . . . . . . . . . . . . . . . . . . . . . . . . . . . . 50
Appendix B – Leg D Data . . . . . . . . . . . . . . . . . . . . . . . . . . . . . . 72
iii
List of Figures
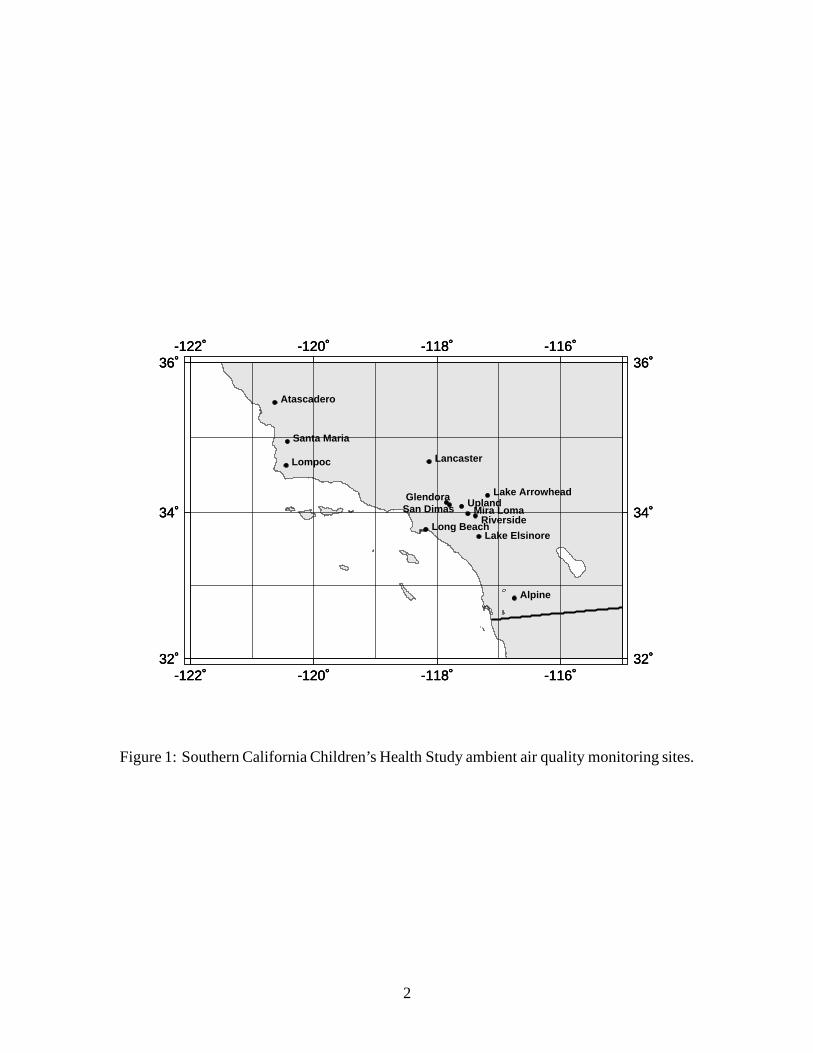
1 Southern California Children’s Health Study ambient air quality monitor-ing sites. . . . . . . . . . . . . . . . . . . . . . . . . . . . . . . . . . . . . 2
2 Replicate sample analyses. . . . . . . . . . . . . . . . . . . . . . . . . . .6
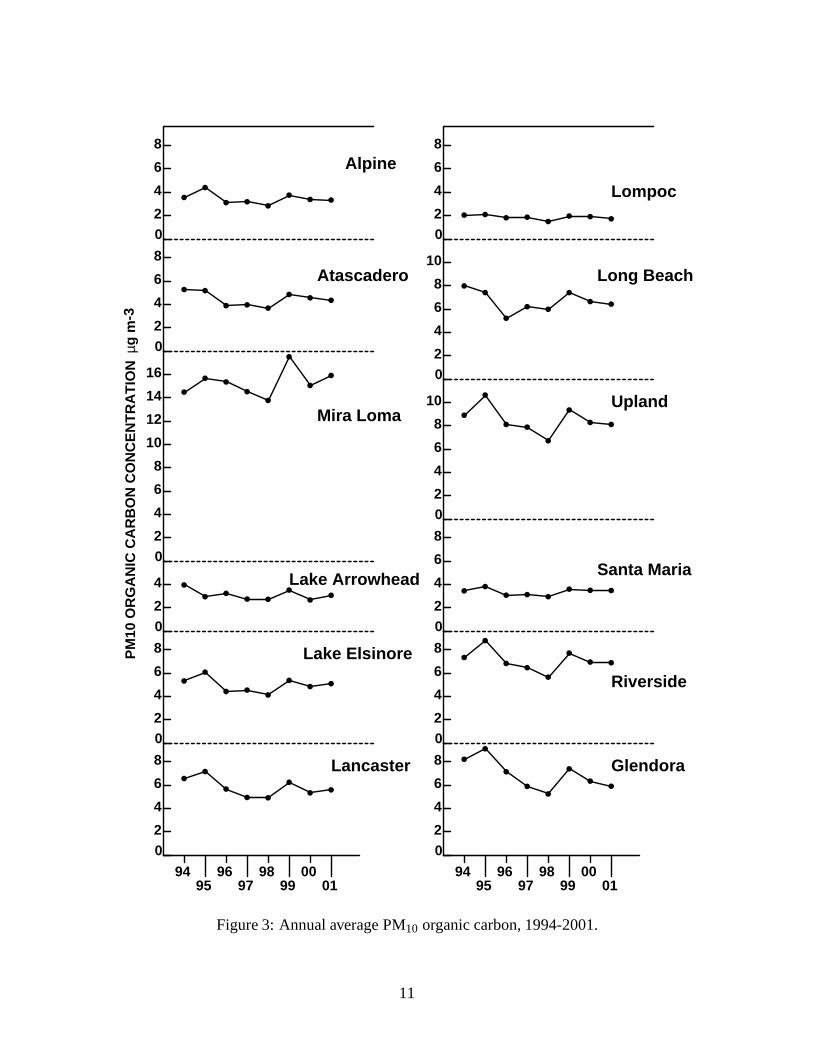
3 Annual average PM10 organic carbon, 1994-2001. . . . . . . . . . . . . . . 11
4 Time series of 2-week average PM10 elemental carbon concentrationsfound in Southern California at Mira Loma, Upland, Riverside andGlendora. (Glendora includes data from the San Dimas site for 1994 and1995.) . . . . . . . . . . . . . . . . . . . . . . . . . . . . . . . . . . . . . 13
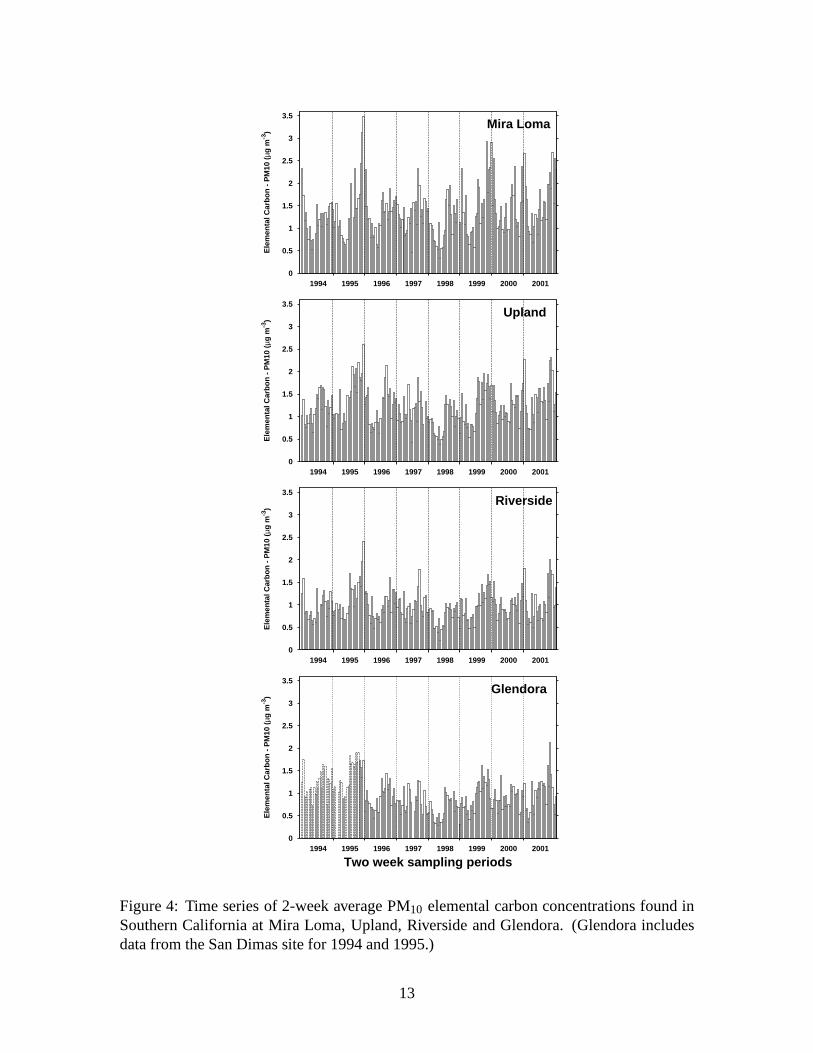
5 Time series of 2-week average PM10 elemental carbon concentrationsfound in Southern California at Lake Arrowhead, Lake Elsinore, Lancaster,and Long Beach. . . . . . . . . . . . . . . . . . . . . . . . . . . . . . . . 14
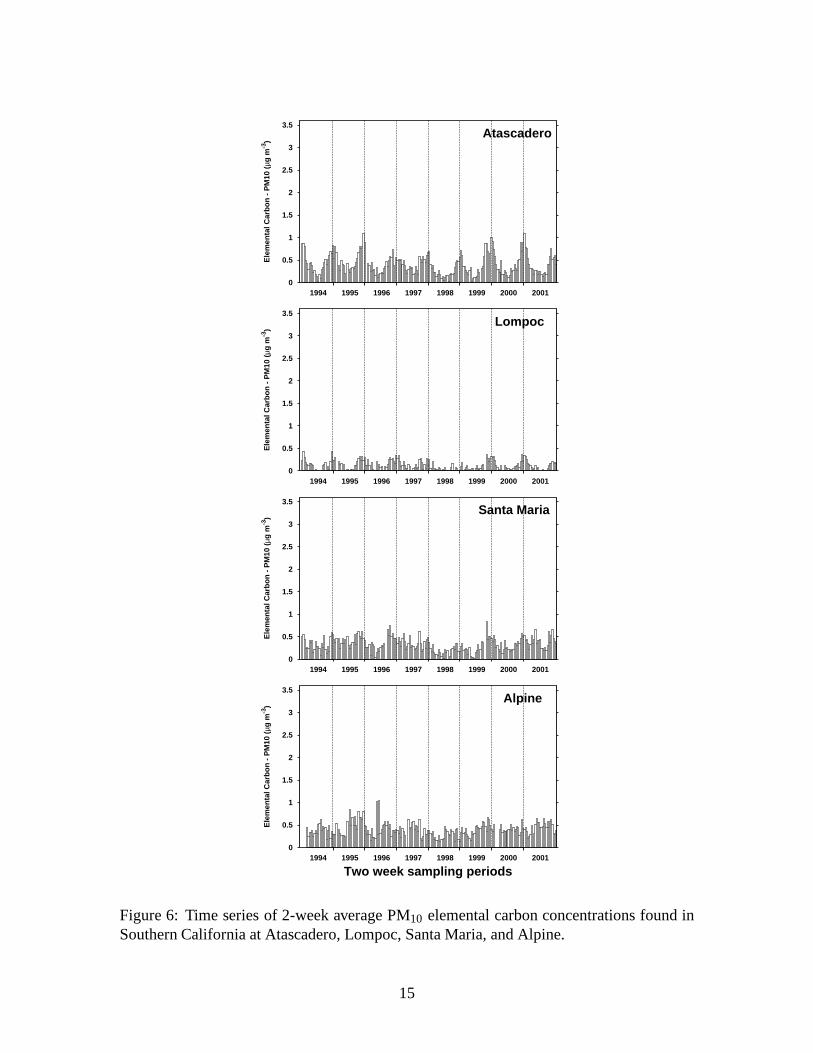
6 Time series of 2-week average PM10 elemental carbon concentrationsfound in Southern California at Atascadero, Lompoc, Santa Maria, andAlpine. . . . . . . . . . . . . . . . . . . . . . . . . . . . . . . . . . . . . 15
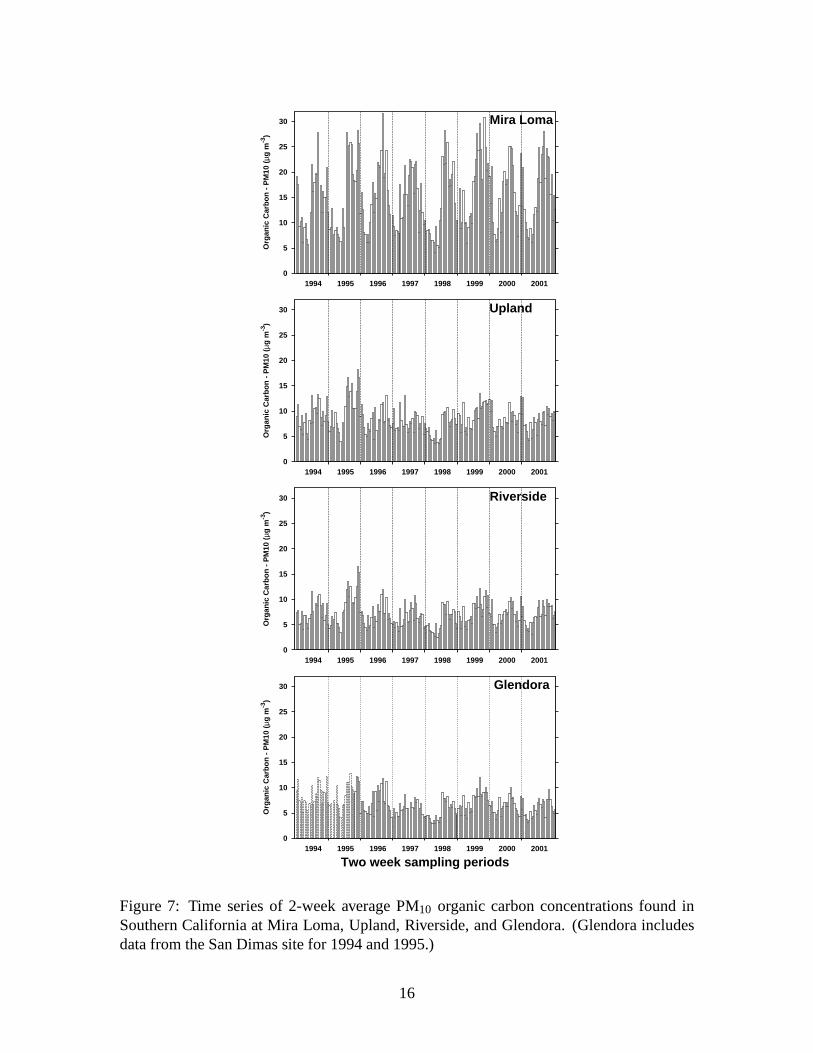
7 Time series of 2-week average PM10 organic carbon concentrations foundin Southern California at Mira Loma, Upland, Riverside, andGlendora.(Glendora includes data from the San Dimas site for 1994 and 1995.) . . . . 16
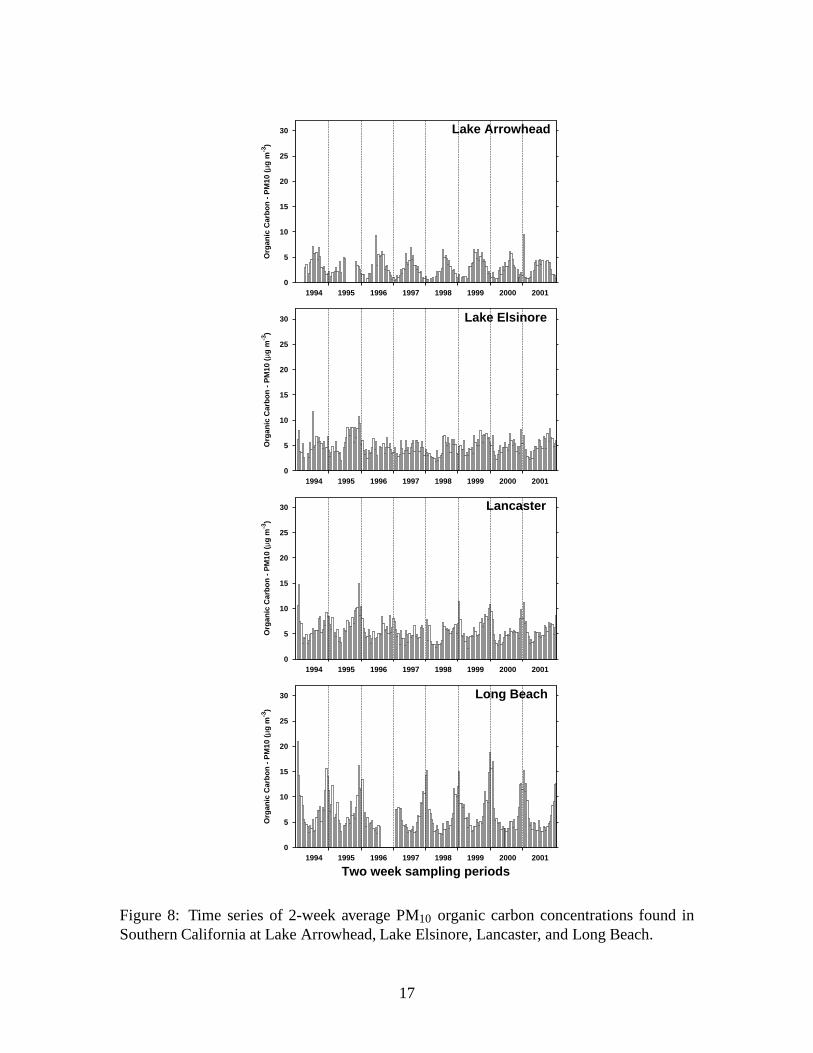
8 Time series of 2-week average PM10 organic carbon concentrations foundin Southern California at Lake Arrowhead, Lake Elsinore, Lancaster, andLong Beach. . . . . . . . . . . . . . . . . . . . . . . . . . . . . . . . . . . 17
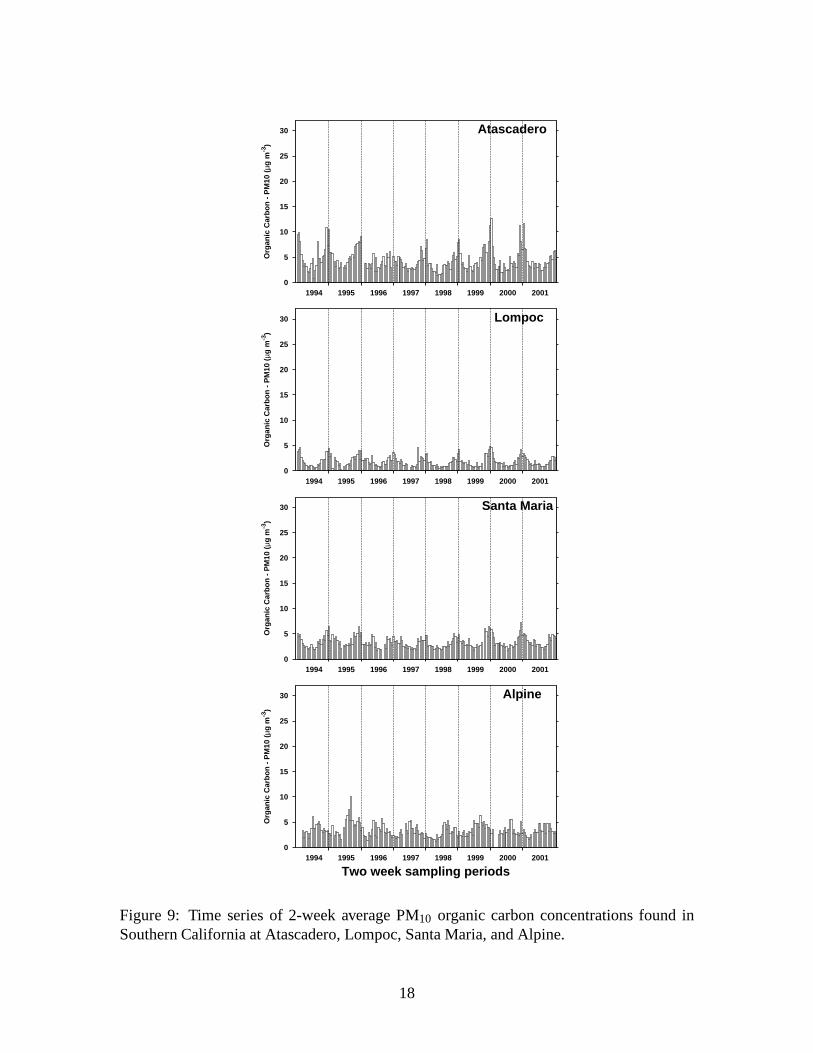
9 Time series of 2-week average PM10 organic carbon concentrations foundin Southern California at Atascadero, Lompoc, Santa Maria,and Alpine. . . 18
10 Time series of 2-week average PM2:2 elemental carbon concentrationsfound in Southern California at Alpine, Atascadero, Glendora, LakeArrowhead, Lake Elsinore and Lancaster. . . . . . . . . . . . . . . . .. . 21
11 Time series of 2-week average PM2:2 elemental carbon concentrationsfound in Southern California at Lompoc, Long Beach, Mira Loma,Riverside, Santa Maria, and Upland. . . . . . . . . . . . . . . . . . . . .. 22
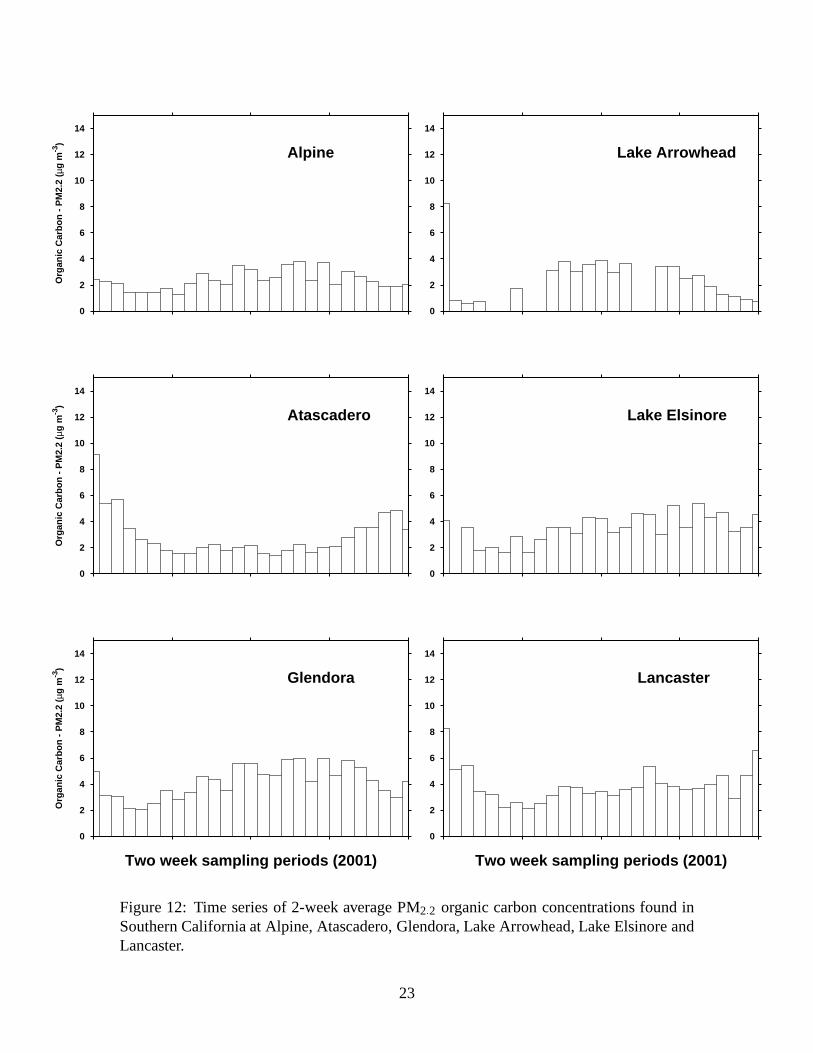
12 Time series of 2-week average PM2:2 organic carbon concentrations foundin Southern California at Alpine, Atascadero, Glendora, Lake Arrowhead,Lake Elsinore and Lancaster. . . . . . . . . . . . . . . . . . . . . . . . . . 23
iv
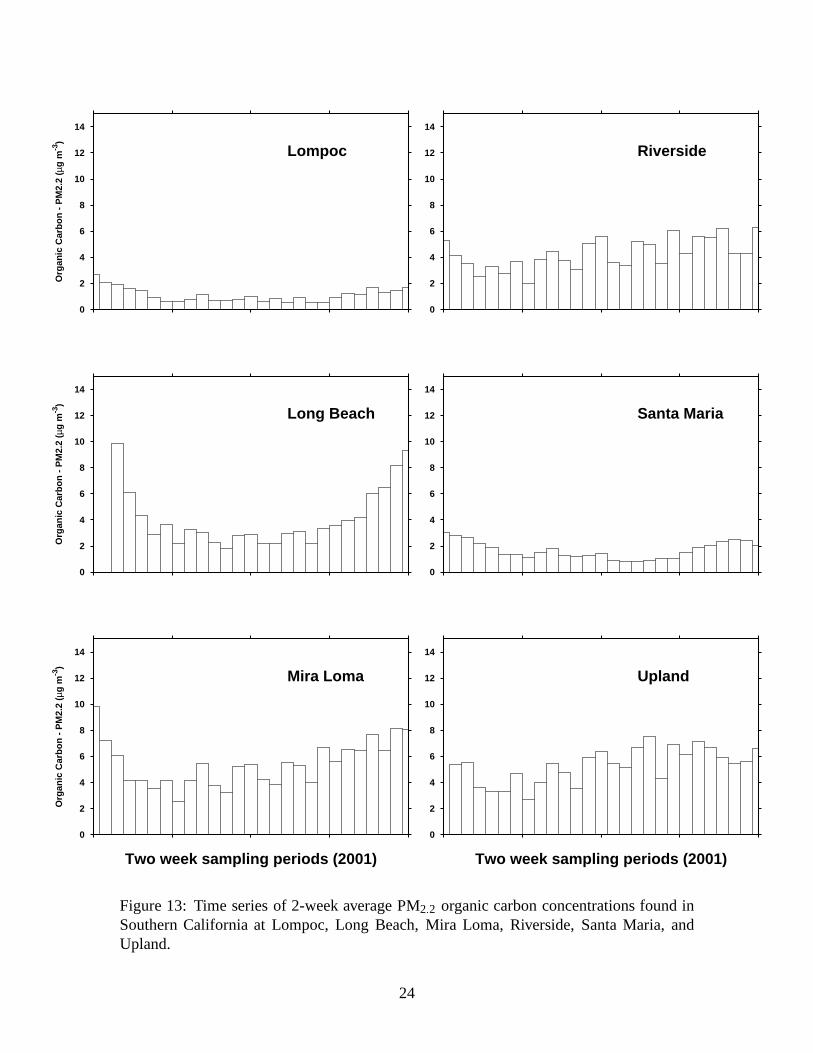
13 Time series of 2-week average PM2:2 organic carbon concentrations foundin Southern California at Lompoc, Long Beach, Mira Loma, Riverside,Santa Maria, and Upland. . . . . . . . . . . . . . . . . . . . . . . . . . . . 24
14 Linear regression comparison of Leg C vs Leg D organic carbon. . . . . . . 27
15 Linear regression comparison of Leg C vs Leg D elemental carbon. . . . . . 30
16 Chemical composition of 1999 annual airborne fine particle concentrations. 36
17 Chemical composition of 2000 annual airborne fine particle concentrations. 37
18 Chemical composition of 2001 annual airborne fine particle concentrations. 38
19 Chemical composition of 1994 annual airborne fine particle concentrations. 39
20 Chemical composition of 1995 annual airborne fine particle concentrations. 40
21 Chemical composition of 1996 annual airborne fine particle concentrations. 41
22 Chemical composition of 1997 annual airborne fine particle concentrations. 42
23 Chemical composition of 1998 annual airborne fine particle concentrations. 43
v
List of Tables
1 – Effect of Freezer Storage on OC/EC Results of Archived Samples . . . . 5
2 – Statistical Description of Annual Average PM10 Carbon Concentrations measuredon Leg C using Two-Week Samplers . . . . . . . . . . . . . . . . . 8
3 – Statistical Description of Annual Average Fine Carbon Concentrations measuredon Leg D using Two-Week Samplers . . . . . . . . . . . . . . . . . 20
4 – Linear Regression Comparison of Organic Carbon – Leg C vs.Leg D . . . 26
5 – Linear Regression Comparison of Elemental Carbon – Leg C vs. Leg D . . 29
6 – Annual Average Fine Particle (PM2.5) Mass Concentrations . . . . . . 33
vi
Abstract
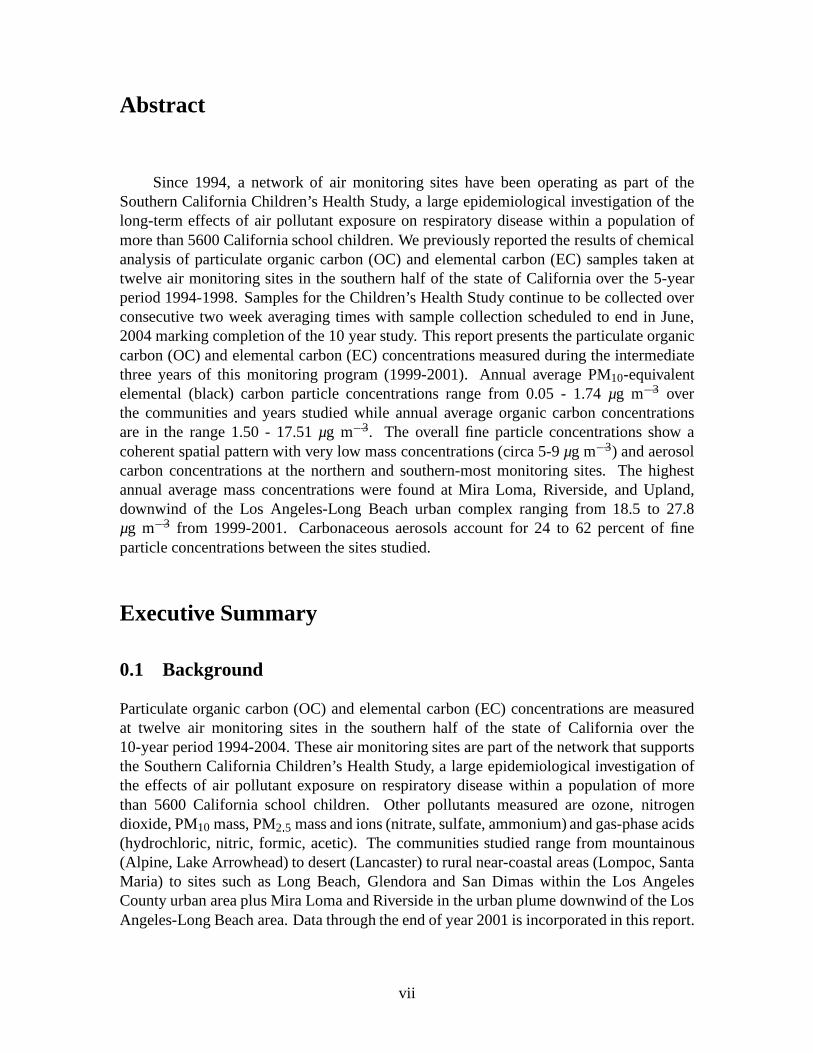
Since 1994, a network of air monitoring sites have been operating as part of theSouthern California Children’s Health Study, a large epidemiological investigation of thelong-term effects of air pollutant exposure on respiratorydisease within a population ofmore than 5600 California school children. We previously reported the results of chemicalanalysis of particulate organic carbon (OC) and elemental carbon (EC) samples taken attwelve air monitoring sites in the southern half of the stateof California over the 5-yearperiod 1994-1998. Samples for the Children’s Health Study continue to be collected overconsecutive two week averaging times with sample collection scheduled to end in June,2004 marking completion of the 10 year study. This report presents the particulate organiccarbon (OC) and elemental carbon (EC) concentrations measured during the intermediatethree years of this monitoring program (1999-2001). Annualaverage PM10-equivalentelemental (black) carbon particle concentrations range from 0.05 - 1.74µg m�3 overthe communities and years studied while annual average organic carbon concentrationsare in the range 1.50 - 17.51µg m�3. The overall fine particle concentrations show acoherent spatial pattern with very low mass concentrations(circa 5-9µg m�3) and aerosolcarbon concentrations at the northern and southern-most monitoring sites. The highestannual average mass concentrations were found at Mira Loma,Riverside, and Upland,downwind of the Los Angeles-Long Beach urban complex ranging from 18.5 to 27.8µg m�3 from 1999-2001. Carbonaceous aerosols account for 24 to 62 percent of fineparticle concentrations between the sites studied.
Executive Summary
0.1 Background
Particulate organic carbon (OC) and elemental carbon (EC) concentrations are measuredat twelve air monitoring sites in the southern half of the state of California over the10-year period 1994-2004. These air monitoring sites are part of the network that supportsthe Southern California Children’s Health Study, a large epidemiological investigation ofthe effects of air pollutant exposure on respiratory disease within a population of morethan 5600 California school children. Other pollutants measured are ozone, nitrogendioxide, PM10 mass, PM2:5 mass and ions (nitrate, sulfate, ammonium) and gas-phase acids(hydrochloric, nitric, formic, acetic). The communities studied range from mountainous(Alpine, Lake Arrowhead) to desert (Lancaster) to rural near-coastal areas (Lompoc, SantaMaria) to sites such as Long Beach, Glendora and San Dimas within the Los AngelesCounty urban area plus Mira Loma and Riverside in the urban plume downwind of the LosAngeles-Long Beach area. Data through the end of year 2001 isincorporated in this report.
vii
0.2 Methods
Organic and elemental carbon particle samples were collected on quartz fiber filters throughwhich ambient air was drawn for two weeks. After each two weekinterval, new quartz fiberfilters were installed at each sampling location in the Children’s Health Study samplingnetwork. The quartz fiber filters were analyzed for OC and EC content by thermal evolutionand combustion. The primary carbon particle cassette used during the study did not havea defined size cut, but was determined to have a broad cut-point of approximately 10µmafter comparison with reference samplers having known sizecuts (Salmon et al., 2001).A separate carbon particle cassette with a PM2:2 size cut was introduced in late 2000 andoperated side-by-side with the primary carbon particle cassette in use since the inceptionof the study. Linear regression analysis was performed on the carbon data obtained duringthe portion of the study when both type cassettes were operating side-by-side in order todetermine correction factors that are used to estimate the fine particle concentrations of theprimary Two-Week Sampler data.
0.3 Results
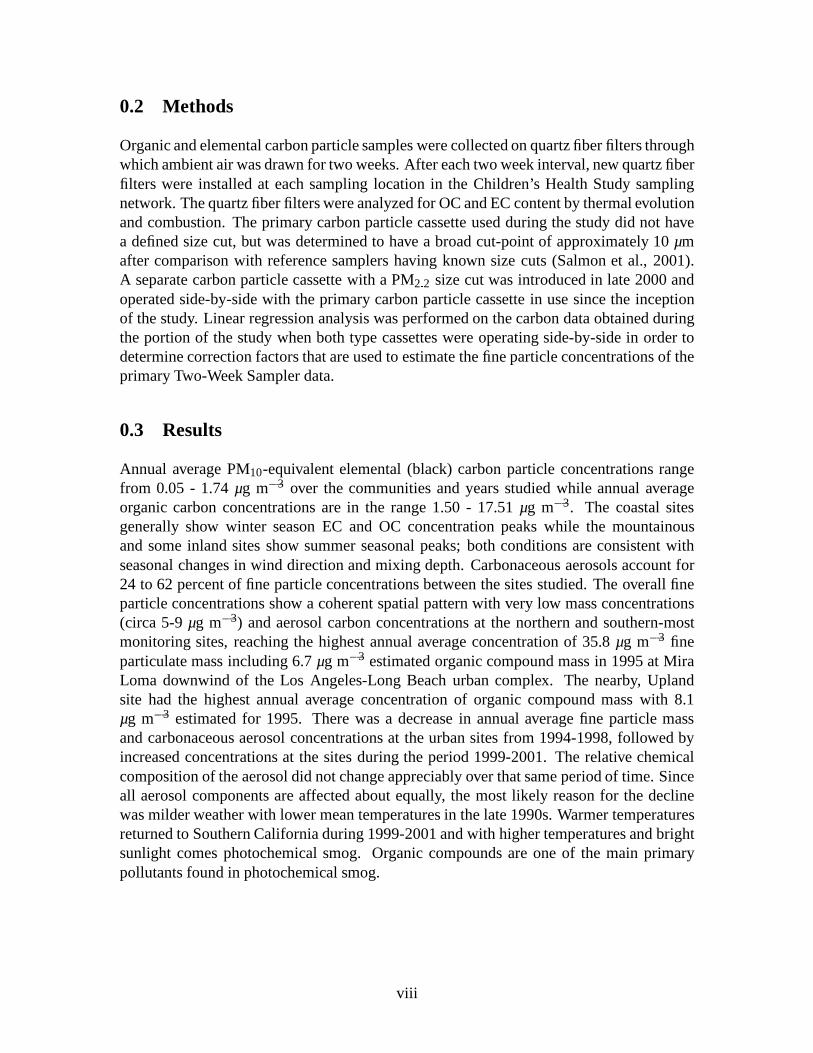
Annual average PM10-equivalent elemental (black) carbon particle concentrations rangefrom 0.05 - 1.74µg m�3 over the communities and years studied while annual averageorganic carbon concentrations are in the range 1.50 - 17.51µg m�3. The coastal sitesgenerally show winter season EC and OC concentration peaks while the mountainousand some inland sites show summer seasonal peaks; both conditions are consistent withseasonal changes in wind direction and mixing depth. Carbonaceous aerosols account for24 to 62 percent of fine particle concentrations between the sites studied. The overall fineparticle concentrations show a coherent spatial pattern with very low mass concentrations(circa 5-9µg m�3) and aerosol carbon concentrations at the northern and southern-mostmonitoring sites, reaching the highest annual average concentration of 35.8µg m�3 fineparticulate mass including 6.7µg m�3 estimated organic compound mass in 1995 at MiraLoma downwind of the Los Angeles-Long Beach urban complex. The nearby, Uplandsite had the highest annual average concentration of organic compound mass with 8.1µg m�3 estimated for 1995. There was a decrease in annual average fine particle massand carbonaceous aerosol concentrations at the urban sitesfrom 1994-1998, followed byincreased concentrations at the sites during the period 1999-2001. The relative chemicalcomposition of the aerosol did not change appreciably over that same period of time. Sinceall aerosol components are affected about equally, the mostlikely reason for the declinewas milder weather with lower mean temperatures in the late 1990s. Warmer temperaturesreturned to Southern California during 1999-2001 and with higher temperatures and brightsunlight comes photochemical smog. Organic compounds are one of the main primarypollutants found in photochemical smog.
viii
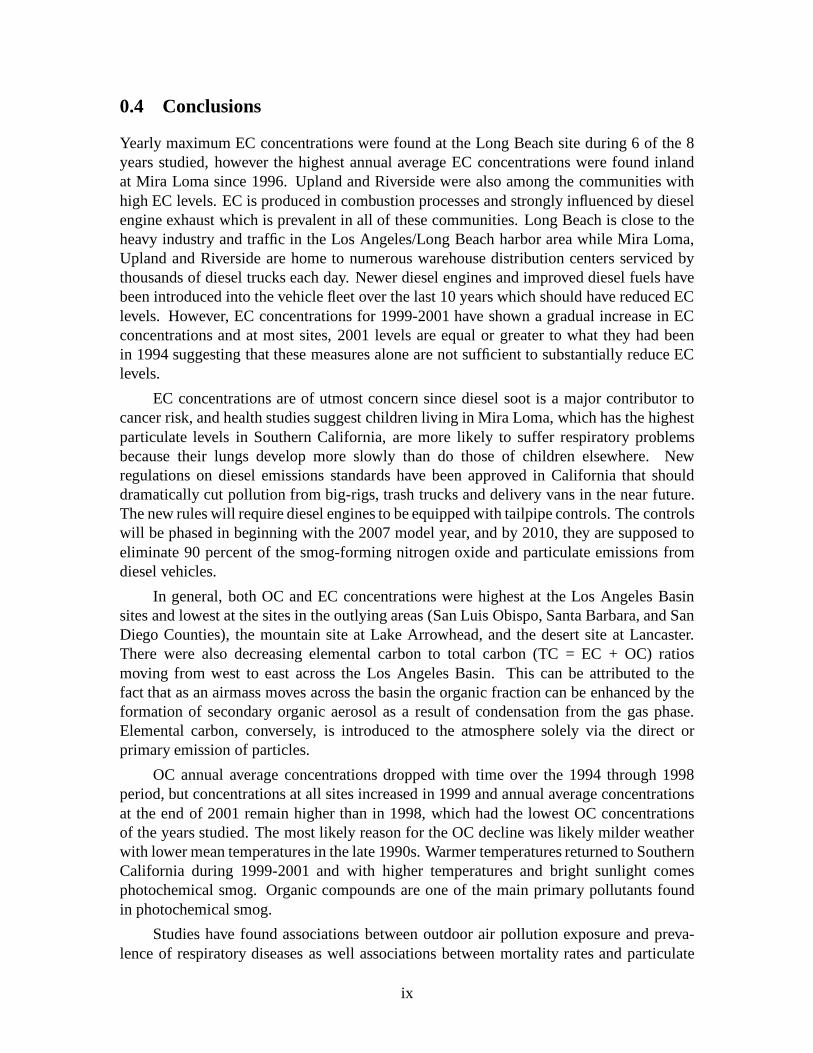
0.4 Conclusions
Yearly maximum EC concentrations were found at the Long Beach site during 6 of the 8years studied, however the highest annual average EC concentrations were found inlandat Mira Loma since 1996. Upland and Riverside were also amongthe communities withhigh EC levels. EC is produced in combustion processes and strongly influenced by dieselengine exhaust which is prevalent in all of these communities. Long Beach is close to theheavy industry and traffic in the Los Angeles/Long Beach harbor area while Mira Loma,Upland and Riverside are home to numerous warehouse distribution centers serviced bythousands of diesel trucks each day. Newer diesel engines and improved diesel fuels havebeen introduced into the vehicle fleet over the last 10 years which should have reduced EClevels. However, EC concentrations for 1999-2001 have shown a gradual increase in ECconcentrations and at most sites, 2001 levels are equal or greater to what they had beenin 1994 suggesting that these measures alone are not sufficient to substantially reduce EClevels.
EC concentrations are of utmost concern since diesel soot isa major contributor tocancer risk, and health studies suggest children living in Mira Loma, which has the highestparticulate levels in Southern California, are more likelyto suffer respiratory problemsbecause their lungs develop more slowly than do those of children elsewhere. Newregulations on diesel emissions standards have been approved in California that shoulddramatically cut pollution from big-rigs, trash trucks anddelivery vans in the near future.The new rules will require diesel engines to be equipped withtailpipe controls. The controlswill be phased in beginning with the 2007 model year, and by 2010, they are supposed toeliminate 90 percent of the smog-forming nitrogen oxide andparticulate emissions fromdiesel vehicles.
In general, both OC and EC concentrations were highest at theLos Angeles Basinsites and lowest at the sites in the outlying areas (San Luis Obispo, Santa Barbara, and SanDiego Counties), the mountain site at Lake Arrowhead, and the desert site at Lancaster.There were also decreasing elemental carbon to total carbon(TC = EC + OC) ratiosmoving from west to east across the Los Angeles Basin. This can be attributed to thefact that as an airmass moves across the basin the organic fraction can be enhanced by theformation of secondary organic aerosol as a result of condensation from the gas phase.Elemental carbon, conversely, is introduced to the atmosphere solely via the direct orprimary emission of particles.
OC annual average concentrations dropped with time over the1994 through 1998period, but concentrations at all sites increased in 1999 and annual average concentrationsat the end of 2001 remain higher than in 1998, which had the lowest OC concentrationsof the years studied. The most likely reason for the OC decline was likely milder weatherwith lower mean temperatures in the late 1990s. Warmer temperatures returned to SouthernCalifornia during 1999-2001 and with higher temperatures and bright sunlight comesphotochemical smog. Organic compounds are one of the main primary pollutants foundin photochemical smog.
Studies have found associations between outdoor air pollution exposure and preva-lence of respiratory diseases as well associations betweenmortality rates and particulate
ix
air pollution in metropolitan areas in the United States (Pope, 2000). There is increasingepidemiological evidence pointing toward health risks from particulate air pollution,especially fine particulate matter. However, organic and elemental carbon measurementswith a fine particle size cut were not taken as part of the Children’s Health Study until theintroduction of the Leg D cassettes near the end of year 2000.Preliminary comparisons ofEC concentrations taken side-by-side with Leg C and Leg D cassettes show problems withlower than expected EC concentrations as measured with the Leg D cassettes. It is stronglysuggested that additional testing be done to determine the cause of the EC reduction on theLeg D cassettes, since obtaining reliable fine particle PM2:5 data is of vital importance.
The organic and elemental carbon particle data show seasonal and annual variationsas well as spatial ranges in carbon particle concentrationsacross the southern half ofCalifornia. With carbonaceous aerosols accounting for 24 to 62 percent of fine particleconcentrations, it is clear that measurement of carbon species should be included inmulti-year, multi-location studies of particulate concentrations.
x
1 Introduction
Beginning in 1994, filter samples were collected and analyzed as part of the SouthernCalifornia Children’s Health Study (Peters et al., 1999). The Children’s Health Study isa 10-year study of the long-term effects of exposure to air pollution in children, organizedby researchers at the University of Southern California (USC) under the support of theCalifornia Air Resources Board. The concentrations of major pollutants are monitoredand the respiratory health of more than 5,600 children is followed. Ongoing research bypersonnel at USC involves analysis of data on PM10 and fine particle (PM2:5) mass, nitrate,sulfate, and ammonium ion concentrations, as well as gas-phase ozone, nitrogen dioxide,formic acid, acetic acid, and nitric acid.
At Caltech, we previously reported results from the chemical analysis of particulateorganic carbon (OC) and elemental carbon (EC) samples takenat twelve air monitoringsites in the southern half of the state of California over the5-year period 1994-1998(Salmon et al., 2001). Samples for the Children’s Health Study continue to be collectedover consecutive two week averaging times, with analysis for gravimetric fine particlemass and chemical analysis for ionic species being performed by Los Amigos Research andEducation Institute (LAREI). Sample collection will end inJune, 2004 marking completionof the 10 year study. This report presents the particulate organic carbon (OC) and elementalcarbon (EC) concentrations measured during the intermediate three years of this monitoringprogram (1999-2001).
During the 1999-2001 period, samples were collected in 12 locations throughoutSouthern California (Alpine, Atascadero, Glendora, Lake Arrowhead, Lake Elsinore,Lancaster, Lompoc, Long Beach, Mira Loma, Riverside, SantaMaria, and Upland), asshown in Figure 1. Sampling at the original San Dimas site wasdiscontinued in 1996 andreplaced with the near by Glendora site. These sites were selected to represent exposureextremes for one or more pollutants and to cover a large enough geographical area and along enough time period to document spatial and temporal variations. Among the sitesare mountain (Alpine, Lake Arrowhead), desert (Lancaster), and other rural locations(Lompoc, Santa Maria, Atascadero).
Epidemiological studies have found an association betweenhuman health effects andfine particle concentrations (Dockery et al., 1993; Pope et al., 1995ab; Guaderman etal., 2002). A large fraction of the fine particulate mass in the atmosphere is made up oforganic and elemental carbon particles (Gray et al., 1986; Solomon et al., 1988; Hanniganet al., 1996; Kaplan and Gordon, 1994; Christoforou et al., 2000) and particular organiccompounds have been identified as a possible health hazard; for example, PAHs have beenshown to be carcinogenic in animals (Seinfeld and Pandis, 1998). Airborne carbon particlesalso lead to reduced visibility via the process of light scattering and absorption (Larson etal., 1989).
Fine particle elemental carbon (EC), also referred to as black carbon, is only producedin combustion processes. Particulate organic carbon (OC) is emitted directly fromcombustion processes, from industrial processes, and fromfugitive area-wide sources; OCalso can be formed by atmospheric chemical reactions (secondary formation). Atmospheric
1
-122˚
-122˚
-120˚
-120˚
-118˚
-118˚
-116˚
-116˚
32˚ 32˚
34˚ 34˚
36˚ 36˚
-122˚
-122˚
-120˚
-120˚
-118˚
-118˚
-116˚
-116˚
32˚ 32˚
34˚ 34˚
36˚ 36˚
Long Beach
Lancaster
San DimasUpland
GlendoraMira Loma
Riverside
Atascadero
Alpine
Lake Arrowhead
Lake Elsinore
Lompoc
Santa Maria
-122˚
-122˚
-120˚
-120˚
-118˚
-118˚
-116˚
-116˚
32˚ 32˚
34˚ 34˚
36˚ 36˚
Figure 1: Southern California Children’s Health Study ambient air quality monitoring sites.
2
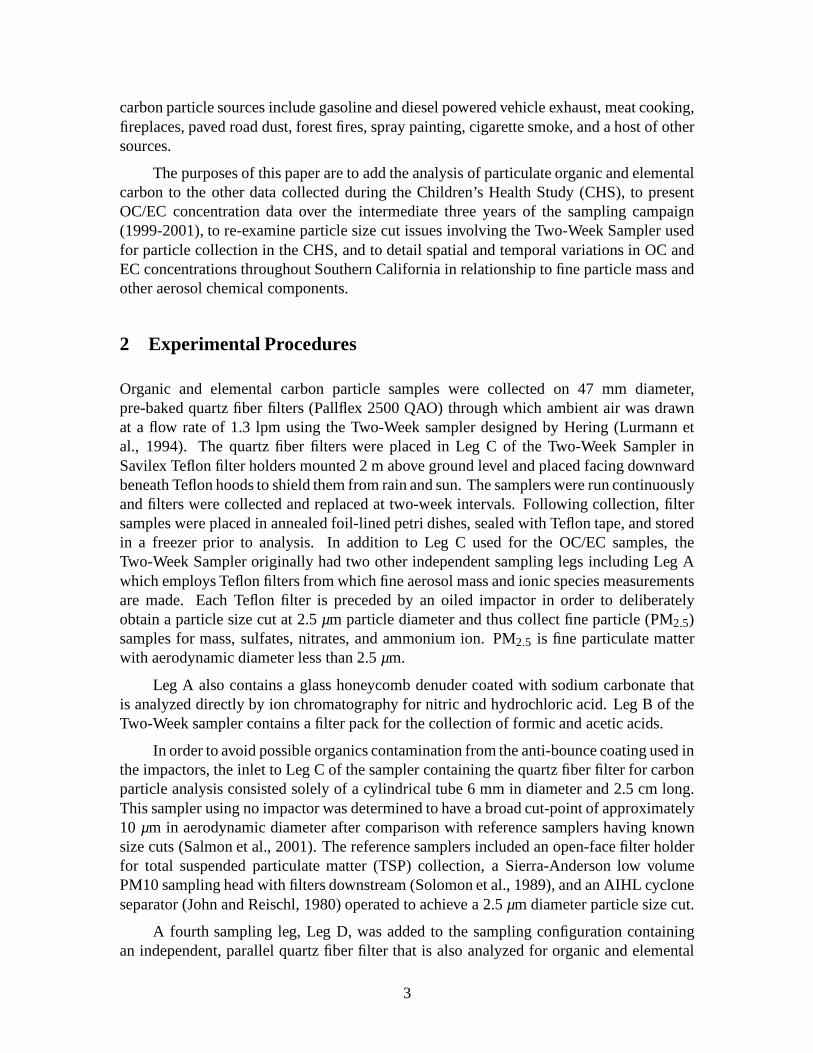
carbon particle sources include gasoline and diesel powered vehicle exhaust, meat cooking,fireplaces, paved road dust, forest fires, spray painting, cigarette smoke, and a host of othersources.
The purposes of this paper are to add the analysis of particulate organic and elementalcarbon to the other data collected during the Children’s Health Study (CHS), to presentOC/EC concentration data over the intermediate three yearsof the sampling campaign(1999-2001), to re-examine particle size cut issues involving the Two-Week Sampler usedfor particle collection in the CHS, and to detail spatial andtemporal variations in OC andEC concentrations throughout Southern California in relationship to fine particle mass andother aerosol chemical components.
2 Experimental Procedures
Organic and elemental carbon particle samples were collected on 47 mm diameter,pre-baked quartz fiber filters (Pallflex 2500 QAO) through which ambient air was drawnat a flow rate of 1.3 lpm using the Two-Week sampler designed byHering (Lurmann etal., 1994). The quartz fiber filters were placed in Leg C of the Two-Week Sampler inSavilex Teflon filter holders mounted 2 m above ground level and placed facing downwardbeneath Teflon hoods to shield them from rain and sun. The samplers were run continuouslyand filters were collected and replaced at two-week intervals. Following collection, filtersamples were placed in annealed foil-lined petri dishes, sealed with Teflon tape, and storedin a freezer prior to analysis. In addition to Leg C used for the OC/EC samples, theTwo-Week Sampler originally had two other independent sampling legs including Leg Awhich employs Teflon filters from which fine aerosol mass and ionic species measurementsare made. Each Teflon filter is preceded by an oiled impactor inorder to deliberatelyobtain a particle size cut at 2.5µm particle diameter and thus collect fine particle (PM2:5)samples for mass, sulfates, nitrates, and ammonium ion. PM2:5 is fine particulate matterwith aerodynamic diameter less than 2.5µm.
Leg A also contains a glass honeycomb denuder coated with sodium carbonate thatis analyzed directly by ion chromatography for nitric and hydrochloric acid. Leg B of theTwo-Week sampler contains a filter pack for the collection offormic and acetic acids.
In order to avoid possible organics contamination from the anti-bounce coating used inthe impactors, the inlet to Leg C of the sampler containing the quartz fiber filter for carbonparticle analysis consisted solely of a cylindrical tube 6 mm in diameter and 2.5 cm long.This sampler using no impactor was determined to have a broadcut-point of approximately10 µm in aerodynamic diameter after comparison with reference samplers having knownsize cuts (Salmon et al., 2001). The reference samplers included an open-face filter holderfor total suspended particulate matter (TSP) collection, aSierra-Anderson low volumePM10 sampling head with filters downstream (Solomon et al., 1989), and an AIHL cycloneseparator (John and Reischl, 1980) operated to achieve a 2.5µm diameter particle size cut.
A fourth sampling leg, Leg D, was added to the sampling configuration containingan independent, parallel quartz fiber filter that is also analyzed for organic and elemental
3
carbon. The sampling cassette in Leg D is installed after an oiled impactor that produces asharp cut-point of 2:2 µm in aerodynamic diameter (Sioutas, et al., 1999). Blank tests wereused to verify that organics contamination were minimal (Taylor, 2001). Leg C remainsin the same configuration in use since the inception of the study. The impactor-equippedcassette in Leg D has been in use alongside the non-impactor-equipped cassette in LegC since mid-September, 2000. The results from both cassettes are compared and usedto estimate the fine particle fraction of the carbon analyzedfrom portions of the studyemploying only the PM10 equivalent samples obtained from Leg C.
Quartz fiber filters are analyzed for OC and EC content by the thermal evolutionand combustion technique of Birch and Cary (1996). In this thermal-optical organic andelemental carbon concentration measurement method, 1.5 cm2 rectangular filter punchesare first placed in a temperature and atmosphere-controlledoven. The analysis processoccurs in two stages. In the first stage, the temperature is raised progressively toapproximately 850oC in a pure helium atmosphere in order to volatilize organic carbonfrom the sample. The volatilized carbon is oxidized catalytically to CO2, which is thenreduced to CH4. The CH4 is then quantified using a flame ionization detector (FID). Duringthis process, the filter may darken somewhat due to production of artifact EC by pyrolysis.Elemental carbon measurement and correction for any artifact EC formed by pyrolysisduring OC analysis are accomplished during stage two. At thebeginning of this secondstage of analysis, the oven temperature is initially reduced, a 4% oxygen, 96% heliummixture is introduced, and the temperature is then raised progressively to approximately900oC. As the black elemental carbon is oxidized and CO2 is evolved, there is an increasein filter transmittance. In order to correct for any contribution to the elemental carbonpresent due to OC pyrolysis during stage 1 of the analysis, the amount of EC oxidationnecessary to return the filter to its initial transmittance is first measured. The point at whichthe filter transmittance equals its initial value is taken tobe the point at which the actual ECbegins to evolve from the sample. Any EC oxidized prior to that point is assumed to be dueto OC pyrolysis earlier in the analysis and thus is added to the OC concentration measuredin the first step of this analysis.
This analysis method is known as the NIOSH (National Institute of OccupationalSafety and Health) protocol and has been employed by our group for nearly 20years. A second protocol, the IMPROVE (Interagency Monitoring of Protected VisualEnvironments) protocol is also used for carbon measurements. The analysis method inthe IMPROVE protocol is the same as that described above, however, the EC fraction iscalculated by allocating part of the OC evolving at 850oC to EC rather than OC. Thisresults in EC values approximately twice as large when the IMPROVE protocol is used.The protocols are equivalent for total carbon, however. Fora detailed comparison of thetwo protocols see Chow et al., (2001).
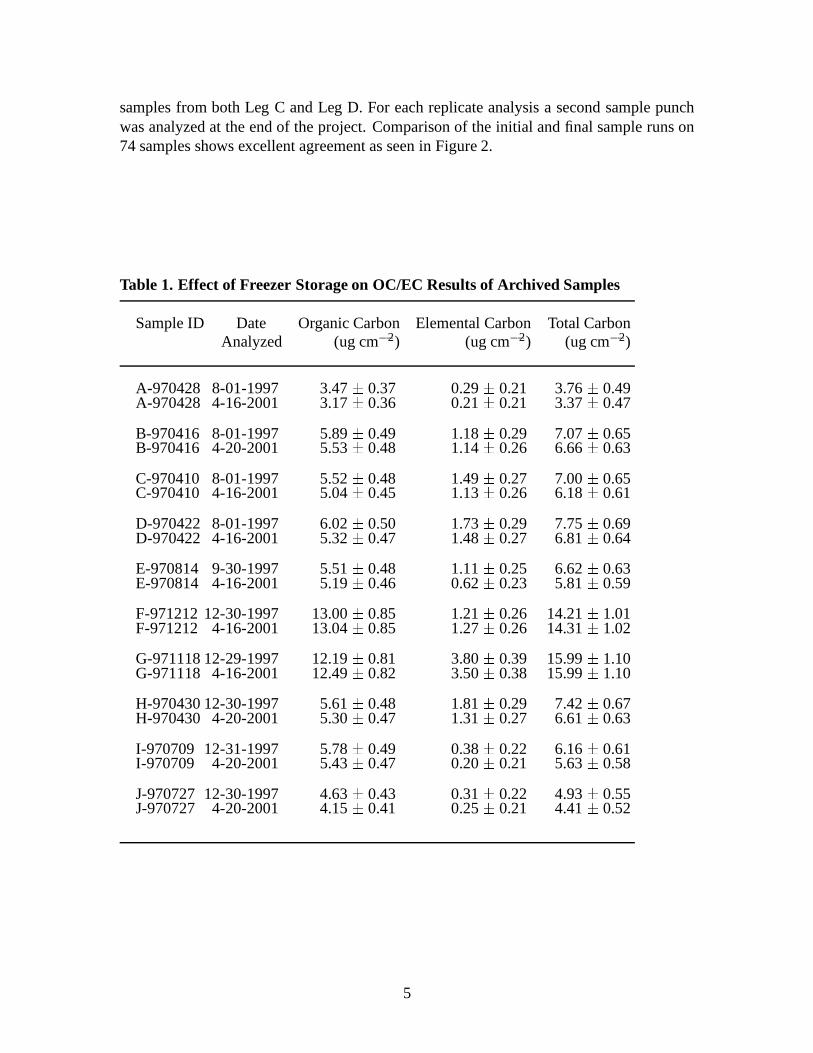
The effect of long freezer storage time on OC/EC results has been investigated by ourlaboratory. Samples originally analyzed in 1997 have been stored frozen and new puncheswere analyzed in 2001 for signs of sample degradation. As seen in Table 1, the differencesover time are well below the calculated error bars.
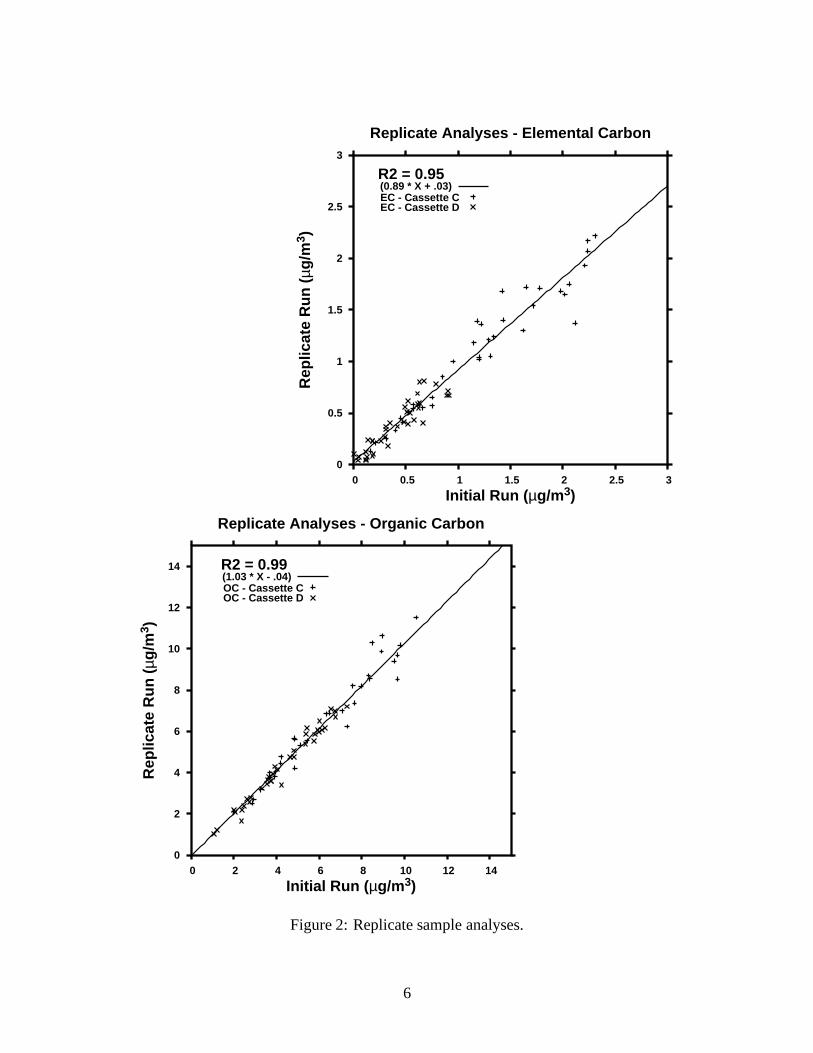
Replicate analyses were also performed on a number of samples from each site for
4
samples from both Leg C and Leg D. For each replicate analysisa second sample punchwas analyzed at the end of the project. Comparison of the initial and final sample runs on74 samples shows excellent agreement as seen in Figure 2.
Table 1. Effect of Freezer Storage on OC/EC Results of Archived Samples
Sample ID Date Organic Carbon Elemental Carbon Total CarbonAnalyzed (ug cm�2) (ug cm�2) (ug cm�2)
A-970428 8-01-1997 3.47� 0.37 0.29� 0.21 3.76� 0.49A-970428 4-16-2001 3.17� 0.36 0.21� 0.21 3.37� 0.47
B-970416 8-01-1997 5.89� 0.49 1.18� 0.29 7.07� 0.65B-970416 4-20-2001 5.53� 0.48 1.14� 0.26 6.66� 0.63
C-970410 8-01-1997 5.52� 0.48 1.49� 0.27 7.00� 0.65C-970410 4-16-2001 5.04� 0.45 1.13� 0.26 6.18� 0.61
D-970422 8-01-1997 6.02� 0.50 1.73� 0.29 7.75� 0.69D-970422 4-16-2001 5.32� 0.47 1.48� 0.27 6.81� 0.64
E-970814 9-30-1997 5.51� 0.48 1.11� 0.25 6.62� 0.63E-970814 4-16-2001 5.19� 0.46 0.62� 0.23 5.81� 0.59
F-971212 12-30-1997 13.00� 0.85 1.21� 0.26 14.21� 1.01F-971212 4-16-2001 13.04� 0.85 1.27� 0.26 14.31� 1.02
G-971118 12-29-1997 12.19� 0.81 3.80� 0.39 15.99� 1.10G-971118 4-16-2001 12.49� 0.82 3.50� 0.38 15.99� 1.10
H-970430 12-30-1997 5.61� 0.48 1.81� 0.29 7.42� 0.67H-970430 4-20-2001 5.30� 0.47 1.31� 0.27 6.61� 0.63
I-970709 12-31-1997 5.78� 0.49 0.38� 0.22 6.16� 0.61I-970709 4-20-2001 5.43� 0.47 0.20� 0.21 5.63� 0.58
J-970727 12-30-1997 4.63� 0.43 0.31� 0.22 4.93� 0.55J-970727 4-20-2001 4.15� 0.41 0.25� 0.21 4.41� 0.52
5
0
2
4
6
8
10
12
14
0 2 4 6 8 10 12 14
Rep
licat
e R
un
(µg
/m3 )
Initial Run (µg/m3)
Replicate Analyses - Organic Carbon
R2 = 0.99(1.03 * X - .04)OC - Cassette COC - Cassette D
0
0.5
1
1.5
2
2.5
3
0 0.5 1 1.5 2 2.5 3
Rep
licat
e R
un
(µg
/m3 )
Initial Run (µg/m3)
Replicate Analyses - Elemental Carbon
R2 = 0.95(0.89 * X + .03)EC - Cassette CEC - Cassette D
Figure 2: Replicate sample analyses.
6
3 Results and Discussion
3.1 Leg C PM10 OC/EC concentration data during 1999-2001
Annual average PM10 elemental carbon particle concentrations for the years 1999-2001across the Children’s Health Study monitoring network ranged from 0:11 µg m�3 to 1.56µg m�3, as shown in Table 2. The lowest average EC concentrations for each year continuedto be found at the rural, coastal Lompoc site. Since 1996, thehighest EC concentrationswere found inland at Mira Loma. During the initial two years of the study, 1994-1995,higher EC concentrations were found at Long Beach, which is close to the heavy industryand traffic in the Los Angeles/Long Beach harbor area. The data showed a decline in ECconcentrations from 1994 to 1998 consistent with newer diesel engines and improved dieselfuels being introduced into the vehicle fleet. However, EC concentrations for 1999-2001have shown a gradual increase in EC concentrations and at most sites, 2001 levels are equalor greater to what they had been in 1994.
Annual average PM10 organic carbon particle concentrations ranged from 1.73to 17.51 µg m�3 between stations in 1999-2001. The lowest annual average OCconcentrations were consistently found at Lompoc, while the highest annual averageconcentrations were found at Mira Loma. In general, both OC and EC concentrations werehighest at the Los Angeles Basin sites and lowest at the sitesin the outlying areas (San LuisObispo, Santa Barbara, and San Diego Counties), the mountain site at Lake Arrowhead,and the desert site at Lancaster. There are also decreasing elemental carbon to total carbon(TC = EC + OC) ratios moving from west to east across the Los Angeles Basin. Thiscan be attributed to the fact that as an airmass moves across the basin the organic fractioncan be enhanced by the formation of secondary organic aerosol as a result of condensationfrom the gas phase. Elemental carbon, conversely, is introduced to the atmosphere solelyvia the direct or primary emission of particles. There were lower OC annual averageconcentrations with time over the 1994 through 1998 period,but OC concentrations atall sites increased in 1999 (see Figure 3). While concentrations have dropped a little from1999 through 2001, annual average concentrations at the endof 2001 remain higher thanin 1998, which had the lowest OC concentrations of the years studied possibly due tomilder weather with lower mean temperatures that year. Warmer temperatures returned toSouthern California during 1999-2001 and with higher temperatures and bright sunlightcomes photochemical smog. Organic compounds are one of the main primary pollutantsfound in photochemical smog.
Figures 4 through 6 show the time series of bi-weekly measurements of elementalcarbon over the period 1994-2001. Each data point on these plots represents a two-weeksampling period. Gaps in the data indicate sampling periodsduring which OC/EC sampleswere labeled as invalid by the station operators; in many cases this designation signifiedthat the duration of sampling was insufficient (due to a powerfailure for example).
EC typifies direct particle emissions from primary sources and is strongly influencedby diesel engine exhaust in Southern California (Cass and Gray, 1995; Schauer et al., 1996,Gray and Cass, 1998). Elemental carbon concentrations typically show a strong seasonal
7
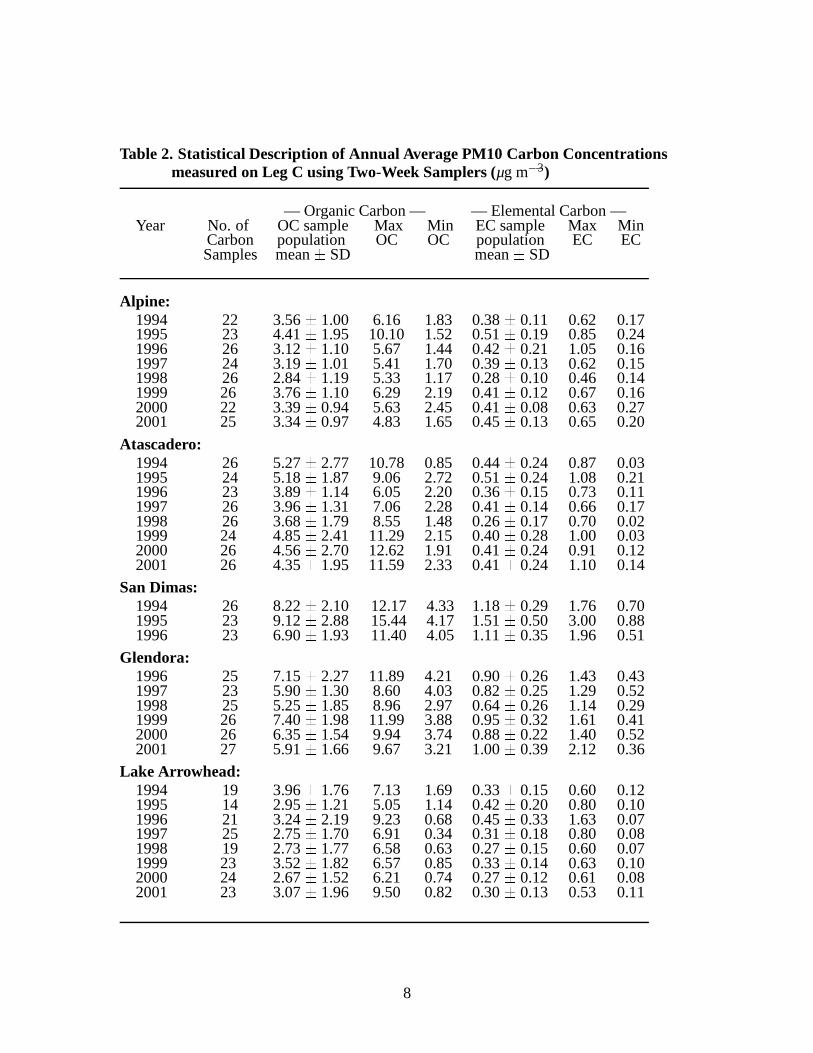
Table 2. Statistical Description of Annual Average PM10 Carbon Concentrationsmeasured on Leg C using Two-Week Samplers (µg m�3)
— Organic Carbon — — Elemental Carbon —Year No. of OC sample Max Min EC sample Max Min
Carbon population OC OC population EC ECSamples mean� SD mean� SD
Alpine:1994 22 3.56� 1.00 6.16 1.83 0.38� 0.11 0.62 0.171995 23 4.41� 1.95 10.10 1.52 0.51� 0.19 0.85 0.241996 26 3.12� 1.10 5.67 1.44 0.42� 0.21 1.05 0.161997 24 3.19� 1.01 5.41 1.70 0.39� 0.13 0.62 0.151998 26 2.84� 1.19 5.33 1.17 0.28� 0.10 0.46 0.141999 26 3.76� 1.10 6.29 2.19 0.41� 0.12 0.67 0.162000 22 3.39� 0.94 5.63 2.45 0.41� 0.08 0.63 0.272001 25 3.34� 0.97 4.83 1.65 0.45� 0.13 0.65 0.20
Atascadero:1994 26 5.27� 2.77 10.78 0.85 0.44� 0.24 0.87 0.031995 24 5.18� 1.87 9.06 2.72 0.51� 0.24 1.08 0.211996 23 3.89� 1.14 6.05 2.20 0.36� 0.15 0.73 0.111997 26 3.96� 1.31 7.06 2.28 0.41� 0.14 0.66 0.171998 26 3.68� 1.79 8.55 1.48 0.26� 0.17 0.70 0.021999 24 4.85� 2.41 11.29 2.15 0.40� 0.28 1.00 0.032000 26 4.56� 2.70 12.62 1.91 0.41� 0.24 0.91 0.122001 26 4.35� 1.95 11.59 2.33 0.41� 0.24 1.10 0.14
San Dimas:1994 26 8.22� 2.10 12.17 4.33 1.18� 0.29 1.76 0.701995 23 9.12� 2.88 15.44 4.17 1.51� 0.50 3.00 0.881996 23 6.90� 1.93 11.40 4.05 1.11� 0.35 1.96 0.51
Glendora:1996 25 7.15� 2.27 11.89 4.21 0.90� 0.26 1.43 0.431997 23 5.90� 1.30 8.60 4.03 0.82� 0.25 1.29 0.521998 25 5.25� 1.85 8.96 2.97 0.64� 0.26 1.14 0.291999 26 7.40� 1.98 11.99 3.88 0.95� 0.32 1.61 0.412000 26 6.35� 1.54 9.94 3.74 0.88� 0.22 1.40 0.522001 27 5.91� 1.66 9.67 3.21 1.00� 0.39 2.12 0.36
Lake Arrowhead:1994 19 3.96� 1.76 7.13 1.69 0.33� 0.15 0.60 0.121995 14 2.95� 1.21 5.05 1.14 0.42� 0.20 0.80 0.101996 21 3.24� 2.19 9.23 0.68 0.45� 0.33 1.63 0.071997 25 2.75� 1.70 6.91 0.34 0.31� 0.18 0.80 0.081998 19 2.73� 1.77 6.58 0.63 0.27� 0.15 0.60 0.071999 23 3.52� 1.82 6.57 0.85 0.33� 0.14 0.63 0.102000 24 2.67� 1.52 6.21 0.74 0.27� 0.12 0.61 0.082001 23 3.07� 1.96 9.50 0.82 0.30� 0.13 0.53 0.11
8
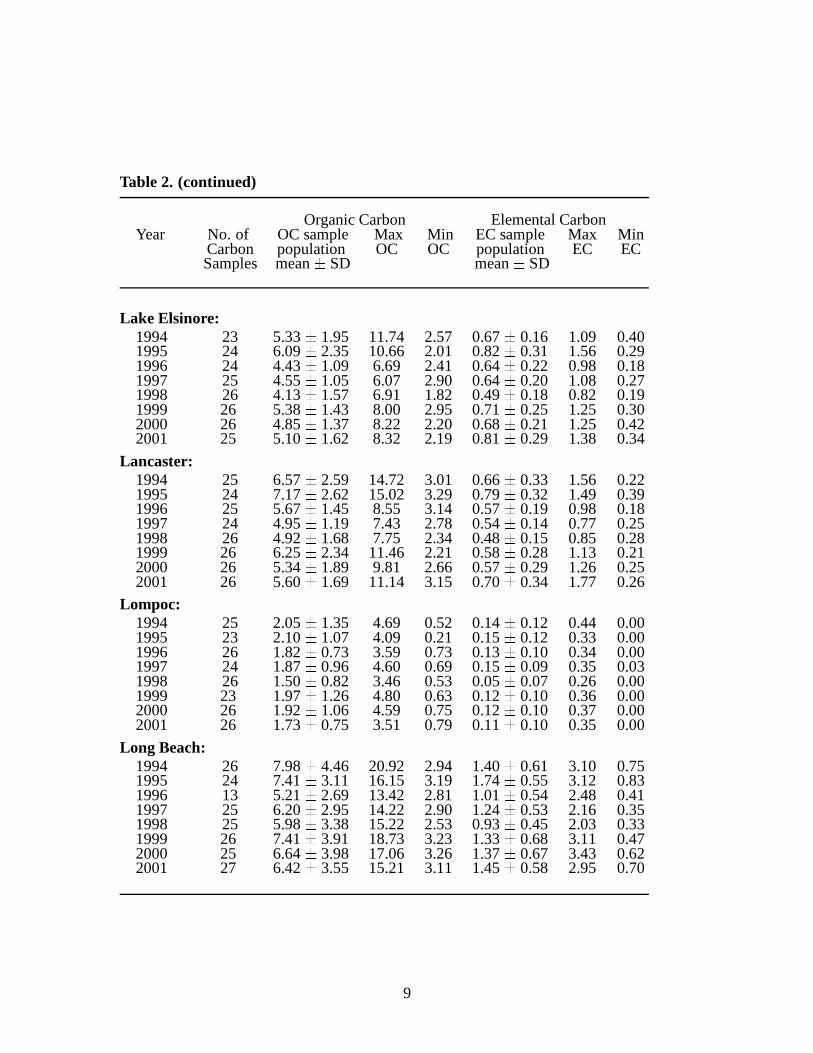
Table 2. (continued)
Organic Carbon Elemental CarbonYear No. of OC sample Max Min EC sample Max Min
Carbon population OC OC population EC ECSamples mean� SD mean� SD
Lake Elsinore:1994 23 5.33� 1.95 11.74 2.57 0.67� 0.16 1.09 0.401995 24 6.09� 2.35 10.66 2.01 0.82� 0.31 1.56 0.291996 24 4.43� 1.09 6.69 2.41 0.64� 0.22 0.98 0.181997 25 4.55� 1.05 6.07 2.90 0.64� 0.20 1.08 0.271998 26 4.13� 1.57 6.91 1.82 0.49� 0.18 0.82 0.191999 26 5.38� 1.43 8.00 2.95 0.71� 0.25 1.25 0.302000 26 4.85� 1.37 8.22 2.20 0.68� 0.21 1.25 0.422001 25 5.10� 1.62 8.32 2.19 0.81� 0.29 1.38 0.34
Lancaster:1994 25 6.57� 2.59 14.72 3.01 0.66� 0.33 1.56 0.221995 24 7.17� 2.62 15.02 3.29 0.79� 0.32 1.49 0.391996 25 5.67� 1.45 8.55 3.14 0.57� 0.19 0.98 0.181997 24 4.95� 1.19 7.43 2.78 0.54� 0.14 0.77 0.251998 26 4.92� 1.68 7.75 2.34 0.48� 0.15 0.85 0.281999 26 6.25� 2.34 11.46 2.21 0.58� 0.28 1.13 0.212000 26 5.34� 1.89 9.81 2.66 0.57� 0.29 1.26 0.252001 26 5.60� 1.69 11.14 3.15 0.70� 0.34 1.77 0.26
Lompoc:1994 25 2.05� 1.35 4.69 0.52 0.14� 0.12 0.44 0.001995 23 2.10� 1.07 4.09 0.21 0.15� 0.12 0.33 0.001996 26 1.82� 0.73 3.59 0.73 0.13� 0.10 0.34 0.001997 24 1.87� 0.96 4.60 0.69 0.15� 0.09 0.35 0.031998 26 1.50� 0.82 3.46 0.53 0.05� 0.07 0.26 0.001999 23 1.97� 1.26 4.80 0.63 0.12� 0.10 0.36 0.002000 26 1.92� 1.06 4.59 0.75 0.12� 0.10 0.37 0.002001 26 1.73� 0.75 3.51 0.79 0.11� 0.10 0.35 0.00
Long Beach:1994 26 7.98� 4.46 20.92 2.94 1.40� 0.61 3.10 0.751995 24 7.41� 3.11 16.15 3.19 1.74� 0.55 3.12 0.831996 13 5.21� 2.69 13.42 2.81 1.01� 0.54 2.48 0.411997 25 6.20� 2.95 14.22 2.90 1.24� 0.53 2.16 0.351998 25 5.98� 3.38 15.22 2.53 0.93� 0.45 2.03 0.331999 26 7.41� 3.91 18.73 3.23 1.33� 0.68 3.11 0.472000 25 6.64� 3.98 17.06 3.26 1.37� 0.67 3.43 0.622001 27 6.42� 3.55 15.21 3.11 1.45� 0.58 2.95 0.70
9
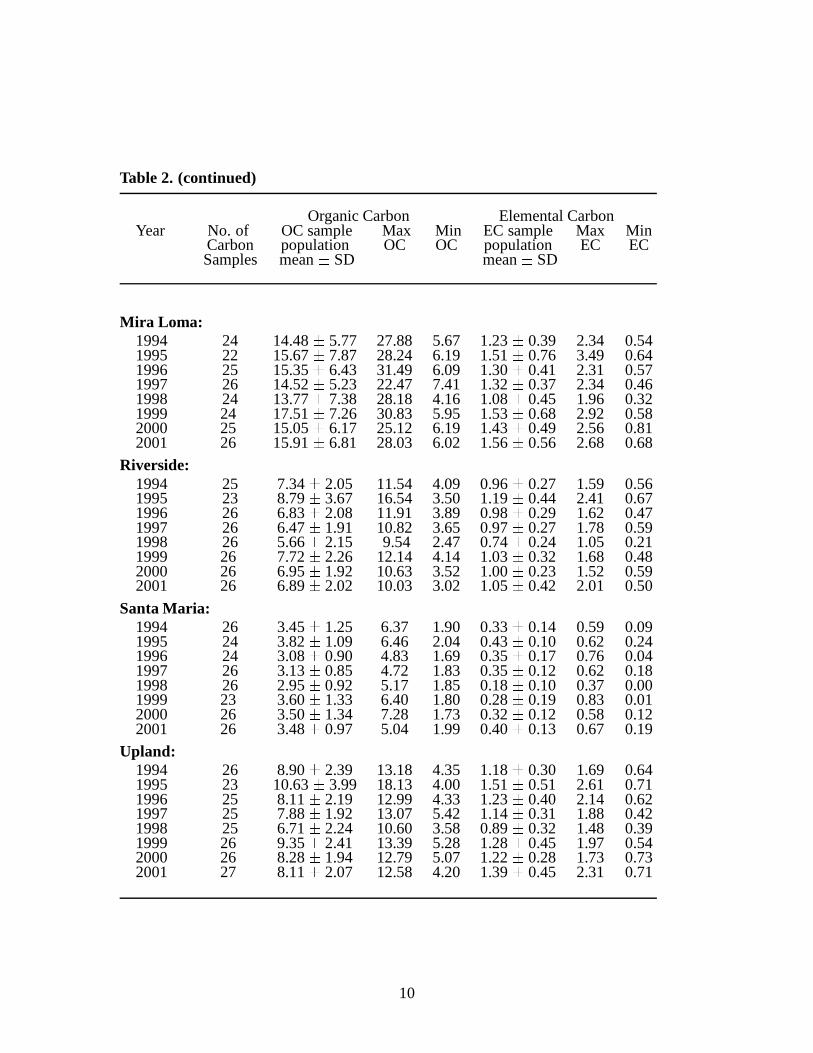
Table 2. (continued)
Organic Carbon Elemental CarbonYear No. of OC sample Max Min EC sample Max Min
Carbon population OC OC population EC ECSamples mean� SD mean� SD
Mira Loma:1994 24 14.48� 5.77 27.88 5.67 1.23� 0.39 2.34 0.541995 22 15.67� 7.87 28.24 6.19 1.51� 0.76 3.49 0.641996 25 15.35� 6.43 31.49 6.09 1.30� 0.41 2.31 0.571997 26 14.52� 5.23 22.47 7.41 1.32� 0.37 2.34 0.461998 24 13.77� 7.38 28.18 4.16 1.08� 0.45 1.96 0.321999 24 17.51� 7.26 30.83 5.95 1.53� 0.68 2.92 0.582000 25 15.05� 6.17 25.12 6.19 1.43� 0.49 2.56 0.812001 26 15.91� 6.81 28.03 6.02 1.56� 0.56 2.68 0.68
Riverside:1994 25 7.34� 2.05 11.54 4.09 0.96� 0.27 1.59 0.561995 23 8.79� 3.67 16.54 3.50 1.19� 0.44 2.41 0.671996 26 6.83� 2.08 11.91 3.89 0.98� 0.29 1.62 0.471997 26 6.47� 1.91 10.82 3.65 0.97� 0.27 1.78 0.591998 26 5.66� 2.15 9.54 2.47 0.74� 0.24 1.05 0.211999 26 7.72� 2.26 12.14 4.14 1.03� 0.32 1.68 0.482000 26 6.95� 1.92 10.63 3.52 1.00� 0.23 1.52 0.592001 26 6.89� 2.02 10.03 3.02 1.05� 0.42 2.01 0.50
Santa Maria:1994 26 3.45� 1.25 6.37 1.90 0.33� 0.14 0.59 0.091995 24 3.82� 1.09 6.46 2.04 0.43� 0.10 0.62 0.241996 24 3.08� 0.90 4.83 1.69 0.35� 0.17 0.76 0.041997 26 3.13� 0.85 4.72 1.83 0.35� 0.12 0.62 0.181998 26 2.95� 0.92 5.17 1.85 0.18� 0.10 0.37 0.001999 23 3.60� 1.33 6.40 1.80 0.28� 0.19 0.83 0.012000 26 3.50� 1.34 7.28 1.73 0.32� 0.12 0.58 0.122001 26 3.48� 0.97 5.04 1.99 0.40� 0.13 0.67 0.19
Upland:1994 26 8.90� 2.39 13.18 4.35 1.18� 0.30 1.69 0.641995 23 10.63� 3.99 18.13 4.00 1.51� 0.51 2.61 0.711996 25 8.11� 2.19 12.99 4.33 1.23� 0.40 2.14 0.621997 25 7.88� 1.92 13.07 5.42 1.14� 0.31 1.88 0.421998 25 6.71� 2.24 10.60 3.58 0.89� 0.32 1.48 0.391999 26 9.35� 2.41 13.39 5.28 1.28� 0.45 1.97 0.542000 26 8.28� 1.94 12.79 5.07 1.22� 0.28 1.73 0.732001 27 8.11� 2.07 12.58 4.20 1.39� 0.45 2.31 0.71
10
PM
10 O
RG
AN
IC C
AR
BO
N C
ON
CE
NT
RA
TIO
Nµg
m-3
9495
9697
9899
0001
02
4
6
8 Lancaster
02
4
6
8 Lake Elsinore
02
4 Lake Arrowhead02
4
6
8
10
12
14
16
Mira Loma
02
4
6
8Atascadero
02
4
6
8Alpine
9495
9697
9899
0001
02
4
6
8 Glendora
02
4
6
8
Riverside
02
4
6
8
Santa Maria
02
4
6
8
10 Upland
02
4
6
8
10Long Beach
02
4
6
8
Lompoc
Figure 3: Annual average PM10 organic carbon, 1994-2001.
11
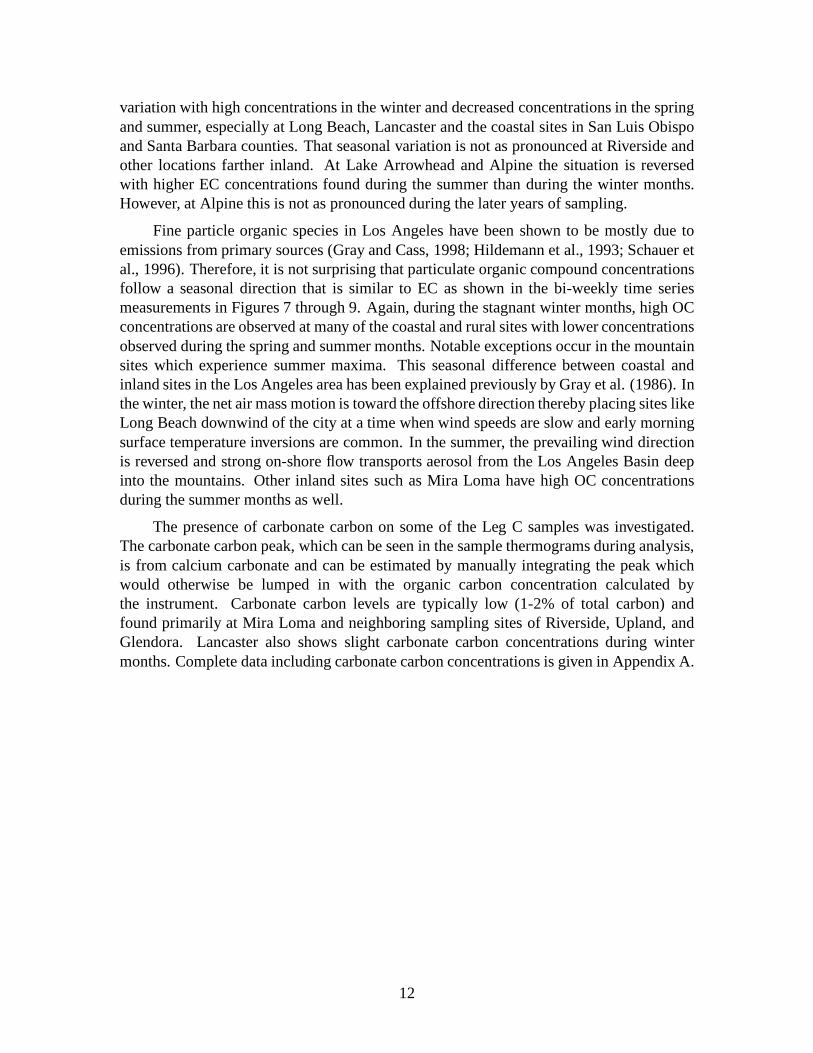
variation with high concentrations in the winter and decreased concentrations in the springand summer, especially at Long Beach, Lancaster and the coastal sites in San Luis Obispoand Santa Barbara counties. That seasonal variation is not as pronounced at Riverside andother locations farther inland. At Lake Arrowhead and Alpine the situation is reversedwith higher EC concentrations found during the summer than during the winter months.However, at Alpine this is not as pronounced during the lateryears of sampling.
Fine particle organic species in Los Angeles have been shownto be mostly due toemissions from primary sources (Gray and Cass, 1998; Hildemann et al., 1993; Schauer etal., 1996). Therefore, it is not surprising that particulate organic compound concentrationsfollow a seasonal direction that is similar to EC as shown in the bi-weekly time seriesmeasurements in Figures 7 through 9. Again, during the stagnant winter months, high OCconcentrations are observed at many of the coastal and ruralsites with lower concentrationsobserved during the spring and summer months. Notable exceptions occur in the mountainsites which experience summer maxima. This seasonal difference between coastal andinland sites in the Los Angeles area has been explained previously by Gray et al. (1986). Inthe winter, the net air mass motion is toward the offshore direction thereby placing sites likeLong Beach downwind of the city at a time when wind speeds are slow and early morningsurface temperature inversions are common. In the summer, the prevailing wind directionis reversed and strong on-shore flow transports aerosol fromthe Los Angeles Basin deepinto the mountains. Other inland sites such as Mira Loma havehigh OC concentrationsduring the summer months as well.
The presence of carbonate carbon on some of the Leg C samples was investigated.The carbonate carbon peak, which can be seen in the sample thermograms during analysis,is from calcium carbonate and can be estimated by manually integrating the peak whichwould otherwise be lumped in with the organic carbon concentration calculated bythe instrument. Carbonate carbon levels are typically low (1-2% of total carbon) andfound primarily at Mira Loma and neighboring sampling sitesof Riverside, Upland, andGlendora. Lancaster also shows slight carbonate carbon concentrations during wintermonths. Complete data including carbonate carbon concentrations is given in Appendix A.
12
0
0.5
1
1.5
2
2.5
3
3.5
1994 1995 1996 1997 1998 1999 2000 2001
Ele
men
tal C
arb
on
- P
M10
(µg
m-3
)
Mira Loma
0
0.5
1
1.5
2
2.5
3
3.5
1994 1995 1996 1997 1998 1999 2000 2001
Ele
men
tal C
arb
on
- P
M10
(µg
m-3
)
Upland
0
0.5
1
1.5
2
2.5
3
3.5
1994 1995 1996 1997 1998 1999 2000 2001
Ele
men
tal C
arb
on
- P
M10
(µg
m-3
)
Riverside
0
0.5
1
1.5
2
2.5
3
3.5
1994 1995 1996 1997 1998 1999 2000 2001
Ele
men
tal C
arb
on
- P
M10
(µg
m-3
)
Two week sampling periods
Glendora
Figure 4: Time series of 2-week average PM10 elemental carbon concentrations found inSouthern California at Mira Loma, Upland, Riverside and Glendora. (Glendora includesdata from the San Dimas site for 1994 and 1995.)
13
0
0.5
1
1.5
2
2.5
3
3.5
1994 1995 1996 1997 1998 1999 2000 2001
Ele
men
tal C
arb
on
- P
M10
(µg
m-3
)
Lake Arrowhead
0
0.5
1
1.5
2
2.5
3
3.5
1994 1995 1996 1997 1998 1999 2000 2001
Ele
men
tal C
arb
on
- P
M10
(µg
m-3
)
Lake Elsinore
0
0.5
1
1.5
2
2.5
3
3.5
1994 1995 1996 1997 1998 1999 2000 2001
Ele
men
tal C
arb
on
- P
M10
(µg
m-3
)
Lancaster
0
0.5
1
1.5
2
2.5
3
3.5
1994 1995 1996 1997 1998 1999 2000 2001
Ele
men
tal C
arb
on
- P
M10
(µg
m-3
)
Two week sampling periods
Long Beach
Figure 5: Time series of 2-week average PM10 elemental carbon concentrations found inSouthern California at Lake Arrowhead, Lake Elsinore, Lancaster, and Long Beach.
14
0
0.5
1
1.5
2
2.5
3
3.5
1994 1995 1996 1997 1998 1999 2000 2001
Ele
men
tal C
arb
on
- P
M10
(µg
m-3
)
Atascadero
0
0.5
1
1.5
2
2.5
3
3.5
1994 1995 1996 1997 1998 1999 2000 2001
Ele
men
tal C
arb
on
- P
M10
(µg
m-3
)
Lompoc
0
0.5
1
1.5
2
2.5
3
3.5
1994 1995 1996 1997 1998 1999 2000 2001
Ele
men
tal C
arb
on
- P
M10
(µg
m-3
)
Santa Maria
0
0.5
1
1.5
2
2.5
3
3.5
1994 1995 1996 1997 1998 1999 2000 2001
Ele
men
tal C
arb
on
- P
M10
(µg
m-3
)
Two week sampling periods
Alpine
Figure 6: Time series of 2-week average PM10 elemental carbon concentrations found inSouthern California at Atascadero, Lompoc, Santa Maria, and Alpine.
15
0
5
10
15
20
25
30
1994 1995 1996 1997 1998 1999 2000 2001
Org
anic
Car
bo
n -
PM
10 (
µg m
-3)
Mira Loma
0
5
10
15
20
25
30
1994 1995 1996 1997 1998 1999 2000 2001
Org
anic
Car
bo
n -
PM
10 (
µg m
-3)
Upland
0
5
10
15
20
25
30
1994 1995 1996 1997 1998 1999 2000 2001
Org
anic
Car
bo
n -
PM
10 (
µg m
-3)
Riverside
0
5
10
15
20
25
30
1994 1995 1996 1997 1998 1999 2000 2001
Org
anic
Car
bo
n -
PM
10 (
µg m
-3)
Two week sampling periods
Glendora
Figure 7: Time series of 2-week average PM10 organic carbon concentrations found inSouthern California at Mira Loma, Upland, Riverside, and Glendora. (Glendora includesdata from the San Dimas site for 1994 and 1995.)
16
0
5
10
15
20
25
30
1994 1995 1996 1997 1998 1999 2000 2001
Org
anic
Car
bo
n -
PM
10 (
µg m
-3)
Lake Arrowhead
0
5
10
15
20
25
30
1994 1995 1996 1997 1998 1999 2000 2001
Org
anic
Car
bo
n -
PM
10 (
µg m
-3)
Lake Elsinore
0
5
10
15
20
25
30
1994 1995 1996 1997 1998 1999 2000 2001
Org
anic
Car
bo
n -
PM
10 (
µg m
-3)
Lancaster
0
5
10
15
20
25
30
1994 1995 1996 1997 1998 1999 2000 2001
Org
anic
Car
bo
n -
PM
10 (
µg m
-3)
Two week sampling periods
Long Beach
Figure 8: Time series of 2-week average PM10 organic carbon concentrations found inSouthern California at Lake Arrowhead, Lake Elsinore, Lancaster, and Long Beach.
17
0
5
10
15
20
25
30
1994 1995 1996 1997 1998 1999 2000 2001
Org
anic
Car
bo
n -
PM
10 (
µg m
-3)
Atascadero
0
5
10
15
20
25
30
1994 1995 1996 1997 1998 1999 2000 2001
Org
anic
Car
bo
n -
PM
10 (
µg m
-3)
Lompoc
0
5
10
15
20
25
30
1994 1995 1996 1997 1998 1999 2000 2001
Org
anic
Car
bo
n -
PM
10 (
µg m
-3)
Santa Maria
0
5
10
15
20
25
30
1994 1995 1996 1997 1998 1999 2000 2001
Org
anic
Car
bo
n -
PM
10 (
µg m
-3)
Two week sampling periods
Alpine
Figure 9: Time series of 2-week average PM10 organic carbon concentrations found inSouthern California at Atascadero, Lompoc, Santa Maria, and Alpine.
18
3.2 Leg D PM2.2 OC/EC concentration data during 2000-2001
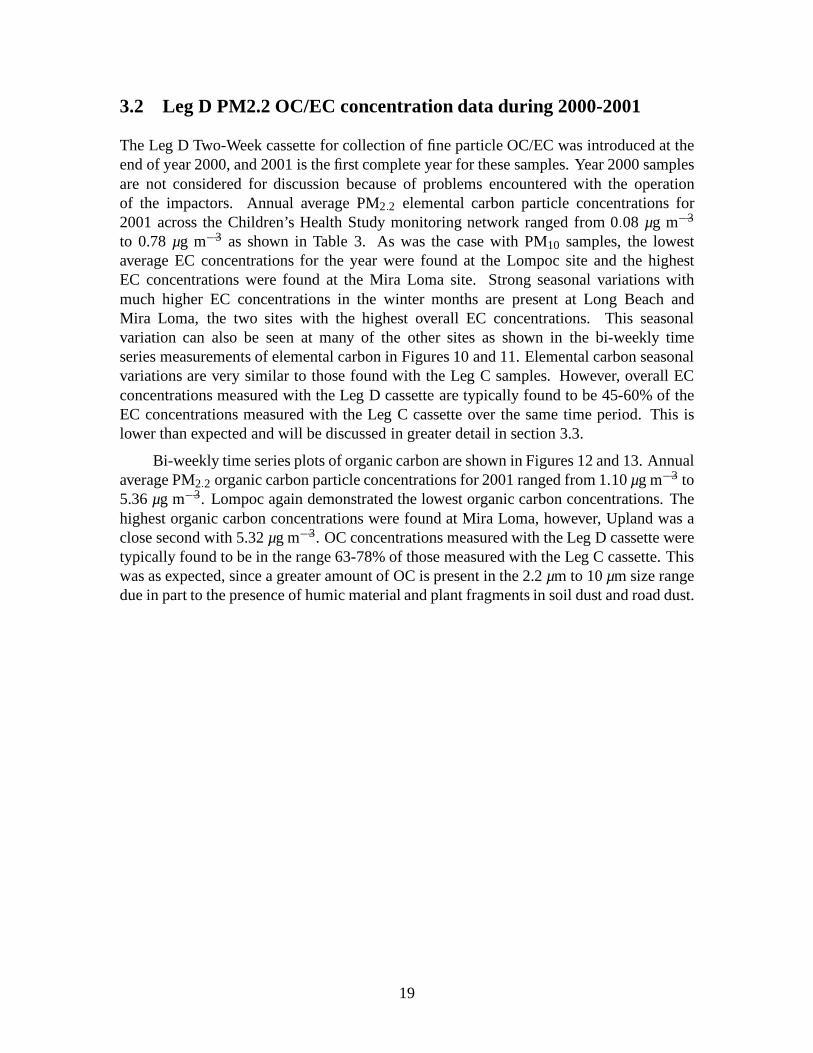
The Leg D Two-Week cassette for collection of fine particle OC/EC was introduced at theend of year 2000, and 2001 is the first complete year for these samples. Year 2000 samplesare not considered for discussion because of problems encountered with the operationof the impactors. Annual average PM2:2 elemental carbon particle concentrations for2001 across the Children’s Health Study monitoring networkranged from 0:08 µg m�3
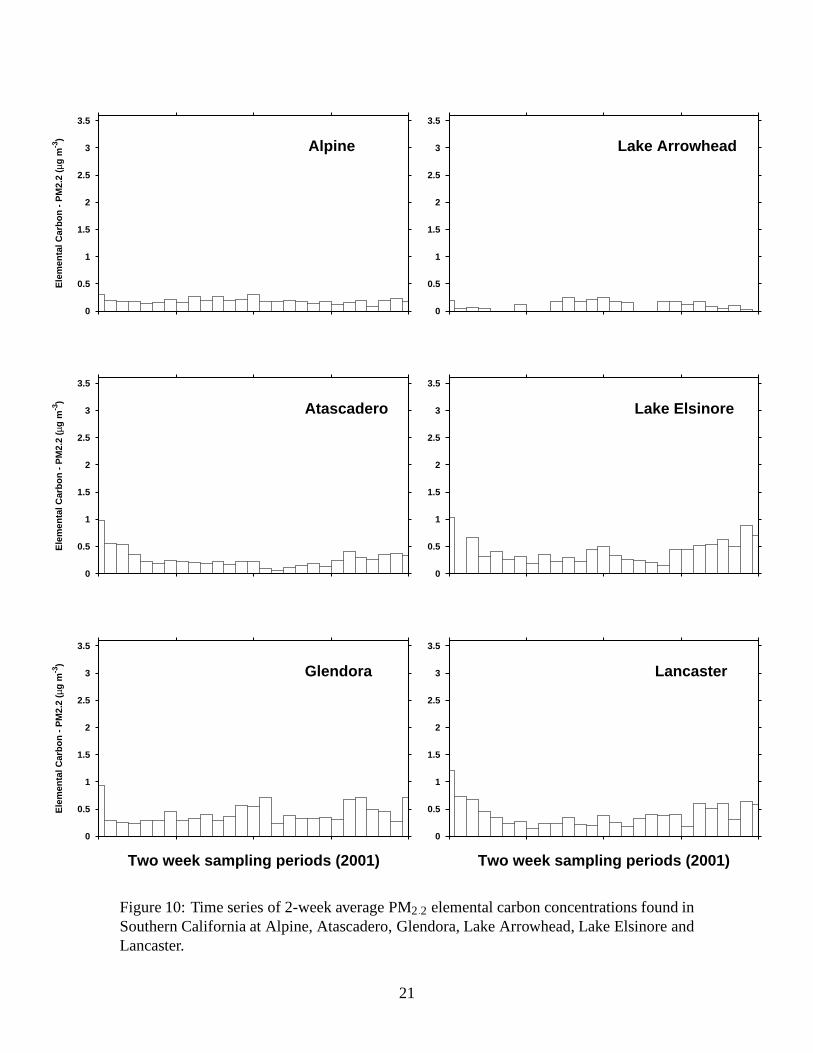
to 0.78µg m�3 as shown in Table 3. As was the case with PM10 samples, the lowestaverage EC concentrations for the year were found at the Lompoc site and the highestEC concentrations were found at the Mira Loma site. Strong seasonal variations withmuch higher EC concentrations in the winter months are present at Long Beach andMira Loma, the two sites with the highest overall EC concentrations. This seasonalvariation can also be seen at many of the other sites as shown in the bi-weekly timeseries measurements of elemental carbon in Figures 10 and 11. Elemental carbon seasonalvariations are very similar to those found with the Leg C samples. However, overall ECconcentrations measured with the Leg D cassette are typically found to be 45-60% of theEC concentrations measured with the Leg C cassette over the same time period. This islower than expected and will be discussed in greater detail in section 3.3.
Bi-weekly time series plots of organic carbon are shown in Figures 12 and 13. Annualaverage PM2:2 organic carbon particle concentrations for 2001 ranged from 1:10µg m�3 to5.36µg m�3. Lompoc again demonstrated the lowest organic carbon concentrations. Thehighest organic carbon concentrations were found at Mira Loma, however, Upland was aclose second with 5.32µg m�3. OC concentrations measured with the Leg D cassette weretypically found to be in the range 63-78% of those measured with the Leg C cassette. Thiswas as expected, since a greater amount of OC is present in the2.2µm to 10µm size rangedue in part to the presence of humic material and plant fragments in soil dust and road dust.
19
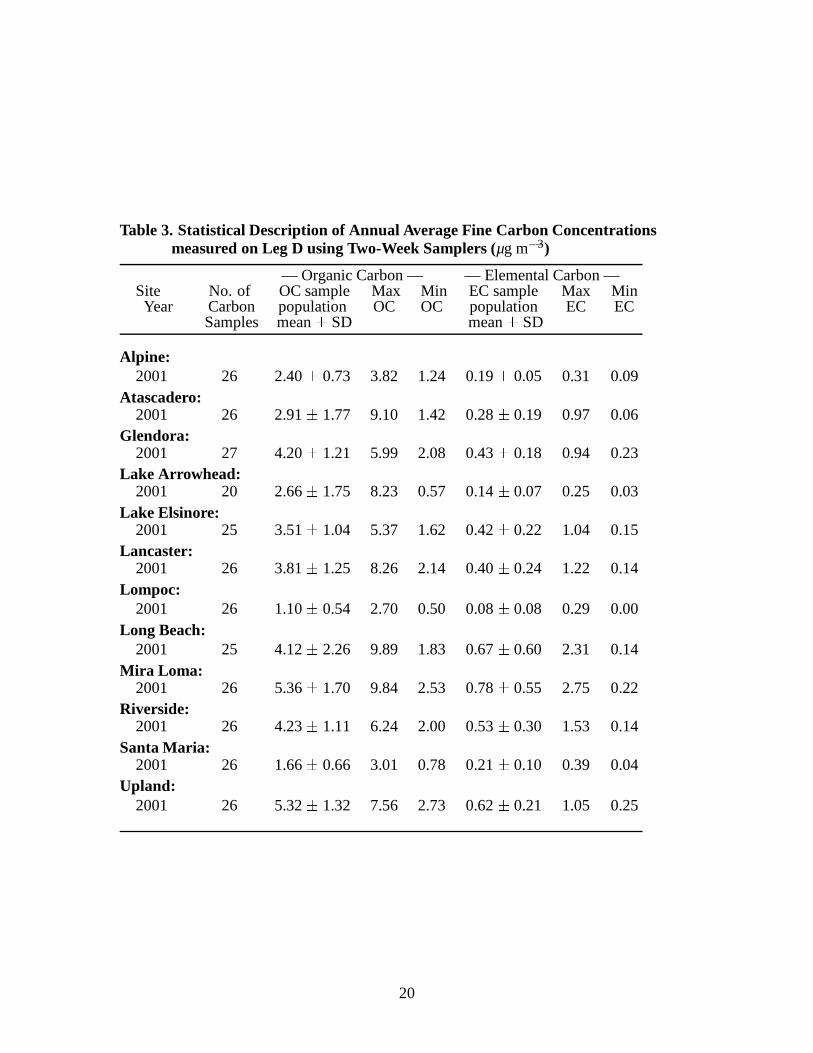
Table 3. Statistical Description of Annual Average Fine Carbon Concentrationsmeasured on Leg D using Two-Week Samplers (µg m�3)
— Organic Carbon — — Elemental Carbon —Site No. of OC sample Max Min EC sample Max MinYear Carbon population OC OC population EC EC
Samples mean� SD mean� SD
Alpine:2001 26 2.40� 0.73 3.82 1.24 0.19� 0.05 0.31 0.09
Atascadero:2001 26 2.91� 1.77 9.10 1.42 0.28� 0.19 0.97 0.06
Glendora:2001 27 4.20� 1.21 5.99 2.08 0.43� 0.18 0.94 0.23
Lake Arrowhead:2001 20 2.66� 1.75 8.23 0.57 0.14� 0.07 0.25 0.03
Lake Elsinore:2001 25 3.51� 1.04 5.37 1.62 0.42� 0.22 1.04 0.15
Lancaster:2001 26 3.81� 1.25 8.26 2.14 0.40� 0.24 1.22 0.14
Lompoc:2001 26 1.10� 0.54 2.70 0.50 0.08� 0.08 0.29 0.00
Long Beach:2001 25 4.12� 2.26 9.89 1.83 0.67� 0.60 2.31 0.14
Mira Loma:2001 26 5.36� 1.70 9.84 2.53 0.78� 0.55 2.75 0.22
Riverside:2001 26 4.23� 1.11 6.24 2.00 0.53� 0.30 1.53 0.14
Santa Maria:2001 26 1.66� 0.66 3.01 0.78 0.21� 0.10 0.39 0.04
Upland:2001 26 5.32� 1.32 7.56 2.73 0.62� 0.21 1.05 0.25
20
0
0.5
1
1.5
2
2.5
3
3.5
Ele
men
tal C
arb
on
- P
M2.
2 (µ
g m
-3)
Alpine
0
0.5
1
1.5
2
2.5
3
3.5
Ele
men
tal C
arb
on
- P
M2.
2 (µ
g m
-3)
Atascadero
0
0.5
1
1.5
2
2.5
3
3.5
Ele
men
tal C
arb
on
- P
M2.
2 (µ
g m
-3)
Two week sampling periods (2001)
Glendora
0
0.5
1
1.5
2
2.5
3
3.5
Lake Arrowhead
0
0.5
1
1.5
2
2.5
3
3.5
Lake Elsinore
0
0.5
1
1.5
2
2.5
3
3.5
Two week sampling periods (2001)
Lancaster
Figure 10: Time series of 2-week average PM2:2 elemental carbon concentrations found inSouthern California at Alpine, Atascadero, Glendora, LakeArrowhead, Lake Elsinore andLancaster.
21
0
0.5
1
1.5
2
2.5
3
3.5
Ele
men
tal C
arb
on
- P
M2.
2 (µ
g m
-3)
Lompoc
0
0.5
1
1.5
2
2.5
3
3.5
Ele
men
tal C
arb
on
- P
M2.
2 (µ
g m
-3)
Long Beach
0
0.5
1
1.5
2
2.5
3
3.5
Ele
men
tal C
arb
on
- P
M2.
2 (µ
g m
-3)
Two week sampling periods (2001)
Mira Loma
0
0.5
1
1.5
2
2.5
3
3.5
Riverside
0
0.5
1
1.5
2
2.5
3
3.5
Santa Maria
0
0.5
1
1.5
2
2.5
3
3.5
Two week sampling periods (2001)
Upland
Figure 11: Time series of 2-week average PM2:2 elemental carbon concentrations foundin Southern California at Lompoc, Long Beach, Mira Loma, Riverside, Santa Maria, andUpland.
22
0
2
4
6
8
10
12
14
Org
anic
Car
bo
n -
PM
2.2
(µg
m-3
)
Alpine
0
2
4
6
8
10
12
14
Org
anic
Car
bo
n -
PM
2.2
(µg
m-3
)
Atascadero
0
2
4
6
8
10
12
14
Org
anic
Car
bo
n -
PM
2.2
(µg
m-3
)
Two week sampling periods (2001)
Glendora
0
2
4
6
8
10
12
14
Lake Arrowhead
0
2
4
6
8
10
12
14
Lake Elsinore
0
2
4
6
8
10
12
14
Two week sampling periods (2001)
Lancaster
Figure 12: Time series of 2-week average PM2:2 organic carbon concentrations found inSouthern California at Alpine, Atascadero, Glendora, LakeArrowhead, Lake Elsinore andLancaster.
23
0
2
4
6
8
10
12
14
Org
anic
Car
bo
n -
PM
2.2
(µg
m-3
)
Lompoc
0
2
4
6
8
10
12
14
Org
anic
Car
bo
n -
PM
2.2
(µg
m-3
)
Long Beach
0
2
4
6
8
10
12
14
Org
anic
Car
bo
n -
PM
2.2
(µg
m-3
)
Two week sampling periods (2001)
Mira Loma
0
2
4
6
8
10
12
14
Riverside
0
2
4
6
8
10
12
14
Santa Maria
0
2
4
6
8
10
12
14
Two week sampling periods (2001)
Upland
Figure 13: Time series of 2-week average PM2:2 organic carbon concentrations found inSouthern California at Lompoc, Long Beach, Mira Loma, Riverside, Santa Maria, andUpland.
24
3.3 Leg C vs. Leg D comparison
The fine particle mass concentration, nitrate, sulfate, andammonium ion concentrationmeasurements available from the Children’s Health Study database were acquireddownstream of impactors having a 2.5 micron size cut. However, organic and elementalcarbon data with a similar size cut was not available until the introduction of the LegD cassettes near the end of year 2000. Therefore, to determine the contribution of fineparticle carbon species to the fine particulate matter and construct pie charts representingthe chemical composition of the fine material collected at the Children’s Health Studysampling sites on dates before the fine particle carbon data was available, the measuredPM10-equivalent OC and EC concentrations are adjusted to the extent possible to estimatea PM2:5 size cut (PM2:5 = particulate matter with aerodynamic diameter less than 2.5µm).It is assumed that the 2.2µm cut-point of Leg D is close enough to the 2.5µm cut-point ofthe Leg used to collect particles for mass and ion measurements for both to be consideredequivalent.
3.3.1 Organic carbon
In the previous report, the factor of 0.78 was used to convertthe data from the approximatePM10 size cut of the Leg C cassettes to an estimated PM2:5 fraction. This factor wasderived by collocating the CHS Two-Week sample holder with PM2:5, PM10, and TSPsamplers over a 10 week period at a single location in Pasadena, California. Clearly, therelative impact of coarse particles will vary significantlyacross sites and over time suchthat this would only be a good estimate for locations and times with similar coarse materialin the atmosphere. Since the addition of the Leg D PM2:2 cassettes in late 2000, we haveside-by-side data and can now use site specific factors to obtain a better correction factor toapply to the 1994-2000 Leg C data. Since only a little over a year’s worth of side-by-sidecomparison samples are currently available, it is too soon to examine seasonal effects onthe correction factor, but that is a logical next step once the year 2002-2004 samples areanalyzed at a future time.
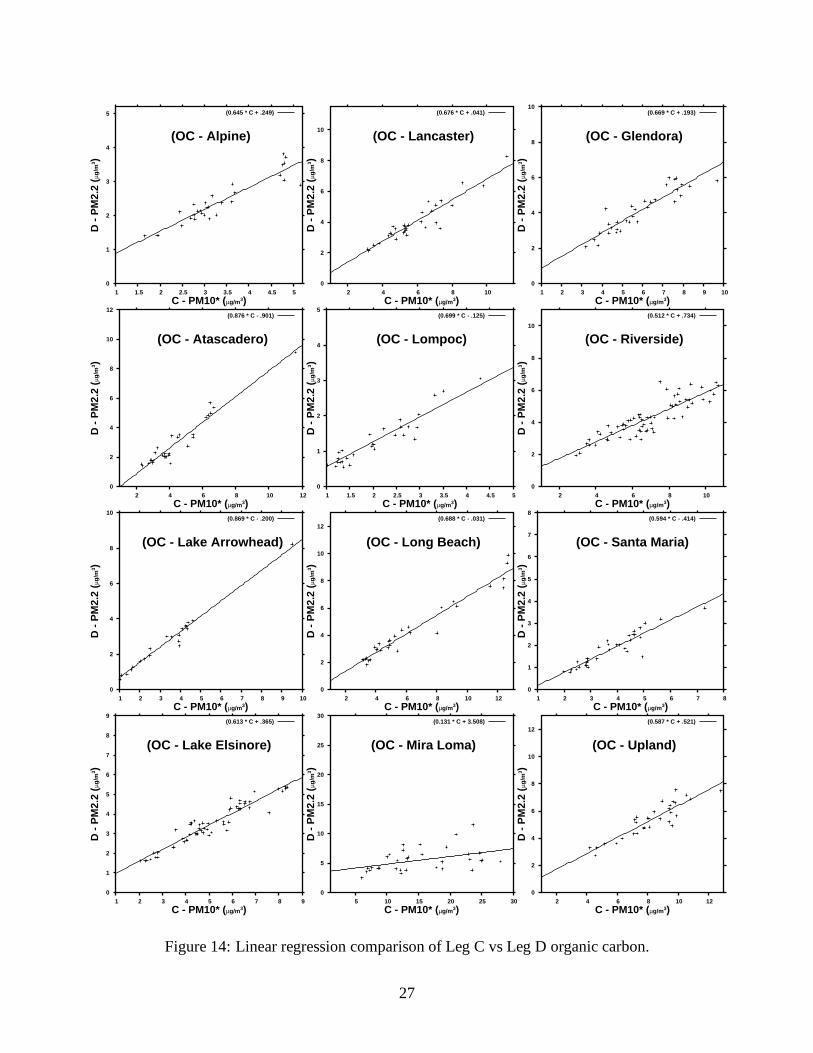
Linear regression analysis was performed on the organic carbon measured side-by-side on samples from Leg C and Leg D with Leg C as the independent variable.These results are given in Table 4 and presented graphicallyin Figure 14 for bettervisualization. Good correlations are found at all sites except Mira Loma which has muchhigher concentrations of organic carbon on the Leg C samplesthan on the Leg D samples.This is not an unusual result since the amount of resuspendedcrustal material (road dustand soil debris) will dominate the coarse particle carbon. It is also important to rememberthat the Leg C sample is really a TSP-like sample and can be impacted by bigger thanPM10 material. Sites that are impacted by a lot of crustal material will tend to have pooreragreement between the effective PM10 OC and PM2:2 OC. This would suggest that MiraLoma is impacted by crustal material more than the other sites based on a review of sitespecific OC data.
25
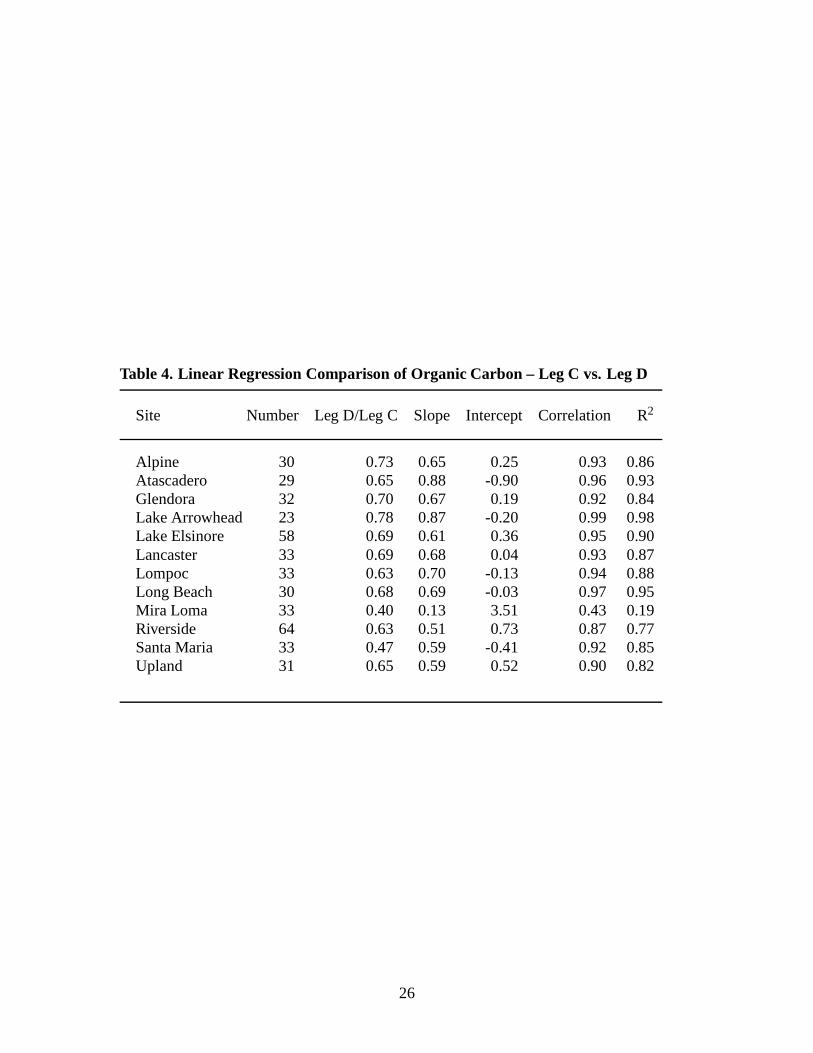
Table 4. Linear Regression Comparison of Organic Carbon – Leg C vs. Leg D
Site Number Leg D/Leg C Slope Intercept Correlation R2
Alpine 30 0.73 0.65 0.25 0.93 0.86Atascadero 29 0.65 0.88 -0.90 0.96 0.93Glendora 32 0.70 0.67 0.19 0.92 0.84Lake Arrowhead 23 0.78 0.87 -0.20 0.99 0.98Lake Elsinore 58 0.69 0.61 0.36 0.95 0.90Lancaster 33 0.69 0.68 0.04 0.93 0.87Lompoc 33 0.63 0.70 -0.13 0.94 0.88Long Beach 30 0.68 0.69 -0.03 0.97 0.95Mira Loma 33 0.40 0.13 3.51 0.43 0.19Riverside 64 0.63 0.51 0.73 0.87 0.77Santa Maria 33 0.47 0.59 -0.41 0.92 0.85Upland 31 0.65 0.59 0.52 0.90 0.82
26
0
2
4
6
8
10
2 4 6 8 10
D -
PM
2.2
(µg
/m3 )
C - PM10* (µg/m3)
(OC - Riverside)
(0.512 * C + .734)
0
1
2
3
4
5
6
7
8
1 2 3 4 5 6 7 8
D -
PM
2.2
(µg
/m3 )
C - PM10* (µg/m3)
(OC - Santa Maria)
(0.594 * C - .414)
0
2
4
6
8
10
1 2 3 4 5 6 7 8 9 10
D -
PM
2.2
(µg
/m3 )
C - PM10* (µg/m3)
(OC - Glendora)
(0.669 * C + .193)
0
5
10
15
20
25
30
5 10 15 20 25 30
D -
PM
2.2
(µg
/m3 )
C - PM10* (µg/m3)
(OC - Mira Loma)
(0.131 * C + 3.508)
0
1
2
3
4
5
1 1.5 2 2.5 3 3.5 4 4.5 5
D -
PM
2.2
(µg
/m3 )
C - PM10* (µg/m3)
(OC - Lompoc)
(0.699 * C - .125)
0
2
4
6
8
10
12
2 4 6 8 10 12
D -
PM
2.2
(µg
/m3 )
C - PM10* (µg/m3)
(OC - Atascadero)
(0.876 * C - .901)
0
2
4
6
8
10
12
2 4 6 8 10 12
D -
PM
2.2
(µg
/m3 )
C - PM10* (µg/m3)
(OC - Long Beach)
(0.688 * C - .031)
0
1
2
3
4
5
1 1.5 2 2.5 3 3.5 4 4.5 5
D -
PM
2.2
(µg
/m3 )
C - PM10* (µg/m3)
(OC - Alpine)
(0.645 * C + .249)
0
2
4
6
8
10
1 2 3 4 5 6 7 8 9 10
D -
PM
2.2
(µg
/m3 )
C - PM10* (µg/m3)
(OC - Lake Arrowhead)
(0.869 * C - .200)
0
1
2
3
4
5
6
7
8
9
1 2 3 4 5 6 7 8 9
D -
PM
2.2
(µg
/m3 )
C - PM10* (µg/m3)
(OC - Lake Elsinore)
(0.613 * C + .365)
0
2
4
6
8
10
12
2 4 6 8 10 12
D -
PM
2.2
(µg
/m3 )
C - PM10* (µg/m3)
(OC - Upland)
(0.587 * C + .521)
0
2
4
6
8
10
2 4 6 8 10
D -
PM
2.2
(µg
/m3 )
C - PM10* (µg/m3)
(OC - Lancaster)
(0.676 * C + .041)
Figure 14: Linear regression comparison of Leg C vs Leg D organic carbon.
27
3.3.2 Elemental carbon
Previous findings show that more than 90 percent of airborne EC mass is found insub-micrometer particles (Seinfeld and Pandis, 1998). In our previous report (Salmon et al.,2001) fine particle samples were collected downstream of an AIHL cyclone for comparisonwith the Leg C Two-Week Sampler during a 10-week test. Those measurements showedthat EC concentrations measured with the fine particle sampler were on average 98% ofthose measured with the Leg C Two-Week sampler. Thus, very little adjustment of ECmeasurements was thought to be required to convert Leg C EC values for comparison withother PM2:5 concentrations.
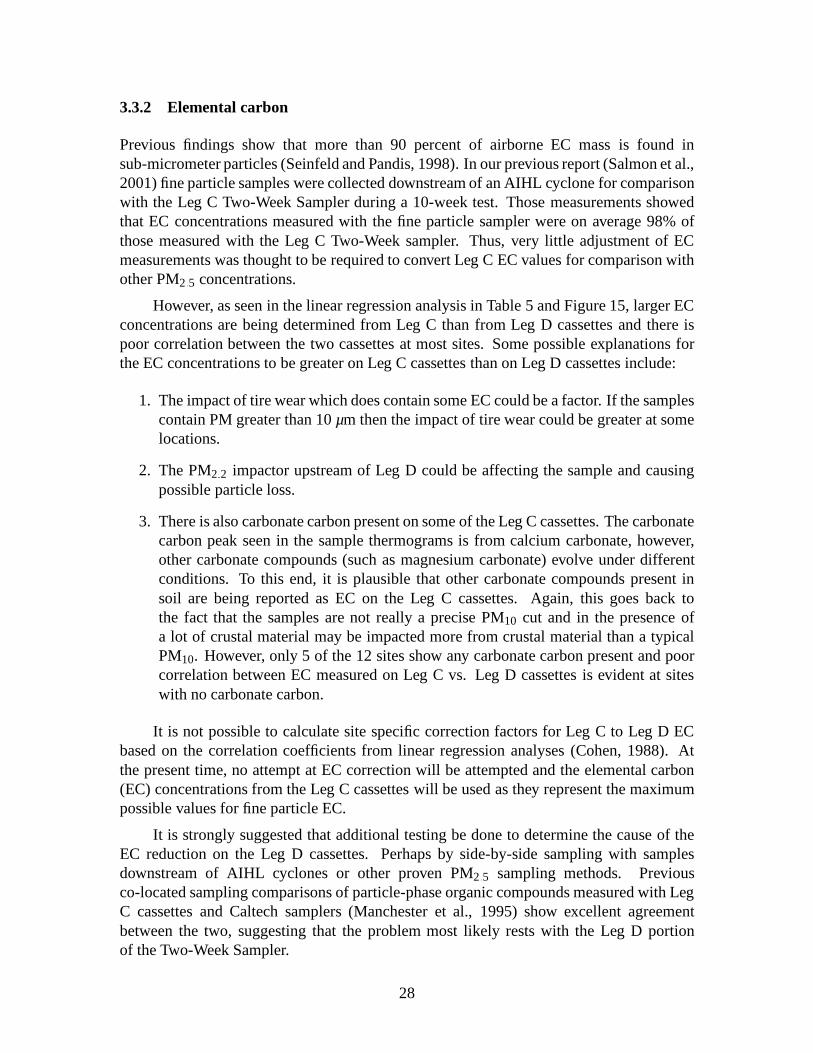
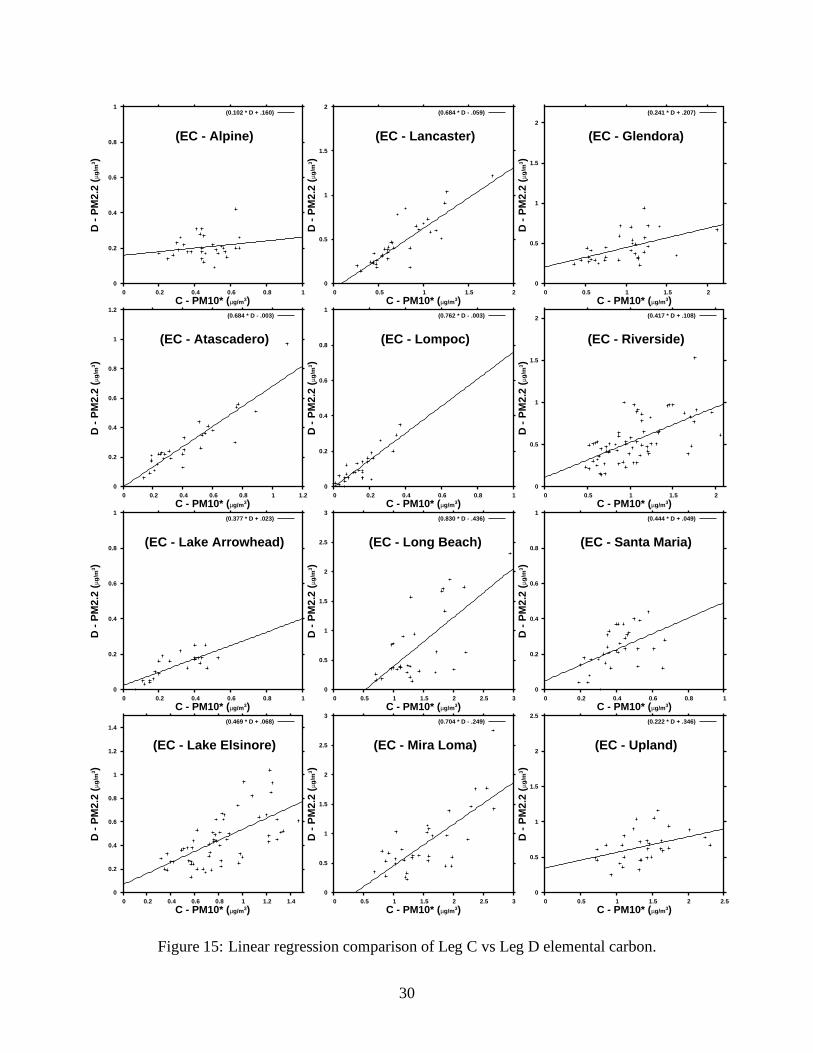
However, as seen in the linear regression analysis in Table 5and Figure 15, larger ECconcentrations are being determined from Leg C than from LegD cassettes and there ispoor correlation between the two cassettes at most sites. Some possible explanations forthe EC concentrations to be greater on Leg C cassettes than onLeg D cassettes include:
1. The impact of tire wear which does contain some EC could be afactor. If the samplescontain PM greater than 10µm then the impact of tire wear could be greater at somelocations.
2. The PM2:2 impactor upstream of Leg D could be affecting the sample and causingpossible particle loss.
3. There is also carbonate carbon present on some of the Leg C cassettes. The carbonatecarbon peak seen in the sample thermograms is from calcium carbonate, however,other carbonate compounds (such as magnesium carbonate) evolve under differentconditions. To this end, it is plausible that other carbonate compounds present insoil are being reported as EC on the Leg C cassettes. Again, this goes back tothe fact that the samples are not really a precise PM10 cut and in the presence ofa lot of crustal material may be impacted more from crustal material than a typicalPM10. However, only 5 of the 12 sites show any carbonate carbon present and poorcorrelation between EC measured on Leg C vs. Leg D cassettes is evident at siteswith no carbonate carbon.
It is not possible to calculate site specific correction factors for Leg C to Leg D ECbased on the correlation coefficients from linear regression analyses (Cohen, 1988). Atthe present time, no attempt at EC correction will be attempted and the elemental carbon(EC) concentrations from the Leg C cassettes will be used as they represent the maximumpossible values for fine particle EC.
It is strongly suggested that additional testing be done to determine the cause of theEC reduction on the Leg D cassettes. Perhaps by side-by-sidesampling with samplesdownstream of AIHL cyclones or other proven PM2:5 sampling methods. Previousco-located sampling comparisons of particle-phase organic compounds measured with LegC cassettes and Caltech samplers (Manchester et al., 1995) show excellent agreementbetween the two, suggesting that the problem most likely rests with the Leg D portionof the Two-Week Sampler.
28
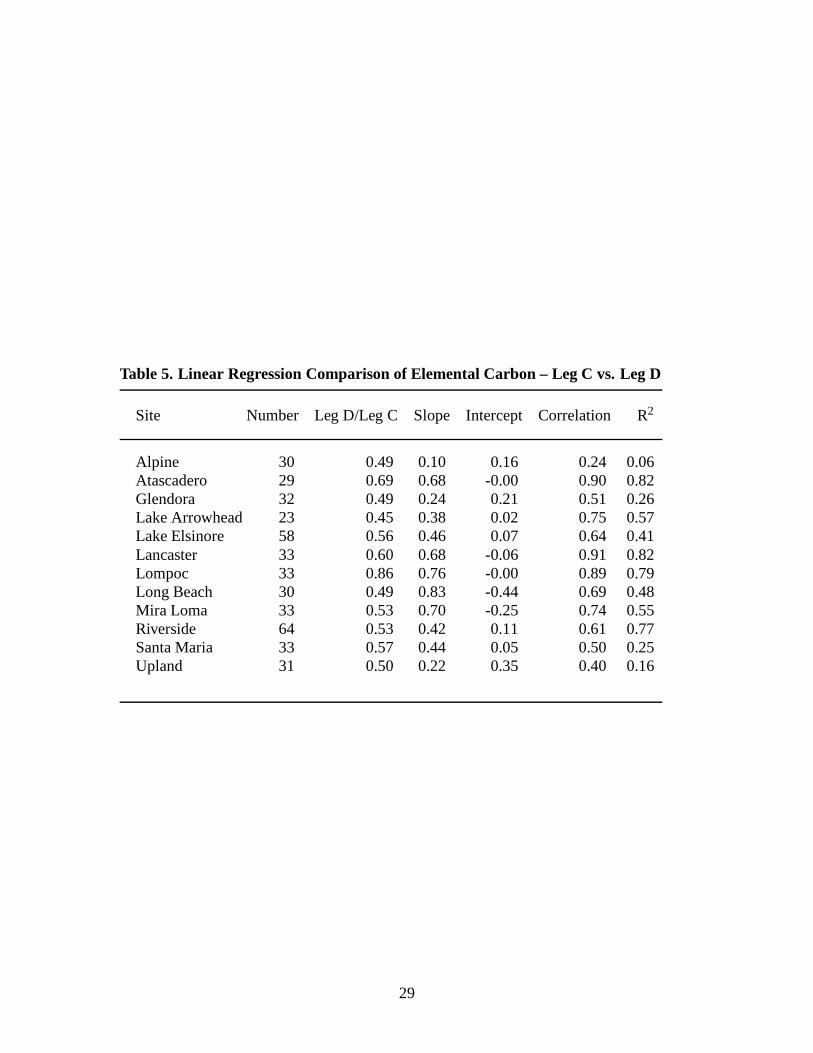
Table 5. Linear Regression Comparison of Elemental Carbon –Leg C vs. Leg D
Site Number Leg D/Leg C Slope Intercept Correlation R2
Alpine 30 0.49 0.10 0.16 0.24 0.06Atascadero 29 0.69 0.68 -0.00 0.90 0.82Glendora 32 0.49 0.24 0.21 0.51 0.26Lake Arrowhead 23 0.45 0.38 0.02 0.75 0.57Lake Elsinore 58 0.56 0.46 0.07 0.64 0.41Lancaster 33 0.60 0.68 -0.06 0.91 0.82Lompoc 33 0.86 0.76 -0.00 0.89 0.79Long Beach 30 0.49 0.83 -0.44 0.69 0.48Mira Loma 33 0.53 0.70 -0.25 0.74 0.55Riverside 64 0.53 0.42 0.11 0.61 0.77Santa Maria 33 0.57 0.44 0.05 0.50 0.25Upland 31 0.50 0.22 0.35 0.40 0.16
29
0
0.2
0.4
0.6
0.8
1
0 0.2 0.4 0.6 0.8 1
D -
PM
2.2
(µg
/m3 )
C - PM10* (µg/m3)
(EC - Alpine)
(0.102 * D + .160)
0
0.2
0.4
0.6
0.8
1
1.2
0 0.2 0.4 0.6 0.8 1 1.2
D -
PM
2.2
(µg
/m3 )
C - PM10* (µg/m3)
(EC - Atascadero)
(0.684 * D - .003)
0
0.2
0.4
0.6
0.8
1
0 0.2 0.4 0.6 0.8 1
D -
PM
2.2
(µg
/m3 )
C - PM10* (µg/m3)
(EC - Lake Arrowhead)
(0.377 * D + .023)
0
0.2
0.4
0.6
0.8
1
1.2
1.4
0 0.2 0.4 0.6 0.8 1 1.2 1.4
D -
PM
2.2
(µg
/m3 )
C - PM10* (µg/m3)
(EC - Lake Elsinore)
(0.469 * D + .068)
0
0.5
1
1.5
2
0 0.5 1 1.5 2
D -
PM
2.2
(µg
/m3 )
C - PM10* (µg/m3)
(EC - Lancaster)
(0.684 * D - .059)
0
0.2
0.4
0.6
0.8
1
0 0.2 0.4 0.6 0.8 1
D -
PM
2.2
(µg
/m3 )
C - PM10* (µg/m3)
(EC - Lompoc)
(0.762 * D - .003)
0
0.5
1
1.5
2
2.5
3
0 0.5 1 1.5 2 2.5 3
D -
PM
2.2
(µg
/m3 )
C - PM10* (µg/m3)
(EC - Long Beach)
(0.830 * D - .436)
0
0.5
1
1.5
2
2.5
3
0 0.5 1 1.5 2 2.5 3
D -
PM
2.2
(µg
/m3 )
C - PM10* (µg/m3)
(EC - Mira Loma)
(0.704 * D - .249)
0
0.5
1
1.5
2
0 0.5 1 1.5 2
D -
PM
2.2
(µg
/m3 )
C - PM10* (µg/m3)
(EC - Glendora)
(0.241 * D + .207)
0
0.5
1
1.5
2
0 0.5 1 1.5 2
D -
PM
2.2
(µg
/m3 )
C - PM10* (µg/m3)
(EC - Riverside)
(0.417 * D + .108)
0
0.2
0.4
0.6
0.8
1
0 0.2 0.4 0.6 0.8 1
D -
PM
2.2
(µg
/m3 )
C - PM10* (µg/m3)
(EC - Santa Maria)
(0.444 * D + .049)
0
0.5
1
1.5
2
2.5
0 0.5 1 1.5 2 2.5
D -
PM
2.2
(µg
/m3 )
C - PM10* (µg/m3)
(EC - Upland)
(0.222 * D + .346)
Figure 15: Linear regression comparison of Leg C vs Leg D elemental carbon.
30
3.4 Mass balance
The estimated annual average fine particle (PM2:5) organic compound and elemental carbonconcentrations are given alongside fine particle mass and ionic species concentrationsdetermined from samples taken on the other legs of the Two-Week samplers in Table 6.
For years 1994-2000, PM2.5 OC was estimated from Leg C organic carbonmeasurements using correction factors based on site specific side-by-side Leg C and LegD samples. For year 2001, both the estimated fine particle OC concentration from Leg Csamples and the fine particle OC concentration measured by Leg D samples are given inTable 6.
To convert the Leg C Two-Week Sampler measurements to PM2:5 values, themeasured OC concentrations from the Leg C samples were adjusted by the site specificcorrection factors obtained by the linear regression analysis to yield estimated PM2:5 OCconcentrations. The Leg C data will be adjusted by the slope and intercept values shown inTable 4 for each site including Mira Loma.
In addition, to account for oxygen and hydrogen associated with organic material,the adjusted OC concentrations were next multiplied by 1.2 to estimate the organic matterconcentrations. Factors used to convert organic carbon into organic mass in other studiesrange from 1.2 to 1.4 (Gray et al., 1986). The lower value was chosen for this study since ahigher conversion factor would have resulted in a greater incidence of over-balanced mass.
The elemental carbon (EC) concentrations from the Leg C samples are used withoutany conversion factor. These values are considered to represent an upper bound for the ECconcentrations. Lower annual average EC concentrations determined from Leg D samplesare given for comparison in Table 6.
A mass balance can be constructed by subtracting the concentrations of all of themeasured components from the measured mass concentration to determine the amount of“other” material not accounted for in the analyses that wereperformed. Figures 16-18show the relative quantity of the PM2:5 mass contributed by each of the major chemicalspecies measured at each site during each year, 1999-2001. Data from years 1994-1998are presented in Figures 19-23. In cases where the sum of the mass of species identifiedchemically exceeds by a small amount the mass measured gravimetrically, the speciescontributions are presented as a percentage of the total mass of identified species. The sumof individual species measured can exceed gravimetric massmeasured due to experimentaluncertainties on all quantities measured. “Other” in the pie charts represents the remainderof the measured mass after all of the identified components have been subtracted. Lompocand Santa Maria have the largest amounts of “other” materialfrom species not measured inthis study. Other components that are not accounted for in this study include mineral dustand other trace metals as well as sodium ion, which could be present from sea salt aerosolat coastal sites .
The combined mass of EC plus organic matter averaged at each site over all fiveyears accounts for 24 to 62 percent of PM2:5 mass at the various sites. Riverside (28%)and Lompoc (24%) lie at the low end of this range; at the high end of the range areLancaster (62% organics plus EC) and Atascadero (57% organics plus EC). With the
31
exception of Riverside, the concentrations of organic compounds plus EC at Los AngelesBasin sites lie between 32 and 45 percent of PM2:5 mass. Previous findings have placedthe average of organics plus EC for the Los Angeles Basin at approximately 40 percent offine particle mass (Gray et al., 1986), consistent with the present findings. The apparentlower relative carbon content at Riverside can be explainedby the higher PM2:5 ammoniumnitrate concentration at the site. Higher carbon content percentages are found at mountainand desert sites, as well as sites further north and south. These higher percentages ofcarbonaceous aerosol at the outlying sites are accompaniedby lower absolute carbonparticle concentrations as well as lower absolute concentrations of fine particle mass,sulfate, nitrate, and ammonium ions.
32
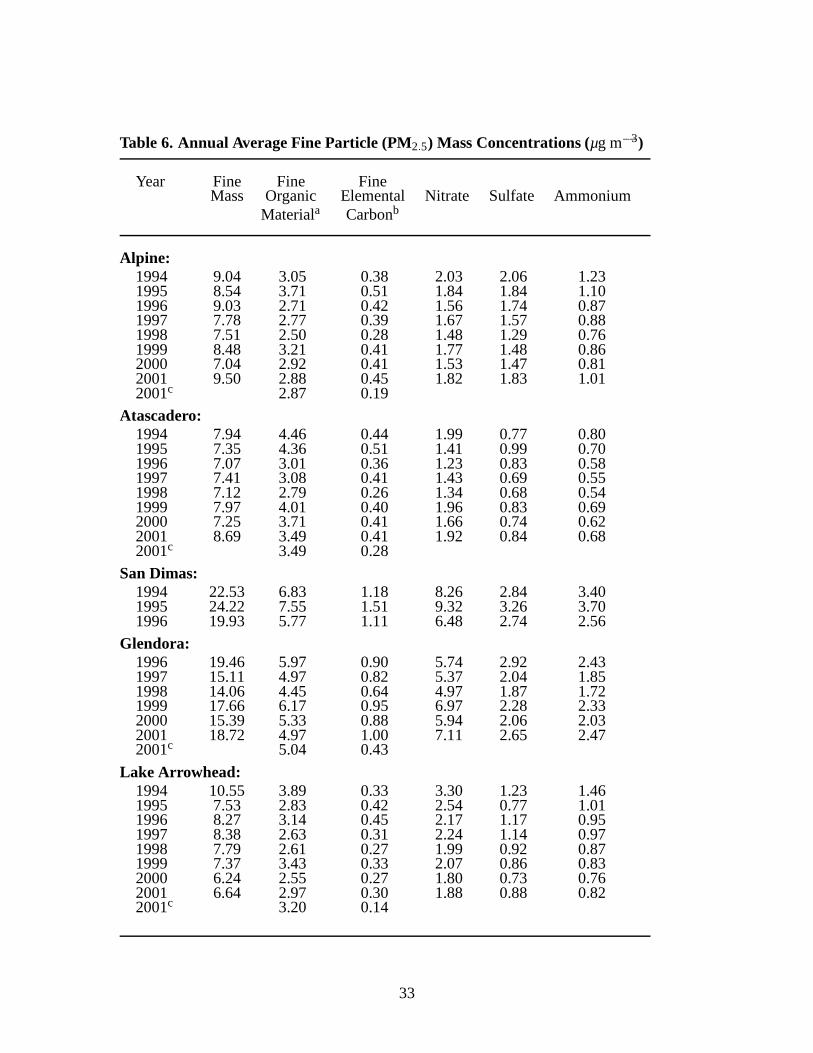
Table 6. Annual Average Fine Particle (PM2:5) Mass Concentrations (µg m�3)
Year Fine Fine FineMass Organic Elemental Nitrate Sulfate Ammonium
Materiala Carbonb
Alpine:1994 9.04 3.05 0.38 2.03 2.06 1.231995 8.54 3.71 0.51 1.84 1.84 1.101996 9.03 2.71 0.42 1.56 1.74 0.871997 7.78 2.77 0.39 1.67 1.57 0.881998 7.51 2.50 0.28 1.48 1.29 0.761999 8.48 3.21 0.41 1.77 1.48 0.862000 7.04 2.92 0.41 1.53 1.47 0.812001 9.50 2.88 0.45 1.82 1.83 1.012001c 2.87 0.19
Atascadero:1994 7.94 4.46 0.44 1.99 0.77 0.801995 7.35 4.36 0.51 1.41 0.99 0.701996 7.07 3.01 0.36 1.23 0.83 0.581997 7.41 3.08 0.41 1.43 0.69 0.551998 7.12 2.79 0.26 1.34 0.68 0.541999 7.97 4.01 0.40 1.96 0.83 0.692000 7.25 3.71 0.41 1.66 0.74 0.622001 8.69 3.49 0.41 1.92 0.84 0.682001c 3.49 0.28
San Dimas:1994 22.53 6.83 1.18 8.26 2.84 3.401995 24.22 7.55 1.51 9.32 3.26 3.701996 19.93 5.77 1.11 6.48 2.74 2.56
Glendora:1996 19.46 5.97 0.90 5.74 2.92 2.431997 15.11 4.97 0.82 5.37 2.04 1.851998 14.06 4.45 0.64 4.97 1.87 1.721999 17.66 6.17 0.95 6.97 2.28 2.332000 15.39 5.33 0.88 5.94 2.06 2.032001 18.72 4.97 1.00 7.11 2.65 2.472001c 5.04 0.43
Lake Arrowhead:1994 10.55 3.89 0.33 3.30 1.23 1.461995 7.53 2.83 0.42 2.54 0.77 1.011996 8.27 3.14 0.45 2.17 1.17 0.951997 8.38 2.63 0.31 2.24 1.14 0.971998 7.79 2.61 0.27 1.99 0.92 0.871999 7.37 3.43 0.33 2.07 0.86 0.832000 6.24 2.55 0.27 1.80 0.73 0.762001 6.64 2.97 0.30 1.88 0.88 0.822001c 3.20 0.14
33
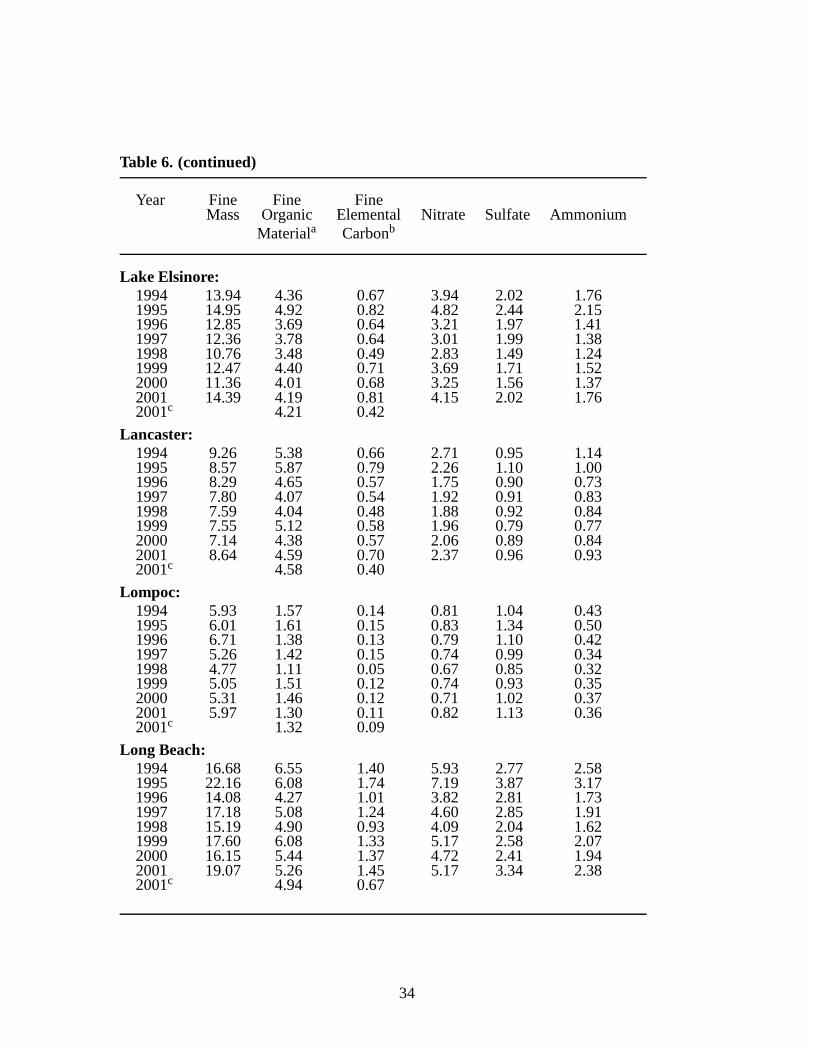
Table 6. (continued)
Year Fine Fine FineMass Organic Elemental Nitrate Sulfate Ammonium
Materiala Carbonb
Lake Elsinore:1994 13.94 4.36 0.67 3.94 2.02 1.761995 14.95 4.92 0.82 4.82 2.44 2.151996 12.85 3.69 0.64 3.21 1.97 1.411997 12.36 3.78 0.64 3.01 1.99 1.381998 10.76 3.48 0.49 2.83 1.49 1.241999 12.47 4.40 0.71 3.69 1.71 1.522000 11.36 4.01 0.68 3.25 1.56 1.372001 14.39 4.19 0.81 4.15 2.02 1.762001c 4.21 0.42
Lancaster:1994 9.26 5.38 0.66 2.71 0.95 1.141995 8.57 5.87 0.79 2.26 1.10 1.001996 8.29 4.65 0.57 1.75 0.90 0.731997 7.80 4.07 0.54 1.92 0.91 0.831998 7.59 4.04 0.48 1.88 0.92 0.841999 7.55 5.12 0.58 1.96 0.79 0.772000 7.14 4.38 0.57 2.06 0.89 0.842001 8.64 4.59 0.70 2.37 0.96 0.932001c 4.58 0.40
Lompoc:1994 5.93 1.57 0.14 0.81 1.04 0.431995 6.01 1.61 0.15 0.83 1.34 0.501996 6.71 1.38 0.13 0.79 1.10 0.421997 5.26 1.42 0.15 0.74 0.99 0.341998 4.77 1.11 0.05 0.67 0.85 0.321999 5.05 1.51 0.12 0.74 0.93 0.352000 5.31 1.46 0.12 0.71 1.02 0.372001 5.97 1.30 0.11 0.82 1.13 0.362001c 1.32 0.09
Long Beach:1994 16.68 6.55 1.40 5.93 2.77 2.581995 22.16 6.08 1.74 7.19 3.87 3.171996 14.08 4.27 1.01 3.82 2.81 1.731997 17.18 5.08 1.24 4.60 2.85 1.911998 15.19 4.90 0.93 4.09 2.04 1.621999 17.60 6.08 1.33 5.17 2.58 2.072000 16.15 5.44 1.37 4.72 2.41 1.942001 19.07 5.26 1.45 5.17 3.34 2.382001c 4.94 0.67
34
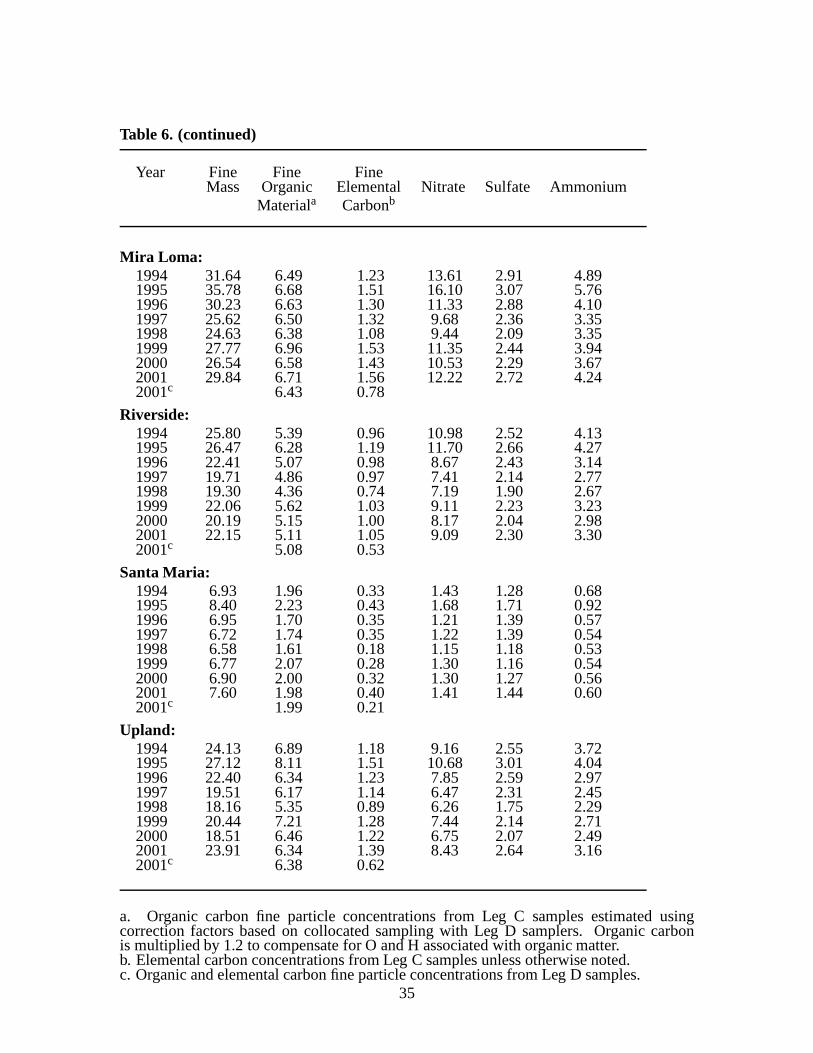
Table 6. (continued)
Year Fine Fine FineMass Organic Elemental Nitrate Sulfate Ammonium
Materiala Carbonb
Mira Loma:1994 31.64 6.49 1.23 13.61 2.91 4.891995 35.78 6.68 1.51 16.10 3.07 5.761996 30.23 6.63 1.30 11.33 2.88 4.101997 25.62 6.50 1.32 9.68 2.36 3.351998 24.63 6.38 1.08 9.44 2.09 3.351999 27.77 6.96 1.53 11.35 2.44 3.942000 26.54 6.58 1.43 10.53 2.29 3.672001 29.84 6.71 1.56 12.22 2.72 4.242001c 6.43 0.78
Riverside:1994 25.80 5.39 0.96 10.98 2.52 4.131995 26.47 6.28 1.19 11.70 2.66 4.271996 22.41 5.07 0.98 8.67 2.43 3.141997 19.71 4.86 0.97 7.41 2.14 2.771998 19.30 4.36 0.74 7.19 1.90 2.671999 22.06 5.62 1.03 9.11 2.23 3.232000 20.19 5.15 1.00 8.17 2.04 2.982001 22.15 5.11 1.05 9.09 2.30 3.302001c 5.08 0.53
Santa Maria:1994 6.93 1.96 0.33 1.43 1.28 0.681995 8.40 2.23 0.43 1.68 1.71 0.921996 6.95 1.70 0.35 1.21 1.39 0.571997 6.72 1.74 0.35 1.22 1.39 0.541998 6.58 1.61 0.18 1.15 1.18 0.531999 6.77 2.07 0.28 1.30 1.16 0.542000 6.90 2.00 0.32 1.30 1.27 0.562001 7.60 1.98 0.40 1.41 1.44 0.602001c 1.99 0.21
Upland:1994 24.13 6.89 1.18 9.16 2.55 3.721995 27.12 8.11 1.51 10.68 3.01 4.041996 22.40 6.34 1.23 7.85 2.59 2.971997 19.51 6.17 1.14 6.47 2.31 2.451998 18.16 5.35 0.89 6.26 1.75 2.291999 20.44 7.21 1.28 7.44 2.14 2.712000 18.51 6.46 1.22 6.75 2.07 2.492001 23.91 6.34 1.39 8.43 2.64 3.162001c 6.38 0.62
a. Organic carbon fine particle concentrations from Leg C samples estimated usingcorrection factors based on collocated sampling with Leg D samplers. Organic carbonis multiplied by 1.2 to compensate for O and H associated withorganic matter.b. Elemental carbon concentrations from Leg C samples unless otherwise noted.c. Organic and elemental carbon fine particle concentrations from Leg D samples.
35

Other
Ammonium
Sulfate
Nitrate
Organics
EC
Other
Ammonium
Sulfate
Nitrate
Organics
EC
Other
Ammonium
Sulfate
Nitrate
Organics
EC
Other
Ammonium
Sulfate
Nitrate
Organics
EC
Other
Ammonium
Sulfate
Nitrate
Organics
EC
Other
Ammonium
Sulfate
Nitrate
Organics
EC
Other
Ammonium
Sulfate
Nitrate
Organics
EC
Other
Ammonium
Sulfate
Nitrate
Organics
EC
Other
Ammonium
Sulfate
Nitrate
Organics
EC
Other
Ammonium
Sulfate
Nitrate
Organics
EC
Other
Ammonium
Sulfate
Nitrate
Organics
EC
Other
Ammonium
Sulfate
Nitrate
Organics
EC
Other
Ammonium
Sulfate Nitrate
Organics
EC
Alpine (8.5) Lake Arrowhead (7.4) Lake Elsinore (12.5)
Atascadero (8.0) Lompoc (5.1) Santa Maria (6.8)
Mira Loma (27.8) Upland (20.4) Riverside (22.1)
Long Beach (17.6) Lancaster (7.6) Glendora (17.7)
Fine Particle Chemical Composition1999 Average -- µg m-3
Figure 16: Chemical composition of 1999 annual airborne fineparticle concentrations.
36

Other
Ammonium
Sulfate
Nitrate
Organics
EC
Other
Ammonium
Sulfate
Nitrate
Organics
EC Other
Ammonium
Sulfate
Nitrate
Organics
EC
Other
Ammonium
Sulfate
Nitrate
Organics
EC
Other
Ammonium
Sulfate
Nitrate
Organics
EC
Other
Ammonium
Sulfate
Nitrate
Organics
EC
Other
Ammonium
Sulfate
Nitrate
Organics
EC
Other
Ammonium
Sulfate
Nitrate
Organics
EC
Other
Ammonium
Sulfate
Nitrate
Organics
EC
Other
Ammonium
Sulfate
Nitrate
Organics
EC
Other
Ammonium
Sulfate
Nitrate Organics
EC
Other
Ammonium
Sulfate
Nitrate
Organics
EC
Other
Ammonium
Sulfate Nitrate
Organics
EC
Alpine (7.0) Lake Arrowhead (6.2) Lake Elsinore (11.4)
Atascadero (7.3) Lompoc (5.3) Santa Maria (6.9)
Mira Loma (26.5) Upland (18.5) Riverside (20.2)
Long Beach (16.2) Lancaster (7.1) Glendora (15.4)
Fine Particle Chemical Composition2000 Average -- µg m-3
Figure 17: Chemical composition of 2000 annual airborne fineparticle concentrations.
37

Other
Ammonium
Sulfate
Nitrate
Organics
EC
Other
Ammonium
Sulfate
Nitrate
Organics
EC
Other
Ammonium
Sulfate
Nitrate
Organics
EC
Other
Ammonium
Sulfate
Nitrate
Organics
EC
Other
Ammonium
Sulfate
Nitrate
Organics
EC
Other
Ammonium
Sulfate Nitrate
Organics
EC
Other
Ammonium
Sulfate
Nitrate
Organics
EC
Other
Ammonium
Sulfate
Nitrate
Organics
EC Other
Ammonium
Sulfate
Nitrate
Organics
EC
Other
Ammonium
Sulfate
Nitrate
Organics
EC
Other
Ammonium
Sulfate
Nitrate
Organics
EC
Other
Ammonium
Sulfate
Nitrate
Organics
EC
Other
Ammonium
Sulfate Nitrate
Organics
EC
Alpine (9.5) Lake Arrowhead (6.6) Lake Elsinore (14.4)
Atascadero (8.7) Lompoc (6.0) Santa Maria (7.6)
Mira Loma (29.8) Upland (23.9) Riverside (22.2)
Long Beach (19.1) Lancaster (8.6) Glendora (18.7)
Fine Particle Chemical Composition2001 Average -- µg m-3
Figure 18: Chemical composition of 2001 annual airborne fineparticle concentrations.
38

Other
Ammonium
Sulfate
Nitrate
Organics
EC
Other
Ammonium
Sulfate
Nitrate
Organics
EC
Other
Ammonium
Sulfate
Nitrate
Organics
EC
Other
Ammonium
Sulfate
Nitrate
Organics
EC
Other
Ammonium
Sulfate
Nitrate
Organics
EC
Other
Ammonium
Sulfate
Nitrate
Organics
EC
Other
Ammonium
Sulfate
Nitrate
Organics
EC
Other
Ammonium
Sulfate
Nitrate
Organics
EC
Other
Ammonium
Sulfate
Nitrate
Organics
EC
Other
Ammonium
Sulfate
Nitrate
Organics
EC
Other
Ammonium
Sulfate
Nitrate
Organics
EC
Other
Ammonium
Sulfate
Nitrate
Organics
EC
Other
Ammonium
Sulfate Nitrate
Organics
EC
Alpine (9.0) Lake Arrowhead (10.6) Lake Elsinore (13.9)
Atascadero (7.9) Lompoc (5.9) Santa Maria (6.9)
Mira Loma (31.6) Upland (24.1) Riverside (25.8)
Long Beach (16.7) Lancaster (9.3) San Dimas (22.5)
Fine Particle Chemical Composition1994 Average -- µg m-3
Figure 19: Chemical composition of 1994 annual airborne fineparticle concentrations.
39

Other
Ammonium
Sulfate
Nitrate
Organics
EC
Other
Ammonium
Sulfate
Nitrate
Organics
EC
Other
Ammonium
Sulfate
Nitrate
Organics
EC
Other
Ammonium
Sulfate
Nitrate
Organics
EC
Other
Ammonium
Sulfate
Nitrate
Organics
EC
Other
Ammonium
Sulfate
Nitrate
Organics
EC
Other
Ammonium
Sulfate
Nitrate
Organics
EC
Other
Ammonium
Sulfate
Nitrate
Organics
EC
Other
Ammonium
Sulfate
Nitrate
Organics
EC
Other
Ammonium
Sulfate
Nitrate
Organics
EC
Other
Ammonium
Sulfate
Nitrate
Organics
EC
Other
Ammonium
Sulfate
Nitrate
Organics
EC
Other
Ammonium
Sulfate Nitrate
Organics
EC
Alpine (8.5) Lake Arrowhead (7.5) Lake Elsinore (15.0)
Atascadero (7.4) Lompoc (6.0) Santa Maria (8.4)
Mira Loma (35.8) Upland (27.1) Riverside (26.5)
Long Beach (22.2) Lancaster (8.6) San Dimas (24.2)
Fine Particle Chemical Composition1995 Average -- µg m-3
Figure 20: Chemical composition of 1995 annual airborne fineparticle concentrations.
40

Other
Ammonium
Sulfate
Nitrate
Organics
EC Other
Ammonium
Sulfate
Nitrate
Organics
EC
Other
Ammonium
Sulfate
Nitrate
Organics
EC
Other
Ammonium
Sulfate
Nitrate
Organics
EC
Other
Ammonium
Sulfate
Nitrate
Organics
EC
Other
Ammonium
Sulfate
Nitrate
Organics
EC
Other
Ammonium
Sulfate
Nitrate
Organics
EC
Other
Ammonium
Sulfate
Nitrate
Organics
EC
Other
Ammonium
Sulfate
Nitrate
Organics
EC
Other
Ammonium
Sulfate
Nitrate
Organics
EC
Other
Ammonium
Sulfate
Nitrate
Organics
EC Other
Ammonium
Sulfate
Nitrate
Organics
EC
Other
Ammonium
Sulfate Nitrate
Organics
EC
Alpine (9.0) Lake Arrowhead (8.3) Lake Elsinore (12.9)
Atascadero (7.1) Lompoc (6.7) Santa Maria (7.0)
Mira Loma (30.2) Upland (22.4) Riverside (22.4)
Long Beach (14.1) Lancaster (8.3) San Dimas (19.9)
Fine Particle Chemical Composition1996 Average -- µg m-3
Figure 21: Chemical composition of 1996 annual airborne fineparticle concentrations.
41

Other
Ammonium
Sulfate
Nitrate
Organics
EC
Other
Ammonium
Sulfate
Nitrate
Organics
EC
Other
Ammonium
Sulfate
Nitrate
Organics
EC
Other
Ammonium
Sulfate
Nitrate
Organics
EC
Other
Ammonium
Sulfate
Nitrate
Organics
EC
Other
Ammonium
Sulfate
Nitrate
Organics
EC
Other
Ammonium
Sulfate
Nitrate
Organics
EC Other
Ammonium
Sulfate
Nitrate
Organics
EC
Other
Ammonium
Sulfate
Nitrate
Organics
EC
Other
Ammonium
Sulfate
Nitrate
Organics
EC
Other
Ammonium
Sulfate
Nitrate
Organics
EC
Other
Ammonium
Sulfate
Nitrate
Organics
EC
Other
Ammonium
Sulfate Nitrate
Organics
EC
Alpine (7.8) Lake Arrowhead (8.4) Lake Elsinore (12.4)
Atascadero (7.4) Lompoc (5.3) Santa Maria (6.7)
Mira Loma (25.6) Upland (19.5) Riverside (19.7)
Long Beach (17.2) Lancaster (7.8) Glendora (15.1)
Fine Particle Chemical Composition1997 Average -- µg m-3
Figure 22: Chemical composition of 1997 annual airborne fineparticle concentrations.
42

Other
Ammonium
Sulfate
Nitrate
Organics
EC
Other
Ammonium
Sulfate
Nitrate
Organics
EC
Other
Ammonium
Sulfate
Nitrate
Organics
EC
Other
Ammonium
Sulfate
Nitrate
Organics
EC
Other
Ammonium
Sulfate
Nitrate
Organics
EC
Other
Ammonium
Sulfate
Nitrate
Organics
EC
Other
Ammonium
Sulfate
Nitrate
Organics
EC
Other
Ammonium
Sulfate
Nitrate
Organics
EC
Other
Ammonium
Sulfate
Nitrate
Organics
EC
Other
Ammonium
Sulfate
Nitrate
Organics
EC
Other
Ammonium
Sulfate
Nitrate
Organics
EC
Other
Ammonium
Sulfate
Nitrate
Organics
EC
Other
Ammonium
Sulfate Nitrate
Organics
EC
Alpine (7.5) Lake Arrowhead (7.8) Lake Elsinore (10.8)
Atascadero (7.1) Lompoc (4.8) Santa Maria (6.6)
Mira Loma (24.6) Upland (18.2) Riverside (19.3)
Long Beach (15.2) Lancaster (7.6) Glendora (14.1)
Fine Particle Chemical Composition1998 Average -- µg m-3
Figure 23: Chemical composition of 1998 annual airborne fineparticle concentrations.
43
4 Summary and Conclusions
A network of air monitoring sites have been operating as partof the Southern CaliforniaChildren’s Health Study since 1994. This is a large epidemiological investigation of thelong-term effects of air pollutant exposure on respiratorydisease within a population ofmore than 5600 California school children. Among the sites studied are mountain (Alpine,Lake Arrowhead, Lake Elsinore), desert (Lancaster), and other rural locations (Lompoc,Santa Maria, Atascadero) as well as Long Beach, Glendora andSan Dimas within the LosAngeles County urban area plus Upland, Mira Loma, and Riverside in the urban plumedownwind of the Los Angeles-Long Beach area. These sites represent exposure extremesfor one or more pollutants and cover a large enough geographical area and a long enoughtime period to document spatial and temporal variations (Peters et al., 1999). Data throughthe end of year 2001 has been presented in this report. Samples for the Children’s HealthStudy continue to be collected over consecutive two week averaging times.
Particulate organic carbon (OC) and elemental carbon (EC) samples were collectedon quartz fiber filters through which ambient air was drawn fortwo weeks. After eachtwo week interval, new quartz fiber filters were installed at each sampling location in theChildren’s Health Study sampling network. The quartz fiber filters were analyzed for OCand EC content by thermal evolution and combustion. The primary carbon particle cassette(Leg C) used during the study did not have a defined size cut, but was determined to have abroad cut-point of approximately 10µm after comparison with reference samplers havingknown size cuts (Salmon et al., 2001). A separate carbon particle cassette (Leg D) witha PM2:2 size cut was introduced in late 2000 and operated side-by-side with the primarycarbon particle cassette in use since the inception of the study. In addition to carbon species,concentrations of PM10 and fine particle (PM2:5) mass, nitrate, sulfate, and ammonium ionconcentrations, as well as gas-phase ozone, nitrogen dioxide, formic acid, acetic acid, andnitric acid have been measured continuously since 1994.
From 1994 through 2001, annual average PM10-equivalent elemental (black) carbonparticle concentrations ranged from 0.05 to 1.74µg m�3 at the communities studied. Thelowest EC concentrations during all years were consistently measured at the rural, coastalLompoc site. Yearly maximum EC concentrations were found atthe Long Beach siteduring 6 of the 8 years studied, however the highest annual average EC concentrationswere found inland at Mira Loma since 1996. Upland and Riverside were also among thecommunities with high EC levels. EC is produced in combustion processes and stronglyinfluenced by diesel engine exhaust which is prevalent in allof these communities. LongBeach is close to the heavy industry and traffic in the Los Angeles/Long Beach harbor areawhile Mira Loma, Upland and Riverside are home to numerous warehouse distributioncenters serviced by thousands of diesel trucks each day. Newer diesel engines and improveddiesel fuels have been introduced into the vehicle fleet overthe last 10 years which shouldhave reduced EC levels. However, EC concentrations for 1999-2001 have shown a gradualincrease in EC concentrations and at most sites, 2001 levelsare equal or greater to whatthey had been in 1994 suggesting that these measures alone are not sufficient to address theproblem, especially in communities like those in Riversidecounty that are experiencingincreased truck traffic with the building of more and more giant distribution centers.
44
EC concentrations are of utmost concern since diesel soot isa major contributor tocancer risk, and health studies suggest children living in Mira Loma, which has the highestparticulate levels in Southern California, are more likelyto suffer respiratory problemsbecause their lungs develop more slowly than do those of children elsewhere. Newregulations on diesel emissions standards have been approved in California that shoulddramatically cut pollution from big-rigs, trash trucks anddelivery vans in the near future.The new rules will require diesel engines to be equipped withtailpipe controls. The controlswill be phased in beginning with the 2007 model year, and by 2010, they are supposed toeliminate 90 percent of the smog-forming nitrogen oxide andparticulate emissions fromdiesel vehicles.
Annual average PM10-equivalent particulate organic carbon concentrations were inthe range 1.5 to 17.5µg m�3 during 1994 through 2001. The maximum 2-week OCconcentration of 31.5µg m�3 was measured at Mira Loma in 1996 and Mira Loma hadthe highest organic carbon concentrations of any site in this study. The lowest annualaverage OC concentrations were consistently found at Lompoc. In general, both OC andEC concentrations were highest at the Los Angeles Basin sites and lowest at the sites in theoutlying areas (San Luis Obispo, Santa Barbara, and San Diego Counties), the mountainsite at Lake Arrowhead, and the desert site at Lancaster. There were also decreasingelemental carbon to total carbon (TC = EC + OC) ratios moving from west to east acrossthe Los Angeles Basin. This can be attributed to the fact thatas an airmass moves across thebasin the organic fraction can be enhanced by the formation of secondary organic aerosolas a result of condensation from the gas phase. Elemental carbon, conversely, is introducedto the atmosphere solely via the direct or primary emission of particles.
OC annual average concentrations dropped with time over the1994 through 1998period, but concentrations at all sites increased in 1999 and annual average concentrationsat the end of 2001 remain higher than in 1998, which had the lowest OC concentrationsof the years studied. The most likely reason for the OC decline was likely milder weatherwith lower mean temperatures in the late 1990s. Warmer temperatures returned to SouthernCalifornia during 1999-2001 and with higher temperatures and bright sunlight comesphotochemical smog. Organic compounds are one of the main primary pollutants foundin photochemical smog.
Studies have found associations between outdoor air pollution exposure and preva-lence of respiratory diseases as well associations betweenmortality rates and particulateair pollution in metropolitan areas in the United States (Pope, 2000). There is increasingepidemiological evidence pointing toward health risks from particulate air pollution,especially fine particulate matter. However, organic and elemental carbon measurementswith a fine particle size cut were not taken as part of the Children’s Health Study until theintroduction of the Leg D cassettes near the end of year 2000.Preliminary comparisons ofEC concentrations taken side-by-side with Leg C and Leg D cassettes show problems withlower than expected EC concentrations as measured with the Leg D cassettes. It is stronglysuggested that additional testing be done to determine the cause of the EC reduction on theLeg D cassettes, since obtaining reliable fine particle PM2:5 data is of vital importance.
The organic and elemental carbon particle data show seasonal and annual variations
45

as well as spatial ranges in carbon particle concentrationsacross the southern half ofCalifornia. With carbonaceous aerosols accounting for 24 to 62 percent of fine particleconcentrations, it is clear that measurement of carbon species should be included inmulti-year, multi-location studies of particulate concentrations.
46
5 References
Birch, M.E.; and Cary, R.A. (1996) “Elemental carbon-basedmethod for monitoring
occupational exposures to particulate diesel exhaust,”Aerosol Science and Technology25
221-241.
Cass, G.R.; and Gray, H.A. (1995) “Regional emissions and atmospheric concentrations of
diesel engine particulate matter: Los Angeles as a case study,” In Diesel Exhaust: A Critical
Analysis of Emissions, Exposure, and Health Effects, Health Effects Institute, Cambridge,
MA.
Chow, J.C.; Watson, J.G.; Crow, D.; Lowenthal, D.H.; and Merrifield, T. (2001)
“Comparison of IMPROVE and NIOSH Carbon Measurements,”Aerosol Science and
Technology3423-34.
Christoforou, C.S.; Salmon, L.G; Hannigan, M.P., Solomon,P.A.; and Cass, G.R. (2000)
“Trends in fine particle concentration and chemical composition in Southern California,”
Journal of the Air and Waste Management Association5043-53.
Cohen, J.; (1988)Statistical power analysis for the behavioral sciences, (2nd ed.), New
Jersey: Lawrence Erlbaum.
Dockery, D.W.; Pope, C.A., III; Xu, X.; Spengler, J.D.; Ware, J.H.; Martha, E.F.; Ferris,
B.G., Jr.; and Speizer, F.E. (1993) “An association betweenair pollution and mortality in
six U.S. Cities,”New England Journal of Medicine3291753-1759.
Guaderman, W.J.; Gilliland, G.F.; Vora, H.; Avol, E.; Stram, D.; McConnell, R.; Thomas,
D.; Lurmann, F.; Margolis, H.G.; Rappaport, E.B.; Berhand,K.; and Peters, J.M. (2002)
“Association between Air Pollution and Lung Function Growth in Southern California
Children. Results from a Second Cohort,”American Journal of Respiratory Critical Care
Medicine16676-84.
Gray, H.A.; Cass, G.R.; Huntzicker, J.J.; Heyerdahl, E.K.;and Rau, J.A. (1986)
“Characteristics of atmospheric organic and elemental carbon particle concentrations in
Los Angeles,”Environmental Science and Technology20580-589.
Gray, H.A. and Cass, G.R. (1998) “Source contributions to atmospheric fine carbon particle
concentrations,”Atmospheric Environment32, pp. 3805-3825.
Hannigan, M.P.; Salmon, L.G.; Christoforou, C.S.; Gharib,S.S.; Butcher, C.H.; Cass,
G.R.; Chow, J.C.; and Frazier, C.A. (1996) “Determination of fine particle concentration
47
and chemical composition in the South Coast air basin, 1993,” Final Report to the South
Coast Air Quality Management District, California Institute of Technology, Pasadena, CA.
Hildemann, L.M.; Markowski, G.R.; and Cass, G.R. (1991) “Chemical composition
of emissions from urban sources of fine organic aerosol,”Environmental Science and
Technology25, pp. 744-759.
John, W.; and Reischl, G. (1980) “A cyclone for size-selective sampling of air,”Journal of
the Air Pollution Control Association30872-876.
Kaplan, I.R.; and Gordon, R.J. (1994) “Non-fossil fuel fine particle organic carbon aerosols
in Southern California determined during the Los Angeles aerosol characterization and
source apportionment study,”Aerosol Science and Technology21, pp. 343-359.
Larson, S.M.; Cass, G.R.; and Gray, H.A. (1989) “Atmospheric carbon particles and the
Los Angeles visibility problem,”Aerosol Science and Technology10118-130.
Lurmann, F.W; Roberts, P.T.; Main, H.H.; Hering, S.V.; Avol, E.L., and Colome, S.D.
(1994) Phase II Report – Appendix A: Exposure Assessment Methodology, Sonoma
Technology, Petaluma, CA.
Manchester, J.B.; Schauer, J.J.; and Cass, G.R.; (2001) “Determination of the Elemental
Carbon, Organic Compounds, and Source Contributions to Atmospheric Particles during
the Southern California Children’s Health Study: Part B: The Distribution of Particle-Phase
Organic Compounds in the Atmosphere and Source Contributions to Atmospheric
Particulate Matter Concentrations During the Southern California Children’s Health Study,
1995,” Environmental Chemistry and Technology Program, University of Wisconsin-
Madison and Environmental Engineering Science Department, California Institute of
Technology, Final Report to the California Air Resources Board under contract 98-320.
Peters, J.M.; Avol, E.; Navidi, W.; London, S.J.; Gauderman, W.J; Lurmann, F.; Linn,
W.S; Margolis, H.; Rappaport, E.; Gong, H., Jr.; and Thomas,D.C. (1999) “A study of
twelve Southern California communities with differing levels and types of air pollution:
I. Prevalence of respiratory morbidity,”American Journal of Respiratory Critical Care
Medicine159760-767.
Pope, C.A., III. (2000) “What Do Epidemiologic Findings Tell Us about Health Effects of
Environmental Aerosols?,”Journal of Aerosol Medicine13335-354.
Pope, C.A., III; Thun, M.J.; Namboodiri, M.M.; Dockery, D.W.; Evans, J.S.; Speizer, F.E.;
and Heath, C.W., Jr. (1995a) “Particulate air pollution as apredictor of mortality in a
48
prospective study of U.S. adults,”American Journal of Respiratory Critical Care Medicine
151, pp. 669-674.
Pope, C.A., III; Dockery, D.W.; and Schwartz, J. (1995b) “Review of epidemiological
evidence of health effects of particulate air pollution,”Inhalation Toxicology7, pp. 1-18.
Salmon, L.G.; Mertz, K.A.; Mayo, P.R.; and Cass, G.R.; (2001) “Determination of
the Elemental Carbon, Organic Compounds, and Source Contributions to Atmospheric
Particles during the Southern California Children’s Health Study: Part A: Organic and
Elemental Carbon Particle Concentrations During the Southern California Children’s
Health Study, 1994–1998,” Environmental Engineering Science Department, California
Institute of Technology, Final Report to the California AirResources Board under contract
98-320.
Schauer, J.J.; Rogge, W.F., Hildemann, L.M.; Mazurek, M.A.; Cass, G.R.; and
Simoneit, B.R.T. (1996) “Source apportionment of airborneparticulate matter using
organic compounds as tracers,”Atmospheric Environment30, pp. 3837-3855.
Seinfeld, J.H; and Pandis, S.N. (1998)Atmospheric Chemistry and Physics: From Air
Pollution to Climate Change, John Wiley and Sons, Inc., New York, NY.
Sioutas, C.; Chang, O.; and Kim, S. (1999) personal communication.
Solomon, P.A.; Fall, T.; Salmon, L.G.; Lin, P.; Vasquez, F.;and Cass, G.R. (1988)
“Acquisition of acid vapor and aerosol concentration data for use in dry deposition
studies in the South Coast Air Basin,” Environmental Quality Laboratory Report 25,
California Institute of Technology, Final Report to the California Air Resources Board
under Agreement A4-144-32.
Solomon, P.A.; Fall, T.; Salmon, L.G.; Cass, G.R.; Gray, H.A.; and Davidson, A. (1989)
“Chemical characteristics of PM10 aerosols collected in the Los Angeles area,”Journal of
the Air Pollution Control Association39154-163.
Taylor, C. (2001) personal communication.
49
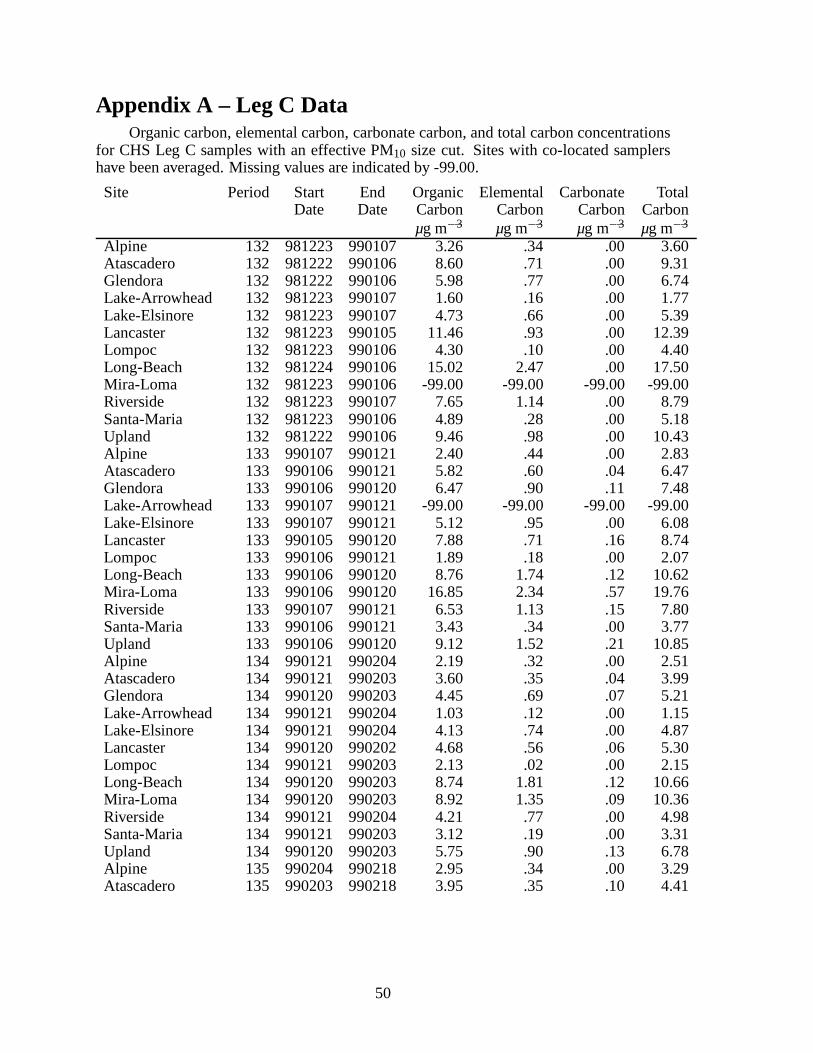
Appendix A – Leg C DataOrganic carbon, elemental carbon, carbonate carbon, and total carbon concentrations
for CHS Leg C samples with an effective PM10 size cut. Sites with co-located samplershave been averaged. Missing values are indicated by -99.00.
Site Period Start End Organic Elemental Carbonate TotalDate Date Carbon Carbon Carbon Carbon
µg m�3 µg m�3 µg m�3 µg m�3
Alpine 132 981223 990107 3.26 .34 .00 3.60Atascadero 132 981222 990106 8.60 .71 .00 9.31Glendora 132 981222 990106 5.98 .77 .00 6.74Lake-Arrowhead 132 981223 990107 1.60 .16 .00 1.77Lake-Elsinore 132 981223 990107 4.73 .66 .00 5.39Lancaster 132 981223 990105 11.46 .93 .00 12.39Lompoc 132 981223 990106 4.30 .10 .00 4.40Long-Beach 132 981224 990106 15.02 2.47 .00 17.50Mira-Loma 132 981223 990106 -99.00 -99.00 -99.00 -99.00Riverside 132 981223 990107 7.65 1.14 .00 8.79Santa-Maria 132 981223 990106 4.89 .28 .00 5.18Upland 132 981222 990106 9.46 .98 .00 10.43Alpine 133 990107 990121 2.40 .44 .00 2.83Atascadero 133 990106 990121 5.82 .60 .04 6.47Glendora 133 990106 990120 6.47 .90 .11 7.48Lake-Arrowhead 133 990107 990121 -99.00 -99.00 -99.00 -99.00Lake-Elsinore 133 990107 990121 5.12 .95 .00 6.08Lancaster 133 990105 990120 7.88 .71 .16 8.74Lompoc 133 990106 990121 1.89 .18 .00 2.07Long-Beach 133 990106 990120 8.76 1.74 .12 10.62Mira-Loma 133 990106 990120 16.85 2.34 .57 19.76Riverside 133 990107 990121 6.53 1.13 .15 7.80Santa-Maria 133 990106 990121 3.43 .34 .00 3.77Upland 133 990106 990120 9.12 1.52 .21 10.85Alpine 134 990121 990204 2.19 .32 .00 2.51Atascadero 134 990121 990203 3.60 .35 .04 3.99Glendora 134 990120 990203 4.45 .69 .07 5.21Lake-Arrowhead 134 990121 990204 1.03 .12 .00 1.15Lake-Elsinore 134 990121 990204 4.13 .74 .00 4.87Lancaster 134 990120 990202 4.68 .56 .06 5.30Lompoc 134 990121 990203 2.13 .02 .00 2.15Long-Beach 134 990120 990203 8.74 1.81 .12 10.66Mira-Loma 134 990120 990203 8.92 1.35 .09 10.36Riverside 134 990121 990204 4.21 .77 .00 4.98Santa-Maria 134 990121 990203 3.12 .19 .00 3.31Upland 134 990120 990203 5.75 .90 .13 6.78Alpine 135 990204 990218 2.95 .34 .00 3.29Atascadero 135 990203 990218 3.95 .35 .10 4.41
50
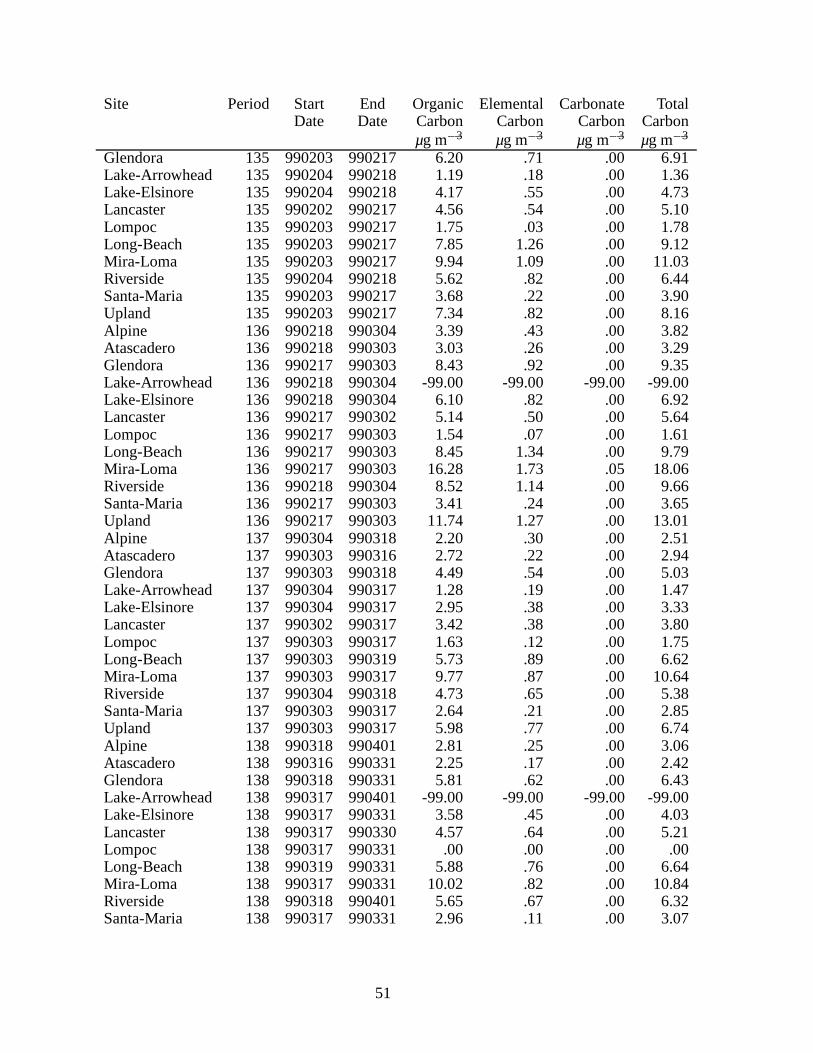
Site Period Start End Organic Elemental Carbonate TotalDate Date Carbon Carbon Carbon Carbon
µg m�3 µg m�3 µg m�3 µg m�3
Glendora 135 990203 990217 6.20 .71 .00 6.91Lake-Arrowhead 135 990204 990218 1.19 .18 .00 1.36Lake-Elsinore 135 990204 990218 4.17 .55 .00 4.73Lancaster 135 990202 990217 4.56 .54 .00 5.10Lompoc 135 990203 990217 1.75 .03 .00 1.78Long-Beach 135 990203 990217 7.85 1.26 .00 9.12Mira-Loma 135 990203 990217 9.94 1.09 .00 11.03Riverside 135 990204 990218 5.62 .82 .00 6.44Santa-Maria 135 990203 990217 3.68 .22 .00 3.90Upland 135 990203 990217 7.34 .82 .00 8.16Alpine 136 990218 990304 3.39 .43 .00 3.82Atascadero 136 990218 990303 3.03 .26 .00 3.29Glendora 136 990217 990303 8.43 .92 .00 9.35Lake-Arrowhead 136 990218 990304 -99.00 -99.00 -99.00 -99.00Lake-Elsinore 136 990218 990304 6.10 .82 .00 6.92Lancaster 136 990217 990302 5.14 .50 .00 5.64Lompoc 136 990217 990303 1.54 .07 .00 1.61Long-Beach 136 990217 990303 8.45 1.34 .00 9.79Mira-Loma 136 990217 990303 16.28 1.73 .05 18.06Riverside 136 990218 990304 8.52 1.14 .00 9.66Santa-Maria 136 990217 990303 3.41 .24 .00 3.65Upland 136 990217 990303 11.74 1.27 .00 13.01Alpine 137 990304 990318 2.20 .30 .00 2.51Atascadero 137 990303 990316 2.72 .22 .00 2.94Glendora 137 990303 990318 4.49 .54 .00 5.03Lake-Arrowhead 137 990304 990317 1.28 .19 .00 1.47Lake-Elsinore 137 990304 990317 2.95 .38 .00 3.33Lancaster 137 990302 990317 3.42 .38 .00 3.80Lompoc 137 990303 990317 1.63 .12 .00 1.75Long-Beach 137 990303 990319 5.73 .89 .00 6.62Mira-Loma 137 990303 990317 9.77 .87 .00 10.64Riverside 137 990304 990318 4.73 .65 .00 5.38Santa-Maria 137 990303 990317 2.64 .21 .00 2.85Upland 137 990303 990317 5.98 .77 .00 6.74Alpine 138 990318 990401 2.81 .25 .00 3.06Atascadero 138 990316 990331 2.25 .17 .00 2.42Glendora 138 990318 990331 5.81 .62 .00 6.43Lake-Arrowhead 138 990317 990401 -99.00 -99.00 -99.00 -99.00Lake-Elsinore 138 990317 990331 3.58 .45 .00 4.03Lancaster 138 990317 990330 4.57 .64 .00 5.21Lompoc 138 990317 990331 .00 .00 .00 .00Long-Beach 138 990319 990331 5.88 .76 .00 6.64Mira-Loma 138 990317 990331 10.02 .82 .00 10.84Riverside 138 990318 990401 5.65 .67 .00 6.32Santa-Maria 138 990317 990331 2.96 .11 .00 3.07
51
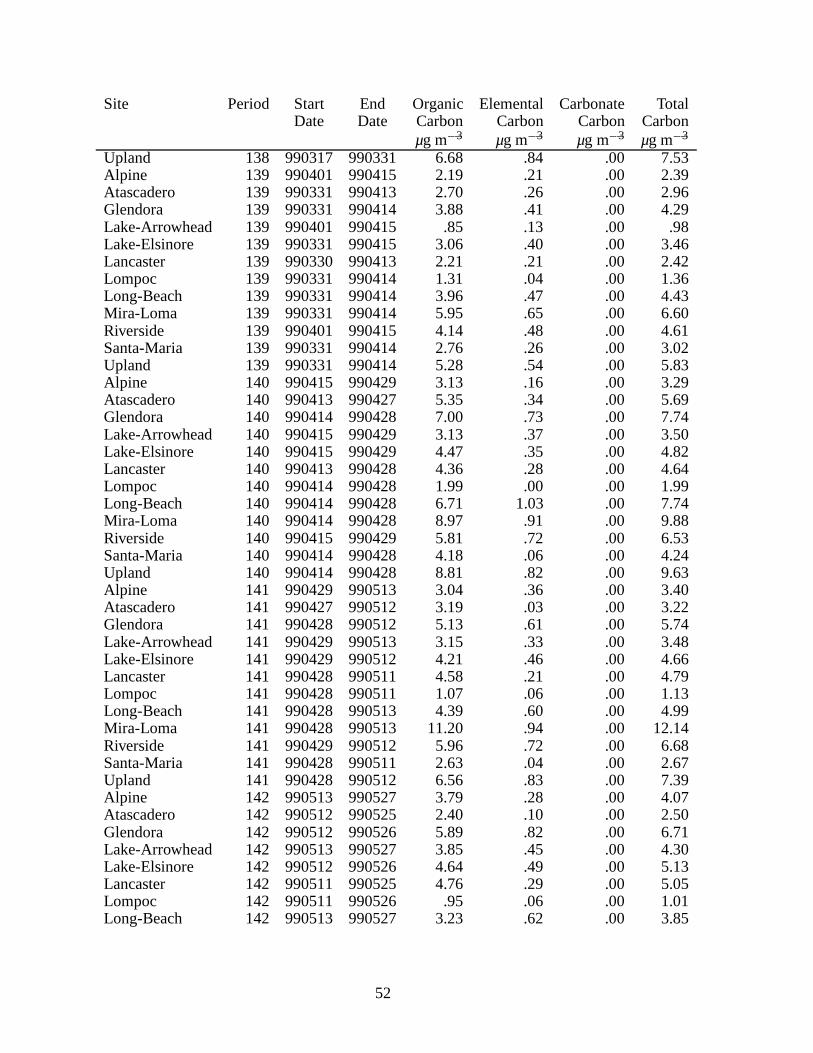
Site Period Start End Organic Elemental Carbonate TotalDate Date Carbon Carbon Carbon Carbon
µg m�3 µg m�3 µg m�3 µg m�3
Upland 138 990317 990331 6.68 .84 .00 7.53Alpine 139 990401 990415 2.19 .21 .00 2.39Atascadero 139 990331 990413 2.70 .26 .00 2.96Glendora 139 990331 990414 3.88 .41 .00 4.29Lake-Arrowhead 139 990401 990415 .85 .13 .00 .98Lake-Elsinore 139 990331 990415 3.06 .40 .00 3.46Lancaster 139 990330 990413 2.21 .21 .00 2.42Lompoc 139 990331 990414 1.31 .04 .00 1.36Long-Beach 139 990331 990414 3.96 .47 .00 4.43Mira-Loma 139 990331 990414 5.95 .65 .00 6.60Riverside 139 990401 990415 4.14 .48 .00 4.61Santa-Maria 139 990331 990414 2.76 .26 .00 3.02Upland 139 990331 990414 5.28 .54 .00 5.83Alpine 140 990415 990429 3.13 .16 .00 3.29Atascadero 140 990413 990427 5.35 .34 .00 5.69Glendora 140 990414 990428 7.00 .73 .00 7.74Lake-Arrowhead 140 990415 990429 3.13 .37 .00 3.50Lake-Elsinore 140 990415 990429 4.47 .35 .00 4.82Lancaster 140 990413 990428 4.36 .28 .00 4.64Lompoc 140 990414 990428 1.99 .00 .00 1.99Long-Beach 140 990414 990428 6.71 1.03 .00 7.74Mira-Loma 140 990414 990428 8.97 .91 .00 9.88Riverside 140 990415 990429 5.81 .72 .00 6.53Santa-Maria 140 990414 990428 4.18 .06 .00 4.24Upland 140 990414 990428 8.81 .82 .00 9.63Alpine 141 990429 990513 3.04 .36 .00 3.40Atascadero 141 990427 990512 3.19 .03 .00 3.22Glendora 141 990428 990512 5.13 .61 .00 5.74Lake-Arrowhead 141 990429 990513 3.15 .33 .00 3.48Lake-Elsinore 141 990429 990512 4.21 .46 .00 4.66Lancaster 141 990428 990511 4.58 .21 .00 4.79Lompoc 141 990428 990511 1.07 .06 .00 1.13Long-Beach 141 990428 990513 4.39 .60 .00 4.99Mira-Loma 141 990428 990513 11.20 .94 .00 12.14Riverside 141 990429 990512 5.96 .72 .00 6.68Santa-Maria 141 990428 990511 2.63 .04 .00 2.67Upland 141 990428 990512 6.56 .83 .00 7.39Alpine 142 990513 990527 3.79 .28 .00 4.07Atascadero 142 990512 990525 2.40 .10 .00 2.50Glendora 142 990512 990526 5.89 .82 .00 6.71Lake-Arrowhead 142 990513 990527 3.85 .45 .00 4.30Lake-Elsinore 142 990512 990526 4.64 .49 .00 5.13Lancaster 142 990511 990525 4.76 .29 .00 5.05Lompoc 142 990511 990526 .95 .06 .00 1.01Long-Beach 142 990513 990527 3.23 .62 .00 3.85
52
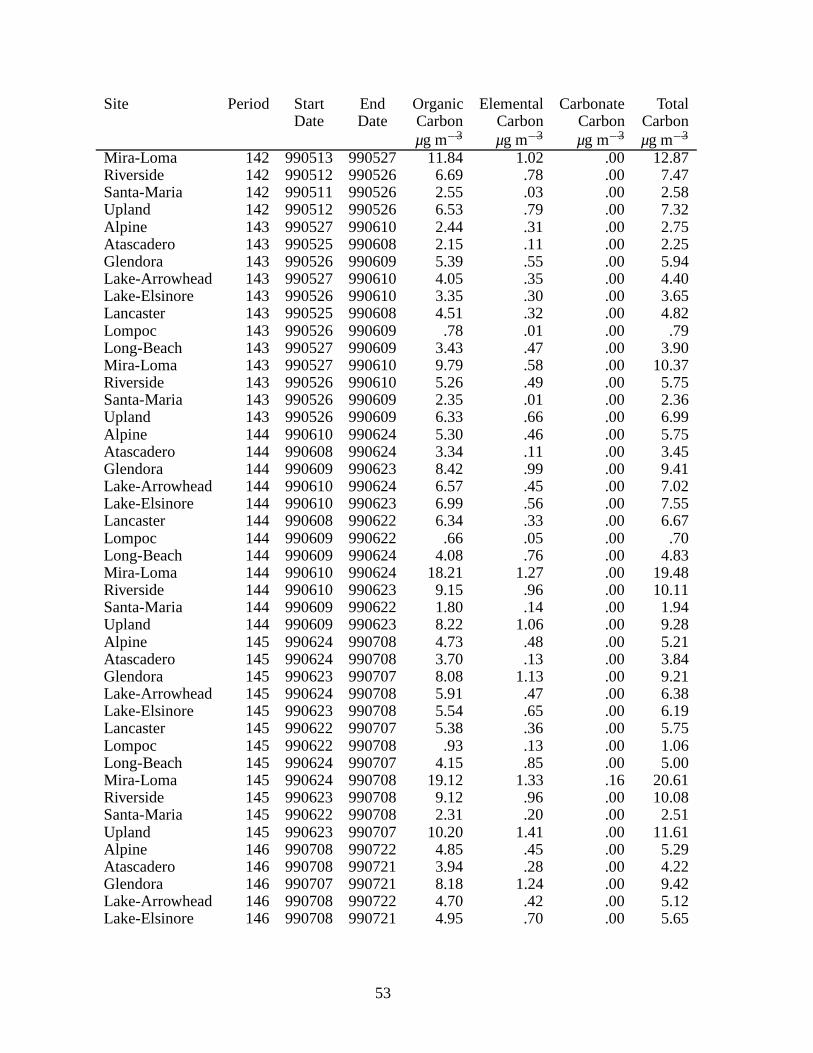
Site Period Start End Organic Elemental Carbonate TotalDate Date Carbon Carbon Carbon Carbon
µg m�3 µg m�3 µg m�3 µg m�3
Mira-Loma 142 990513 990527 11.84 1.02 .00 12.87Riverside 142 990512 990526 6.69 .78 .00 7.47Santa-Maria 142 990511 990526 2.55 .03 .00 2.58Upland 142 990512 990526 6.53 .79 .00 7.32Alpine 143 990527 990610 2.44 .31 .00 2.75Atascadero 143 990525 990608 2.15 .11 .00 2.25Glendora 143 990526 990609 5.39 .55 .00 5.94Lake-Arrowhead 143 990527 990610 4.05 .35 .00 4.40Lake-Elsinore 143 990526 990610 3.35 .30 .00 3.65Lancaster 143 990525 990608 4.51 .32 .00 4.82Lompoc 143 990526 990609 .78 .01 .00 .79Long-Beach 143 990527 990609 3.43 .47 .00 3.90Mira-Loma 143 990527 990610 9.79 .58 .00 10.37Riverside 143 990526 990610 5.26 .49 .00 5.75Santa-Maria 143 990526 990609 2.35 .01 .00 2.36Upland 143 990526 990609 6.33 .66 .00 6.99Alpine 144 990610 990624 5.30 .46 .00 5.75Atascadero 144 990608 990624 3.34 .11 .00 3.45Glendora 144 990609 990623 8.42 .99 .00 9.41Lake-Arrowhead 144 990610 990624 6.57 .45 .00 7.02Lake-Elsinore 144 990610 990623 6.99 .56 .00 7.55Lancaster 144 990608 990622 6.34 .33 .00 6.67Lompoc 144 990609 990622 .66 .05 .00 .70Long-Beach 144 990609 990624 4.08 .76 .00 4.83Mira-Loma 144 990610 990624 18.21 1.27 .00 19.48Riverside 144 990610 990623 9.15 .96 .00 10.11Santa-Maria 144 990609 990622 1.80 .14 .00 1.94Upland 144 990609 990623 8.22 1.06 .00 9.28Alpine 145 990624 990708 4.73 .48 .00 5.21Atascadero 145 990624 990708 3.70 .13 .00 3.84Glendora 145 990623 990707 8.08 1.13 .00 9.21Lake-Arrowhead 145 990624 990708 5.91 .47 .00 6.38Lake-Elsinore 145 990623 990708 5.54 .65 .00 6.19Lancaster 145 990622 990707 5.38 .36 .00 5.75Lompoc 145 990622 990708 .93 .13 .00 1.06Long-Beach 145 990624 990707 4.15 .85 .00 5.00Mira-Loma 145 990624 990708 19.12 1.33 .16 20.61Riverside 145 990623 990708 9.12 .96 .00 10.08Santa-Maria 145 990622 990708 2.31 .20 .00 2.51Upland 145 990623 990707 10.20 1.41 .00 11.61Alpine 146 990708 990722 4.85 .45 .00 5.29Atascadero 146 990708 990721 3.94 .28 .00 4.22Glendora 146 990707 990721 8.18 1.24 .00 9.42Lake-Arrowhead 146 990708 990722 4.70 .42 .00 5.12Lake-Elsinore 146 990708 990721 4.95 .70 .00 5.65
53
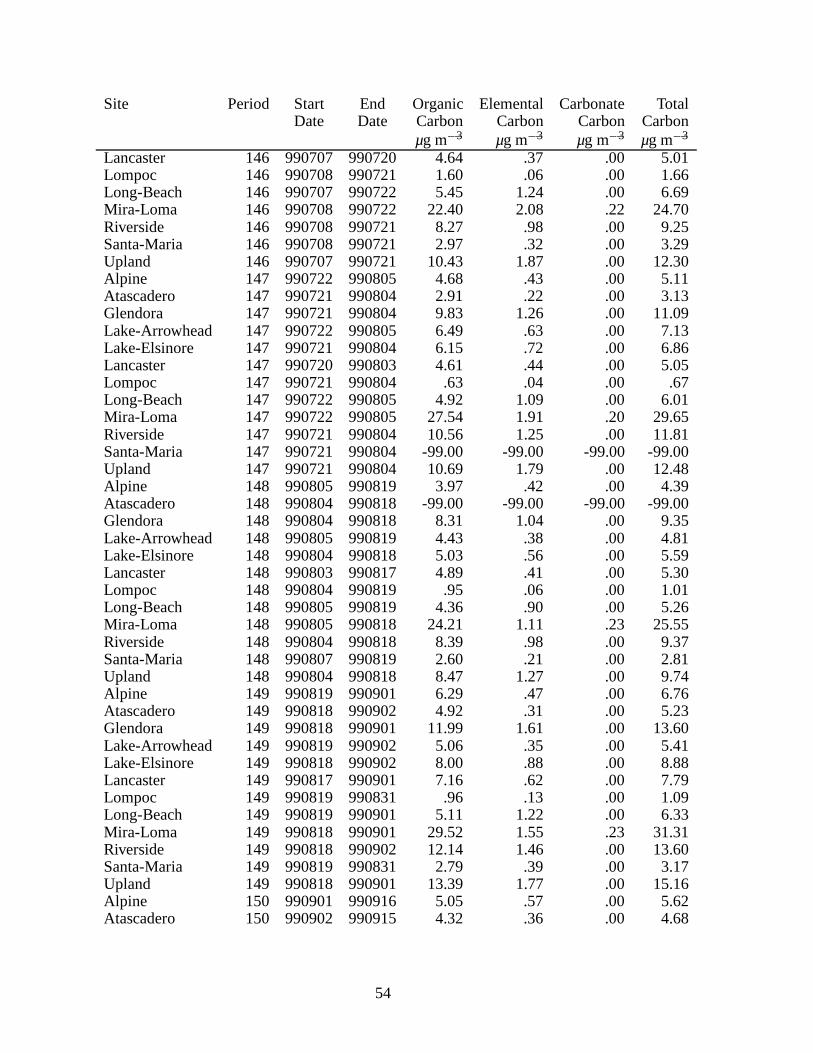
Site Period Start End Organic Elemental Carbonate TotalDate Date Carbon Carbon Carbon Carbon
µg m�3 µg m�3 µg m�3 µg m�3
Lancaster 146 990707 990720 4.64 .37 .00 5.01Lompoc 146 990708 990721 1.60 .06 .00 1.66Long-Beach 146 990707 990722 5.45 1.24 .00 6.69Mira-Loma 146 990708 990722 22.40 2.08 .22 24.70Riverside 146 990708 990721 8.27 .98 .00 9.25Santa-Maria 146 990708 990721 2.97 .32 .00 3.29Upland 146 990707 990721 10.43 1.87 .00 12.30Alpine 147 990722 990805 4.68 .43 .00 5.11Atascadero 147 990721 990804 2.91 .22 .00 3.13Glendora 147 990721 990804 9.83 1.26 .00 11.09Lake-Arrowhead 147 990722 990805 6.49 .63 .00 7.13Lake-Elsinore 147 990721 990804 6.15 .72 .00 6.86Lancaster 147 990720 990803 4.61 .44 .00 5.05Lompoc 147 990721 990804 .63 .04 .00 .67Long-Beach 147 990722 990805 4.92 1.09 .00 6.01Mira-Loma 147 990722 990805 27.54 1.91 .20 29.65Riverside 147 990721 990804 10.56 1.25 .00 11.81Santa-Maria 147 990721 990804 -99.00 -99.00 -99.00 -99.00Upland 147 990721 990804 10.69 1.79 .00 12.48Alpine 148 990805 990819 3.97 .42 .00 4.39Atascadero 148 990804 990818 -99.00 -99.00 -99.00 -99.00Glendora 148 990804 990818 8.31 1.04 .00 9.35Lake-Arrowhead 148 990805 990819 4.43 .38 .00 4.81Lake-Elsinore 148 990804 990818 5.03 .56 .00 5.59Lancaster 148 990803 990817 4.89 .41 .00 5.30Lompoc 148 990804 990819 .95 .06 .00 1.01Long-Beach 148 990805 990819 4.36 .90 .00 5.26Mira-Loma 148 990805 990818 24.21 1.11 .23 25.55Riverside 148 990804 990818 8.39 .98 .00 9.37Santa-Maria 148 990807 990819 2.60 .21 .00 2.81Upland 148 990804 990818 8.47 1.27 .00 9.74Alpine 149 990819 990901 6.29 .47 .00 6.76Atascadero 149 990818 990902 4.92 .31 .00 5.23Glendora 149 990818 990901 11.99 1.61 .00 13.60Lake-Arrowhead 149 990819 990902 5.06 .35 .00 5.41Lake-Elsinore 149 990818 990902 8.00 .88 .00 8.88Lancaster 149 990817 990901 7.16 .62 .00 7.79Lompoc 149 990819 990831 .96 .13 .00 1.09Long-Beach 149 990819 990901 5.11 1.22 .00 6.33Mira-Loma 149 990818 990901 29.52 1.55 .23 31.31Riverside 149 990818 990902 12.14 1.46 .00 13.60Santa-Maria 149 990819 990831 2.79 .39 .00 3.17Upland 149 990818 990901 13.39 1.77 .00 15.16Alpine 150 990901 990916 5.05 .57 .00 5.62Atascadero 150 990902 990915 4.32 .36 .00 4.68
54
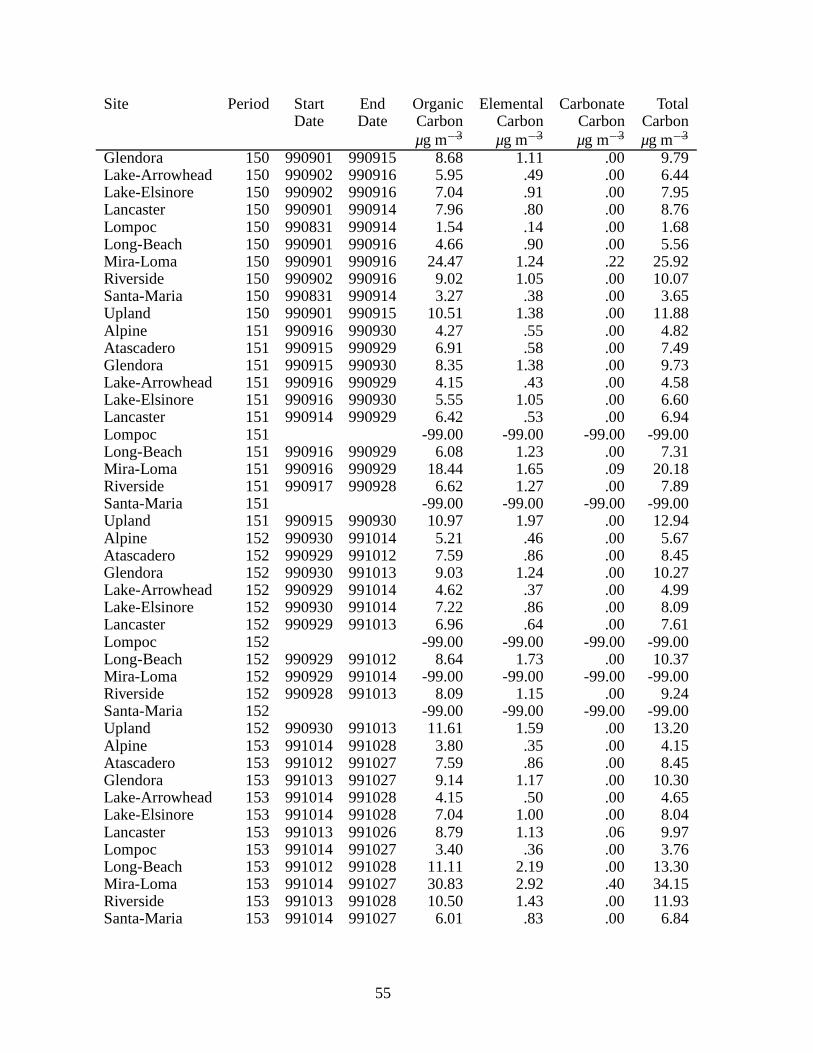
Site Period Start End Organic Elemental Carbonate TotalDate Date Carbon Carbon Carbon Carbon
µg m�3 µg m�3 µg m�3 µg m�3
Glendora 150 990901 990915 8.68 1.11 .00 9.79Lake-Arrowhead 150 990902 990916 5.95 .49 .00 6.44Lake-Elsinore 150 990902 990916 7.04 .91 .00 7.95Lancaster 150 990901 990914 7.96 .80 .00 8.76Lompoc 150 990831 990914 1.54 .14 .00 1.68Long-Beach 150 990901 990916 4.66 .90 .00 5.56Mira-Loma 150 990901 990916 24.47 1.24 .22 25.92Riverside 150 990902 990916 9.02 1.05 .00 10.07Santa-Maria 150 990831 990914 3.27 .38 .00 3.65Upland 150 990901 990915 10.51 1.38 .00 11.88Alpine 151 990916 990930 4.27 .55 .00 4.82Atascadero 151 990915 990929 6.91 .58 .00 7.49Glendora 151 990915 990930 8.35 1.38 .00 9.73Lake-Arrowhead 151 990916 990929 4.15 .43 .00 4.58Lake-Elsinore 151 990916 990930 5.55 1.05 .00 6.60Lancaster 151 990914 990929 6.42 .53 .00 6.94Lompoc 151 -99.00 -99.00 -99.00 -99.00Long-Beach 151 990916 990929 6.08 1.23 .00 7.31Mira-Loma 151 990916 990929 18.44 1.65 .09 20.18Riverside 151 990917 990928 6.62 1.27 .00 7.89Santa-Maria 151 -99.00 -99.00 -99.00 -99.00Upland 151 990915 990930 10.97 1.97 .00 12.94Alpine 152 990930 991014 5.21 .46 .00 5.67Atascadero 152 990929 991012 7.59 .86 .00 8.45Glendora 152 990930 991013 9.03 1.24 .00 10.27Lake-Arrowhead 152 990929 991014 4.62 .37 .00 4.99Lake-Elsinore 152 990930 991014 7.22 .86 .00 8.09Lancaster 152 990929 991013 6.96 .64 .00 7.61Lompoc 152 -99.00 -99.00 -99.00 -99.00Long-Beach 152 990929 991012 8.64 1.73 .00 10.37Mira-Loma 152 990929 991014 -99.00 -99.00 -99.00 -99.00Riverside 152 990928 991013 8.09 1.15 .00 9.24Santa-Maria 152 -99.00 -99.00 -99.00 -99.00Upland 152 990930 991013 11.61 1.59 .00 13.20Alpine 153 991014 991028 3.80 .35 .00 4.15Atascadero 153 991012 991027 7.59 .86 .00 8.45Glendora 153 991013 991027 9.14 1.17 .00 10.30Lake-Arrowhead 153 991014 991028 4.15 .50 .00 4.65Lake-Elsinore 153 991014 991028 7.04 1.00 .00 8.04Lancaster 153 991013 991026 8.79 1.13 .06 9.97Lompoc 153 991014 991027 3.40 .36 .00 3.76Long-Beach 153 991012 991028 11.11 2.19 .00 13.30Mira-Loma 153 991014 991027 30.83 2.92 .40 34.15Riverside 153 991013 991028 10.50 1.43 .00 11.93Santa-Maria 153 991014 991027 6.01 .83 .00 6.84
55
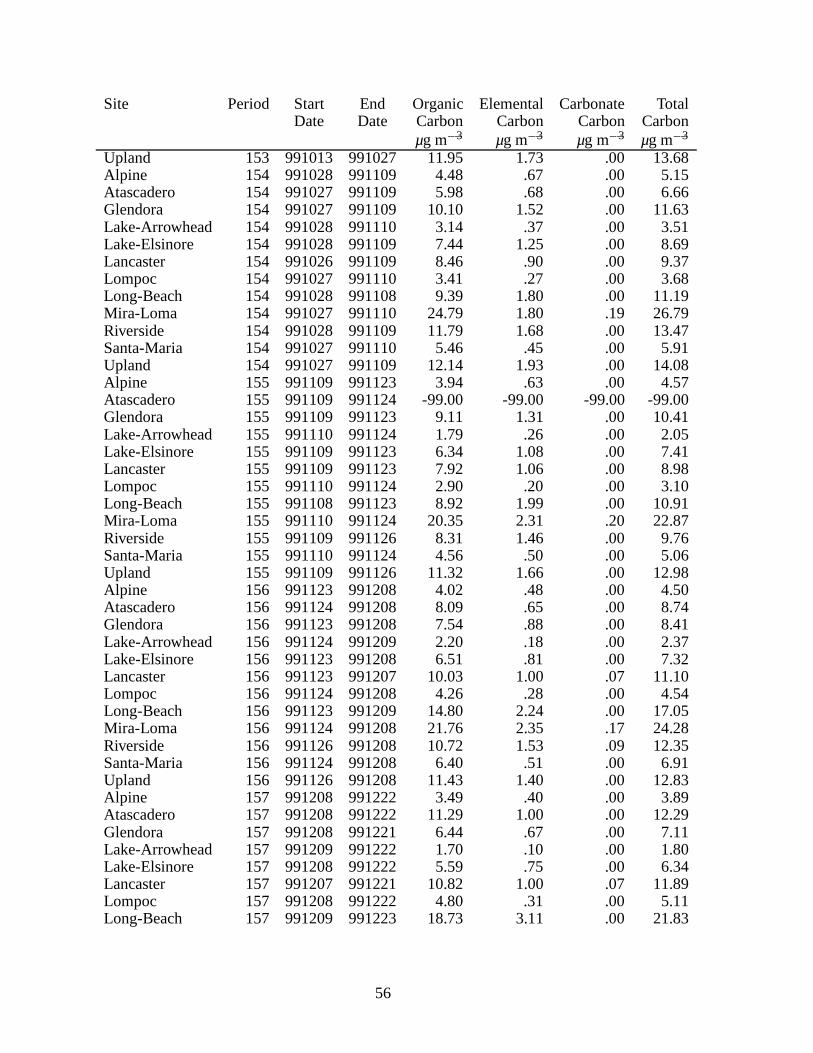
Site Period Start End Organic Elemental Carbonate TotalDate Date Carbon Carbon Carbon Carbon
µg m�3 µg m�3 µg m�3 µg m�3
Upland 153 991013 991027 11.95 1.73 .00 13.68Alpine 154 991028 991109 4.48 .67 .00 5.15Atascadero 154 991027 991109 5.98 .68 .00 6.66Glendora 154 991027 991109 10.10 1.52 .00 11.63Lake-Arrowhead 154 991028 991110 3.14 .37 .00 3.51Lake-Elsinore 154 991028 991109 7.44 1.25 .00 8.69Lancaster 154 991026 991109 8.46 .90 .00 9.37Lompoc 154 991027 991110 3.41 .27 .00 3.68Long-Beach 154 991028 991108 9.39 1.80 .00 11.19Mira-Loma 154 991027 991110 24.79 1.80 .19 26.79Riverside 154 991028 991109 11.79 1.68 .00 13.47Santa-Maria 154 991027 991110 5.46 .45 .00 5.91Upland 154 991027 991109 12.14 1.93 .00 14.08Alpine 155 991109 991123 3.94 .63 .00 4.57Atascadero 155 991109 991124 -99.00 -99.00 -99.00 -99.00Glendora 155 991109 991123 9.11 1.31 .00 10.41Lake-Arrowhead 155 991110 991124 1.79 .26 .00 2.05Lake-Elsinore 155 991109 991123 6.34 1.08 .00 7.41Lancaster 155 991109 991123 7.92 1.06 .00 8.98Lompoc 155 991110 991124 2.90 .20 .00 3.10Long-Beach 155 991108 991123 8.92 1.99 .00 10.91Mira-Loma 155 991110 991124 20.35 2.31 .20 22.87Riverside 155 991109 991126 8.31 1.46 .00 9.76Santa-Maria 155 991110 991124 4.56 .50 .00 5.06Upland 155 991109 991126 11.32 1.66 .00 12.98Alpine 156 991123 991208 4.02 .48 .00 4.50Atascadero 156 991124 991208 8.09 .65 .00 8.74Glendora 156 991123 991208 7.54 .88 .00 8.41Lake-Arrowhead 156 991124 991209 2.20 .18 .00 2.37Lake-Elsinore 156 991123 991208 6.51 .81 .00 7.32Lancaster 156 991123 991207 10.03 1.00 .07 11.10Lompoc 156 991124 991208 4.26 .28 .00 4.54Long-Beach 156 991123 991209 14.80 2.24 .00 17.05Mira-Loma 156 991124 991208 21.76 2.35 .17 24.28Riverside 156 991126 991208 10.72 1.53 .09 12.35Santa-Maria 156 991124 991208 6.40 .51 .00 6.91Upland 156 991126 991208 11.43 1.40 .00 12.83Alpine 157 991208 991222 3.49 .40 .00 3.89Atascadero 157 991208 991222 11.29 1.00 .00 12.29Glendora 157 991208 991221 6.44 .67 .00 7.11Lake-Arrowhead 157 991209 991222 1.70 .10 .00 1.80Lake-Elsinore 157 991208 991222 5.59 .75 .00 6.34Lancaster 157 991207 991221 10.82 1.00 .07 11.89Lompoc 157 991208 991222 4.80 .31 .00 5.11Long-Beach 157 991209 991223 18.73 3.11 .00 21.83
56
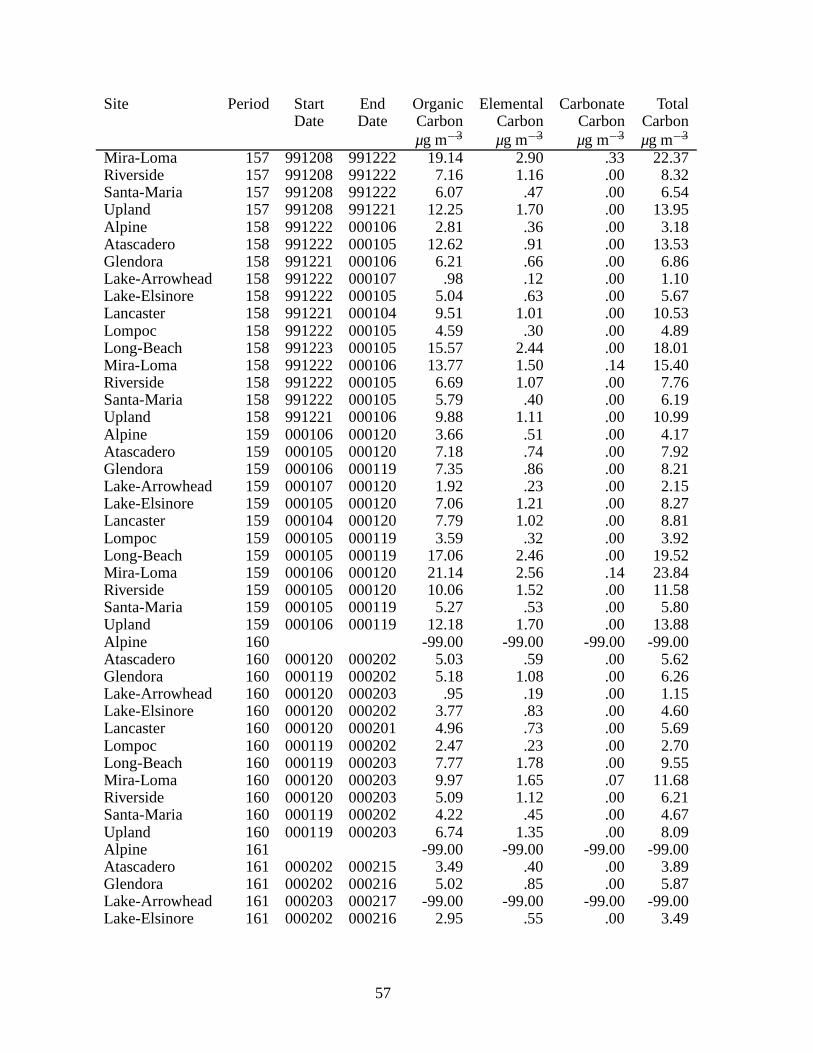
Site Period Start End Organic Elemental Carbonate TotalDate Date Carbon Carbon Carbon Carbon
µg m�3 µg m�3 µg m�3 µg m�3
Mira-Loma 157 991208 991222 19.14 2.90 .33 22.37Riverside 157 991208 991222 7.16 1.16 .00 8.32Santa-Maria 157 991208 991222 6.07 .47 .00 6.54Upland 157 991208 991221 12.25 1.70 .00 13.95Alpine 158 991222 000106 2.81 .36 .00 3.18Atascadero 158 991222 000105 12.62 .91 .00 13.53Glendora 158 991221 000106 6.21 .66 .00 6.86Lake-Arrowhead 158 991222 000107 .98 .12 .00 1.10Lake-Elsinore 158 991222 000105 5.04 .63 .00 5.67Lancaster 158 991221 000104 9.51 1.01 .00 10.53Lompoc 158 991222 000105 4.59 .30 .00 4.89Long-Beach 158 991223 000105 15.57 2.44 .00 18.01Mira-Loma 158 991222 000106 13.77 1.50 .14 15.40Riverside 158 991222 000105 6.69 1.07 .00 7.76Santa-Maria 158 991222 000105 5.79 .40 .00 6.19Upland 158 991221 000106 9.88 1.11 .00 10.99Alpine 159 000106 000120 3.66 .51 .00 4.17Atascadero 159 000105 000120 7.18 .74 .00 7.92Glendora 159 000106 000119 7.35 .86 .00 8.21Lake-Arrowhead 159 000107 000120 1.92 .23 .00 2.15Lake-Elsinore 159 000105 000120 7.06 1.21 .00 8.27Lancaster 159 000104 000120 7.79 1.02 .00 8.81Lompoc 159 000105 000119 3.59 .32 .00 3.92Long-Beach 159 000105 000119 17.06 2.46 .00 19.52Mira-Loma 159 000106 000120 21.14 2.56 .14 23.84Riverside 159 000105 000120 10.06 1.52 .00 11.58Santa-Maria 159 000105 000119 5.27 .53 .00 5.80Upland 159 000106 000119 12.18 1.70 .00 13.88Alpine 160 -99.00 -99.00 -99.00 -99.00Atascadero 160 000120 000202 5.03 .59 .00 5.62Glendora 160 000119 000202 5.18 1.08 .00 6.26Lake-Arrowhead 160 000120 000203 .95 .19 .00 1.15Lake-Elsinore 160 000120 000202 3.77 .83 .00 4.60Lancaster 160 000120 000201 4.96 .73 .00 5.69Lompoc 160 000119 000202 2.47 .23 .00 2.70Long-Beach 160 000119 000203 7.77 1.78 .00 9.55Mira-Loma 160 000120 000203 9.97 1.65 .07 11.68Riverside 160 000120 000203 5.09 1.12 .00 6.21Santa-Maria 160 000119 000202 4.22 .45 .00 4.67Upland 160 000119 000203 6.74 1.35 .00 8.09Alpine 161 -99.00 -99.00 -99.00 -99.00Atascadero 161 000202 000215 3.49 .40 .00 3.89Glendora 161 000202 000216 5.02 .85 .00 5.87Lake-Arrowhead 161 000203 000217 -99.00 -99.00 -99.00 -99.00Lake-Elsinore 161 000202 000216 2.95 .55 .00 3.49
57
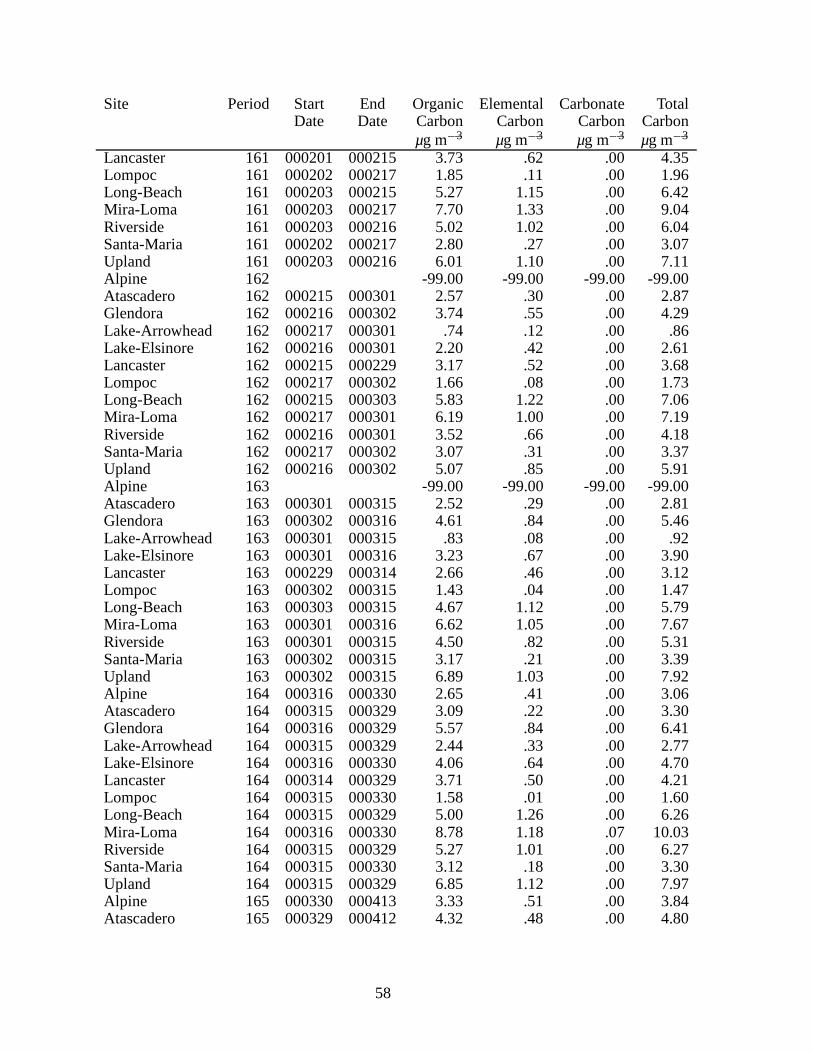
Site Period Start End Organic Elemental Carbonate TotalDate Date Carbon Carbon Carbon Carbon
µg m�3 µg m�3 µg m�3 µg m�3
Lancaster 161 000201 000215 3.73 .62 .00 4.35Lompoc 161 000202 000217 1.85 .11 .00 1.96Long-Beach 161 000203 000215 5.27 1.15 .00 6.42Mira-Loma 161 000203 000217 7.70 1.33 .00 9.04Riverside 161 000203 000216 5.02 1.02 .00 6.04Santa-Maria 161 000202 000217 2.80 .27 .00 3.07Upland 161 000203 000216 6.01 1.10 .00 7.11Alpine 162 -99.00 -99.00 -99.00 -99.00Atascadero 162 000215 000301 2.57 .30 .00 2.87Glendora 162 000216 000302 3.74 .55 .00 4.29Lake-Arrowhead 162 000217 000301 .74 .12 .00 .86Lake-Elsinore 162 000216 000301 2.20 .42 .00 2.61Lancaster 162 000215 000229 3.17 .52 .00 3.68Lompoc 162 000217 000302 1.66 .08 .00 1.73Long-Beach 162 000215 000303 5.83 1.22 .00 7.06Mira-Loma 162 000217 000301 6.19 1.00 .00 7.19Riverside 162 000216 000301 3.52 .66 .00 4.18Santa-Maria 162 000217 000302 3.07 .31 .00 3.37Upland 162 000216 000302 5.07 .85 .00 5.91Alpine 163 -99.00 -99.00 -99.00 -99.00Atascadero 163 000301 000315 2.52 .29 .00 2.81Glendora 163 000302 000316 4.61 .84 .00 5.46Lake-Arrowhead 163 000301 000315 .83 .08 .00 .92Lake-Elsinore 163 000301 000316 3.23 .67 .00 3.90Lancaster 163 000229 000314 2.66 .46 .00 3.12Lompoc 163 000302 000315 1.43 .04 .00 1.47Long-Beach 163 000303 000315 4.67 1.12 .00 5.79Mira-Loma 163 000301 000316 6.62 1.05 .00 7.67Riverside 163 000301 000315 4.50 .82 .00 5.31Santa-Maria 163 000302 000315 3.17 .21 .00 3.39Upland 163 000302 000315 6.89 1.03 .00 7.92Alpine 164 000316 000330 2.65 .41 .00 3.06Atascadero 164 000315 000329 3.09 .22 .00 3.30Glendora 164 000316 000329 5.57 .84 .00 6.41Lake-Arrowhead 164 000315 000329 2.44 .33 .00 2.77Lake-Elsinore 164 000316 000330 4.06 .64 .00 4.70Lancaster 164 000314 000329 3.71 .50 .00 4.21Lompoc 164 000315 000330 1.58 .01 .00 1.60Long-Beach 164 000315 000329 5.00 1.26 .00 6.26Mira-Loma 164 000316 000330 8.78 1.18 .07 10.03Riverside 164 000315 000329 5.27 1.01 .00 6.27Santa-Maria 164 000315 000330 3.12 .18 .00 3.30Upland 164 000315 000329 6.85 1.12 .00 7.97Alpine 165 000330 000413 3.33 .51 .00 3.84Atascadero 165 000329 000412 4.32 .48 .00 4.80
58
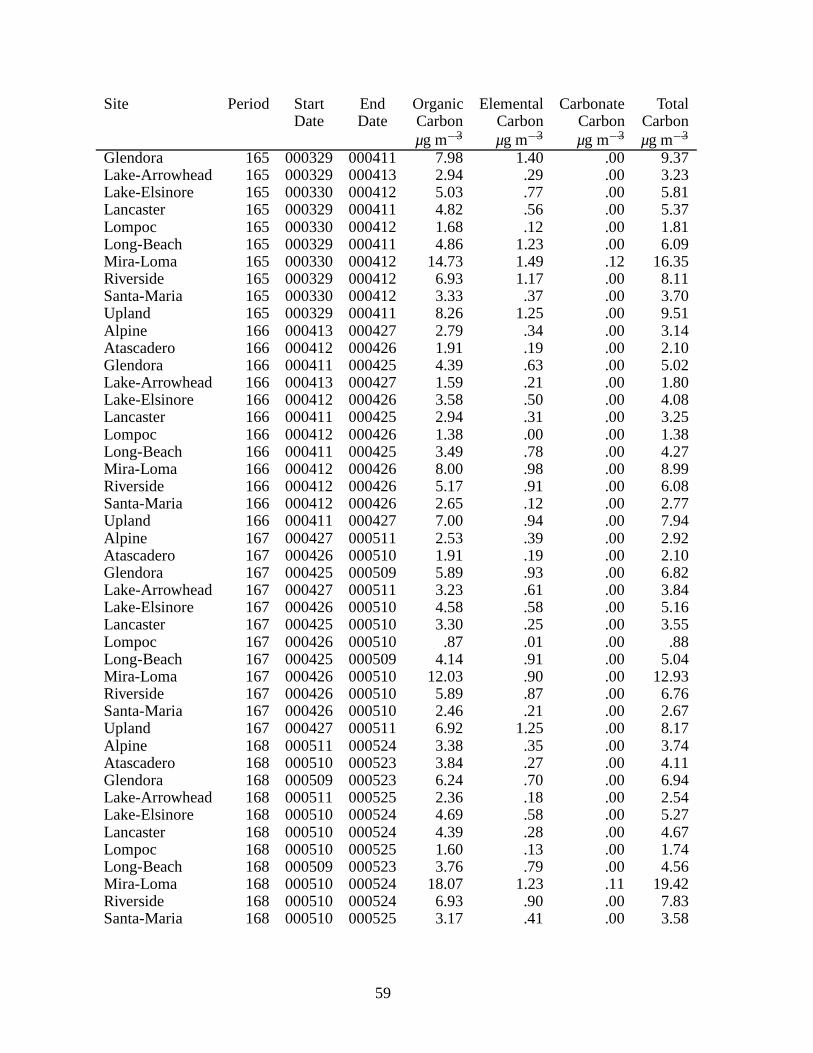
Site Period Start End Organic Elemental Carbonate TotalDate Date Carbon Carbon Carbon Carbon
µg m�3 µg m�3 µg m�3 µg m�3
Glendora 165 000329 000411 7.98 1.40 .00 9.37Lake-Arrowhead 165 000329 000413 2.94 .29 .00 3.23Lake-Elsinore 165 000330 000412 5.03 .77 .00 5.81Lancaster 165 000329 000411 4.82 .56 .00 5.37Lompoc 165 000330 000412 1.68 .12 .00 1.81Long-Beach 165 000329 000411 4.86 1.23 .00 6.09Mira-Loma 165 000330 000412 14.73 1.49 .12 16.35Riverside 165 000329 000412 6.93 1.17 .00 8.11Santa-Maria 165 000330 000412 3.33 .37 .00 3.70Upland 165 000329 000411 8.26 1.25 .00 9.51Alpine 166 000413 000427 2.79 .34 .00 3.14Atascadero 166 000412 000426 1.91 .19 .00 2.10Glendora 166 000411 000425 4.39 .63 .00 5.02Lake-Arrowhead 166 000413 000427 1.59 .21 .00 1.80Lake-Elsinore 166 000412 000426 3.58 .50 .00 4.08Lancaster 166 000411 000425 2.94 .31 .00 3.25Lompoc 166 000412 000426 1.38 .00 .00 1.38Long-Beach 166 000411 000425 3.49 .78 .00 4.27Mira-Loma 166 000412 000426 8.00 .98 .00 8.99Riverside 166 000412 000426 5.17 .91 .00 6.08Santa-Maria 166 000412 000426 2.65 .12 .00 2.77Upland 166 000411 000427 7.00 .94 .00 7.94Alpine 167 000427 000511 2.53 .39 .00 2.92Atascadero 167 000426 000510 1.91 .19 .00 2.10Glendora 167 000425 000509 5.89 .93 .00 6.82Lake-Arrowhead 167 000427 000511 3.23 .61 .00 3.84Lake-Elsinore 167 000426 000510 4.58 .58 .00 5.16Lancaster 167 000425 000510 3.30 .25 .00 3.55Lompoc 167 000426 000510 .87 .01 .00 .88Long-Beach 167 000425 000509 4.14 .91 .00 5.04Mira-Loma 167 000426 000510 12.03 .90 .00 12.93Riverside 167 000426 000510 5.89 .87 .00 6.76Santa-Maria 167 000426 000510 2.46 .21 .00 2.67Upland 167 000427 000511 6.92 1.25 .00 8.17Alpine 168 000511 000524 3.38 .35 .00 3.74Atascadero 168 000510 000523 3.84 .27 .00 4.11Glendora 168 000509 000523 6.24 .70 .00 6.94Lake-Arrowhead 168 000511 000525 2.36 .18 .00 2.54Lake-Elsinore 168 000510 000524 4.69 .58 .00 5.27Lancaster 168 000510 000524 4.39 .28 .00 4.67Lompoc 168 000510 000525 1.60 .13 .00 1.74Long-Beach 168 000509 000523 3.76 .79 .00 4.56Mira-Loma 168 000510 000524 18.07 1.23 .11 19.42Riverside 168 000510 000524 6.93 .90 .00 7.83Santa-Maria 168 000510 000525 3.17 .41 .00 3.58
59

Site Period Start End Organic Elemental Carbonate TotalDate Date Carbon Carbon Carbon Carbon
µg m�3 µg m�3 µg m�3 µg m�3
Upland 168 000511 000525 6.60 1.01 .00 7.60Alpine 169 000524 000608 3.96 .36 .00 4.33Atascadero 169 000523 000606 3.01 .23 .00 3.24Glendora 169 000523 000606 7.14 .95 .02 8.11Lake-Arrowhead 169 000525 000608 4.00 .34 .00 4.34Lake-Elsinore 169 000524 000607 5.53 .55 .00 6.09Lancaster 169 000524 000606 5.38 .27 .00 5.65Lompoc 169 000525 000607 .93 .07 .00 1.00Long-Beach 169 000523 000606 3.81 .90 .00 4.71Mira-Loma 169 000524 000607 20.16 1.55 .21 21.92Riverside 169 000524 000608 7.53 .84 .00 8.38Santa-Maria 169 000525 000607 2.38 .25 .00 2.63Upland 169 000525 000606 8.69 1.09 .06 9.85Alpine 170 000608 000622 3.06 .38 .00 3.44Atascadero 170 000606 000621 2.38 .15 .00 2.54Glendora 170 000606 000620 6.21 .71 .00 6.92Lake-Arrowhead 170 000608 000622 3.17 .24 .00 3.42Lake-Elsinore 170 000607 000621 4.65 .50 .00 5.15Lancaster 170 000606 000620 4.64 .26 .00 4.90Lompoc 170 000607 000621 1.12 .05 .00 1.17Long-Beach 170 000606 000620 3.26 .62 .00 3.88Mira-Loma 170 000607 000621 17.48 .95 .10 18.52Riverside 170 000608 000621 8.05 .68 .00 8.73Santa-Maria 170 000607 000621 2.44 .26 .00 2.70Upland 170 000606 000622 7.66 1.06 .01 8.73Alpine 171 000622 000706 3.55 .41 .00 3.96Atascadero 171 000621 000706 2.51 .12 .00 2.63Glendora 171 000620 000703 7.11 .75 .00 7.87Lake-Arrowhead 171 000622 000706 3.24 .27 .00 3.51Lake-Elsinore 171 000621 000705 4.04 .43 .00 4.47Lancaster 171 000620 000705 4.81 .31 .00 5.12Lompoc 171 000621 000705 .75 .06 .00 .81Long-Beach 171 000620 000703 3.72 .64 .00 4.37Mira-Loma 171 000621 000705 18.44 .97 .09 19.49Riverside 171 000621 000705 7.02 .70 .00 7.72Santa-Maria 171 000621 000705 1.73 .21 .00 1.94Upland 171 000622 000706 7.76 .90 .00 8.66Alpine 172 000706 000720 3.65 .41 .00 4.06Atascadero 172 000706 000719 2.29 .16 .00 2.46Glendora 172 000703 000718 6.25 .70 .00 6.96Lake-Arrowhead 172 000706 000720 4.46 .37 .00 4.83Lake-Elsinore 172 000705 000719 5.29 .52 .00 5.80Lancaster 172 000705 000718 4.61 .27 .00 4.88Lompoc 172 000705 000719 .81 .03 .00 .84Long-Beach 172 000703 000718 3.73 .69 .00 4.42
60
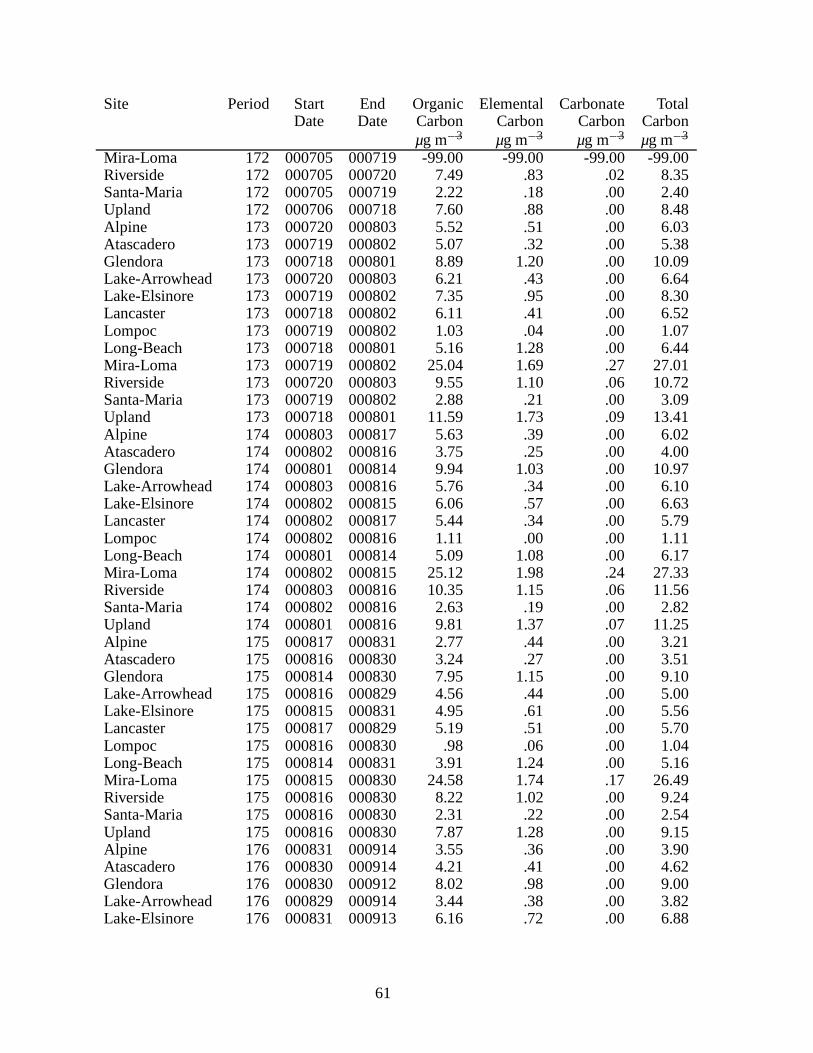
Site Period Start End Organic Elemental Carbonate TotalDate Date Carbon Carbon Carbon Carbon
µg m�3 µg m�3 µg m�3 µg m�3
Mira-Loma 172 000705 000719 -99.00 -99.00 -99.00 -99.00Riverside 172 000705 000720 7.49 .83 .02 8.35Santa-Maria 172 000705 000719 2.22 .18 .00 2.40Upland 172 000706 000718 7.60 .88 .00 8.48Alpine 173 000720 000803 5.52 .51 .00 6.03Atascadero 173 000719 000802 5.07 .32 .00 5.38Glendora 173 000718 000801 8.89 1.20 .00 10.09Lake-Arrowhead 173 000720 000803 6.21 .43 .00 6.64Lake-Elsinore 173 000719 000802 7.35 .95 .00 8.30Lancaster 173 000718 000802 6.11 .41 .00 6.52Lompoc 173 000719 000802 1.03 .04 .00 1.07Long-Beach 173 000718 000801 5.16 1.28 .00 6.44Mira-Loma 173 000719 000802 25.04 1.69 .27 27.01Riverside 173 000720 000803 9.55 1.10 .06 10.72Santa-Maria 173 000719 000802 2.88 .21 .00 3.09Upland 173 000718 000801 11.59 1.73 .09 13.41Alpine 174 000803 000817 5.63 .39 .00 6.02Atascadero 174 000802 000816 3.75 .25 .00 4.00Glendora 174 000801 000814 9.94 1.03 .00 10.97Lake-Arrowhead 174 000803 000816 5.76 .34 .00 6.10Lake-Elsinore 174 000802 000815 6.06 .57 .00 6.63Lancaster 174 000802 000817 5.44 .34 .00 5.79Lompoc 174 000802 000816 1.11 .00 .00 1.11Long-Beach 174 000801 000814 5.09 1.08 .00 6.17Mira-Loma 174 000802 000815 25.12 1.98 .24 27.33Riverside 174 000803 000816 10.35 1.15 .06 11.56Santa-Maria 174 000802 000816 2.63 .19 .00 2.82Upland 174 000801 000816 9.81 1.37 .07 11.25Alpine 175 000817 000831 2.77 .44 .00 3.21Atascadero 175 000816 000830 3.24 .27 .00 3.51Glendora 175 000814 000830 7.95 1.15 .00 9.10Lake-Arrowhead 175 000816 000829 4.56 .44 .00 5.00Lake-Elsinore 175 000815 000831 4.95 .61 .00 5.56Lancaster 175 000817 000829 5.19 .51 .00 5.70Lompoc 175 000816 000830 .98 .06 .00 1.04Long-Beach 175 000814 000831 3.91 1.24 .00 5.16Mira-Loma 175 000815 000830 24.58 1.74 .17 26.49Riverside 175 000816 000830 8.22 1.02 .00 9.24Santa-Maria 175 000816 000830 2.31 .22 .00 2.54Upland 175 000816 000830 7.87 1.28 .00 9.15Alpine 176 000831 000914 3.55 .36 .00 3.90Atascadero 176 000830 000914 4.21 .41 .00 4.62Glendora 176 000830 000912 8.02 .98 .00 9.00Lake-Arrowhead 176 000829 000914 3.44 .38 .00 3.82Lake-Elsinore 176 000831 000913 6.16 .72 .00 6.88
61
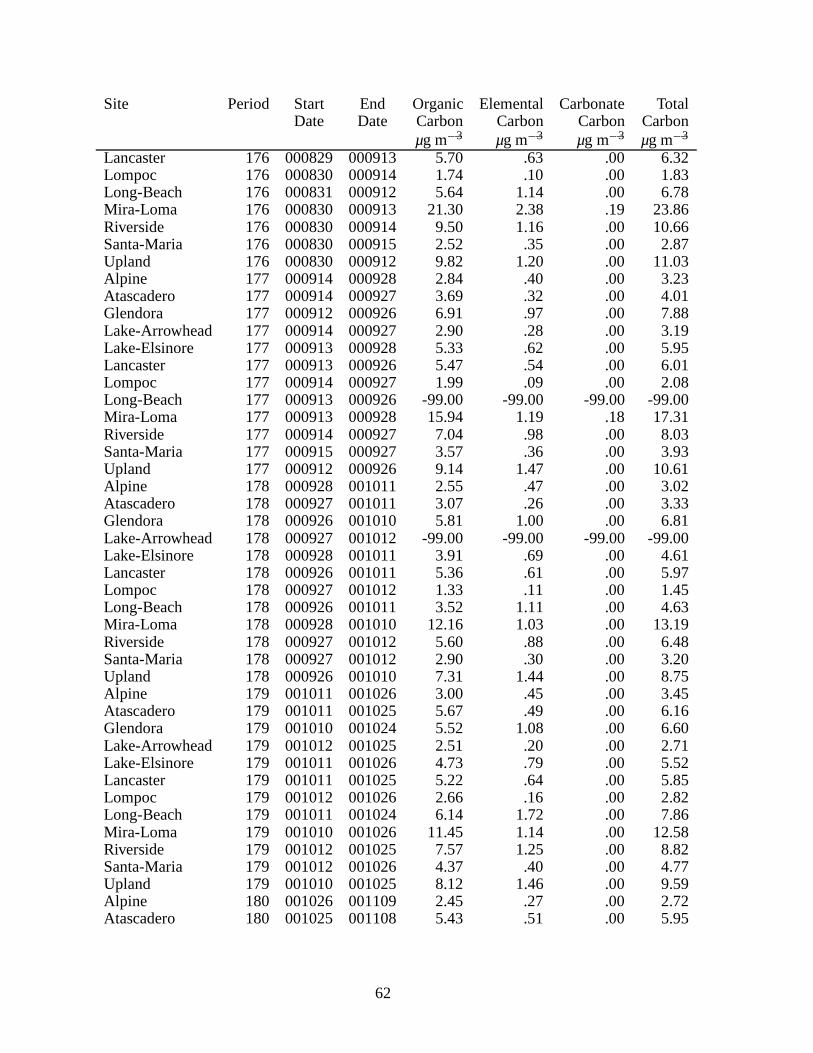
Site Period Start End Organic Elemental Carbonate TotalDate Date Carbon Carbon Carbon Carbon
µg m�3 µg m�3 µg m�3 µg m�3
Lancaster 176 000829 000913 5.70 .63 .00 6.32Lompoc 176 000830 000914 1.74 .10 .00 1.83Long-Beach 176 000831 000912 5.64 1.14 .00 6.78Mira-Loma 176 000830 000913 21.30 2.38 .19 23.86Riverside 176 000830 000914 9.50 1.16 .00 10.66Santa-Maria 176 000830 000915 2.52 .35 .00 2.87Upland 176 000830 000912 9.82 1.20 .00 11.03Alpine 177 000914 000928 2.84 .40 .00 3.23Atascadero 177 000914 000927 3.69 .32 .00 4.01Glendora 177 000912 000926 6.91 .97 .00 7.88Lake-Arrowhead 177 000914 000927 2.90 .28 .00 3.19Lake-Elsinore 177 000913 000928 5.33 .62 .00 5.95Lancaster 177 000913 000926 5.47 .54 .00 6.01Lompoc 177 000914 000927 1.99 .09 .00 2.08Long-Beach 177 000913 000926 -99.00 -99.00 -99.00 -99.00Mira-Loma 177 000913 000928 15.94 1.19 .18 17.31Riverside 177 000914 000927 7.04 .98 .00 8.03Santa-Maria 177 000915 000927 3.57 .36 .00 3.93Upland 177 000912 000926 9.14 1.47 .00 10.61Alpine 178 000928 001011 2.55 .47 .00 3.02Atascadero 178 000927 001011 3.07 .26 .00 3.33Glendora 178 000926 001010 5.81 1.00 .00 6.81Lake-Arrowhead 178 000927 001012 -99.00 -99.00 -99.00 -99.00Lake-Elsinore 178 000928 001011 3.91 .69 .00 4.61Lancaster 178 000926 001011 5.36 .61 .00 5.97Lompoc 178 000927 001012 1.33 .11 .00 1.45Long-Beach 178 000926 001011 3.52 1.11 .00 4.63Mira-Loma 178 000928 001010 12.16 1.03 .00 13.19Riverside 178 000927 001012 5.60 .88 .00 6.48Santa-Maria 178 000927 001012 2.90 .30 .00 3.20Upland 178 000926 001010 7.31 1.44 .00 8.75Alpine 179 001011 001026 3.00 .45 .00 3.45Atascadero 179 001011 001025 5.67 .49 .00 6.16Glendora 179 001010 001024 5.52 1.08 .00 6.60Lake-Arrowhead 179 001012 001025 2.51 .20 .00 2.71Lake-Elsinore 179 001011 001026 4.73 .79 .00 5.52Lancaster 179 001011 001025 5.22 .64 .00 5.85Lompoc 179 001012 001026 2.66 .16 .00 2.82Long-Beach 179 001011 001024 6.14 1.72 .00 7.86Mira-Loma 179 001010 001026 11.45 1.14 .00 12.58Riverside 179 001012 001025 7.57 1.25 .00 8.82Santa-Maria 179 001012 001026 4.37 .40 .00 4.77Upland 179 001010 001025 8.12 1.46 .00 9.59Alpine 180 001026 001109 2.45 .27 .00 2.72Atascadero 180 001025 001108 5.43 .51 .00 5.95
62
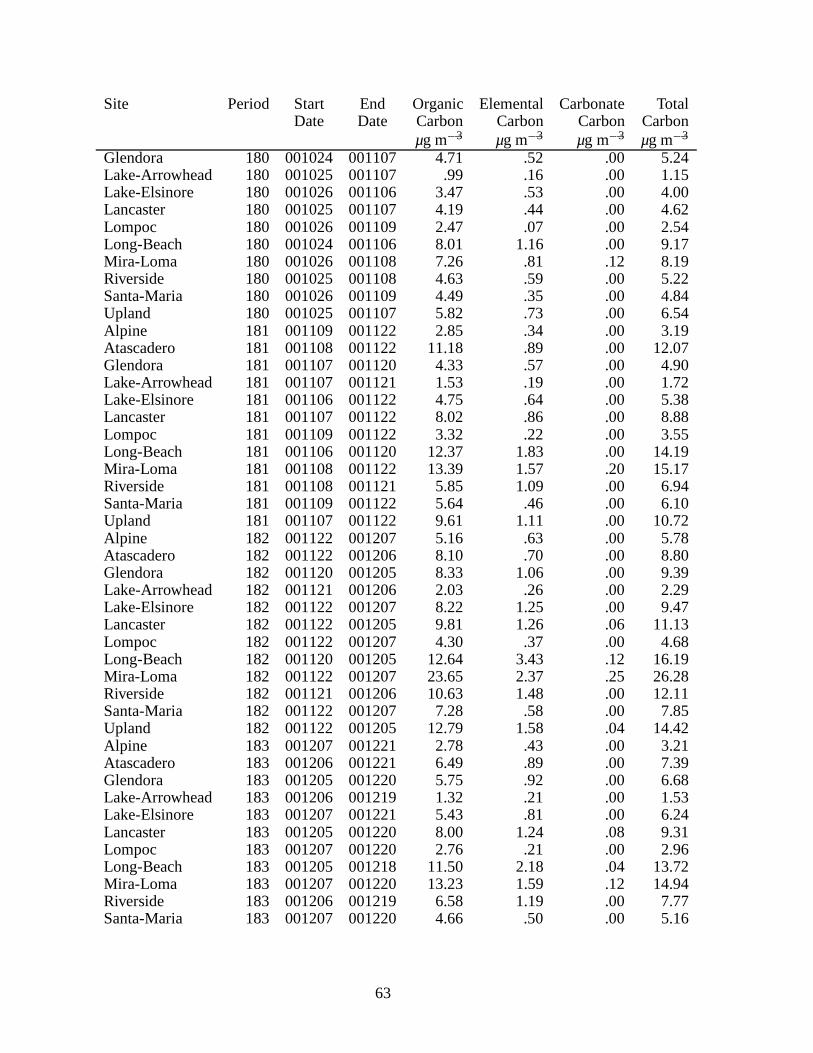
Site Period Start End Organic Elemental Carbonate TotalDate Date Carbon Carbon Carbon Carbon
µg m�3 µg m�3 µg m�3 µg m�3
Glendora 180 001024 001107 4.71 .52 .00 5.24Lake-Arrowhead 180 001025 001107 .99 .16 .00 1.15Lake-Elsinore 180 001026 001106 3.47 .53 .00 4.00Lancaster 180 001025 001107 4.19 .44 .00 4.62Lompoc 180 001026 001109 2.47 .07 .00 2.54Long-Beach 180 001024 001106 8.01 1.16 .00 9.17Mira-Loma 180 001026 001108 7.26 .81 .12 8.19Riverside 180 001025 001108 4.63 .59 .00 5.22Santa-Maria 180 001026 001109 4.49 .35 .00 4.84Upland 180 001025 001107 5.82 .73 .00 6.54Alpine 181 001109 001122 2.85 .34 .00 3.19Atascadero 181 001108 001122 11.18 .89 .00 12.07Glendora 181 001107 001120 4.33 .57 .00 4.90Lake-Arrowhead 181 001107 001121 1.53 .19 .00 1.72Lake-Elsinore 181 001106 001122 4.75 .64 .00 5.38Lancaster 181 001107 001122 8.02 .86 .00 8.88Lompoc 181 001109 001122 3.32 .22 .00 3.55Long-Beach 181 001106 001120 12.37 1.83 .00 14.19Mira-Loma 181 001108 001122 13.39 1.57 .20 15.17Riverside 181 001108 001121 5.85 1.09 .00 6.94Santa-Maria 181 001109 001122 5.64 .46 .00 6.10Upland 181 001107 001122 9.61 1.11 .00 10.72Alpine 182 001122 001207 5.16 .63 .00 5.78Atascadero 182 001122 001206 8.10 .70 .00 8.80Glendora 182 001120 001205 8.33 1.06 .00 9.39Lake-Arrowhead 182 001121 001206 2.03 .26 .00 2.29Lake-Elsinore 182 001122 001207 8.22 1.25 .00 9.47Lancaster 182 001122 001205 9.81 1.26 .06 11.13Lompoc 182 001122 001207 4.30 .37 .00 4.68Long-Beach 182 001120 001205 12.64 3.43 .12 16.19Mira-Loma 182 001122 001207 23.65 2.37 .25 26.28Riverside 182 001121 001206 10.63 1.48 .00 12.11Santa-Maria 182 001122 001207 7.28 .58 .00 7.85Upland 182 001122 001205 12.79 1.58 .04 14.42Alpine 183 001207 001221 2.78 .43 .00 3.21Atascadero 183 001206 001221 6.49 .89 .00 7.39Glendora 183 001205 001220 5.75 .92 .00 6.68Lake-Arrowhead 183 001206 001219 1.32 .21 .00 1.53Lake-Elsinore 183 001207 001221 5.43 .81 .00 6.24Lancaster 183 001205 001220 8.00 1.24 .08 9.31Lompoc 183 001207 001220 2.76 .21 .00 2.96Long-Beach 183 001205 001218 11.50 2.18 .04 13.72Mira-Loma 183 001207 001220 13.23 1.59 .12 14.94Riverside 183 001206 001219 6.58 1.19 .00 7.77Santa-Maria 183 001207 001220 4.66 .50 .00 5.16
63
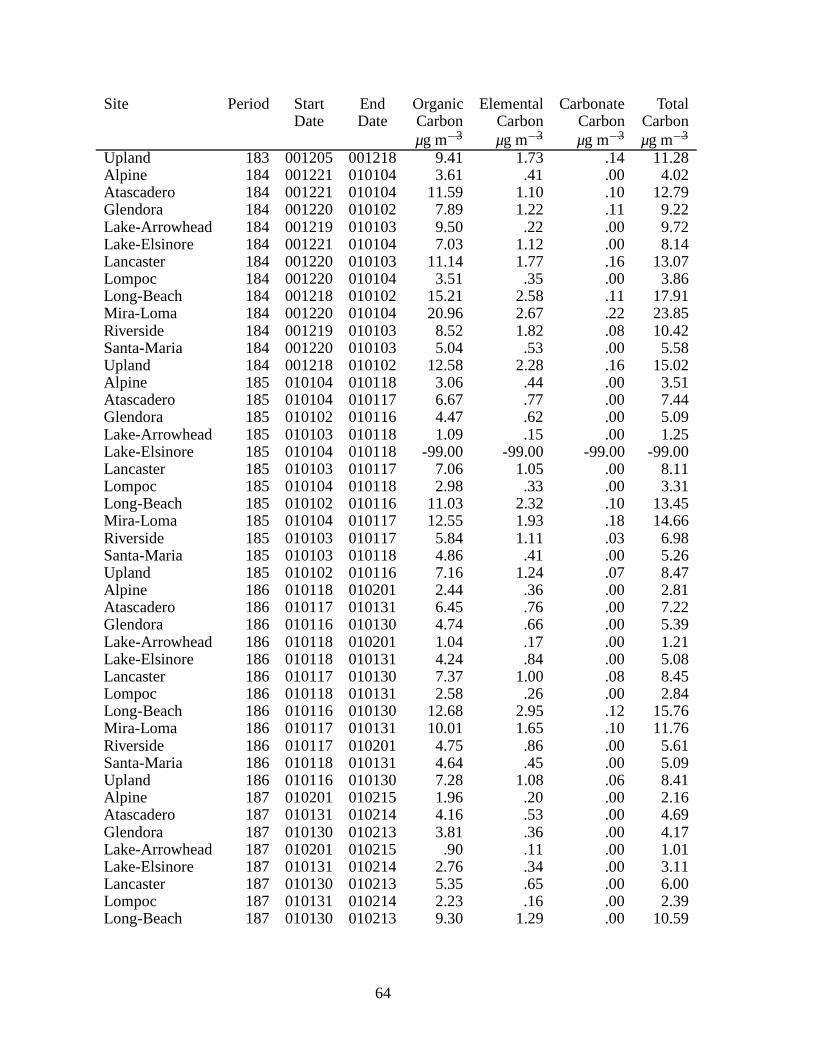
Site Period Start End Organic Elemental Carbonate TotalDate Date Carbon Carbon Carbon Carbon
µg m�3 µg m�3 µg m�3 µg m�3
Upland 183 001205 001218 9.41 1.73 .14 11.28Alpine 184 001221 010104 3.61 .41 .00 4.02Atascadero 184 001221 010104 11.59 1.10 .10 12.79Glendora 184 001220 010102 7.89 1.22 .11 9.22Lake-Arrowhead 184 001219 010103 9.50 .22 .00 9.72Lake-Elsinore 184 001221 010104 7.03 1.12 .00 8.14Lancaster 184 001220 010103 11.14 1.77 .16 13.07Lompoc 184 001220 010104 3.51 .35 .00 3.86Long-Beach 184 001218 010102 15.21 2.58 .11 17.91Mira-Loma 184 001220 010104 20.96 2.67 .22 23.85Riverside 184 001219 010103 8.52 1.82 .08 10.42Santa-Maria 184 001220 010103 5.04 .53 .00 5.58Upland 184 001218 010102 12.58 2.28 .16 15.02Alpine 185 010104 010118 3.06 .44 .00 3.51Atascadero 185 010104 010117 6.67 .77 .00 7.44Glendora 185 010102 010116 4.47 .62 .00 5.09Lake-Arrowhead 185 010103 010118 1.09 .15 .00 1.25Lake-Elsinore 185 010104 010118 -99.00 -99.00 -99.00 -99.00Lancaster 185 010103 010117 7.06 1.05 .00 8.11Lompoc 185 010104 010118 2.98 .33 .00 3.31Long-Beach 185 010102 010116 11.03 2.32 .10 13.45Mira-Loma 185 010104 010117 12.55 1.93 .18 14.66Riverside 185 010103 010117 5.84 1.11 .03 6.98Santa-Maria 185 010103 010118 4.86 .41 .00 5.26Upland 185 010102 010116 7.16 1.24 .07 8.47Alpine 186 010118 010201 2.44 .36 .00 2.81Atascadero 186 010117 010131 6.45 .76 .00 7.22Glendora 186 010116 010130 4.74 .66 .00 5.39Lake-Arrowhead 186 010118 010201 1.04 .17 .00 1.21Lake-Elsinore 186 010118 010131 4.24 .84 .00 5.08Lancaster 186 010117 010130 7.37 1.00 .08 8.45Lompoc 186 010118 010131 2.58 .26 .00 2.84Long-Beach 186 010116 010130 12.68 2.95 .12 15.76Mira-Loma 186 010117 010131 10.01 1.65 .10 11.76Riverside 186 010117 010201 4.75 .86 .00 5.61Santa-Maria 186 010118 010131 4.64 .45 .00 5.09Upland 186 010116 010130 7.28 1.08 .06 8.41Alpine 187 010201 010215 1.96 .20 .00 2.16Atascadero 187 010131 010214 4.16 .53 .00 4.69Glendora 187 010130 010213 3.81 .36 .00 4.17Lake-Arrowhead 187 010201 010215 .90 .11 .00 1.01Lake-Elsinore 187 010131 010214 2.76 .34 .00 3.11Lancaster 187 010130 010213 5.35 .65 .00 6.00Lompoc 187 010131 010214 2.23 .16 .00 2.39Long-Beach 187 010130 010213 9.30 1.29 .00 10.59
64

Site Period Start End Organic Elemental Carbonate TotalDate Date Carbon Carbon Carbon Carbon
µg m�3 µg m�3 µg m�3 µg m�3
Mira-Loma 187 010131 010214 8.63 1.04 .04 9.71Riverside 187 010201 010215 3.81 .56 .00 4.37Santa-Maria 187 010131 010214 3.63 .36 .00 3.99Upland 187 010130 010213 5.95 .73 .00 6.68Alpine 188 010215 010301 1.65 .25 .00 1.90Atascadero 188 010214 010301 3.29 .40 .00 3.69Glendora 188 010213 010228 3.21 .45 .00 3.66Lake-Arrowhead 188 010215 010301 .82 .19 .00 1.01Lake-Elsinore 188 010214 010228 2.72 .59 .00 3.31Lancaster 188 010213 010227 4.54 .60 .00 5.14Lompoc 188 010214 010228 1.93 .14 .00 2.07Long-Beach 188 010213 010227 5.70 1.35 .00 7.05Mira-Loma 188 010214 010227 6.99 .92 .05 7.95Riverside 188 010215 010301 4.17 .70 .00 4.87Santa-Maria 188 010214 010228 3.31 .22 .00 3.53Upland 188 010213 010228 4.66 .73 .00 5.40Alpine 189 010301 010312 1.93 .28 .00 2.21Atascadero 189 010301 010314 3.15 .32 .00 3.47Glendora 189 010228 010313 3.61 .57 .00 4.18Lake-Arrowhead 189 010301 010315 1.00 .19 .00 1.18Lake-Elsinore 189 010228 010314 2.19 .41 .00 2.60Lancaster 189 010227 010313 3.15 .44 .00 3.58Lompoc 189 010228 010314 1.26 .13 .00 1.39Long-Beach 189 010227 010313 4.33 .97 .00 5.30Mira-Loma 189 010227 010314 6.77 .87 .04 7.68Riverside 189 010301 010315 3.58 .60 .00 4.17Santa-Maria 189 010228 010314 2.87 .33 .00 3.20Upland 189 010228 010313 4.20 .71 .00 4.90Alpine 190 010316 010329 2.49 .50 .00 2.99Atascadero 190 010314 010327 3.02 .31 .00 3.34Glendora 190 010313 010327 5.36 1.27 .00 6.63Lake-Arrowhead 190 010315 010329 2.23 .36 .00 2.59Lake-Elsinore 190 010314 010328 3.75 .99 .00 4.74Lancaster 190 010313 010327 3.81 .60 .00 4.41Lompoc 190 010314 010328 1.50 .07 .00 1.58Long-Beach 190 010313 010327 4.90 1.11 .00 6.01Mira-Loma 190 010314 010328 8.77 1.32 .07 10.16Riverside 190 010315 010329 5.48 1.26 .00 6.74Santa-Maria 190 010314 010328 3.23 .52 .00 3.75Upland 190 010313 010327 7.74 1.43 .00 9.17Alpine 191 010329 010412 -99.00 -99.00 -99.00 -99.00Atascadero 191 010327 010411 4.08 .28 .00 4.35Glendora 191 010327 010410 3.90 .74 .00 4.64Lake-Arrowhead 191 010329 010412 -99.00 -99.00 -99.00 -99.00Lake-Elsinore 191 010328 010411 2.37 .36 .00 2.73
65
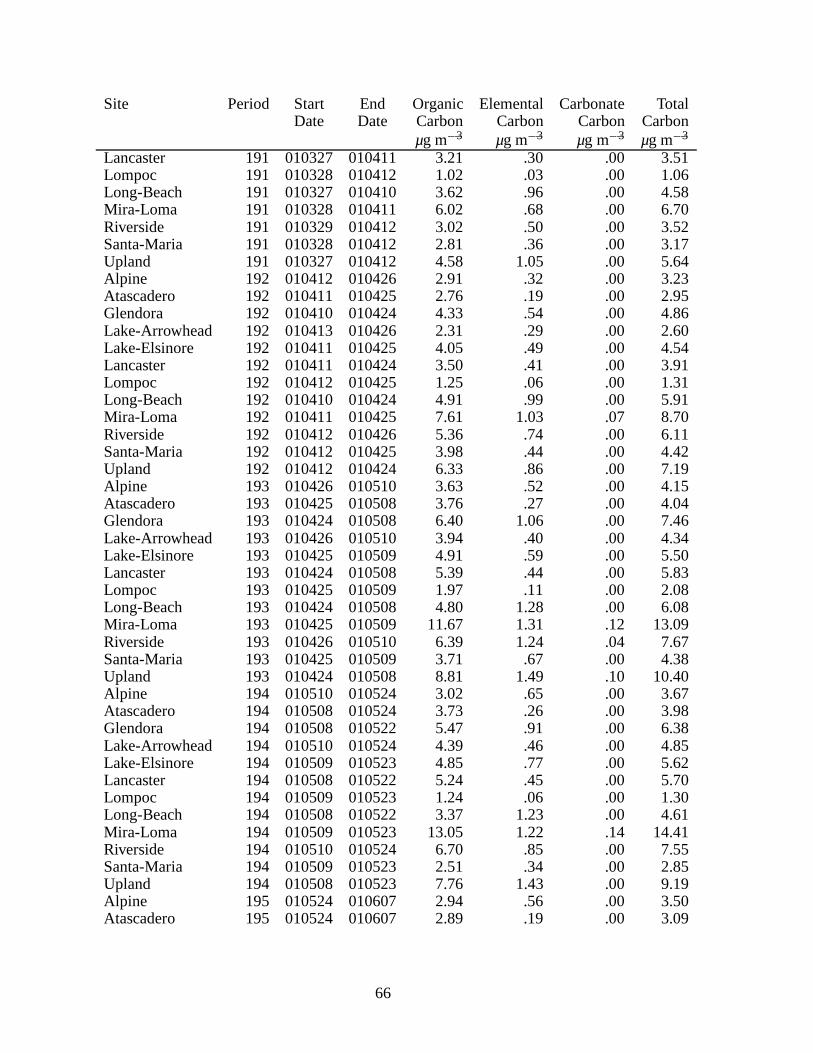
Site Period Start End Organic Elemental Carbonate TotalDate Date Carbon Carbon Carbon Carbon
µg m�3 µg m�3 µg m�3 µg m�3
Lancaster 191 010327 010411 3.21 .30 .00 3.51Lompoc 191 010328 010412 1.02 .03 .00 1.06Long-Beach 191 010327 010410 3.62 .96 .00 4.58Mira-Loma 191 010328 010411 6.02 .68 .00 6.70Riverside 191 010329 010412 3.02 .50 .00 3.52Santa-Maria 191 010328 010412 2.81 .36 .00 3.17Upland 191 010327 010412 4.58 1.05 .00 5.64Alpine 192 010412 010426 2.91 .32 .00 3.23Atascadero 192 010411 010425 2.76 .19 .00 2.95Glendora 192 010410 010424 4.33 .54 .00 4.86Lake-Arrowhead 192 010413 010426 2.31 .29 .00 2.60Lake-Elsinore 192 010411 010425 4.05 .49 .00 4.54Lancaster 192 010411 010424 3.50 .41 .00 3.91Lompoc 192 010412 010425 1.25 .06 .00 1.31Long-Beach 192 010410 010424 4.91 .99 .00 5.91Mira-Loma 192 010411 010425 7.61 1.03 .07 8.70Riverside 192 010412 010426 5.36 .74 .00 6.11Santa-Maria 192 010412 010425 3.98 .44 .00 4.42Upland 192 010412 010424 6.33 .86 .00 7.19Alpine 193 010426 010510 3.63 .52 .00 4.15Atascadero 193 010425 010508 3.76 .27 .00 4.04Glendora 193 010424 010508 6.40 1.06 .00 7.46Lake-Arrowhead 193 010426 010510 3.94 .40 .00 4.34Lake-Elsinore 193 010425 010509 4.91 .59 .00 5.50Lancaster 193 010424 010508 5.39 .44 .00 5.83Lompoc 193 010425 010509 1.97 .11 .00 2.08Long-Beach 193 010424 010508 4.80 1.28 .00 6.08Mira-Loma 193 010425 010509 11.67 1.31 .12 13.09Riverside 193 010426 010510 6.39 1.24 .04 7.67Santa-Maria 193 010425 010509 3.71 .67 .00 4.38Upland 193 010424 010508 8.81 1.49 .10 10.40Alpine 194 010510 010524 3.02 .65 .00 3.67Atascadero 194 010508 010524 3.73 .26 .00 3.98Glendora 194 010508 010522 5.47 .91 .00 6.38Lake-Arrowhead 194 010510 010524 4.39 .46 .00 4.85Lake-Elsinore 194 010509 010523 4.85 .77 .00 5.62Lancaster 194 010508 010522 5.24 .45 .00 5.70Lompoc 194 010509 010523 1.24 .06 .00 1.30Long-Beach 194 010508 010522 3.37 1.23 .00 4.61Mira-Loma 194 010509 010523 13.05 1.22 .14 14.41Riverside 194 010510 010524 6.70 .85 .00 7.55Santa-Maria 194 010509 010523 2.51 .34 .00 2.85Upland 194 010508 010523 7.76 1.43 .00 9.19Alpine 195 010524 010607 2.94 .56 .00 3.50Atascadero 195 010524 010607 2.89 .19 .00 3.09
66
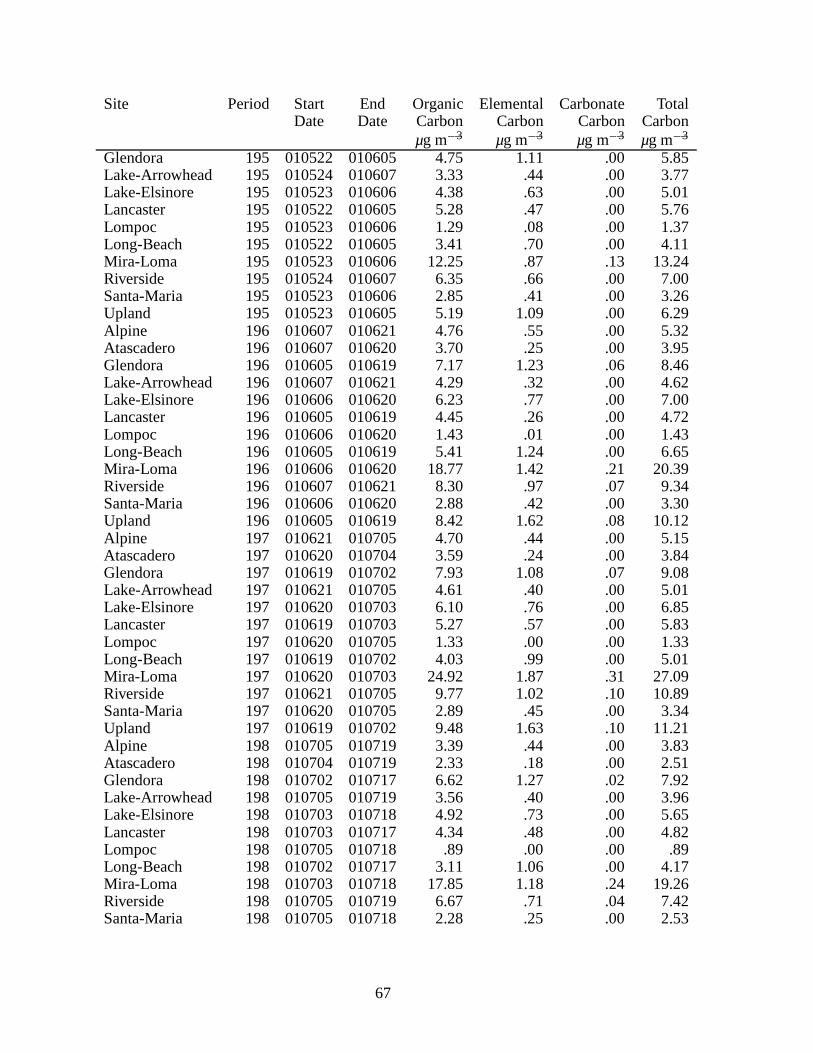
Site Period Start End Organic Elemental Carbonate TotalDate Date Carbon Carbon Carbon Carbon
µg m�3 µg m�3 µg m�3 µg m�3
Glendora 195 010522 010605 4.75 1.11 .00 5.85Lake-Arrowhead 195 010524 010607 3.33 .44 .00 3.77Lake-Elsinore 195 010523 010606 4.38 .63 .00 5.01Lancaster 195 010522 010605 5.28 .47 .00 5.76Lompoc 195 010523 010606 1.29 .08 .00 1.37Long-Beach 195 010522 010605 3.41 .70 .00 4.11Mira-Loma 195 010523 010606 12.25 .87 .13 13.24Riverside 195 010524 010607 6.35 .66 .00 7.00Santa-Maria 195 010523 010606 2.85 .41 .00 3.26Upland 195 010523 010605 5.19 1.09 .00 6.29Alpine 196 010607 010621 4.76 .55 .00 5.32Atascadero 196 010607 010620 3.70 .25 .00 3.95Glendora 196 010605 010619 7.17 1.23 .06 8.46Lake-Arrowhead 196 010607 010621 4.29 .32 .00 4.62Lake-Elsinore 196 010606 010620 6.23 .77 .00 7.00Lancaster 196 010605 010619 4.45 .26 .00 4.72Lompoc 196 010606 010620 1.43 .01 .00 1.43Long-Beach 196 010605 010619 5.41 1.24 .00 6.65Mira-Loma 196 010606 010620 18.77 1.42 .21 20.39Riverside 196 010607 010621 8.30 .97 .07 9.34Santa-Maria 196 010606 010620 2.88 .42 .00 3.30Upland 196 010605 010619 8.42 1.62 .08 10.12Alpine 197 010621 010705 4.70 .44 .00 5.15Atascadero 197 010620 010704 3.59 .24 .00 3.84Glendora 197 010619 010702 7.93 1.08 .07 9.08Lake-Arrowhead 197 010621 010705 4.61 .40 .00 5.01Lake-Elsinore 197 010620 010703 6.10 .76 .00 6.85Lancaster 197 010619 010703 5.27 .57 .00 5.83Lompoc 197 010620 010705 1.33 .00 .00 1.33Long-Beach 197 010619 010702 4.03 .99 .00 5.01Mira-Loma 197 010620 010703 24.92 1.87 .31 27.09Riverside 197 010621 010705 9.77 1.02 .10 10.89Santa-Maria 197 010620 010705 2.89 .45 .00 3.34Upland 197 010619 010702 9.48 1.63 .10 11.21Alpine 198 010705 010719 3.39 .44 .00 3.83Atascadero 198 010704 010719 2.33 .18 .00 2.51Glendora 198 010702 010717 6.62 1.27 .02 7.92Lake-Arrowhead 198 010705 010719 3.56 .40 .00 3.96Lake-Elsinore 198 010703 010718 4.92 .73 .00 5.65Lancaster 198 010703 010717 4.34 .48 .00 4.82Lompoc 198 010705 010718 .89 .00 .00 .89Long-Beach 198 010702 010717 3.11 1.06 .00 4.17Mira-Loma 198 010703 010718 17.85 1.18 .24 19.26Riverside 198 010705 010719 6.67 .71 .04 7.42Santa-Maria 198 010705 010718 2.28 .25 .00 2.53
67
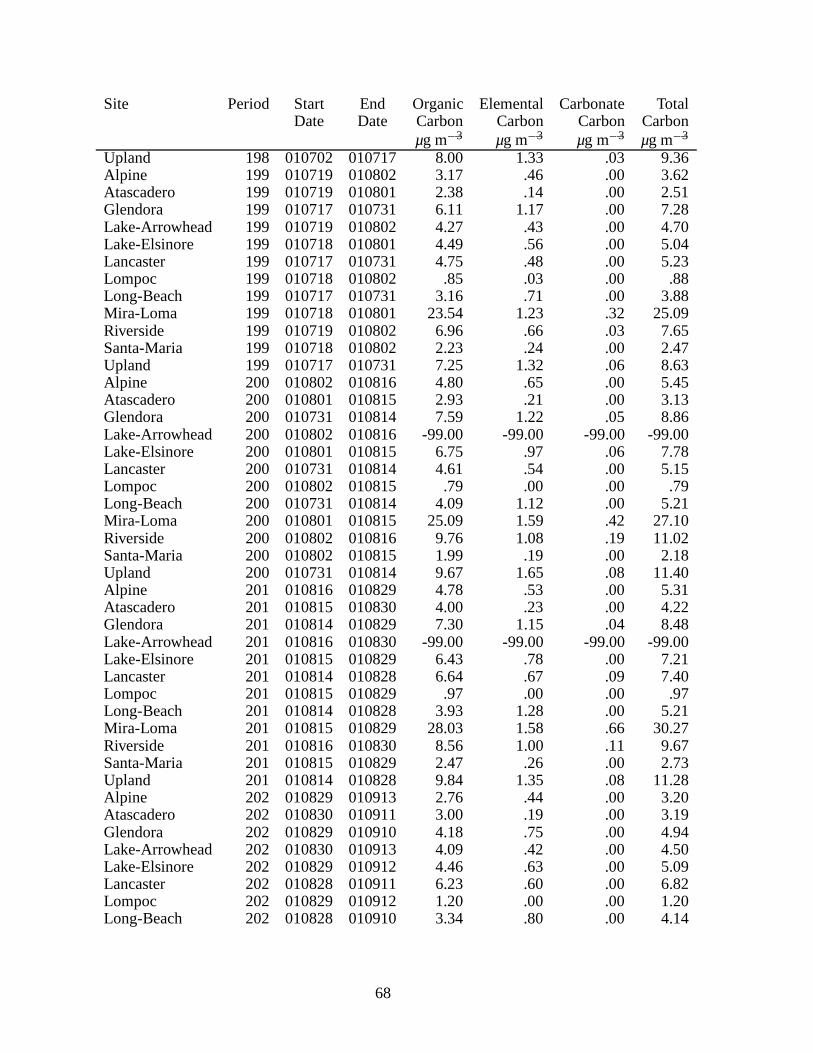
Site Period Start End Organic Elemental Carbonate TotalDate Date Carbon Carbon Carbon Carbon
µg m�3 µg m�3 µg m�3 µg m�3
Upland 198 010702 010717 8.00 1.33 .03 9.36Alpine 199 010719 010802 3.17 .46 .00 3.62Atascadero 199 010719 010801 2.38 .14 .00 2.51Glendora 199 010717 010731 6.11 1.17 .00 7.28Lake-Arrowhead 199 010719 010802 4.27 .43 .00 4.70Lake-Elsinore 199 010718 010801 4.49 .56 .00 5.04Lancaster 199 010717 010731 4.75 .48 .00 5.23Lompoc 199 010718 010802 .85 .03 .00 .88Long-Beach 199 010717 010731 3.16 .71 .00 3.88Mira-Loma 199 010718 010801 23.54 1.23 .32 25.09Riverside 199 010719 010802 6.96 .66 .03 7.65Santa-Maria 199 010718 010802 2.23 .24 .00 2.47Upland 199 010717 010731 7.25 1.32 .06 8.63Alpine 200 010802 010816 4.80 .65 .00 5.45Atascadero 200 010801 010815 2.93 .21 .00 3.13Glendora 200 010731 010814 7.59 1.22 .05 8.86Lake-Arrowhead 200 010802 010816 -99.00 -99.00 -99.00 -99.00Lake-Elsinore 200 010801 010815 6.75 .97 .06 7.78Lancaster 200 010731 010814 4.61 .54 .00 5.15Lompoc 200 010802 010815 .79 .00 .00 .79Long-Beach 200 010731 010814 4.09 1.12 .00 5.21Mira-Loma 200 010801 010815 25.09 1.59 .42 27.10Riverside 200 010802 010816 9.76 1.08 .19 11.02Santa-Maria 200 010802 010815 1.99 .19 .00 2.18Upland 200 010731 010814 9.67 1.65 .08 11.40Alpine 201 010816 010829 4.78 .53 .00 5.31Atascadero 201 010815 010830 4.00 .23 .00 4.22Glendora 201 010814 010829 7.30 1.15 .04 8.48Lake-Arrowhead 201 010816 010830 -99.00 -99.00 -99.00 -99.00Lake-Elsinore 201 010815 010829 6.43 .78 .00 7.21Lancaster 201 010814 010828 6.64 .67 .09 7.40Lompoc 201 010815 010829 .97 .00 .00 .97Long-Beach 201 010814 010828 3.93 1.28 .00 5.21Mira-Loma 201 010815 010829 28.03 1.58 .66 30.27Riverside 201 010816 010830 8.56 1.00 .11 9.67Santa-Maria 201 010815 010829 2.47 .26 .00 2.73Upland 201 010814 010828 9.84 1.35 .08 11.28Alpine 202 010829 010913 2.76 .44 .00 3.20Atascadero 202 010830 010911 3.00 .19 .00 3.19Glendora 202 010829 010910 4.18 .75 .00 4.94Lake-Arrowhead 202 010830 010913 4.09 .42 .00 4.50Lake-Elsinore 202 010829 010912 4.46 .63 .00 5.09Lancaster 202 010828 010911 6.23 .60 .00 6.82Lompoc 202 010829 010912 1.20 .00 .00 1.20Long-Beach 202 010828 010910 3.34 .80 .00 4.14
68
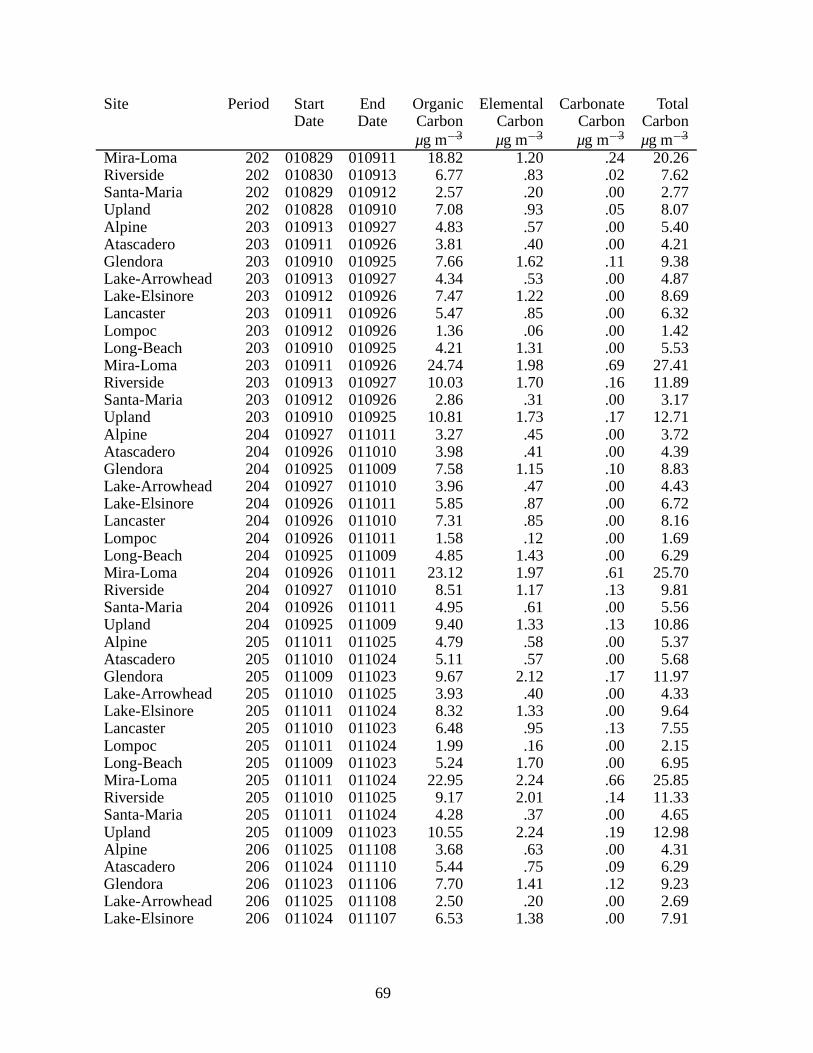
Site Period Start End Organic Elemental Carbonate TotalDate Date Carbon Carbon Carbon Carbon
µg m�3 µg m�3 µg m�3 µg m�3
Mira-Loma 202 010829 010911 18.82 1.20 .24 20.26Riverside 202 010830 010913 6.77 .83 .02 7.62Santa-Maria 202 010829 010912 2.57 .20 .00 2.77Upland 202 010828 010910 7.08 .93 .05 8.07Alpine 203 010913 010927 4.83 .57 .00 5.40Atascadero 203 010911 010926 3.81 .40 .00 4.21Glendora 203 010910 010925 7.66 1.62 .11 9.38Lake-Arrowhead 203 010913 010927 4.34 .53 .00 4.87Lake-Elsinore 203 010912 010926 7.47 1.22 .00 8.69Lancaster 203 010911 010926 5.47 .85 .00 6.32Lompoc 203 010912 010926 1.36 .06 .00 1.42Long-Beach 203 010910 010925 4.21 1.31 .00 5.53Mira-Loma 203 010911 010926 24.74 1.98 .69 27.41Riverside 203 010913 010927 10.03 1.70 .16 11.89Santa-Maria 203 010912 010926 2.86 .31 .00 3.17Upland 203 010910 010925 10.81 1.73 .17 12.71Alpine 204 010927 011011 3.27 .45 .00 3.72Atascadero 204 010926 011010 3.98 .41 .00 4.39Glendora 204 010925 011009 7.58 1.15 .10 8.83Lake-Arrowhead 204 010927 011010 3.96 .47 .00 4.43Lake-Elsinore 204 010926 011011 5.85 .87 .00 6.72Lancaster 204 010926 011010 7.31 .85 .00 8.16Lompoc 204 010926 011011 1.58 .12 .00 1.69Long-Beach 204 010925 011009 4.85 1.43 .00 6.29Mira-Loma 204 010926 011011 23.12 1.97 .61 25.70Riverside 204 010927 011010 8.51 1.17 .13 9.81Santa-Maria 204 010926 011011 4.95 .61 .00 5.56Upland 204 010925 011009 9.40 1.33 .13 10.86Alpine 205 011011 011025 4.79 .58 .00 5.37Atascadero 205 011010 011024 5.11 .57 .00 5.68Glendora 205 011009 011023 9.67 2.12 .17 11.97Lake-Arrowhead 205 011010 011025 3.93 .40 .00 4.33Lake-Elsinore 205 011011 011024 8.32 1.33 .00 9.64Lancaster 205 011010 011023 6.48 .95 .13 7.55Lompoc 205 011011 011024 1.99 .16 .00 2.15Long-Beach 205 011009 011023 5.24 1.70 .00 6.95Mira-Loma 205 011011 011024 22.95 2.24 .66 25.85Riverside 205 011010 011025 9.17 2.01 .14 11.33Santa-Maria 205 011011 011024 4.28 .37 .00 4.65Upland 205 011009 011023 10.55 2.24 .19 12.98Alpine 206 011025 011108 3.68 .63 .00 4.31Atascadero 206 011024 011110 5.44 .75 .09 6.29Glendora 206 011023 011106 7.70 1.41 .12 9.23Lake-Arrowhead 206 011025 011108 2.50 .20 .00 2.69Lake-Elsinore 206 011024 011107 6.53 1.38 .00 7.91
69
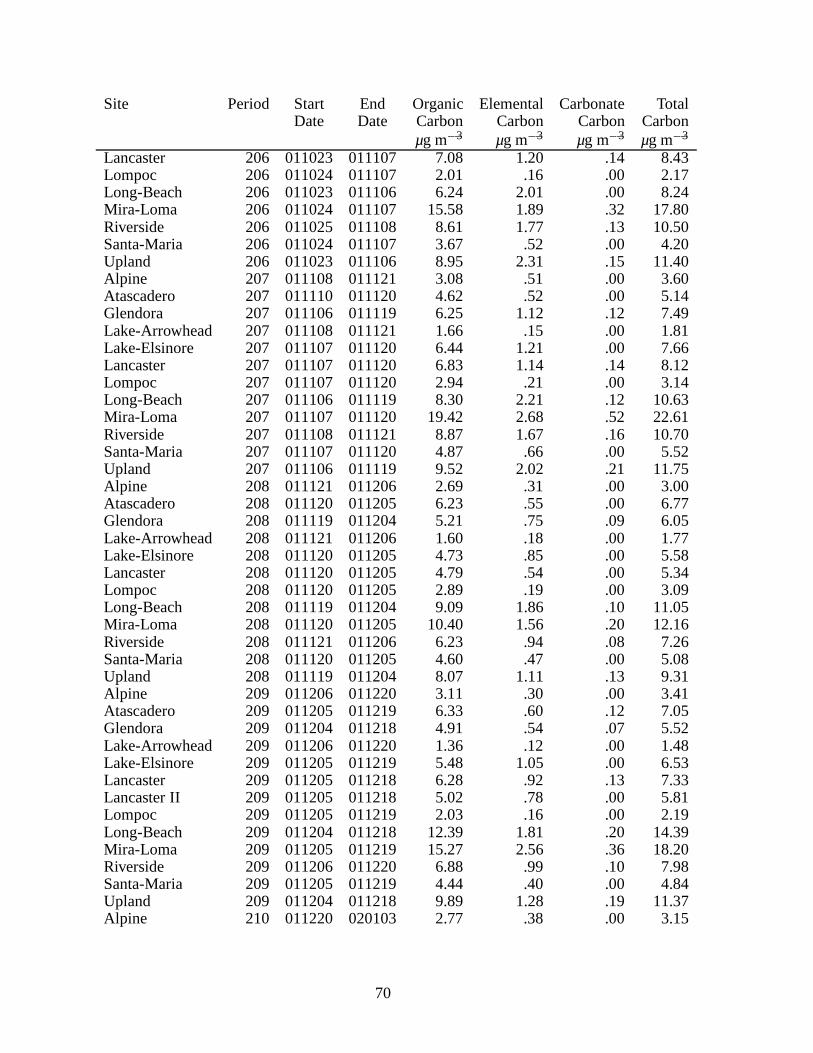
Site Period Start End Organic Elemental Carbonate TotalDate Date Carbon Carbon Carbon Carbon
µg m�3 µg m�3 µg m�3 µg m�3
Lancaster 206 011023 011107 7.08 1.20 .14 8.43Lompoc 206 011024 011107 2.01 .16 .00 2.17Long-Beach 206 011023 011106 6.24 2.01 .00 8.24Mira-Loma 206 011024 011107 15.58 1.89 .32 17.80Riverside 206 011025 011108 8.61 1.77 .13 10.50Santa-Maria 206 011024 011107 3.67 .52 .00 4.20Upland 206 011023 011106 8.95 2.31 .15 11.40Alpine 207 011108 011121 3.08 .51 .00 3.60Atascadero 207 011110 011120 4.62 .52 .00 5.14Glendora 207 011106 011119 6.25 1.12 .12 7.49Lake-Arrowhead 207 011108 011121 1.66 .15 .00 1.81Lake-Elsinore 207 011107 011120 6.44 1.21 .00 7.66Lancaster 207 011107 011120 6.83 1.14 .14 8.12Lompoc 207 011107 011120 2.94 .21 .00 3.14Long-Beach 207 011106 011119 8.30 2.21 .12 10.63Mira-Loma 207 011107 011120 19.42 2.68 .52 22.61Riverside 207 011108 011121 8.87 1.67 .16 10.70Santa-Maria 207 011107 011120 4.87 .66 .00 5.52Upland 207 011106 011119 9.52 2.02 .21 11.75Alpine 208 011121 011206 2.69 .31 .00 3.00Atascadero 208 011120 011205 6.23 .55 .00 6.77Glendora 208 011119 011204 5.21 .75 .09 6.05Lake-Arrowhead 208 011121 011206 1.60 .18 .00 1.77Lake-Elsinore 208 011120 011205 4.73 .85 .00 5.58Lancaster 208 011120 011205 4.79 .54 .00 5.34Lompoc 208 011120 011205 2.89 .19 .00 3.09Long-Beach 208 011119 011204 9.09 1.86 .10 11.05Mira-Loma 208 011120 011205 10.40 1.56 .20 12.16Riverside 208 011121 011206 6.23 .94 .08 7.26Santa-Maria 208 011120 011205 4.60 .47 .00 5.08Upland 208 011119 011204 8.07 1.11 .13 9.31Alpine 209 011206 011220 3.11 .30 .00 3.41Atascadero 209 011205 011219 6.33 .60 .12 7.05Glendora 209 011204 011218 4.91 .54 .07 5.52Lake-Arrowhead 209 011206 011220 1.36 .12 .00 1.48Lake-Elsinore 209 011205 011219 5.48 1.05 .00 6.53Lancaster 209 011205 011218 6.28 .92 .13 7.33Lancaster II 209 011205 011218 5.02 .78 .00 5.81Lompoc 209 011205 011219 2.03 .16 .00 2.19Long-Beach 209 011204 011218 12.39 1.81 .20 14.39Mira-Loma 209 011205 011219 15.27 2.56 .36 18.20Riverside 209 011206 011220 6.88 .99 .10 7.98Santa-Maria 209 011205 011219 4.44 .40 .00 4.84Upland 209 011204 011218 9.89 1.28 .19 11.37Alpine 210 011220 020103 2.77 .38 .00 3.15
70
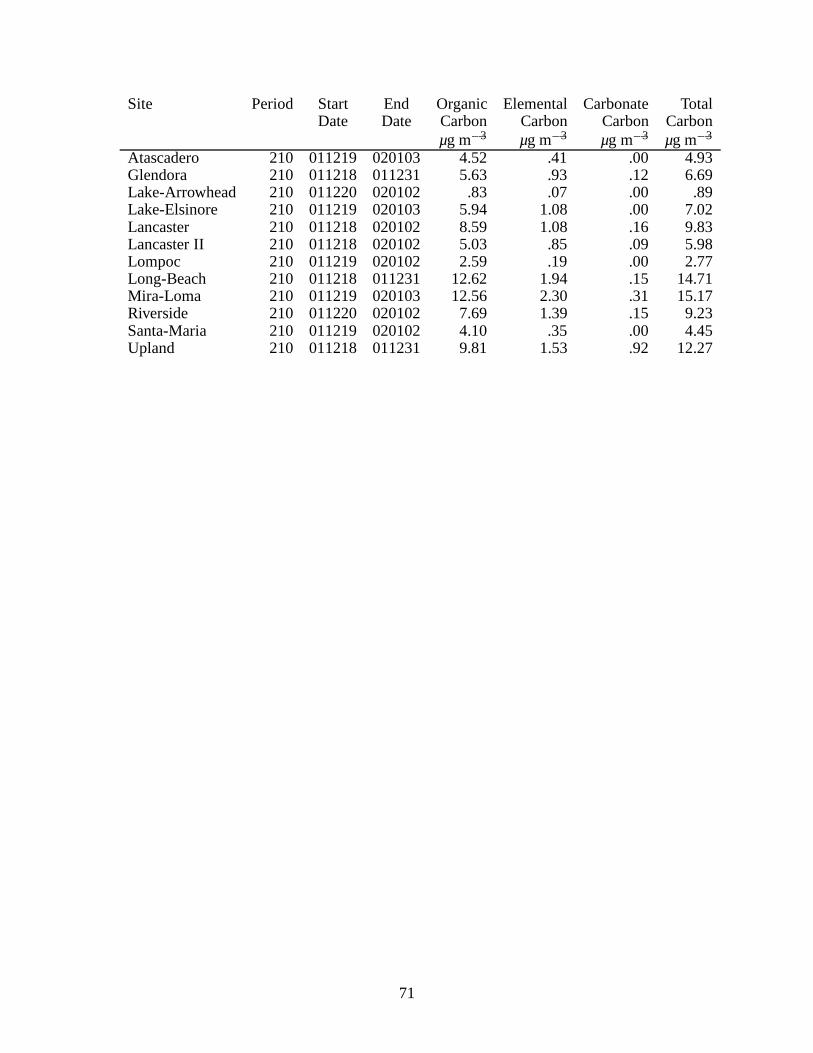
Site Period Start End Organic Elemental Carbonate TotalDate Date Carbon Carbon Carbon Carbon
µg m�3 µg m�3 µg m�3 µg m�3
Atascadero 210 011219 020103 4.52 .41 .00 4.93Glendora 210 011218 011231 5.63 .93 .12 6.69Lake-Arrowhead 210 011220 020102 .83 .07 .00 .89Lake-Elsinore 210 011219 020103 5.94 1.08 .00 7.02Lancaster 210 011218 020102 8.59 1.08 .16 9.83Lancaster II 210 011218 020102 5.03 .85 .09 5.98Lompoc 210 011219 020102 2.59 .19 .00 2.77Long-Beach 210 011218 011231 12.62 1.94 .15 14.71Mira-Loma 210 011219 020103 12.56 2.30 .31 15.17Riverside 210 011220 020102 7.69 1.39 .15 9.23Santa-Maria 210 011219 020102 4.10 .35 .00 4.45Upland 210 011218 011231 9.81 1.53 .92 12.27
71
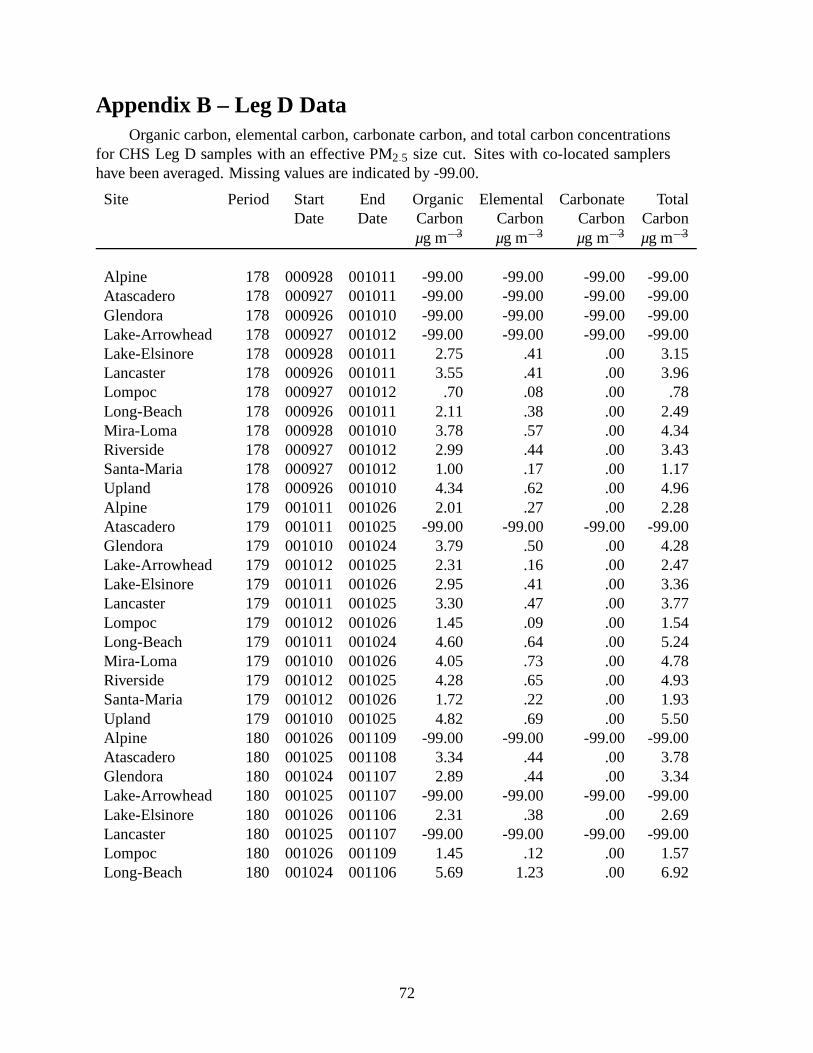
Appendix B – Leg D DataOrganic carbon, elemental carbon, carbonate carbon, and total carbon concentrations
for CHS Leg D samples with an effective PM2:5 size cut. Sites with co-located samplershave been averaged. Missing values are indicated by -99.00.
Site Period Start End Organic Elemental Carbonate TotalDate Date Carbon Carbon Carbon Carbon
µg m�3 µg m�3 µg m�3 µg m�3
Alpine 178 000928 001011 -99.00 -99.00 -99.00 -99.00Atascadero 178 000927 001011 -99.00 -99.00 -99.00 -99.00Glendora 178 000926 001010 -99.00 -99.00 -99.00 -99.00Lake-Arrowhead 178 000927 001012 -99.00 -99.00 -99.00 -99.00Lake-Elsinore 178 000928 001011 2.75 .41 .00 3.15Lancaster 178 000926 001011 3.55 .41 .00 3.96Lompoc 178 000927 001012 .70 .08 .00 .78Long-Beach 178 000926 001011 2.11 .38 .00 2.49Mira-Loma 178 000928 001010 3.78 .57 .00 4.34Riverside 178 000927 001012 2.99 .44 .00 3.43Santa-Maria 178 000927 001012 1.00 .17 .00 1.17Upland 178 000926 001010 4.34 .62 .00 4.96Alpine 179 001011 001026 2.01 .27 .00 2.28Atascadero 179 001011 001025 -99.00 -99.00 -99.00 -99.00Glendora 179 001010 001024 3.79 .50 .00 4.28Lake-Arrowhead 179 001012 001025 2.31 .16 .00 2.47Lake-Elsinore 179 001011 001026 2.95 .41 .00 3.36Lancaster 179 001011 001025 3.30 .47 .00 3.77Lompoc 179 001012 001026 1.45 .09 .00 1.54Long-Beach 179 001011 001024 4.60 .64 .00 5.24Mira-Loma 179 001010 001026 4.05 .73 .00 4.78Riverside 179 001012 001025 4.28 .65 .00 4.93Santa-Maria 179 001012 001026 1.72 .22 .00 1.93Upland 179 001010 001025 4.82 .69 .00 5.50Alpine 180 001026 001109 -99.00 -99.00 -99.00 -99.00Atascadero 180 001025 001108 3.34 .44 .00 3.78Glendora 180 001024 001107 2.89 .44 .00 3.34Lake-Arrowhead 180 001025 001107 -99.00 -99.00 -99.00 -99.00Lake-Elsinore 180 001026 001106 2.31 .38 .00 2.69Lancaster 180 001025 001107 -99.00 -99.00 -99.00 -99.00Lompoc 180 001026 001109 1.45 .12 .00 1.57Long-Beach 180 001024 001106 5.69 1.23 .00 6.92
72
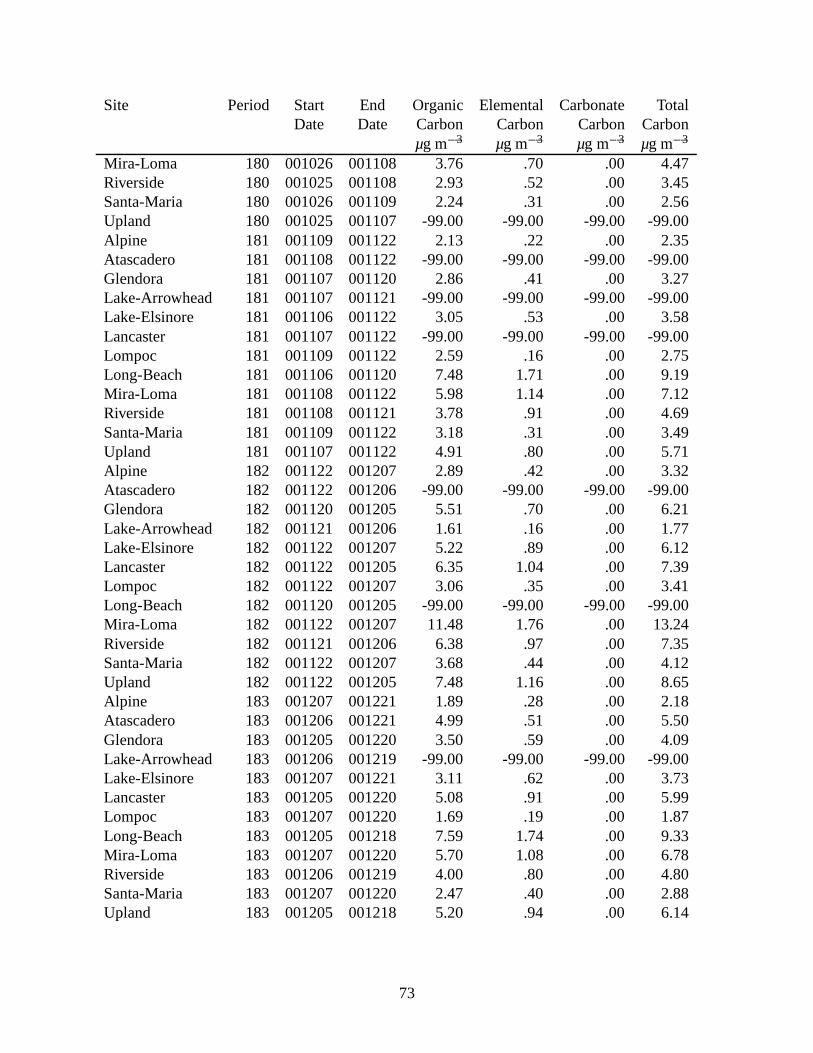
Site Period Start End Organic Elemental Carbonate TotalDate Date Carbon Carbon Carbon Carbon
µg m�3 µg m�3 µg m�3 µg m�3
Mira-Loma 180 001026 001108 3.76 .70 .00 4.47Riverside 180 001025 001108 2.93 .52 .00 3.45Santa-Maria 180 001026 001109 2.24 .31 .00 2.56Upland 180 001025 001107 -99.00 -99.00 -99.00 -99.00Alpine 181 001109 001122 2.13 .22 .00 2.35Atascadero 181 001108 001122 -99.00 -99.00 -99.00 -99.00Glendora 181 001107 001120 2.86 .41 .00 3.27Lake-Arrowhead 181 001107 001121 -99.00 -99.00 -99.00 -99.00Lake-Elsinore 181 001106 001122 3.05 .53 .00 3.58Lancaster 181 001107 001122 -99.00 -99.00 -99.00 -99.00Lompoc 181 001109 001122 2.59 .16 .00 2.75Long-Beach 181 001106 001120 7.48 1.71 .00 9.19Mira-Loma 181 001108 001122 5.98 1.14 .00 7.12Riverside 181 001108 001121 3.78 .91 .00 4.69Santa-Maria 181 001109 001122 3.18 .31 .00 3.49Upland 181 001107 001122 4.91 .80 .00 5.71Alpine 182 001122 001207 2.89 .42 .00 3.32Atascadero 182 001122 001206 -99.00 -99.00 -99.00 -99.00Glendora 182 001120 001205 5.51 .70 .00 6.21Lake-Arrowhead 182 001121 001206 1.61 .16 .00 1.77Lake-Elsinore 182 001122 001207 5.22 .89 .00 6.12Lancaster 182 001122 001205 6.35 1.04 .00 7.39Lompoc 182 001122 001207 3.06 .35 .00 3.41Long-Beach 182 001120 001205 -99.00 -99.00 -99.00 -99.00Mira-Loma 182 001122 001207 11.48 1.76 .00 13.24Riverside 182 001121 001206 6.38 .97 .00 7.35Santa-Maria 182 001122 001207 3.68 .44 .00 4.12Upland 182 001122 001205 7.48 1.16 .00 8.65Alpine 183 001207 001221 1.89 .28 .00 2.18Atascadero 183 001206 001221 4.99 .51 .00 5.50Glendora 183 001205 001220 3.50 .59 .00 4.09Lake-Arrowhead 183 001206 001219 -99.00 -99.00 -99.00 -99.00Lake-Elsinore 183 001207 001221 3.11 .62 .00 3.73Lancaster 183 001205 001220 5.08 .91 .00 5.99Lompoc 183 001207 001220 1.69 .19 .00 1.87Long-Beach 183 001205 001218 7.59 1.74 .00 9.33Mira-Loma 183 001207 001220 5.70 1.08 .00 6.78Riverside 183 001206 001219 4.00 .80 .00 4.80Santa-Maria 183 001207 001220 2.47 .40 .00 2.88Upland 183 001205 001218 5.20 .94 .00 6.14
73
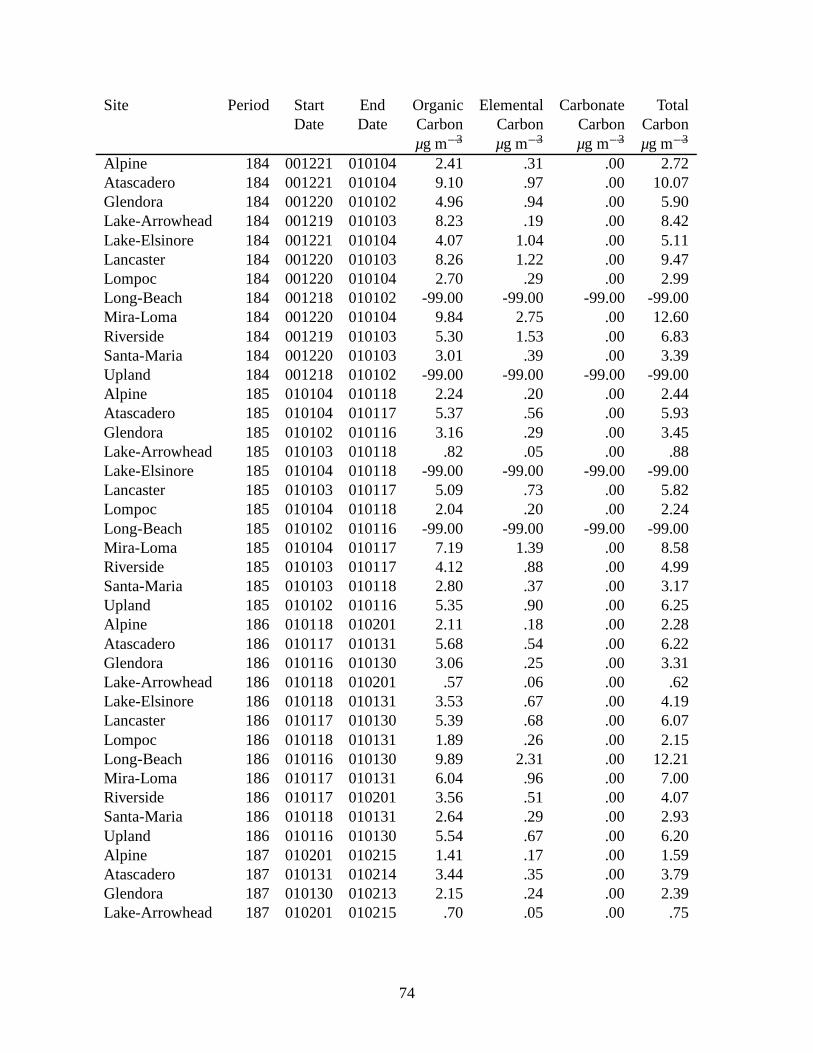
Site Period Start End Organic Elemental Carbonate TotalDate Date Carbon Carbon Carbon Carbon
µg m�3 µg m�3 µg m�3 µg m�3
Alpine 184 001221 010104 2.41 .31 .00 2.72Atascadero 184 001221 010104 9.10 .97 .00 10.07Glendora 184 001220 010102 4.96 .94 .00 5.90Lake-Arrowhead 184 001219 010103 8.23 .19 .00 8.42Lake-Elsinore 184 001221 010104 4.07 1.04 .00 5.11Lancaster 184 001220 010103 8.26 1.22 .00 9.47Lompoc 184 001220 010104 2.70 .29 .00 2.99Long-Beach 184 001218 010102 -99.00 -99.00 -99.00 -99.00Mira-Loma 184 001220 010104 9.84 2.75 .00 12.60Riverside 184 001219 010103 5.30 1.53 .00 6.83Santa-Maria 184 001220 010103 3.01 .39 .00 3.39Upland 184 001218 010102 -99.00 -99.00 -99.00 -99.00Alpine 185 010104 010118 2.24 .20 .00 2.44Atascadero 185 010104 010117 5.37 .56 .00 5.93Glendora 185 010102 010116 3.16 .29 .00 3.45Lake-Arrowhead 185 010103 010118 .82 .05 .00 .88Lake-Elsinore 185 010104 010118 -99.00 -99.00 -99.00 -99.00Lancaster 185 010103 010117 5.09 .73 .00 5.82Lompoc 185 010104 010118 2.04 .20 .00 2.24Long-Beach 185 010102 010116 -99.00 -99.00 -99.00 -99.00Mira-Loma 185 010104 010117 7.19 1.39 .00 8.58Riverside 185 010103 010117 4.12 .88 .00 4.99Santa-Maria 185 010103 010118 2.80 .37 .00 3.17Upland 185 010102 010116 5.35 .90 .00 6.25Alpine 186 010118 010201 2.11 .18 .00 2.28Atascadero 186 010117 010131 5.68 .54 .00 6.22Glendora 186 010116 010130 3.06 .25 .00 3.31Lake-Arrowhead 186 010118 010201 .57 .06 .00 .62Lake-Elsinore 186 010118 010131 3.53 .67 .00 4.19Lancaster 186 010117 010130 5.39 .68 .00 6.07Lompoc 186 010118 010131 1.89 .26 .00 2.15Long-Beach 186 010116 010130 9.89 2.31 .00 12.21Mira-Loma 186 010117 010131 6.04 .96 .00 7.00Riverside 186 010117 010201 3.56 .51 .00 4.07Santa-Maria 186 010118 010131 2.64 .29 .00 2.93Upland 186 010116 010130 5.54 .67 .00 6.20Alpine 187 010201 010215 1.41 .17 .00 1.59Atascadero 187 010131 010214 3.44 .35 .00 3.79Glendora 187 010130 010213 2.15 .24 .00 2.39Lake-Arrowhead 187 010201 010215 .70 .05 .00 .75
74
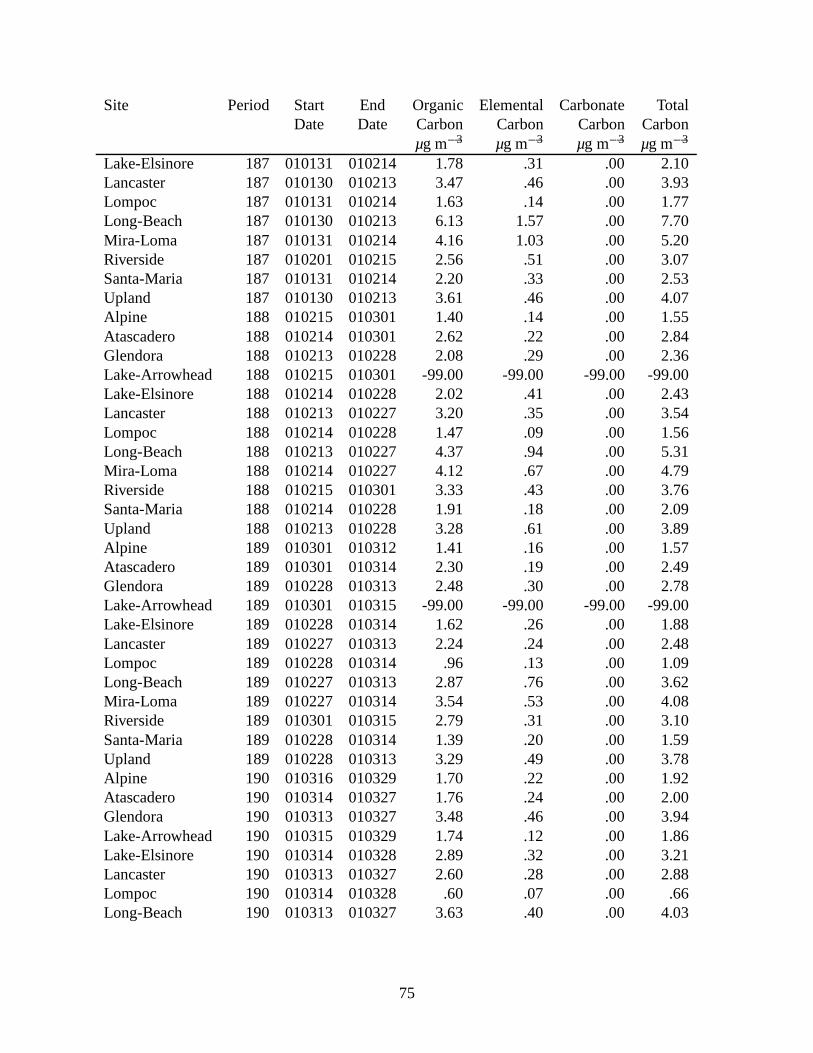
Site Period Start End Organic Elemental Carbonate TotalDate Date Carbon Carbon Carbon Carbon
µg m�3 µg m�3 µg m�3 µg m�3
Lake-Elsinore 187 010131 010214 1.78 .31 .00 2.10Lancaster 187 010130 010213 3.47 .46 .00 3.93Lompoc 187 010131 010214 1.63 .14 .00 1.77Long-Beach 187 010130 010213 6.13 1.57 .00 7.70Mira-Loma 187 010131 010214 4.16 1.03 .00 5.20Riverside 187 010201 010215 2.56 .51 .00 3.07Santa-Maria 187 010131 010214 2.20 .33 .00 2.53Upland 187 010130 010213 3.61 .46 .00 4.07Alpine 188 010215 010301 1.40 .14 .00 1.55Atascadero 188 010214 010301 2.62 .22 .00 2.84Glendora 188 010213 010228 2.08 .29 .00 2.36Lake-Arrowhead 188 010215 010301 -99.00 -99.00 -99.00 -99.00Lake-Elsinore 188 010214 010228 2.02 .41 .00 2.43Lancaster 188 010213 010227 3.20 .35 .00 3.54Lompoc 188 010214 010228 1.47 .09 .00 1.56Long-Beach 188 010213 010227 4.37 .94 .00 5.31Mira-Loma 188 010214 010227 4.12 .67 .00 4.79Riverside 188 010215 010301 3.33 .43 .00 3.76Santa-Maria 188 010214 010228 1.91 .18 .00 2.09Upland 188 010213 010228 3.28 .61 .00 3.89Alpine 189 010301 010312 1.41 .16 .00 1.57Atascadero 189 010301 010314 2.30 .19 .00 2.49Glendora 189 010228 010313 2.48 .30 .00 2.78Lake-Arrowhead 189 010301 010315 -99.00 -99.00 -99.00 -99.00Lake-Elsinore 189 010228 010314 1.62 .26 .00 1.88Lancaster 189 010227 010313 2.24 .24 .00 2.48Lompoc 189 010228 010314 .96 .13 .00 1.09Long-Beach 189 010227 010313 2.87 .76 .00 3.62Mira-Loma 189 010227 010314 3.54 .53 .00 4.08Riverside 189 010301 010315 2.79 .31 .00 3.10Santa-Maria 189 010228 010314 1.39 .20 .00 1.59Upland 189 010228 010313 3.29 .49 .00 3.78Alpine 190 010316 010329 1.70 .22 .00 1.92Atascadero 190 010314 010327 1.76 .24 .00 2.00Glendora 190 010313 010327 3.48 .46 .00 3.94Lake-Arrowhead 190 010315 010329 1.74 .12 .00 1.86Lake-Elsinore 190 010314 010328 2.89 .32 .00 3.21Lancaster 190 010313 010327 2.60 .28 .00 2.88Lompoc 190 010314 010328 .60 .07 .00 .66Long-Beach 190 010313 010327 3.63 .40 .00 4.03
75
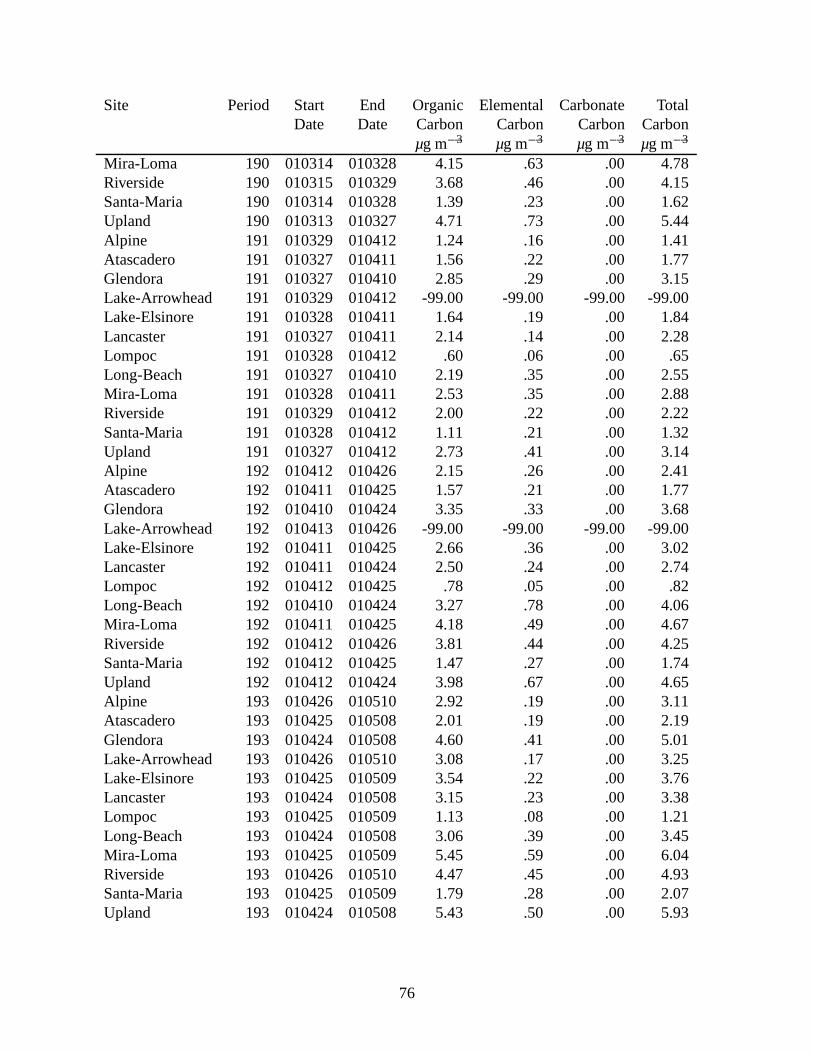
Site Period Start End Organic Elemental Carbonate TotalDate Date Carbon Carbon Carbon Carbon
µg m�3 µg m�3 µg m�3 µg m�3
Mira-Loma 190 010314 010328 4.15 .63 .00 4.78Riverside 190 010315 010329 3.68 .46 .00 4.15Santa-Maria 190 010314 010328 1.39 .23 .00 1.62Upland 190 010313 010327 4.71 .73 .00 5.44Alpine 191 010329 010412 1.24 .16 .00 1.41Atascadero 191 010327 010411 1.56 .22 .00 1.77Glendora 191 010327 010410 2.85 .29 .00 3.15Lake-Arrowhead 191 010329 010412 -99.00 -99.00 -99.00 -99.00Lake-Elsinore 191 010328 010411 1.64 .19 .00 1.84Lancaster 191 010327 010411 2.14 .14 .00 2.28Lompoc 191 010328 010412 .60 .06 .00 .65Long-Beach 191 010327 010410 2.19 .35 .00 2.55Mira-Loma 191 010328 010411 2.53 .35 .00 2.88Riverside 191 010329 010412 2.00 .22 .00 2.22Santa-Maria 191 010328 010412 1.11 .21 .00 1.32Upland 191 010327 010412 2.73 .41 .00 3.14Alpine 192 010412 010426 2.15 .26 .00 2.41Atascadero 192 010411 010425 1.57 .21 .00 1.77Glendora 192 010410 010424 3.35 .33 .00 3.68Lake-Arrowhead 192 010413 010426 -99.00 -99.00 -99.00 -99.00Lake-Elsinore 192 010411 010425 2.66 .36 .00 3.02Lancaster 192 010411 010424 2.50 .24 .00 2.74Lompoc 192 010412 010425 .78 .05 .00 .82Long-Beach 192 010410 010424 3.27 .78 .00 4.06Mira-Loma 192 010411 010425 4.18 .49 .00 4.67Riverside 192 010412 010426 3.81 .44 .00 4.25Santa-Maria 192 010412 010425 1.47 .27 .00 1.74Upland 192 010412 010424 3.98 .67 .00 4.65Alpine 193 010426 010510 2.92 .19 .00 3.11Atascadero 193 010425 010508 2.01 .19 .00 2.19Glendora 193 010424 010508 4.60 .41 .00 5.01Lake-Arrowhead 193 010426 010510 3.08 .17 .00 3.25Lake-Elsinore 193 010425 010509 3.54 .22 .00 3.76Lancaster 193 010424 010508 3.15 .23 .00 3.38Lompoc 193 010425 010509 1.13 .08 .00 1.21Long-Beach 193 010424 010508 3.06 .39 .00 3.45Mira-Loma 193 010425 010509 5.45 .59 .00 6.04Riverside 193 010426 010510 4.47 .45 .00 4.93Santa-Maria 193 010425 010509 1.79 .28 .00 2.07Upland 193 010424 010508 5.43 .50 .00 5.93
76
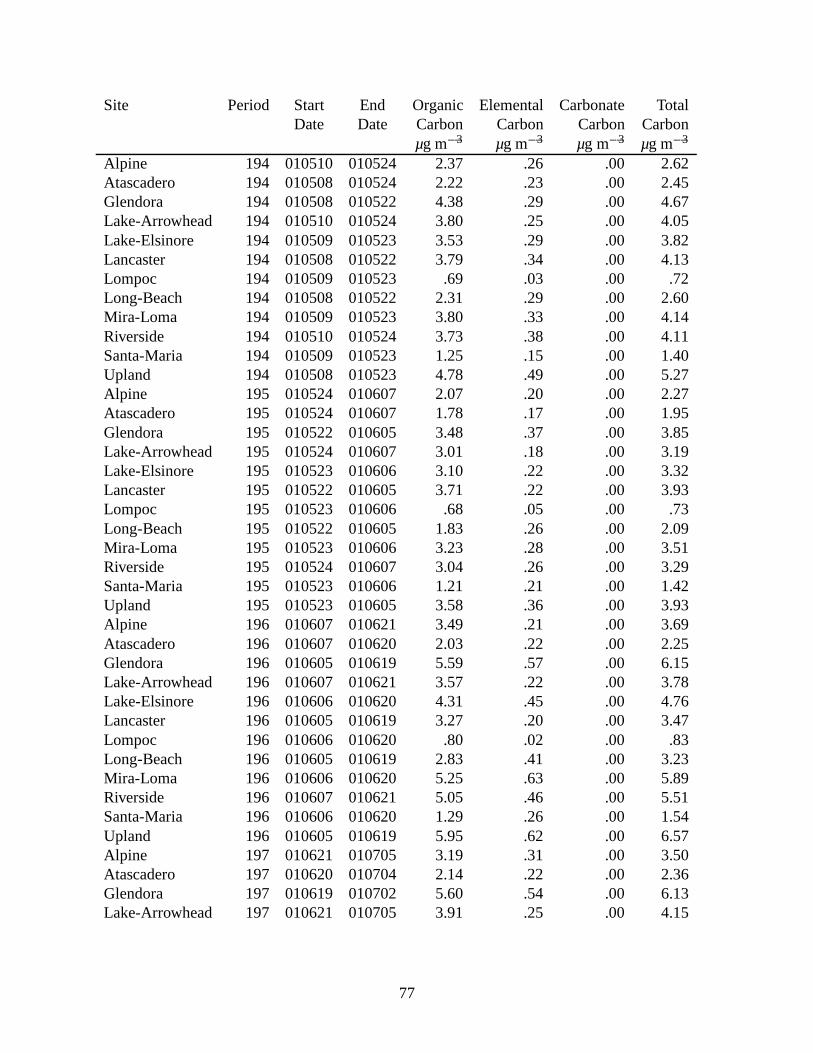
Site Period Start End Organic Elemental Carbonate TotalDate Date Carbon Carbon Carbon Carbon
µg m�3 µg m�3 µg m�3 µg m�3
Alpine 194 010510 010524 2.37 .26 .00 2.62Atascadero 194 010508 010524 2.22 .23 .00 2.45Glendora 194 010508 010522 4.38 .29 .00 4.67Lake-Arrowhead 194 010510 010524 3.80 .25 .00 4.05Lake-Elsinore 194 010509 010523 3.53 .29 .00 3.82Lancaster 194 010508 010522 3.79 .34 .00 4.13Lompoc 194 010509 010523 .69 .03 .00 .72Long-Beach 194 010508 010522 2.31 .29 .00 2.60Mira-Loma 194 010509 010523 3.80 .33 .00 4.14Riverside 194 010510 010524 3.73 .38 .00 4.11Santa-Maria 194 010509 010523 1.25 .15 .00 1.40Upland 194 010508 010523 4.78 .49 .00 5.27Alpine 195 010524 010607 2.07 .20 .00 2.27Atascadero 195 010524 010607 1.78 .17 .00 1.95Glendora 195 010522 010605 3.48 .37 .00 3.85Lake-Arrowhead 195 010524 010607 3.01 .18 .00 3.19Lake-Elsinore 195 010523 010606 3.10 .22 .00 3.32Lancaster 195 010522 010605 3.71 .22 .00 3.93Lompoc 195 010523 010606 .68 .05 .00 .73Long-Beach 195 010522 010605 1.83 .26 .00 2.09Mira-Loma 195 010523 010606 3.23 .28 .00 3.51Riverside 195 010524 010607 3.04 .26 .00 3.29Santa-Maria 195 010523 010606 1.21 .21 .00 1.42Upland 195 010523 010605 3.58 .36 .00 3.93Alpine 196 010607 010621 3.49 .21 .00 3.69Atascadero 196 010607 010620 2.03 .22 .00 2.25Glendora 196 010605 010619 5.59 .57 .00 6.15Lake-Arrowhead 196 010607 010621 3.57 .22 .00 3.78Lake-Elsinore 196 010606 010620 4.31 .45 .00 4.76Lancaster 196 010605 010619 3.27 .20 .00 3.47Lompoc 196 010606 010620 .80 .02 .00 .83Long-Beach 196 010605 010619 2.83 .41 .00 3.23Mira-Loma 196 010606 010620 5.25 .63 .00 5.89Riverside 196 010607 010621 5.05 .46 .00 5.51Santa-Maria 196 010606 010620 1.29 .26 .00 1.54Upland 196 010605 010619 5.95 .62 .00 6.57Alpine 197 010621 010705 3.19 .31 .00 3.50Atascadero 197 010620 010704 2.14 .22 .00 2.36Glendora 197 010619 010702 5.60 .54 .00 6.13Lake-Arrowhead 197 010621 010705 3.91 .25 .00 4.15
77
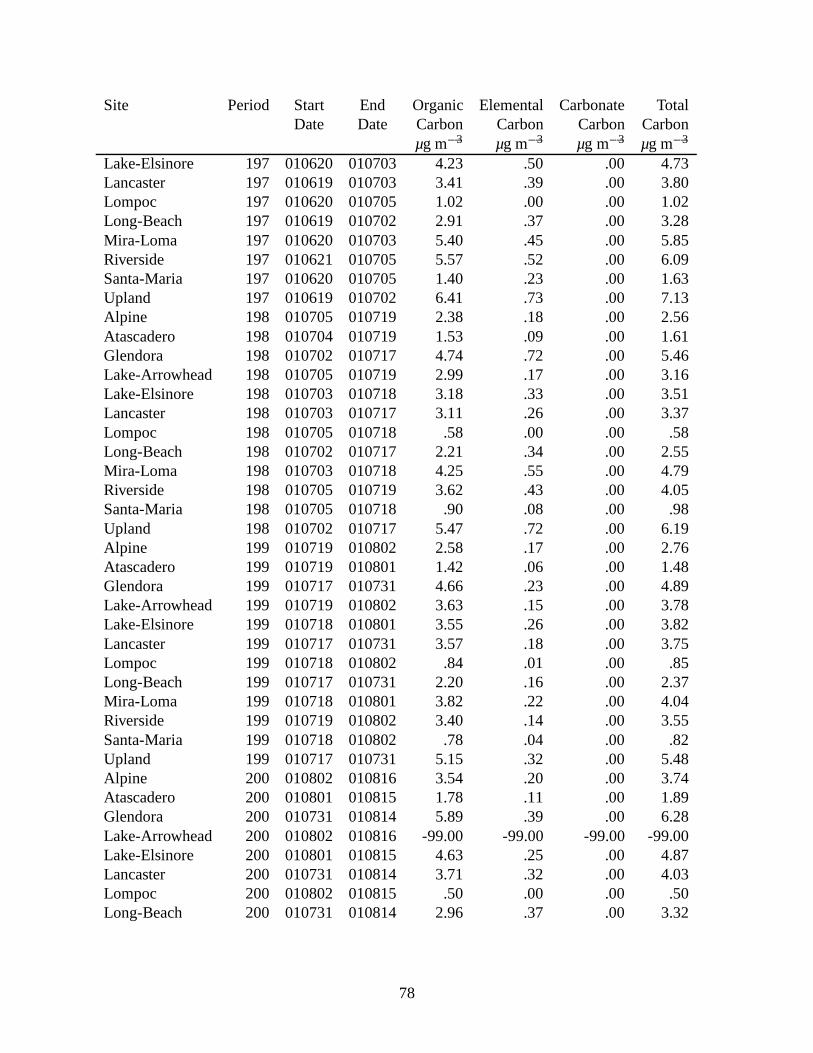
Site Period Start End Organic Elemental Carbonate TotalDate Date Carbon Carbon Carbon Carbon
µg m�3 µg m�3 µg m�3 µg m�3
Lake-Elsinore 197 010620 010703 4.23 .50 .00 4.73Lancaster 197 010619 010703 3.41 .39 .00 3.80Lompoc 197 010620 010705 1.02 .00 .00 1.02Long-Beach 197 010619 010702 2.91 .37 .00 3.28Mira-Loma 197 010620 010703 5.40 .45 .00 5.85Riverside 197 010621 010705 5.57 .52 .00 6.09Santa-Maria 197 010620 010705 1.40 .23 .00 1.63Upland 197 010619 010702 6.41 .73 .00 7.13Alpine 198 010705 010719 2.38 .18 .00 2.56Atascadero 198 010704 010719 1.53 .09 .00 1.61Glendora 198 010702 010717 4.74 .72 .00 5.46Lake-Arrowhead 198 010705 010719 2.99 .17 .00 3.16Lake-Elsinore 198 010703 010718 3.18 .33 .00 3.51Lancaster 198 010703 010717 3.11 .26 .00 3.37Lompoc 198 010705 010718 .58 .00 .00 .58Long-Beach 198 010702 010717 2.21 .34 .00 2.55Mira-Loma 198 010703 010718 4.25 .55 .00 4.79Riverside 198 010705 010719 3.62 .43 .00 4.05Santa-Maria 198 010705 010718 .90 .08 .00 .98Upland 198 010702 010717 5.47 .72 .00 6.19Alpine 199 010719 010802 2.58 .17 .00 2.76Atascadero 199 010719 010801 1.42 .06 .00 1.48Glendora 199 010717 010731 4.66 .23 .00 4.89Lake-Arrowhead 199 010719 010802 3.63 .15 .00 3.78Lake-Elsinore 199 010718 010801 3.55 .26 .00 3.82Lancaster 199 010717 010731 3.57 .18 .00 3.75Lompoc 199 010718 010802 .84 .01 .00 .85Long-Beach 199 010717 010731 2.20 .16 .00 2.37Mira-Loma 199 010718 010801 3.82 .22 .00 4.04Riverside 199 010719 010802 3.40 .14 .00 3.55Santa-Maria 199 010718 010802 .78 .04 .00 .82Upland 199 010717 010731 5.15 .32 .00 5.48Alpine 200 010802 010816 3.54 .20 .00 3.74Atascadero 200 010801 010815 1.78 .11 .00 1.89Glendora 200 010731 010814 5.89 .39 .00 6.28Lake-Arrowhead 200 010802 010816 -99.00 -99.00 -99.00 -99.00Lake-Elsinore 200 010801 010815 4.63 .25 .00 4.87Lancaster 200 010731 010814 3.71 .32 .00 4.03Lompoc 200 010802 010815 .50 .00 .00 .50Long-Beach 200 010731 010814 2.96 .37 .00 3.32
78
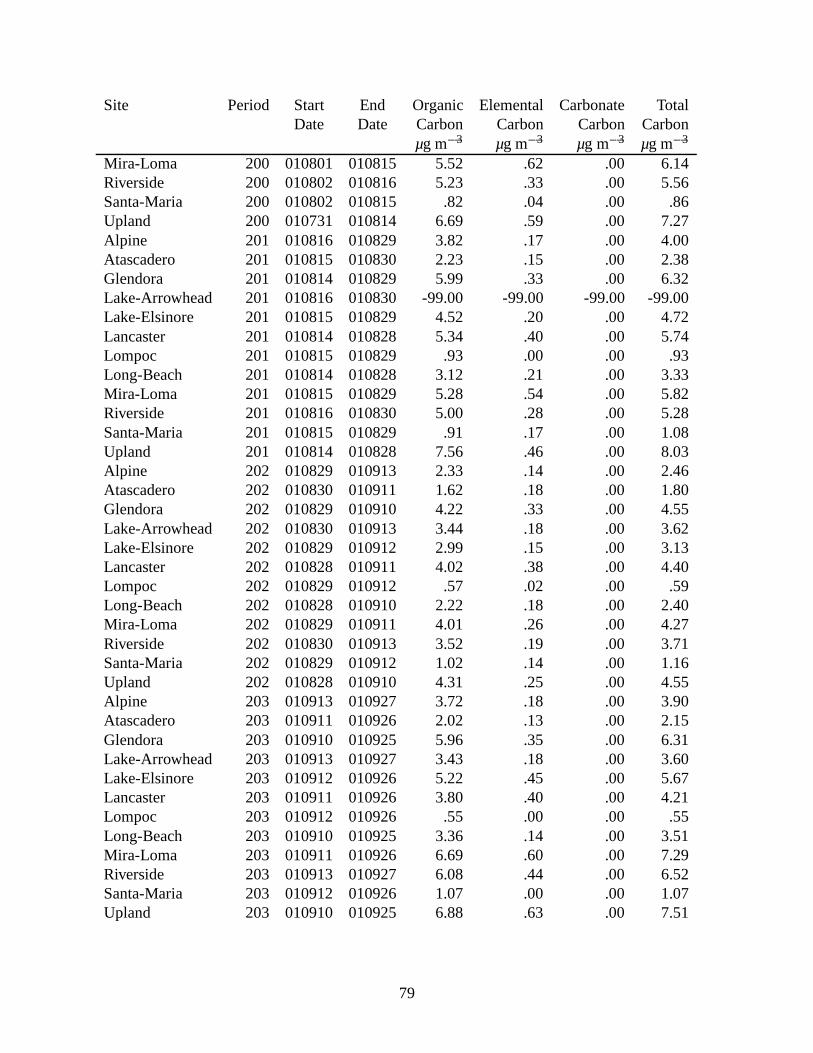
Site Period Start End Organic Elemental Carbonate TotalDate Date Carbon Carbon Carbon Carbon
µg m�3 µg m�3 µg m�3 µg m�3
Mira-Loma 200 010801 010815 5.52 .62 .00 6.14Riverside 200 010802 010816 5.23 .33 .00 5.56Santa-Maria 200 010802 010815 .82 .04 .00 .86Upland 200 010731 010814 6.69 .59 .00 7.27Alpine 201 010816 010829 3.82 .17 .00 4.00Atascadero 201 010815 010830 2.23 .15 .00 2.38Glendora 201 010814 010829 5.99 .33 .00 6.32Lake-Arrowhead 201 010816 010830 -99.00 -99.00 -99.00 -99.00Lake-Elsinore 201 010815 010829 4.52 .20 .00 4.72Lancaster 201 010814 010828 5.34 .40 .00 5.74Lompoc 201 010815 010829 .93 .00 .00 .93Long-Beach 201 010814 010828 3.12 .21 .00 3.33Mira-Loma 201 010815 010829 5.28 .54 .00 5.82Riverside 201 010816 010830 5.00 .28 .00 5.28Santa-Maria 201 010815 010829 .91 .17 .00 1.08Upland 201 010814 010828 7.56 .46 .00 8.03Alpine 202 010829 010913 2.33 .14 .00 2.46Atascadero 202 010830 010911 1.62 .18 .00 1.80Glendora 202 010829 010910 4.22 .33 .00 4.55Lake-Arrowhead 202 010830 010913 3.44 .18 .00 3.62Lake-Elsinore 202 010829 010912 2.99 .15 .00 3.13Lancaster 202 010828 010911 4.02 .38 .00 4.40Lompoc 202 010829 010912 .57 .02 .00 .59Long-Beach 202 010828 010910 2.22 .18 .00 2.40Mira-Loma 202 010829 010911 4.01 .26 .00 4.27Riverside 202 010830 010913 3.52 .19 .00 3.71Santa-Maria 202 010829 010912 1.02 .14 .00 1.16Upland 202 010828 010910 4.31 .25 .00 4.55Alpine 203 010913 010927 3.72 .18 .00 3.90Atascadero 203 010911 010926 2.02 .13 .00 2.15Glendora 203 010910 010925 5.96 .35 .00 6.31Lake-Arrowhead 203 010913 010927 3.43 .18 .00 3.60Lake-Elsinore 203 010912 010926 5.22 .45 .00 5.67Lancaster 203 010911 010926 3.80 .40 .00 4.21Lompoc 203 010912 010926 .55 .00 .00 .55Long-Beach 203 010910 010925 3.36 .14 .00 3.51Mira-Loma 203 010911 010926 6.69 .60 .00 7.29Riverside 203 010913 010927 6.08 .44 .00 6.52Santa-Maria 203 010912 010926 1.07 .00 .00 1.07Upland 203 010910 010925 6.88 .63 .00 7.51
79
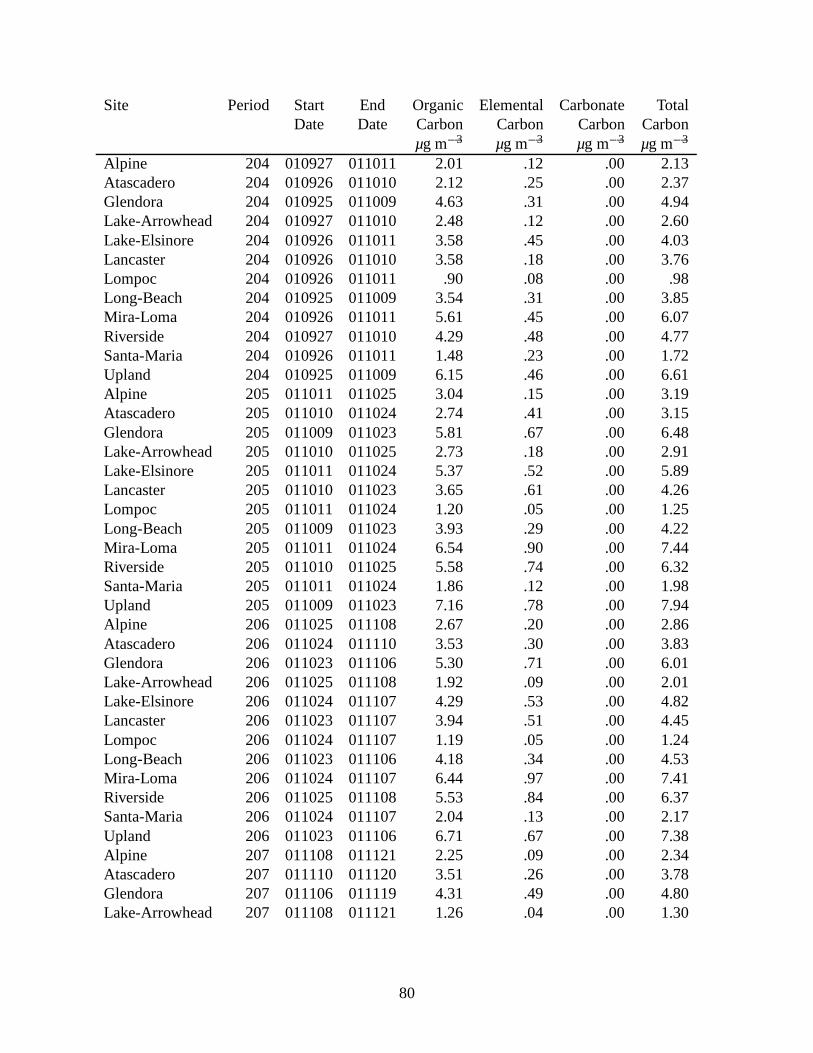
Site Period Start End Organic Elemental Carbonate TotalDate Date Carbon Carbon Carbon Carbon
µg m�3 µg m�3 µg m�3 µg m�3
Alpine 204 010927 011011 2.01 .12 .00 2.13Atascadero 204 010926 011010 2.12 .25 .00 2.37Glendora 204 010925 011009 4.63 .31 .00 4.94Lake-Arrowhead 204 010927 011010 2.48 .12 .00 2.60Lake-Elsinore 204 010926 011011 3.58 .45 .00 4.03Lancaster 204 010926 011010 3.58 .18 .00 3.76Lompoc 204 010926 011011 .90 .08 .00 .98Long-Beach 204 010925 011009 3.54 .31 .00 3.85Mira-Loma 204 010926 011011 5.61 .45 .00 6.07Riverside 204 010927 011010 4.29 .48 .00 4.77Santa-Maria 204 010926 011011 1.48 .23 .00 1.72Upland 204 010925 011009 6.15 .46 .00 6.61Alpine 205 011011 011025 3.04 .15 .00 3.19Atascadero 205 011010 011024 2.74 .41 .00 3.15Glendora 205 011009 011023 5.81 .67 .00 6.48Lake-Arrowhead 205 011010 011025 2.73 .18 .00 2.91Lake-Elsinore 205 011011 011024 5.37 .52 .00 5.89Lancaster 205 011010 011023 3.65 .61 .00 4.26Lompoc 205 011011 011024 1.20 .05 .00 1.25Long-Beach 205 011009 011023 3.93 .29 .00 4.22Mira-Loma 205 011011 011024 6.54 .90 .00 7.44Riverside 205 011010 011025 5.58 .74 .00 6.32Santa-Maria 205 011011 011024 1.86 .12 .00 1.98Upland 205 011009 011023 7.16 .78 .00 7.94Alpine 206 011025 011108 2.67 .20 .00 2.86Atascadero 206 011024 011110 3.53 .30 .00 3.83Glendora 206 011023 011106 5.30 .71 .00 6.01Lake-Arrowhead 206 011025 011108 1.92 .09 .00 2.01Lake-Elsinore 206 011024 011107 4.29 .53 .00 4.82Lancaster 206 011023 011107 3.94 .51 .00 4.45Lompoc 206 011024 011107 1.19 .05 .00 1.24Long-Beach 206 011023 011106 4.18 .34 .00 4.53Mira-Loma 206 011024 011107 6.44 .97 .00 7.41Riverside 206 011025 011108 5.53 .84 .00 6.37Santa-Maria 206 011024 011107 2.04 .13 .00 2.17Upland 206 011023 011106 6.71 .67 .00 7.38Alpine 207 011108 011121 2.25 .09 .00 2.34Atascadero 207 011110 011120 3.51 .26 .00 3.78Glendora 207 011106 011119 4.31 .49 .00 4.80Lake-Arrowhead 207 011108 011121 1.26 .04 .00 1.30
80
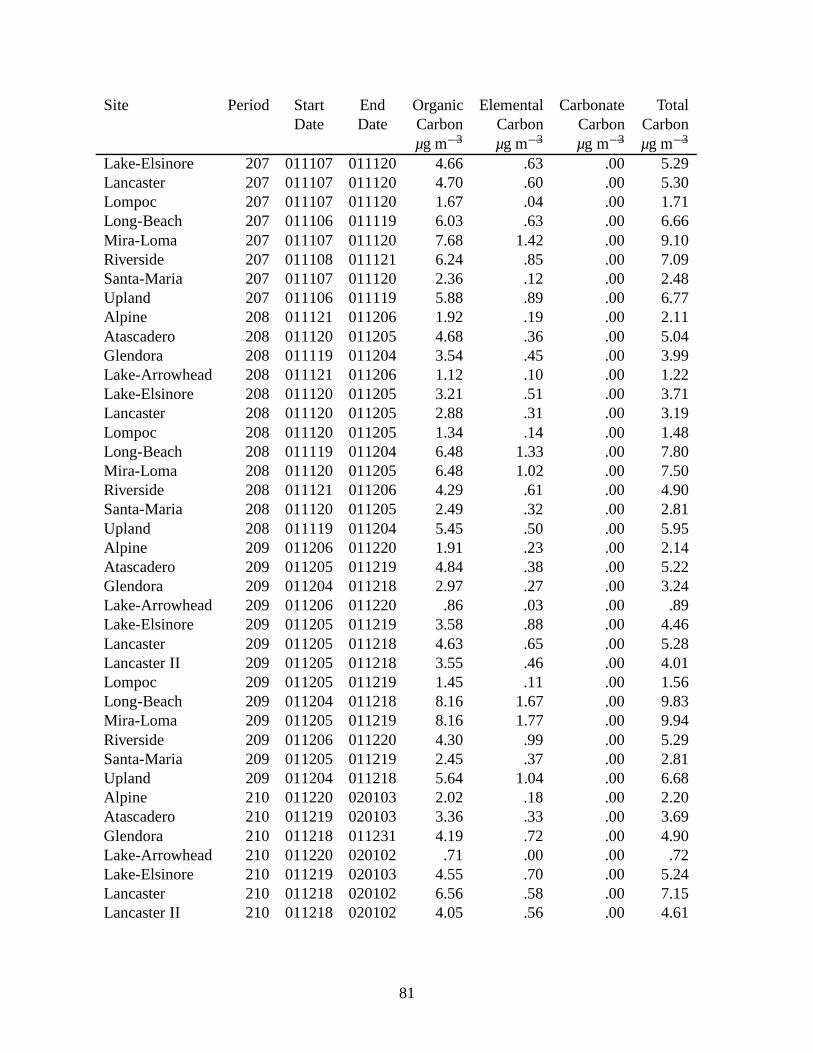
Site Period Start End Organic Elemental Carbonate TotalDate Date Carbon Carbon Carbon Carbon
µg m�3 µg m�3 µg m�3 µg m�3
Lake-Elsinore 207 011107 011120 4.66 .63 .00 5.29Lancaster 207 011107 011120 4.70 .60 .00 5.30Lompoc 207 011107 011120 1.67 .04 .00 1.71Long-Beach 207 011106 011119 6.03 .63 .00 6.66Mira-Loma 207 011107 011120 7.68 1.42 .00 9.10Riverside 207 011108 011121 6.24 .85 .00 7.09Santa-Maria 207 011107 011120 2.36 .12 .00 2.48Upland 207 011106 011119 5.88 .89 .00 6.77Alpine 208 011121 011206 1.92 .19 .00 2.11Atascadero 208 011120 011205 4.68 .36 .00 5.04Glendora 208 011119 011204 3.54 .45 .00 3.99Lake-Arrowhead 208 011121 011206 1.12 .10 .00 1.22Lake-Elsinore 208 011120 011205 3.21 .51 .00 3.71Lancaster 208 011120 011205 2.88 .31 .00 3.19Lompoc 208 011120 011205 1.34 .14 .00 1.48Long-Beach 208 011119 011204 6.48 1.33 .00 7.80Mira-Loma 208 011120 011205 6.48 1.02 .00 7.50Riverside 208 011121 011206 4.29 .61 .00 4.90Santa-Maria 208 011120 011205 2.49 .32 .00 2.81Upland 208 011119 011204 5.45 .50 .00 5.95Alpine 209 011206 011220 1.91 .23 .00 2.14Atascadero 209 011205 011219 4.84 .38 .00 5.22Glendora 209 011204 011218 2.97 .27 .00 3.24Lake-Arrowhead 209 011206 011220 .86 .03 .00 .89Lake-Elsinore 209 011205 011219 3.58 .88 .00 4.46Lancaster 209 011205 011218 4.63 .65 .00 5.28Lancaster II 209 011205 011218 3.55 .46 .00 4.01Lompoc 209 011205 011219 1.45 .11 .00 1.56Long-Beach 209 011204 011218 8.16 1.67 .00 9.83Mira-Loma 209 011205 011219 8.16 1.77 .00 9.94Riverside 209 011206 011220 4.30 .99 .00 5.29Santa-Maria 209 011205 011219 2.45 .37 .00 2.81Upland 209 011204 011218 5.64 1.04 .00 6.68Alpine 210 011220 020103 2.02 .18 .00 2.20Atascadero 210 011219 020103 3.36 .33 .00 3.69Glendora 210 011218 011231 4.19 .72 .00 4.90Lake-Arrowhead 210 011220 020102 .71 .00 .00 .72Lake-Elsinore 210 011219 020103 4.55 .70 .00 5.24Lancaster 210 011218 020102 6.56 .58 .00 7.15Lancaster II 210 011218 020102 4.05 .56 .00 4.61
81
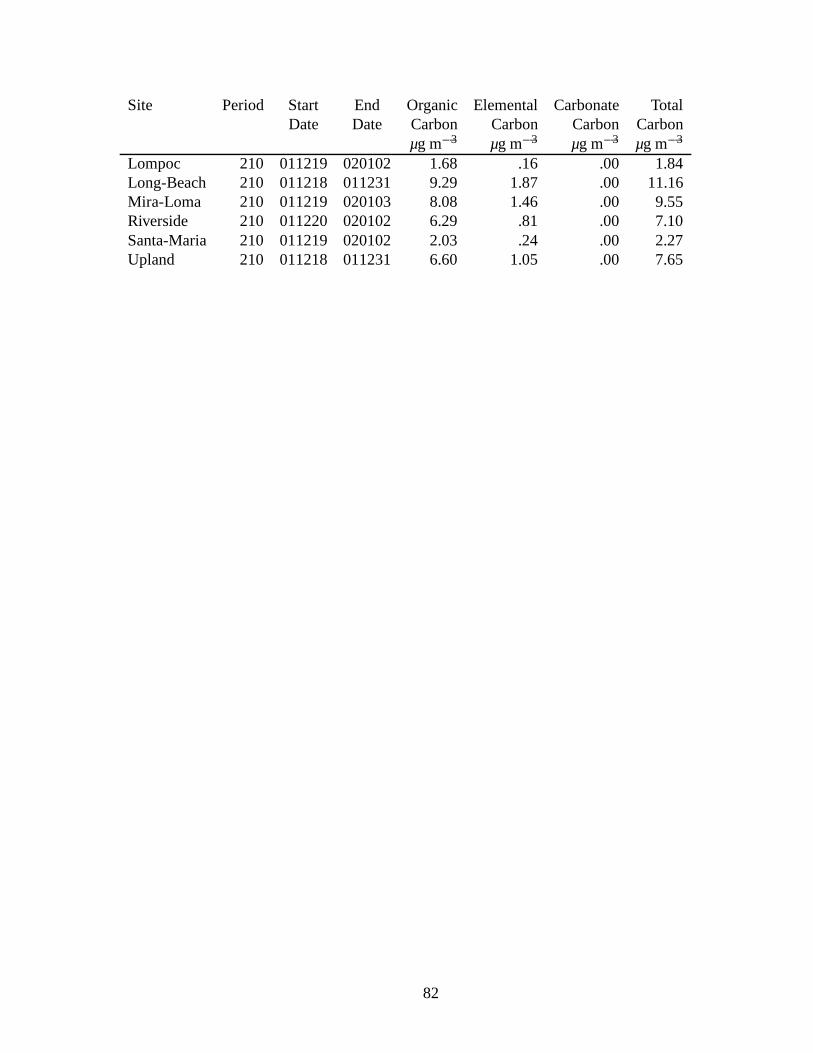
Site Period Start End Organic Elemental Carbonate TotalDate Date Carbon Carbon Carbon Carbon
µg m�3 µg m�3 µg m�3 µg m�3
Lompoc 210 011219 020102 1.68 .16 .00 1.84Long-Beach 210 011218 011231 9.29 1.87 .00 11.16Mira-Loma 210 011219 020103 8.08 1.46 .00 9.55Riverside 210 011220 020102 6.29 .81 .00 7.10Santa-Maria 210 011219 020102 2.03 .24 .00 2.27Upland 210 011218 011231 6.60 1.05 .00 7.65
82