Embed Size (px)
Citation preview

Determination of Actual Human Resources for Health Staffing Requirements Using Workload Indictors for
Staffing Needs Methodology
A Case Study
A Post Graduate Research Dissertation presented to the Institute of Health Policy and Management in
Partial Fulfillment of the Requirements for the Award of a Masters Degree in Business Administration-
Health Management
of
International Health Sciences University
Patrick, Nalere2010-MBA-PT-012
December, 2012
1

DECLARATION
I Patrick Nalere, declare that the work presented in this study is my own, that all
sources used or quoted have been indicated and acknowledged by names of
complete references and that it has never been presented anywhere for award of
any degree.
Candidate:
Signed …………………………………………...………………………………..…
Patrick Nalere,
Date: …………………………………….…………………………………..……….
Supervisors:
Signed ……………………….………………………………………………………
Okiria John Charles
Date: ………………………………..…………………….…………….……………
2

DEDICATION
To my wife and children that endured my absence while concentrating on the study program.
3

DEDICATION.................................................................................3
6.2.1 IMPROVING DISTRIBUTION OF HEALTH WORKERS IN PUBLIC HEALTH FACILITIES…………...55....................................................11
ABSTRACT..................................................................................20
CHAPTER ONE.............................................................................21
INTRODUCTION...........................................................................21
1.0 INTRODUCTION......................................................................21
1.1 BACKGROUND TO THE STUDY.................................................21
1.3 STATEMENT OF THE PROBLEM ...............................................25
1.5 OVERALL OBJECTIVE .............................................................26
1.5.2 Specific Objectives ..................................................................................26
1.5.3 Research Questions ................................................................................26
1.10 OPERATIONAL DEFINITIONS .................................................31
LITERATURE REVIEW...................................................................34
2.1 HEALTH WORKERS’ STAFFING NORMS AND STAFFING REQUIREMENTS ..........................................................................34
2.2 HUMAN RESOURCE FOR HEALTH WORKLOAD...........................35
2.5 TASK SHIFTING AMONG HEALTH WORKERS ............................40
CHAPTER THREE..........................................................................42
RESEARCH METHODOLOGY..........................................................42
4

3.0 INTRODUCTION......................................................................42
3.1 RESEARCH DESIGN................................................................42
3.2.3 Data Analysis and Interpretation .............................................................46
DATA PRESENTATION, ANALYSIS AND INTERPRETATION.....................................49
4.0 INTRODUCTION......................................................................49
4.1.1 The Actual Number and WISN Staffing Recommended for Mityana District. 50
Actual number and WISN Recommended health workers that are required to cope with current workload in public health facilities are calculated below in Table 4.1. Indeed table 4.1 revealed that the district of Mityan in the year 2011 (January – December) had an actual total number of 252 health workers. This comprised of 10 doctors, 26 Clinical Officers, 105 nurses, 83 midwives and 30 Nursing Assistants. Of the 252 health workers in the district, 112 were working at the General Hospital, 37 at Health Centre IVs, 57 at Health Centre IIIs, and 48 at Health Centre IIs. The details of the number of each category of workers are presented in table 4.1 below............................................................................50
4.1.3 The Actual Number and WISN Staffing Recommended for Health Centre IIIs .......................................................................................................................55
4.1.4 The Actual Number and WISN Staffing Recommended for Health Centre IVs .......................................................................................................................58
CHAPTER FIVE.............................................................................62
5.1 SUMMARY OF IMPORTANT FINDINGS ......................................62
5.2.1 Current Staff Status – Over or Understaffing ............................................63
5.2.2 Current Staff and Workload Pressure .......................................................64
5.4 IMPLICATIONS OF UNDERSTAFFING AND OVERSTAFFING IN HEALTH FACILITIES ....................................................................71
CONCLUSION AND RECOMMENDATIONS........................................75
6.0 INTRODUCTION......................................................................75
6.1 CONCLUSIONS ......................................................................75
5

6.2.4 General and Policy Recommendations.......................................................81
6.2.5 Recommendations for Further Research...................................................82
This study research on determining the appropriate number of actual staffing gap, cadre mix and work pressures in all public health facilities in Mityana District focused essentially on numbers of the selected health workers per se for the Public Health Centres to cope with its workload. This only emphasizes effective management of the valuable Health Human Resources, without looking at its quality, motivations, and remunerations among others things. .........................83
REFERENCES....................................................................................................84
APPENDICES...............................................................................89
APPENDIX 1: LETTER OF INTRODUCTION............................................................89
APPENDIX 3: HMIS 105: HEALTH UNIT MONTHLY REPORT ..................................92
APPENDIX 4: HMIS 108: HEALTH UNIT INPATIENT MONTHLY REPORT..................95
1.10 OPERATIONAL DEFINITIONS.......................................................................................................11
DEDICATION.................................................................................3
6.2.1 IMPROVING DISTRIBUTION OF HEALTH WORKERS IN PUBLIC HEALTH FACILITIES…………...55....................................................11
ABSTRACT..................................................................................20
CHAPTER ONE.............................................................................21
INTRODUCTION...........................................................................21
1.0 INTRODUCTION......................................................................21
1.1 BACKGROUND TO THE STUDY.................................................21
6

1.3 STATEMENT OF THE PROBLEM ...............................................25
1.5 OVERALL OBJECTIVE .............................................................26
1.5.2 Specific Objectives ..................................................................................26
1.5.3 Research Questions ................................................................................26
1.10 OPERATIONAL DEFINITIONS .................................................31
LITERATURE REVIEW...................................................................34
2.1 HEALTH WORKERS’ STAFFING NORMS AND STAFFING REQUIREMENTS ..........................................................................34
2.2 HUMAN RESOURCE FOR HEALTH WORKLOAD...........................35
2.5 TASK SHIFTING AMONG HEALTH WORKERS ............................40
CHAPTER THREE..........................................................................42
RESEARCH METHODOLOGY..........................................................42
3.0 INTRODUCTION......................................................................42
3.1 RESEARCH DESIGN................................................................42
3.2.3 Data Analysis and Interpretation .............................................................46
DATA PRESENTATION, ANALYSIS AND INTERPRETATION.....................................49
4.0 INTRODUCTION......................................................................49
4.1.1 The Actual Number and WISN Staffing Recommended for Mityana District. 50
Actual number and WISN Recommended health workers that are required to cope with current workload in public health facilities are calculated below in Table 4.1. Indeed table 4.1 revealed that the district of Mityan in the year 2011 (January – December) had an actual total number of 252 health workers. This comprised of 10 doctors, 26 Clinical Officers, 105 nurses, 83 midwives and 30 Nursing Assistants. Of the 252 health workers in the district, 112 were working at the General Hospital, 37 at Health Centre IVs, 57 at Health Centre IIIs, and 48 at
7
Health Centre IIs. The details of the number of each category of workers are presented in table 4.1 below............................................................................50
4.1.3 The Actual Number and WISN Staffing Recommended for Health Centre IIIs .......................................................................................................................55
4.1.4 The Actual Number and WISN Staffing Recommended for Health Centre IVs .......................................................................................................................58
CHAPTER FIVE.............................................................................62
5.1 SUMMARY OF IMPORTANT FINDINGS ......................................62
5.2.1 Current Staff Status – Over or Understaffing ............................................63
5.2.2 Current Staff and Workload Pressure .......................................................64
5.4 IMPLICATIONS OF UNDERSTAFFING AND OVERSTAFFING IN HEALTH FACILITIES ....................................................................71
CONCLUSION AND RECOMMENDATIONS........................................75
6.0 INTRODUCTION......................................................................75
6.1 CONCLUSIONS ......................................................................75
6.2.4 General and Policy Recommendations.......................................................81
6.2.5 Recommendations for Further Research...................................................82
This study research on determining the appropriate number of actual staffing gap, cadre mix and work pressures in all public health facilities in Mityana District focused essentially on numbers of the selected health workers per se for the Public Health Centres to cope with its workload. This only emphasizes effective management of the valuable Health Human Resources, without looking at its quality, motivations, and remunerations among others things. .........................83
REFERENCES....................................................................................................84
APPENDICES...............................................................................89
APPENDIX 1: LETTER OF INTRODUCTION............................................................89
APPENDIX 3: HMIS 105: HEALTH UNIT MONTHLY REPORT ..................................92
APPENDIX 4: HMIS 108: HEALTH UNIT INPATIENT MONTHLY REPORT..................95
8

4.1.1 The Actual Number and WISN Staffing Recommended for Mityana District.............................29
4.1.2 The Actual Number and WISN Staffing Recommended for Health Centre IIs...........................30
4.1.3 The Actual Number and WISN Staffing Recommended for Health Centre IIIs..........................35
4.1.4 The Actual Number and WISN Staffing Recommended for Health Centre IVs..........................38
4.1.5 The Actual Number and WISN Staffing Recommended for The General Hospital....................40
DEDICATION.................................................................................3
6.2.1 IMPROVING DISTRIBUTION OF HEALTH WORKERS IN PUBLIC HEALTH FACILITIES…………...55....................................................11
ABSTRACT..................................................................................20
CHAPTER ONE.............................................................................21
INTRODUCTION...........................................................................21
1.0 INTRODUCTION......................................................................21
1.1 BACKGROUND TO THE STUDY.................................................21
1.3 STATEMENT OF THE PROBLEM ...............................................25
1.5 OVERALL OBJECTIVE .............................................................26
1.5.2 Specific Objectives ..................................................................................26
1.5.3 Research Questions ................................................................................26
1.10 OPERATIONAL DEFINITIONS .................................................31
LITERATURE REVIEW...................................................................34
9

2.1 HEALTH WORKERS’ STAFFING NORMS AND STAFFING REQUIREMENTS ..........................................................................34
2.2 HUMAN RESOURCE FOR HEALTH WORKLOAD...........................35
2.5 TASK SHIFTING AMONG HEALTH WORKERS ............................40
CHAPTER THREE..........................................................................42
RESEARCH METHODOLOGY..........................................................42
3.0 INTRODUCTION......................................................................42
3.1 RESEARCH DESIGN................................................................42
3.2.3 Data Analysis and Interpretation .............................................................46
DATA PRESENTATION, ANALYSIS AND INTERPRETATION.....................................49
4.0 INTRODUCTION......................................................................49
4.1.1 The Actual Number and WISN Staffing Recommended for Mityana District. 50
Actual number and WISN Recommended health workers that are required to cope with current workload in public health facilities are calculated below in Table 4.1. Indeed table 4.1 revealed that the district of Mityan in the year 2011 (January – December) had an actual total number of 252 health workers. This comprised of 10 doctors, 26 Clinical Officers, 105 nurses, 83 midwives and 30 Nursing Assistants. Of the 252 health workers in the district, 112 were working at the General Hospital, 37 at Health Centre IVs, 57 at Health Centre IIIs, and 48 at Health Centre IIs. The details of the number of each category of workers are presented in table 4.1 below............................................................................50
4.1.3 The Actual Number and WISN Staffing Recommended for Health Centre IIIs .......................................................................................................................55
4.1.4 The Actual Number and WISN Staffing Recommended for Health Centre IVs .......................................................................................................................58
CHAPTER FIVE.............................................................................62
5.1 SUMMARY OF IMPORTANT FINDINGS ......................................62
5.2.1 Current Staff Status – Over or Understaffing ............................................63
10
5.2.2 Current Staff and Workload Pressure .......................................................64
5.4 IMPLICATIONS OF UNDERSTAFFING AND OVERSTAFFING IN HEALTH FACILITIES ....................................................................71
CONCLUSION AND RECOMMENDATIONS........................................75
6.0 INTRODUCTION......................................................................75
6.1 CONCLUSIONS ......................................................................75
6.2.4 General and Policy Recommendations.......................................................81
6.2.5 Recommendations for Further Research...................................................82
This study research on determining the appropriate number of actual staffing gap, cadre mix and work pressures in all public health facilities in Mityana District focused essentially on numbers of the selected health workers per se for the Public Health Centres to cope with its workload. This only emphasizes effective management of the valuable Health Human Resources, without looking at its quality, motivations, and remunerations among others things. .........................83
REFERENCES....................................................................................................84
APPENDICES...............................................................................89
APPENDIX 1: LETTER OF INTRODUCTION............................................................89
APPENDIX 3: HMIS 105: HEALTH UNIT MONTHLY REPORT ..................................92
APPENDIX 4: HMIS 108: HEALTH UNIT INPATIENT MONTHLY REPORT..................95
6.2 RECOMMENDATIONS.................................................................................................55
6.2.1 Improving Distribution of Health Workers in Public Health Facilities…………...55
DEDICATION.................................................................................3
6.2.1 IMPROVING DISTRIBUTION OF HEALTH WORKERS IN PUBLIC HEALTH FACILITIES…………...55....................................................11
11

ABSTRACT..................................................................................20
CHAPTER ONE.............................................................................21
INTRODUCTION...........................................................................21
1.0 INTRODUCTION......................................................................21
1.1 BACKGROUND TO THE STUDY.................................................21
1.3 STATEMENT OF THE PROBLEM ...............................................25
1.5 OVERALL OBJECTIVE .............................................................26
1.5.2 Specific Objectives ..................................................................................26
1.5.3 Research Questions ................................................................................26
1.10 OPERATIONAL DEFINITIONS .................................................31
LITERATURE REVIEW...................................................................34
2.1 HEALTH WORKERS’ STAFFING NORMS AND STAFFING REQUIREMENTS ..........................................................................34
2.2 HUMAN RESOURCE FOR HEALTH WORKLOAD...........................35
2.5 TASK SHIFTING AMONG HEALTH WORKERS ............................40
CHAPTER THREE..........................................................................42
RESEARCH METHODOLOGY..........................................................42
3.0 INTRODUCTION......................................................................42
3.1 RESEARCH DESIGN................................................................42
3.2.3 Data Analysis and Interpretation .............................................................46
DATA PRESENTATION, ANALYSIS AND INTERPRETATION.....................................49
12

4.0 INTRODUCTION......................................................................49
4.1.1 The Actual Number and WISN Staffing Recommended for Mityana District. 50
Actual number and WISN Recommended health workers that are required to cope with current workload in public health facilities are calculated below in Table 4.1. Indeed table 4.1 revealed that the district of Mityan in the year 2011 (January – December) had an actual total number of 252 health workers. This comprised of 10 doctors, 26 Clinical Officers, 105 nurses, 83 midwives and 30 Nursing Assistants. Of the 252 health workers in the district, 112 were working at the General Hospital, 37 at Health Centre IVs, 57 at Health Centre IIIs, and 48 at Health Centre IIs. The details of the number of each category of workers are presented in table 4.1 below............................................................................50
4.1.3 The Actual Number and WISN Staffing Recommended for Health Centre IIIs .......................................................................................................................55
4.1.4 The Actual Number and WISN Staffing Recommended for Health Centre IVs .......................................................................................................................58
CHAPTER FIVE.............................................................................62
5.1 SUMMARY OF IMPORTANT FINDINGS ......................................62
5.2.1 Current Staff Status – Over or Understaffing ............................................63
5.2.2 Current Staff and Workload Pressure .......................................................64
5.4 IMPLICATIONS OF UNDERSTAFFING AND OVERSTAFFING IN HEALTH FACILITIES ....................................................................71
CONCLUSION AND RECOMMENDATIONS........................................75
6.0 INTRODUCTION......................................................................75
6.1 CONCLUSIONS ......................................................................75
6.2.4 General and Policy Recommendations.......................................................81
6.2.5 Recommendations for Further Research...................................................82
This study research on determining the appropriate number of actual staffing gap, cadre mix and work pressures in all public health facilities in Mityana District focused essentially on numbers of the selected health workers per se for the Public Health Centres to cope with its workload. This only emphasizes effective
13

management of the valuable Health Human Resources, without looking at its quality, motivations, and remunerations among others things. .........................83
REFERENCES....................................................................................................84
APPENDICES...............................................................................89
APPENDIX 1: LETTER OF INTRODUCTION............................................................89
APPENDIX 3: HMIS 105: HEALTH UNIT MONTHLY REPORT ..................................92
APPENDIX 4: HMIS 108: HEALTH UNIT INPATIENT MONTHLY REPORT..................95
14

DEDICATION.................................................................................3
6.2.1 IMPROVING DISTRIBUTION OF HEALTH WORKERS IN PUBLIC HEALTH FACILITIES…………...55....................................................11
ABSTRACT..................................................................................20
CHAPTER ONE.............................................................................21
INTRODUCTION...........................................................................21
1.0 INTRODUCTION......................................................................21
1.1 BACKGROUND TO THE STUDY.................................................21
1.3 STATEMENT OF THE PROBLEM ...............................................25
1.5 OVERALL OBJECTIVE .............................................................26
1.5.2 Specific Objectives ..................................................................................26
1.5.3 Research Questions ................................................................................26
1.10 OPERATIONAL DEFINITIONS .................................................31
LITERATURE REVIEW...................................................................34
2.1 HEALTH WORKERS’ STAFFING NORMS AND STAFFING REQUIREMENTS ..........................................................................34
2.2 HUMAN RESOURCE FOR HEALTH WORKLOAD...........................35
2.5 TASK SHIFTING AMONG HEALTH WORKERS ............................40
CHAPTER THREE..........................................................................42
RESEARCH METHODOLOGY..........................................................42
15

3.0 INTRODUCTION......................................................................42
3.1 RESEARCH DESIGN................................................................42
3.2.3 Data Analysis and Interpretation .............................................................46
DATA PRESENTATION, ANALYSIS AND INTERPRETATION.....................................49
4.0 INTRODUCTION......................................................................49
4.1.1 The Actual Number and WISN Staffing Recommended for Mityana District. 50
Actual number and WISN Recommended health workers that are required to cope with current workload in public health facilities are calculated below in Table 4.1. Indeed table 4.1 revealed that the district of Mityan in the year 2011 (January – December) had an actual total number of 252 health workers. This comprised of 10 doctors, 26 Clinical Officers, 105 nurses, 83 midwives and 30 Nursing Assistants. Of the 252 health workers in the district, 112 were working at the General Hospital, 37 at Health Centre IVs, 57 at Health Centre IIIs, and 48 at Health Centre IIs. The details of the number of each category of workers are presented in table 4.1 below............................................................................50
4.1.3 The Actual Number and WISN Staffing Recommended for Health Centre IIIs .......................................................................................................................55
4.1.4 The Actual Number and WISN Staffing Recommended for Health Centre IVs .......................................................................................................................58
CHAPTER FIVE.............................................................................62
5.1 SUMMARY OF IMPORTANT FINDINGS ......................................62
5.2.1 Current Staff Status – Over or Understaffing ............................................63
5.2.2 Current Staff and Workload Pressure .......................................................64
5.4 IMPLICATIONS OF UNDERSTAFFING AND OVERSTAFFING IN HEALTH FACILITIES ....................................................................71
CONCLUSION AND RECOMMENDATIONS........................................75
6.0 INTRODUCTION......................................................................75
6.1 CONCLUSIONS ......................................................................75
16

6.2.4 General and Policy Recommendations.......................................................81
6.2.5 Recommendations for Further Research...................................................82
This study research on determining the appropriate number of actual staffing gap, cadre mix and work pressures in all public health facilities in Mityana District focused essentially on numbers of the selected health workers per se for the Public Health Centres to cope with its workload. This only emphasizes effective management of the valuable Health Human Resources, without looking at its quality, motivations, and remunerations among others things. .........................83
REFERENCES....................................................................................................84
APPENDICES...............................................................................89
APPENDIX 1: LETTER OF INTRODUCTION............................................................89
APPENDIX 3: HMIS 105: HEALTH UNIT MONTHLY REPORT ..................................92
APPENDIX 4: HMIS 108: HEALTH UNIT INPATIENT MONTHLY REPORT..................95
17

LIST OF ABBREVIATIONS
AWT Available Working Time CAF Category Allowance FactorCAS Category allowance standards GoU Government of UgandaHIV/AIDS Human Immunodeficiency Virus /Acquired Immunodeficiency Syndrome HDPs Health Development Partners HMIS Health Management Information SystemHR Human ResourcesHRH Human Resource for HealthHSD Health Sub Districts HSSP Health Sector Strategic Plan IAS Individual Allowance StandardsIHK International Hospital KampalaIHSU International Health Science University LG Local GovernmentMCH interventions MoH Ministry of HealthNDP National Development Plan NGO Non Governmental OrganizationsNMHCP National Minimum Health Care package SSA Sub Saharan African UBOS Uganda Bureau of Statistics USAID United States of America International developmentWISN Workload Indictors for Staffing Needs MethodologyWHO World Health Organization
18

ACKNOWLEDGEMENTS
Producing this dissertation was challenging and enlightening. I wish to express my sincere
gratitude and appreciation to the following people, who were there for me through this bumpy
journey.
The greatest debt is owed to my supervisor, Mr. Okiria John Charles for his invaluable and
professional guidance, expert advice and untiring support and inspiration displayed throughout
the duration of the study. His thoughtful and constructive criticism, and his interest and
contributions made the completion of this study a reality. Thank you.
Special thanks go to Justine Nampojja Ssekanjako the Mityana bio-statistician for her support in
data collection and continued help.
Considerable gratitude also belongs to my family for their constant support and encouragement.
Above all, I thank God Almighty for granting health, strengths and wisdom to complete this
study.
Without the contribution of all these people, this study would never have been possible.
19

ABSTRACT
Uganda has chronically had inadequate numbers of trained health personnel, poor equitable
distribution of the human resources, poor skills mix and ineffective use of available human
resources with non-professional task shifting in place. The study determined the appropriate
number, cadre mix and the work-related pressures experienced at different level of health
Centres in Mityana District in order to enhance effective and efficient use of human resources for
health (HRH).
The study adopted the Workload Indictors for Staffing Needs Methodology (WISN) process and
data analysis package as developed by Shipp, (1988) which is currently being piloted and rolled
out in Uganda. Health Unit monthly reports summarized in the HMIS 105 and HMIS 108 for a
period from January 2011 to December 2011 in all the 32 public health facilities was used for
data collection.
The findings reveal that the district in 2011 had 254 health workers consisting of 10 Doctors, 26
Clinical Officers, 83 Midwives, 105 Nurses and 30 Nursing Assistants. Yet, according to the
WISN staffing requirements, the district is supposed to have 16 Doctors, 29 Clinical Officers, 55
Midwives, 92 Nurses and 57 Nursing Assistants, giving a deficit of 5 health workers in total.
To meet the district WISN staffing requirements there is need to: recruit more health worker per
facility deficit, improve the equitable distribution by cadre, reduce un-professional tasking
shifting, budget for human resources for health as well as implement incentive scheme for hard
to reach and to stay areas.
20

CHAPTER ONE
INTRODUCTION
1.0 Introduction
This first chapter presents the background to the study. Uganda’s decentralization, health
systems and overview of the study area are also briefly articulated. The chapter further presents
the statement of the problem, objectives and research questions. It concludes with the study
significance, scope and a conceptual framework.
1.1 Background to the Study
Uganda is one of the landlocked countries in East Africa. Uganda’s total area is 241,038 sq.
Kms. Of 241,038 sq. Kms, 43 942 square Kms is covered by swamps and land occupies 197 096
sq. Kms. By the end of 2011, the population estimate for Uganda was 32.9 million growing at an
average rate of 3.4% per annum (Uganda Bureau of Statistics (UBOS), 2011). By July 2012,
Uganda had been divided into 132 districts which are decentralized across four administrative
regions.
Uganda has chronically had inadequate numbers of trained health personnel, poor equitable
distribution of human resources, poor skills mix and ineffective use of available human
resources, worsened by the practice of non-professional task-shifting. Determining the actual
capacity of Human Resources needed to facilitate health staffing requirements and tackle work-
related pressures in different health facilities, remains a great concern in Uganda as a country. It
is under the pressure of globalization, overpopulation and need for adequate and quality
21
healthcare. Like elsewhere in the developing world, different health facilities in Uganda are
coping with workload and pressure on different categories of health personnel.
The health system of Uganda comprises of public and private provision and financing of health
service deliveries. The main health providers consist of the public, NGOs, private health
practitioners, traditional practitioners and the informal sector actors (Ministry of Health, 2010).
Most healthcare services in the formal sector system are provided at Health Centers and at
hospitals at district, regional and national levels.
One on the means of achieving efficiency gains and enhanced health services delivery is through
appropriate determination and use of Human Resources for Health (HRH). To date, the HRH
predicament has taken numerous dimensions in terms of numbers which are projected to reach
only 50% of the required resource by 2025 (Lacet, 2008). These numbers are aggravated more
by the inequitable distribution of health workers globally. There is emigration of qualified health
workers from developing countries to the developed countries.
Cadre mix is another very critical dimension to quality healthcare service delivery. The ratio of
nurses to doctors, for example determines the capacity of workload that a facility can handle per
given time. This scenario is worse in Sub-Saharan African countries where there is a lot of brain
drain, with disease burden being the highest. As a result, health workers are experiencing heavy
workload and hence burn-out (Mungherera 2005).
In Uganda, the human resource for health is being determined by the doctor population ratio
which currently stands at about 1:20,000 on average with some districts having a ratio as high as
1:80,000. These ratios are definitely unacceptable by any standard. The staffing for health
22

workers in public facilities currently is based on bed capacity of the hospital and the level of
health service delivery. Whereas this criterion may guide the staffing of facilities, this basis
however is not scientific at all since it does not reflect the actual workload that is reflected in
various regions and locations of the facilities (MoH Human Resource for Health 2009).
1.2 Human Resource Planning and Management Tools
In order to address the challenges of improve human resource planning and management, several
human resources for health tools have been applied. The tools among others include:
a) Human Resources Management Rapid Assessment (HRMRA)
A HRMRA tool is a self-evaluation instrument designed to enable quick identification of the
strengths and weakness of human resources systems in an organization, whether in health or not.
The results inform the appropriate strategy development to improve the systems and maximize
the effectiveness of the HRH.
The advantage of HRMRA is that little training is require and can be easily applied by both small
or big governmental or non-governmental organizations. It facilitates clear identification of the
critical issues of human resources systems that require strengthening. However, the tool doesn’t
measure human resources productivity and requires approval by the Board which may not
always be the case.
b) Human Resources Audit
23

A Human resource audit is viewed as a broader approach to reviewing existing human resources
systems, policies and procedures. It helps to make clear the anticipated practice of human
resource work and function within an organization for the purpose of detecting strengths and
needs for enhancements and improvement of the HR function. In doing so, HR audit attempts to
create the standard for the future improvement, appraise the effectiveness and knowledge and
skills as well as improve performance levels.
A Human resource audit is applied using a checklist of key human resources parameters which
are reviewed.
c) WPRO Workforce Projection Tool
WPRO workforce projection is a tool that is designed for projecting human resource needs. It is
used to facilitate the production of comparative, cadre specific and summary reports for health
workers’ projection and cost parameters. The outcome of the tool application serves to guidepost
for the basis of HRH plans and strategies in determining and meeting the optimal number of
health workers required to cater for the need.
d) Workload Indictors for Staffing Needs (WISN).
WISN provides a systematic way of decision making on staffing in order to manage the valuable
human Recourses for health properly. It is based on a health worker’s workload, with activity
standards applied for each workload. Therefore the approach is used to:
24

1) Determine the number of health workers of a particular type required to cope with the
workload of a given health facility,
2) Assess the workload pressure of the health workers in a given health facility.
It was developed and published as an approach to adjusting staffing levels to effect affair and
optimal distribution of staff at health facilities at all levels
This study was intended to demonstrate a practical application of an alternative approach to
staffing requirement determination that are based on health workforce utilization and the
workload they face in different level facility. The approach applied is known as the Workload
Indictors of Staffing Needs (WISN). This study presents evidence established by the use of
WISN in public health facilities for defined health cadres in Mitayana district as a case study.
1.3 Statement of the Problem
The health system of Uganda has chronically had inadequate numbers of trained health personnel
(Ministry of Health, 2007). This phenomenon is aggravated by poor equitable distribution of
human resources, poor skills mix and ineffective use of available human resources with the
practice of non-professional task-shifting (ibid). Uganda is lively to severe health challenges as a
result of poor human resource planning and management (Carayon and Gurses, 2007).
The emerging and re-emerging diseases, increasing young and aging population and chronic
conditions are likely increase the effective demand for quality service delivery and yet threaten
the credibility of the health facilities (Carayon and Gurses, 2007). In order to address the
challenges of improving human resource planning and management, several human resources for 25

health tools have been applied. The tools among others include human resources audit,
Workforce Project tool, HR management rapid assessment tool and Health human resources
modeling- challenging the past, creating the future.
These tools however have not sufficiently informed how to ensure an adequate supply of well-
trained health workers, high levels of team work and staff performance, cost saving, a more
motivated workforce and a healthier population. This necessitated the determination of actual
human resources for health staffing requirements using alternative tools, thus Workload Indictors
for Staffing Needs (WISN) Methodology adopted by this study.
1.5 Overall Objective
The study set out to determine the actual number of health workers, actual staffing gap, cadre
mix and work-related workload and pressures in public health facilities in Mityana District.
1.5.2 Specific Objectives
1. To determine the actual number of health workers that are required to cope with actual
workload in public health facilities;
2. To compare the actual staffing levels and staffing norms with the WISN requirement in
public health facilities;
3. To assess the workload pressure experienced by respective staffs/cadres in public health
facilities in the district;
1.5.3 Research Questions
26

The general research question was: What is the actual Human Resources capacity of the selected
cadres (Doctors, clinical officers, Nurses, mid-wives, Nursing Assistants) is needed to meet
health staffing requirements and remedy workload pressures using Workload Indicators of
Staffing Needs Methodology in public health facilities in Mityana District?
While the specific questions were:
• What are the actual numbers of the selected cadres required per health facility basing on the
workload?
• What are the actual deficits/surpluses of staff per public health facility?
• What are the actual workload pressures experienced by the selected cadres in the selected
facilities?
1.6 Significance of the Study
This study was viewed significant on theoretical, social policy and/or practical fronts as
advanced by Marshall and Rossman (1999).
From the theoretical view, this study results provides researchers and academicians with an
alternative perspective to the studies on workload for health personnel in health facilities and the
use of WISN for human resource management. This contributes to the growing body of
knowledge and understanding of the theory on workload, WISN and informs practice in
Uganda’s health sector and health facilities in Mityana district, in particular.
27

From the social policy front, the study results provide new insights and help policy makers at
local government (Mityana District) to foster informed reforms in the district health sector
directed towards ensuring optimal resource deployment in different health facilities. The study
was timely, since severe workload challenges faced by health facilities in Mityana District was
directly impacting on patients and generally compromising on the quality of health service
delivery. The study informs an establishment of clear mechanisms for ensuring balanced
allocation of doctors, Clinical Officers, midwives, nurses, and Nursing Assistants at the district
health facilities.
Practically, the study results contribute to the improvement on health staffing in Mityana District
by providing managers at different levels of health facilities with a systematic way to make
staffing decisions based on workload, in order to manage their valuable human resources without
compromising on the quality of services they offer. This help in the distribution of health
personnel in Mityana District to reduce workload pressure; reviewing and aligning task
allocation between health workers; and planning for balanced future deployments.
1.7 Scope of the Study
Due to limited time, the study was limited to all levels of health facilities in only one district of
Mityana. It covered the 32 public health facilities (1 General Hospital, 3 Health Centre IVs, 9
Health Centre IIIs and 19 Health Centre IIs) in the district. The study limited itself to data from
January 2011 to December 2011 calendar year. This was because WISN uses previous year
statistic to ensure results validity.
28

Whereas there are many important categories of workforce in the selected facilities, the study
covered only five key cadres namely; doctors, Clinical Officers, midwives, nurses, and Nursing
Assistants. This was basically because the activity standards and the workloads of these cadres
had already been estimated by WHO and adjusted to the developing countries’ health system
services.
1.8 Conceptual Framework
The conceptual framework in figure 1.1 was based on the available workload of the different
categories of health cadres. The framework served as a simple model that displayed the link
between available workload of health workers (Doctors, Clinical Officers, Midwives, Nurses and
Nursing Assistants) and the actual number of health workers needed in a given health facility or
a geographical location say district, or even a country.
Equally, Hornby (2006:1242) defines Workload as the amount of work or of working time
expected to be done by someone on something. Therefore, the available workload of the different
categories of health personnel was viewed in terms of the available amount of work or of
working time expected to be done by the different categories of health workers in a given health
facility as in figure 1.1 below.
29

Figure 1.1 Shows the linkage between Available workload and actual number of health cadres needed.
Source: Conceptual framework developed by the researcher
For the sake of this study, the different selected health cadres included: Doctors, Clinical
Officers, Midwives, Nurses, and Nursing Assistants. This meant that the WISN staffing
requirement of health personnel in a given health facility was treated as a function of the
available workload of the different health cadres in the facility or defined geographical areas.
However to determine whether there existed an overstaffing or and understaffing then the
differences between The Actual Staffing of health workers and the WISN Staffing requirement
were established.
The linkages are shown by the arrows pointing from the available workloads of the different
selected cadre category to the actual number of workers needed at the center.
30
Available workload for: Doctor; Nurse; Midwives; Clinical Officer and Nursing Assistant
WISN Staffing requirements
Actual Staffing of health workers needed
Difference between
The Actual Staffing of health workers
AND
The WISN Staffing requirement of health workers
Per Health
DEFICIT/Understaffing
SURPLUS/Overstaffing

1.10 Operational Definitions
The operational/conceptual definitions are derived WISN user’s manual developed by World
Health Organization (WHO, 1998). The concepts that were conceptually imperative to the
context of this study were: activity standard, available working time, standards workload, and
workload components as defined by Rasmussen, (2010). Their definitions are:
a) Workload Indictors of Staffing Needs (WISN)
WISN method is a human resource management tool that; determines how many health
personnel of a particular type are required to cope with the workload of a given health facility
and assesses the workload pressure of the health personnel in a given health facility. The WISN
is the ratio of present staffing numbers to the calculated staff requirements (Rasmussen, 2010).
According to Rasmussen, this ratio is used to demonstrate the varying workload pressure among
the departments and among staff of the same cadre in any health facility.
b) Activity Standard:
Activity standard was defined as the time necessary to any of the selected health cadres to
perform an activity to professional standards in the local circumstances (Shipp 1988). There are
two kinds of activity standards: Service standard: activity standard for health service activity;
and Allowance standard: activity standard for support and additional activities.
31

c) Available Working Time
Available working time was defined as the time available to any of the selected health cadres in
one year to his/her work taking into account authorized and unauthorized absences (Shipp 1988).
d) Standard Workload:
Standard workload was the amount of work within a health service workload component that one
health personnel can do in a year (Shipp 1988).
e) Workload Components
Workload components was defined as one of the main work activities that take up most of any of
the selected health cadres’ daily working time, such as health service activity, support activity
and additional activity (Shipp 1988).
f) Actual number of workers needed
The Oxford Advanced Learners dictionary of current English Hornby (2006:1242) 7th Edition
defines a worker as a person who contributes labor and expertise to an endeavor of an employer
and is usually hired to perform specific duties which are packaged into a job. In this case and for
the study, Actual number of workers needed can be viewed in terms of exact number of health
personnel (doctors, Clinical Officers, midwives, nurses, and Nursing Assistants) who are hired
to contribute their labor and expertise to an endeavor of a given health facility.
32

h) Human Resource for Health (HRH)
HRH was defined by Diarra-Nama, (2007) as “all persons who work directly or indirectly to
support and create health and well-being and embodies not only the technical expertise directly
responsible for creating and sustaining health, but also the skills needed by support systems and
the linkages that facilitate the application of the technical skills”.
33

CHAPTER TWO
LITERATURE REVIEW
2.0 Introduction
This chapter presents a review of the literature on the study. It attempts to explore some of the
theoretical and policy issues regarding human resource, efficient utilization, task-shifting,
patient-worker ratios; and human resource workload. More insights into staffing norms and
staffing requirements; workload pressure and the burn-out effect; and the benefits and limitations
for using WISN are explored.
2.1 Health Workers’ Staffing Norms and Staffing Requirements
Scott, (2008) argues that ‘top-down’ formulae can help in setting standards for health personnel
in National Health Service by health authorities. Scoott further asserts that where staffing norms
are developed judiciously, using expert professional judgment and research evidence, they
complement cost-cutting exercises by employing organizations. The Commission of
Macroeconomic and Health (2001) also noted that many of the healthcare interventions provided
by certain health Cadres at community level can be carried out by those of lower training. For
instance, in the absence of doctors, Clinical officers can be entrusted to perform tasks meant for
doctors (ibid).
Kurowski and Mills, (2006) argues there is no accepted ‘gold standard’ measure of health
workforce workload. To Kurowski and Mills, this is because health worker workload has been
measured in a number of ways including techniques such as time-motion, self-reporting 34

(timesheets), worker sampling, worker recall involving provider interviews, and patient-flow
analysis (ibid).
Daviauda and Chopraa (2007) argue that each of the health facility has a minimum staff
requirement. For instance a clinic requires one professional nurse, one enrolled Nurse Assistant
and a half-time general assistant. For a community Health Centre, a doctor and a clerk need to be
added as staff expected on duty at any time during the working hours. Daviauda and Chopraa
contends that staff shortages increases workload of existing staff and pose a potential threat to
the quality of service delivery, and safety of patients.
According to Hongoro and Normand (2006), staffing norms do not play a critical role if funds
for salaries required to fill the staffing gaps is not available. Hongoro and Normand further assert
that decisions about how many health cadres to employ and in what capacities need to be based
on the contributions such employees are expected to make, not underscoring the costs of
employing them. Therefore, to Hongoro and Normand staffing norms help in planning, but also
require careful analysis of affordability of care, the skills needed, and the way to provide those
skills most efficiently. Because of this and out of necessity, several countries have turned to
alternative models of health service provision such as using staff skilled in the delivery of key
elements of high-priority services, including as immunization and emergency obstetric care
(ibid).
2.2 Human Resource for Health Workload
According to (Carayon & Gurses, 2005), the most commonly used workload measure is the
health worker - patient ratio. The health personnel - patient ratio can be used to provide a strong 35

evidence that high health workers’ workload negative impact on patient outcomes Lang, Hodge,
Olson, et al. (2004). On the other hand the type of health personnel job determines the level of
workload (Schaufeli & Le Blanc, 1998). On this, Oates & Oates (1996), arguers that workload
measures at the job level are suitable to use when comparing workload levels of health personnel
with different specialties.
According to Carayon & Gurses (2005), the number of patients allocated to given health workers
and the patient’s clinical condition, describe the workload experienced at a given health facility.
Hughes et al., (2002) supports the WHO finding that poor performance of health workers arrive
from shortage of staff, or from staff not providing care according to standards and not being
responsive to the needs of the community and patients. Joint Learning Initiative, (2004) support
the argument in that poor performance of health cadres results into inaccessibility of health
services and inappropriate care to patients. This then contributes to the reduction of health
outcomes as people are not using health services or are ill-treated due to harmful practices (ibid).
2.3 Health Workers Efficient Utilization of Time
Ruwoldt & Hassett (2007) in their study reveal that on average, health workers spend three-fifths
(61%) of their on-the-job time doing productive activities, which primarily involves providing
direct care for patients. However, they spent more than one-fourth (27%) of their time doing
unproductive activities such as waiting for patients. Several studies expose the necessity to
encourage the use of health human resources (Romanow, 2002). Besner et al. (2005) argues that
guaranteeing that health workers are able to work at their full scope of practice is a significant
retention approach that is crucial in fixing health workforce shortages
36

Whereas no all-inclusive indication has yet been known on the degree of absenteeism by health
workers, Chaudhury et al. (2004) in a study from Uganda discovered absenteeism rates of 37%
in health facilities. McKinsey (2004) adds that circumstantial evidence from Tanzania
recommends that widespread moonlighting occurs, both among doctors (who moonlight in
private health facilities) and nurses (who moonlights in agriculture). Kurowski et al. (2004)
noted that a large share of working hours is spent on unproductive activities in their study in
Tanzania. They argues that if misused hours were fully used the productivity of the health
workers would increase by 45%.
Hedberg and Larsson (2004) found that the availability of time or lack of it influences health
workers decision making abilities. Wieck et al. (2004) adds that conflicts, poor communication
and lack of clarity of boundaries and roles among health workers (Pearson 2003) also serve as
barriers to full scope practice. Jackson (2005); Wieck et al. (2004); Pearson (2003), all argued
that teamwork among health workers helps in providing desirable healthcare for patients.
Mæstad, (2006) argues that besides increasing the number of health workers, another way of
strengthening health workforce is the use of the existing workforce more effectively. To
Maestand, this can be achieved through increased productivity, improved performance and
through more effective (and equitable) deployment of personnel. Maestand further contends that
to use the present workforce more effectively is not necessarily as disconnected from the issue of
the size of the workforce. For instance, heavy workload, caused by shortage of personnel, may
be one major reason why health workers lose their motivation, which in turn may lead to low
productivity and performance.
37

2.4 Work Pressure and Quality Services Delivery
According to Kane, (2007) a shortage of health personnel of a specific category, increases
workload and threatens quality of care. Kane further argues that increasing the health worker to
patient ratio is a mean to improve health service delivery, thereby improving patient safety.
Further studies indicate that a heavy workload adversely affects patient safety (Lang et al, 2004).
Lang et al, goes ahead to argue that increased workload negatively affects job satisfaction and
contributes to high health workforce turnover.
Duffield et al (2003) argues that health workers are expected to perform non-professional tasks
in addition to professional responsibilities. The non-professional tasks such as delivering and
retrieving food trays; housekeeping duties; transporting patients; and coordinating, or performing
ancillary services, increases workload pressures and burn-out (ibid).
Health workers in Uganda face workload pressure, which health experts contend is getting worse
with more health workers to quitting their professional jobs (Baguma, 2010). Baguma, further
notes that in Uganda, hospitals at regional level are having less by 30% of the workforce they
should have. This displays gross disparities across different districts in Uganda, because of the
poor distribution of health cadres (Oketcho et al, 2009). On the other hand (Matsiko, 2010)
reveals that almost half (48%) of approved posts at Health Centers and hospitals in Uganda are
vacant, with a worse situation in the lower-level Health Centers.
Delva MD, et al (2002) argues that increased workload pressure makes health workers to become
unhappy with their work, which manifest as stress or burn-out, may result into emotional
38

exhaustion; depersonalisation; and reduced personal accomplishment. Delanyo (2005) reveals
that in Ghana the average of 2.4 days are spent on sick leave by health workers due to high
workload.
Work environments that support professional health workers’ practice leads to a more positive
outcome for patients (Tourangeau, Gioavannetti, Tu, & Wood, 2002). However, current public
health facility work environments with their workload pressure are stressful for even the most
seasoned health personnel who report high levels of burn-out and absenteeism (Greco,
Laschinger, & Wong, 2006; Laschinger, Almost, Purdy, & Kim, 2004).
Many studies indicate that a, lower health workers’ - to - patient ratio results into more hitches
and poorer patient outcomes (Aiken in Duffield & O’Brien-Pallas, 2003). In addition, shortage of
health workers negatively affect the motivation of the remaining staff as it causes increased
workload, causing extra stress and the risk of more staff leaving or being absent from work.
According to the Ministry of Health, (2010), a major challenge for the Ugandan healthcare
system is the rapidly growing population. This has resulted into Uganda having only one doctor
per 10,000 people, and only 14 Health Workers (doctors, nurses and midwives) per 10,000
people. This is significantly below the level of 23 health workers per 10,000 recommended by
the World Health Organization (WHO) (MoH, 2010), thus leads to reduced quality healthcare
delivery to the patients.
39
2.5 Task Shifting Among Health Workers
To enhance health worker functions in delivering health interventions that can be more
accessible to patients some role have to be delegated to less specialized health workers
(Nabudere, Asiimwe, & Mijumbi, 2010). Task-shifting is a way of solving this challenge.
Therefore, task-shifting is being used as a process of delegation whereby tasks are moved, where
appropriate, to less specialized health workers. According to McPake, B. & Kwadwo Mensah, K
(2008) task-shifting improves the efficient provision of health services by health cadres in
different health facilities.
Marchal, B., De Brouwere. V. and Kegels G (2005) asserts that successful task-shifting
necessitates an all-inclusive and cohesive reconfiguration of health teams, especially at
community and primary care levels. In the absence of a health team approach, the delegation of
tasks will perpetually remain a disjointed and untenable (Macinko J, et al. (2006). In the
contrary, Fawcett, B. and South, J. (2005), notes that any thoughtful commitment to task shifting
necessitates direction from national governments. Furthermore, McPake, B. and Mensah, K.
(2008), argues that where the national government fails to harness the support of the multiple
stakeholders, task-shifting occur on the political and organizational boundary of the formal
health system.
Samb B, et al (2007) argues that the intense shortage of health workers creates traditional models
of healthcare delivery (e.g, physician-centered) fail to serve as an option in many settings. In
response to such a challenge, task-shifting is increasingly being promoted and studied as one
approach for fixing this major global health problem. In fact Samb B, et al contends that
40

achievable, healthcare tasks are often shifted from higher-trained health cadres to less highly
trained health cadres in order to maximize the efficient utilization of human resources for health.
According to Nabudere, H, Delius Asiimwe, D, & Mijumbi, R (2010), those in promotion of
task-shifting view it as a potential solution to Uganda’s dual problem of lack of skilled personnel
and high demand for services. However, those in opposed to task-shifting perceive it as a quick
fix and an approach that could dilute the quality of care and compromise the health system in the
long term.
According to Gilson, L. et al (1989); Cohen, J. and Uphoff, N. (1977), community involvement
as an important element of task-shifting, mainly with respect to community health personnel.
Larry W.& Chang, M.D, (2009) argue that the need to guarantee quality of healthcare and patient
safety, task-shifting is being accepted, and for contributing to motivation, retention, and
performance health workers to whom tasks are shifted. Larry & Chang goes ahead to strongly
emphasize that task-shifting has succeeded in medical and maternal health applications.
However, the persistent surgical workforce crisis requires immediate and sustained action (ibid).
Samb, et al. (2007) argues that any long-term success of task-shifting centres on political will
and financial availability for health. Samb et al. argues, for instance in the context of HIV/AIDS
services that task-shifting need be part of the broader health system strengthening if it is to be
sustainable. They argue that governments and international and bilateral agencies need to support
in the preparation of health systems to implement successful task-shifting by ensuring the
creation of applicable regulatory frameworks and the building of training and management
capacity (ibid).
41
CHAPTER THREE
RESEARCH METHODOLOGY
3.0 Introduction
This chapter presents the qualitative case study of WISN methodology used in this study. It
explicitly provides a step by step approach to WISN as proposed by WHO. It further looks at the
choice of study health facilities and priority category of health workers. It ends by discussing the
data management and quality assurance mechanisms and ethical compliance means.
3.1 Research Design
The study adopted the Workload Indicators of Staffing Needs (WISN) process and methods as
developed by WHO (1988). According to Schurink (1998:252) a quantitative research such as
WISN provide a step by step ways of calculating staff requirements based on workload. The
calculation of the required staff size is based on the same medical standards in all similar health
facilities. Differences and ratios are used in interpretations. The difference between the actual
and calculated number of health personnel shows the level of staffing shortage or surplus for a
particular category in a given public health facility. The ratio of the actual to the required number
of staff is used to measures the workload pressure with which the staff is coping.
The WISN method is based on the health personnel’s workload, with activity (time) standards
applied to each workload component. The choice for WISN was based on the fact that it takes
into account the diverse complexities of healthcare services provided in different health facilities.
42
The study used available service statistics collected from the different public health facilities in
Mityana District for the calendar year 2011.
WISN is one of the Human Resource management tools that provide systematic ways to make
staffing decisions especially on health, in order to enhance proper and productive management of
valuable human resources.
The WISN methodology determines the number of health cadres of a particular type that are
required to cope with the workload of a given health facility. It also makes an assessment of the
workload pressure of the health personnel in the same health facility. In so doing, it helps in
balancing the workforce within and between health facilities by advocating for a more just
distribution of workload and better productivity.
3.2 Sample Size for Study Implementation
3.2.1 Sampling Procedures
The key consideration in deciding and selecting an appropriate unit of analysis was to establish a
sample for study that would deduce a meaningful finding at the end of the research; and
consequently add to existing knowledge. Appropriate data collection methods and the resultant
information were attained by clearly defining the sample as a unit of inquiry. This was informed
by the research objectives and interview questions.
Based on this argument, two units of inquiry and analysis were sampled:
43
a) The Health Facility Type Sampling
The focus of this study was all public health facilities within the district’s approved health
system and structure. The study used the while as the sample. The study therefore, involved 32
public health facilities in Mityana District. These included; General Hospital (1), Health Centre
IVs (3), Health Centre IIIs (9) and Health Centre IIs (19).
b) The Health Cadre Category Sampling
The study sampled the following health cadres: doctors, nurses, midwives, Clinical Officers and
Nursing Assistants to form a representative sample from all the 32 public health facilities in
Mityana District. The purposive choice of the health workers to consider for the study was
informed by the following criteria:
• A staff category in short supply in relation to the demand;
• A staff category whose distribution was likely to be most inequitable;
• A staff category with problems that affect the quality of the health care; and
• A staff category whose shortage was likely to affected the quality of health care.
c) The Sample district
44

The case study described here come from Mityana district of Uganda. Mityana district was
selected for ease of data collection. This was because it was among those that were in the process
of rolling out the WSIN method for HRH.
3.2.2 Data Source, Tools and Collection Process
Both qualitative and quantitative primary and secondary data collection approaches were used.
The use of different methods and techniques of data collection and use of various sources
(triangulation) ensured rigor and reliability of the findings of the study as is suggested by Green
et al. (1989).
Determining the workload pressure by staff category – was an important step in calculating
staffing requirements based on WISN. A bio-statistician and one Research Assistants were
identified and assignment to collect using the Health Unit monthly reports summarized in the
HMIS 105 and HMIS 108 for all the 32 health facilities in Mityana district (see appendix 1 & 2).
A desk review approach was used to collected raw data from the Mityana District Management
Information System records. The records were generally available at the district health office. At
times it was necessary to visit the individual health Centres when some data was missing.
Collected data was entered into an excel data collection sheet, monthly for the Period January
2011 to December 2011. The annual excel output - workload statistics was then exported into a
WISN data analysis package that has in-built standard activity loads that have been determined
by WHO for each cadre for each activity, but modified by the Ministry of Health to reflect the
standard workloads and activities in Uganda health setting. This was done to determine staffing
45

requirements that was as close to the present workload situation as possible in the selected health
facilities in Mityana district.
3.2.3 Data Analysis and Interpretation
To facilitate easy data analysis adjustment of the WISN numbers that were in fractions was done.
Therefore, the WISN results were analyzed and interpreted in two ways:
a) Comparison of the difference between actual number of health cadres and the WISN staffing
recommended levels, provided information on whether the facility in question was relatively
understaffed or overstaffed.
b) Use of the WISN ratio as a proxy measure, provided an assessment of the work pressure that
health workers in a given health facility experienced in their day to day work. Therefore, when
WISN ratio results was equal to 1(= 1), it indicates that actual staffing was in balance with the
staffing demands of a health facility’s workload. On the other hand, when WISN ratio results
was more than one (>1), it evidenced a situation of overstaffing in relation to the workload in the
given health facility. Conversely, when WISN ratio results was less than one (<1) it indicated
that the actual number of staff is insufficient to cope with the workload in a given health facility.
It should be noted however, that the smaller the WISN ratio results, the greater the workload
pressure.
To determine workload pressure, the surplus/deficit staffs was expressed as a percentage of the
WISN values. The higher the deficit the higher the workload pressure experienced and hence the
46

higher the additional number of the cadre required. Workload pressures were further analyzed for
probable equitable redistribution. The findings are presented in Chapter Four.
3.3 Data Management and Quality Assurance
In order to minimize errors or bias, standard measures for data control were employed. These
included: objectivity, credibility, and dependability/consistency (Miles and Huberman 1994) as
below:
a) Credibility/Internal Validity: since qualitative study was essentially subjective, monthly
reports of all public health facilities were cross-checked at source to ascertain their accuracy and
gap filling. Follow-up inquiries were made where required.
b) Reliability: Research Assistants were identified and debriefed/ trained into not only the
research problem, but also the use of the Health Unit monthly reports HMIS 105 and HMIS 108.
This helped in collection of reliable raw data. Research Assistants also worked in constant
consultation with me (the author) to ensure all relevant information was collected.
c) Objectivity: since qualitative study is essentially subjective, records such as written notes and
memos were used during the study process to document verbal responses. Files (folders) for raw
data including notes and other study documents were created and kept separately for easy referral
and for safety purposes.
47

d) Dependability: flexibility was exercised especially where some respondents were not familiar
with certain aspects of HMIS. Opportunities were given to focus on questions with which they
were more familiar.
3.5 Ethical Considerations of the Study
Every effort was made to ensure that study ethics were exercised. First, the objectives and
purpose of the study results were clearly explained to the Mityana District Health Director, from
whom permission was sought to access monthly health reports: HMIS 105 and 108 for all the 32
public health facilities in the district.
Confidentiality was ensured by not sharing any raw data without the consent of Mityana District
Health Director. Any section or information that was not original to the study was acknowledged
by their authors in this study.
The researcher exercised moral responsibility in securing internal health information from the
different facilities visited. In this regard full disclosure of the purpose of the study to the health
officials in the district was done.
The study report presents accurate results as were observed and captured, without taking
responses out of context. Considerations were made to safeguard against any personal biases and
opinions interfering with the study.
48

CHAPTER FOUR
DATA PRESENTATION, ANALYSIS AND INTERPRETATION
4.0 Introduction
This chapter presents an analysis of the empirical data for this study, which sets out to determine
the number of staffing levels based on the Actual staffing; and the WISN staffing requirement
levels in public health facilities in Mityana District. The chapter further explores the comparison
between the three staffing levels.
4.1 Staffing by Cadre per Health Facility in the entire District
This section addresses study objective 1 and 2. Therefore it presents a comparison between the
actual staffing and the required staffing based on the WISN staffing requirements. It also
presents the required number of health workers that were expected to cope with the workload in
public health facilities in Mityana District by cadre and per health facility and. The required
number of health workers was determined using the calculated WISN staffing requirements.
49

4.1.1 The Actual Number and WISN Staffing Recommended for Mityana District.
Actual number and WISN Recommended health workers that are required to cope with current
workload in public health facilities are calculated below in Table 4.1. Indeed table 4.1
revealed that the district of Mityan in the year 2011 (January – December) had an actual
total number of 252 health workers. This comprised of 10 doctors, 26 Clinical Officers,
105 nurses, 83 midwives and 30 Nursing Assistants. Of the 252 health workers in the
district, 112 were working at the General Hospital, 37 at Health Centre IVs, 57 at Health
Centre IIIs, and 48 at Health Centre IIs. The details of the number of each category of
workers are presented in table 4.1 below.
Table 4.1 Actual and WISN Staffing Requirement by Cadre and Facility Category
Current and WISN staffing Requirements by cadres in different health Centre level
Total Staff by Cadre
Health Cadre Gen. Hospital HCIVs HCIIIs HC IIs Current WISN Current WISN Current WISN Current WISN Current WISNDoctors 9 13 1 3 0 0 0 0 10 16Nurses 42 49 13 15 23 9 27 19 105 92Clinical Off. 9 17 0 3 8 9 9 0 26 29Midwives 40 24 14 3 20 9 9 19 83 55Nursing Ass. 12 25 9 9 6 9 3 14 30 57Total staff by Facility 112 128 37 33 57 36 48 52 254 249Source: Primary data
On the contrary, Table 4.1 revealed that according to WISN staffing requirement the district of
Mityan in the year 2011 (January – December) had an actual total number of 249 health workers.
This comprised of 16 Doctors, 29 Clinical Officers, 92 Nurses, 55 midwives and 57 Nursing
Assistants. Of the 249 health workers in the district, 128 are expected to be working at the
General Hospital, 33 at Health Centre IVs, 36 at Health Centre IIIs, and 52 at Health Centre IIs.
50

4.1.2 The Actual Number and WISN Staffing Recommended for Health Centre IIs
According to the Ugandan government's health policy, every parish is supposed to have a Health
Centre II. It is expected to serve a few thousand people and should provide preventive,
supportive and outpatient curative health services, and outreach care. It runs an out-patient clinic,
treating common diseases and offering antenatal care.
In 2011 the district of Mityana had 19 Health Centre IIs. According to the Local Government
staffing norms, Health Centre IIs are supposed have four (4) health workers whereas, Health
Centre IIs are expected to be led by an enrolled nurse, working with a Midwife, two Nursing
Assistants and a Health Assistant.
The calculated WISN staffing requirements in table 4.2 below shows a balance between actual
staffing and the WISN staffing requirements in all the Health Centre IIs of: Busunju,
Kabuwambo, Katiiko, and Kanyanya,. In fact, the Centres each had two health workers
comprising of one (1) midwife and one (1) nurse, but did not require Nursing Assistants. With a
WISN ratio of one (1) means there is no body to exert pressure, thus no pressure.
Table 4.2 Comparison of Actual Staffing and WISN Staffing RequirementCadre LG Norm Actual Staff WISN Req. Difference WISN Ratio PressureMidwives 1 1 1 0 1 0%Nurses 1 1 1 0 1 0%Nursing Ass. 2 1 1 0 0 0%
Source: Primary data.
Data analysis in table 4.3 shows that the actual staffing of Bekina Health Centre II was three (3)
health workers, which comprises of two (2) nurses and one (1) Nursing Assistant. This is
contrary to the WSN staffing requirement which recommends three (3) health workers consisting
51
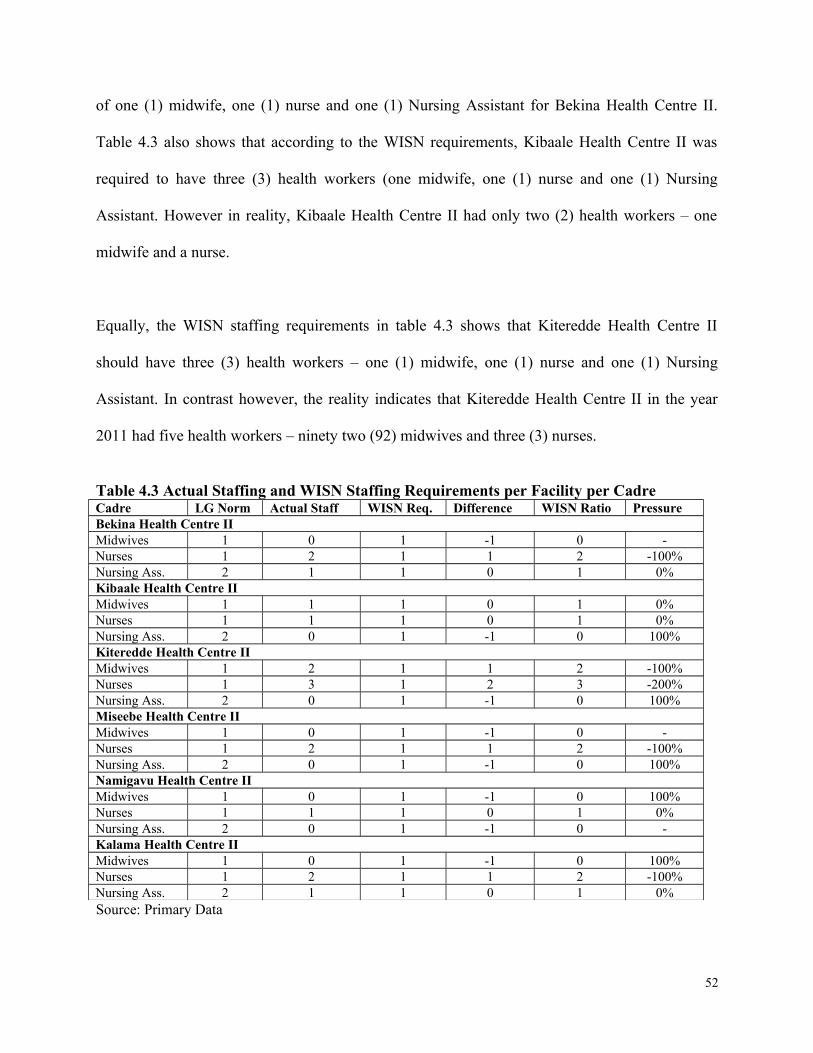
of one (1) midwife, one (1) nurse and one (1) Nursing Assistant for Bekina Health Centre II.
Table 4.3 also shows that according to the WISN requirements, Kibaale Health Centre II was
required to have three (3) health workers (one midwife, one (1) nurse and one (1) Nursing
Assistant. However in reality, Kibaale Health Centre II had only two (2) health workers – one
midwife and a nurse.
Equally, the WISN staffing requirements in table 4.3 shows that Kiteredde Health Centre II
should have three (3) health workers – one (1) midwife, one (1) nurse and one (1) Nursing
Assistant. In contrast however, the reality indicates that Kiteredde Health Centre II in the year
2011 had five health workers – ninety two (92) midwives and three (3) nurses.
Table 4.3 Actual Staffing and WISN Staffing Requirements per Facility per CadreCadre LG Norm Actual Staff WISN Req. Difference WISN Ratio Pressure Bekina Health Centre IIMidwives 1 0 1 -1 0 -Nurses 1 2 1 1 2 -100%Nursing Ass. 2 1 1 0 1 0%Kibaale Health Centre IIMidwives 1 1 1 0 1 0%Nurses 1 1 1 0 1 0%Nursing Ass. 2 0 1 -1 0 100%Kiteredde Health Centre IIMidwives 1 2 1 1 2 -100%Nurses 1 3 1 2 3 -200%Nursing Ass. 2 0 1 -1 0 100%Miseebe Health Centre IIMidwives 1 0 1 -1 0 -Nurses 1 2 1 1 2 -100%Nursing Ass. 2 0 1 -1 0 100%Namigavu Health Centre IIMidwives 1 0 1 -1 0 100%Nurses 1 1 1 0 1 0%Nursing Ass. 2 0 1 -1 0 -Kalama Health Centre IIMidwives 1 0 1 -1 0 100%Nurses 1 2 1 1 2 -100%Nursing Ass. 2 1 1 0 1 0%Source: Primary Data
52
Further analysis of the data in table 4.3 indicates that Miseebe Health Centre II was expected to
have three (3) health workers according to the WISN staffing requirements. This was supposed
to consist of one (1) midwife, one nurse and one Nursing Assistant. However, facts reveal that
the Centre had only two (2) health workers who are both nurses. Like others, Namigavu health
center II was required to have three (3) health workers (nurse, midwife, Nursing Assistant) meet
the WISN staffing requirement. However, Namigavu Health Centre III had only one (1) health
worker who was a Nurse.
Table 4.3 further indicates that Kalama Health Centre II based on the calculated WISN staffing
requirements was expected to have three (3) staff (nurse, midwife, Nursing Assistant). The facts
indicate that the Centre had three (3) health workers, which were, two (2) nurses and one (1)
Nursing Assistant.
Data analysis shown in table 4.4 indicate that WISN staffing requirement for Kasiikombe Health
Centre II was three (3) health workers, one of each of the selected category below. In contrast,
there were three (3) health workers of which two (2) were midwives and one (1) Nurse. Lusalira
Health Centre II as shown in table 4.4, according to the WISN staffing requirement, was required
to have three (3) health workers one of each category below.
Nonetheless, there were only two (2) health workers comprising of only two (2) Nurses. Further
analysis of data in table 4.4 reveals that Nakaseeta Health Centre II should have had two (2)
health workers – a midwife and a nurse only. However, findings show that the Centre had three
(3) health workers – one (1) midwife and two (2) Nurses.
53

The calculated WISN staffing requirements in table 4.4 show that Nakazibwe Health Centre II
was required to employ three (3) health workers – one of each category (nurse, midwife and
Nursing Assistant). The findings, however, revealed that the Centre only had two (2) staff – one
Nurse and one Nursing Assistant. Namungo Health Centre II in table 4.4, according to WISN
staffing requirement was expected to employ three (3) health workers. These were supposed to
comprise of one Midwife, one Nurse and one Nursing assistant. Nonetheless, in actual terms,
Namungo Health Centre II had five health workers comprised of two (2) Midwives, two (2)
Nurses and one (1) Nursing Assistant.
Table 4.4 Comparison of Actual Staffing and WISN Staffing RequirementCadre LG Norm Actual Staff WISN Req. Difference WISN Ratio Pressure Kasiikombe Health Centre IIMidwives 1 2 1 -1 0 100%Nurses 1 1 1 1 2 -100%Nursing Ass. 2 0 1 0 1 -%Lusalira Health Centre IIMidwives 1 0 1 -1 0 -Nurses 1 2 1 1 2 -100%Nursing Ass. 2 0 1 -1 0 -Nakaseeta Health Centre IIMidwives 1 1 1 0 1 0%Nurses 1 2 1 1 2 -100%Nursing Ass. 2 0 0 0 0 -Nakazibwe Health Centre IIMidwives 1 0 1 -1 0 100%Nurses 1 1 1 0 1 0%Nursing Ass. 2 1 1 0 1 0%Namungo Health Centre IIMidwives 1 2 1 1 2 -100%Nurses 1 2 1 1 2 -100%Nursing Ass. 2 1 1 0 1 0%Mpongo Health Centre II,Midwives 1 0 1 -1 -Nurses 1 1 1 0 2 0%Nursing Ass 2 1 1 0 1 0%
Source: Primary data.
Data for Mpongo Health Centre II in table 4.4 indicate that based on the WISN staffing
requirements, the Centre should have had three (3) health workers, one of each of selected
54

category. However, reality indicated that Mpongo Health Centre II had only two (2) health
workers – one Nurse and one Nursing Assistant.
4.1.3 The Actual Number and WISN Staffing Recommended for Health Centre IIIs
Health Centre IIIs are found at every sub-county, so was in Mityana District. I Health Centre IIIs
are supposed to serve about 20,000 people for preventive, outpatient, curative, maternity,
inpatient services and laboratory services. There are nine (9) Health Centre IIIs in the district
supposed to be headed by Senior Clinical Officers. Each Centre IIIs according to Local
Government staffing norms is expected to have two (2) Clinical Officers, four (4) midwives, four
(4) nurses and three (3) Nursing Assistants.
The results in table 4.5 show that the WSIN staffing requirement for Maanyi Health Centre III
was supposed to be four (4) health workers. These were to consist of one (1) Clinical Officer,
one (1) midwife and one (1) nurse, and one (1) Nursing Assistant. However, the actual staffing
for Maanyi Health Centre III was instead ten (10) health workers which comprised of two (2)
Clinical Officers, two (2) Midwives, five (5) Nurses, and one Nursing Assistant.
The WISN staffing requirement for Kiyongo Health Centre III in table 4.6 show that the center
was expected to have four (4) health workers comprising of one (1) Clinical Officer, one (1)
midwife, one (1) nurse and one (1) Nursing Assistant. In the contrary, the center actual had six
(6) health workers consisting of one (1) Clinical Officer, one (1) midwife, two (2) nurses and two
(2) Nursing Assistants.
55

Looking at table 4.5, findings show that Naama Health Centre III, was supposed to have four (4)
health workers according to WISN staffing requirement. These were to comprise of One (1)
Clinical Officer, one (1) Midwife, one (1) Nurse and one (1) Nursing Assistant. However, the
reality of the ground shows that Naama Health Centre III had only three (3) health workers
including one (1) Clinical Offer, one (1) Midwife and one (1) Nurse.
Table 4.5 Health Centre IIIsMaanyi Health Centre III
Cadre LG Norm Actual Staff WISN Req. Difference WISN Ratio Pressure Clinical Off. 2 2 1 1 2 -100%Midwives 4 2 1 1 2 -100%Nurses 4 5 1 4 5 -400%Nursing Ass. 3 1 1 0 1 0%Kitongo Health Centre IIIClinical Off. 2 1 1 0 1 0%Midwives 4 1 1 0 1 0%Nurses 4 2 1 1 2 -100%Nursing Ass. 3 2 1 1 2 -100%Naama Health Centre IIIClinical Off. 2 1 1 0 1 0%Midwives 4 1 1 0 1 0%Nurses 4 1 1 0 1 0%Nursing Ass. 3 0 1 -1 0 -Bulera Health Centre IIIClinical Off. 2 0 1 -1 0 100%Midwives 4 2 1 1 2 -100%Nurses 4 1 1 0 1 0%Nursing Ass. 3 1 1 0 1 0%
Source: Primary data.
Table 4.5 further shows that according to the WISN staffing requirement , the Bulera Health
Centre III, was required to have four (4) health workers of which, one (1) Clinical Officer, one
(1) Midwife, one (1) nurse and one (1) Nursing Assistant. However, facts from the Centre
indicate that there were four (4) health workers consisting of two (2) midwives, one (1) Nurse
and one (1) Nursing Assistant.
56

According to WISN staffing requirements, table 4.7 show that the Malangal Health Centre III
was required to have four (4) health workers consisting of one (1) Clinical Officer, One (1)
Midwife, one (1) Nurse and one (1) Nursing Assistant. However, reality at the Centre shows that
the Centre had six (6) health workers that consist of three (3) midwives and three (3) Nurses.
Analyzing the data in Table 4.6 the WISN calculated staffing requirement show that Magala
Health Centre III, was required to have four (4) health worker consisting of one (1) Clinical
Officer, one (1) Midwife, one (1) Nurse and one (1) Nursing Assistant. However, facts at the
Centre indicate that the actual staffing was six (6) health workers comprising of two (2) Clinical
Officers, two (2) midwives, and two (2) Nurses.
The calculated WISN staffing requirements in table 4.6 also shows that of Kabuule Health
Centre III, was required to have four (4) health workers comprising of one (1) Clinical Officer,
One (1) Midwife, one (1) Nurse and one (1) Nursing Assistant. In contrast, the Centre actually
had four (4) health workers consisting of one (1) Clinical officer, two (2) midwives and one (1)
Nurse.
The calculated WISN staffing requirements indicated in table 4.6 shows that Kikandwa Health
Centre III was required to have four (4) health workers. These are supposed to consist of one (1)
Clinical Officer, One (1) Midwife, one (1) Nurse and one (1) Nursing Assistant. The contrary,
show that the Kikandwa Health Centre III actually had a staffing of ten (10) health workers
consisting of four (4) midwives, four (4) Nurses and two (2) Nursing Assistant. The Centre
however, lacks a Clinical Officer to cope with its work.
57

Analyzing data the calculated WISN staffing requirement in Table 4.6 shows that the Kyamusisi
Health Centre III was required to have four (4) health works. Of the four, there should be one (1)
Clinical officer, One (1) Midwife, One (1) Nurse and one (1) Nursing Assistant. However, fact at
the Centre instead indicate that there were eight (8) health workers consisting of one (1) Clinical
officer, three (3) midwives and four (4) Nurses.
Table 4.6 More Health Centre IIIsMalanga Health Centre III
Cadre LG Norm Actual StaffWISN Req.
Difference WISN Ratio Pressure
Clinical Off. 2 0 1 -1 0 -Midwives 4 3 1 2 3 -200%Nurses 4 3 1 2 3 -200%Nursing Ass. 3 0 1 -1 0 -Magala Health Centre IIIClinical Off. 2 2 1 1 2 -100%Midwives 4 2 1 1 2 -100%Nurses 4 2 1 1 2 -100%Nursing Ass. 3 0 1 -1 0 -Kabuule Health Centre IIIClinical Off. 2 1 1 0 1 0%Midwives 4 2 1 1 2 -100%Nurses 4 1 1 0 1 0%Nursing Ass. 3 0 1 -1 0 -Kikandwa Health Centre IIIClinical Off. 2 0 1 -1 0Midwives 4 4 1 3 4 -300%Nurses 4 4 1 3 4 -300%Nursing Ass. 3 2 1 1 2 -100%Kyamusisi Health Centre IIIClinical Off. 2 1 1 0 1 0%Midwives 4 3 1 2 3 -200%Nurses 4 4 1 3 4 -300%Nursing Ass. 3 0 1 -1 0
Source: Primary data
4.1.4 The Actual Number and WISN Staffing Recommended for Health Centre IVs
58

According to the decentralization of Uganda’s health structure, this level of health facility is
expected to serves 100,000 people at county or a parliamentary constituency level. A health
Centre IV (shown in Table 4.7) is a mini hospital. It should have the kind of services found at
health Centre III, for preventive, outpatient, curative, maternity, inpatient services emergency
surgery and blood transfusion and laboratory services, but it should have wards for men, women,
and children and should be able to admit patients as well as a theatre for carrying out emergency
operations.
In Mityana district there are three (3) Health Centre IVs and all according to Local Government
staffing norms are supposed to have twenty two (22) health workers. These are expected to
include two (2) Doctors, three (3) Clinical officers, eight (8) Nurses, four (4) Midwives, and five
(5) Nursing Assistants.
Table 4.7: Health Centre IVs in Mityana DistrictCadre LG Norm Actual Staff WISN Req Difference WISN Ratio Pressure Mwera Health Centre IVDoctor 2 0 1 -1 0 -Clinical Off. 3 5 1 4 5 -400%Midwives 4 2 1 1 2 -100%Nurses 8 4 5 -1 0.8 20%Nursing Ass. 5 1 4 -3 0.2 80%Kyantungo Health Centre IVDoctors 2 1 1 0 1 0%Clinical off. 3 2 1 1 2 -100%Midwives 4 5 1 4 5 -400%Nurses 8 5 5 0 1 0%Nursing Ass. 5 0 4 -4 0 -Ssekanyonyi Health Centre IVDoctors 2 0 1 -1 0 -Clinical Off. 3 2 1 1 2 -100%Midwives 4 2 1 1 2 -100%Nurses 8 4 5 -1 0.8 20%Nursing Ass. 5 1 1 0 1 0%
Source: Primary data.
59

The calculated WISN staffing requirements for Mwera Health Centre IV in table 4.7 indicate that
Mitynana District was recommended to have twelve (12) health workers. Of these the Centre
should have had one (1) doctor, one (1) Clinical Officer, one (1) midwife, five (5) nurses and
four (4) Nursing Assistants. On the contrary, however Mwera Health Centre IV twelve (12)
health workers. However, the Centre didn’t have any doctor, but had only five (5) Clinical
Officers, two (2) midwives, four (4) nurses and one (1) Nursing Assistant.
The calculated WISN results in table 4.7 indicate Kyantungo Health Centre IV was expected to
have a total of twelve (12) health workers. These would include one (1) doctor, one (1) Clinical
Officer, One (1) midwife, Five (5) nurses, and four (4) Nursing Assistants. In contrast, the results
in table 4.7 show that actual staffing of Kyantungo Health Centre IV was thirteen (13) health
workers. Of these, there were one (1) doctor, two (2) Clinical Officers, five (5) Midwives, five
(5) Nurses and zero Nursing Assistant.
The WISN staffing requirement in table 4.7 indicate that Ssekanyonyi Health Centre IV, was
expected to have nine (9) Health workers. Of these the center should have had one (1) Doctor,
one (1) Clinical Officer, one (1) Midwife, five (5) Nurses and one (1) Nursing Assistant. These
results were opposed to the actual staffing of Ssekanyonyi Health Centre IV, which indicate nine
(9) health workers present employed of which zero (0) doctors, two (2) Clinical Officers, two (2)
midwives, four (4) nurses and one (1) Nursing Assistant.
4.1.5 The Actual Number and WISN Staffing Recommended for the General Hospital
60
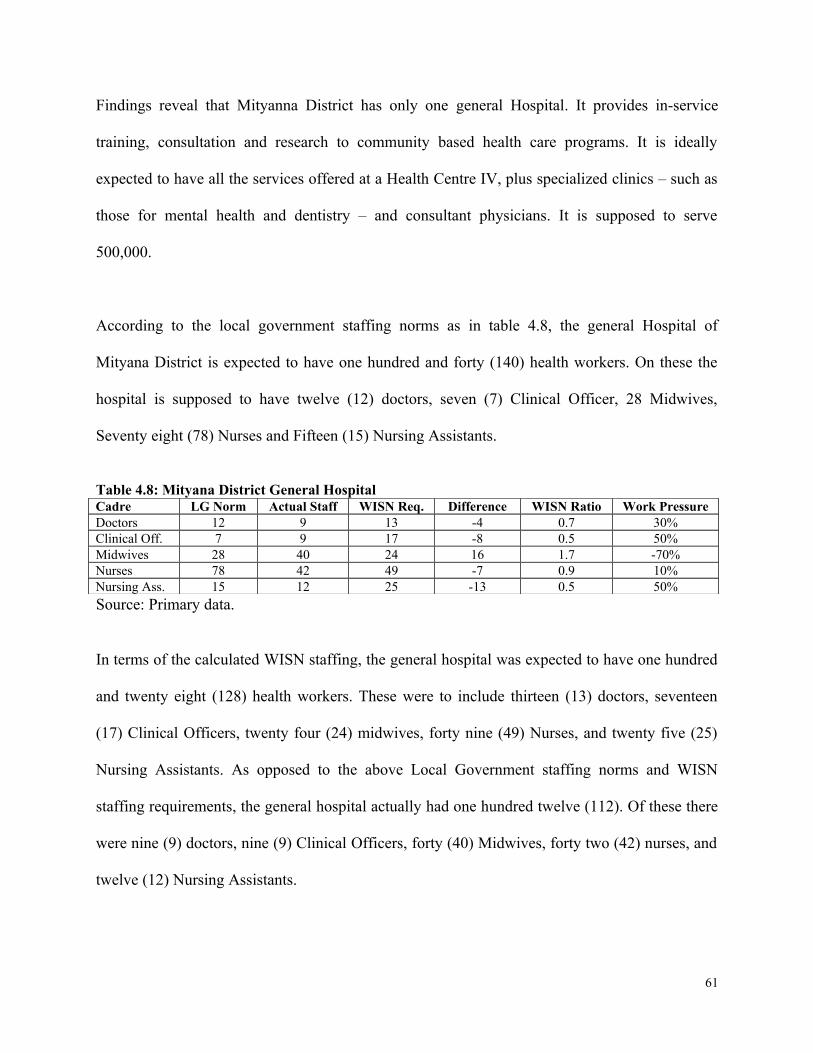
Findings reveal that Mityanna District has only one general Hospital. It provides in-service
training, consultation and research to community based health care programs. It is ideally
expected to have all the services offered at a Health Centre IV, plus specialized clinics – such as
those for mental health and dentistry – and consultant physicians. It is supposed to serve
500,000.
According to the local government staffing norms as in table 4.8, the general Hospital of
Mityana District is expected to have one hundred and forty (140) health workers. On these the
hospital is supposed to have twelve (12) doctors, seven (7) Clinical Officer, 28 Midwives,
Seventy eight (78) Nurses and Fifteen (15) Nursing Assistants.
Table 4.8: Mityana District General HospitalCadre LG Norm Actual Staff WISN Req. Difference WISN Ratio Work PressureDoctors 12 9 13 -4 0.7 30%Clinical Off. 7 9 17 -8 0.5 50%Midwives 28 40 24 16 1.7 -70%Nurses 78 42 49 -7 0.9 10%Nursing Ass. 15 12 25 -13 0.5 50%
Source: Primary data.
In terms of the calculated WISN staffing, the general hospital was expected to have one hundred
and twenty eight (128) health workers. These were to include thirteen (13) doctors, seventeen
(17) Clinical Officers, twenty four (24) midwives, forty nine (49) Nurses, and twenty five (25)
Nursing Assistants. As opposed to the above Local Government staffing norms and WISN
staffing requirements, the general hospital actually had one hundred twelve (112). Of these there
were nine (9) doctors, nine (9) Clinical Officers, forty (40) Midwives, forty two (42) nurses, and
twelve (12) Nursing Assistants.
61
CHAPTER FIVE
DISCUSSION
5.0 Introduction
This chapter presents a discussion of the main findings which is aimed at giving a general
overview of the investigation in order to show that the purpose and objectives originally
expressed in section 1.4 have been addressed and achieved.
5.1 Summary of Important Findings
There are several important findings regarding the number of selected categories of health
workers in the study based on the WISN calculated staffing that are required to cope with the
workloads of the specific health facilities in Mityana District. The summary of the findings are:
• In the year 2011, the district of Mityana had only ten (10) doctors, one hundred five (105)
Nurses, twenty six Clinical Officers, eighty-three (83) Midwives and thirty (30) Nursing
Assistants. This i as opposed to the required sixteen (16) doctors, ninety-two (92) Nurses,
twenty nine (29) Clinical Officers, fifty five (55) Midwives and fifty seven (57) Nursing
Assistants.
62

• In terms of health facilities, the general hospital of Mityana had a deficit of sixteen (16)
health workers in the category of four (4) doctors, seven (7) Nurses, eight (8) Clinical
Officers and thirteen (13) Nursing Assistant, but with an excess of sixteen (16) Midwives.
• HCIV, had a deficit of health workers of four (4), with a shortage of three (3) doctors, two
(2) Nurses, and three (3) Clinical officers. The Nursing Assistants in HCVI were in balance,
while the Midwives were in excess of nine (9).
• HCII were overstaffed by fourteen (14) Nurses, eleven (11) Midwives, but had a shortage of
one (1) Clinical Officer and three (3) Nursing Assistants.
• Finally, for HCII, had an excess of eight (8) Nurses and nine (9) Clinical Officers. However,
they are in shortage of eleven (11) Midwives and nine (9) Nursing Assistants.
5.2.1 Current Staff Status – Over or Understaffing
Table 5.1 below shows the summarized staffing status by cadre and facility for the entire district
of Mityana.
Table 5.1 Summary of Staffing Status by Cadre and Facility Cadre status at different Health level facility
Deficit/ SurplusHealth Cadre
General Hospital (1)
HC IVs (3)
HC IIIs (9) HC IIs (19)
Doctors -4 -2 0 0 -6
Nurses -7 -2 13 9 13
Clinical Officers -8 6 -1 0 -3
63

Midwives 16 6 11 -4 29Nursing Assistants
-13 -7 -3 -6 -29
Source: Primary data.
From table 5.1 the entire district of Mityana lacked six (6) doctors; three (3) Clinical Officers
and twenty nine (29) Nursing Assistants to cope with its workload match with the WISN staffing
requirement. According to Kane (2007), shortage of health workers implies understaffing of the
existing staff, which in turn threatens the quality of health care and patient safety. This means the
existing doctors; Clinical Officers and Nursing Assistant in the district are facing workload
pressure, which needs to be addressed.
The shortage of some of the key health workers in the district may imply that the work
environments their workload pressure were stressful for even the most seasoned health personnel
such as clinical officer and Nursing Assistants, which is likely to cause high levels of burn-out
and absenteeism (Greco, Laschinger, & Wong, 2006), thus resulting into a more negative
outcomes for patients in Mityana district.
In the contrary, the district had had a surplus of thirteen (13) Nurses and twenty nine (29)
midwives. This according to Nabudere, Asiimwe and Mijumbi, (2010) means over staffing of the
existing Nurses and Midwives in some health facilities. This highlights the unbalanced staffing
situation in the district, requiring urgent attention. From a positive note, such surplus can be used
to improve services in health facilities, if transferring staff is difficult and the staffing gap is.
5.2.2 Current Staff and Workload Pressure
64

This section addresses objective three (3) of the study. It presented the difference between the
actual and WISN requirements per health worker.
Using the WISN ratio as a proxy measure in assessing the workload pressure experienced by
health workers in their daily work, table 4.9 reveals that:
The WISN ratio of 0.6 with a 40% work pressure for doctors – means the actual number of
doctors is insufficient to cope with its workload. The WISN ratio of 0.5 with a 50% work
pressure means the Nursing Assistants are insufficient to cope with its workload in the district.
According to Maestad (2006), shortage of staff of this nature lowers the motivation of the
existing one, which results into low productivity.
Table 5.2 Mityana District Overall Staffing PressureCADRE LG Norm Actual Staff WISN Req Difference WISN Ratio PressureDoctors 18 10 16 -6 0.6 40%Clinical Off. 36 26 29 -3 0.9 10%Midwives 95 83 55 28 1.5 -50%Nurses 152 105 92 13 1.1 -10%Nursing Ass. 95 30 57 -29 0.5 50%Total Staff 396 254 249
Source: Primary data.
The WISN ratio of 0.9 with a 10% work pressure for Clinical Officers – indicates a normal work
pressure, which is a normal pressure, hence, Clinical Officers are able to cope with its workload
in the district. Equally, the WISN ratio of 1.1 with a -10% shows a normal workload pressure for
nurses in the district. The WISN ratio of 1.5 with a -50% work pressure reveals that the
midwives were more than required, thus not under workload pressure. They have excess time to
attend to other things;
65

5.3 Distribution of Actual Staff and Workload Pressure on Health Facilities
Comparing the difference between actual staffing with WISN results of various health workers in
the different facilities as presented in Chapter 4, the following are recommended:
5.3.1 Distribution of Doctors in Public Health Facilities in Mityana District
There were only ten (10) doctors in the entire Mityana district compared to the WISN staffing
requirement of sixteen (16) doctors as in table 5.2 below. This indicated a shortage of doctors by
four (4) at the General Hospital, one (1) at Mwera Health Centre IV and another one (1) at
Ssekanyonyi Health Centre IV. The one (1) doctor at Kyantungo Health Centre was however in
balance with the WISN staffing requirements. The shortage of doctors in the district may explain
the poor quality of current health services provided.
Table 5.3 Summary of Doctors in the districtHealth Centre Name Facility
LevelLG Norms
Actual Staff WISN Req.
Staffing Status
General Hospital Hospital 12 9 13 -4Mwera Health Centre IV 2 0 1 -1Kyantungo Health Centre
IV 2 1 1 0
Ssekanyonyi Health Centre
IV 2 0 1 -1
Total 18 10 16 0Source: Primary data.
5.3.2 Distribution of Clinical Officers
In comparing the actual and WISN staffing requirements as shown in table 5.3, the entire
Mityana District was supposed to have twenty nine (29) Clinical Officers as opposed to the
66

actual staffing level of twenty six (26). This shows that the number of Clinical officers in
Mityana District had a shortage of only three (3) staff. This was however, an insignificant
number that the district can operate without significant negative impact on patients. It indicated a
normal workload pressure.
Table 5.4 Summary for Clinical Officers staffing in the districtHealth Centre Name Facility Level LG Norm Actual Staff WISN Req. Staffing StatusGeneral Hospital Hospital 7 9 17 -8Mwera Health Centre IV 3 5 1 4Kyantungo Health Centre IV 3 2 1 1Ssekanyonyi H Centre IV 3 2 1 1Maanyi Health Centre III 2 2 1 1Kitongo Health Centre III 2 1 1 0Naam Health Centre III 2 1 1 0Bulera Health Centre III 2 0 1 -1Malangala Health Centre III 2 0 1 -1Magala Health Centre III 2 2 1 1Kabuule Health Centre III 2 1 1 0Kikandwa Health Centre III 2 0 1 -1Kyamusisi Health Centre III 2 1 1 0Total 34 26 29 -3
Source: Primary data.
5.3.3 Distribution of Midwives in Public Health Facilities in Mityana District
According to Table 5.4, there were eighty four (84) midwives in the whole of Mityana District.
This compared with the WISN staffing requirement of fifty five (55), indicates an overstaffing
by twenty nine (29) midwives. In fact, seven (7) health Centre IIs including: Katiiko, Miseebe,
Namigavu, Nalama, Lusalira, Nakaziba and Mpongo lacks midwives.
Conversely, the number of midwives in Health Centre IIIs of Kitongo and Naama included: nine
(9) health Centre IIs of Bekina, Bussunju, Kabywambo, Kalangalo, Kibale, Kiyoganyi,
Kanyanya, Nakseeta and Ttanda were in balance with their workload. The rest of the fourteen
67

(14) health Centers were overstaffed with midwives. These were led by the General Hospital
which had an excess of sixteen (16) midwives.
Table 5.5 Summary of Midwives in District Health Centre Name Facility Level LG Norms Actual Staff WISN Req. Staffing statusGeneral Hospital Hospital 28 40 24 16Mwera Health Centre IV 4 2 1 1Kyantungo Health Centre IV 4 5 1 4Ssekanyonyi Health Centre IV 4 2 1 1Maanyi Health Centre III 4 2 1 1Kitongo Health Centre III 4 1 1 0Naama Health Centre III 4 1 1 0Bulera Health Centre III 4 2 1 1Malangala Health Centre III 4 3 1 2Magala Health Centre III 4 2 1 1Kabuule Health Centre III 4 2 1 1Kikandwa Health Centre III 4 4 1 3Kyamusisi Health Centre III 4 3 1 2Bekina Health Centre II 1 1 1 0Bussunju Health Centre II 1 1 1 0Kabywambo Health Centre II 1 1 1 0Kalangalo Health Centre II 1 1 1 0Katiiko Health Centre II 1 0 1 -1Kibale Health Centre II 1 1 1 0Kiteredde Health Centre II 1 2 1 1Kiyoganyi Health Centre II 1 1 1 0Miseebe Health Centre II 1 0 1 -1Namigavu Health Centre II 1 0 1 -1Nalama Health Centre II 1 0 1 -1Kanyanya Health Centre II 1 1 1 0Lusalira Health Centre II 1 0 1 -1Nasiikombe Health Centre II 1 2 1 1Nakseeta Health Centre II 1 1 1 0Ttanda Health Centre II 1 1 1 0Nakaziba Health Centre II 1 0 1 -1Namungo Health Centre II 1 2 1 1Mpongo Health Centre II 1 0 1 -1Total 95 84 55
Source: Primary data.
5.3.4 Distribution of Nurses in Public Health Facilities
68
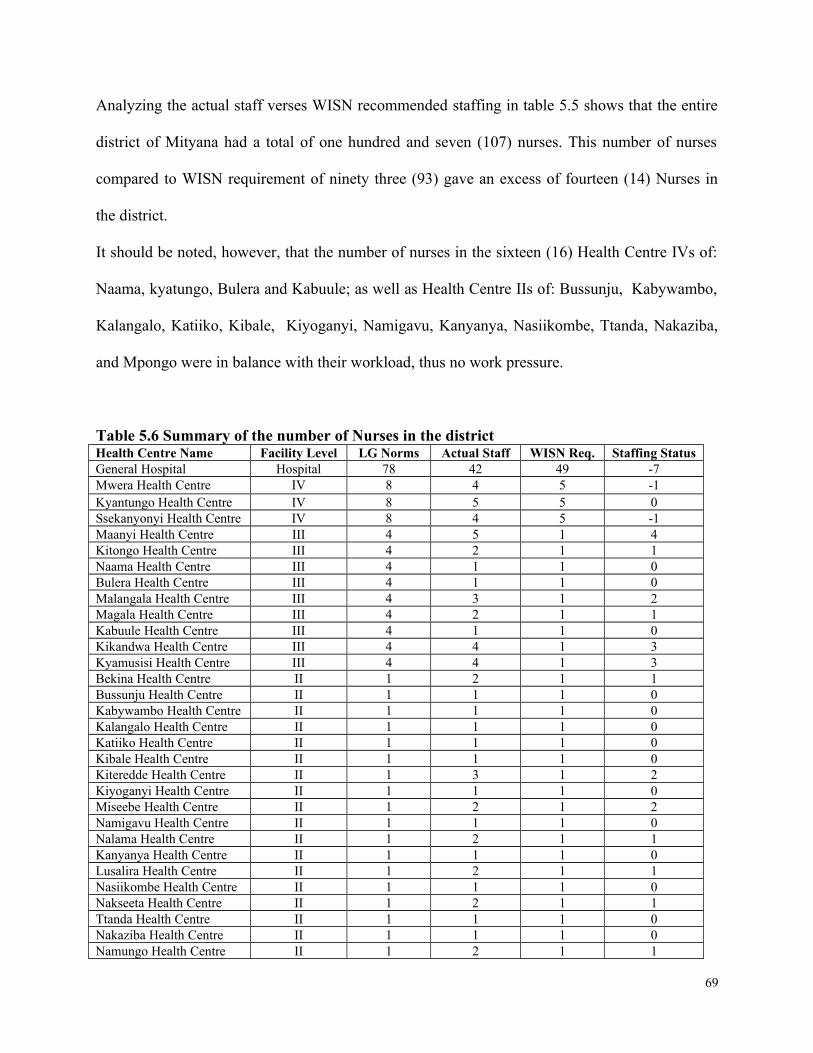
Analyzing the actual staff verses WISN recommended staffing in table 5.5 shows that the entire
district of Mityana had a total of one hundred and seven (107) nurses. This number of nurses
compared to WISN requirement of ninety three (93) gave an excess of fourteen (14) Nurses in
the district.
It should be noted, however, that the number of nurses in the sixteen (16) Health Centre IVs of:
Naama, kyatungo, Bulera and Kabuule; as well as Health Centre IIs of: Bussunju, Kabywambo,
Kalangalo, Katiiko, Kibale, Kiyoganyi, Namigavu, Kanyanya, Nasiikombe, Ttanda, Nakaziba,
and Mpongo were in balance with their workload, thus no work pressure.
Table 5.6 Summary of the number of Nurses in the district Health Centre Name Facility Level LG Norms Actual Staff WISN Req. Staffing StatusGeneral Hospital Hospital 78 42 49 -7Mwera Health Centre IV 8 4 5 -1Kyantungo Health Centre IV 8 5 5 0Ssekanyonyi Health Centre IV 8 4 5 -1Maanyi Health Centre III 4 5 1 4Kitongo Health Centre III 4 2 1 1Naama Health Centre III 4 1 1 0Bulera Health Centre III 4 1 1 0Malangala Health Centre III 4 3 1 2Magala Health Centre III 4 2 1 1Kabuule Health Centre III 4 1 1 0Kikandwa Health Centre III 4 4 1 3Kyamusisi Health Centre III 4 4 1 3Bekina Health Centre II 1 2 1 1Bussunju Health Centre II 1 1 1 0Kabywambo Health Centre II 1 1 1 0Kalangalo Health Centre II 1 1 1 0Katiiko Health Centre II 1 1 1 0Kibale Health Centre II 1 1 1 0Kiteredde Health Centre II 1 3 1 2Kiyoganyi Health Centre II 1 1 1 0Miseebe Health Centre II 1 2 1 2Namigavu Health Centre II 1 1 1 0Nalama Health Centre II 1 2 1 1Kanyanya Health Centre II 1 1 1 0Lusalira Health Centre II 1 2 1 1Nasiikombe Health Centre II 1 1 1 0Nakseeta Health Centre II 1 2 1 1Ttanda Health Centre II 1 1 1 0Nakaziba Health Centre II 1 1 1 0Namungo Health Centre II 1 2 1 1
69

Mpongo Health Centre II 1 1 1 0Total 159 107 93 14
Source: Primary data.
On the other hand, thirteen (13) health centers were overstaffed. These included: six (6) Centre
IVs of Maanyi; four (4), Kitongo; one (1), Malangala; two (2), Magala; one (1), Kikandwa; and
three (3), Kyamusisi (3). Also Health Centre IIs of: Bekina with one (1); two (2), Kiteredde; two
(2), Miseebe; one (1), Nalama; one (1), Lusalira; one (1), Namungo; and one (1) Nakseeta. The
implication was lack of alignment of task among the nurses in the different health facilities.
Only three health facilities were understaffed of nurses led by the General Hospital with a
shortage of seven (7), one (1) for Mwera and another one (1) for Ssekanyonyi Health Centre IVs.
These were facing varying workload pressure.
5.3.5 Distribution of Nursing Assistants in Public Health Facilities
Looking at table 5.7 below and comparing the difference between the actual and the WISN
required staffing, evidence shows that there were twenty eight (28) Nursing Assistants in the
entire district of Mityana. This indicated a shortage of twenty nine (29) Nursing Assistants which
was slightly more than half of the required staffing level.
The implication portrayed in table 5.7 therefore shows an understaffing of Nursing Assistants in
the entire district of Mityana. Only two (2) of the thirty two (32) health Centers were overstaffed,
70

with one (1) in Health Centre III of Kitongo and Kikandwa. This however, indicated poor
distribution of Nursing Assistant within the different health centres.
Table 5.7: Summary of number of Nursing Assistants in the district Health Centre Name Facility Level LG Norms Actual Staff WISN Req. Staffing StatusGeneral Hospital Hospital 15 12 25 -13Mwera Health Centre IV 5 1 4 -3Kyantungo Health Centre IV 5 0 4 -4Ssekanyonyi Health Centre IV 5 1 1 0Maanyi Health Centre III 3 1 1 0Kitongo Health Centre III 3 2 1 1Naama Health Centre III 3 0 1 -1Bulera Health Centre III 3 1 1 0Malangala Health Centre III 3 0 1 -1Magala Health Centre III 3 0 1 -1Kabuule Health Centre III 3 0 1 -1Kikandwa Health Centre III 3 2 1 1Kyamusisi Health Centre III 3 0 1 -1Bekina Health Centre II 2 1 1 0Bussunju Health Centre II 2 0 0 0Kabywambo Health Centre II 2 0 0 0Kalangalo Health Centre II 2 1 1 0Katiiko Health Centre II 2 0 0 0Kibale Health Centre II 2 0 1 -1Kiteredde Health Centre II 2 0 1 -1Kiyoganyi Health Centre II 2 1 1 0Miseebe Health Centre II 2 0 1 -1Namigavu Health Centre II 2 0 1 -1Nalama Health Centre II 2 1 1 0Kanyanya Health Centre II 2 0 0 0Lusalira Health Centre II 2 0 1 -1Nasiikombe Health Centre II 2 0 1 -1Nakseeta Health Centre II 2 0 0 0Ttanda Health Centre II 2 1 1 0Nakaziba Health Centre II 2 1 1 0Namungo Health Centre II 2 1 1 0Mpongo Health Centre II 2 1 1 0Total 95 28 57 -30
Source: Primary data
5.4 Implications of Understaffing and Overstaffing in Health Facilities
71

The major causes of understaffing in the health facilities were the increases in voluntary
termination, frozen hiring, and budget take-backs. The implications of understaffing and
overstaffing in health facilities are articulated below.
Some of the health facilities that were found understaffed, health workers complained of
exhaustion because they must often perform the work of two or more employees. When health
workers are exhausted, productivity goes down. Health workers in understaffed health facilities
lacked a sense of control over their rapidly increasing workload. This hectic environment lead to
poor work performance and can be detrimental to the facilities. Their creativity and ingenuity
decreased, because they were more concerned with catching up with work than thinking outside
the box. The patients did not receive timely assistance and attention from health workers, so
overall customer service delivery suffered greatly.
The health workers reported low morale of overworked health workers as there seemed no hope
of getting relief from extra workload. Low morale often cause health workers to take more days
off duty, fail to meet deadlines and show little interest in their jobs, thus resulting into low
productivity which manifests in poor quality of health services, thus a risk to patients.
It was discovered that there were high turnover of viable health workers who left for greener
pastures. The demanding work environments accompanied by low pay impelled many new
health workers to leave the health system. A high turnover rate is an expensive undertaking for
any health facility in terms costs to be incurred in recruiting and training of new employees. This
exacerbated the already existing understaffing problem.
5.5 Limitations of the Study
72

As a phenomenological study based on more of quantitative methodology of WISN, for the case
of selected health cadres in Mityana District Health Facilities for a Period of January to
December 2011, the research demonstrated both the strengths and the limitations intrinsic to such
a study. According to Mashall and Rosseman (1999) a discussion of limitations of any study,
demonstrates the researcher’s understanding, that reality is such that findings of one study cannot
be conclusive or generalized to other settings but can in the least be transferable. Some of the
limitations to note include:
The WISN method largely depends on the accuracy of the workload records which affects the
validity of the results. Some of the recorded data was inaccurate, incomplete in some health
facilities especially in rural / or remote areas e.g the record officers failed to capture for example
in-patient days and hence unable to calculate the average length of stay (ALOS).
The WISN methodology also uses workload data of the previous year to calculate staffing
requirements for the present year. To avoid this creating a potential source of error since the
staffing requirements change every year depending on the decisions of district and hospital
management, the available data for January 2011 to December 2011 were used.
Another limitation was the inadequacy of data and analysis to allow segregation of certain health
workers by specialties. An example in point was the generalization of all nurses (enrolled,
registered, etc) into one category. Doctors were also put into one category without considering
their different specialties. Therefore, the WISN calculated numbers for such health workers may
lack accuracy.
73

WISN method ignores the varying level of functionality of different health facilities even those
at the same level. For instance, not all Health Centre IVs have functional operating theatres,
which in one way or another affects the WISN calculated staffing requirements.
74

CHAPTER SIX
CONCLUSION AND RECOMMENDATIONS
6.0 Introduction
This chapter presents the conclusion and main recommendations resulting from the study that
can provide guidance to health managers and decision makers on how well to manage the
allocation and use of health workers. The Chapter also provides recommendations for further
research and some limitations of the study. The Chapter ends with a brief conclusion on the
study summary and recommendations.
6.1 Conclusions
The study has found out that:
The existing health worker distribution patterns are not conducive to meet the needs of the
patients in the district. There was poor health worker distribution especially of Nurses, Midwives
and Nursing Assistants within different health level facilities in the district, as was evidenced by
shortages and overstaffing. This problem is two faced: first, disparities in the health cadres in the
district. For instance, health facilities in remote/ far areas from Mityana town council (the district
capital city) are very under resourced. Secondly, some health cadres such as Nurses and
midwives are easier to come by in the district as compared to the other categories of health
workers.
75

The research findings revealed that there was understaffing of health workers such as doctors and
Nursing Assistants and some health facilities were not having enough health workers in the right
combination to cover the regular workload and complete job tasks efficiently. The burden of
understaffing fell on the shoulders of the few existing health workers, who had to take up the
various responsibilities for lack of adequate staff.
There were many more Nurses and Midwives in different health facilities than required. In such
facilities, shortages of health workers had created substitute – some health workers were taking
on some of the functions and roles normally beyond their specialisations. This was evidenced by
health centre that did not have Midwives but rather only Nurses and Nursing Assistants, yet are
providing care and support to women during pregnancy, labour and birth, and for up to six weeks
following the birth.
Some health facilities had a low WISN ratio, implying they were facing challenges to cope with
their workload.
6.2 Recommendations
On the basis of the findings in this report, the following recommendations are made:
6.2.1 Improving Distribution of Health Workers in Public Health Facilities
Given the revealed imbalances (over and understaffing) of health workers in the district, the
solution is to consider improving management and better distribution of Human Resource in
76

health care systems. The distribution of Health Human Resources should be seen as not merely
the availability of numbers but rather the geographical location (rural vs. urban), skills mix,
professionals mix and numbers of approved post for the different categories of professionals
needed at different levels of health facilities.
Therefore, below are the suggestions for improving distribution of selected health workers in the
different public health facilities in Mityana District.
i) Improving Distribution of Doctors
The district of Mityana had only ten (10) doctors against the sixteen (16) WISN recommended.
This means internal alignment is not possible. Referring to Table 5.2 in Chapter Five, in order
for the district to cope with its workload for doctors, it is recommended that the deficit of six
doctors be recruited from outside the district. If not, then the alternative is to shift tasks to either
Clinical Officers and or/ Nurses where there graduates. This then could be followed by ensuring
that such staff receiving appropriate training for these tasks. When they are successfully sourced
from outside the district: Four (4) of the doctors should be allocated to the General Hospital;
and Two (2) doctors, should be allocated - one to Mwera and another to Ssekanyonyi Health
Centre IVs.
ii) Improving Distribution of Clinical Officers
In order for Mityana district to cope with its workload for Clinical Officers of twenty nine (29)
according to WISN staffing requirements, the district should: consider recruitment of the three
77

(3) more Clinical Officers to cover the district shortage. This should be external (from outside
the district) transfers - possibly post them to Health Centre III of Bulera, Malangala and
Kikandwa that have none.
The second option could be for district health authorities together district public service to
consider internal (within the district) transfers for the eight (8) Clinical Officers from the
overstaffed facilities to those that are under staffed as shown in Table 5.2. For instance, the four
(4) from Mwere Health IV and four (4) from the excess of one (1) from each of the Health
Centre IV of Kyantungo and Ssekanyonyi as well as from Centre III of Maayi and Magala
should be posted to the General Hospital for it to cope with its workload. The district should
maintain the actual staffing levels for Clinical Officers in Health Centre III of Naama, Kabuule,
Katungo and Kyamusisi. Another feasible alternative would be delegation of tasks to less-highly
trained health workers would be with an appropriate orientation into these duties.
iii) Improving Distribution of Midwives
Given the scenario portrayed in Table 5.4, it is important to improve the unbalanced staffing
situation of midwives in Mityana district. The following are recommended to be done: Transfer
some seven (7) midwives from the general hospital to each of the seven (7) Health Centre IIs of:
Katiiko, Miseebe, Namigavu, Nalama, Lusalira, Nakaziba and Mpongo get one (1) midwife as
per WISN staffing requirement. The excess of seven (7) midwives at the general hospital and
excess from Health Centre IVs, one (1) Mwera, four (4) from Kyantungo, one (1) from
Ssekanyonyi, and one (1) from Maanyi should be transferred to those Health Centres that are in
shortage of other types of health workers especially nurses and Nursing Assistants.
78

iv) Improving Distribution of Nurses
In order for the nurses in the district to cope with the workload at their respective health
facilities, the following are recommended: The district should increase the number of nurses by
thirteen (13) for them to have sufficient time to perform all their tasks well. In case such staff
increase is not possible, an option would be to shift tasks to less-highly trained persons such as
the midwives and Nursing Assistants as the case may be. It should be noted, however, that such a
shift has a disadvantage of lowering the quality of health services provided, unless it is
appropriately addressed. Therefore, task-shift if taken on as an option should be approached very
carefully.
The status quo in the Health Centres with the number of nurses which is in balance with their
workload should be maintained, since there is no work pressure. For the second category of
Health Centres that are overstaffed, nine (9) of the thirteen (13) Nurses should be transferred to
facilities with shortages – General Hospital, Mwera and Ssekanyinyi Health Centre IVs. The
district then needs to redeploy the balance of four (4) nurses elsewhere.
v) Improving Distribution of Nursing Assistant
Given the huge shortage of Nursing Assistants, the district of Mityana is recommended to:
Increase the number of Nursing Assistants by twenty nine (29) for them to have sufficient time to
perform all their tasks. If such an increase is not possible, an alternative also is to shift tasks to a
less-highly trained health worker. In fact for Nursing Assistants the best option should be taking
79

on staff members with less training that are likely to continue performing the tasks in the future.
In this case, the district must ensure that these receive the appropriate training for these tasks. To
do this, the district will need to work together with those in charge of decisions regarding pre-
service training and continuing education.
Transfer the two (2) Nursing Assistants from over-staffed facilities such as Kitongo and
Kikandwa Health Centre IIIs to those that are understaffed as showed in Table 5.5. This
however, should be done carefully as in many cases it disrupts the life and work of such health
workers in the facilities with excess.
Explore the possibility of hiring the twenty nine (29) Nursing Assistants. In the event of little
scope to recruit within and get transfers from outside, the district could possibly resort to
training. However, if it is a question of a stagnant or diminishing salary budget, other avenue
should be explored to increase the budget, because failure to consider this matter means not
prioritizing better health for the people of Mityana.
In general the district can improve distribution by 1) posting staff to the understaffed health
facilities; 2) alternatives, the existing staff in overstaffed facilities can be transferred to the
understaffed. This can help provide a rapid relief to the understaff health facility; 3) allocate new
staff to health facilities with shortages. This has advantage of not disrupting the work of health
workers in those health facilities with a surplus.
80

6.2.2 Review and Align Tasks Allocation between Health Workers
To avoid over lapping roles and in order to improve efficiency, there was need to review and
align task allocation between the different health workers in the district. The tasks that are meant
for say Midwives and can be done say by Nurses, can inform a review and realignments.
Alternatively, the district health authorities can hire more / new health workers of the category in
shortage, to provide sufficient time to perform all their tasks. If recruitment of new health
workers is not possible, the professional task shifting should be exercised by utilizing less-highly
trained health workers as long as such staff are provided with appropriate induction and training
for the new tasks.
6.2.3 Improving the quality of current health Services in Public Health Facilities
Some health facilities had a low WISN ratio, implying they were facing challenges to cope with
their workload, which jeopardize quality of health services. In order for health workers to cope
with their workload, the district needs to use adequate staffing to improve the quality of current
health services in Mityana district.
6.2.4 General and Policy Recommendations
To address the problem of overstaffing and understaffing which had critical implications as
indicated in section 5.4 this study recommends:
Forecasting with accuracy should help the district to take into account all the historic and future
HRH dynamics. This requires employing forecasting tools such as WISN on a regular basis, say
81

after every two to three years. It should, however, be noted that no single methodology is optimal
for all circumstances, thus a mixture of approaches need to be employed.
The district should increase allocations to human resources for health, education, improving
salaries and working conditions. Also the district is urged to review its policies and prioritize
spending and make the best use of the available resource. Investing in staff accommodation,
equipment, supplies and drugs, especially for rural area facilities and staff, should be part of the
district development assistance programs.
The district should improve the information management at the district and health facility levels
with regular updates by every health facility. Development of an improved and expanded Human
Resource information system provides information for human resource for health planning and
management decisions.
Finally, the district should establish a system that provides visible incentives for health workers
working in rural and/or remote location. This shall attract and retain health workers in hard to
reach and hard to stay locations. The incentive scheme may comprise of availing training
opportunities including scholarships, promotions for health workers willing to stay for an agreed
period in hard-to-reach areas, among others.
6.2.5 Recommendations for Further Research
From a methodological point of view, it is recommended that the potential use of quantitative
research methodology adopted from the use of the WISN methods, as the only Human Resource
82

management tool, particularly to achieve a more just distribution and better productivity should
be further explored. This method approaches the Human Resource issues from one angle of
quantitative rather than a combination with the qualitative.
This study research on determining the appropriate number of actual staffing gap, cadre mix and
work pressures in all public health facilities in Mityana District focused essentially on
numbers of the selected health workers per se for the Public Health Centres to cope with its
workload. This only emphasizes effective management of the valuable Health Human
Resources, without looking at its quality, motivations, and remunerations among others
things.
83

REFERENCES
Adams, J., Bakalar, R., Boroch,MD., Knecht, K., Mounib, E. L., & Stuart, N., 2008. Healthcare 2015 And Care Delivery. Delivery Models Refined, Competencies Defined. IBM Global Business Services.
AHMO, 2009. Human Resources for Health Country Profile Uganda. African Health Workforce Observatory.
Amaravadi RK, Dimick JB, Pronovost PJ, et al., 2000. ICU nurse-to-patient ratio is associated with complications and resource use after esophagectomy. Intensive Care Med ;26(12):1857-62.
American Hospital Association, Commission, 2002. Commission on Workforce for Hospitals and Health Systems. In our hands: how hospital leaders can build a thriving workforce.
Awases, M., A. Gbary, J., Nyoni, and Chatora. R., 2004. Migration of Health Professionals in six countries: A Synthesis Report. WHO Regional Office for Africa. Brazzaville.Awases, M., 2007. Migration of Skilled Health Professionals in the African Region: An Overview. African Health Monitor January-June
Buchan, J and Dovlo, D., 2004. International recruitment of health workers to the UK: A report for DIFD. http://www.difdhealthrc.org/shared/publications/reports/int_rec/int-rec-main.pdf
Chaudhury, N., Hammer, J. Kremer, M., Muralidharan, K. and Rogers F. H., 2004. Provider Absence in Schools and Health Clinics. Paper presented at Northeast Universities Development Consortium Conference, MontrealCampbell C, et al., 2008. Hearing community voices: grassroots perceptions of an intervention to support health volunteers in South Africa. Sahara J 2008, 5(4):162-177.
Carayon P, Gurses AP, Hundt AS, et al., 2005. Performance obstacles and facilitators of Healthcare providers. In: Korunka C, Hoffmann P, eds. Change and quality in human service work. Vol. 4. Munchen, Germany: Hampp Publishers; 2005. p. 257-76
Cohen, J. and Uphoff, N., 1977. Rural development. Participation: concepts and measures for project design, implementation and evaluation. New York: Rural Development Comittee; 1977.
Coovadia, H, Jewkes R, Barron p, Sanders D, and Mc Intyre D., 2009. The health and the health system of South Africa: historical roots of current public health challenges. The Lancet 374: 835–846Couper, I., 2002. The Ethics of International Recruitment. Department of Family Medicineand Primary Health Care, MEDUNSA, South Africa. Paper prepared for the ARRWAGConference in Adelaide, Australia.
Crickmore, R., 1987. A review of stress in the intensive care unit. Intensive Care Nurs 1987;3:19-27
84

Delva MD, et al., 2002. Postal survey of approaches to learning among Ontario physicians: implications for continuing medical education. Brit Med J 2002, 325:1218.
Daviauda, E, Chopra, M., 2008. “How much is not enough? Human resources requirements for primary health care: a case study from South Africa.” Bulletin of the World Health Organization 86:46–51
Delanyo, D., 2005. Wastage in the health workforce: some perspectives from African countries. http://www.human-resources-health.com/content/3/1/6 [viewed 4/6/07]
Diarra-Nama, J. A., 2007. Human Resources for Health Development in the African Region: The Journey so Far. African Health Monitor January-June.
Dieleman, M and Harnmeijer, J. W., 2006. Improving health Worker performance: in search of promising practices. Evidence and Information for Policy, Department of Human Resources for Health, Geneva.
Egger, D., Lipson, D. & Adams, O., 2000. Achieving the Right Balance – The Role of Policymaking Processes in Managing Human Resources for Health Problems: Issues in Health Services Delivery. Discussion Paper No. 2. Geneva: WHO, Human Resources for Health Department
Fawcett, B. and South, J., 2005. Community involvement and Primary Care Trusts: The case for social entrepreneurship. Critical Public Health 2005, 15(2):191-204.
Gilson, L. et al., 1989. National community health worker programs: how can they be strengthened? J Public Health Policy 1989, 10(4):518-532.
GoU, 2007. Annual Health Sector Performance Report. Financial Year 2006/2007Global Health Initiative Kenya Strategy, 2011. In Partnership with the Government of Kenya. Revision: Kenya Strategy 2011/14
Gurses, A. P., 2005. ICU nursing workload: causes and consequences—final report Rockville, MD: Agency for Healthcare Research and Quality; 2005. Available at: http://hfrp.umaryland.edu/People/gurses_AHRQ_final_report-06-15-05.pdf.
Hickam, D. H., et al., 2003. The Effect of Health Care Working Conditions on Patient Safety. Evidence Report/Technology Assessment Number 74. (Prepared by Oregon Health & Science University under Contract No. 290-97-0018.) AHRQ Publication No. 03-E031. Rockville, MD: Agency for Healthcare Research and Quality.
Hedberg, B. and Larsson, U. S., 2004. “Environmental Elements Affecting Decision-Making Process in Nursing Practice.” Journal of Clinical Nursing 13(3) 316-24.Hongoro, C. and Normand, C., 2006. Health Workers: Building and Motivating the Workforce. Disease Control Priorities in Developing CountriesHossain B, and Khaleda B., 2001. Likely Benefit of Using Workload Indicators of Staffing Need (WISN) for Human Resources Management and Planning in the Health Sector of Bangladesh.
85

Jamison, D. T. et al. (ed)., 2006. Improving the Quality of Care in Developing Countries. Disease Control Priorities in Developing Countries. 2nd edition. Joint Learning Initiative, 2004. Human resources for health: overcoming the crisis. Cambridge, Global Equity
Kadowa, I. and Nuwaha, F., 2009. Factors influencing disclosure of HIV positive status in Mityana district of Uganda. Afr Health Sci. 2009 March; 9(1): 26–33. PMCID: PMC2932514Kane, R. L., 2007. Nurse Staffing and Quality of Patient Care. Evidence Report/Technology Assessment. Number 151
Kurowski, C., and Mills, A., 2006. Estimating human resource requirements for scaling up priority health interventions in Low income countries of Sub-Saharan Africa: A methodology based on service quantity, tasks and productivity (THE QTP METHODOLOGY)
Kurowski, C., Wyss, K., Abdulla, S., Yémadji, N. and Mills, A., 2004 Human Resources for Health: Requirements and Availability in the Context of Scaling-up Priority Interventions in Low-income Countries. Case Studies from Tanzania and Chad. HEFP Working paper 01/04. London School of Hygiene and Tropical Medicine.Larry, W., and Chang, M.D., 2009. Task Shifting: A Solution for the Health Worker Human Resource Crisis?
Leonard, K. L.,. Masatu, M. C., and Vialou, A., 2005. Getting doctors to do their best: Ability, altruism and incentives. Working paper. University of Maryland.Levin, A, Dmytraczenko, T, and Ssengooba, F., 1999. Costs of Maternal Health care Services inMasaka District, Uganda. Partnership for Health Reform Special Initiative Report 16.
Lynch, E. and Diallo. I., 2002. Donor Mapping. Study commissioned by USAID/Mali
Lwasampijja, 2009. Mityan Sistrict PMTCT Program : Achievements, Challenges And Lessons Learnt
Mæstad, O., 2006. Human Resources for Health in Tanzania: Challenges, Policy Options and Knowledge Gaps. CMI Reports.Macinko J, et al., 2006. Evaluation of the impact of the Family Health Program on infant mortality in Brazil, 1990–2002. J Epidemiol Community Health 2006, 60(1):13-19.
Marchal, B., De Brouwere. V. and Kegels, G., 2005. Viewpoint: HIV/AIDS and the health workforce crisis: what are the next steps? Trop Med Int Health 2005, 10(4):300-304.
Mashall, C. and Rossman G. B., 1999. Designing Qualitative Research. Thousands Oaks, CA: Sage
McManus, I. C., Winder, B. C., and Gordon, D., 2002. The causal links between stress and burnout in a longitudinal study of UK doctors. The Lancet 2002; 359: 2089-2090. Crane M. Why burned-out.
86

McPake, B. and Mensah, K., 2008. Task shifting in health care in resource-poor countries. Lancet 2008, 372(9642):870-871 Federation and World Confederation for Physical Therapy
Matsiko C.W., 2001. Motivating health workers: Will it improve health care indicators? Uganda Health Bulletin 2001 7 (4); 38–9.
Mbonye, A., 2001. The Structure of The Ministry of Health: Is there room for democracy and motivation? Uganda Health Bulletin 2001 7 (1); 21–23.
Meisinger, S. R., 2005. ‘The four Cs of the HR profession: being competent, curious, courageous and caring about people’, Human Resource Management, 44:2, pp 189–94. http://doc.mbalib.com/view/1ffe753e3f02f6705fc463cb0dabd427.html
McPake, B. and Kwadwo-Mensah, K., 2008. Task Shifting in Health care in Resource poor Countries. The Lancet; 372, 9642; Platinum Periodicals pg. 870
MoH, 2004. Draft Manual for management of Health Services in the Health sub-sector2007. Uganda Human Resources for Health Strategic Plan 2005-20202009. Human Resources for Health Audit Report, Kampala2010. Health Sector Strategic and Investment Plan: Promofing people’s health to enhance socio-economic development 2010/11–2014/15, Kampala: Ministry of Health.
Mojoyinola, J. K., 2008. Effects of Job Stress on Health, Personal and Work Behaviour of Nurses in Public Hospitals in Ibadan Metropolis, NigeriaMugisha, J, F., and Namaganda, G., 2008. Using the Workload Indicator Of Staffing Needs (Wisn) Methodology To Assess Work Pressure Among The Nursing Staff Of Lacor Hospital. 1 Faculty of Health Sciences, Uganda Martyrs University
Nabudere, H., Asiimwe, D., & Mijumbi, R., 2010. An Evidence-Based Policy Brief Task Shifting to optimize the roles of health workers to improve the delivery of maternal and child Healthcare. Prepared by the Uganda country node of the Regional East African Community Health (REACH) Policy Initiative.
Oelke, et al., 2008. Nursing Workforce Utilization: An Examination of Facilitators and Barriers on Scope of Practice. Nursing Research.
Oketcho, V., Namaganda, G., and Matsiko, C., 2009. Human Resources for Health Planning In Uganda: Pracfice and lessons, Uganda Capacity Program, IntraHealth International, UgandaSamb, B., et al., 2007. Rapid expansion of the health workforce in response to the HIV epidemic. N Engl J Med. 2007;357:2510-2514.
Romanow, R. J., 2002. Building on Values: The Future of Health Care in Canada. Ottawa: Commission on the Future of Health Care in Canada.
Rasmussen, A., 2010. WISN Workload Indictors of staffing needs. User’s manual
Ruwoldt, P., and Hassett, P., 2007. Zanzibar Health Care Worker Productivity Study: Preliminary Study Findings. Training Resources Group, Inc.
87

Shipp, P., 1988. Workload Indictors of staffing needs (WISN). A Manual for Implementation. Geneva, World Health Organization, (WHO/HRB/98.2)
Ssengooba, F, et al., 2003. Health Systems Development Programme Maternal Health Review Uganda. Makerere University Institute of Public Health. HSD/WP/04/03
UCC, 2011. Rural Communications Development Fund (RCDF). RCDF projects in Mityana District, Uganda. UCC Support through the RCDF Programme.USAID Support for Analysis and Research in Africa, 2003. The Health Sector Human Resource Crisis in Africa: An Issues Paper. Washington, D.C.: Bureau for Africa Office of Sustainable Development Wiskow, C., 2010. How to create an attractive and supportive working environment for health professionals. Health Systems and Policy Analysis. Policy Brief 15WHO, 2003. The people who work for our health: placing health workers at the heart of health service delivery in Africa. Brazzaville, page 4.
WHO, 2009. Towards Universal Access: Scaling up priority HIV/AIDS interventions in the health sector: progress report 2009. WHO Press.
WHO/AFRO Brazzaville, 2004. Report on Human Resources for Health status in the African Region.
Wood R. et al., 1996. Models of job-related stress and personal achievement among consultant doctors. British Journal of Psychology 1996, 87:3-29.
88

APPENDICESAPPENDIX 1: LETTER OF INTRODUCTION
89

APPENDIX 2: Health Facilities in Mityana District
NAME OF FACILITY LEVEL HMIS 105 HMIS 108 NO.DOCTORS C.O MW NO N.A
1 KALANGALO HC 12 NA 0 0 1 1 1
2 KIBAALE HC II 9 NA
3 TTANDA HC II 11 NA 0 0 1 1 1
4 KASIIKOMBE HC II 12 NA 0 0 2 1 0
5 LUSALIRA HC II 12 NA 0 0 0 1 0
6 NAMIGAVU HC II 12 NA 0 0 0 1 0
7 KITEREDDE HC II 12 NA 0 0 2 3 0
8 KABUWAMBO HC II 12 NA 0 0 1 1 0
9 BUSUNJU HC II 12 NA 0 0 1 1 010 MAANYI HC III 7 5 0 2 1 5 111 MALANGALA HC III 12 0 0 0 3 3 112 KABULE HC III 12 0 0 1 2 1 013 MAGALA HC III 12 0 0 2 2 2 014 NAAMA HC III 12 0 0 1 1 1 015 Mityana Hospital HOSPITAL 12 12 9 9 40 42 1216 Bekiina II 7 NA 0 0 0 2 117 Miseebe II 12 NA 0 0 0 2 018 Kiyoganyi II 12 NA 0 0 1 1 119 Katiiko II 12 NA 0 0 0 1 020 Nakaseeta II 12 NA 0 0 1 2 021 Namungo II 11 NA 0 0 2 1 122 Kalama II 12 NA 0 0 1 1 123 Mpongo II 12 NA 0 0 1 1 024 Nakaziba II 12 NA 0 0 0 1 125 Kanyanya II 12 NA 0 0 1 1 026 Bulera III 12 0 0 0 2 1 127 Kitongo III 12 1 0 1 1 2 228 Kikandwa III 12 0 0 0 4 4 229 Kyamusisi III 12 9 0 0 3 4 0
90

30 Mwera IV 12 11 0 5 2 4 131 Kyantungo IV 12 12 1 2 5 5 032 Ssekanyonyi IV 12 12 0 2 2 4 1
91

APPENDIX 3: HMIS 105: HEALTH UNIT MONTHLY REPORT
Health unit name MALANGALA
Level HC III
Health sub district MWERA-BUSUJJU
District MITYANA
Ownership GOVERNMENT
Number of wards OUT PATIENT UTILIZATION DATA Jan
Feb
Mar
Apr
May Jun Jul
Aug
Sept Oct Nov Dec
Average
Annual total
Total New Attendance 735 558 826 661
1298
1118
1469 624 982
1436
1024
1319
1,004
12,050
Total Re-attendance 118 70 56 93 130 125 247 41 104 72 131 73
105
1,260
Total Referrals from unit (all ages) 2 1 4 2 1 1 4 5 6 6 5 5
4
42
ANTENATAL/POSTNATAL CLINIC
-
Total New ANC Attendance 69 59 53 37 68 51 66 56 40 44 57 42
54
642
Total ANC re-attendance 4th visit 8 12 12 15 10 15 7 13 11 10 4 6
10
123
Total Referrals from unit 7 1 3 4 8 7 2 3 1 0 2 4
4
42
Total Postnatal visits - 3 2 4 5 7 2 4 5 9 1 3 4
45
MATERNITY -
Total Admissions 26 23 19 32 36 26 23 24 21 21 20 21
24
292
Total Referrals from unit 1 3 2 6 3 3 1 3 4 3 3 4
3
36
Total Deliveries in unit 20 19 15 25 30 22 20 21 15 18 16 18
20
239
Total Still births in unit - 0 0 0 1 0 1 0 0 0 2 0 0
4
Total Birth Asphyxia - 0 0 0 0 0 0 1 0 1 0 1 0
3
Total Maternal deaths - 0 0 0 0 0 0 0 0 0 0 0 -
-
TETANUS IMMUNISATION -
Dose 1 38 55 49 35 65 22 58 48 32 48 54 30
45
534
92

Dose 2 19 22 44 39 20 18 19 40 44 19 25 12
27
321
Dose 3 - 0 0 0 0 0 0 0 0 0 0 0 -
-
Dose 4 - 0 0 0 0 0 0 0 0 0 0 0 -
-
Dose 5 - 0 0 0 0 0 0 0 0 0 0 0 -
-
Total Pregnant women TT vaccine
57
77
93
74
85
40
77
88
76 67
79 42
71
855
Dose 1 - 0 0 0 0 0 0 0 0 0 0 0
-
-
Dose 2 - 0 0 0 0 0 0 0 0 0 0 0
-
-
Dose 3 - 0 0 0 0 0 0 0 0 0 0 0
-
-
Dose 4 - 0 0 0 0 0 0 0 0 0 0 0
-
-
Dose 5 - 0 0 0 0 0 3 0 0 0 0 0
0
3
Total Non-pregnant women TT vaccine - - - - - -
3
-
- - - -
0
3
CHILD IMMUNISATION
-
Total BCG 31 45 23 62 32 56 53 45 43 27 30 57
42
504
Total Polio 0 14 19 11 24 20 17 13 33 23 9 19 28
19
230
Total Polio 1 30 47 35 52 47 61 62 36 49 29 30 61
45
539
Total Polio 2 30 42 46 37 43 50 50 44 44 23 36 51
41
496
Total Polio 3 33 32 30 32 27 33 35 47 37 27 26 40
33
399
Total DPT-HepB+Hib 1 31 47 32 45 46 60 53 39 48 13 40 66
43
520
Total DPT-HepB+Hib 2 30 42 46 37 42 45 58 52 45 14 38 47
41
496
Total DPT-HepB+Hib 3 29 32 29 30 27 33 40 43 43 13 30 52
33
401
Total Measles 29 32 33 26 24 32 23 18 32 14 17 31
26
311
Total Immunizations 257
338
285
345
308
387
387
357
364 169
266 433
325
3,896
OUT PATIENT UTILIZATION DATA Jan
Feb
Mar
Apr
May Jun Jul
Aug
Sept Oct Nov Dec
Average
Annual total
FROM THE OPERATING THEATRE
-
93

Total Female Sterilisation (tubal ligation) - 0 0 0 0 0 0 0 0 0 0 0
-
-
Total Male Sterilisation (vasectomy) - 0 0 0 0 0 0 0 0 0 0 0
-
-
Total Implant new users - 0 0 0 0 0 0 0 0 0 0 0 - -
Total Implant revisits - 0 0 0 0 0 0 0 0 0 0 0 - -
Total Implant removals - 0 0 0 0 0 0 0 0 0 0 - -
PMTCT SERVICES #DIV/0! #DIV/0!
Total Pregnant women tested for HIV
65 63 53 36 60 43 59 52 36 40 56 42
50
605
HCT SERVICES #DIV/0! #DIV/0! Total HIV counseled
41 52 16 65 24 31 17 9 42 35 47 68 37
447
Total Received HIV results 42 52 16 65 24 31 17 9 42 25 54 79 38 456
Total HIV positive 42 4 1 7 1 2 2 2 4 1 5 10 7 81
INPATIENT ACTIVITIES - Admission all wards minus maternity - 0 0 0 0 0 0 0 0 0 0 0
-
-
Deaths all wards minus materinity - 0 0 0 0 0 0 0 0 0 0 0 -
-
Inpatient days maternity 78
69
57
96
108
78
69
72
63 63
60 63 73 876
In patient days other wards minus maternity - 0 0 0 0 0 0 0 0 0 0 0
-
-
2. Referrals - Number Inpatients referred from this health unit - 0 0 0 0 0 0 0 0 0 0 0
-
-
3. MAJOR SURGICAL PROCEDURES - Caesarian sections
- 0 0 0 0 0 0 0 0 0 0 0 - - Other major operations minus caesarian sections - 0 0 0 0 0 0 0 0 0 0 0
-
-
Total Number Major Operations including CS - 0 0 0 0 0 0 0 0 0 0 0
-
-
4. MINOR SURGICAL PROCEDURES
-
Total Number Minor Operations minus dental extractions - 0 0 0 0 0 0 0 0 0 0 0
-
-
94

APPENDIX 4: HMIS 108: HEALTH UNIT INPATIENT MONTHLY REPORT
Health unit name MITYANA HOSPITAL
Level HOSPITAL
Health sub district MITYANA HOSPITAL
District MITYANA
Ownership GOVERNMENT
Number of wards 4
OUT PATIENT UTILIZATION DATA Jan Feb Mar Apr May Jun Jul Aug Sept Oct Nov Dec
Average
Annual total
Total New Attendance 9,735 9196 6282 9500 2986282 9747 8640 9194 10209 10221 10485 10078
257,464
3,089,569
Total Re-attendance 2,303 2223 2323 2381 2348 2371 2307 2243 2395 2451 2321 2335
2,333
28,001
Total Referrals from unit (all ages) - 0 0 0 0 0 0 0 0 0 0 0
-
-
ANTENATAL/POSTNATAL CLINIC
-
Total New ANC Attendance
510 311 361 265 385 423 391 359 355 331 329 302
360
4,322
Total ANC re-attendance 4th visit
9 13 11 11 10 48 22 31 31 93 68 77
35
424
Total Referrals from unit - 46 0 0 0 0 0 0 0 0 0 0 4
46
Total Postnatal visits - 75 7 11 0 33 61 55 99 92 89 88 51
610
-
MATERNITY -
Total Admissions 553 503 585 572 555 505 538 498 519 533 567 451
532
6,379
Total Referrals from unit 2 2 2 3 2 6 1 3 2 2 0 2
2
27
Total Deliveries in unit 408 440 376 429 327 409 373 420 422 425 335
95

379 395 4,743
Total Still births in unit 24 21 28 24 19 13 21 16 24 29 18 15
21
252
Total Birth Asphyxia 15 17 19 17 13 15 19 17 19 21 27 19
18
218
Total Maternal deaths 4 3 1 2 1 1 1 0 0 5 1 1
2
20
-
TETANUS IMMUNISATION
-
Dose 1 346 303 371 288 399 394 37 308 314 297 326 359
312
3,742
Dose 2 191 253 243 198 151 269 183 244 260 141 171 189
208
2,493
Dose 3 12 9 10 6 6 8 9 7 4 3 10 8
8
92
Dose 4 1 3 8 6 3 8 2 8 4 7 9 7
6
66
Dose 5 1 0 2 0 1 1 3 4 2 3 2 2
2
21
Total Pregnant women TT vaccine
551 568 634
498
1 680 234 571 584
451
518
565
488
5,855
-
Dose 1 48 33 46 55 68 76 56 70 64 84 39 57
58
696
Dose 2 2 3 0 4 4 4 9 2 2 1 2 0
3
33
Dose 3 1 6 5 6 3 4 6 3 4 3 2 1
4
44
Dose 4 1 0 1 1 1 3 3 0 2 3 1 0
1
16
Dose 5 - 0 0 0 1 0 1 3 1 1 0 1
1
8
Total Non-pregnant women TT vaccine
52 42 52
66
77 87 75 78 73
92
44
59
66
797
-
CHILD IMMUNISATION
-
96

Total BCG 258 260 281 260 272 196 246 288 292 282 292 261
266
3,188
Total Polio 0 226 161 181 198 243 168 216 242 261 248 289 220
221
2,653
Total Polio 1 147 96 113 146 156 149 138 107 155 139 151 144
137
1,641
Total Polio 2 154 72 96 112 158 143 155 110 116 113 129 135
124
1,493
Total Polio 3 154 113 76 75 116 117 126 125 86 124 133 121
114
1,366
Total DPT-HepB+Hib 1 147 115 143 145 153 149 138 107 155 139 151 144
141
1,686
Total DPT-HepB+Hib 2 154 102 130 103 152 134 137 110 116 113 129 135
126
1,515
Total DPT-HepB+Hib 3 154 126 98 103 115 98 125 125 86 124 123 121
117
1,398
Total Measles 95 72 88 71 98 74 87 83 145 102 89 124
94
1,128
Total Immunizations 1,489 1,117 1,206
1,213
1,463 1,228 1,368 1,297 1,412
1,384
1,486
1,405
1,339
16,068
OUT PATIENT UTILIZATION DATA Jan Feb Mar Apr May Jun Jul Aug Sept Oct Nov Dec
Average
Annual total
FROM THE OPERATING THEATRE
-
Total Female Sterilisation (tubal ligation)
6 4 3 4 5 6 6 3 400 5 4 8
38
454
Total Male Sterilisation (vasectomy) - 0 0 0 0 0 0 0 0 0 0 0
-
-
Total Implant new users - 0 0 0 0 0 0 0 0 25 8 0
3
33
Total Implant revisits - 0 0 0 0 0 0 0 0 17 9 0
2
26
Total Implant removals - 0 1 0 0 0 0 0 4 2 2 0
1
9
-
PMTCT SERVICES #DIV/0! #DIV/0!
Total Pregnant women tested for HIV
187 127 89 43 380 310 402 362 440 366 367 314
282
3,387
#DIV/0! #DIV/0!
HCT SERVICES #DIV/0! #DIV/0!
97

Total HIV counseled 419 129 0 0 670 370 246 593 592 627 273 565
374
4,484
Total Received HIV results 431 125 0 0 699 370 253 593 623 653 285 598
386
4,630
Total HIV positive 107 32 0 0 138 57 46 77 135 131 55 84
72
862
INPATIENT ACTIVITIES -
Admission all wards minus maternity
553 383 382 932 660 715 642 479 435 589 572 602
579
6,944
Deaths all wards minus materinity
27 25 20 26 27 34 29 30 24 30 35 33
28
340
Inpatient days maternity 1,342 1175 1610 1252 1188 1405 1411 1392 1365 1403 1361 1241
1,345
16,145
In patient days other wards minus maternity
2,808 2481 1694 1957 2706 3116 3413 2220 2132 2121 2692 2668
2,501
30,008
2. Referrals -
Number Inpatients referred from this health unit
20 24 19 19 17 16 38 42 23 25 20 29
24
292
3. MAJOR SURGICAL PROCEDURES
-
Caesarian sections 97 88 106 104 117 79 103 84 114 109 75 72
96
1,148
Other major operations minus caesarian sections
60 32 33 40 30 39 32 40 39 34 35 41
38
455
Total Number Major Operations including CS
157 120 139 144 147 118 135 124 153 143 110 113
134
1,603
4. MINOR SURGICAL PROCEDURES
-
Total Number Minor Operations minus dental extractions
69 68 64 90 82 86 75 63 69 103 90 78
78
937
98