Embed Size (px)
Citation preview

i
DETERMINATION OF A PRICE INDEX FOR ESCALATION OF BUILDING CONSTRUCTION COSTS IN TURKEY
A THESIS SUBMITTED TO THE GRADUATE SCHOOL OF NATURAL AND APPLIED SCIENCES
OF MIDDLE EAST TECHNICAL UNIVERSITY
BY
SERHAN KAHRAMAN
IN PARTIAL FULFILLMENT OF THE REQUIREMENTS FOR
THE DEGREE OF MASTER OF SCIENCE IN
CIVIL ENGINEERING
AUGUST 2005

ii
Approval of the Graduate School of Natural and Applied Sciences
____________________
Prof. Dr. Canan Özgen Director
I certify that this thesis satisfies all the requirements as a thesis for the degree of Master of Science.
______________________ Prof. Dr. Erdal Çokça
Head of Department
This is to certify that we have read this thesis and that in our opinion it is fully adequate, in scope and quality, as a thesis for the degree of Master of Science.
______________________________
Asst. Prof. Dr. Rifat Sönmez
Supervisor
Examining Committee Members
Prof. Dr. Talat Birgönül (METU, CE) _____________________
Asst. Prof. Dr. Rifat Sönmez (METU, CE) _____________________
Assoc.Prof.Dr. İrem Dikmen Toker (METU, CE) _____________________
Dr. Engin ERANT (METU, CE) _____________________
Kerem Tanboğa, M.S. (TEKNOKA) _____________________

iii
I hereby declare that all information in this document has been obtained
and presented in accordance with academic rules and ethical conduct. I also
declare that, as required by this rules and conduct, I have fully cited and
referenced all material and results that are not original to this work.
Name, Last name : Serhan Kahraman Signature :

iv
ABSTRACT
DETERMINATION OF A PRICE INDEX
FOR ESCALATION OF
BUILDING CONSTRUCTION COSTS IN TURKEY
KAHRAMAN, Serhan
M.S. Department of Civil Engineering
Supervisor: Asst. Prof. Dr. Rifat SÖNMEZ
August 2005, 85 pages
Construction cost indices are developed to measure the degree of price variations
in construction material and labor costs. However, each specific type of
construction is a combination of unique set of materials and labor. As such, the
degree of price variations referring to each specific type of construction shall be
measured by specific price indices, in order to achieve more accurate results. In
Turkey, Producer Price Index (PPI) published by State Statistics Institute is
commonly used for the escalation of building costs. This study aims to compare
the existing cost indices as well as new alternative cost indices in terms of their
adequacy for the representation of variations in the building costs in Turkey. The
developed price indices will be tested to measure their fit with the cost of
building projects, will be compared with the price indices published by the
Ministry of Public Works and Settlement and also State Statistics Institute, and
finally the most adequate price indices among the examined ones to be used for

v
building projects will be selected. Moreover, models representing past price
movements will be developed.
Key Words: Price Index, Escalation, Correlation, Regression Analysis.

vi
ÖZ
TÜRKİYE’DE YER ALAN BİNA PROJELERİNİN MALİYETLERİNİN
ESKALASYONU İÇİN BİR FİYAT ENDEKSİ BELİRLENMESİ
KAHRAMAN, Serhan
Yüksek Lisans, İnşaat Mühendisliği Bölümü
Tez Yöneticisi: Yrd. Doç. Dr. Rifat SÖNMEZ
Ağustos 2005, 85 sayfa
İnşaat fiyat endeksleri, inşaat malzeme ve işçilik maliyetlerindeki fiyat
değişikliklerinin seviyesini ölçmek amacıyla geliştirilmiştir. Bununla birlikte her
tip inşaat, kendine özgü malzeme ve işçilik grubu kombinasyonundan
oluşmuştur. Dolayısıyla, daha hassas sonuçlar elde edebilmek için, her tip inşaat
projesine tekabül eden fiyat değişikliklerinin seviyesi, kendilerine özgü fiyat
endeksleriyle ölçülmelidir. Türkiye’de bina maliyetlerinin eskalasyonu için
genellikle Devlet İstatistik Enstitüsü tarafından yayınlanan Üretici Fiyat Endeksi
kullanılmaktadır. Bu çalışma, Türkiye’de bina maliyetlerindeki değişikliklerin
temsil edilebilmesi için mevcut fiyat endeksleri ile yeni alternatif fiyat
endekslerinin uygunlukları açısından kıyaslanmasını amaçlamaktadır.
Geliştirilen fiyat endeksleri, bina projelerinin sözleşme fiyatlarına uygunluklarını
ölçmek için test edilecek, Bayındırlık ve İskan Bakanlığı ve ayrıca Devlet
İstatistik Enstitüsü tarafından yayınlanan fiyat endeksleriyle kıyaslanacak ve
sonuçta incelenen endeksler arasından bina projeleri için kullanilabilecek en
uygun fiyat endeksleri seçilecektir. Bunlara ilaveten, geçmişteki fiyat
hareketlerini temsil eden modeller geliştirilecek ve geliştirilen modellerin

vii
sonuçları gelecekteki fiyat hareketlerinin tahmin edilmesi açısından ayrıca ele
alınacaktır.
Anahtar Sözcükler: Fiyat Endeksi, Eskalasyon, Korelasyon, Regresyon Analizi.

viii
ACKNOWLEDGMENTS
I want to gratefully thank to Dr. Rifat Sönmez, without whom I would not be
able to complete my thesis, for his unconditional guidance, support, patience and
tolerance at each step of this study. His unlimited assistance that made my
research come into this stage should never be forgotten.
For the provision of good times throughout my life, my father Hüseyin
Kahraman, my mother Halise Kahraman and my sister Nihan Kahraman, who
have never left me alone, deserve special emphasis. I would like to express my
appreciation to my family members for their endless love and efforts that
encouraged me to realize my goals.
I wish to thank to Öntepeli and Mercan families who have participated in this
study and especially to my brother Bahadır Öntepeli for his positive approach
and considerable aids that have made this study reach its objectives.
I should thank to all my friends, who have believed in me in the way to achieve
this study, for their sincere and continuous love.
Finally, I would like to thank to Özge Mercan, from whom I have always
received spiritual and remarkable support and who made me feel strong all the
time by sharing her unique friendship.

ix
TO MY FAMILY,

x
TABLE OF CONTENTS PLAGIARISM.................................................................................................... iii
ABSTRACT ........................................................................................................ iv
ÖZ ........................................................................................................................ vi
ACKNOWLEDGMENTS ............................................................................... viii
DEDICATION.................................................................................................... ix
TABLE OF CONTENTS.................................................................................... x
LIST OF TABLES ............................................................................................ xii
LIST OF FIGURES ......................................................................................... xiv
LIST OF ABBREVIATIONS........................................................................... xv
CHAPTERS
1. INTRODUCTION ................................................................................. 1
2. LITERATURE REVIEW ..................................................................... 7
3. GENERAL INFORMATION ABOUT PRICE INDICES ………...17
3.1 Introduction................................................................................... 17
3.2 General........................................................................................... 18
3.3 Price Index ..................................................................................... 19
3.3.1 Basket of goods and services................................................... 20
3.3.2 Weight ..................................................................................... 21
3.3.3 Base year price ........................................................................ 21
3.3.4 Current price............................................................................ 21
3.4 Construction Price Indices ........................................................... 22
3.4.1 General .................................................................................... 22
3.4.2 Outline of processes in developing a
construction price index ................................................................... 26
3.5 Consumer Price Index (CPI)........................................................ 28
3.6 Producer Price Index (PPI).......................................................... 30
3.7 Building Construction Cost Index (BCCI) ................................. 32
3.8 Cost Index (CI) .............................................................................. 33

xi
4. METHODOLOGY AND DATA ANALYSIS ................................... 34
4.1 Introduction................................................................................... 34
4.2 Data Collection .............................................................................. 35
4.3 Identification of Price Indices ...................................................... 39
4.3.1 Available Price Indices............................................................ 39
4.3.2 Produced Price Indices ............................................................ 39
4.3.2.1 Produced Building Price Index 1 (PBPI1)....................... 40
4.3.2.2 Produced Building Price Index 2 (PBPI2)....................... 44
4.3.2.3 Produced Building Price Index 3 (PBPI3)....................... 47
4.3.2.4 Produced Building Price Index 4 (PBPI4) ............................50
4.3.2.5 Summary List for the Price Indices ................................. 52
4.4 Regression Analysis....................................................................... 54
4.5 Comparison of Indices .................................................................. 63
4.6 Prediction of Future Index Values .............................................. 65
5. CONCLUSIONS AND RECOMMENDATIONS ............................ 81
REFERENCES.................................................................................................. 84

xii
LIST OF TABLES
TABLES
Table 4.1 List of projects...……………………………………...... 36
Table 4.2 Unit Costs of the Projects……………………………… 38
Table 4.3 Average Weights for PBPI1……………………………. 43
Table 4.4 Index values for PBPI1……………………………….... 44
Table 4.5 Average Weights for PBPI2……………………………. 46
Table 4.6 Index values for PBPI2………………............................ 47
Table 4.7 Average Weights for PBPI3…………………………..... 48
Table 4.8 Index values for PBPI3………………............................ 49
Table 4.9 Average Weights for PBPI4……………......................... 51
Table 4.10 Index values for PBPI4……………................................ 52
Table 4.11 Values for Available and Produced Price Indices for the time frame 1994-2004……………………………... 53
Table 4.12 Closeness of Fit of the models RM1.1 to RM1.8 60
Table 4.13 Prediction Performance of the models RM1.1 to RM1.8 63
Table 4.14 Comparison Table for the Models RM1.1 to RM1.8….. 64
Table 4.15 Closeness of Fit for Building Cost Index……………… 69
Table 4.16 Closeness of Fit for Produced Building Price Index 4 (PBPI4)…………………………………………………. 69
Table 4.17 Corresponding Values of Building Cost Index for each year (Constant ≠ 0)…………………………………….. 71
Table 4.18 Corresponding Values of Building Cost Index for each year (Constant = 0)…………………………………….. 72

xiii
Table 4.19 Corresponding Values of Produced Building Price Index 4 for each year (Constant ≠ 0)…………………... 73
Table 4.20 Corresponding Values of Produced Building Price Index 4 for each year (Constant = 0)…………………... 74
Table 4.21 Prediction Performance for Building Cost Index……… 75
Table 4.22 Prediction Performance for Produced Building Price Index 4 ………………………………………………… 75
Table 4.23 Predicted Values of BCI and PBPI4 for years 2005, 2006 and 2007 and corresponding Increase Rates (Models derived when constant was 0).………………. 77
Table 4.24 Expected rates of inflation……………………………... 78
Table 4.25 Predicted Values of BCI and PBPI4 for years 2005, 2006 and 2007.………………………………………… 79

xiv
LIST OF FIGURES
FIGURES
Figure 4.1 Closed Areas of the Projects.......................................... 37
Figure 4.2 Unit Cost vs. Building Cost Index.................................. 56
Figure 4.3 Unit Cost vs. Consumer Price Index.............................. 56
Figure 4.4 Unit Cost vs. Producer Price Index................................ 57
Figure 4.5 Unit Cost vs. Cost Index ................................................ 57
Figure 4.6 Unit Cost vs. Produced Building Price Index 1.............. 58
Figure 4.7 Unit Cost vs. Produced Building Price Index 2.............. 58
Figure 4.8 Unit Cost vs. Produced Building Price Index 3.............. 59
Figure 4.9 Unit Cost vs. Produced Building Price Index 4.............. 59
Figure 4.10 Building Cost Index vs. Years........................................ 67
Figure 4.11 Produced Building Price Index 4 vs. Years.................... 68
Figure 4.12 Building Cost Index vs. Years including future values.. 79
Figure 4.13 Produced Building Price Index 4 vs. Years including future values...................................................................
80

xv
LIST OF ABBREVIATIONS
BCEPC Belgian Chemical Engineering Plant Cost
BCI Building Cost Index
CEPC Chemical Engineering Plant Cost
CI Cost Index
CPI Consumer Price Index
ENR Engineering News Record
EUROSTAT Statistical Office of the European Community
MAPE Mean Absolute Percent Error
MPWS Ministry of Public Works and Settlement
M&S Marshall and Swift
NFCC Nelson-Farrar Construction Cost
OECD Organization for Economic Co-operation and Development
PBPI1 Produced Building Price Index 1
PBPI2 Produced Building Price Index 2
PBPI3 Produced Building Price Index 3
PBPI4 Produced Building Price Index 4
PPI Producer Price Index
SSI State Statistics Institute
TL Turkish Lira
UC Unit Cost
UK United Kingdom

xvi
US United States
USD United States Dollar
VAT Value Added Tax

1
CHAPTER I
INTRODUCTION
Construction cost indices are developed to measure the degree of price variations
in construction material and labor costs. However, each specific type of
construction is a combination of unique set of materials and labor. This leads to
the fact that cost variations for different types of constructions shall be measured
by different types of cost indices, which actually are developed by measuring the
price variations regarding those specific sets of material and labor involved in
those kinds of construction projects.
The objective of this study was to examine which cost index, among Consumer
Price Index (CPI), Producer Price Index (PPI), Building Cost Index (BCI)
published by the State Statistic Institute, Cost Index (CI) published by Ministry
of Public Works and Settlement and the Cost Indices produced in this study
using the data compiled from the database of several Turkish contractors, would
provide the most precise result to be used for the escalation purposes of building
projects in Turkey. In addition, it was aimed to develop models to predict the
future values of the most precise two cost indices selected to assist for cost
estimating of the building projects.
Determination of the current value of a past project plays an important role in the
procurement process, since the applicants of any tender process could be
compared in terms of the amounts of the projects completed by them in the past.
In this aspect, the past projects of the contractors could be compared
quantitatively, either in the prequalification or post qualification process. The

2
base of comparison usually and mainly depends on the projects completed by
these contractors, examining the contract prices of those completed projects,
besides other criteria regarding the technical and administrative issues. However,
since the periods of the execution of the projects for each contractor may vary in
time, the impact of inflation should be included in these comparisons.
Escalation is not only used to determine current value of the past projects; but
also to predict the future costs of the construction projects. As most of the
construction projects usually take several months to complete, costs are expected
to increase during the construction of the project, even with the decreasing
inflation rates achieved in Turkey over the last decades.
In most of the contracts which the payments are going to be made in TL, a
method for the escalation of construction prices is included. In the majority of
these contracts, especially for the public projects, price escalation is calculated
by a formula which is a linear function of the producer price index published by
the State Statistics Institute.
In some projects where payments are made in TL, there may be no price
escalation included in the contract. For these projects, the contractor should
estimate future construction costs for the contract period and include these costs
in the bid amount. Payments could be made in foreign currencies for some
projects that are contracted in Turkey. Even the payments are going to be made
in foreign currencies, the contractors bidding for these projects should also
consider possible increases in the construction costs in Turkey, as most of the
time local labor and material are used by the contractors.
The Producer Price Index (PPI) published by the State Statistics Institute and the
Cost Index (CI) published by the Ministry of Public Works and Settlement are
commonly used for the escalation purposes of building project costs in Turkey.

3
As such, cost indices have been developed to measure the impact of inflation
over several sectors. In this study, it was aimed to compare the adequacy of
several available cost indices including the ones developed and to select the
index which gives with the best performance to escalate the costs for building
projects. The comparison of these indices will be performed by conducting
statistical techniques, such as regression analysis and validation.
The Statistics Directorate of OECD (1994 (a), 1996, 1994 (b)) and EUROSTAT
(1995, 1996), on the other hand, notes that construction price indices are
primarily used for analysis of price movements and for price formation in the
construction industry, for price escalation clauses in construction contracts, and
for deflation of components of the national accounts. The same organization
specifies the primary uses of such indices as:
• Measuring the changes of prices of construction materials for
construction work.
In developing a program of projects, preparing estimates, comparing
estimates with bids, and scheduling projects within funding limits it is
necessary to have some way of judging price movements. The aim is to
express physical volumes of work needed for future construction work in
value terms.
• Studying the impacts of changing prices over the total construction cost
and selling prices of the construction work.
• Measuring the expenditure of consumed materials at constant prices.
• Estimating the short-term evolution of prices.

4
• To determine replacement values for insurance purposes.
The use of construction price indices (where quality and other changes in
the price determining characteristics of the construction operations
observed have been eliminated) can have considerable impact if they are
used to determine replacement values. If construction work of the original
quality is no longer supplied because of substantial changes in materials,
techniques, etc. the replacement values obtained from the use of
construction price indices may be considerably less than the amount
actually required to be spent on the replacement.
• Realizing price-index readjustments of construction contracts.
• Planning the production of materials and checking the efficiency of
entrepreneurial units.
• Deflating components of the national accounts.
In addition to the compilation of national accounts at current prices there is a
necessity in having constant price measures that separate the effects of price
and volume increases (or decreases). This necessity is particularly strong in
countries experiencing high inflation.
In many countries, cost indices are published by the governmental organizations
to escalate the costs of the past projects of the contractors and to classify them
into groups with respect to their experience. In Turkey, Ministry of Public Works
and Settlement publishes every year an index to be used for the mentioned
purposes. However, this index is a general index calculated with the contribution
of many parameters and may not be suitable, perhaps not sufficient, for building
projects, in which many of these parameters may not exist or may not cover the

5
significant amount of the same. Similarly, PPIs published by the State Statistics
Institute is another index that is also commonly used for escalation purposes of
the building projects. However, this index is designed to reflect price movements
in general products which are not generally directly related with the building
costs. Hence, this study aimed to address specifically the building projects, by
developing new cost indices to be used for the purpose of escalating the costs of
building projects for civil works and by comparing them with the existing
published indices with the use of statistical techniques. In addition, future values
of these indices were also aimed to be predicted by constructing models, which
enabled to also predict the future cost of such kind of projects. Again, statistical
techniques were conducted to quantify the accuracy of the predicted values and
the indices providing the most accurate estimations were selected finally.
This study is structured as an introductory chapter, three main chapters and a
summary chapter.
• Chapter One – Introduction – This chapter involves the purpose of the
study and presents general information about the concept.
• Chapter Two – Literature Review – This chapter presents the background
information about the studies related to the subject.
• Chapter Three – General Information about Price Indices – In this
chapter, general information about price indices and the relevant
calculation methods are presented.
• Chapter Four – Methodology and Data Analysis – The methodology used
to develop the produced indices, by the analysis of the collected data, is
explained in detail in this chapter. The accuracy of the models developed
to predict the future cost of the selected indices is also discussed.

6
• Chapter Five – Conclusions and Recommendations – This chapter gives a
brief review of the studies conducted and states whether the target of the
study has been achieved.

7
CHAPTER II
LITERATURE REVIEW
Many studies have been conducted to develop special price indices for different
types of construction projects; each calculated by using different weights
assigned to the rates of price changes of material and labor costs included
therein. The developed price indices were also tested to define how much they
could describe the price variations in the costs of the subject types of projects.
On the other hand, some of the studies were performed to select the most
applicable index among the available ones. This chapter aims to present
information about previous studies regarding price indices developed for
different types of projects, with detailed explanations about the calculation
techniques.
Pintelon and Geeroms (1996) touched on the subject of deficiency of plant cost
indices to be applicable for countries other than US. Their study referred to the
utilization of these cost indices and development of them for a non-US country.
In the research, the authors illustrated development of a cost index for chemical
process plants in Europe, more specifically in Belgium. Pintelon and Geeroms
(1996) conducted this study with the involvement of the data regarding the cost
escalation period from 1965 to 1994. As cost indices have no dimension, a base
year was assigned according to the available data. Then they obtained cost
indices by dividing the actual price in a given year by the price in the base year,
and multiplying the result by 100. The actual price in a given year was calculated
by taking the average of the unit prices throughout the given year into
consideration.

8
The number of the construction of chemical plants was not sufficient to develop
valid statistics on the cost of these plants. Moreover, as chemical plants include
large variety of equipments; trustworthy statistics was difficult to be obtained.
Most of the indices for complex costs had been built up from commodity and
less complex components. An example of a fairly simple cost index was the two
parameter model by Cran (1976):
SteelLaborCran IIIndex *3.0*7.0)( += [2.1]
Where ILabor is the labor price index and ISteel is the steel price index.
Data for this index was composed of only two general and well-known indices.
This resulted in making the model easy to use as these indices were readily
available for many countries. On the other hand, according to Pintelon and
Geeroms (1996), the disadvantage of this model was that since the model was
based on only two parameters, this made it an oversimplification of the price
escalation. Using this model over a long period of time might have caused
unreliable results.
On the other hand, there were several cost indices for chemical plants but most
of them were related to US situation. The authors focused on four US plant cost
indices: the Nelson-Farrar construction cost (NFCC) index, the Engineering
News-Record (ENR) index, the Chemical Engineering Plant Cost (CEPC) index
and the Marshall and Swift (M&S) index. The ENR index was not directly
related with chemical engineering applications and NFCC index was specifically
focused on petroleum industry. Due to the fact that the remaining two indices
(M&S and CEPC) were most appropriate for chemical process industries, the
CEPC index was found to be more suitable rather than the M&S index. The same
index was also considered to be the most complete and most reliable index. As a
9
result, the new Belgian chemical engineering plant cost index (BCEPC)
developed in this study was based on and compared with the CEPC index.
While forming this BCEPC index, Pintelon and Geeroms (1996) followed four
main steps:
1. Building a cost index model
2. Comparing the resulting cost index with the CEPC
3. Fine-tuning the new cost index for the Belgian situation on hand
4. Final evaluation step
In the first step, a cost index model was developed using those US statistical data
that are also readily available for the European countries. In step 2, the cost
index model was compared with the CEPC index. If the index would be closer to
the CEPC index, the evaluation of the index would have been more suitable. In
order to obtain a satisfactory result, the authors stated that Step 1 and Step 2
might be repeated alternately. Two parameters were taken into consideration in
order to test the “quality of fit” of the model developed with the CEPC index.
The authors emphasized on the fact that the small changes in the weights of the
model should not affect the value of the index largely. This control was also
mentioned as the stability control of the new index.
While developing the BCEPC index, the authors tried two-parameter, three-
parameter, four-parameter and five-parameter models. In two-parameter model,
the cost of the chemical installation could be divided in two major parts: labor
and material. The carbon steel price was taken as material parameter since it was
the most used material in chemical plants. Productivity improvement was
considered as the third parameter, inflation index as the forth parameter and

10
crude oil price as the fifth one. Having developed four different cost index
models, Pintelon and Geeroms (1996) compared all these four models
individually with two other chemical process indices of US origin (ENR and
CEPC). It was understood that there were not a significant difference between
four-parameter and five-parameter model. Moreover, the authors stated that four-
parameter model was more suitable than the other due to the simplicity and the
significantly inferior of the “quality of fit” of the four-parameter model. Finally,
the formula of the model was expressed as:
InflationlabadjoductSteel IIIIndex *35.0*38.0*27.0 Pr ++= −− [2.2]
Where ISteel is the steel price index, Iprod_adj_lab is the productivity adjusted labor
cost index and IInflation is the inflation index.
In step 3, a weighted index was formed according to a weighted average of the
Belgian indices. Past projects and trade relations indicated the way to obtain this
individual weighted index.
Finally, in step 4, the authors continued with the further evaluation of the new
index, with the purpose of checking whether it would fail to estimate escalation
correctly or not. Hence, the escalation of the cost of a project over a certain time
period was compared with the predicted escalation of the cost index. In case of
the failure where the new cost index would estimate the escalation correctly, it
was stated that either it would be required to make a new CEPC model and to
evaluate it similarly, or a careful and critical examination of the underlying
assumptions would be needed.
As a result of these studies, the impact of a (changed) cost index on some current
management ratios was examined by the authors. As regards to the findings of
the study, the resulting cost index, which was based on the readily available data

11
of well-known chemical engineering plants in Belgium, was meant for use in
chemical engineering plant cost applications, specifically geared at the Belgian
situations. The authors concluded with the fact that the produced index seemed
to lead to satisfactory results. However, they also recommended that such cost
index should be treated with some specific cautions, since it was unlikely to be
really up-to-date; it was based on model but not on actual Belgian data; and it
was an average value.
Remer, Huynh, Agarwal, Auchard and Nelson (1998) stated that the inflation
and location indices were used in order to adjust costs for time and location.
Hence they focused on the use of these indices, different types of indices
available, and some caveats. As Remer et al. (1998) stated, a cost estimator
would adjust the variables like time and location when the cost of similar
projects was available. At this point, the usage of cost index came into scene in
order to make this calculation. On the other hand, selecting the most suitable
index to use was actually the main problem in using inflation indices. The
authors illustrated a large number of indices to help the cost estimators locate
the correct one to use.
There were four types of cost indices: compiler intent, measured cost, industry
and location. Compilers use cost indices for the following: general purpose,
contractor price, valuation and special purpose. General purpose cost indices
cover a broad spectrum of a particular industry or a type of cost, such as the
engineering news record (ENR) index (Remer et al., 1998). On the other hand,
the authors mentioned that contractor price indices measure the change in selling
prices of various types of buildings, such as the Turner general building index.
They also defined valuation indices and special purpose indices as representing
replacement costs, such as the Marshall and Swift industrial equipment index
and being used for a particular industry, such as the Nelson-Farrar Refinery Cost
Index or the Handy Whitman Public Utilities Index respectively.

12
Remer, Huynh, Agarwal, Auchard and Nelson (1998) used the data of 70 indices
by dividing these data in two groups which are US Indexes and International
Indexes. The US Indices contains indexes applicable to projects located within
the US, on the other hand, International Indexes contains indexes compiled with
data from areas outside the US. They also categorized these 70 indices according
to their industry category, type of cost category, and descriptions to find
potentially useful indices. In order to find the most appropriate cost index to be
used, they suggested contacting index compilers for detailed information on how
the indexes are constructed. Finally, Remer, Huynh, Agarwal, Auchard and
Nelson (1998) gave a list of caveats in using inflation and location indexes as
follows:
• Inflation indexes are statistically weighted composite averages, and thus,
should only be used for ballpark or order-of-magnitude calculations.
• Inflation indexes are usually limited in scope to a particular industry or
industrial segment. As noted by Miller, the engineering news record construction
index may be misapplied in the process industries (Park, 1973). The ENR Index
was intended for use with civil engineering projects involving large quantities of
unskilled labor, which may not be the case for process plants or process plant
equipment.
• Inflation indexes measuring similar types of cost may be constructed of
different weighted averages of sub-costs. For example, the Bureau of Labor
Statistics compiles two Employment Cost Indexes for various types of workers,
one for benefits and the other for wages and salaries (Monthly Labor Review,
1995). Examining the cost measured by a particular inflation index and how the
index is calculated increases the probability of accurate cost estimate calculation.
• Some indexes do not account for radical technological changes in design
and construction. As technology progresses, the cost weightings for a

13
particular index can change, which may or may not be reflected by the
inflation index. For example, production technology developments may
shift manufacturing costs from labor to plant equipment. An inflation
index tracking the manufacturing cost may not adjust to these changes.
Cost estimators should always check the applicability of cost indexes
used in their calculations.
• Inflation indexes compare costs for products that evolve over time.
Comparing the cost of a chemical plant constructed today versus 20 years
ago should reflect not only the increased cost of materials, but also the
additional cost of government-mandated environmental equipment. Cost
estimators should be aware that some inflation indexes do not adjust for
these additional costs.
• Inflation index calculations become increasingly inaccurate as the time
interval between data points is increased, i.e., a 5 year calculation is
probably more accurate than a 20 year escalation.
• Some inflation indexes are based on published list prices (rather than
market prices) and time averaged labor conditions. These indexes can be
insensitive to short-term economic cycle swings.
The study by Remer and Mattos (2003) updated and expanded upon the study by
Remer, Huynh, Agarwal, Auchard and Nelson (1998) on cost and location
factors used in the US and internationally. In their study, 43 US cost and location
factors and 30 international cost and location factors for 12 countries were used.
In addition, cost scale-up factors for a wide variety of equipment, plants and
processes from air pollution abatement to waste-to-energy facilities were
presented. Remer and Mattos (2003) reviewed the use of these indices and scale-
up factors, and presented caveats for their use.
14
Wilmot and Cheng (2003) made a study in order to develop a model that
estimates future highway construction costs in Lousiana. They stated that when
projects are costed, their costs are estimated in terms of the current cost of the
project, and this estimate is not adjusted for the year in which the project is
scheduled for implementation. These cost increases can be significant and are, of
course, cumulative across projects; also, they rise at an increasing rate each year
into the future. Estimating future highway construction was the focus of their
study. In order to describe the change in overall construction costs in the future,
a predictive construction cost index was adopted in their study.
Wilmot and Cheng (2003) used the data of 2.827 highway and bridge contracts,
which were obtained of highway construction projects let by the Lousiana
DOTD during the period 1984-1997. Five submodels of price estimation were
formed in order to predict overall highway construction costs. In their study, the
most influential factors were found to be the cost of the material, labor, and
equipment used in constructing the facility. On the other hand, characteristics of
individual contracts and the contracting environment in which contracts were let
also affect construction costs. In particular, contract size, duration, location, and
the quarter in which the contract is let were found to have a significant impact on
contract cost. Bid volume, bid volume variance, number of plan changes, and
changes in construction practice, standards, or specifications also make a
significant impact on contract costs.
The model developed by Wilmot and Cheng (2003) reproduced past overall
construction costs reasonably accurately at the aggregate level. Predicted overall
construction costs were not significantly different from observed costs at the
99% level of significance. The model estimated that highway construction costs
in Louisiana were going to increase more rapidly to the year 2015 than would be
anticipated if past trends were extrapolated or if the rate of general inflation were
used as an estimate of future increase in costs. The authors stated that their
model would be used by highway officials in Louisiana to test alternative
15
contract management strategies. Increasing contract sizes, reducing the duration
of contracts, reducing bid volume and bid volume variance, reducing the number
of plan changes, and reducing the proportion of contracts let in the fourth quarter
all serve to reduce overall construction costs. They also mentioned that highway
officials would assess the impact of strategies they believe were achievable by
applying the model. Finally, it can be said that, the model would assist in
estimating future construction costs and providing the means to produce more
reliable construction programs.
Wang and Mei (1998) made a model for forecasting construction cost indices in
Taiwan. The major determining factors to make up the construction cost indices
were mentioned as:
1. The number of difference
2. The required periods of preceding construction cost indices
3. The weight associated with each preceding construction cost index
4. The mean value of the series of construction cost indices that have been
converted into a stationary series
5. The estimation of the errors between the predicted values of construction
cost indices and the observed values of construction cost indices
Focusing on the above mentioned factors Wang and Mei (1998) set up an
analytical model in order to predict the current and future construction cost
indices. Then, they tested the feasibility of the model by using the observed data
of the construction cost indices obtained from the Executive Yuan of the
Republic of China. After setting up and testing the model, the results showed that

16
the model is adequate in forecasting the trend values of construction cost indices
and can also provide the predicted values of them in Taiwan.

17
CHAPTER III
GENERAL INFORMATION ABOUT PRICE INDICES
3.1 Introduction
This study aims to compare the existing cost indices as well as new alternative
cost indices in terms of their adequacy for the representation of variations in the
building costs in Turkey, which will be explained in the following section. A
study conducted by the Statistics Directorate of the OECD (1994 (a) , 1996, 1994
(b)) and EUROSTAT (1995, 1996) dictates that the demand for adequate
construction price indices arises from the need to assess real changes in the
output from these activities which cannot be derived solely through reference to
regular building and construction statistics. These indices have a wide range of
applications including deflation of components of national accounts, adjustment
of construction contracts and leases, and as a basis for indexation for insurance
purposes (Sources and Methods – Construction Price Indices, OECD, 1994 (a),
1996, 1994 (b) & EUROSTAT, 1995, 1996). However, before going into the
details of the methodology used to derive such cost indices and compare them in
terms of adequacy; it shall be better to present information about the available
cost indices of Turkey, which are calculated by the governmental organizations
and updated periodically.
A variety of tools are used to measure price changes taking place in an economy.
These include consumer price indices (CPIs), producer price indices (PPIs), price
indices relating to specific goods and/or services, and GDP deflators (Sources
and Methods – Construction Price Indices, OECD, 1994 (a), 1996, 1994 (b) &
18
EUROSTAT, 1995, 1996). This chapter provides information about the concept
of price index, available price indices and the methods regarding how they are
calculated. These indices consist of CPI, PPI and BCI; each calculated and
published periodically by the State Statistics Institute and CI, which is published
by the Ministry of Public Works and Settlement. A detailed investigation
through the calculation methods of these indices will create a suitable media for
the reader to have a better understanding regarding the concept of price index.
3.2 General
The first cost indices were developed by Carli in 1750 to determine the effects of
the discovery of America on the purchasing power of money in Europe
(Ostwald, 1992). One type of cost index is the inflation index, which attempts to
adjust costs of similar projects during different time periods. The engineering
news record (ENR) index started in 1909 is the oldest inflation index currently
used by engineers (Grogan, 1994).
In index calculation, various methods are used according to the type and
coverage of the index. Therefore, it can be an easy way to examine the index
calculation methods with the index types. SSI Turkey (2002) gives a
classification of the indices as follows:
1. Location and Time Indices
2. Constant and Variable Indices
3. Simple and Compound Indices
Location index is defined as the measurement of rational alteration which is
indicated by any statistical variable such as population, production and price

19
among the locations like regions, provinces, etc (SSI Turkey, 2002). Similarly,
time index is the measurement of rational alteration which is indicated by any
statistical variable such as population, production and price with respect to time.
These indices are based on a time series and used on implementation widely. The
classification of the indices as constant and variable indices is usually valid for
the time series. Constant-based index is the description for the index obtained by
explaining the complete set of the indices as the percentage of the average of
some certain periods or a certain period. The constant period, where the data of
various periods are compared, does not change (SSI Turkey, 2002).
When the base period is variable, in other words when all the values of a current
period are compared with those of the previous period, it is called variable-based
index.
Finally, simple indices are calculated to cover only one material. On the other
hand, compound indices cover two or more materials.
3.3 Price Index
SSI Turkey (2002) defines the price index as a tool which measures the rate at
which the prices of goods and services are changing over time. A basket of
goods and services according to the market under interest (consumer, producer,
export, import, etc.) and representing this market is established and the prices of
the selected materials are monitored periodically. The price indices are named
according to the good and service market where the prices are monitored. The
consumer price index, producer price index, export price index, import price
index can be examples for these indices.
The price indices are required for determining the structure of a country, taking
an economic decision, establishing the purchasing power of the members,
20
determining the costs and wages, establishing the retail prices for goods and
services purchased by consumer and determining the change of these prices in
time. On the other hand, they are required for confirming the socio-economic
condition and tendency, determining the conjuncture and taking future decisions.
The basic variables required for the calculation of price indices are:
• Basket of goods and services
• Base year weights
• Base year prices
• Current prices
3.3.1 Basket of goods and services
Basket of goods and services or basket of goods is a specific good and service
list in which prices are focused periodically in order to calculate indices. In
indices, it is very hard to focus all of the price movements of the goods and
services. Therefore, they are limited with important goods and services according
to a criterion and named as basket of good and service. The goods and services
chosen are defined as type, quantity and quality, and updated according to the
purpose of the index.

21
3.3.2 Weight
The weight is defined as the share which the selected goods and services gain
with respect to their values in the total basket and which is required for the
calculation of the index. There are two types of weights:
Constant weight: The weights of the materials of which consumption or
production structure are not affected by the months or seasons are called constant
weight.
Variable Weight: The weights of the materials of which consumption or
production structure are affected by the seasons are called in this way.
3.3.3 Base year price
Base year price is the average price of the goods and services used to calculate
the price indices in 12 months of the base year.
3.3.4 Current Price
Current price is the existing price of the goods and services used to calculate the
price indices.
The indices are renewed periodically because SSI Turkey (2002) states that in
Turkey, which is socially, economically, and culturally in continuous and in
rapid change, the products and services also change in light of new technological
advances. This, in return, results in alterations in consumer behavior. There are
changes in the structures and shares of the sectors, firms, and resources in
production. Certain goods and services leave their positions to new ones, and

22
others loose their significance in production. Reflecting these changes to indices
in the structure of consumption and production and updating the indices are
mandatory. On the international platform, it is advised that the indexes are
renewed every five years (SSI Turkey, 2002).
3.4 Construction Price Indices
3.4.1 General
Construction Price Indices are calculated by the statistical directorates of
countries to meet the demand arising from the need to assess real changes in the
output from these activities (i.e. to create a constant value series) which cannot
be derived solely through reference to regular building and construction statistics
(Sources and Methods – Construction Price Indices, OECD, 1994 (a), 1996,
1994 (b) & EUROSTAT, 1995, 1996). The Statistics Directorate of the OECD
(1994 (a), 1996, 1994 (b)) and EUROSTAT (1995,1996) also notes that
construction price indices are used in guaranteed value clauses in rental, leasing,
and other contracts; adjustment of sales contracts for buildings under
construction; and as a basis for indexation for insurance purposes. They are also
used to deflate national accounts estimates of output of construction activities,
and gross fixed capital formation in residential construction. In summary,
construction price indices are used to track changes/trends in the cost (or price)
of construction. They do not provide information on the current market value of
construction work, earning capacity, or rental values.
The compilers of construction price indexes face some difficult problems
specific to construction. They are stated briefly in (Turvey Demon,
http://www.turvey.demon.co.uk/ Construction%20Price%20Indexes.doc, last
access June 9, 2005) and as follows:

23
1. Construction projects are heterogeneous; each is unique, except for
standard pre-fabricated single-family houses,
2. The specifications in construction contracts are complex and lengthy,
3. Since work under many contracts takes months or years to complete, it is
necessary to distinguish between contract (tender) prices agreed at a point
in time and the prices of current construction output over a number of
time periods. When contracts include an escalation adjustment for wages
or the prices of materials, output prices are not known in advance,
4. Where there is single main contractor, the contract price includes a major
non-quantified item (known as “Preliminaries” in the UK) onto which
most of the contractor’s profits and overheads are loaded (TurveyDemon,
http://www.turvey.demon.co.uk/Construction%20Price%20Indexes.doc,
last access June 9, 2005).
Construction price indexes may be used for two distinct purposes
1. The deflation of current expenditure on construction projects to provide
estimates of construction expenditure at constant prices.
2. As a measure of one component of inflation.
These purposes impose different requirements in two respects:
1. For deflation, division of construction expenditure by the index must be
done period by period over the duration of each contract to yield a
measure of construction output period by period. For analyzing inflation,
on the other hand, what counts is the time when a contract is signed, not
the time(s) of payment or delivery. Hence the whole of the agreed

24
contract price should enter an inflation price index in the period when it
is agreed,
2. For deflation, a current-based index is needed in order to divide into
value to derive a fixed-base estimate of expenditure at current prices. But
for measuring inflation, a fixed-base index is required, both to conform
with the fixed-base indexes used for other types of expenditure, and to
provide a meaningful period to period indicator of changes in agreed
prices(TurveyDemon,http://www.turvey.demon.co.uk/Construction%20P
rice%20Indexes.doc, last access June 9, 2005).
In broad terms, construction price indices provide measures of changes in the
prices of either the inputs to, or outputs of, construction activity. However,
terminology used in the context of price indices for construction activity varies
between countries. There is also considerable variation in the inclusion/exclusion
of items such as transport costs, consumption taxes, fittings, etc (Sources and
Methods – Construction Price Indices, OECD, 1994 (a), 1996, 1994 (b) &
EUROSTAT, 1995, 1996). The terms used in this study to represent the
construction price indices have been defined by the SSI Turkey (2002); since the
scope of the study is drawn with the data of the actual projects located in Turkey.
Most of the information used in the compilation of construction price indices are
derived from the supply side of the industry (i.e. from construction firms, sub-
contractors, materials supply firms, etc.). However, a unique feature of
construction activity that impacts on the compilation of construction price
indices is that in most situations the completed building or construction is not
produced and sold by one construction contractor alone. Normally, the client (or
architect charged by the client with the responsibility of supervising the
construction) concludes contracts with a number of firms. Most of these are
predominantly part of the construction branch; however they may also belong to
other branches of the economy (e.g. steel construction, manufacture of fixtures,

25
engineering, etc.). The client (or supervising architect) invites construction
contractors (who in turn may invite sub-contractors) to undertake work at a
building or construction site. The work to be done is referred to as “work
category”. If the offer is accepted the work is performed and supplied to the
client/architect as a “product”. The work categories correspond to the “goods” or
“products” observed in other price statistics. From the perspective of the
production performed by a construction contractor, the prices in question may be
either the prices of the various inputs to the construction process paid by the
construction contractor, or the prices received by the construction contractor
from the client for the output of the construction contractor. The latter are
producer prices and come close to the concept of a PPI (i.e. in the context of the
construction industry the prices received by the producers of work categories).
The construction contractor’s sales prices of individual work categories from the
construction sector are in most cases also the purchase prices of the client.
In summary, construction price indices may be described as indices compiled
from:
• prices paid by the contractor for inputs to the construction process; or
• the price received for the completed output of construction activity paid
by the client; or
• the selling price including all of the demand side cost elements paid by
the purchaser or final owner,
(Sources and Methods – Construction Price Indices, OECD, 1994 (a), 1996,
1994 (b) & EUROSTAT, 1995, 1996).

26
3.4.2 Outline of Processes in Developing a Construction Price Index
As with both CPIs and PPIs, the development and compilation of price indices
for construction activity is a complex procedure consisting of a long and varied
set of operations, as stated by the Statistics Directorate of OECD (1994 (a),
1996, 1994 (b)) & EUROSTAT (1995, 1996). The usefulness of the construction
indices compiled also depends on having a clear understanding of the purposes
of the indices, and the characteristics of the construction industry in the country
where it is located. The study conducted by the OECD (1994 (a), 1996, 1994 (b))
and EUROSTAT (1995, 1996) lists these characteristics which include:
• the range of construction activities conducted throughout the country;
• construction techniques commonly used for each type of construction
activity, together with an idea of the rate of change in techniques used;
• types of entities/organizations undertaking construction activity, and their
characteristics (e.g. size, industry concentration, etc.);
• administrative arrangements for the maintenance of building/construction
standards;
• administrative arrangements for government authorization of individual
construction projects.
The Statistics Directorate of OECD (1994 (a), 1996, 1994 (b)) and EUROSTAT
(1995, 1996) lists the major processes in the development and compilation of
construction price indices using the “model price” methodology outlined above
as the following:

27
• Selection of a small, representative group of recently constructed
buildings, civil engineering projects, etc. as models. The number of
models required depends on the range of construction activity to be
included in the index, diversity of the specifications for each type of
activity, and regional diversity.
• Specification of the hundreds of detailed tasks or component trades in the
construction of these model projects. These are prepared using
architectural drawings and specifications. Also involves the development
of components for the general requirements (overheads and profit
margins) of the main construction contractor.
• Selection of a sample of components. The selection of components within
each trade area is based on both money value and the coverage of
significant materials and/or products involved. A goal might be to select
components which cover at least 70 per cent of the total value of the
trade.
• Development of specifications for each component to include quantities
involved and base-weight unit prices. Specifications must be exact to
avoid the risk of varying interpretation by different respondents.
• Selection of a sub-sample of subcontractors and general contractors in the
appropriate geographic areas from whom prices are collected. An
important goal is to select contractors who are actively engaged in
building sample components and can report price quotes based on recent
experience. Some respondents might be able to supply quotes on
components included in more than one model.

28
• Collection of periodic reports for a sample of these components from
subcontractors. These should be based on current prices they charge
(including overheads and profit) for the component they supply. Price
collection may be done by telephone or mail, generally after an initial
personal visit to gain co-operation and discuss reporting problems. The
prices of electrical and mechanical equipment can be obtained from
manufacturers of the equipment.
• Calculation of a price index for the construction as a weighted
combination of these component prices. This is done by multiplying new
price quotations by base period weights, and comparing the result to base
period model prices.
• Development and implementation of an ongoing process of index review
to revise the list of model projects, weights, component items,
respondents, etc.
3.5 Consumer Price Index (CPI)
The consumer price index measures, by comparing in time, the price variation of
a basket of goods and services purchased by the householders in a certain
reference period. It is provided that the index shall reflect only the price
movements by taking care of the quantity and quality changes of every material
in the basket of good and service (SSI Turkey, 2002).
On the other hand, the Statistics Directorate of the OECD (1994 (a), 1996, 1994
(b)) and EUROSTAT (1995, 1996) states that CPIs are designed to measure
changes over time in average retail prices of a fixed basket of goods and services
taken as representing the consumption habits of households.

29
The consumer price index is used for various purposes. The most important ones
are listed by the Statistics Directorate of the OECD (1994 (a), 1996, 1994 (b))
and EUROSTAT (1995, 1996) as the following:
• Measurement of the inflation in macro-economic sense and comparison
of them with other countries.
• Determination of the economic politics of the governments.
• Adjustment of the wages and costs.
• Purification of any value data from the inflation.
• To be an indicator for the national accounting
• To be an indicator for price analysis
• Orientation of the commercial facilities
• To be an indicator for the retail price and the increase in rent.
The 2003 base year consumer price index calculated by Prime Ministry State
Institute of Statistics covers all of the consumption expenses in Turkey, without
considering the citizen of the people making these expenses and whether they
live in domestic. In the coverage, any differentiation according to the income
groups of the population and the geography regions is not applied.

30
3.6 Producer Price Index (PPI)
SSI Turkey (2002) defines the Producer Price Index as the price index which
measures the price differences by comparing the producer prices of the products
manufactured for the country economy in a certain reference period and being
subject to domestic sale. The producer price is the selling price in advance of the
products manufactured in the home country excluding VAT and similar taxes.
For the producer price indices, the first-hand selling prices of the products,
which the producers activating in the fields of agriculture, hunting, forestry and
fishery grow and present to the market, are monitored. These prices related to the
agricultural sector are named as the Prices Earned by the Producer. The prices of
the products related to the industrial sector, on the other hand, are received
directly from the producer firms.
Another definition comes from the Statistics Directorate of the OECD (1994 (a),
1996, 1994 (b)) and EUROSTAT (1995, 1996), which dictates that PPIs provide
measures of average movements of prices received by the producers of
commodities. In principle, PPIs exclude transport costs and consumption taxes.
Producer price indices are not a measure of average price levels, or of the costs
of production. Moreover, PPIs do not include commercial mark-ups. Though the
scope of PPIs varies, they are generally calculated on the basis of the total
turnover of a definable industry such as manufacturing, agriculture, or mining
(Sources and Methods – Construction Price Indices, OECD, 1994 (a), 1996,
1994 (b) & EUROSTAT, 1995, 1996).
The PPI being used up to the current period was a mixed price index, which was
calculated by obtaining the prices of the materials manufactured in the home
country partially from the producers and partially from the mediators who do not
make sales and who are engaged with wholesale, and where the prices included
the taxes for the consumers and the margins of the wholesalers (SSI Turkey,
2002). The Producer Price Index comes now for common use, both to establish a

31
more meaningful index which measures the price differences during the
production period against the Consumer Price Index which measures the price
differences during the consumption period, and to provide the harmony and to
enable the comparison with the international indices.
The basic difference between the two indices appears among the units where the
prices are gathered. The prices for the PPI are also gathered from the wholesale
selling spots (from vegetable, fruit and fish markets) in addition to the producers.
VAT and similar taxes are included in the prices of the wholesale goods. For the
producer price indices, the basic point is to gather the prices form the producers
and the prices of the products are the domestic selling prices in advance,
excluding VAT and the similar taxes.
The producer price index is used for various purposes, most important of which
are mentioned by the Statistics Directorate of the OECD (1994 (a), 1996, 1994
(b)) and EUROSTAT (1995, 1996) as the following:
• Following the price movements in inflation and economy.
• Determination of the economic politics of the governments.
• Adjustment of the wages and costs.
• Production and productivity calculations.
• Accounting calculations.
• Studies related to the price analysis
• Investment decisions.

32
3.7 Building Construction Cost Index (BCCI)
The State Institute of Statistics calculates a quarterly building construction cost
index based on the standard factor method. The purpose of the index is to
identify changes in the cost of input items used in construction projects. The
index covers the construction of houses and apartments, shops and commercial
buildings, medical buildings, schools and cultural buildings, and administrative
buildings. In total these categories cover more than 90 per cent of construction
activity in Turkey. In terms of geographic area covered, the index covers all of
Turkey.
Included in the index are costs of materials, labor and machinery. No taxes are
included in the prices used in the calculation of the index, but the prices are net
of discounts. Most of the cost data used are obtained through surveys of
construction and other enterprises as well as from price lists. The data are
collected from 24 provinces which have been chosen to represent all the regions
of Turkey. Price quotations are obtained for each of the items costed from three
establishments in each province. In total, 295 items are priced from around 1.300
suppliers to construction firms (SSI Turkey, 2002).
The selection of items for inclusion in the index was made after extensive
consultation with interested bodies, including the Finance and Industry Statistics
Divisions within the State Institute of Statistics, the Chamber of Civil Engineers
and of Architects, trade unions and a number of other institutions and
associations. With the help of the Turkish Scientific and Technical Resource
Institution and their publication Construction Unit Price Analysis, the items were
selected and weights determined through detailed examination of bills of
quantities for a sample of current projects representative in terms of regional
distribution and project type of construction activity within the scope of the
index. The index is calculated quarterly according to the Laspeyres formula and

33
has base period 1991=100 (Sources and Methods – Construction Price Indices,
OECD, 1994 (a), 1996, 1994 (b) & EUROSTAT, 1995, 1996).
The index results are published by the State Institute of Statistics in the
publication Quarterly Building Construction Cost Index. In addition to the
aggregate results, separate indices are published for materials, machinery and
labor costs, as well as for apartments, houses, and other construction. The
methodology used in the compilation of the index is published in Methodology
of the Building Construction Cost Index. Regional results as well as national
indices for Turkey are presented.
3.8 Cost Index (CI)
The Ministry of Public Works and Settlement publishes every year an index to
be used to escalate the past costs of construction projects in Turkey. The subject
index is calculated based on the rates of increase in the prices of certain material,
labor and equipment groups. Cost Index can also be defined as the weighted
average of the rates of increase in these certain groups of material, labor and
equipment.

34
CHAPTER IV
METHODOLOGY AND DATA ANALYSIS
4.1 Introduction
Construction cost indices have always been used to assess the variations in labor
and material costs (Wang and Mei, 1998). In other words, they represent the
variations in the costs of material and labor, which form in general the sub-items
of construction costs. Several cost indices are calculated and published by
governmental organizations to be used for several purposes; whereas various
studies are conducted for different classes of constructional structures to achieve
more accurate cost indices to be used specifically for that type of constructions.
This kind of studies consider the weight of the material and labor costs included
in that specific type of construction and the price variations for these material
and labor costs are examined to calculate such kind of specific construction cost
indices.
This study aims to compare the existing cost indices as well as new alternative
cost indices in terms of their adequacy for the representation of variations in the
building costs in Turkey. This section presents the steps of calculating several
cost indices using the data of building projects compiled from several Turkish
contractors. In addition, the produced price indices will be compared with those
published by governmental organizations in Turkey; and thus, it will be possible
to evaluate the adequacy of these developed indices. Finally, the most adequate
cost index to be used for building projects will be selected. Moreover, statistical

35
methods will be used to predict the future values of selected cost indices and
advantages of use of such kind of indices will be discussed.
4.2 Data Collection
The data of 23 building projects (residential, hotel, office and hospital), out of
which 14 were public and 9 were private and which were executed within the
time frame 1994-2004, were compiled from several Turkish contractors. These
data actually covered the contract date, total contract price for civil scope and
total closed area of these projects. Table 4.1 lists the projects, classifying them
into groups in terms of their types and presents the contract dates of the same.

36
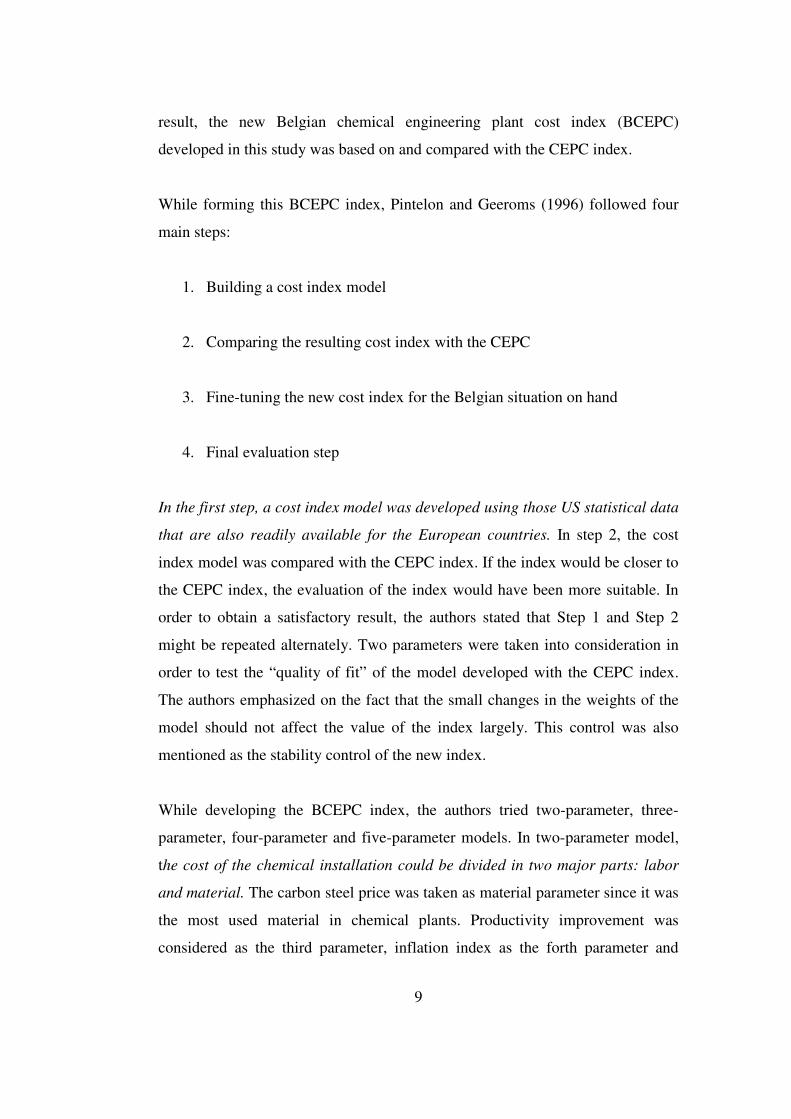
Table 4.1: List of projects
NO PROJECT NAME TYPE CONTRACT
DATE
1 Project 1 RESIDENTIAL 06.09.1994
2 Project 2 OFFICE 01.10.1995
3 Project 3 HOTEL 01.08.1997
4 Project 4 HOTEL 01.10.1997
5 Project 5 HOTEL 01.02.1998
6 Project 6 RESIDENTIAL 01.04.1998
7 Project 7 RESIDENTIAL 07.05.1998
8 Project 8 HOSPITAL 01.09.1999
9 Project 9 RESIDENTIAL 24.04.2000
10 Project 10 RESIDENTIAL 13.05.2000
11 Project 11 HOSPITAL 07.11.2000
12 Project 12 OFFICE 08.11.2000
13 Project 13 OFFICE 07.02.2001
14 Project 14 RESIDENTIAL 06.09.2001
15 Project 15 HOSPITAL 01.04.2002
16 Project 16 OFFICE 10.05.2002
17 Project 17 OFFICE 07.10.2002
18 Project 18 OFFICE 01.11.2002
19 Project 19 RESIDENTIAL 01.01.2003
20 Project 20 OFFICE 01.03.2003
21 Project 21 HOSPITAL 08.09.2003
22 Project 22 OFFICE 21.11.2003
23 Project 23 RESIDENTIAL 01.06.2004

37
The contract prices (see Table 4.2) covered only the civil scope, excluding
electrical and mechanical works, in parallel with the purpose of the study which
is to achieve a price index for the civil costs. The term cost anywhere in this
study refers to the contract price for the civil works of a building project.
However, VAT was excluded from these prices. On the other hand, closed areas
of the buildings, in the range of 2,000 – 92,000 m2 (see Figure 4.1), were used to
obtain the unit costs, represented by UC in TL/m2.
CLOSED AREAS OF THE PROJECTS vs PROJECTS
0
10.000
20.000
30.000
40.000
50.000
60.000
70.000
80.000
90.000
100.000
Pro
ject 1
Pro
ject 2
Pro
ject 3
Pro
ject 4
Pro
ject 5
Pro
ject 6
Pro
ject 7
Pro
ject 8
Pro
ject 9
Pro
ject 1
0
Pro
ject 1
1
Pro
ject 1
2
Pro
ject 1
3
Pro
ject 1
4
Pro
ject 1
5
Pro
ject 1
6
Pro
ject 1
7
Pro
ject 1
8
Pro
ject 1
9
Pro
ject 2
0
Pro
ject 2
1
Pro
ject 2
2
Pro
ject 2
3
Projects
Clo
sed
Are
as o
f th
e P
roje
cts
Figure 4.1: Closed Areas of the Projects
The contract prices were in two different currencies, Turkish Lira (TL) for 16
projects and United States Dollar (USD) for 7 projects. The contract prices in
USD were converted to TL by using the buying exchange rate published by the
Central Bank of Turkey at the date of contract for each project.

38
Table 4.2: Unit Costs of the Projects
NO PROJECT
NAME TL/m2
1 Project 1 3.999.566
2 Project 2 11.767.566
3 Project 3 63.008.464
4 Project 4 27.922.055
5 Project 5 77.766.697
6 Project 6 36.202.903
7 Project 7 37.096.930
8 Project 8 156.981.219
9 Project 9 69.263.961
10 Project 10 222.981.829
11 Project 11 73.857.247
12 Project 12 114.603.108
13 Project 13 170.535.291
14 Project 14 139.786.060
15 Project 15 257.999.135
16 Project 16 167.726.549
17 Project 17 363.749.680
18 Project 18 236.991.800
19 Project 19 106.077.192
20 Project 20 214.541.316
21 Project 21 235.264.803
22 Project 22 219.664.566
23 Project 23 216.810.253

39
4.3 Identification of Price Indices
The price indices can be classified into two groups, as available price indices and
produced price indices.
4.3.1 Available Price Indices
The first group of the price indices was composed of the indices which have
already been calculated by several governmental organizations and a web survey
was conducted to collect the values of the these price indices available for the
time frame 1994-2004. In this study, the Consumer Price Index (CPI), the
Producer Price Index (PPI), the Cost Index (CI) and the Building Cost Index
(BCI) were considered for the comparison purposes and their corresponding
annual values were gathered from the relevant web sites and publications.
However, the values of BCI were quarter based and the average of quarters was
calculated to obtain the annual values for each corresponding year.
4.3.2 Produced Price Indices
Different from the available price indices mentioned as the first group, four more
indices were calculated by using the unit rates published by the Ministry of
Public Works and Settlement for the three indices and the building cost indices
published by the State Statistic Institute for the other one, and the indices in this
second group were called as the produced price indices. The following sections
provide detailed explanations regarding the calculation methods and steps of
these indices.
40
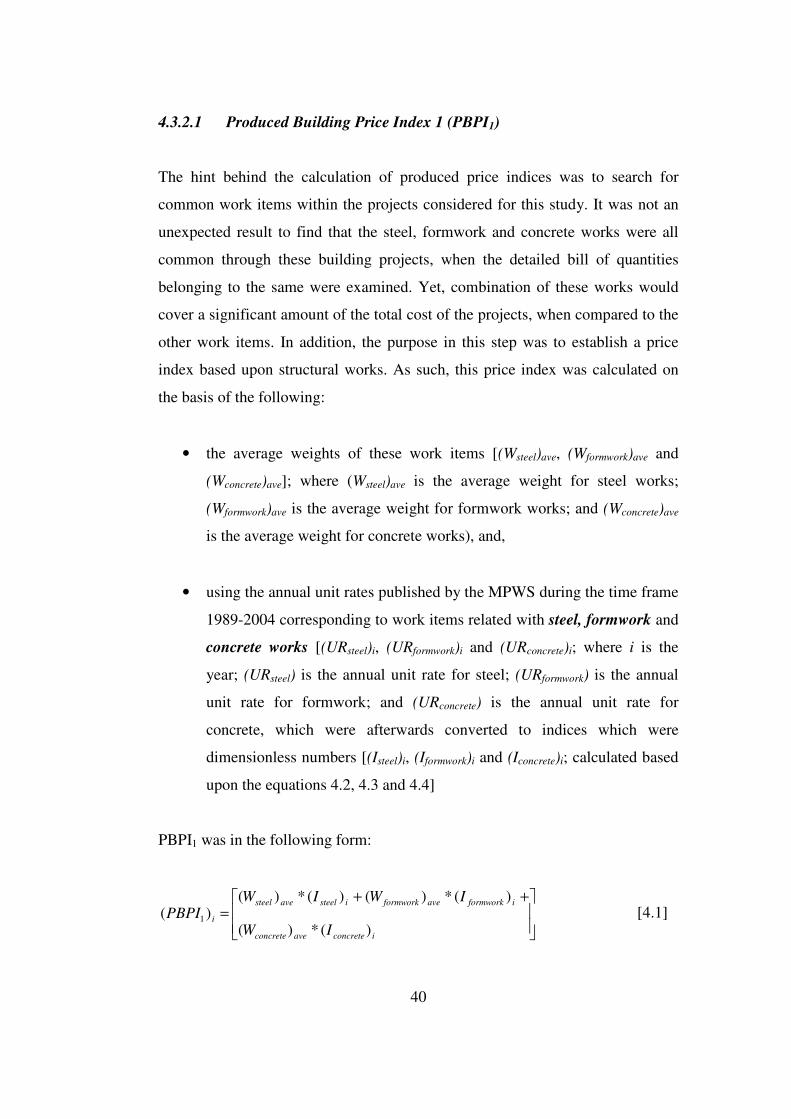
4.3.2.1 Produced Building Price Index 1 (PBPI1)
The hint behind the calculation of produced price indices was to search for
common work items within the projects considered for this study. It was not an
unexpected result to find that the steel, formwork and concrete works were all
common through these building projects, when the detailed bill of quantities
belonging to the same were examined. Yet, combination of these works would
cover a significant amount of the total cost of the projects, when compared to the
other work items. In addition, the purpose in this step was to establish a price
index based upon structural works. As such, this price index was calculated on
the basis of the following:
• the average weights of these work items [(Wsteel)ave, (Wformwork)ave and
(Wconcrete)ave]; where (Wsteel)ave is the average weight for steel works;
(Wformwork)ave is the average weight for formwork works; and (Wconcrete)ave
is the average weight for concrete works), and,
• using the annual unit rates published by the MPWS during the time frame
1989-2004 corresponding to work items related with steel, formwork and
concrete works [(URsteel)i, (URformwork)i and (URconcrete)i; where i is the
year; (URsteel) is the annual unit rate for steel; (URformwork) is the annual
unit rate for formwork; and (URconcrete) is the annual unit rate for
concrete, which were afterwards converted to indices which were
dimensionless numbers [(Isteel)i, (Iformwork)i and (Iconcrete)i; calculated based
upon the equations 4.2, 4.3 and 4.4]
PBPI1 was in the following form:
++=
iconcreteaveconcrete
iformworkaveformworkisteelavesteel
i
IW
IWIWPBPI
)(*)(
)(*)()(*)()( 1 [4.1]

41
Equation [4.1] represents the form of PBPI1. To be integrated into this index
equation, the unit rates of each of steel, formwork and concrete works for the
corresponding years were converted to dimensionless numbers by assigning the
value of 1 for base year 1989 and by dividing the values of the other years by the
value of the unit rate of the base year.
baseyearsteel
isteel
isteelUR
URI
)(
)()( = [4.2]
baseyearformwork
iformwork
iformworkUR
URI
)(
)()( = [4.3]
baseyearconcrete
iconcrete
iconcreteUR
URI
)(
)()( = [4.4]
The first step of calculation of this index was to calculate the average weights of
the steel, formwork and concrete works [(Wsteel)ave, (Wformwork)ave and
(Wconcrete)ave]. These were calculated in the following steps:
1) The total costs for each of these items [(Csteel)i, (Cformwork)i and (Cconcrete)i]
were determined from the detailed bill of quantities.
2) These total costs for each item of work were divided by the summation of
these to obtain the weights for each year as per the equations 4.5, 4.6 and
4.7:
iconcreteiformworkisteel
isteel
isteelCCC
CW
)()()(
)()(
++= [4.5]

42
iconcreteiformworkisteel
iformwork
iformworkCCC
CW
)()()(
)()(
++= [4.6]
iconcreteiformworkisteel
iconcrete
iconcreteCCC
CW
)()()(
)()(
++= [4.7]
Where i is the project number; Wsteel is the weight of total cost of steel works for
a project; Wformwork is the weight of total cost of formwork works for a project;
Wconcrete is the weight of total cost of concrete works for a project; Csteel is the
total cost of steel works in a project; Cformwork is the total cost of formwork works
in a project; and Cconcrete is the total cost of concrete works in a project. The
following equation also would hold:
1)()()( =++ iconcreteiformworkisteel WWW [4.8]
It should be mentioned that these weights could only be calculated for the
projects of which detailed cost analyses were available. The next step was to take
the average of the weights of these work items to calculate a common and final
weight representing the steel, formwork and concrete works separately.
n
WW
isteel
avesteel
∑=
)()( [4.9]
n
WW
iformwork
aveformwork
∑=
)()( [4.10]
n
WW
iformwork
aveformwork
∑=
)()( [4.11]
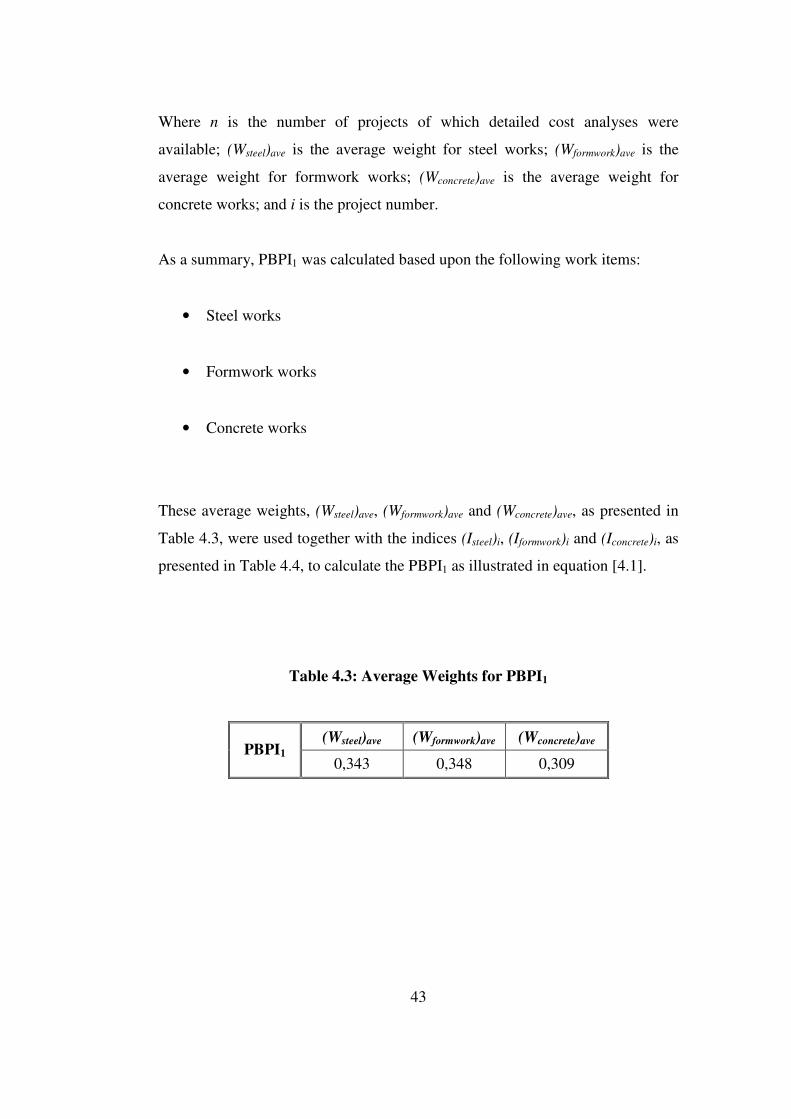
43
Where n is the number of projects of which detailed cost analyses were
available; (Wsteel)ave is the average weight for steel works; (Wformwork)ave is the
average weight for formwork works; (Wconcrete)ave is the average weight for
concrete works; and i is the project number.
As a summary, PBPI1 was calculated based upon the following work items:
• Steel works
• Formwork works
• Concrete works
These average weights, (Wsteel)ave, (Wformwork)ave and (Wconcrete)ave, as presented in
Table 4.3, were used together with the indices (Isteel)i, (Iformwork)i and (Iconcrete)i, as
presented in Table 4.4, to calculate the PBPI1 as illustrated in equation [4.1].
Table 4.3: Average Weights for PBPI1
(Wsteel)ave (Wformwork)ave (Wconcrete)ave PBPI1
0,343 0,348 0,309

44
Table 4.4: Index values for PBPI1
Years Isteel Iconcrete Iformwork
1989 1,00 1,00 1,00
1990 1,41 1,70 1,75
1991 1,84 3,02 2,81
1992 3,05 4,92 4,70
1993 5,47 7,52 8,01
1994 8,67 11,96 13,76
1995 21,07 23,96 30,33
1996 33,01 44,32 60,53
1997 59,13 102,78 117,74
1998 114,07 158,22 196,12
1999 151,03 237,33 319,85
2000 255,57 379,05 475,58
2001 329,04 493,42 598,35
2002 609,83 741,49 1.043,98
2003 925,23 967,04 1.369,25
2004 1.076,76 1.083,82 1.568,63
4.3.2.2 Produced Building Price Index 2 (PBPI2)
PBPI2 was calculated with the same method through which PBPI1 was
calculated. However, different from PBPI1, this index was calculated based upon
the weights and indices derived from the unit rates of several work items, in
addition to steel, formwork and concrete works, since the purpose in this step
was to establish a price index formed with the contribution of both structural
works and architectural works. Equation 4.12 represents the form in which PBPI2
was calculated:

45
+
++
++
++
=
iplasticpaaveplasticpaiheatinsaveheatins
iplasteraveplastericoncretelevaveconcretelev
iscreedavescreediconcreteaveconcrete
iformworkaveformworkisteelavesteel
i
IWIW
IWIW
IWIW
IWIW
PBPI
)(*)()(*)(
)(*)()(*)(
)(*)()(*)(
)(*)()(*)(
)(
intint..
.int.int..
2 [4.12]
Where (Wsteel)ave is the average weight for steel works; (Wformwork)ave is the
average weight for formwork works; (Wconcrete)ave is the average weight for
concrete works; (Wscreed)ave is the average weight for screeding works;
(Wlev.concrete)ave is the average weight for leveling concrete works; (Wint.plaster)ave is
the average weight for interior plastering works; (Wheatins)ave is the average
weight for heat insulation works; (Wplasticpaint)ave is the average weight for plastic
paint works; (Isteel), (Iformwork), (Iconcrete), (Iscreed), (Ilev.concrete), (Iint.plaster), (Iheatins)
and (Iplasticpaint) are the corresponding index values as calculated in the same way
with PBPI1; and i is the project number.
PBPI2 was calculated based upon the following work items:
• Steel works
• Formwork works
• Concrete works
• Screeding works
• Leveling concrete works
• Interior plastering works

46
• Heat insulation works
• Plastic paint works
The average weights for these work items were calculated in the same way as
done through equations 4.5, 4.6, 4.7, 4.9, 4.10 and 4.11 (see Table 4.5), by also
considering the total costs for additional architectural work items mentioned
above.
Table 4.5: Average Weights for PBPI2
(Wsteel)ave (Wformwork)ave (Wconcrete)ave (Wscreed)ave
0,304 0,290 0,257 0,018
(Wlev.concrete)ave (Wint.plaster)ave (Wheat ins.)ave (Wplastic paint)ave PBPI2
0,026 0,026 0,007 0,072
The indices in Equation 4.12 were calculated in parallel with the same logic as
applied for equations 4.2, 4.3 and 4.4. Table 4.6 lists the values of these indices
for each work item corresponding to the time frame 1989-2004.

47
Table 4.6: Index values for PBPI2
Years Isteel Iconcrete Iformwork Iscreed Ilev.concrete Iint.plaster Iheat ins. Iplastic paint
1989 1,00 1,00 1,00 1,00 1,00 1,00 1,00 1,00
1990 1,41 1,70 1,75 1,69 1,60 1,68 1,33 1,33
1991 1,84 3,02 2,81 2,88 2,74 2,60 2,17 1,67
1992 3,05 4,92 4,70 5,00 4,80 4,14 7,73 2,62
1993 5,47 7,52 8,01 8,39 8,09 6,82 11,59 4,22
1994 8,67 11,96 13,76 14,66 14,31 11,75 12,18 6,97
1995 21,07 23,96 30,33 29,27 28,01 22,80 19,91 16,00
1996 33,01 44,32 60,53 55,43 52,87 43,09 44,12 28,89
1997 59,13 102,78 117,74 116,65 112,85 85,90 67,31 53,56
1998 114,07 158,22 196,12 205,64 202,21 145,04 142,72 93,33
1999 151,03 237,33 319,85 342,79 339,40 237,99 178,87 149,33
2000 255,57 379,05 475,58 537,76 539,16 401,77 286,19 261,33
2001 329,04 493,42 598,35 714,93 725,17 521,86 385,87 311,11
2002 609,83 741,49 1.043,98 1.178,05 1.169,77 830,57 767,53 622,22
2003 925,23 967,04 1.369,25 1.596,08 1.605,58 1.134,03 1.028,98 888,89
2004 1.076,76 1.083,82 1.568,63 1.839,71 1.863,88 1.325,35 1.047,28 1.000,00
4.3.2.3 Produced Building Price Index 3 (PBPI3)
PBPI3 was calculated based upon the following work items (see Equation 4.13):
• Interior plastering works
• Heat insulation works

48
• Plastic paint works
++=
iplasticpaaveplasticpa
iheatinsaveheatinsiplasteraveplaster
i
IW
IWIW
PBPI)(*)(
)(*)()(*)()(
intint
...int.int
3 [4.13]
Where (Wint.plaster)ave is the average weight for interior plastering works;
(Wheatins)ave is the average weight for heat insulation works; (Wplasticpaint)ave is the
average weight for plastic paint works; (Iint.plaster), (Iheatins) and (Iplasticpaint) are the
corresponding index values as calculated in the same way with PBPI1 and PBPI2;
and i is the project number.
The calculated average weights and indices are presented in Tables 4.7 and 4.8,
respectively.
Table 4.7: Average Weights for PBPI3
(Wint.plaster)ave (Wheat ins.)ave (Wplastic paint)ave PBPI3
0,026 0,007 0,072

49
Table 4.8: Index values for PBPI3
Years Iint.plaster Iheat ins. Iplastic paint
1989 1,00 1,00 1,00
1990 1,68 1,33 1,33
1991 2,60 2,17 1,67
1992 4,14 7,73 2,62
1993 6,82 11,59 4,22
1994 11,75 12,18 6,97
1995 22,80 19,91 16,00
1996 43,09 44,12 28,89
1997 85,90 67,31 53,56
1998 145,04 142,72 93,33
1999 237,99 178,87 149,33
2000 401,77 286,19 261,33
2001 521,86 385,87 311,11
2002 830,57 767,53 622,22
2003 1.134,03 1.028,98 888,89
2004 1.325,35 1.047,28 1.000,00

50
4.3.2.4 Produced Building Price Index 4 (PBPI4)
Different from PBPI1, PBPI2 and PBPI3, the price index PBPI4 was established
based upon the building cost indices published by the State Statistic Institute. For
the calculation purposes of this price index, several common work items
regarding only architectural works (paint, polish and insulation materials, glazing
materials and door and window metal parts) were selected throughout the
projects and sub-indices, corresponding to these work items, which form these
published building cost indices when summed up, were used to calculate PBPI4
as per the Equation 4.14. The detailed analysis of the prices of the building
projects were not available in parallel with the entire set of sub-indices, which
was the fact to limit the number of sub-indices to be used for analysis. In other
words, paint, polish and insulation materials, glazing materials and door and
window metal parts were the only sub-indices corresponding directly to the
available price details of the building projects.
+
+
=
ipmetwinddooravepmetwinddoor
itgalazingmaaveglazingmat
imatinspolpaavematinspolpa
i
IW
IW
IW
PBPI
)(*)(
)(*)(
)(*)(
)(
..&..&
..
.&.int,.&.int,
4 [4.14]
Where (Wpaint,pol.&ins.mat.)ave is the average weight for paint, polish and insulation
materials; (Wglazing mat.)ave is the average weight for glazing materials;
(Wdoor&wind.met.p)ave is the average weight for door and window metal parts;
(Ipaint,pol.&ins.mat.), (Iglazing mat) and (Idoor&wind.met.p) are the corresponding index
values as published by the State Statistics Institute and as presented in Table
4.10; and i is the project number.

51
As a summary, PBPI4 was calculated based upon the following work items (see
Equation 4.13):
• paint, polish and insulation materials
• glazing materials
• door and window metal parts
Table 4.9 presents the average weights for these selected work items.
Table 4.9: Average Weights for PBPI4
(Wpaint,pol.&ins.mat.)ave (Wglazing mat.)ave (Wdoor&wind.met.p)ave PBPI4
0,372 0,244 0,384
On the other hand, in Table 4.10, the index values for these work items are listed
for the time frame 1994-2004.

52
Table 4.10: Index values for PBPI4
Years Ipaint,pol.&ins.mat. Iglazing mat. Idoor&wind.met.p
1994 100 100 100
1995 168 199 182
1996 307 337 299
1997 655 587 559
1998 1.208 1.001 978
1999 1.911 1.574 1.476
2000 2.910 2.317 2.131
2001 5.069 4.153 3.682
2002 7.212 5.878 5.432
2003 8.215 7.109 6.737
2004 8.581 7.537 7.608
4.3.2.5 Summary list for the Price Indices
Table 4.11 presents the summary as a list of the values of the available price
indices (CPI, PPI, CI and BCI) and produced price indices (PBPI1, PBPI2, PBPI3
and PBPI4), calculated for the time frame 1994-2005, in accordance with the
methods described in the previous sections.

53
Table 4.11: Values for Available and Produced Price Indices for the time frame 1994-2004
Indices / Year
BCI CPI PPI CI PBPI1 PBPI2 PBPI3 PBPI4
1994 598,00 99,43 100,00 104,59 11,39 11,17 8,54 100,00
1995 1.007,00 188,04 186,03 47,54 24,94 24,29 17,99 180,96
1996 1.781,00 339,22 327,28 26,34 45,45 44,33 33,54 311,32
1997 3.385,00 629,88 595,26 13,53 92,45 89,64 62,68 601,66
1998 5.888,00 1.163,03 1.022,42 7,84 154,81 151,42 109,85 1.069,17
1999 9.186,00 1.917,45 1.564,93 5,06 233,28 230,13 173,77 1.661,79
2000 13.126,00 2.970,43 2.369,85 3,06 366,59 364,80 298,49 2.466,05
2001 20.543,00 4.586,34 3.830,33 2,50 469,54 467,28 369,51 4.312,83
2002 27.914,00 6.648,55 5.749,60 1,51 789,92 792,14 684,98 6.203,47
2003 33.855,00 8.330,39 7.219,36 1,16 1.077,11 1.084,77 960,56 7.377,98
2004 38.797,00 9.212,10 8.020,14 1,00 1.231,34 1.240,10 1.085,37 7.952,79
53

54
4.4 Regression Analysis
The next step was to select a method to quantify how much the unit costs were
explained by the indices mentioned up to here, each of which was considered as
the independent variable for the models driven. Regression analysis was selected
and was used as the method for this purpose. The purpose in this section of the
study was to perform regression analyses by using each of the price indices as an
independent variable separately and the unit costs of the projects as the
dependent variable. Regarding the concept of regression analysis, one can use it
to identify the relationship between a dependent variable and independent
variables. In other words, the parametric results of a regression analysis indicate
the quantity of the relationship between the independent variables and the
dependent variable involved in the process. Ostwald (2001, p.146-148) states
that in regression, on the basis of sample data, the value of a dependent variable
y is to be found corresponding to a given value of a variable x. This is
determined from a least-squares equation that fits the sample data. If the variable
x is time, then the data show the values of y at various times, and the equation is
known as a time series. A regression line or a curve y on x or the response
function on time is frequently called a trend line and is used for prediction and
forecasting. Thus, regression refers to average relationship between variables.
“The notion of fitting a curve to a set of sufficient points is essentially the
problem of finding the parameters of the curve. The best-known method is that
of least squares (regression). Since the desired curve or equation is to be used for
estimating or prediction purposes, the curve or equation should be so modeled as
to make the errors of estimation small. An error of estimation means the
difference between an observed value and the corresponding fitted curve value
for the specific value of x. It will not do require that the sum of these differences
or errors to be as small as possible. It is a requirement that the sum of absolute
value of the errors be as small as possible. However, sums of absolute values are
not convenient mathematically. The difficulty is avoided by requiring that the

55
sum of the squares of the errors be minimized. If this procedure is followed, the
values of parameters give what is known as the best curve in the sense of least-
squares difference (Ostwald, 2001, p.146-148)”.
In this step of regression process, linear regression analyses were performed for
each of the indices being the independent variables and the unit cost being the
dependent variable. As stated previously, the aim of this step was to measure and
compare the level of linear fit between the cost indices developed and cost data
collected for a time frame of 11 years. The prediction performance of the
regression models with price indices as independent variables to predict building
costs will also be compared. This comparison would lead to the selection of the
adequate cost index for escalation of building construction costs.
Before the regression analysis, the unit costs of the projects were plotted against
the price indices, of which values for the time frame 1994-2004 are presented in
Table 4.11. Figures 4.2 to 4.9 illustrate clear images for the relationships
between these parameters. These plots indicate that linear relations were present
between the subject parameters (unit costs and price indices).

56
UNIT COST vs BUILDING COST INDEX
0
50.000.000
100.000.000
150.000.000
200.000.000
250.000.000
300.000.000
350.000.000
400.000.000
0
1.0
00
2.0
00
3.0
00
4.0
00
5.0
00
6.0
00
7.0
00
Building Cost Index
Un
it C
os
t (T
L / m
2)
Figure 4.2: Unit Cost vs. Building Cost Index
UNIT COST vs CONSUMER PRICE INDEX
0
50.000.000
100.000.000
150.000.000
200.000.000
250.000.000
300.000.000
350.000.000
400.000.000
0
1.0
00
2.0
00
3.0
00
4.0
00
5.0
00
6.0
00
7.0
00
8.0
00
9.0
00
10
.00
0
Consumer Price Index (CPI)
Un
it C
os
t (T
L / m
2)
Figure 4.3: Unit Cost vs. Consumer Price Index

57
UNIT COST vs PRODUCER PRICE INDEX
0
50.000.000
100.000.000
150.000.000
200.000.000
250.000.000
300.000.000
350.000.000
400.000.000
0
1.0
00
2.0
00
3.0
00
4.0
00
5.0
00
6.0
00
7.0
00
8.0
00
9.0
00
Producer Price Index (PPI)
Un
it C
os
t (T
L / m
2)
Figure 4.4: Unit Cost vs. Producer Price Index
UNIT COST vs COST INDEX
0
50.000.000
100.000.000
150.000.000
200.000.000
250.000.000
300.000.000
350.000.000
400.000.000
0
2.0
00
4.0
00
6.0
00
8.0
00
10.0
00
12.0
00
Cost Index (CI)
Un
it C
ost
(TL
/ m
2)
Figure 4.5: Unit Cost vs. Cost Index

58
UNIT COST vs PRODUCED BUILDING PRICE INDEX 1
0
50.000.000
100.000.000
150.000.000
200.000.000
250.000.000
300.000.000
350.000.000
400.000.000
0
2.0
00
4.0
00
6.0
00
8.0
00
10
.00
0
12
.00
0
Produced Building Price Index 1 (PBPI1)
Un
it C
os
t (T
L / m
2)
Figure 4.6: Unit Cost vs. Produced Building Price Index 1
UNIT COST vs PRODUCED BUILDING PRICE INDEX 2
0
50.000.000
100.000.000
150.000.000
200.000.000
250.000.000
300.000.000
350.000.000
400.000.000
0
2.0
00
4.0
00
6.0
00
8.0
00
10
.00
0
12
.00
0
Produced Building Price Index 2 (PBPI2)
Un
it C
os
t (T
L / m
2)
Figure 4.7: Unit Cost vs. Produced Building Price Index 2

59
UNIT COST vs PRODUCED BUILDING PRICE INDEX 3
0
50.000.000
100.000.000
150.000.000
200.000.000
250.000.000
300.000.000
350.000.000
400.000.000
0
2.0
00
4.0
00
6.0
00
8.0
00
10
.00
0
12
.00
0
14
.00
0
Produced Building Price Index 3 (PBPI3)
Un
it C
os
t (T
L / m
2)
Figure 4.8: Unit Cost vs. Produced Building Price Index 3
UNIT COST vs PRODUCED BUILDING PRICE INDEX 4
0
50.000.000
100.000.000
150.000.000
200.000.000
250.000.000
300.000.000
350.000.000
400.000.000
0
1.0
00
2.0
00
3.0
00
4.0
00
5.0
00
6.0
00
7.0
00
8.0
00
9.0
00
Produced Building Price Index 4 (PBPI4)
Un
it C
os
t (T
L / m
2)
Figure 4.9: Unit Cost vs. Produced Building Price Index 4

60
However, to quantify these relationships, regression analyses were performed,
with the results presented in Table 4.14.
Table 4.12: Closeness of Fit of the models RM1.1 to RM1.8
Regression Model Independent
Variable P-value R2
RM1.1 BCI 0,0000113 0,609
RM1.2 CPI 0,0000157 0,597
RM1.3 PPI 0,0000190 0,589
RM1.4 CI 0,0000299 0,572
RM1.5 PBPI1 0,0000511 0,550
RM1.6 PBPI2 0,0000537 0,548
RM1.7 PBPI3 0,0000728 0,535
RM1.8 PBPI4 0,0000098 0,614
Two regression statistics, significance level (P value, giving an indication of the
significance of the variables included in the model) and coefficient of
determination (R2, which gives a measure of the variability explained by the
model) were listed in Table 4.14. R2 also gives a measure for the variability
explained by the models. The R2 values for the models were between 0.55 and
0.62 as the only independent variable used in these models was the price index.
This variable only explains the cost variations due to the inflation. However,
there are several other factors such as quality, number of floors, techniques and
methods used, and also factors related to management that were not included in
these models. Therefore, the models only explain the variations in costs related
to inflation. The model with a higher R2 value is expected to have a less P-value
for the variable. RM1.8 had the highest value of R2, being 0.614.

61
R2 (Coefficient of Determination) can be also calculated manually by Equation
4.16 rather than using the Microsoft Office Excel.
yy
yy
S
SSESR
−=2 [4.16]
Where Syy is the total variability in y-values, SSE is the unexpected variability
and they can be calculated by the Equations 4.17 and 4.18 respectively.
∑ −= 2)( yyy yS µ [4.17]
∑ −= 2)ˆ( yySSE [4.18]
Where µy is the mean value of the y-values and ŷ is the estimated y value and it
can be calculated by the Equation 4.19.
xy 10ˆ ββ += [4.19]
Where β0 and β1 are the least squares estimates, and they can be calculated by the
Equations 4.20 and 4.21 respectively.
xx
xy
S
S=1β [4.20]
xy µβµβ 10 −= [4.21]
∑ −= 2)( xxx xS µ [4.22]
∑ −−= ))(( yxxy yxS µµ [4.23]

62
Where Sxx is the total variability in x-values, Sxy is the total variability in x-
values and y-values; and they can be calculated by the Equations 4.22 and 4.23
respectively and µx is the mean value of the x-values.
The models listed in Table 4.12 were tested in terms of prediction performance.
To compare the prediction performances of the models, mean absolute percent
error (MAPE) was used as an error measure and was calculated as follows:
100xpredicted
predictedactual1MAPE
1∑
=
−=
n
i i
ii
n [4.24]
in which i is the project number; actual is the actual cost of the project in TL/m2;
and predicted is the predicted cost of the project in TL/m2. The procedure used to
evaluate prediction performance is based on the cross validation technique and
can be summarized in the following steps:
1. The projects of the last two years (2003 and 2004) were selected as the
test sample and a new data set was performed. The new data set included data of
all of the remaining projects, but not the data of the projects of the last two years
which were selected as the test sample.
2. Model parameters for the regression model were calculated with the new
data set by regression analysis.
3. The regression model with the new parameters was used to predict the
unit cost of the projects which were selected as the test sample.
4. Mean absolute percent error (MAPE) values were calculated according to
the Equation 4.16 for the regression models.

63
The results of the prediction performance test of the models RM1.1 to RM1.8 are
presented in Table 4.13.
Table 4.13: Prediction Performance of
the models RM1.1 to RM1.8
Regression Model
Independent Variable
MAPE
RM1.1 BCI 35,637
RM1.2 CPI 37,590
RM1.3 PPI 38,453
RM1.4 CI 41,248
RM1.5 PBPI1 44,173
RM1.6 PBPI2 44,392
RM1.7 PBPI3 45,570
RM1.8 PBPI4 34,333
The prediction performance evaluation, based on cross validation technique, was
performed by comparing the calculated MAPE values for each of the models.
The best prediction performance belonged to the model RM1.8, with the MAPE
value of 34,333 being the lowest among the others.
4.5 Comparison of Indices
In this section the adequacy of the cost indices for the representation of building
construction costs for the civil works are compared (See Table 4.14). The linear

64
regression models fitted to the data of 23 projects showed that the BCI and
PBPI4 indices gave the best linear fit. The models developed with these cost
indices had the best prediction performance among the single variable linear
index models studied. Therefore, it could be concluded that the BCI and PBPI4
indices are the most adequate indices among the price indices studied in terms of
representation of the variations in building construction costs for the civil works
due to inflation.
Table 4.14: Comparison Table for the Models RM1.1 to RM1.8
Closeness of Fit Prediction
Performance Regression Model
Independent Variable
P-value R2 MAPE
RM1.1 BCI 0,0000113 0,609 35,637
RM1.2 CPI 0,0000157 0,597 37,590
RM1.3 PPI 0,0000190 0,589 38,453
RM1.4 CI 0,0000299 0,572 41,248
RM1.5 PBPI1 0,0000511 0,550 44,173
RM1.6 PBPI2 0,0000537 0,548 44,392
RM1.7 PBPI3 0,0000728 0,535 45,570
RM1.8 PBPI4 0,0000098 0,614 34,333

65
4.6 Prediction of Future Index Values
In the previous section of the study, the BCI and PBPI4 indices were determined
as the adequate indices for representing the impact of inflation on building
construction costs for civil works. The purpose of this section of the study is to
conduct linear and non-linear regression analysis to predict the future values of
these indices. The future values of these indices can be used to predict the future
cost of building projects. By the use of these predicted values of cost indices,
contractors can make more accurate cost estimates at the tender phase of such
kind of projects and can prepare more accurate bids which lead to more
competitive situations. On the other hand, owners may also benefit from these
predicted indices and can use them instead of formulas derived to compensate
the contractors against the increasing costs during the execution period of a
project. At the same time, owners could improve the feasibility budget with the
models developed.
To predict the future values of these indices, it was necessary to find an adequate
relationship between the years and the values of these indices. The regression
models were built to determine the relation between the years and the indices and
were in the following forms:
• For BCI:
ii xBCI 10)( ββ += [4.25]
210)( ii xBCI ββ += [4.26]
310)( ii xBCI ββ += [4.27]
ii xBCI log)( 10 ββ += [4.28]

66
2210)( iii xxBCI βββ ++= [4.29]
32
210)( iii xxBCI βββ ++= [4.30]
3210)( iii xxBCI βββ ++= [4.31]
• For PBPI4:
( ) iixPBPI 104 ββ += [4.32]
( ) 2104 iixPBPI ββ += [4.33]
( ) 3104 iixPBPI ββ += [4.34]
( ) iixPBPI log104 ββ += [4.35]
( ) 22104 iiixxPBPI βββ ++= [4.36]
( ) 32
2104 iii
xxPBPI βββ ++= [4.37]
( ) 32104 iiixxPBPI βββ ++= [4.38]
where i is the year term from 1994 to 2004; BCI is the value of the building cost
index for the corresponding year; (PBPI4) i is the value of the produced building
price index for the corresponding year; x is the value of the year being 1 for year

67
1994, 2 for 1995, ….11 for 2004; and β0, β1 and β2 are regression coefficients for
each of the models.
With techniques used in previous section, these following equations were tested
by regression analysis to determine which function fitted the data best and
resulted with a good prediction performance. However, before the regression
analysis, the plot of the values of these indices against the years provided a good
illustration to portray the relationship between each of these indices and the year
term (See Figure 4.10 and Figure 4.11).
BUILDING COST INDEX vs YEARS
0
5.000
10.000
15.000
20.000
25.000
30.000
35.000
40.000
0 1 2 3 4 5 6 7 8 9 10 11
Years
Bu
ild
ing
Co
st
Ind
ex
Figure 4.10: Building Cost Index vs. Years

68
PRODUCED BUILDING PRICE INDEX 4 vs YEARS
0
1.000
2.000
3.000
4.000
5.000
6.000
7.000
8.000
0 1 2 3 4 5 6 7 8 9 10 11
Years
Pro
du
ce
d B
uild
in P
ric
e
Ind
ex
4
Figure 4.11: Produced Building Price Index 4 vs. Years
These plots gave a clear image of the non-linear relationship existing between
both of these indices and the years. Regression analyses were performed for each
of the models in the form of the equations numbered from 1 to 14 and the
resulting regression statistics were noted.
To determine the closeness of fit, the entire data set was used for regression
analysis. The regression statistic R2 for each of the models is presented in Table
4.15 for BCI and Table 4.16 for PBPI4.

69
Table 4.15: Closeness of Fit for
Building Cost Index (BCI)
Regression Model with the independent variable year (x) in the form of:
R2
x 0,914
x2 0,990
Log x 0,677
x3 0,977
(x + x2) 0,988
(x2 + x3) 0,980
(x + x3) 0,978
Table 4.16: Closeness of Fit for
Produced Building Price Index 4 (PBPI4)
Regression Model with the independent variable year (x) in the form of:
R2
x 0,895
x2 0,976
Log x 0,654
x3 0,964
(x + x2) 0,973
(x2 + x3) 0,967
(x + x3) 0,965

70
On the other hand, to evaluate the prediction performance of the above models,
again the models were validated by the technique of cross validation¸ and the
regression models were driven with the data set excluding the data of the projects
of the last two years which were used in the test sample. The values predicted by
the models for each year are listed in the Tables 4.17 (for BCI when constant is
not 0), 4.18 (for BCI when constant is 0), 4.19 (for PBPI4 when constant is not
0), and 4.20 (for PBPI4 when constant is 0).
The MAPE values of these models are presented in Table 4.21 for BCI and Table
4.22 for PBPI4.
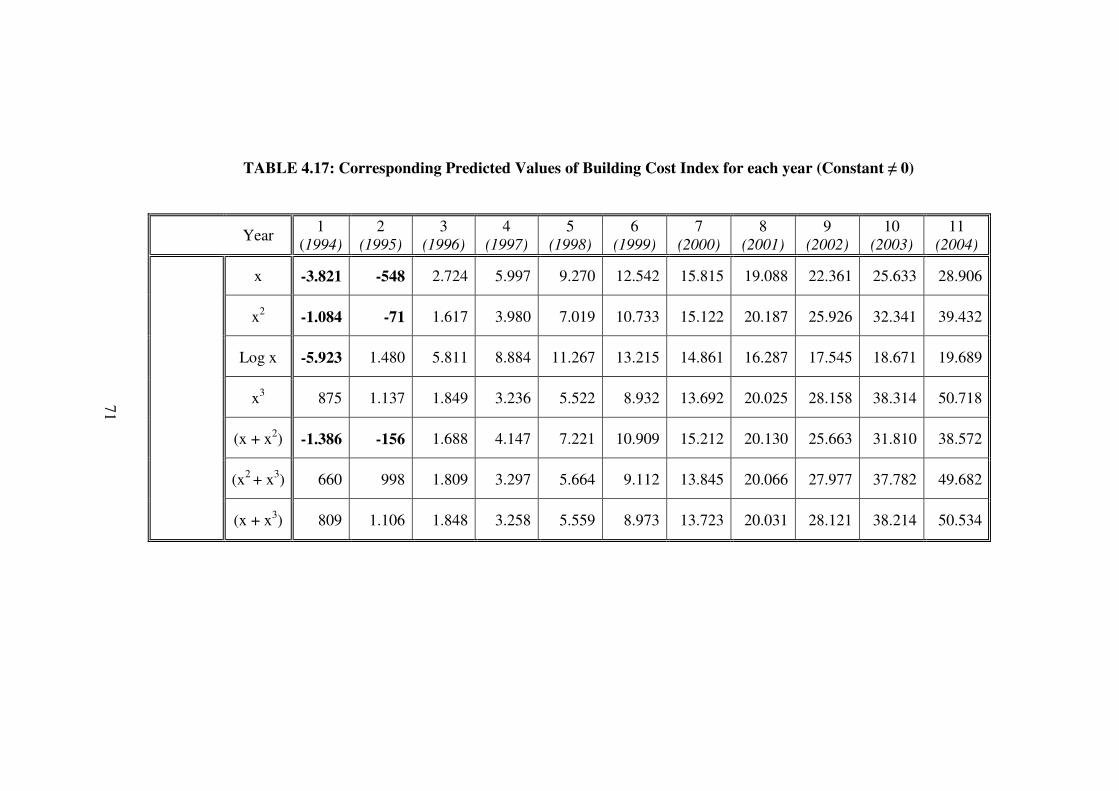
71
TABLE 4.17: Corresponding Predicted Values of Building Cost Index for each year (Constant ≠ 0)
Year 1
(1994) 2
(1995) 3
(1996) 4
(1997) 5
(1998) 6
(1999) 7
(2000) 8
(2001) 9
(2002) 10
(2003) 11
(2004)
x -3.821 -548 2.724 5.997 9.270 12.542 15.815 19.088 22.361 25.633 28.906
x2 -1.084 -71 1.617 3.980 7.019 10.733 15.122 20.187 25.926 32.341 39.432
Log x -5.923 1.480 5.811 8.884 11.267 13.215 14.861 16.287 17.545 18.671 19.689
x3 875 1.137 1.849 3.236 5.522 8.932 13.692 20.025 28.158 38.314 50.718
(x + x2) -1.386 -156 1.688 4.147 7.221 10.909 15.212 20.130 25.663 31.810 38.572
(x2 + x3) 660 998 1.809 3.297 5.664 9.112 13.845 20.066 27.977 37.782 49.682
(x + x3) 809 1.106 1.848 3.258 5.559 8.973 13.723 20.031 28.121 38.214 50.534
71

72
TABLE 4.18: Corresponding Predicted Values of Building Cost Index for each year (Constant = 0)
Year 1
(1994) 2
(1995) 3
(1996) 4
(1997) 5
(1998) 6
(1999) 7
(2000) 8
(2001) 9
(2002) 10
(2003) 11
(2004)
x 2.153 4.305 6.458 8.611 10.763 12.916 15.068 17.221 19.374 21.526 23.679
x2 311 1.245 2.801 4.979 7.780 11.203 15.249 19.917 25.207 31.120 37.656
Log x 0 5.052 8.007 10.103 11.730 13.058 14.182 15.155 16.013 16.781 17.476
x3 39 314 1.059 2.509 4.901 8.469 13.449 20.075 28.584 39.210 52.188
(x+x2) 548 1.643 3.286 5.476 8.214 11.500 15.333 19.714 24.642 30.118 36.142
(x2+x3) 70 419 1.257 2.793 5.237 8.799 13.687 20.112 28.282 38.408 50.698
(x+x3) 77 386 1.158 2.626 5.020 8.573 13.515 20.080 28.498 39.001 51.822
72

73
TABLE 4.19: Corresponding Predicted Values of Produced Building Price Index 4 for each year (Constant ≠ 0)
Year 1
(1994) 2
(1995) 3
(1996) 4
(1997) 5
(1998) 6
(1999) 7
(2000) 8
(2001) 9
(2002) 10
(2003) 11
(2004)
x -933 -230 473 1.176 1.879 2.582 3.285 3.988 4.691 5.394 6.096
x2 -376 -155 212 727 1.388 2.197 3.153 4.256 5.505 6.902 8.446
Log x -1.334 231 1.147 1.797 2.301 2.713 3.061 3.363 3.629 3.867 4.082
x3 30 88 245 550 1.054 1.804 2.852 4.247 6.037 8.273 11.004
(x + x2) -439 -172 230 764 1.433 2.235 3.171 4.241 5.444 6.781 8.252
(x2 + x3) -15 59 238 565 1.085 1.844 2.885 4.253 5.993 8.149 10.766
(x + x3) 16 82 245 555 1.062 1.813 2.859 4.247 6.028 8.249 10.961
73

74
TABLE 4.20: Corresponding Predicted Values of Produced Building Price Index 4 for each year (Constant = 0)
Year 1
(1994) 2
(1995) 3
(1996) 4
(1997) 5
(1998) 6
(1999) 7
(2000) 8
(2001) 9
(2002) 10
(2003) 11
(2004)
x 445 889 1.334 1.778 2.223 2.668 3.112 3.557 4.002 4.446 4.891
x2 65 261 586 1.043 1.629 2.346 3.193 4.170 5.278 6.516 7.885
Log x 0 1.036 1.642 2.072 2.405 2.678 2.908 3.108 3.284 3.441 3.583
x3 8 66 224 531 1.037 1.792 2.846 4.248 6.048 8.297 11.043
(x + x2) 114 343 687 1.145 1.717 2.404 3.206 4.122 5.152 6.297 7.556
(x2 + x3) 15 89 266 590 1.107 1.860 2.893 4.251 5.977 8.117 10.715
(x + x3) 16 82 245 555 1.062 1.813 2.859 4.247 6.028 8.249 10.961
74

75
Table 4.21: Prediction Performance for
Building Cost Index (BCI)
Regression Model
MAPE (Constant ≠ 0)
MAPE (Constant = 0)
x (*) 33,146 60,559
x2 (*) 3,145 5,909
Log x (*) 89,188 111,872
x3 17,571 19,658
(x + x2) (*) 3,506 9,876
(x2 + x3) 16,151 17,664
(x + x3) 17,317 19,165
(*) represents the models giving negative predicted values and they will not be
taken into account.
Table 4.22: Prediction Performance for
Produced Building Price Index 4 (PBPI4)
Regression Model
MAPE (Constant ≠ 0)
MAPE (Constant = 0)
x (*) 33,621 64,274
x2 (*) 6,367 7,043
Log x (*) 92,824 118,175
x3 19,272 19,527
(x + x2) (*) 6,213 11,211
(x2 + x3) (*) 17,796 17,444
(x + x3) 19,004 19,004
(*) represents the models giving negative predicted values and they will not be
taken into account.
76
The next step was to select the models which resulted in best prediction
performance, but with reasonable results (i.e. the models producing negative
values shall not be considered). Having examined the Tables 4.21 and 4.22, the
best prediction performances belonged to the models derived with the variables
x2 and (x+x2) when constant was 0 (zero) for both BCI and PBPI4. The models
with better prediction performances, in other words with less MAPE values,
were ignored due to the negative index values for some year values estimated by
the corresponding models (indicated with (*)).
The above mentioned models with the best prediction performances and which
produce reasonable index values were examined. In other words, corresponding
models were used to predict the future values of BCI and PBPI4 and the results
were listed in Table 4.23.
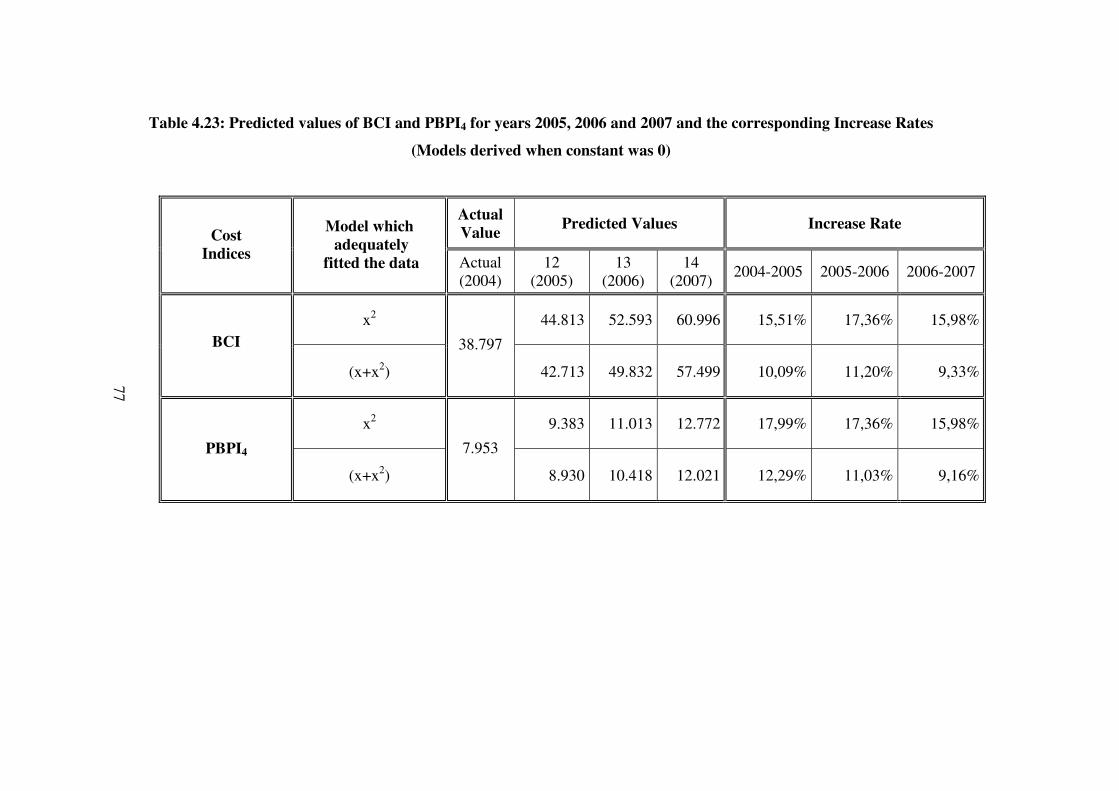
77
Table 4.23: Predicted values of BCI and PBPI4 for years 2005, 2006 and 2007 and the corresponding Increase Rates
(Models derived when constant was 0)
Actual Value
Predicted Values Increase Rate Cost
Indices
Model which adequately
fitted the data Actual (2004)
12 (2005)
13 (2006)
14 (2007)
2004-2005 2005-2006 2006-2007
x2 44.813 52.593 60.996 15,51% 17,36% 15,98%
BCI
(x+x2)
38.797
42.713 49.832 57.499 10,09% 11,20% 9,33%
x2 9.383 11.013 12.772 17,99% 17,36% 15,98%
PBPI4
(x+x2)
7.953
8.930 10.418 12.021 12,29% 11,03% 9,16%
77

78
In order to provide the most reliable prediction for the future cost of a building
project, the most reasonable model should be selected to predict the future value
of the cost indices. The expected inflation rates provided a basis to evaluate the
increase rates of index values between the successive years of 2004-2005, 2005-
2006 and 2006-2007. Table 4.24 gives the expected rates of inflation for these
years.
Table 4.24: Expected rates of inflation
2004-2005 2005-2006 2006-2007
9,00% 6,10% 5,00%
The models derived by the parameter (x+x2) for both BCI and PBPI4 (when
constant was 0) predicted future values for these indices for the years 2005, 2006
and 2007; which had somehow more reasonable increase rates when compared to
the expected inflation rates presented in Table 4.24. Therefore, the predicted
values for the years 2005 to 2007 for BCI and PBPI4, achieved as a result of the
regression models derived with the variable (x+x2) when constant was 0, were
selected to represent the future costs of building projects and were summarized
in Table 4.25.
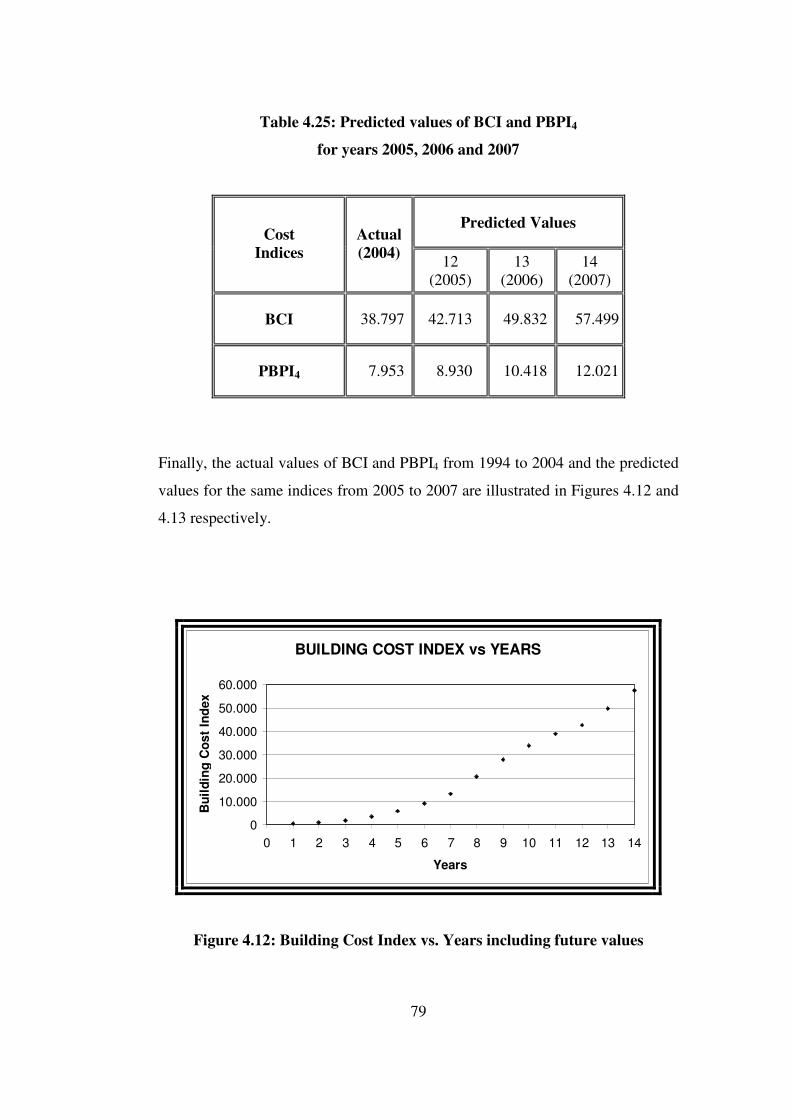
79
Table 4.25: Predicted values of BCI and PBPI4
for years 2005, 2006 and 2007
Predicted Values Cost
Indices Actual (2004)
12 (2005)
13 (2006)
14 (2007)
BCI 38.797 42.713 49.832 57.499
PBPI4 7.953 8.930 10.418 12.021
Finally, the actual values of BCI and PBPI4 from 1994 to 2004 and the predicted
values for the same indices from 2005 to 2007 are illustrated in Figures 4.12 and
4.13 respectively.
BUILDING COST INDEX vs YEARS
0
10.000
20.000
30.000
40.000
50.000
60.000
0 1 2 3 4 5 6 7 8 9 10 11 12 13 14
Years
Bu
ild
ing
Co
st
Ind
ex
Figure 4.12: Building Cost Index vs. Years including future values

80
PRODUCED BUILDING PRICE INDEX 4 vs YEARS
0
2.000
4.000
6.000
8.000
10.000
12.000
14.000
0 1 2 3 4 5 6 7 8 9 10 11 12 13 14
Years
Pro
du
ce
d B
uild
in P
ric
e
Ind
ex
4
Figure 4.13: Produced Building Price Index 4 vs. Years including future
values

81
CHAPTER V
CONCLUSIONS AND RECOMMENDATIONS
This research covered the studies performed to compare the existing and newly
developed cost indices in terms of their adequacy to escalate the costs of building
projects in Turkey. Moreover, the indices that were found to be adequate were
analyzed by regression technique, to obtain models to predict the future values of
the same indices, which was a way enabling the prediction of the future cost of a
building project.
The objectives of the study were outlined in the introductory chapter. The next
chapter about the literature review was developed to have a look at the past
studies conducted about the concept of price indices and yielded that many
studies were performed to develop new cost indices particularly for specific
types of construction projects. The newly developed cost indices were based on
the past cost data of those projects and were found to be more adequate for the
escalation purposes regarding the same type of projects rather than using the
existing indices. The techniques followed in the past studies to develop new cost
indices were examined and the steps included in the calculation of the same were
explained in detail. The third chapter introduced the concept of price index and
presented general information about the price indices. The basic variables
required for the calculation of price indices were defined and the outline of
processes in developing and compiling construction price indices were
examined. Moreover, the definitions and components of the existing price
indices were studied.

82
The chapter about the Methodology and Data Analysis covered the steps and
detailed explanations of the studies performed to meet the objectives of this
research. The data to be analyzed was introduced, and afterwards, the steps for
the calculations performed to obtain new cost indices were developed. The
developed price indices were compared with the existing ones, and the indices
which provided the best linear relationship with the costs of the building projects
were selected as the adequate indices to be used to escalate the costs of building
projects. Nevertheless, these selected indices were analyzed by the regression
technique and the relationship between the years and the values of these indices
were investigated. The aim of this step was to achieve a model which would
make it possible to predict the future values of the selected indices. Such a step
in this study was covered to be able to predict the future cost of a building
project, which is needed by the contractors in most cases as described in the
introduction to this study.
One of the points that should be mentioned in this study is to clarify whether or
not it would be a true method to use the predicted values of the cost indices
obtained as a result of the models explaining the relationship between the time
and the values of these indices, to estimate the future cost of a building project.
On the other hand, the cost indices developed in this study were based on the
data derived from the construction costs of building projects regarding only the
civil scope, excluding the costs related with the electrical and mechanical works.
Thus, they shall only be used for representation of the cost of the civil scope of
building projects. The costs that are related with the electrical and mechanical
costs shall be represented by the indices developed by using the past costs of the
electro-mechanical scope of the building projects, where the breakdown of the
prices are available; or by the existing indices calculated by governmental
organizations based on the past price movements in electrical and mechanical
work items. However, the best way would certainly be to perform a study similar

83
to this one which would aim to compare the developed and existing price indices
in terms of their adequacy.
Furthermore, besides building projects, the cost indices for different types of
construction projects, such as industrial plants, highways, dams and power
plants, pipelines, etc., can also be developed by using the data about the past
costs of such projects and can be used to represent the costs of the same. One of
the important requirements to perform such studies is to achieve the price
breakdown of the costs of the subject projects, of which data are compiled to
investigate the relationship between costs and values of the indices.
This study resulted with the selection of price indices among the existing and
developed indices which were found to be adequate to represent the costs of the
building projects in Turkey. By using these indices, one shall achieve more
accurate results when escalating the cost of a building project. On the other hand,
the predicted values of these indices achieved by the derived models will provide
more precise results to estimate the future cost of a building project. More
accurate estimations shall enable contractors to produce more reliable cash flow
forecasts, which is one of the main factors affecting the overall success of a
construction project. Furthermore, owners shall also produce better predictions
for the budget allocations of their projects, where they can also evaluate several
project alternatives with better predictions based on the selected price indices as
a result of this study.
84
REFERENCES
Cran, J., 1976. Cost indices. Eng. Process Econom., 1: 13-23.
EUROSTAT, Luxembourg, Industrial Trends: National Methods, Supp. December 1995
EUROSTAT, Luxembourg, Methodological Aspects of Construction Price Indices, 1996.
Grogan, T., 1994. “Cost history: indexes hit by high lumber prices”, Eng. News Record 28, 46.
Monthly Labor Rev., 1995. U.S. Department of Labor, Bureau of Labor Statistics, vol. 118(4) April.
OECD, Paris, Consumer Price Indices, Sources and Methods, 1994. (a)
OECD, Paris, Main Economic Indicators, Sources and Methods, 1996.
OECD, Paris, Producer Price Indices, Sources and Methods, 1994. (b)
Ostwald, P.F., 1992. “Engineering Cost Estimating. 3rd ed. Prentice-Hall Englewood Cliffs”, NJ, p.170.

85
Ostwald, P.F., 2001. Construction Cost Analysis and Estimating, Prentice Hall International Series In Civil Engineering and Engineering Mechanics, New Jersey.
Park, W.R., 1973. “Cost Engineering Analysis”, Wiley, New York.
Pintelon, L. and Geeroms, K., 1997. “Computational model for a Belgian chemical engineering plant cost index”, Int. J. Production Economics, 49, 101-115.
Remer, D.S., Huynh, L., Agarwal, K., Auchard, B.J. and Heaps-Nelson, T., 1998. “A compilation of inflation and location indexes”, Int. J. Production Economics, 54, 41-55.
Remer, D.S. and Mattos F.B., 2003. “Cost and scale-up factors, international inflation indexes and location factors”, Int. J. Production Economics, 84, 1-16.
SSI Turkey (State Statistics Institute Turkey), 2002. Fiyat Endeksleri ve Enflasyon, Sorularla İstatistikler Dizisi 2.
Turvey Demon, Last Updated June 6, 2005, “Price Indices” http://www.turvey.demon.co.uk/Construction%20Price%20Indexes.doc, last access June 9, 2005.
Wang, C.H. and Mei, Y.H., 1998. “Model for forecasting construction cost indices in Taiwan”, Construction Management and Economics, 16, 147-157.
Wilmot, C.G. and Cheng, G., 2003. “Estimating Future Highway Construction Costs”, Journal of Construction Engineering and Management, ASCE, Vol. 129, No. 3, 272-279.