Embed Size (px)
Citation preview
AFWAL-TR-82-21 28
1 1- 0
• DETERMINATION OF A JET FUEL METAL DEACTIVATORBY HIGH PERFORMANCE LIQUID CHROMATOGRAPHY
Paul C. Hayes, Jr.Fuels BranchFuels and Lubrication Division
June 1983
Final Report for Period 1 January - 4 July 1980
Approved for Public Release; Distribution Unlimited.
Cl-]
AERO PROPULSION LABORATORY
AIR FORCE WRIGHT AERONAUTICAL LABORATORIESAIR FORCE SYSTEMS COMMAND
C WRIGHT-PATTERSON AIR FORCE BASE, OHIO 45433
---
NOTICE
When Government drawings, specifications, or other data are used for any purposeother than in connection with a definitely related Government procurement operation,the United States Government thereby incurs no responsibility nor any obligationwhatsoever; and the fact that the government may have formulated, furnished, or inany way supplied the said drawings, specifications, or other data, is not to be re-garded by implication or otherwise as in any manner licensing the holder or anyother person or corporation, or conveying any rights or permission to manufactureuse, or sell any patented invention that may in any way be related thereto.
This report has been reviewed by the Office of Public Affairs (ASD/PA) and isreleasable to the National Technical Information Service (NTIS). At NTIS, it willbe available to the general public, including foreign nations.
This technical report has been reviewed and is approved for publication.
PAUL C. HAYES, JR. ARTHUR V. CHURCHILLFuels Branch, Fuels and Lubrication Division Chief, Fuels BranchAero Propulsion Laboratory Fuels and Lubrication Division
Aero Propulsion Laboratory
FOR THE COMMAMER
ROE D. SHEFP ILL -
Chief, Fuels and Lubrication DivisionAero Propulsion Laboratory
"If your address has changed, if you wish to be removed from our mailing list, orif the addressee is no longer employed by your organization please notify AFWAL/POSF,W-PAFB, OH 45433 to help us maintain a current mailing list".
Copies of this report should not be returned unless return is required by securityconsiderations, contractual obligations, or notice on a specific document.

BLANK PAGES IN THIS DOCUMENT WERE NOT FILMED
IJNC'.ASSTFTEDSECURITY CLASSIFICATION OF THIS PAGE (When Date Entered),
READ INSTRUCTIONSREPORT DOCUMENTATION PAGE BEFORE COMPLETING FORM
1. REPORT NUMBER 2GVACCESSION No 3. RECIPIENT'S CATALOG NUMBERAFWAL-TR-82-2128
4. TITLE (and Subtitle) S TYPE OF REPORT 6 PERIOD COVERED
DETERMINATION OF A JET FUEL METAL Final Report for Period-
DEACTIVATOR BY HIGH PERFORMANCE LIQUID January - July 1980CHROMATOGRAPHY 6. PERFORMING ORG. REPORT NUMBER
7. AUTHOR(s) S. CONTRACT OR GRANT NUMBER(s)
Paul C. Hayes Jr.
9. PERFORMING ORGANIZATION NAME AND ADDRESS 10. PROGRAM ELEMENT. PROJECT. TASKSEAA jb PT U 1T N.UMBE RS
Aero Propulsion Laboratory (AFWAL/POSF) P.. OzAu roject: 3048
AF Wright Aeronautical Laboratories Task: 304805
Wright-Patterson AFB OH 45433 Work Unit: 30480591
I. CONTROLLING OFFICE NAME AND ADDRESS 12. REPORT DATE
Aero Propulsion Laboratory (AFWAL/POSF) June 1983
AF Wright Aeronautical Laboratories 13 NUMBER OF PAGESWright-Patterson AFB OH 45433 49
14. MONITORING AGENCY NAME 6 ADORESS(II different from Cottrofng Office) 15. SECURITY CLASS. (of this report)
UNCLASSIFIED
15a. DECLASSIFICATION DOWNGRADINGSCHEDULE
16. DISTRIBUTION STATEMENT (of this Report)
Approved for public release; distribution unlimited.
17. DISTRIBUTION STATEMENT (of the abstract entered in Block 20. if different from Report)
Ia. SUPPLEMENTARY NOTES
19. KEY WORDS (Continue on reverse side if necessary and identify by block number)
High Performance Liquid Chromatography absorbance ratioingmetal deactivatorJP-4fuel additives
20. ABSTRACT (Continue on reverse side If necessary and identify by block number)
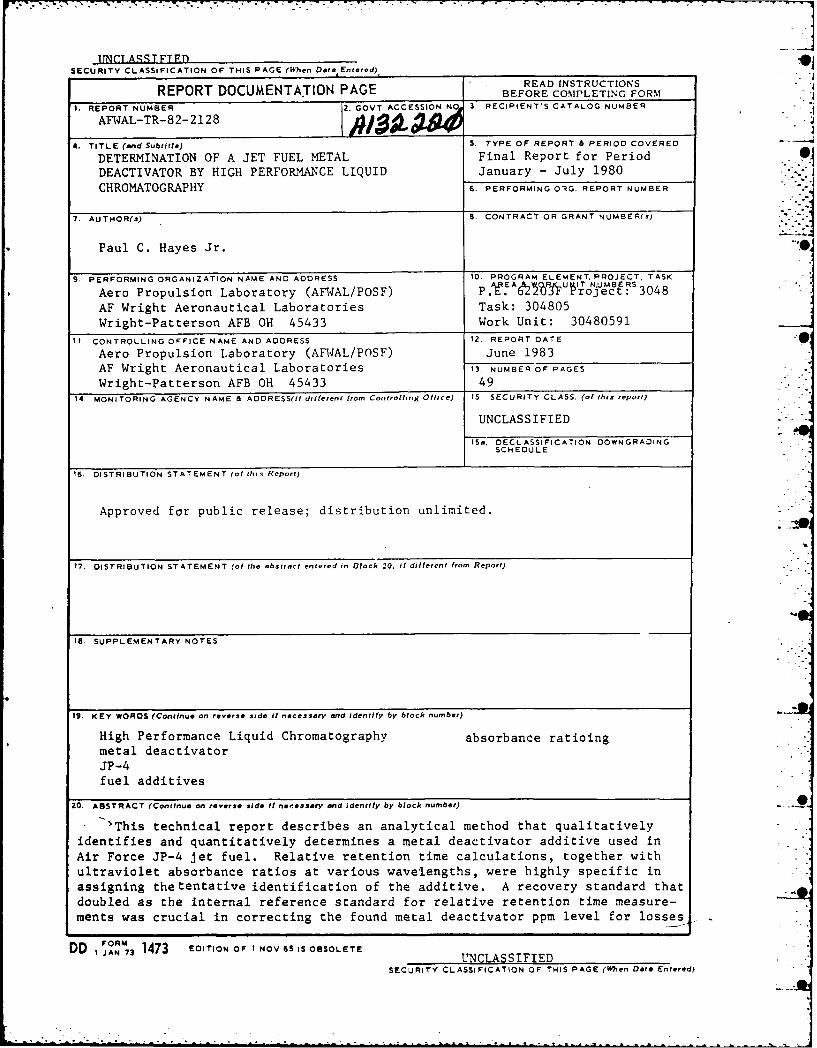
- 'This technical report describes an analytical method that qualitativelyidentifies and quantitatively determines a metal deactivator additive used in
Air Force JP-4 jet fuel. Relative retention time calculations, together withultraviolet absorbance ratios at various wavelengths, were highly specific in
assigning the tentative identification of the additive. A recovery standard that
doubled as the internal reference standard for relative retention time measure-ments was crucial in correcting the found metal deactivator ppm level for lossesi.
DD JAN73 1473 EDITION OF I NOV 65 IS OBSOLETEUNCLASSIFIED
SECURITY CLASSIFICATION OF THIS PAGE (Wen Date Entered)
UNCLASSIFIEDSECURITY CLASSIFICATION OF THIS PAGE(Wh7 Date Entered)
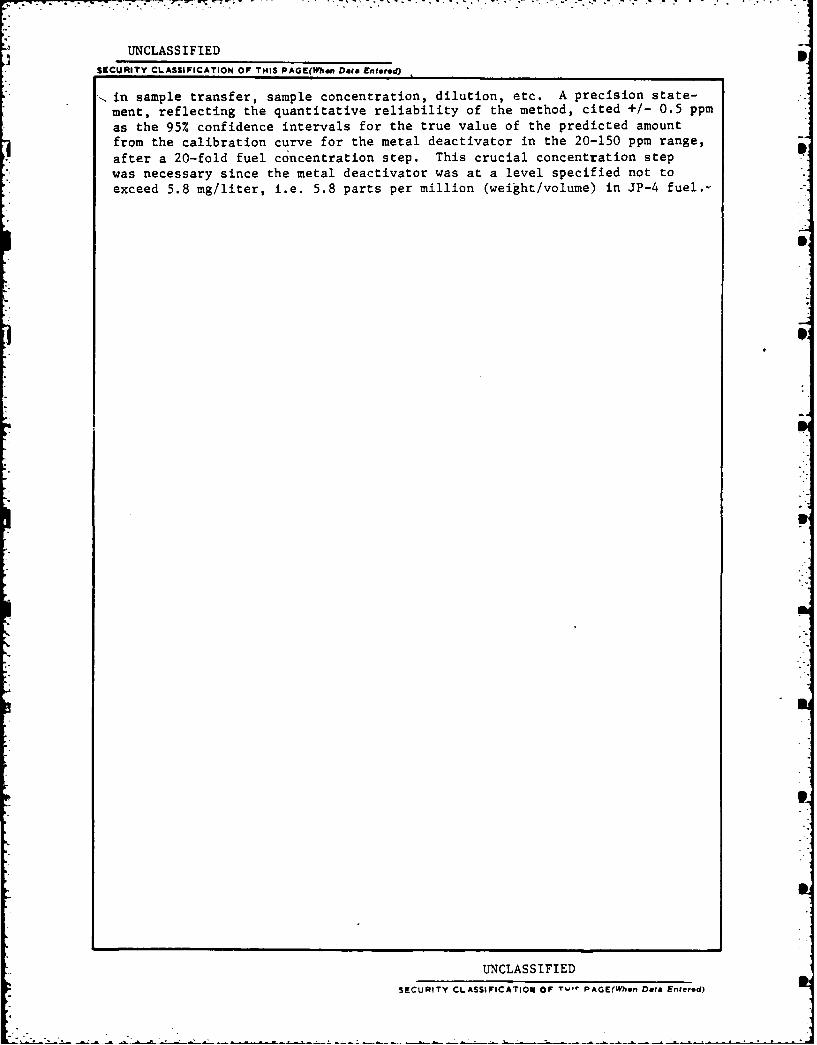
- in sample transfer, sample concentration, dilution, etc. A precision state-ment, reflecting the quantitative reliability of the method, cited +/- 0.5 ppm
as the 95% confidence intervals for the true value of the predicted amountfrom the calibration curve for the metal deactivator in the 20-150 ppm range,
after a 20-fold fuel concentration step. This crucial concentration stepwas necessary since the metal deactivator was at a level specified not toexceed 5.8 mg/liter, i.e. 5.8 parts per million (weight/volume) in JP-4 fuel.-
lp
UNCLASSIFIEDSECURITY CLASSIFICATIOW OF ''-l PAoErWhen Data Entered)
AFWAL-TR-82-2128
FOREWORD
This technical report describes work performed under the In-House
Work Unit 30480591 administered by the Fuels Branch (POSF), Fuels and
Lubrication Division (POS), Aero Propulsion Laboratory (AFWAL/PO),Air
Force Wright Aeronautical Laboratories. Project scientist for this
program was Mr. Paul C. Hayes, Jr., who prepared this report.
Particular gratitude is extended to several individuals whose
contributions ensured the success of this research effort. Teresa A.
Boos (AFWAL/POSF) operated the liquid chromatograph, took the absorbance S
readings, and generated the calibration curves. Dwayne A. Burns
(AFWAL/POSF) prepared the calibration solutions as well as the JP-4
fuels mixtures. The Quality Assurance Laboratory, Det. #13, SA-ALC/SFTLA,
W-PAFB, Ohio, aided in evaporating the fuel samples. Mr. Edward C.
Eimutis, a statistician with Monsanto Research Corporation (Dayton
Laboratory), presented stimulating lectures and assistance in deriving
the precision statements of all of the analyses contained in this report.
This report also represents the partial fulfillment of the require-
ments for a master's thesis by Mr. Hayes at Xavier University,
Cincinnati, Ohio. The author wishes to express his deep appreciation
for the guidance and encouragement offered by Dr. Joseph J. Klingenberg,
the research advisor at Xavier University.
Dis I t
NT' --T-.R1
P2ee7* : : fl -'-
Di t i ,.:P '"
iii
I -
AFWAL-TR-82-2128
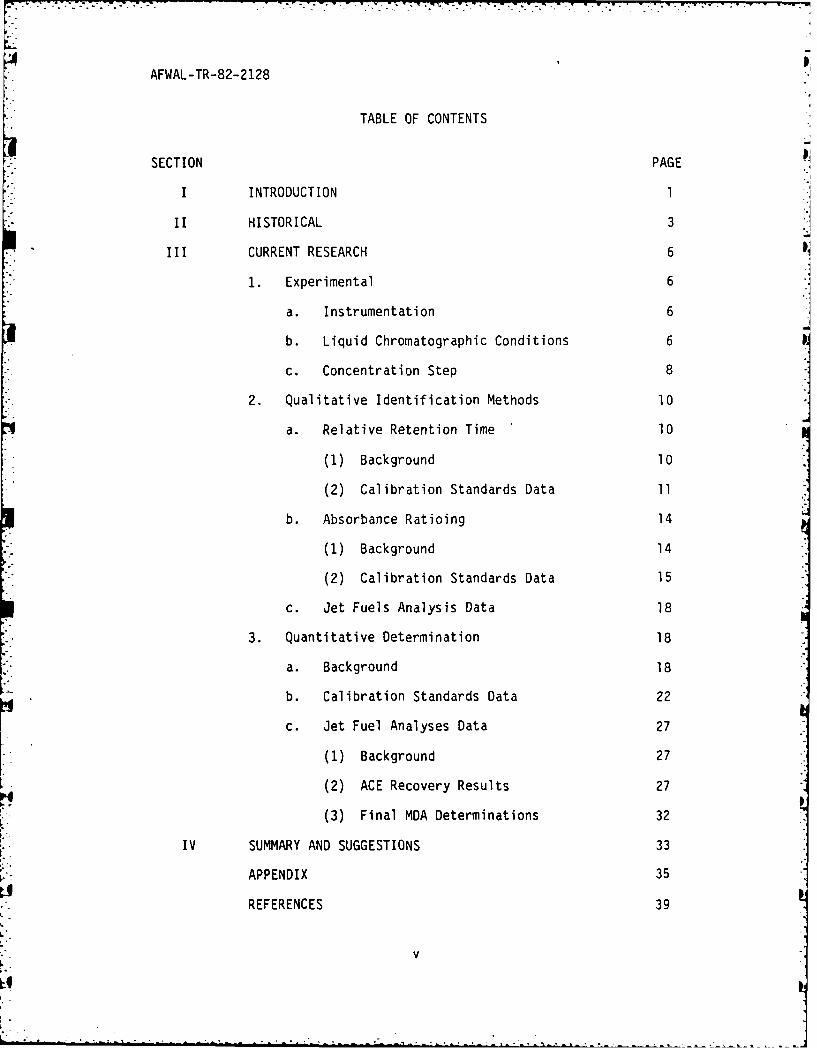
TABLE OF CONTENTS
SECTION PAGE
I INTRODUCTION 1
II HISTORICAL 3
III CURRENT RESEARCH 6
1. Experimental 6
a. Instrumentation 6
b. Liquid Chromatographic Conditions 6
c. Concentration Step 8
2. Qualitative Identification Methods 10
a. Relative Retention Time 10
(1) Background 10
(2) Calibration Standards Data 11
b. Absorbance Ratioing 14
(1) Background 14
(2) Calibration Standards Data 15
c. Jet Fuels Analysis Data 18
3. Quantitative Determination 18
a. Background 18
b. Calibration Standards Data 22
c. Jet Fuel Analyses Data 27
(1) Background 27
(2) ACE Recovery Results 27
(3) Final MDA Determinations 32
IV SUMMARY AND SUGGESTIONS 33
APPENDIX 35
REFERENCES 39
v
AFWAL-TR-82-2128
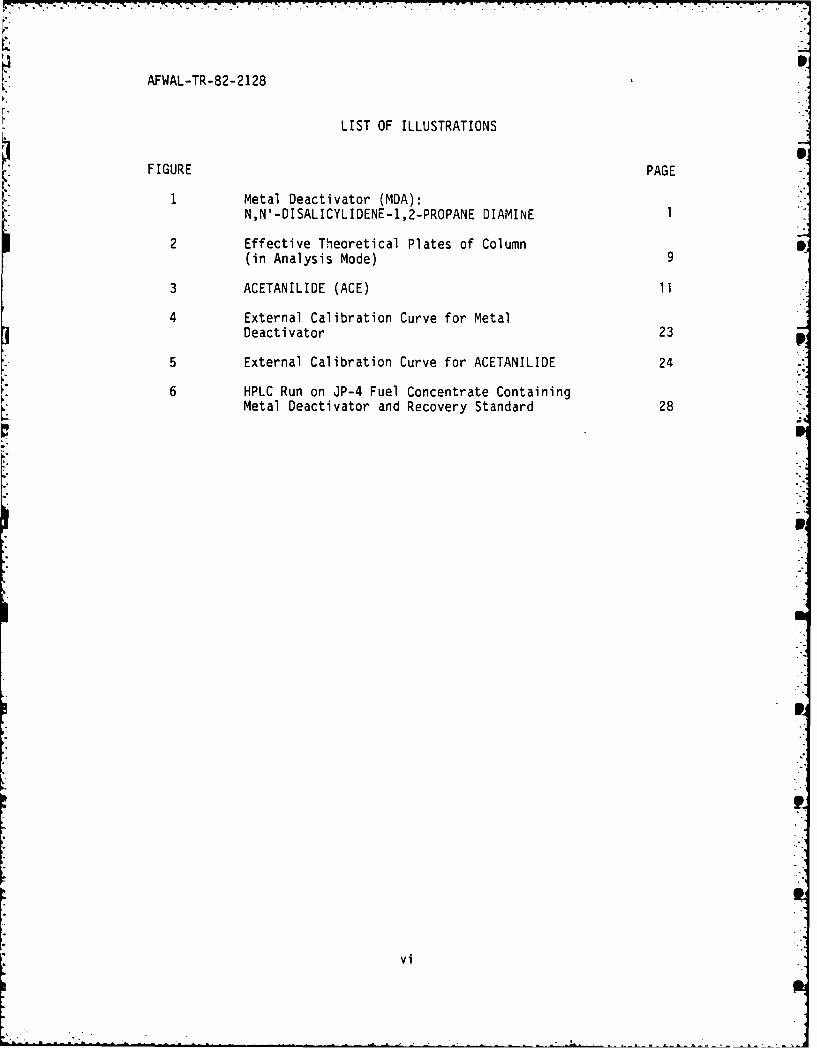
LIST OF ILLUSTRATIONS
FIGURE PAGE
1 Metal Deactivator (MDA):N,N'-DISALICYLIDENE-1,2-PROPANE DIAMINE1
2 Effective Theoretical Plates of Column
(in Analysis Mode) 9
3 ACETANILIDE (ACE) 11
4 External Calibration Curve for MetalDeactivator 23
5 External Calibration Curve for ACETANILIDE 24 .
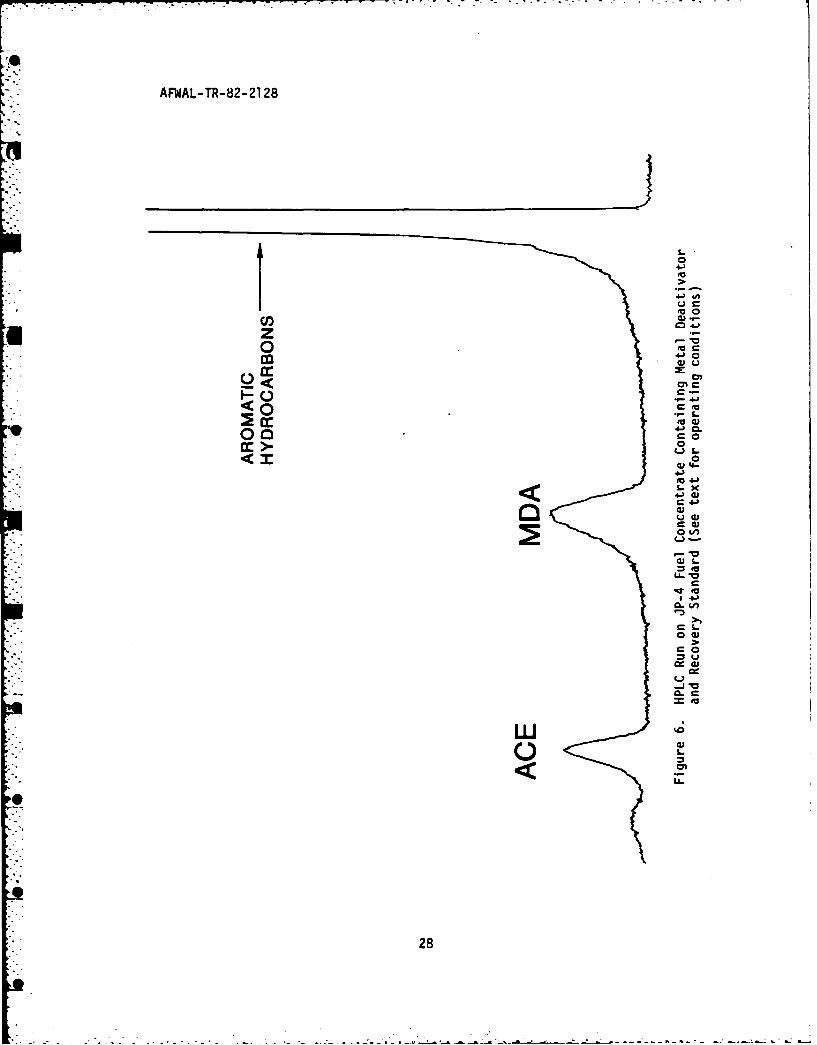
6 HPLC Run on JP-4 Fuel Concentrate ContainingMetal Deactivator and Recovery Standard 28
v
vi
S-.---. - --. -. - - .
AFWAL-TR-82-2128
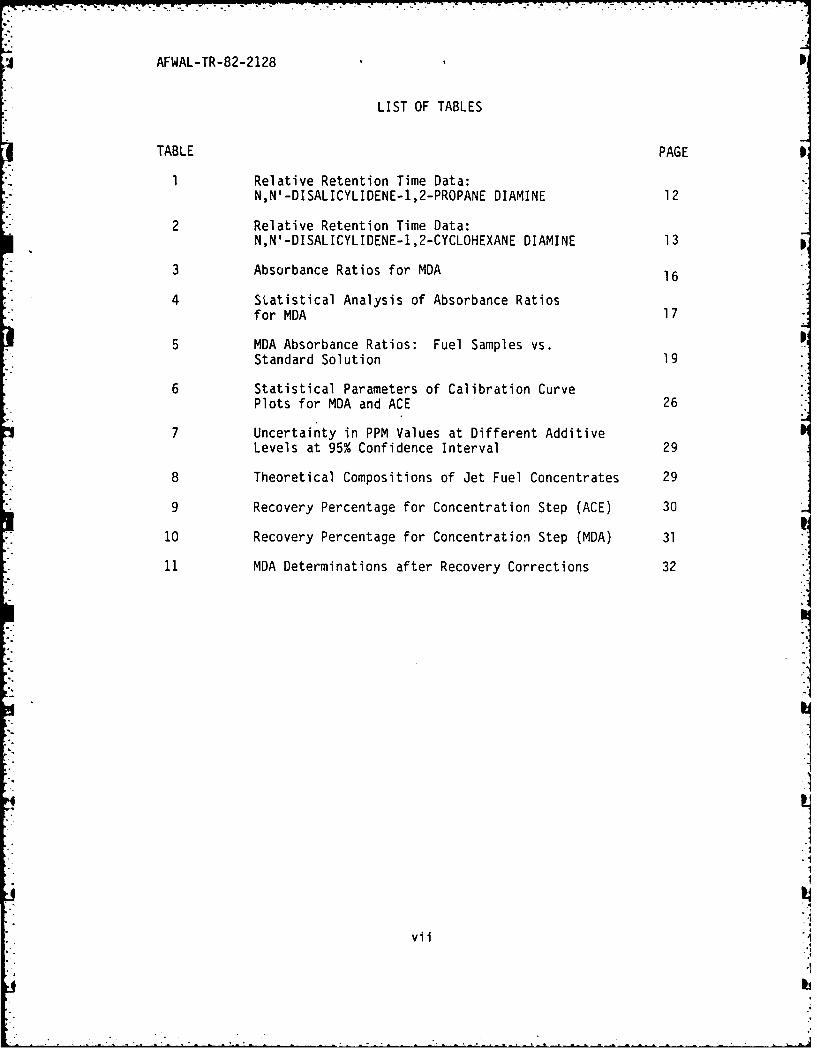
LIST OF TABLES
TABLE PAGE
1 Relative Retention Time Data:N,N'-DISALICYLIDENE-1,2-PROPANE DIAMINE 12
2 Relative Retention Time Data:
N,N'-DISALICYLIDENE-1,2-CYCLOHEXANE DIAMINE 13
3 Absorbance Ratios for MDA 16
4 Statistical Analysis of Absorbance Ratiosfor MDA 17
5 MDA Absorbance Ratios: Fuel Samples vs.Standard Solution 19
6 Statistical Parameters of Calibration CurvePlots for MDA and ACE 26
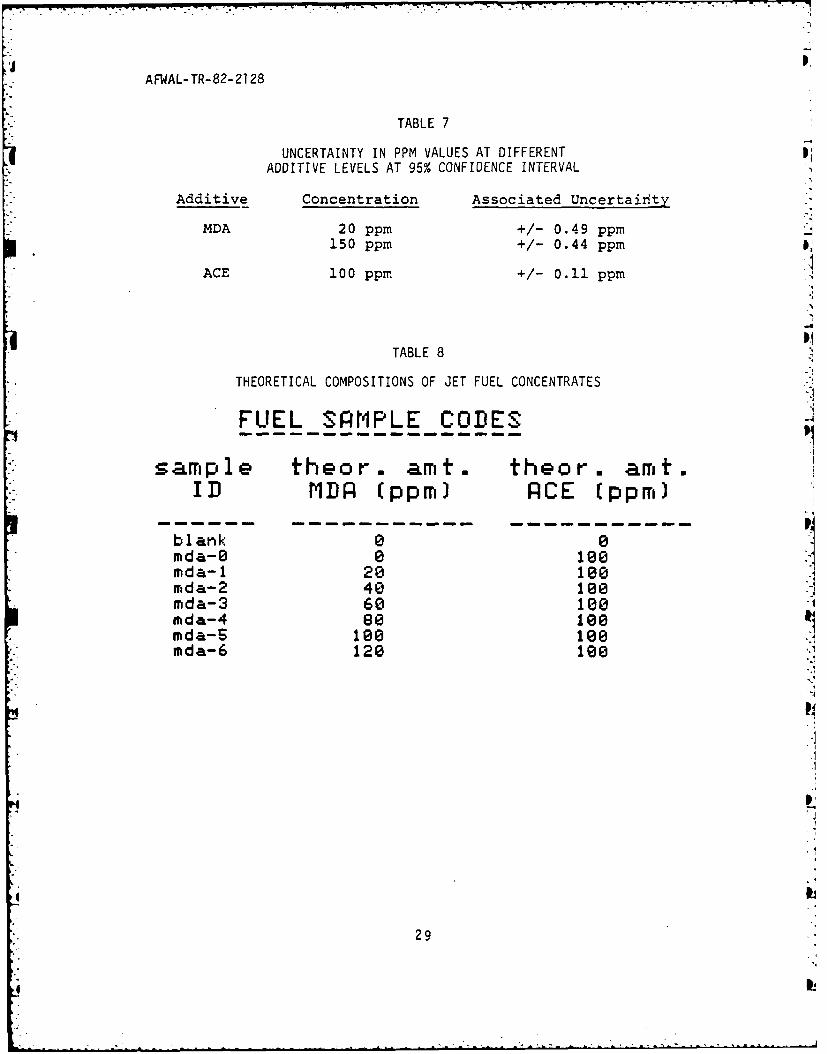
7 Uncertainty in PPM Values at Different Additive
Levels at 95% Confidence Interval 29
8 Theoretical Compositions of Jet Fuel Concentrates 29
9 Recovery Percentage for Concentration Step (ACE) 30
10 Recovery Percentage for Concentration Step (MDA) 31
11 MDA Determinations after Recovery Corrections 32
vii
AFWAL-TR-82-21 8
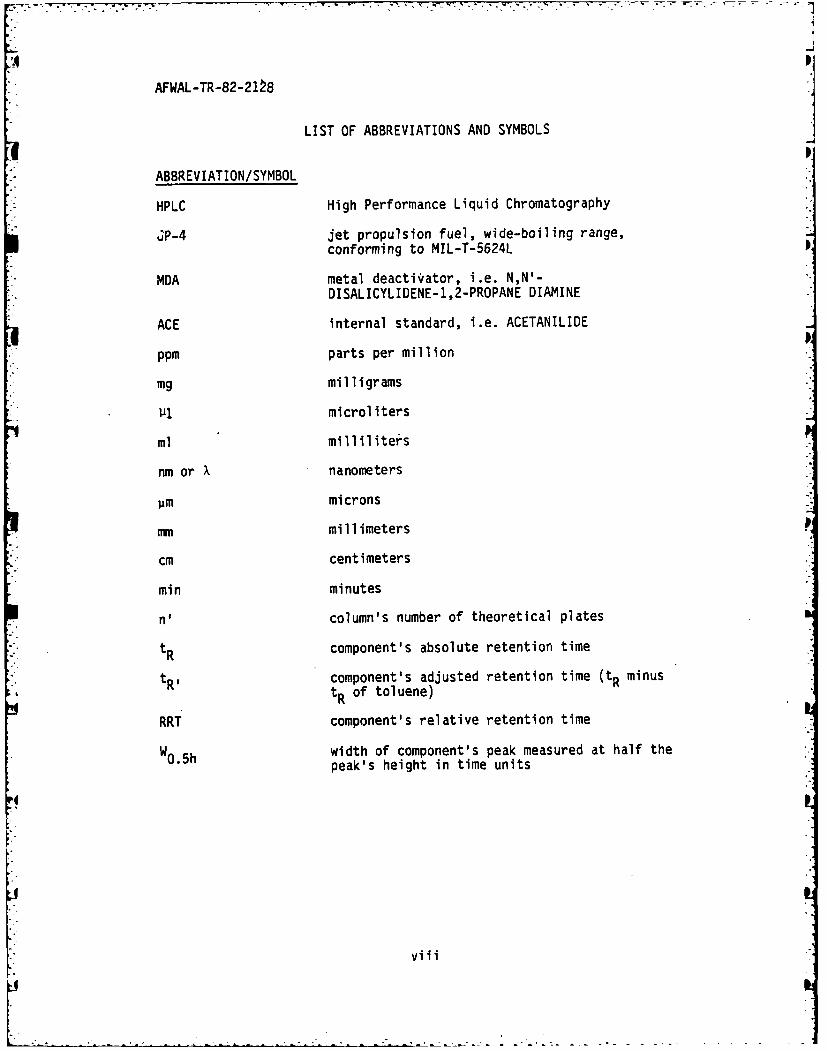
LIST OF ABBREVIATIONS AND SYMBOLS
ABBREVIATION/SYMBOL
HPLC High Performance Liquid Chromatography
P-4 jet propulsion fuel, wide-boiling range,conforming to MIL-T-5624L
MDA metal deactivator, i.e. N,N'-DISALICYLIDENE-1,2-PROPANE DIAMINE
ACE internal standard, i.e. ACETANILIDE•p
ppm parts per million
mg milligrams
1.1 microliters
ml milliliters
nm or X nanometers
Jim microns
Imn millimeters
cm centimeters
min minutes
n' column's number of theoretical plates
tR component's absolute retention time
tR, component's adjusted retention time (tR minustR of toluene)
RRT component's relative retention time
Wo0.5h width of component's peak measured at half thepeak's height in time units
viii
AFWAL-TR-82-2128
SECTION I
INTRODUCTION
This study utilized High Performance Liquid Chromatography (HPLC)
for the determination of N,Nidisalicylidene-1,2-propane diamine (MDA), a
specific additive used by the United States Air Force in turbine fuels.
The end goal was to devise an analytical scheme for the qualitative
identification and quantitative determination of this metal deactivator
at a level specified not to exceed 5.8 mg/liter, i.e. 5.8 parts per
million (weight/volume) in JP-4 jet fuel. JP-4 is a wide-cut distillate
jet propulsion fuel conforming to Air Force Military Specification MIL-
T-5624L. The fuel may have one of two metal deactivators, MDA and N,N'-
disalicylidene-1,2-cyclohexane diamine (MDA'), but MDA is the more widely
used. However, no analytical method exists for directly determining MDA
or MDA' in jet fuels.
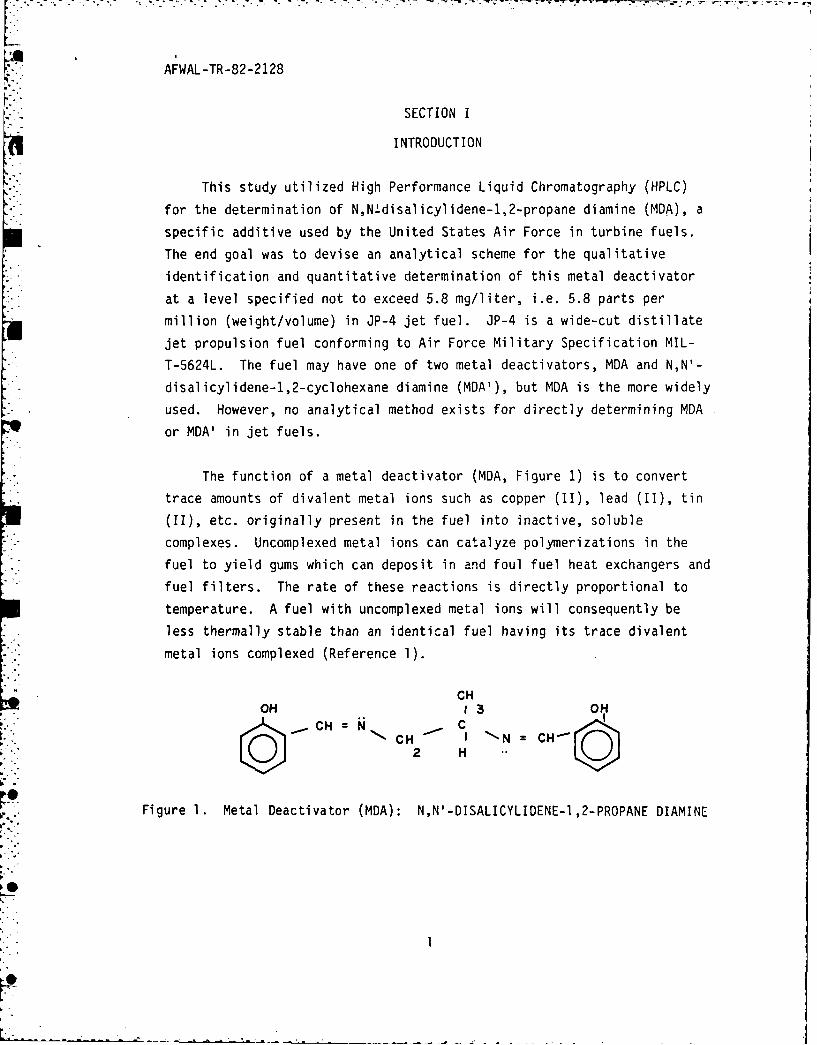
The function of a metal deactivator (MDA, Figure 1) is to convert
trace amounts of divalent metal ions such as copper (II), lead (II), tin
(II), etc. originally present in the fuel into inactive, soluble
complexes. Uncomplexed metal ions can catalyze polymerizations in the
fuel to yield gums which can deposit in and foul fuel heat exchangers and
fuel filters. The rate of these reactions is directly proportional to
temperature. A fuel with uncomplexed metal ions will consequently be
less thermally stable than an identical fuel having its trace divalent
metal ions complexed (Reference 1).
CCH
N CH N N =CH
2 H
Figure 1. Metal Deactivator (MDA): N,N'-DISALICYLIDENE-1,2-PROPANE DIAMINE
AFWAL-TR-82-2128
The analytical scheme as developed in this report will:
a) qualitatively identify the MDA in a preconcentrated fuel
sample by comparison of ultra-violet absorption data and relative
retention time data;
b) and quantitatively determine the MDA by using appropriate
calibration curves and a recovery standard.
HPLC was the analytical method of choice because of its high
sensitivity, good resolution, and speed, as well as its ready
adaptability to automation. Limiting factors in its use are the high
equipment costs and the considerable experience needed to achieve
reliable results.
2II
AFWAL-TR-82-2128
SECTION II
HISTORICAL
Since the analytical method of choice to identify and quantitate
the metal deactivator in JP-4 jet fuel was High Performance Liquid
Chromatography, a short digression into the nature of this technique and
its emergence to the forefront of analytical chemistry is warranted.
Tswett first recognized and interpreted the chromatographic process
based on his experiments using a chalk column to separate pigments in
green leaves. The term "chromatography" was coined by Tswett to
describe the colored zones that moved down the white column, i.e.
"colored writing." Within the last decade, suitable high pressure pumps,
efficient column packings, and sensitive low dead volume detectors have
catapulted HPLC into a rapidly maturing and valuable complement to gas
chromatography.
Chromatography is a wide-encompassing term describing a variety of
separation techniques wherein a solute partitions between a moving phase,
which can be a gas or liquid; and a stationary phase, which may be
either a liquid or a solid. The form of chromatography used in this
research was partition chromatography. The solute partitions between two
immiscible solvents, one of which is fixed, i.e. stationary, and the
other is the mobile phase. As the demand increased for more durable
columns, packings with the stationary phase chemically bonded to the
inert support were developed. This form of partition chromatography is
called bonded phase chromatography. The commercially available column
utilized in this study was of the bonded phase type with an aliphatic
amine chemically bonded to the silica support. Packings based on
silylation reactions have prevailed since the -Si-O-Si (siloxane) bond is
very stable in most chromatographic solvents. These packings are
generally stable in the pH range 2-7.5 and temperatures as high as 70°C
have been useable. When the stationary phase is more polar than themobile phase, as in this research project, the chromatographic technique
LLis called normal bonded phase chromatography (Reference 2).
73
AFWAL-TR-82-2128
Bonded phase packings offer distinct advantages over other
packings:
a. Irreversible retention is less likely, since the very polar
silanol groups (-Si-OH) have been converted to less polar linkages (-Si-
O-Si-R);
b. No water for silica deactivation is necessary;
c. Solvent equilibration is rapid;
d. The packing materials are compatible with a wide assortment of
HPLC solvents;
e. Selectivities are different for different polymeric phases.
Typical solvents used as mobile phases are mixtures of hydro-
carbons, methylene chloride, tetrahydrofuran, etc. In these nonaqueous
phases, a few percent of acid, e.g. acetic or phosphoric, may be added
to suppress ionization and tailing of polar compounds, without damaging
the column.
The heart of the chromatographic system is the column. It contains
a stationary phase which in the case of this study was chemically bonded
to a solid inert material called the support. The sample to be analyzed
was injected into the column and moved across or through the stationary
phase, being pushed along by the liquid mobile phase. Oftentimes,
several atmospheres of pressure are required to elute the entire sample
in a reasonable time. This is why HPLC is also called High Pressure
Liquid Chromatography. In the form of liquid chromatography utilized in
this research study, the various components in the injected sample were
separated according to their degree of solubility in the stationary
phase. Simply, it is a case of "like dissolves like." For a polar
bonded phase column, polar compounds such as the metal deactivator are
held or retained in the polar stationary phase longer than the relatively
less polar aromatic hydrocarbons in the fuel matrix. Thus the MDA is
4
AFWAL-TR-82-2128
separated from the relatively less polar aromatics, and for that matter,
the even less polar saturated and olefinic hydrocarbons. The fuel
hydrocarbon matrix was hardly delayed at all; essentially, it did not
notice the presence of the stationary phase and eluted from the column at
almost the speed of the mobile liquid phase. The more polar MDA wasretained considerably longer. When the MDA finally did elute from the
column, it was identified and measured quantitatively by the variable
wavelength ultraviolet detector.
IL
5
I-
AFWAL-TR-82-2128
SECTION III
CURRENT RESEARCH
1. EXPERIMENTAL
a. Instrumentation
The basic analytical instrumentation utilized in this studywas the Varian Model 4200 Liquid Chromatograph equipped with a Varian
VARISCAN Model 635 variable wavelength ultraviolet detector with flowcells designed for liquid chromatography. All injections were performed
automatically with a Varian 8000 AutosaImple. A Spectra-Physics ModelAuto-Lab System IV Computing Integrator initiated the injection sequence
and collected the data with the calculations printed in report format on
a Teletype Corporation "Teleprinter" Model ASR-33.
b. Liquid Chromatographic Conditions
A Whatman Partisil 10 PAC was used in this work and exhibited
the following specifications: oarticle size of 10.0 um, column length of
25 cm, column internal diameter of 4.6 mm, and a stationary liquid phase
of a polymeric aliphatic amine bonded to silica gel. The optimizedmobile phase composition (by volume) for this method was 97% methylene
chloride and 3% glacial acetic acid. These solvents were the "distilled-in-glass" grade (Burdick and Jackson, Inc.) and used as is. The flow
rate of the mobile phase was 1.0 ml/min, requiring a back pressure
through the column of 350 psig. Other HPLC operating parameters were as
follows:
(1) Temperature of the column was maintained at 250C via a
water jacket through which distilled water was circulated and temperature
controlled by a Haake Model E-52 Heater/Circulator installed in a Varian PModel 4000 constant temperature bath chamber;
(2) The variable wavelength ultraviolet detector was alsothermostatted at 25°C for greater baseline stability at high detector
sensitivities;
6
- - ----
AFWAL-TR-82-2128
(3) The electrometer on the detector was set at 0.5
absorbance units full scale and attenuation, 1;
(4) Injection volume was fixed at 10 pI (calibrated sample
loop);
(5) The column was conditioned prior to usage to remove
interfering polar aromatic imp~rities at a flow rate of 2.0 ml/min for
four hours with isopropyl alcohol and reconditioned for another four
hours at the same flow rate with the mobile phase composition cited above
for the analysis (column outlet unattached).
(6) A Brownlee Labs guard column system was installed between
the injector and the column consisting of a high performance disposable
cartridge and a reusable holder to filter out harmful particles and
irreversibly adsorbed materials from the sample, along with dust, teflon
fragments from the injector valve, water, etc.
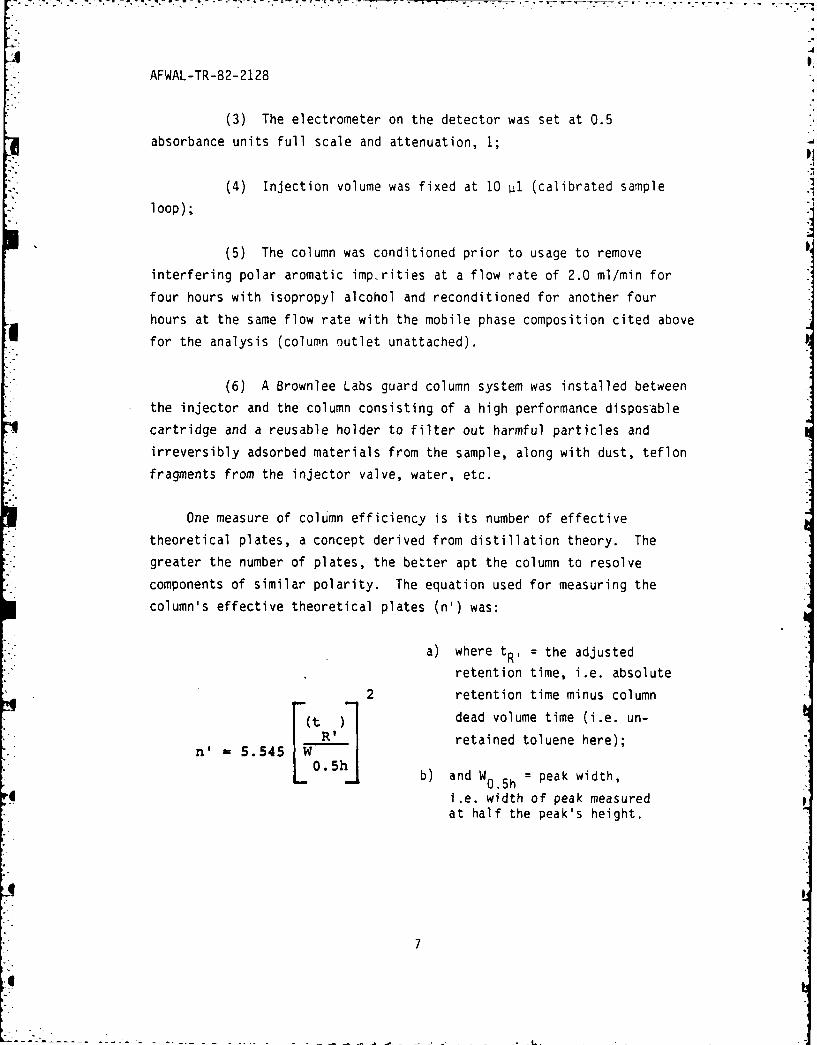
One measure of column efficiency is its number of effective
theoretical plates, a concept derived from distillation theory. The
greater the number of plates, the better apt the column to resolve
components of similar polarity. The equation used for measuring the
column's effective theoretical plates (n') was:
a) where tR, = the adjustedretention time, i.e. absolute
2 retention time minus column
(tR dead volume time (i.e. un-
retained toluene here);n'= 5.545
b) and W0.5h = peak width,
i.e. width of peak measuredat half the peak's height.
7
AFWAL-TR-82-2128
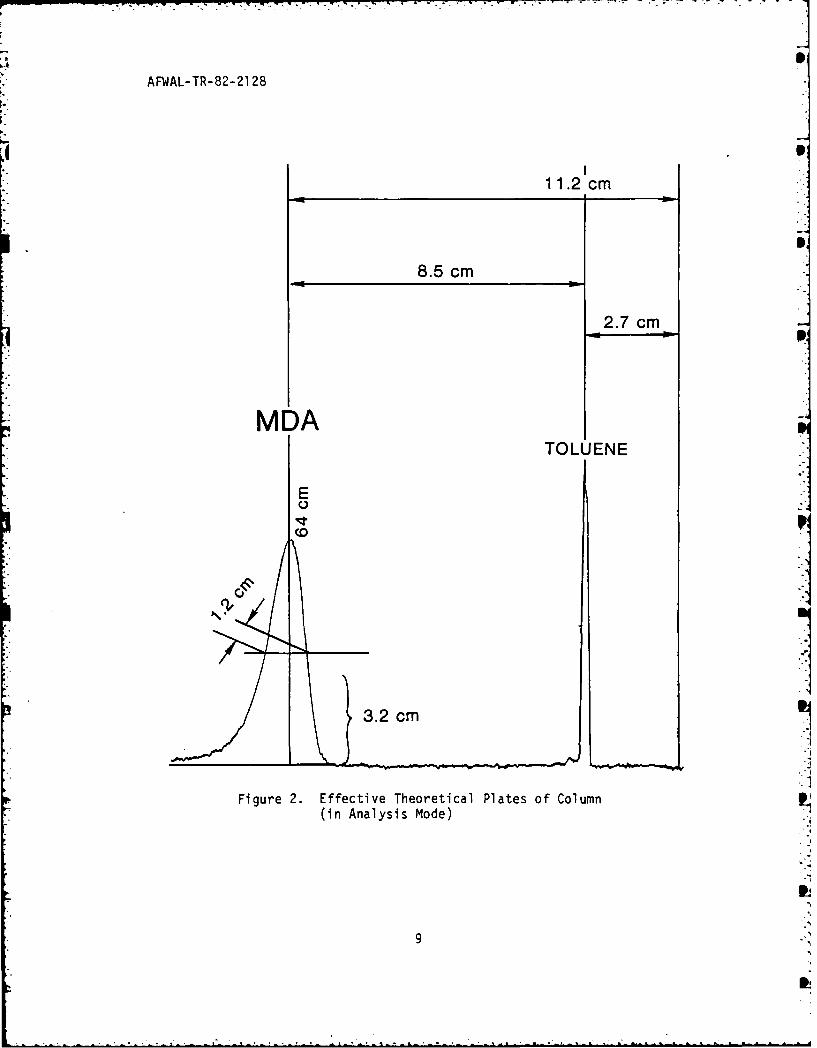
The sample analyzed to determine column efficiency was a ten
microliter injection of toluene and MDA dissolved in hexane to 100 ppm
each and run at ambient conditions in the above mobile phase at the
above flow rate (Figure 2).
From Figure 2, 2
(12 cm -2.7 cm)n' 5.545 1. cm)
The effective theoretical plates were determined from this run to be
approximately 275 for MDA.
c. Concentration Step
Two hundred milliliter samples of JP-4 containing neither
deactivator nor internal standard were doped with MDA in the range of 0-
6.0 ppm, the upper limit conforming with MIL-T-5624L. In addition, an
internal standard, acetanilide (ACE) was added to each sample to a con-
centration of 5.0 ppm. The fuel samples were then evaporated at about
2180C under a gentle stream of nitrogen (i.e. 100 ml/min). The fuel
residue, approximately 5 ml, was transferred via a Pasteur pipette to a
10 ml volumetric flask and diluted with methylene chloride to the mark.
In this manner, a scale up factor of 20 in concentration was realized
for both the MDA and the ACE.
In summary, these synthetically prepared JP-4 fuel samples, after
the 20-fold concentration increase, should theoretically range from 0.0
to 120.0 ppm for MDA and be 100.0 ppm for ACE. Subsequent calibration
curves were generated using standard solutions that simulated these final
concentrations for MDA and ACE.
8
AFWAL-TR-82-2128
11.2 cm
8.5 cm
2.7 cm
MDATOLUENE
E
CD
______ 13.2 cm mFigure 2. Effective Theoretical Plates of Column P
(in Analysis Mode)
9
AFWAL-TR-82-2128
2. QUALITATIVE IDENTIFICATION METHODS
a. Relative Retention Time
(1) Background
The chromatographic behavior of a component of interest
can provide information on its identity. Simply matching absolute
retention times of the metal deactivator concentrated from an actual fuel
sample with that of the pure standard is a good indication of its
identity. The absolute retention times of a particular component or peak
is the time from injection to the peak maximum, as displayed on the
recorder or logged by an integrator. The same compound on the same
column under exactly the same conditions should have the same absolute
retention time. However, slight deviations in any of the operating
conditions or for that matter, the quality or state of the column, can
change this absolute retention time. Also, it is possible for different
compounds to exhibit identical retention times.
For these reasons, the determination of the retention time of the
MDA relative to a chemically similar reference compound was preferred
since it is far more reliable and repeatable from day-to-day, as will bedemonstrated in this report. Whatever alters the retention time of the
reference component will also affect other like components in a similar
manner. Values for MDA's relative retention time are dependent only upon
temperature and composition of the column and the eluent. If these are
kept constant, so are the relative retention times. There are, however,
several requirements for the successful employment of an internal
reference compound:
(a) It must be completely resolved from the component of
interest;
(b) It must be similar in concentration to the peak of
interest;
(c) It must not react or decompose in the chromatographic
system;
(d) It must elute near the peak of interest.
10
AFWAL-TR-82-2128
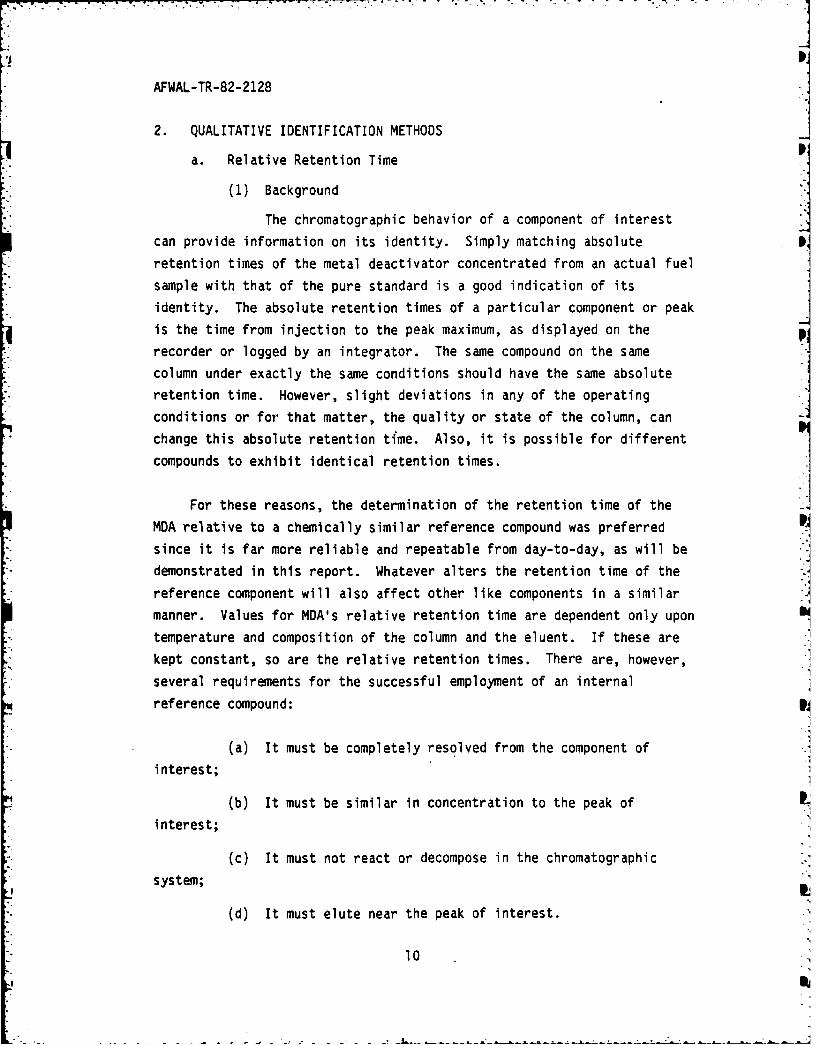
After considerable trial and error, a suitable reference standard wasfound in research grade acetanilide (ACE), purchased from Coleman
Instruments, Division of Perkin-Elmer (Figure 3).
0
CH C-N-~
H
Figure 3. ACETANILIDE (ACE)
(2) Calibration Standards Data
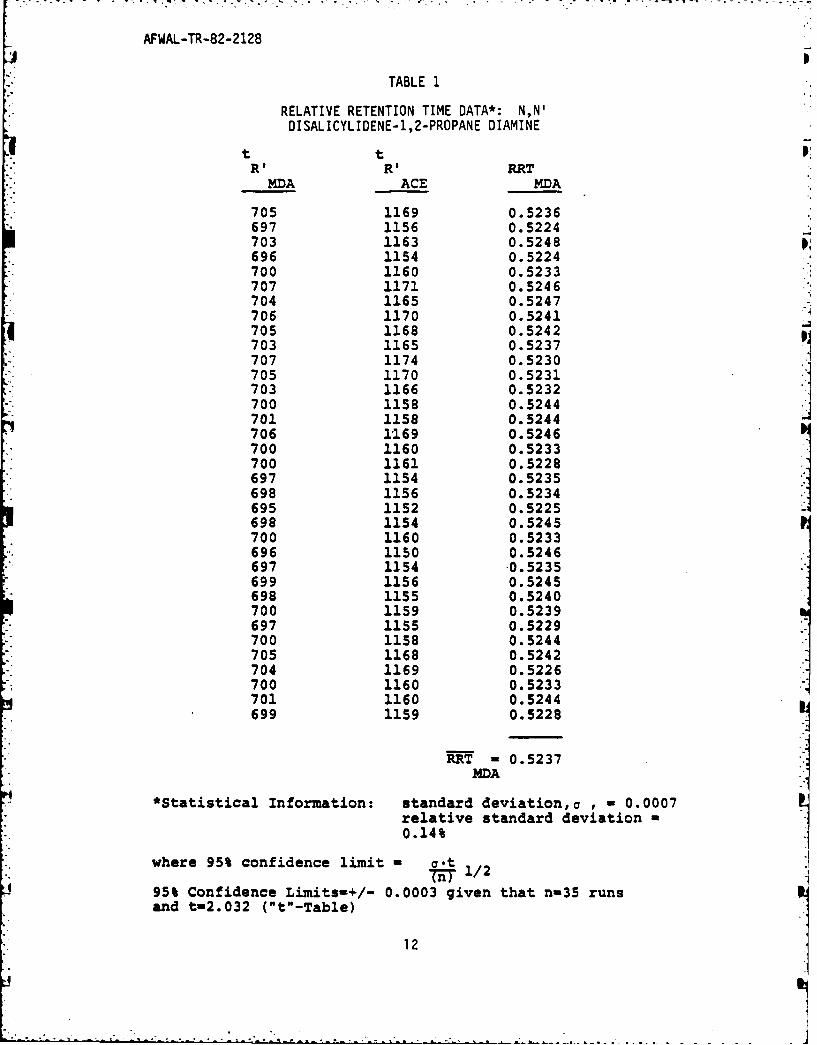
Table 1 is a compendium of relative retention times derived from
calibration blends containing MDA and ACE (see Section 3. "Quantitative
Determination" for experimental details).
The equation used for measuring MDA's relative retention time was:
where tR1 = the adjustedt
RRT = R' MDA retention time, i.e. absoluteMDA t retention time minus column dead
R' ACE
time (for unretained toluene).
All sample preparations were chromatographed five times over a three day
period. The relative standard deviation and 95% confidence limits are
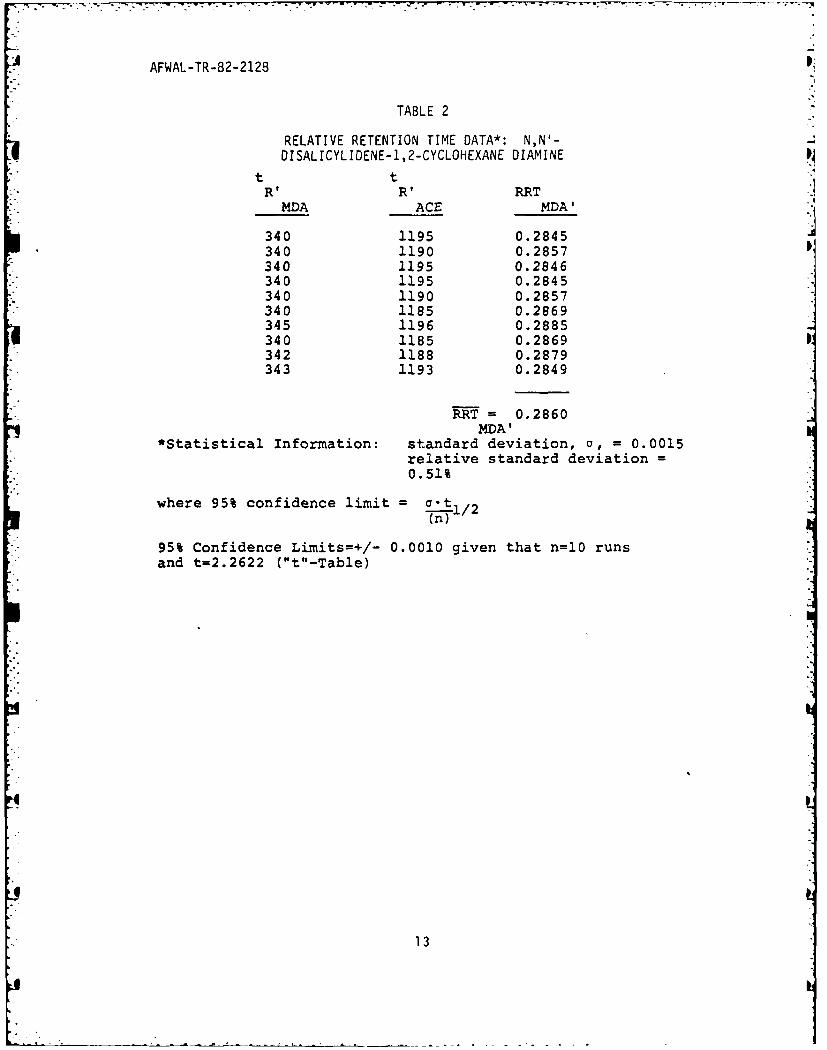
also displayed in Table 1. Table 2 lists the relative retention time
data for the other accepted metal deactivator, N,N'-disalicylidene-l,2-
cyclohexanediamine. Obviously, this column flowing with this mobile
phase could resolve the two metal deactivators in the highly unlikely
event that they were present in the same fuel sample.
11
AFWAL-TR-82-2128
TABLE 1
RELATIVE RETENTION TIME DATA*: N,N'DISALICYLIDENE-1,2-PROPANE DIAMINE
t tRp R1 RRT
MDA ACE MDA
705 1169 0.5236697 1156 0.5224703 1163 0.5248696 1154 0.5224700 1160 0.5233707 1171 0.5246704 1165 0.5247706 1170 0.5241705 1168 0.5242703 1165 0.5237707 1174 0.5230705 1170 0.5231703 1166 0.5232700 1158 0.5244701 1158 0.5244706 1169 0.5246700 1160 0.5233700 1161 0.5228697 1154 0.5235698 1156 0.5234695 1152 0.5225698 1154 0.5245700 1160 0.5233696 1150 0.5246697 1154 0.5235699 1156 0.5245698 1155 0.5240700 1159 0.5239697 1155 0.5229700 1158 0.5244705 1168 0.5242704 1169 0.5226700 1160 0.5233701 1160 0.5244699 1159 0.5228
RRT 0.5237
MDA
*Statistical Information: standard deviation,o , - 0.0007relative standard deviation -0.14%
where 95% confidence limit - 0-t-rn 1/2
95% Confidence Limits-+/- 0.0003 given that n-35 runsand t-2.032 ("t"-Table)
12
AFWAL-TR-82-2128
TABLE 2
RELATIVE RETENTION TIME DATA*: N,N'-DISALICYLIDENE-1,2-CYCLOHEXANE DIAMINE
t tR' R' RRTMDA ACE MDA'
340 1195 0.2845340 1190 0.2857340 1195 0.2846340 1195 0.2845340 1190 0.2857340 1185 0.2869345 1196 0.2885340 1185 0.2869342 1188 0.2879343 1193 0.2849
RRT= 0.2860MDA'
*Statistical Information: standard deviation, a, = 0.0015relative standard deviation =0.51%
where 95% confidence limit =aoti.(n)
95% Confidence Limits=+/- 0.0010 given that n=10 runsand t=2.2622 ("t"-Table)
13
AFWAL-TR-82-2128
b. Absorbance Ratioing J(1) Background
Although the relative retention time data exhibited
excellent repeatability, RRTMDA is not sufficient to positively identify
particular peaks, since the data is characteristic, but not definitive.
To significantly increase the validity of the qualitative assignment of
the metal deactivator peak, absorbance ratioing with a variable
wavelength spectrophotometric HPLC detector was introduced.
Absorbance ratioing can be used to significantly improve the
component assignment reliability (Reference 3-6). If rat os of both
standards and sample components match, purity and identity can be
confirmed. If absorbance ratios fail to match, it is highly probable
that the compound has been improperly identified or that the component of
interest is unresolved from a contaminant. This latter case also
results in erroneous quantitative information, thus the absorbance
ratioing method can be viewed as essential in obtaining accurate
quantitative analyses.
An ultraviolet spectrum of a component in a complex mixture is a
good "fingerprint" of that compound but taken alone is difficult to
interpret accurately. More precise information can be gained from
absorbance ratios at several different wavelengths. These ratios, when
obtained under standard conditions, are absolutely specific for a given
compound and can be used to identify it and determine its purity. By
stopping the column flow while the compound of interest resides in the
detector cell, the concentration of the compound remains constant, and if
Beer's Law is followed, a linear relationship exists between absorbance
and concentration. Absorbance ratios, then, are actually ratios of
extinction coefficients (Reference 7). The Varian HPLC system previously
described is capable of stopflow operation. Flow is halted simply by
closing a valve located near the column inlet. This action maintains the
14
AFWAL-TR-82-2128
pump's original operating pressure, but isolates the column. The
procedure is relatively simple for determining absorbance ratios:
(a) As the peak elutes, it is isolated or "trapped" in the
flowcell of the spectrophotometer by stopping the flow,
(b) The computing integrator's microvolt level is recorded at
a given wavelength,
(c) The wavelength selector is carefully reset at another
wavelength and the level recorded,
(d) This process is repeated enough times to accumulate data
for five ratios relative to the generally used 254 nm,
(e) The original wavelength is reset and the peak allowed to
elute,
(f) After the baseline is re-established, backgroundmicrovolt levels are obtained at each wavelength (to be subtracted from
the corresponding sample readings).
Wavelengths were selected to include: a general wavelength, i.e. 254
nm, where many aromatic compounds have some absorption, a lower
wavelength, i.e. 244 nm, where most aromatic compounds have stronger
absorption, and several other wavelengths up to nearly 300*nm. It is
crucial to determine the ratios for three or more wavelengths, because it
is quite possible for the ratios to match for any two wavelengths.
However, it is highly unlikely for ratios to match at three or more well-
resolved wavelengths.
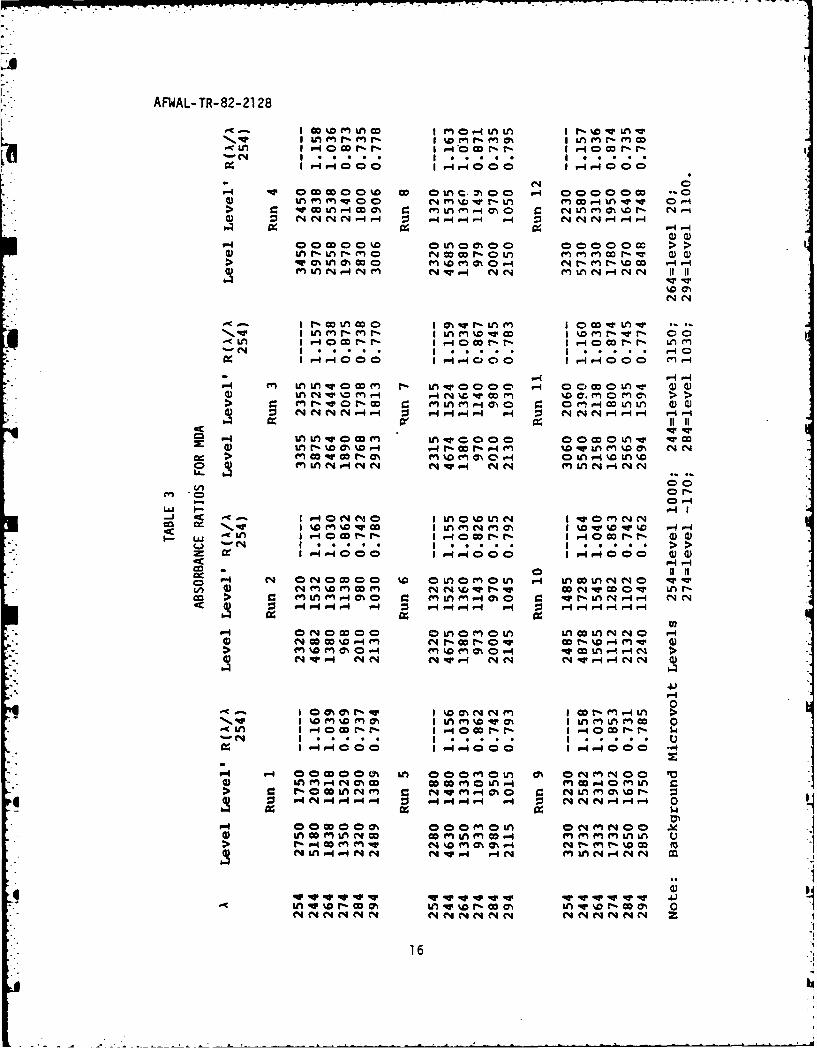
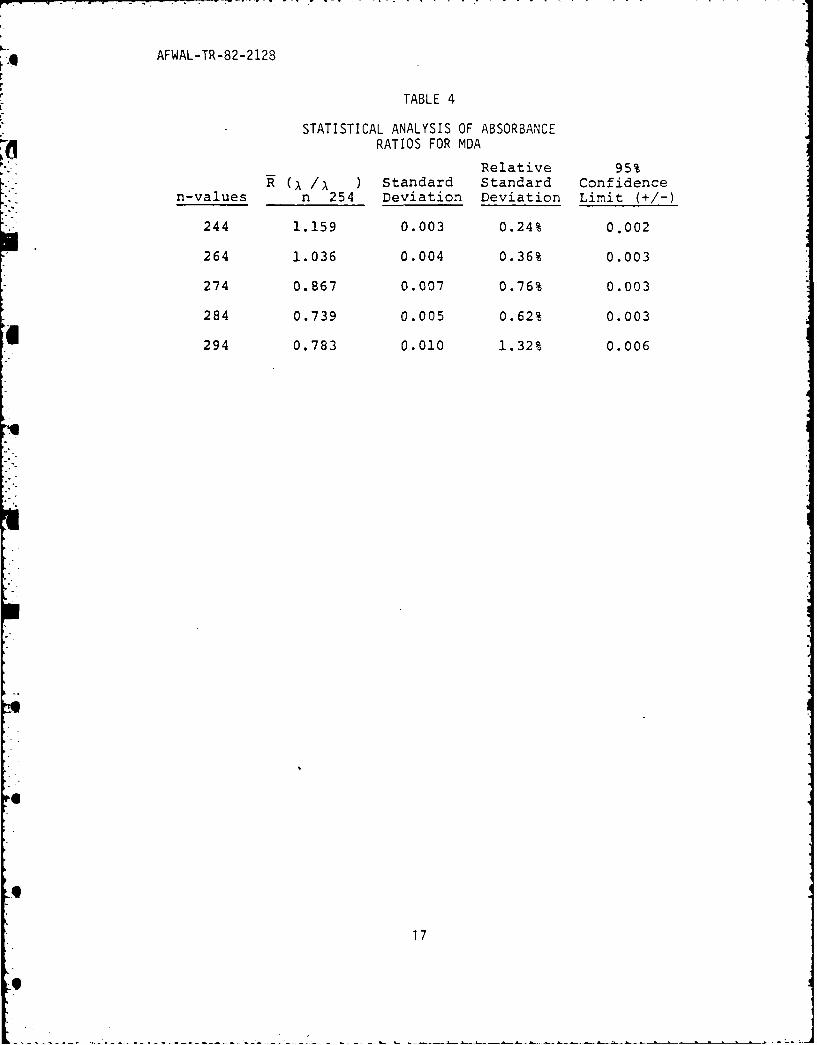
(2) Calibration Standards Data
Table 3 is a compilation of runs of a 100 ppm
standard solution of MDA , and Table 4 is a statistical analysis of that
data. The flow was randomly stopped at various sites on the leading,
crest, and tailing edge of peaks. Note, however, that the relative
standard deviations of the ratios were less than one percent, making
15
AFWAL-TR-82-21 28
C ~ ~ ~ ~ ~ o Iu0cor r - or- fl-t4 0 .* * . . . . . . . I
I (%4 0-
V- In Q,~o~ m Ouc 0 C V-1 0000000 *.C%Af q 0 m V wr-L e c 4 n-W. 0-4
0 N N N N r4 qr-4r-4-I P- r- 'I - -
N0- O- -4-4
IVor1I 00w
> wON) 0 M Wt4.1 M M-i-..i- 0.-4 N ( - - % G 4 -4
0 ) M Ln 04 N m N4w - NML N VC1 4C4" 1
0! 0 C r -4
r4.. 0 Iv-4-0 00 14 -4 0 0 Q 0en0.)F-I -4
e-4L -w C( 0~ Go mL OM u Q. 0 AI 0 O At tL0 W 4 Q)0) 4, z r.t ,q -W cowo mu0aMr- %
4 .- ,4I- 4 :1 -4 4 -1-4 p.4 N - - - - -
cU)in O 0 Leuocon oI"C 0Q UOtCO e-W4T0
0)M n ~- (4eqN -4N N m V)- N~(' f-4 N~ N
U- -4C 0 r
I 'DMDt1O C C410O I4 l01If 0 nC% n 4e
-ti do . cc r. . . . I *- * *o *- *
1F-IOOO CC 1 -4C 0 -4 F-4 0 0 Q )
o >) m Lm m..4 i-l.M-4 M p4 -4- m p-.r4L r~~t' 4 4 0
r-4P- 4 Pe4~ -I jr.4 -I 0- - - jr1r.
F- 0 ~ ~ ~ qq co 0 ' mom nL cLneW oG D0- -G r, -W ~ CO~~~' 0 aM4M-
4)NIW4 N N q4 4I N W4'F4 N N
t Chcri - -wI c r- n 4L16
AFWAL-TR-82-212B
TABLE 4
STATISTICAL ANALYSIS OF ABSORBANCERATIOS FOR MDA
Relative 95%(. /I ) Standard Standard Confidence
n-values n 254 Deviation Deviation Limit (+/-)
244 1.159 0.003 0.24% 0.002
264 1.036 0.004 0.36% 0.003
274 0.867 0.007 0.76% 0.003
284 0.739 0.005 0.62% 0.003
294 0.783 0.010 1.32% 0.006
17
6
o ..
]p
AFWAL-1 R-82-2128
absorbance ratioing an acceptable criterion for the qualitative
identification.
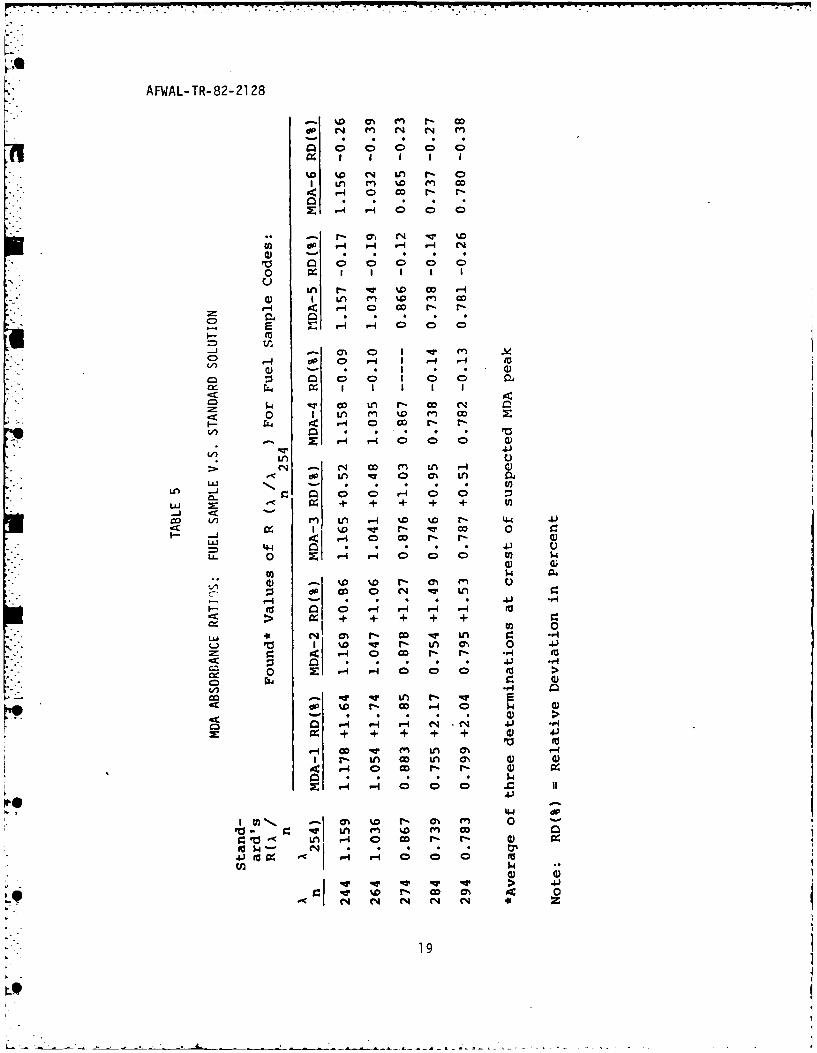
c. Jet Fuels Analysis Data
Having measured peak ratios for pure MDA at 100 ppm level, the
concentrates of six jet fuel samples were examined for MDA presence via
the above procedure (see subsection 3 "Quantitative Determination" for
experimental details). Variations of more than about 2% relative
standard deviations in peak absorbance ratios compared with the above
standard solution of MDA is supposed to be an indication that a
component is not MDA (Reference 3). However, Table 5 shows the
excellent agreement of ratios comparing MDA in the standards and thefuel samples. The averaged absorbance ratios for each wavelength arelisted next to the corresponding ratios for the MDA peaks tentatively
identified by relative retention times in the six fuel samples. Of all
the fuel samples analyzed, only one exceeded the relative standard
deviation limits of +/- 2.0% for the MDA standard average given in Table
1.
3. QUANTITATIVE DETERMINATION
a. Background
In any chromatographic analysis, the separation between the
component(s) of interest and interfering compounds must be optimized
before quantitation can be properly addressed. Previous work and
preliminary experiments with mobile phase compositions of varying
solvent polarity attempted to elute the MDA in a reasonable time whileensuring baseline resolution from the ACE as well as from the tailing
peak of the residual aromatic constituents of the evaporated fuel
sample. Peak tailing was minimized by spiking the methylene chloridemobile phase with glacial acetic acid. Blank runs of sample solvent as
well as JP-4 concentrate (without additives) indicated that potentially
interfering peaks that might co-elute with either the MDA or the ACE
were absent.
18
AFWAL-TR-82-21 28
S0 00 0> a
O'0C~4 kn r- 0i n M~ %D0 m' r -4 C0 co r r-
. .; . .
4) *n m *o *n
o I I I I I4
$4 -W co rn . cc M,
o 0 0 en %D n o
4-
P 0 n IV 0 n 0C0N. I - w
co Ln M ~ LA r- %D %D 0-(z %D 'w - - c
- -4 (D4 0o 0- 0
LA C; .);
%A 0- 01 0"-10
to C t
Io N L 0 ,
0) -. m. 0. N -W9 .
"-1 4 0 CO r- r . .4.) to
I. 0 0 0 1-4 >- - -
V))
0 d: %- 0 0 C - 0W >)
1 .4-4 4 0
S+ + + + + ) .)
r-4 CI tw M LA (7,I N% Ln Go LA m ~ 0)
": 4 9-4 0 0 0 ..41
'44 d
to 1w'. r
r4)0 %D I CD CN 0c 00
19
- -.- - .. ,- . --
AFWAL-TR-82-2128
In developing any multi-step analytical method, analyte losses
must be evaluated and minimized after each critical step. It wastheorized that since the polar characteristics of the MOA and ACE were
similar on this column and with this mobile phase under the above
operating conditions (see the previous subsection, "Qualitative
Identification Methods"),and since both components were relatively
involatile, losses in recovering the MDA due to improper handling,
precipitating out on the container walls, oxidation, etc. would be
comparable. Each fuel sample was doped with the same amount of ACE and
upon evaporation, the recovered ACE used as the indicator of the total
recovery of the MDA. The found amount of MDA was corrected for recovery
losses by a factor that was determined by the found amount of ACE.
Losses due to sampling were minimized. All MDA and ACE calibration
solutions were stored in a refrigerator maintained at 100C and
chromatographed within three days of their preparation. No degradation
of the MDA or of the ACE was noted as a function of time. All glass
containers were thoroughly washed with ALCONOX, and rinsed with distilled
water, followed by HPLC grade solvents. They were then oven dried and
placed in a dessicator for cooling and storage until use. The bottles
were subsequently silanized with "Glas-TREET" (Alltech Associates).
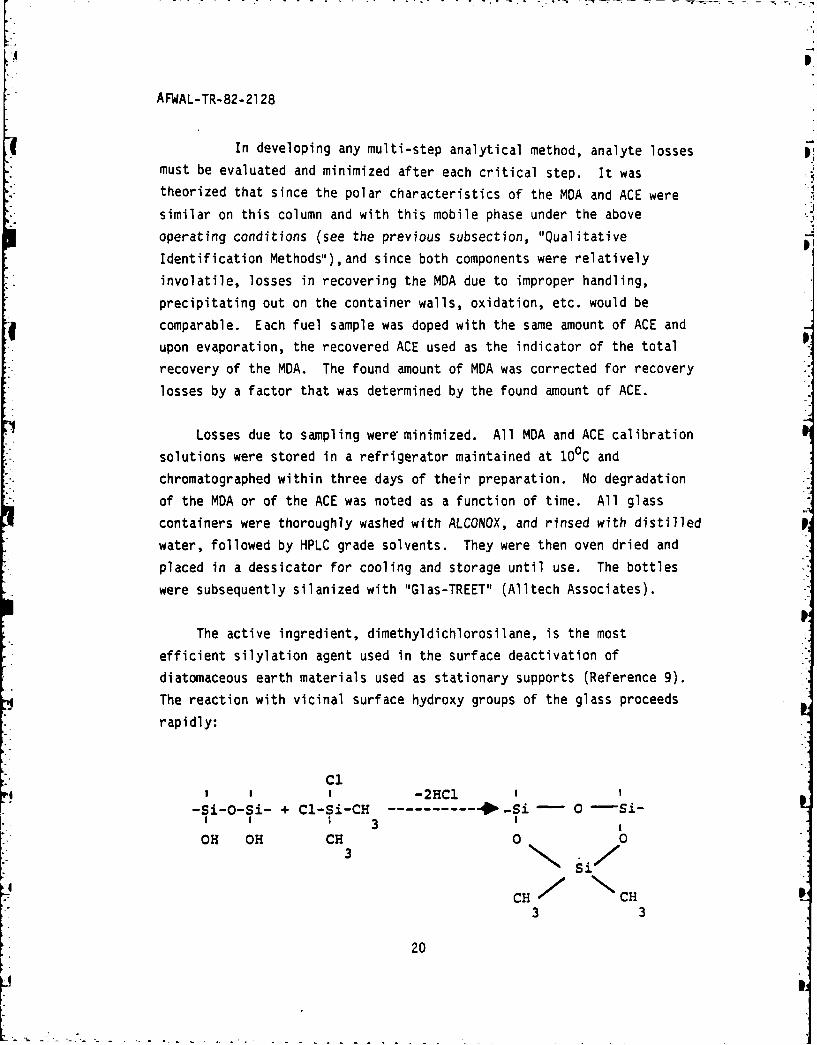
The active ingredient, dimethyldichlorosilane, is the most
efficient silylation agent used in the surface deactivation of
diatomaceous earth materials used as stationary supports (Reference 9).
The reaction with vicinal surface hydroxy groups of the glass proceeds
rapidly:
C14 oI -2HCl
-Si-O-Si- + CI-Si-CH ----------- -Si -0 - Si-I I I 3 n
OH OH CH 0 0
Si
CH NCH3 3
20
0
AFWAL-TR-82-2128
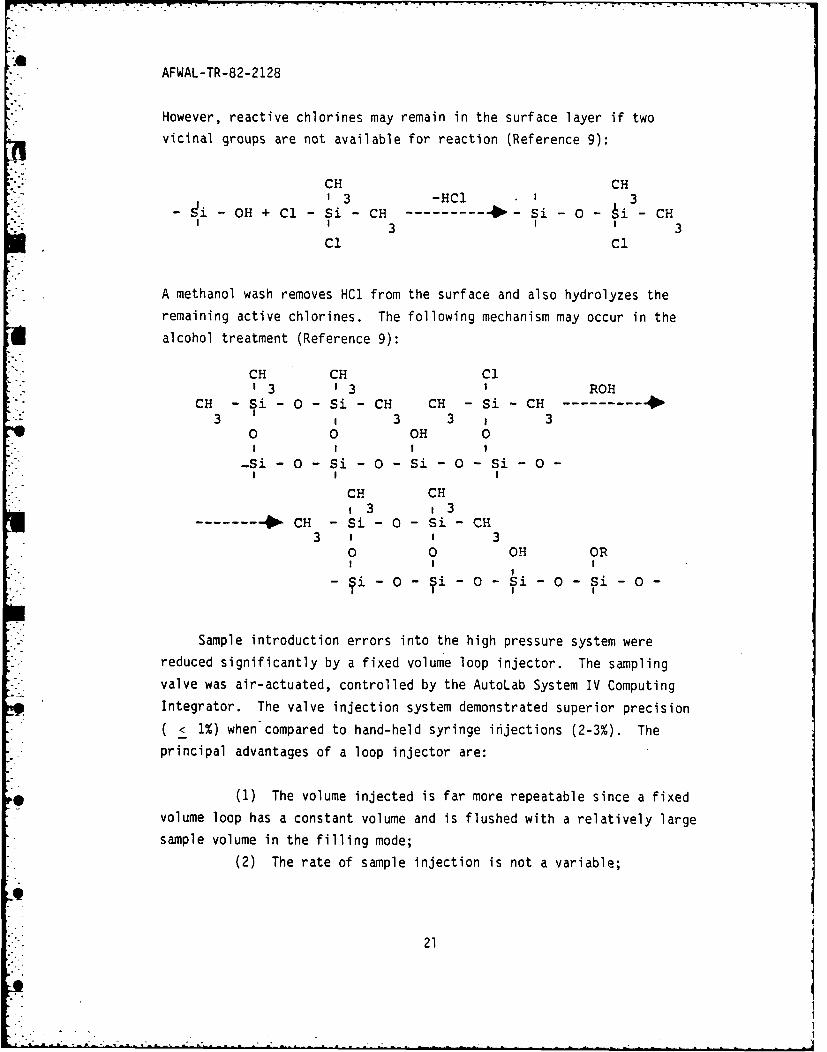
However, reactive chlorines may remain in the surface layer if two
vicinal groups are not available for reaction (Reference 9):
CH CHI 3 -HCI 1 3
- i-OH + C1 -Si -CH ---------- Si -O- CHl i3 i 3
Cl Cl
A methanol wash removes HC1 from the surface and also hydrolyzes theremaining active chlorines. The following mechanism may occur in the
alcohol treatment (Reference 9):
CH CH C1
1 3 1 3 1 ROHCH -Si -O -Si- CH CH -Si -CH ----------
3 I 3 3 I 3o 0 OH 0I I I I
-Si - 0 - Si - 0 - Si - 0 - Si - 0 -I I I
CH CH3 3
- - CH - Si - 0 - Si - CH3 i 1 3
0 0 OH OR! I I
- i -0- i -0 -Si -0 -Si- 0-
Sample introduction errors into the high pressure system were
reduced significantly by a fixed volume loop injector. The sampling
valve was air-actuated, controlled by the AutoLab System IV Computing
Integrator. The valve injection system demonstrated superior precision
< 1%) when compared to hand-held syringe injections (2-3%). The
principal advantages of a loop injector are:
(1) The volume injected is far more repeatable since a fixed
volume loop has a constant volume and is flushed with a relatively large
sample volume in the filling mode;
(2) The rate of sample injection is not a variable;
21
21
AFWAL-TR-82-2128
(3) Since the operator is removed from the sequence,
technique differences are avoided;
(4) The valve is automated and injection can be initiated at
precise intervals, thus maintaining constant state of column
equilibration.
Detection and quantitation of the separated MDA was achieved with a
variable ultraviolet detector. The sample concentrates were diluted in
the non-ultraviolet absorbing mobile phase to avoid over-saturating the
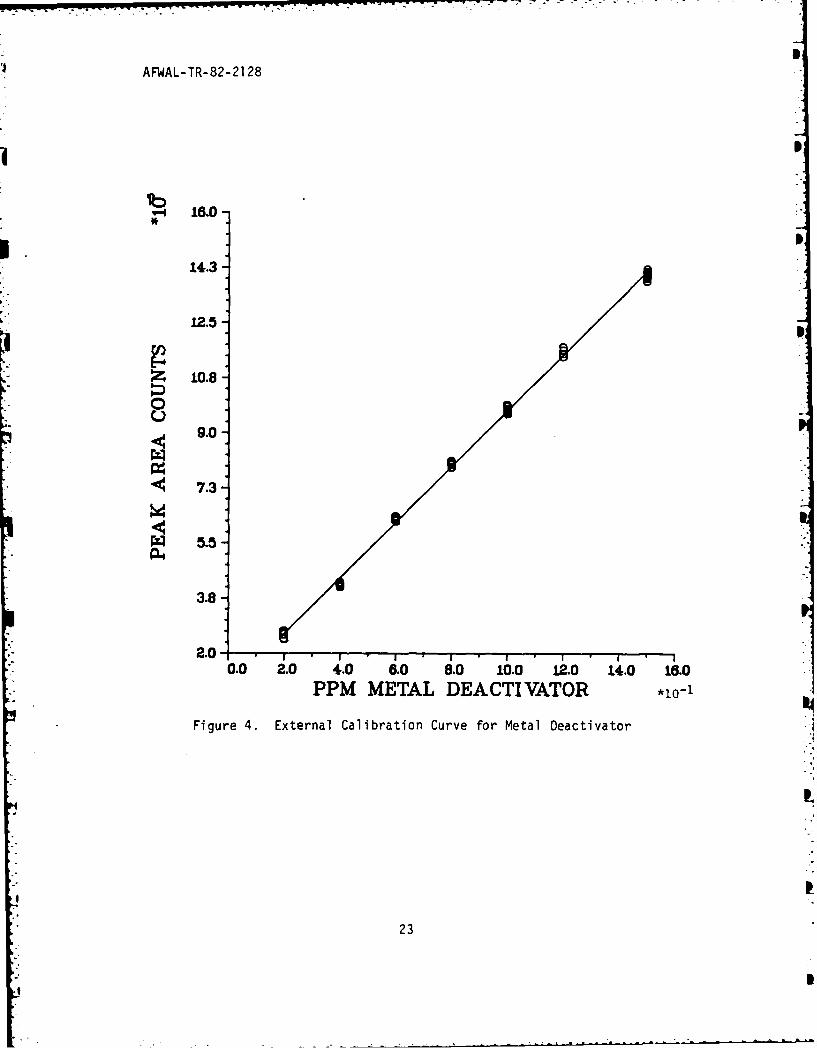
detector at high absorbances. Calibration curves (Figures 4 and 5)
generated for MDA and ACE confirm the excellent linearity in the ppmrange of interest to this analysis. Peak integration, as performed by
the AutoLab Computing Integrator, was merely the accumulation of
microvolt signals from the electrometer of the detector reported as area
counts.
Calculations to obtain the actual concentrations of MDA and ACE in
a fuel concentrate blend were simplified. Since injection volumes were
so repeatable, the external standardization technique of quantitation
could be employed. This method is the direct comparison of peak areas of
components in an unknown sample with the corresponding peak areas in
standard solutions. A calibration curve was generated for each component
from a series of known concentrations and the corresponding peak area
responses. In each case, a first order least squares curve fit provided
the equation of the line. A fuel sample was evaporated as described
above with exactly the same volume injected. The MDA and the ACE amounts
present were calculated from the respective peak areas substituted into
the equation for the calibration curve for that component.
b. Calibration Standards Data
The JP-4 base stock was analyzed for any trace MDA present
before preparation of the calibration standards. The actual fuel
concentrates (described in subsection 2) were filtered through an
unsilanized 0.45 micron syringe filtering assembly (Millipore Part No.
XX3001200) prior to introduction into the HPLC column.
22
AFWAL-TR-82-2128
*11b- 18.0-
14.3
12.5iL
Z 10.8
9.0
S 7.3-
3.8
2.0 * * * * ' , ,0.0 2.0 4.0 6.0 8.0 10.0 12.0 14.0 16.0
PPM METAL DEACTIVATOR *10-1
Figure 4. External Calibration Curve for Metal Deactivator
23
AFWAL-TR-82-21 28j
-88.0-
80.0-
Z 84.0-
0 &
4U
24.0
0.0 50.0 M0. 5.0 200.0PPM ACETA.NILI DE
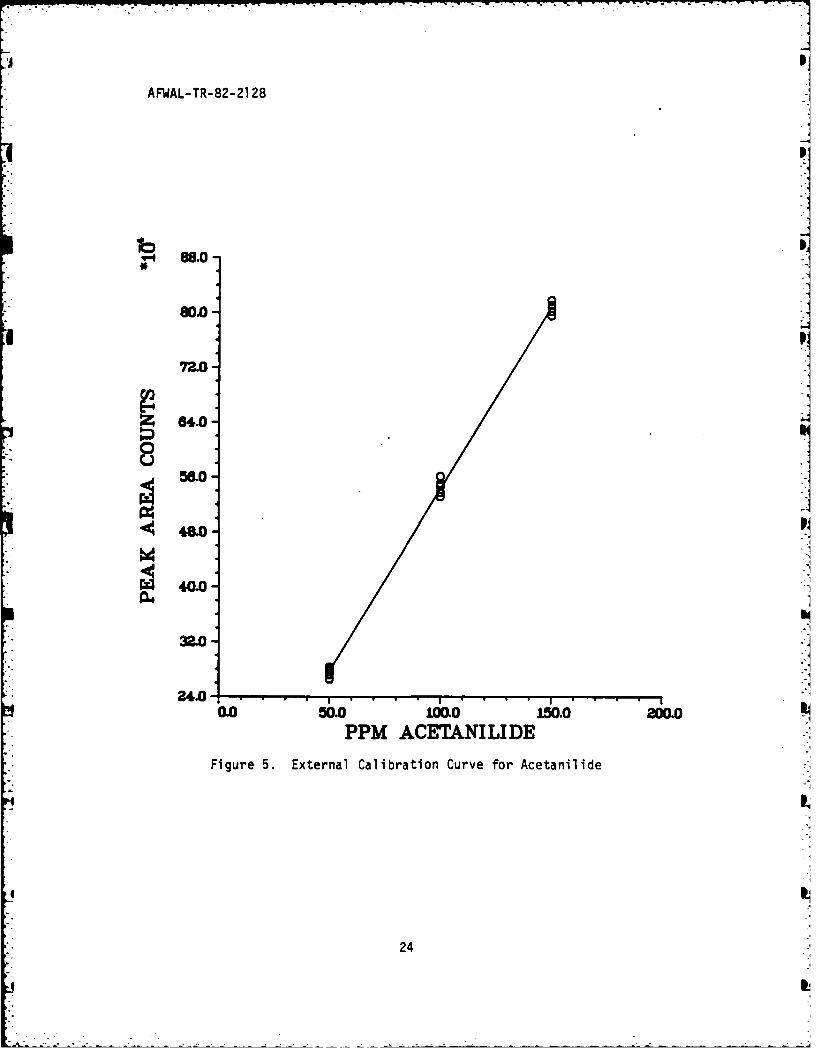
Figure 5. External Calibration Curve for Acetanilide -
M
42
*
AFWAL-TR-82-2128
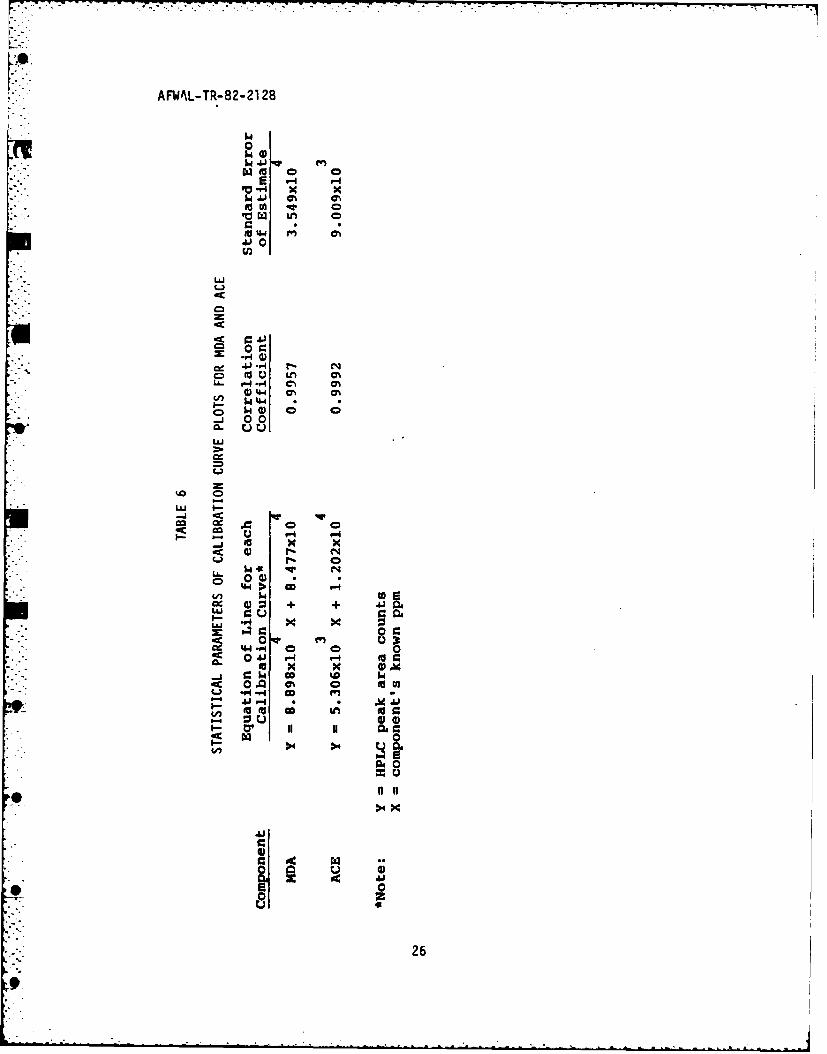
A series of blends containing MDA and ACE were prepared,
chromatographed, and peak areas calculated. Figures 4 and 5 are plots
of the results. Statistical analysis of this data by least squares
curve fitting gave correlation coefficients that approached unity (see
Table 6). With the linear equation for the unique calibration curve of
each component, the unknown fuel concentrates could then be analyzed for
MDA and ACE by substitution of the peak area counts from that run into
the appropriate calibration curve equation.
These equations were then rearranged so that the amount of MDA
additives in an unknown sample, i.e. "X," could be predicted via
interpolation given the appropriate area counts from its HPLC run, i.e.
"Y." The "standard error of estimate" cited in Table 6 has propeities
analogous to that of the standard deviation about a mean value. Lines
constructed parallel to each regression line, of "X" values (ppm of
component) for given "Y" values (peak area counts), at respective
vertical distance of one, two, and three standard deviations from it,
include 68%, 95%, and 99.7% of the data points. Small errors
(relatively) of estimate indicate precise, repeatable results.
Given the high degree of correlation, a statistical analysis was
performed on the calibration curves to predict the uncertainty in a
value of "X," i.e. ppm of component, associated with an observation orseries of observations on the dependent variable "Y," i.e. area counts
from integrator. The attendant equations employed and a description of
how they were obtained are included in the Appendix. The 95% confidence
intervals for the true value of the predicted ppm amount of MDA and ACE
at typical concentration levels are included in Table 7, as described in
the Appendix.
This table, in effect, states that if the MDA calibration curve
predicts that a given unknown solution has 150 ppm of MDA, there is a
95% probability that the true value lies between +0.44 ppm and -0.44 ppm
from that predicted value.
25
AFWAL-TR-82-21 28
0
IaLu 0
E1 0-
r. 41
.0
W .44 % C7%
-. ~~ 0 .W
uLJ
%.0 0
wi f-
- 4 0 IV, r (
V) $4 WE4) = + + 41 04
ui W4 xm 0
~ 44 "4 0 0 0cc 04J P- 0-4 oa
0 0M54-J ~ 54
oc 0.0 0% C IV( "q "I4 co en
it 0 cc LM tor
- uq u ) 4)
04 0
0 n.4j
0 0
26
AFWAL-TR-82-2128
c. Jet Fuel Analysis Data
(1) Background
As noted previously, two hundred milliliter samples of a
JP-4 jet fuel were doped with MDA to meet the Air Force fuel
specification limits for that additive. ACE also had been added to
eventually yield, upon evaporation, a level of 100 ppm in the fuel
concentrate. After the evaporation step, the MDA concentrations were
then comparable to those of the original MDA calibration curve. All the
fuel samples were evaporated down and the fuel residue transferred to a
10 ml volumetric flask and diluted to the mark with methylene chloride.
Recall that the ACE had been added prior to this 20-fold concentration
step to serve not only as a recovery standard but also as a relative
retention time standard. The concentrates were then chromatographed..
The results are shown in Figure 6, the theoretical compositions in
Table 8.
(2) ACE Recovery Results
The equation for the linear least squares line (see
Table 6) for ACE was rearranged so that its amount remaining in the
fuel concentrate, i.e. "X" could be predicted from the area counts of
that sample's HPLC run, i.e. "Y." Table 9 displays the average results
of the fuel samples containing both MDA and ACE. The ACE percentagerecovered was calculated by dividing the theoretical amount of ACE
present, i.e. originally added to the sample, into the found amount of
ACE predicted from the area counts of the HPLC run and the ACE
calibration curve, and multiplying that quotient by 100. The results
show a reasonably good recovery level of the ACE with good repeatability
of its determination from sample to sample. A similar table was
generated for the MDA results to check that approximately the same
relative amounts of MDA were being recovered as well. Table 10 lists
0 those results. The recovery of the MDA was not as high as for the ACE
but was on a level adequately comparable to that for ACE.
27
AFWAL-TR-82-21 28
cm- 41lz0
0
00ccC -
c0
0 u
28w
J[AFWAL- TR- 82-2128
TABLE 7
UNCERTAINTY IN PPM VALUES AT DIFFERENTADDITIVE LEVELS AT 95% CONFIDENCE INTERVAL
Additive Concentration Associated Uncertairity
MDA 20 ppm +/- 0.49 ppm150 ppm +/- 0.44 ppm I
ACE 100 ppm +/- 0.11 ppm
TABLE 8
THEORETICAL COMPOSITIONS OF JET FUEL CONCENTRATES
FUEL SPMPLE CODES
sample theor. amt. theor. amt.ID MDA (ppm] ACE (ppm)-- ~---- ----------- -----------
bl ank 0 0mda-0 0 180mda-1 20 100rmda-2 48 100mda-3 60 160mda-4 80 100mda-S 100 100mda-6 120 100
29
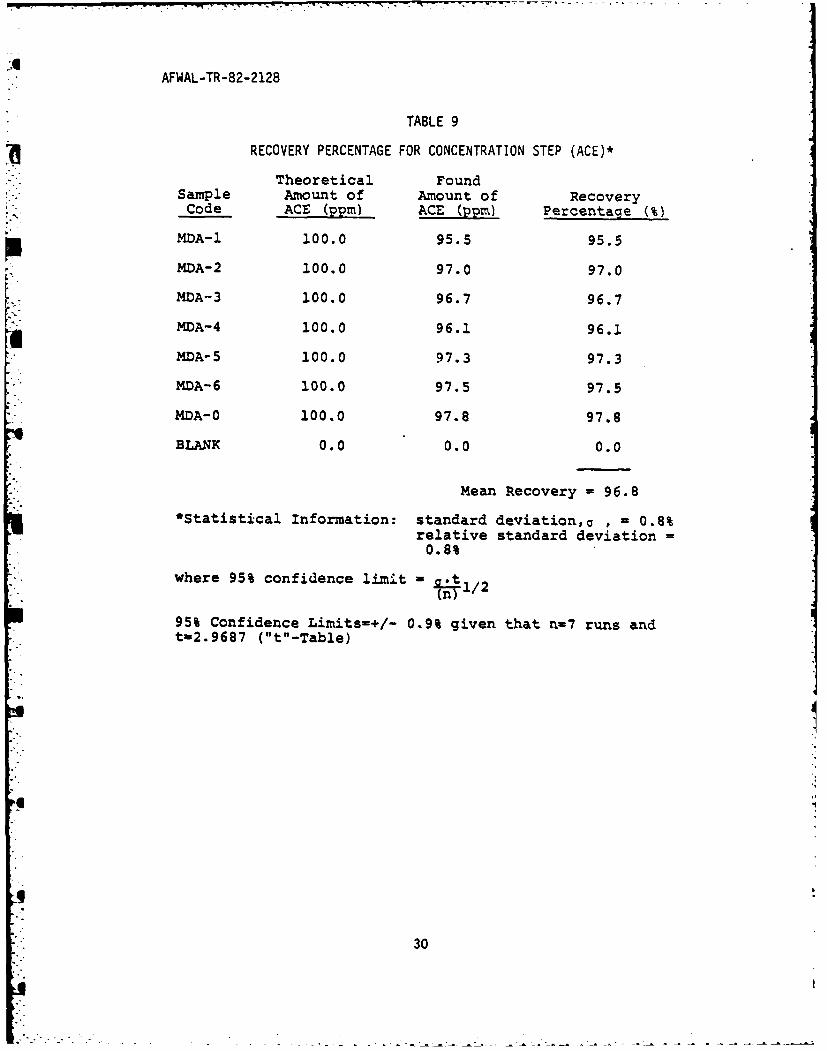
AFWAL-TR-82-2128
TABLE 9
RECOVERY PERCENTAGE FOR CONCENTRATION STEP (ACE)*
Theoretical FoundSample Amount of Amount of RecoveryCode ACE (ppm) ACE (ppm) Percentage (%)
MDA-I 100.0 95.5 95.5
MDA-2 100.0 97.0 97.0
MDA-3 100.0 96.7 96.7
MDA-4 100.0 96.1 96.1
MDA-5 100.0 97.3 97.3
MDA-6 100.0 97.5 97.5
MDA-0 100.0 97.8 97.8
BLANK 0.0 0.0 0.0
Mean Recovery = 96.8
*Statistical Information: standard deviation,c , = 0.8%relative standard deviation =0.8%
where 95% confidence limit =
95% Confidence Limits=+/- 0.9% given that n=7 runs andt-2.9687 ("t"-Table)
30
30
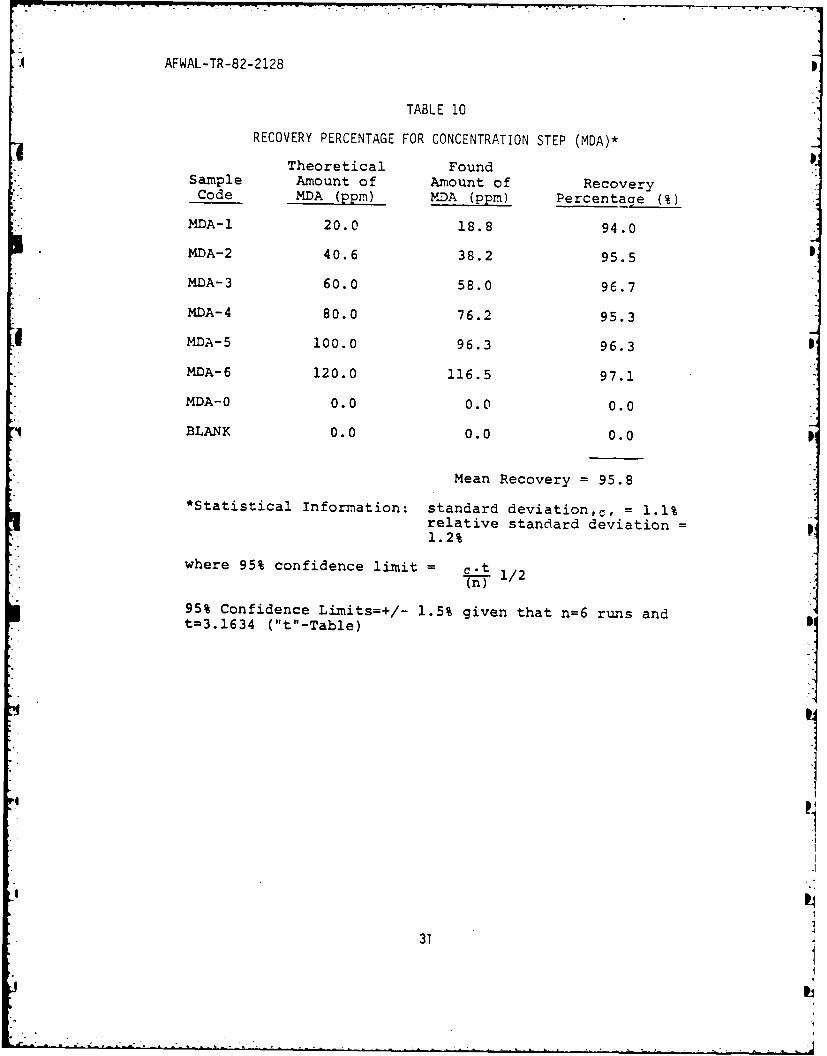
AFWAL-TR-82-2128
TABLE 10
RECOVERY PERCENTAGE FOR CONCENTRATION STEP (MDA)*
Theoretical FoundSample Amount of Amount of RecoveryCode MDA (ppm) MDA (ppm) Percentace (%)
MDA-l 20.0 18.8 94.0
MDA-2 40.6 38.2 95.5
MDA-3 60.0 58.0 96.7
MDA-4 80.0 76.2 95.3
MDA-5 100.0 96.3 96.3
MDA-6 120.0 116.5 97.1
MDA--O 0.0 0.0 0.0
BLANK 0.0 0.0 0.0
Mean Recovery = 95.8
*Statistical Information: standard deviation,c, = 1.1%relative standard deviation =1.2%
where 95% confidence limit = .t 1/2(n)
95% Confidence Limits=+/- 1.5% given that n=6 runs andt=3.1634 ("t"-Table)
31
P4
AFWAL-TR-82-2128
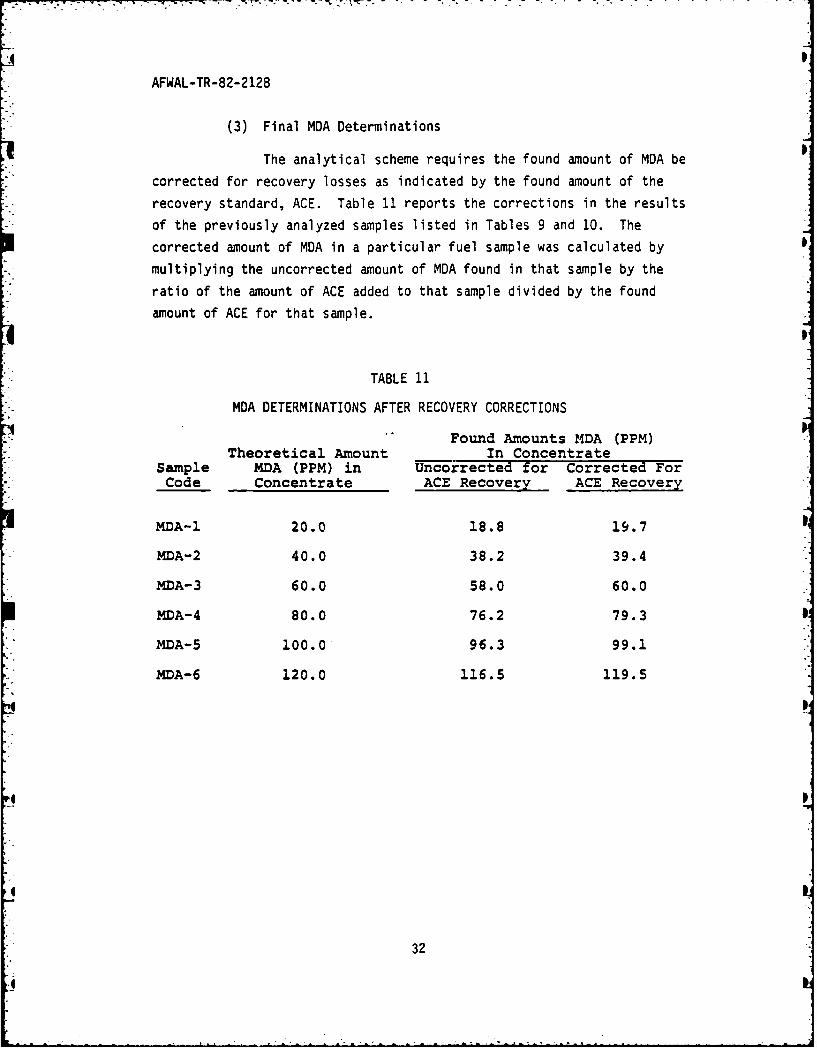
(3) Final MDA Determinations
The analytical scheme requires the found amount of MDA be
corrected for recovery losses as indicated by the found amount of the
recovery standard, ACE. Table 11 reports the corrections in the results
of the previously analyzed samples listed in Tables 9 and 10. The
corrected amount of MDA in a particular fuel sample was calculated by
multiplying the uncorrected amount of MDA found in that sample by the
ratio of the amount of ACE added to that sample divided by the found
amount of ACE for that sample.
TABLE 11
MDA DETERMINATIONS AFTER RECOVERY CORRECTIONS
Found Amounts MDA (PPM)Theoretical Amount In Concentrate
Sample MDA (PPM) in Uncorrected for Corrected ForCode Concentrate ACE Recovery ACE Recovery
MDA-I 20.0 18.8 19.7
MDA-2 40.0 38.2 39.4
MDA-3 60.0 58.0 60.0
MDA-4 80.0 76.2 79.3
MDA-5 100.0 96.3 99.1
MDA-6 120.0 116.5 119.5
32
I&
AFWAL-TR-82-2128
SECTION IV
SUMMARY AND SUGGESTIONS
A successful analytical method has been developed that
qualitatively identifies and quantitatively determines a metal
deactivator additive used in Air Force JP-4 jet fuel. Relative retention
time calculations, together with ultraviolet absorbance ratios at
various wavelengths, were highly specific in assigning the tentative
identification of the additive. A recovery standard that doubled as the
internal reference standard for relative retention time measurements was
crucial in correcting the found metal deactivator ppm level for losses in
sample transfer, sample concentration, dilution, etc. A precision
statement, reflecting the quantitative reliability of the method, cited
+/- 0.5 ppm as the 95% confidence intervals for the true value of the
predicted amount from the calibration curve for the metal deactivator in
the 20-150 ppm range, after the 20-fold fuel concentration step.
By combining an optimized mobile phase composition with the
ultraviolet detector, potential interferences were effectively screened
out from the JP-4 matrix: fuel residues, e.g. saturated paraffins,
alkyl benzenes, alkyl naphthalenes, and polynuclear aromatics;
impurities, e.g. trace levels of pyridines and quinolines, plasticizers,
etc.; and additives, e.g. alkyl phenols, fatty acids, a fatty alcohol,
etc. Thus the separation scherie is of universal applicability for all
specification JP-4 jet fuels regardless of the additive package used or
the trace contaminants normally encountered. The versatility of the
analytical method was further exemplified by its correct qualitative
analysis of synthetic blends that contained either formulation of the two
Air Force accepted metal deactivators.
Future work on this particular additive should include the
monitoring of the visible radiation wavelengths via the ultraviolet-
visible spectrophotometer. The analytical scheme could then be even more
selective and definitive for the metal deactivator or, for that matter,
for other JP-4 distillate fuel additives that are colored, since thevast majority of all fuel components, including additives and impurities,
show no response to radiation in the visible wavelengths.
33
- - - - - - --.
AFWAL-TR-82-2128
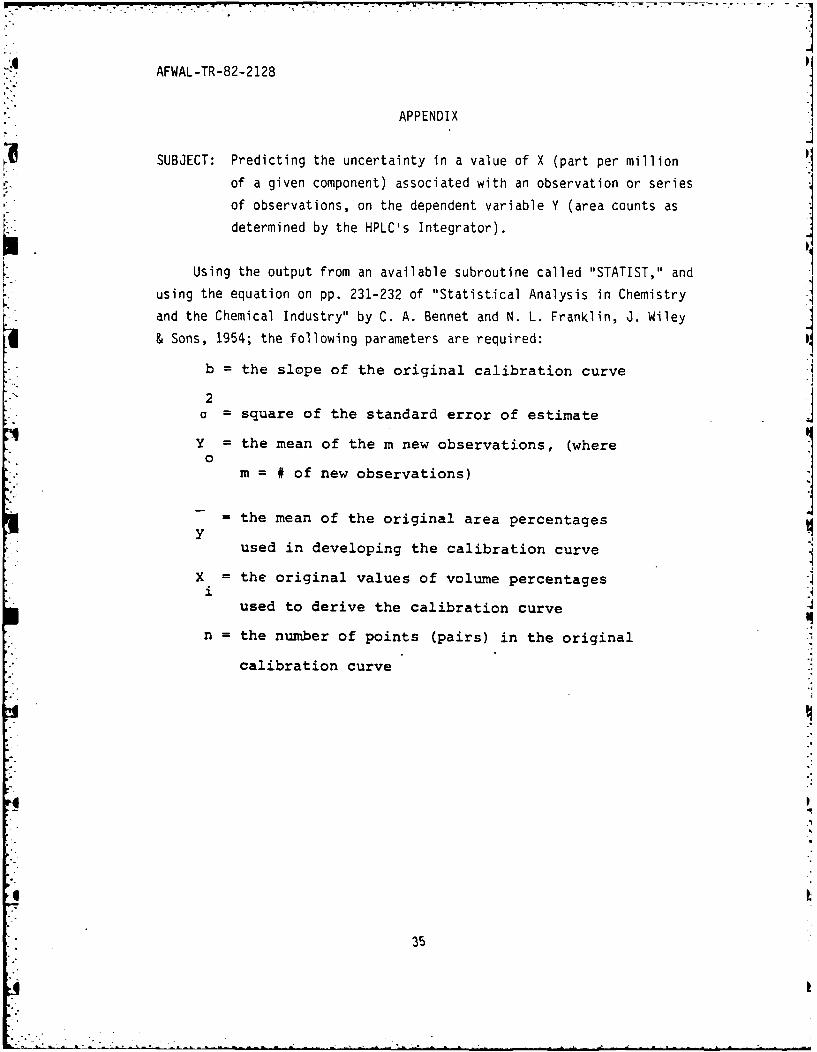
APPENDIX
SUBJECT: Predicting the uncertainty in a value of X (part per million
of a given component) associated with an observation or series
of observations, on the dependent variable Y (area counts as
determined by the HPLC's Integrator).
Using the output from an available subroutine called "STATIST," and
using the equation on pp. 231-232 of "Statistical Analysis in Chemistry
and the Chemical Industry" by C. A. Bennet and N. L. Franklin, J. Wiley
& Sons, 1954; the following parameters are required:
b = the slope of the original calibration curve
2o = square of the standard error of estimate
Y = the mean of the m new observations, (where0
m = # of new observations)
= the mean of the original area percentagesy
used in developing the calibration curve
X = the original values of volume percentagesiused to derive the calibration curve
n = the number of points (pairs) in the original
calibration curve
35
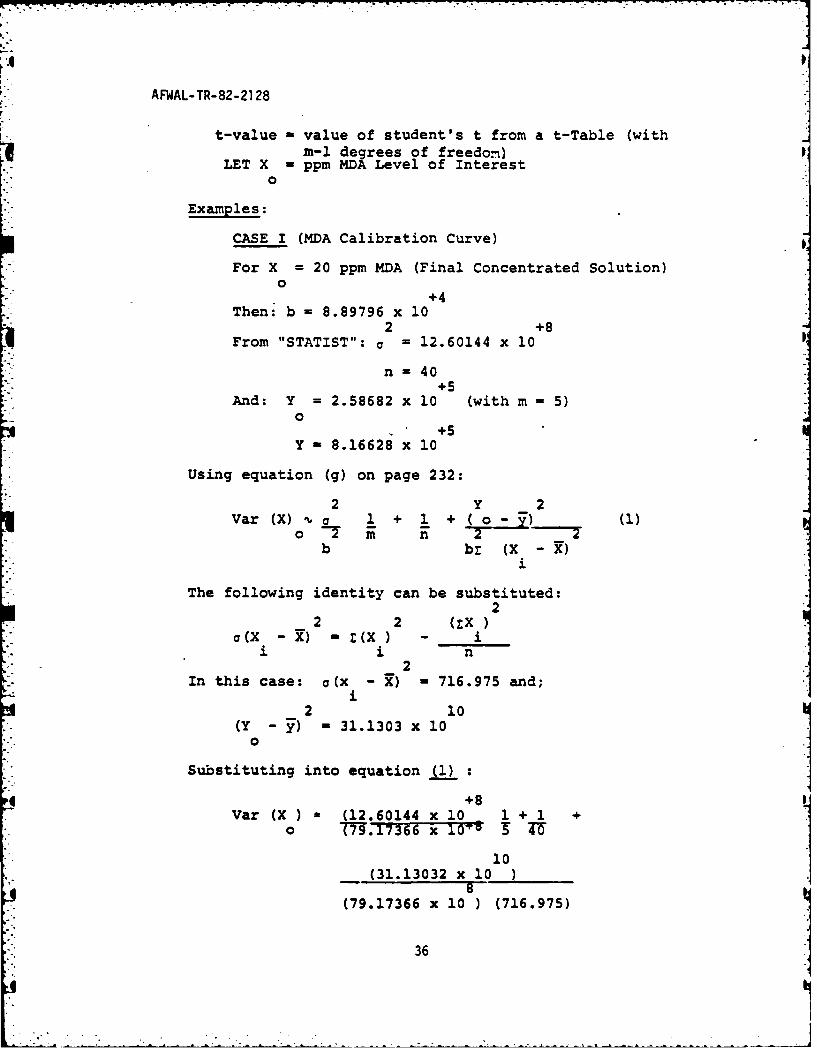
AFWAL-TR-82-2128
t-value - value of student's t from a t-Table (withm-i degrees of freedom)
LET X - ppm MDA Level of Interest0
Examples:
CASE I (MDA Calibration Curve)
For X = 20 ppm MDA (Final Concentrated Solution)0
+4Then: b - 8.89796 x 10
2 +8From "STATIST": a = 12.60144 x 10
n- 40+5
And: Y = 2.58682 x 10 (with m - 5)0
+5Y - 8.16628 x 10
Using equation (g) on page 232:
2 Y 2Var(X)' a 1 + 1 + (o- ) (1)
o f nb bz (X -X)
i
The following identity can be substituted:2
2 2 (EX)S(X (
i n,
2In this case: o(x - ) - 716.975 and;
i2 10
(Y - y) - 31.1303 x 100
Substituting into equation (1) :
+8Var (X) (12.60144 x 10 1 + 1 +0 1366 x 10-- 5 40
10(31.13032 x 10 )8
(79.17366 x 10 ) (716.975)
36
AFWAL-TR-82-2128
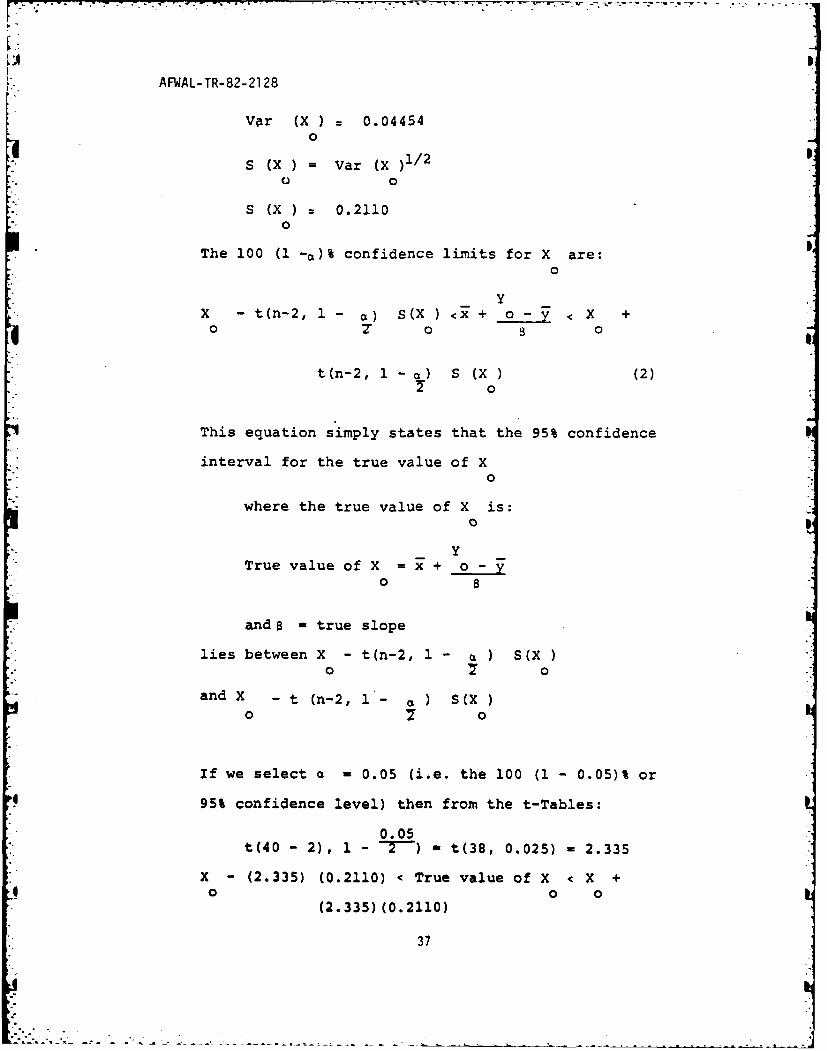
Vr (X) 0.044540
S (X) = Var (X )1/2
o 0
S (X) 0.21100
The 100 (1 -a)% confidence limits for X are:
0
YX -t(n-2, 1- O) s(X) < + o x +
o o 0
t(n-2, 1 - c,) S (X ) (2)0
This equation simply states that the 95% confidence
interval for the true value of X0
where the true value of X is:0
True value of X = x +o-
o
and 8 = true slope
lies between X - t(n-2, 1 - a ) S(X0 0
and X - t (n-2, 1*- ) S(X)
0 2 o
If we select a = 0.05 (i.e. the 100 (1 - 0.05)% or
95% confidence level) then from the t-Tables:
0.05t(40 - 2), 1 - -72) - t(38, 0.025) = 2.335
X - (2.335) (0.2110) < True value of X < X +0 o o
(2.335) (0.2110)
37
- .. . .. . ..- "...
Fp
AFWAL-TR-82-2128
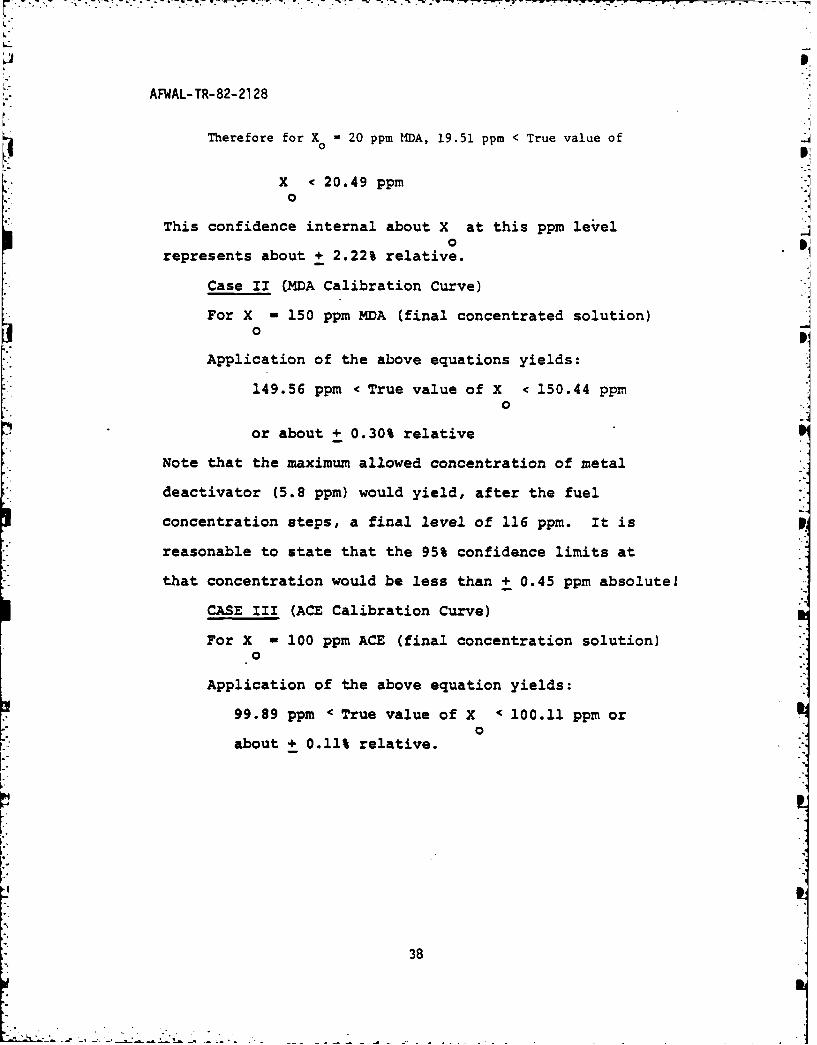
Therefore for X - 20 ppm MDA, 19.51 ppm < True value of
X < 20.49 ppm0 -
This confidence internal about X at this ppm leveloJ
represents about + 2.22% relative.
Case II (MDA Calibration Curve)
For X - 150 ppm MDA (final concentrated solution)0
Application of the above equations yields:
149.56 ppm < True value of X < 150.44 ppm0
or about + 0.30% relative
Note that the maximum allowed concentration of metal
deactivator (5.8 ppm) would yield, after the fuel
concentration steps, a final level of 116 ppm. It is
reasonable to state that the 95% confidence limits at
that concentration would be less than + 0.45 ppm absolute!
CASE III (ACE Calibration Curve)
For X - 100 ppm ACE (final concentration solution)0
Application of the above equation yields:
99.89 ppm < True value of X • 100.11 ppm or0
about + 0.11% relative.
38
AFWAL-TR-82-2128
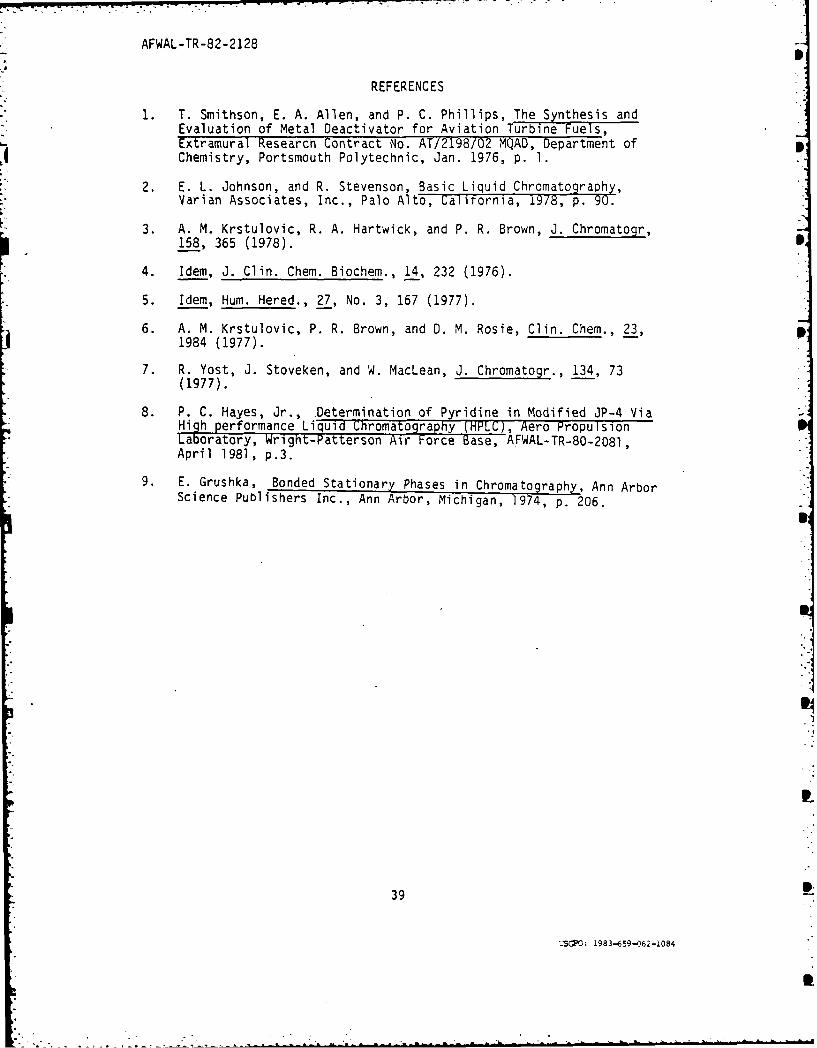
REFERENCES
1. T. Smithson, E. A. Allen, and P. C. Phillips, The Synthesis andEvaluation of Metal Deactivator for Aviation Turbine Fuels,Extramural Research Contract No. AT/2198/02 MQAD, Department ofChemistry, Portsmouth Polytechnic, Jan. 1976, p. 1.
2. E. L. Johnson, and R. Stevenson, Basic Liquid Chromatography,Varian Associates, Inc., Palo Alto, Calirornia, i9/8, p. 90.
3. A. M. Krstulovic, R. A. Hartwick, and P. R. Brown, J. Chromatogr,
158, 365 (1978).
4. Idem, J. Clin. Chem. Biochem., 14, 232 (1976).
5. Idem, Hum. Hered., 27, No. 3, 167 (1977).
6. A. M. Krstulovic, P. R. Brown, and D. M. Rosie, Clin. Chem., 23,1984 (1977).
7. R. Yost, J. Stoveken, and W. MacLean, J. Chromatogr., 134, 73(1977).
8. P. C. Hayes, Jr., Determination of Pyridine in Modified JP-4 ViaHigh performance Liquid Chromatography (HPLC), Aero PropulsionLaboratory, Wright-Patterson Air Force Base, AFWAL-TR-80-2081,April 1981, p.3.
9. E. Grushka, Bonded Stationary Phases in Chromatography, Ann ArborScience Publishers Inc., Ann Arbor, Michigan, 1974, p. 206.
39
2SCPO: 1983-.659-)62-1084
Lr d ' w -


![3.Liquid Fuels[1]](https://img.pdfslide.us/doc/110x75/577cc79f1a28aba711a17e01/3liquid-fuels1.jpg)