Embed Size (px)
Citation preview
Economic Modelling 38 (2014) 296–304
Contents lists available at ScienceDirect
Economic Modelling
j ourna l homepage: www.e lsev ie r .com/ locate /ecmod
Determinants of wage stickiness in a developing economy☆
Waqas Ahmed b, M. Ali Choudhary a,b, Sajawal Khan b, Saima Naeem ⁎,b, Gylfi Zoega c,d
a University of Surrey, Guildford, Surrey GU2 7XH, United Kingdomb Research Department, State Bank of Pakistan, I.I. Chundrigar Road, Karachi 74000, Pakistanc Department of Economics, University of Iceland, 101 Reykjavik, Icelandd Birkbeck College, University of London, Malet Street, London WC1E 7HX, United Kingdom
☆ We thank John Leahy, Chris Woodruf, Shamshad AkhYaseen Anwar, Riaz Riazuddin, Mushtaq Khan, Shahzad Aof Commerce of Karachi and Lahore for their supporEnterprise Development in Low-Income Countries (PEDLLondon. We also acknowledge the fieldwork at the stPunjab with special appreciation for Shamim Rafique anManzoor AhmedMemon andQaziMasood from the Sindhwas undertaken by a large team of researchers at the StatHassanAbbas, AmjadAli, ShahidHussain Javaid and AmnaMansoor Ahmed, Shujat Ali, Suhail Anjum, Alia Atta Karimwe appreciate the help of Carl Campbell who provided theand Zeenat Hisam for providing information on minimum⁎ Corresponding author.
E-mail addresses: [email protected] (M.A. [email protected] (S. Naeem), [email protected].
0264-9993/$ – see front matter © 2014 Elsevier B.V. All rihttp://dx.doi.org/10.1016/j.econmod.2014.01.016
a b s t r a c t
a r t i c l e i n f oArticle history:Accepted 17 January 2014Available online 11 February 2014
JEL classification:E5F4O1
Keywords:Survey of employersWage rigidityLabor market institutionsMonetary policy
We explore wage flexibility in a developing country and compare our results to what has been found in similarstudies using European data. In particular, we conduct a survey of 1189 firms in Pakistan to analyze the determi-nants of wage rigidity. We find that the existence of competitive wages and an interaction with the informaleconomy are statistically significant determinants of wage stickiness. While the role of competitive wages issimilar to what has been found in studies of European firms, the latter find a much larger role for turnover,collective bargaining and employment protection. In contrast, in Pakistan we find that firms hiring from theinformal sector are significantly more flexible in changing their wages. This suggests that the informal sectoradds to the wage flexibility of the formal sector.
© 2014 Elsevier B.V. All rights reserved.
1. Introduction
The objective of this paper is to study wage rigidity in Pakistan.Pakistan differs from the more developed countries where similarstudies have been performed in that the system of unemploymentbenefits is absent, labor unions are very weak, a modern welfare stateis non-exisistent, there is a large underground economy and poverty iswidespread. It shares with many European countries the existence ofsignificant firing costs, in particular in the public sector.
We report the results of 1189 face-to-face structured interviewscarried out in 2009 to 2011 with managers in formal firms in the
tar, Salim Raza, Shahid Kardar,hmed, FPCCI and the Chamberst, and participants at Private) 2012 CEPR/DFID workshop inatistical Bureau of Sindh andd Sajid Rasool from Punjab andBureau of Statistics. The projecte Bank of Pakistan consisting ofSaeed, and a teamof translatorsand Zeeshan Suleiman. Finally,questionnaire of the U.S. survey-wage laws in Pakistan.
udhary),uk (G. Zoega).
ghts reserved.
manufacturing and service sectors of Pakistan.1 Only regular employeesare included making our results comparable to similar research done inthe developed countries. We start by reviewing the literature and thenturn to describing our survey before describing our results on wagesetting, the frequency of wage adjustements, wage setting rules andthe determinants of wage flexibility.
2. Literature
Our structured interviews enable us to study reasons for downwardwage rigidity in Pakistan (as Bewley (1999), Blinder and Choi (1990),Agell and Lundborg (1995), Campbell and Kamlani (1997) and ZoegaandKarlsson (2006)) butwe also focus on the frequency ofwage chang-es rather than just the reasonswhyfirms donot cutwages in recessions.We harmonize our questions with the European Central Bank surveyenabling us to make direct comparisons. The ECB conducted a surveyof 17000 firms in 17 countries, which was performed in 2007–2008.2
The results are described in Druant et al. (2012), Galuscak et al.
1 By formal it is meant that our firms are officially registered, tax liable and also reportdata to employment agencies. Therefore, these firms necessarily are a part of the officialGDP and employment statistics.
2 The countries included are Austria, Belgium, Czech Republic, Estonia, France, Greece,Hungary, Italy, Ireland, Lithuania, Luxembourg, Netherlands, Poland, Portugal, Slovenia,Slovakia and Spain. The German survey was not fully harmonized with the others. In2009 similar surveys were also conducted for Slovakia, Cyprus, Bulgaria and Malta.
297W. Ahmed et al. / Economic Modelling 38 (2014) 296–304
(2010), Babecky et al. (2009, 2012), and Bertola et al. (2012). Ofparticular interest to us is the presence of nominal wage rigidity.3
Druant et al. (2012) describe the nature and sources of nominalrigidities in Europe. They focus on the frequency of price and wagechanges; the prevailing mechanism of adjustment, in particular itstiming and the degree of synchronization; and the cross-sectional vari-ability of rigidity measures with respect to firm-specific characteristics,product–market features and labor market institutions. When it comesto wage setting, these authors find evidence of time-dependent ruleswith more than half documenting that wage changes are concentratedin a particular month. They also find significant variability in wagesetting across firms and sectors. Wages turn out to be more flexiblewhen bargaining is decentralized, when the coverage of collectivebargaining and the stringency of employment-protection legislation islow and where the share of high-skilled and white-collar workers issmaller.
In this paper we are interested in exploring the frequency of wagechanges and the determinants of wage flexibility in a develping countrythat differs in fundamental ways from the European economies. Tofacilitate a comparison we will structure our questions based onDruant et al. (2012). The wage setting enviornment in Pakistan differsfrom what we find in the European countries mainly in that laborunions in Pakistan are weak, a modern welfare state is non-existentand there is a large informal or underground economy.
3. The survey
The survey was conducted in the provinces of Punjab and Sindhbetween December 2009–March 2010 and June 2010–October 2011respectively. For security reasons, smaller provinces were exlcuded.The survey was carried out in collaboration with the statistical agenciesof Pakistan, which also conducted a pilot study before launching theformal interviews.4 The questions were directed at regular employeesdefined as workers on formal contracts, registered with social-securityor the Employment and Old Age Benefit Institute (EOBI), and recorded infirms' official documentation.
Themanufacturing sample is drawn fromdata registers for census ofmanufacturing industries (CMI). Economic activity codes from 15 to 36(excluding 30 since this sector – ioffice equipment and computers –does not have any private firm) are covered in the Pakistan-Standard-Industrial-Classification (PSIC) system.5,6 Similarly, firm size in themanufacturing industry was defined on the basis of employment; firmsin the manufacturing sector were split into three employment brackets:10–50, 51–250 and more than 250 employees defined as small, mediumand large firms respectively. Based on these criteria, a random sample of
3 While there are few studies explaining the frequency of wage changes there is amuch larger number of papers that focus on the frequency of price changes. To namea few of those, Rotemberg (1982) and Carlton (1986) studied price stickiness in theU.S., Cecchetti (1986) the frequency of changes of newspaper prices in the U.S., Blinderet al. (1998) presented the results of a survey of American firms, Asplund et al. (2000)studied gasoline prices, Hall et al. (2000) used survey data in the UK, Bils and Klenow(2004) study the frequency of price change of 350 categories of goods and services inthe U.S., Amirault et al. (2005) studied price stickiness in Canada and more recentlyFabiani et al. (2007) and Álvarez et al. (2006) report the results of a study of pricing deci-sions in the euro area.
4 For a further quality check, economists from the Central Bank randomly audited 10% oflive interviews.
5 The activities are: 15—(food products & beverages), 16—(tobacco products),17—(manufacture of textiles), 18—(wearing apparel), 19—(leather products), 20—(wood &wood products), 21—(paper & paper products), 22—(publishing, printing & reproduction),23—(petroleum), 24—(chemicals & chemical products), 25—(rubber & plastics products),26—(other non—metallicmineral products), 27—(basicmetals), 28—(fabricatedmetal prod-ucts), 29—(machinery & equipment N.E.C.), 31—(electrical machinery & apparatus N.E.C.),32—(radio, TV & communication equipment), 33—(medical & optical instruments),34—(motor vehicles & trailers), 35—(other transport equipment), 36—(furniture).
6 These economic activities are in line with the International Standard IndustrialClassification (ISIC).
1200 manufacturing firms was drawn from 63 mutually exclusive strata,along with a 50% extra replacement sample.7
Pakistan has no formal database for the service sector. To overcomethis issue, we used the database of the Securities and Exchange Commis-sion of Pakistan (SECP) whichmaintains a list of all firms registeredwiththem. Yet, the SECP register has its own limitation; it lacks informationon firm size andwhether firms are dormant or non-dormant. Before uti-lizing the SECP database we applied filters to circumwent this limita-tion.8 Our final service sector sample of 270 firms includes firms fromtransport and telecommunication, hotels and restaurants and educationand health care services, while construction, real state, financial ser-vices, wholesale and trade sectors were dropped due to the problemof defining their main service.9 This is because for services like financialservices, construction, retail and trade the type of service may changewith every transaction.
To draw valid inferences from the population, we perform poststratification to control for closure, non-responses and possibleeconomic activity shifts. We have also dropped observations whenfirms were pure exporters since we are only interested in firms thatoperate in the domestic markets. Furthermore, large firms sufferedfroma low response rate but their decisions are likely to bemore impor-tant. As a result, the observations required adjustment for firm size aswell. These adjustments were done differently for the manufacturingand service sector because the data came from separate sources.10
With population frame, economic activity and firm size serving aspivots, we draw a stratified-random sample for each sector. We sum-marize the sample in Table 1 below where the first two lines describethe size of the manufacturing and the service sectors, lines 3 and 4showhow large the sample is in terms of aggregate output and employ-ment in Pakistan and the remaining lines show the composition of thesample based on the location and size of firms and the type of workers.
The estimates for the aggregate economy are presented as weightedaverages based on the sectoral contribution of manufacturing andservice sectors to GDP. Generally, themanufacturing and service sectorscombined accounted for 71.4% of GDP in 2009, while taking only intoconsideration the sub-sectors covered in our interviews. Our sample isa good representation of decision-makers that produce 25.2–27% ofGDP and that of formal sector wage-earners in our chosen sectors.Specifically, out of 1189 respondents, the sample of 1025 in themanufacturing sector turns out to be 9% of the overall target population,but the sample from the service sector is smaller and based on a derivedpopulation.We usefinal post-stratification to reduce sectoral bias as pertheir contribution towards GDP. Interestingly, the employment sharesof these two economic sectors are consistent with their GDP shares,hence all the estimates reported can be interpreted as both weightedby respective shares in GDP and/or employment.
The selection rests upon per strata shares to population. However,sample size was deliberately increased for the smaller strata to raisethe power of the statistical inference. We asked CEOs to break downtheir labor force into three socio-occupational categories: (i) whitecollar, (ii) skilled blue collar and (iii) unskilled blue collar. Regular em-ployees accounted for 66% of all workers in firms in our sample, imply-ing that our results reflect the wage-setting pattern for therepresentative group of workers we visited. In particular, skilled bluecollar employees account for the main occupational group in the
7 In case of non-response, a firm from a particular stratum was randomly replaced byanother firm from the same stratum to maintain an unchanged sectoral representation.
8 For example, to minimize the chance of selecting dormant firms from a very largedatabase, we only selected firms that had been registered within the last ten years and ifregistered before that time period have reported to the SECP at least once in the last tenyears. Also to avoid too many small firms, firms with paid-up capital of more than RS.2,000,000 (USD 23500) were selected.
9 This is because we used the same sample for a separate price-setting survey where itwas necessary to include firms involved in economic activities that could not be clearlyidentified in term of product/service.10 An appendix presents the post-stratification schemes.
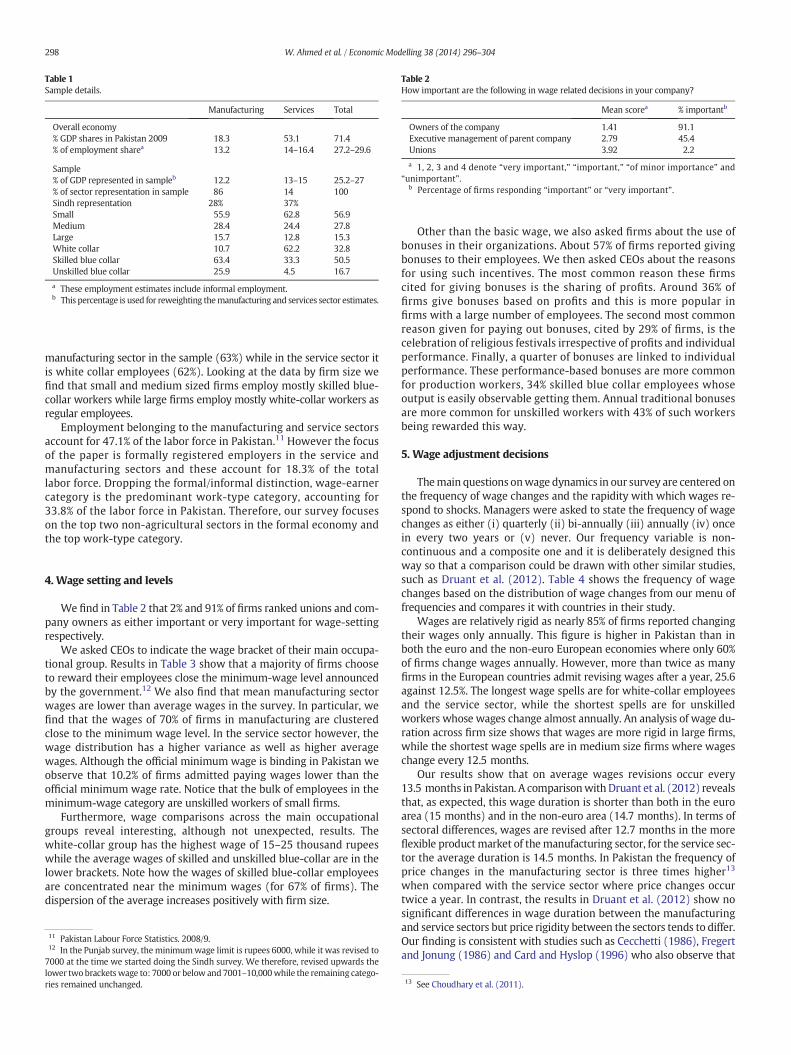
Table 2How important are the following in wage related decisions in your company?
Mean scorea % importantb
Owners of the company 1.41 91.1Executive management of parent company 2.79 45.4Unions 3.92 2.2
a 1, 2, 3 and 4 denote “very important,” “important,” “of minor importance” and“unimportant”.
b Percentage of firms responding “important” or “very important”.
Table 1Sample details.
Manufacturing Services Total
Overall economy% GDP shares in Pakistan 2009 18.3 53.1 71.4% of employment sharea 13.2 14–16.4 27.2–29.6
Sample% of GDP represented in sampleb 12.2 13–15 25.2–27% of sector representation in sample 86 14 100Sindh representation 28% 37%Small 55.9 62.8 56.9Medium 28.4 24.4 27.8Large 15.7 12.8 15.3White collar 10.7 62.2 32.8Skilled blue collar 63.4 33.3 50.5Unskilled blue collar 25.9 4.5 16.7
a These employment estimates include informal employment.b This percentage is used for reweighting themanufacturing and services sector estimates.
298 W. Ahmed et al. / Economic Modelling 38 (2014) 296–304
manufacturing sector in the sample (63%) while in the service sector itis white collar employees (62%). Looking at the data by firm size wefind that small and medium sized firms employ mostly skilled blue-collar workers while large firms employ mostly white-collar workers asregular employees.
Employment belonging to the manufacturing and service sectorsaccount for 47.1% of the labor force in Pakistan.11 However the focusof the paper is formally registered employers in the service andmanufacturing sectors and these account for 18.3% of the totallabor force. Dropping the formal/informal distinction, wage-earnercategory is the predominant work-type category, accounting for33.8% of the labor force in Pakistan. Therefore, our survey focuseson the top two non-agricultural sectors in the formal economy andthe top work-type category.
4. Wage setting and levels
We find in Table 2 that 2% and 91% of firms ranked unions and com-pany owners as either important or very important for wage-settingrespectively.
We asked CEOs to indicate the wage bracket of their main occupa-tional group. Results in Table 3 show that a majority of firms chooseto reward their employees close the minimum-wage level announcedby the government.12 We also find that mean manufacturing sectorwages are lower than average wages in the survey. In particular, wefind that the wages of 70% of firms in manufacturing are clusteredclose to the minimum wage level. In the service sector however, thewage distribution has a higher variance as well as higher averagewages. Although the official minimum wage is binding in Pakistan weobserve that 10.2% of firms admitted paying wages lower than theofficial minimum wage rate. Notice that the bulk of employees in theminimum-wage category are unskilled workers of small firms.
Furthermore, wage comparisons across the main occupationalgroups reveal interesting, although not unexpected, results. Thewhite-collar group has the highest wage of 15–25 thousand rupeeswhile the average wages of skilled and unskilled blue-collar are in thelower brackets. Note how the wages of skilled blue-collar employeesare concentrated near the minimum wages (for 67% of firms). Thedispersion of the average increases positively with firm size.
11 Pakistan Labour Force Statistics. 2008/9.12 In the Punjab survey, theminimumwage limit is rupees 6000, while it was revised to7000 at the time we started doing the Sindh survey. We therefore, revised upwards thelower twobrackets wage to: 7000 or below and 7001–10,000while the remaining catego-ries remained unchanged.
Other than the basic wage, we also asked firms about the use ofbonuses in their organizations. About 57% of firms reported givingbonuses to their employees. We then asked CEOs about the reasonsfor using such incentives. The most common reason these firmscited for giving bonuses is the sharing of profits. Around 36% offirms give bonuses based on profits and this is more popular infirms with a large number of employees. The second most commonreason given for paying out bonuses, cited by 29% of firms, is thecelebration of religious festivals irrespective of profits and individualperformance. Finally, a quarter of bonuses are linked to individualperformance. These performance-based bonuses are more commonfor production workers, 34% skilled blue collar employees whoseoutput is easily observable getting them. Annual traditional bonusesare more common for unskilled workers with 43% of such workersbeing rewarded this way.
5. Wage adjustment decisions
Themain questions onwage dynamics in our survey are centered onthe frequency of wage changes and the rapidity with which wages re-spond to shocks. Managers were asked to state the frequency of wagechanges as either (i) quarterly (ii) bi-annually (iii) annually (iv) oncein every two years or (v) never. Our frequency variable is non-continuous and a composite one and it is deliberately designed thisway so that a comparison could be drawn with other similar studies,such as Druant et al. (2012). Table 4 shows the frequency of wagechanges based on the distribution of wage changes from our menu offrequencies and compares it with countries in their study.
Wages are relatively rigid as nearly 85% of firms reported changingtheir wages only annually. This figure is higher in Pakistan than inboth the euro and the non-euro European economies where only 60%of firms change wages annually. However, more than twice as manyfirms in the European countries admit revising wages after a year, 25.6against 12.5%. The longest wage spells are for white-collar employeesand the service sector, while the shortest spells are for unskilledworkers whose wages change almost annually. An analysis of wage du-ration across firm size shows that wages are more rigid in large firms,while the shortest wage spells are in medium size firms where wageschange every 12.5 months.
Our results show that on average wages revisions occur every13.5 months in Pakistan. A comparisonwith Druant et al. (2012) revealsthat, as expected, this wage duration is shorter than both in the euroarea (15 months) and in the non-euro area (14.7 months). In terms ofsectoral differences, wages are revised after 12.7 months in the moreflexible productmarket of themanufacturing sector, for the service sec-tor the average duration is 14.5 months. In Pakistan the frequency ofprice changes in the manufacturing sector is three times higher13
when compared with the service sector where price changes occurtwice a year. In contrast, the results in Druant et al. (2012) show nosignificant differences in wage duration between the manufacturingand service sectors but price rigidity between the sectors tends to differ.Our finding is consistent with studies such as Cecchetti (1986), Fregertand Jonung (1986) and Card and Hyslop (1996) who also observe that
13 See Choudhary et al. (2011).
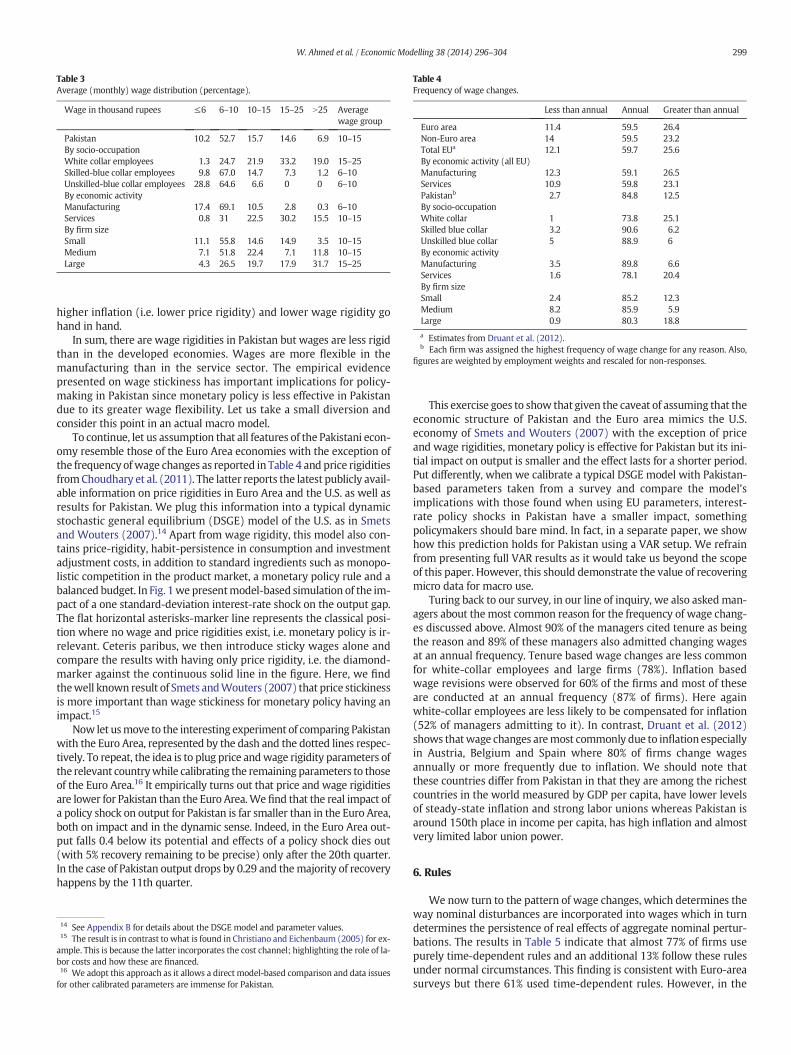
Table 4Frequency of wage changes.
Less than annual Annual Greater than annual
Euro area 11.4 59.5 26.4Non-Euro area 14 59.5 23.2Total EUa 12.1 59.7 25.6By economic activity (all EU)Manufacturing 12.3 59.1 26.5Services 10.9 59.8 23.1Pakistanb 2.7 84.8 12.5By socio-occupationWhite collar 1 73.8 25.1Skilled blue collar 3.2 90.6 6.2Unskilled blue collar 5 88.9 6By economic activityManufacturing 3.5 89.8 6.6Services 1.6 78.1 20.4By firm sizeSmall 2.4 85.2 12.3Medium 8.2 85.9 5.9Large 0.9 80.3 18.8
a Estimates from Druant et al. (2012).b Each firm was assigned the highest frequency of wage change for any reason. Also,
figures are weighted by employment weights and rescaled for non-responses.
Table 3Average (monthly) wage distribution (percentage).
Wage in thousand rupees ≤6 6–10 10–15 15–25 N25 Averagewage group
Pakistan 10.2 52.7 15.7 14.6 6.9 10–15By socio-occupationWhite collar employees 1.3 24.7 21.9 33.2 19.0 15–25Skilled-blue collar employees 9.8 67.0 14.7 7.3 1.2 6–10Unskilled-blue collar employees 28.8 64.6 6.6 0 0 6–10By economic activityManufacturing 17.4 69.1 10.5 2.8 0.3 6–10Services 0.8 31 22.5 30.2 15.5 10–15By firm sizeSmall 11.1 55.8 14.6 14.9 3.5 10–15Medium 7.1 51.8 22.4 7.1 11.8 10–15Large 4.3 26.5 19.7 17.9 31.7 15–25
299W. Ahmed et al. / Economic Modelling 38 (2014) 296–304
higher inflation (i.e. lower price rigidity) and lower wage rigidity gohand in hand.
In sum, there are wage rigidities in Pakistan but wages are less rigidthan in the developed economies. Wages are more flexible in themanufacturing than in the service sector. The empirical evidencepresented on wage stickiness has important implications for policy-making in Pakistan since monetary policy is less effective in Pakistandue to its greater wage flexibility. Let us take a small diversion andconsider this point in an actual macro model.
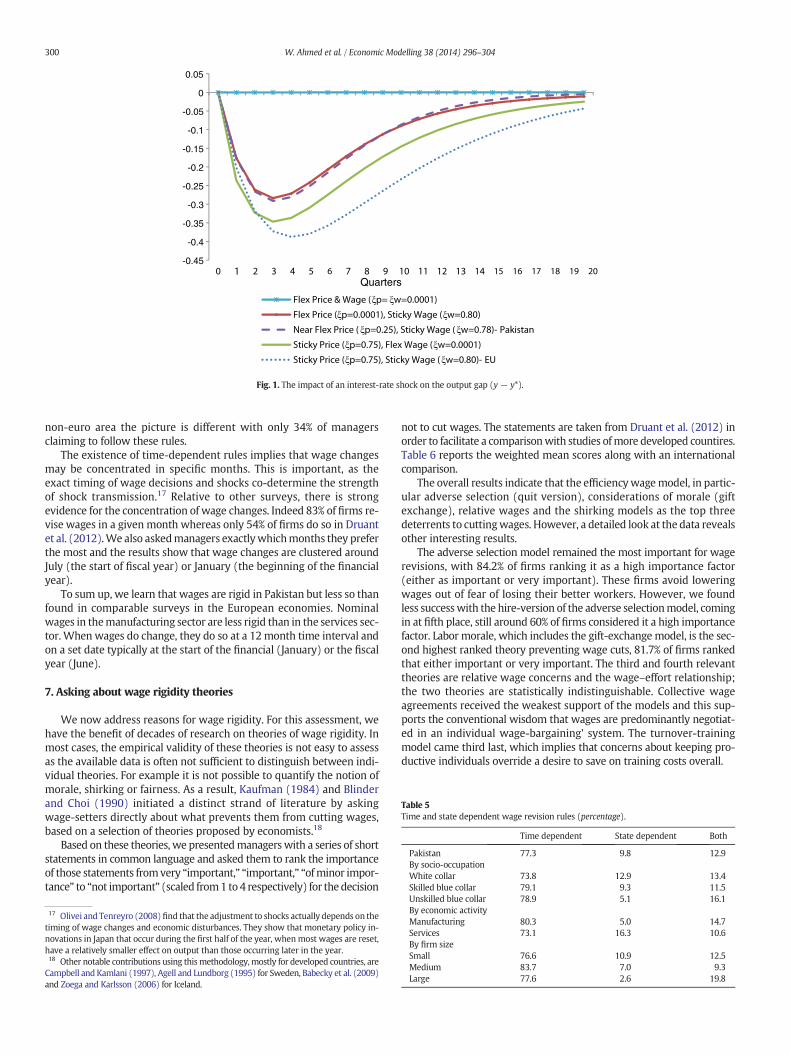
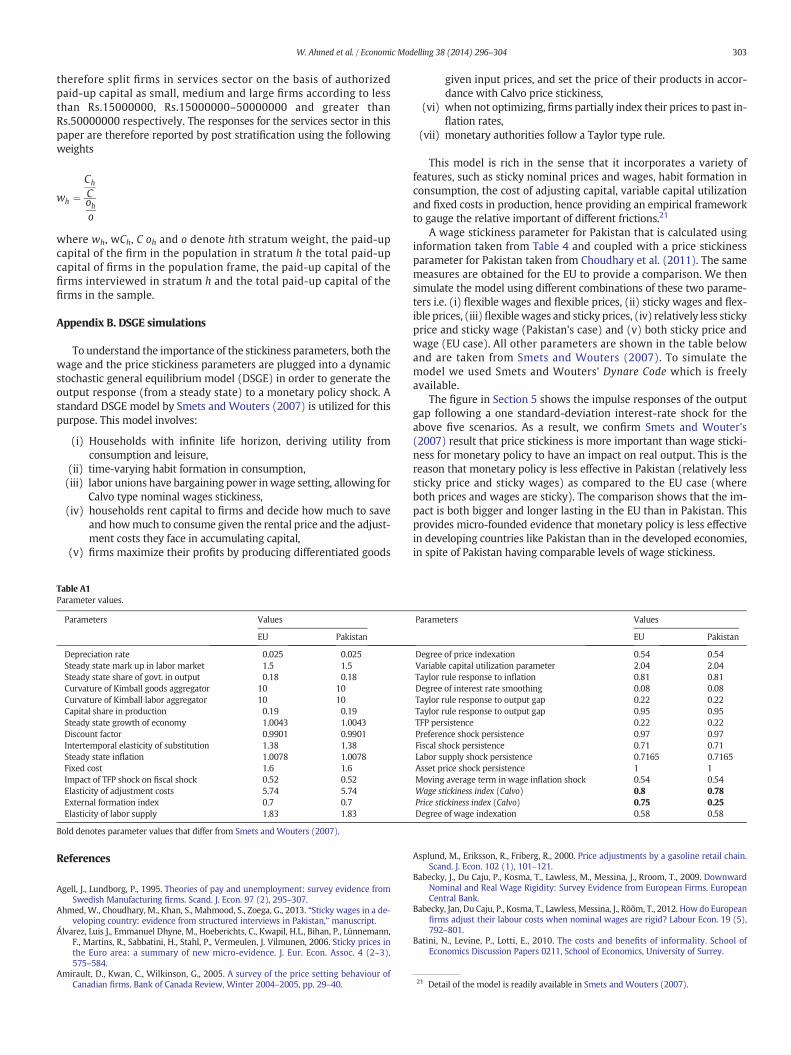
To continue, let us assumption that all features of the Pakistani econ-omy resemble those of the Euro Area economies with the exception ofthe frequency ofwage changes as reported in Table 4 and price rigiditiesfromChoudhary et al. (2011). The latter reports the latest publicly avail-able information on price rigidities in Euro Area and the U.S. as well asresults for Pakistan. We plug this information into a typical dynamicstochastic general equilibrium (DSGE) model of the U.S. as in Smetsand Wouters (2007).14 Apart from wage rigidity, this model also con-tains price-rigidity, habit-persistence in consumption and investmentadjustment costs, in addition to standard ingredients such as monopo-listic competition in the product market, a monetary policy rule and abalanced budget. In Fig. 1we presentmodel-based simulation of the im-pact of a one standard-deviation interest-rate shock on the output gap.The flat horizontal asterisks-marker line represents the classical posi-tion where no wage and price rigidities exist, i.e. monetary policy is ir-relevant. Ceteris paribus, we then introduce sticky wages alone andcompare the results with having only price rigidity, i.e. the diamond-marker against the continuous solid line in the figure. Here, we findthewell known result of Smets andWouters (2007) that price stickinessis more important than wage stickiness for monetary policy having animpact.15
Now let usmove to the interesting experiment of comparing Pakistanwith the Euro Area, represented by the dash and the dotted lines respec-tively. To repeat, the idea is to plug price andwage rigidity parameters ofthe relevant countrywhile calibrating the remaining parameters to thoseof the Euro Area.16 It empirically turns out that price and wage rigiditiesare lower for Pakistan than the Euro Area.We find that the real impact ofa policy shock on output for Pakistan is far smaller than in the Euro Area,both on impact and in the dynamic sense. Indeed, in the Euro Area out-put falls 0.4 below its potential and effects of a policy shock dies out(with 5% recovery remaining to be precise) only after the 20th quarter.In the case of Pakistan output drops by 0.29 and themajority of recoveryhappens by the 11th quarter.
14 See Appendix B for details about the DSGE model and parameter values.15 The result is in contrast to what is found in Christiano and Eichenbaum (2005) for ex-ample. This is because the latter incorporates the cost channel; highlighting the role of la-bor costs and how these are financed.16 We adopt this approach as it allows a direct model-based comparison and data issuesfor other calibrated parameters are immense for Pakistan.
This exercise goes to show that given the caveat of assuming that theeconomic structure of Pakistan and the Euro area mimics the U.S.economy of Smets and Wouters (2007) with the exception of priceand wage rigidities, monetary policy is effective for Pakistan but its ini-tial impact on output is smaller and the effect lasts for a shorter period.Put differently, when we calibrate a typical DSGE model with Pakistan-based parameters taken from a survey and compare the model'simplications with those found when using EU parameters, interest-rate policy shocks in Pakistan have a smaller impact, somethingpolicymakers should bare mind. In fact, in a separate paper, we showhow this prediction holds for Pakistan using a VAR setup. We refrainfrom presenting full VAR results as it would take us beyond the scopeof this paper. However, this should demonstrate the value of recoveringmicro data for macro use.
Turing back to our survey, in our line of inquiry, we also askedman-agers about themost common reason for the frequency of wage chang-es discussed above. Almost 90% of the managers cited tenure as beingthe reason and 89% of these managers also admitted changing wagesat an annual frequency. Tenure based wage changes are less commonfor white-collar employees and large firms (78%). Inflation basedwage revisions were observed for 60% of the firms and most of theseare conducted at an annual frequency (87% of firms). Here againwhite-collar employees are less likely to be compensated for inflation(52% of managers admitting to it). In contrast, Druant et al. (2012)shows thatwage changes aremost commonly due to inflation especiallyin Austria, Belgium and Spain where 80% of firms change wagesannually or more frequently due to inflation. We should note thatthese countries differ from Pakistan in that they are among the richestcountries in the world measured by GDP per capita, have lower levelsof steady-state inflation and strong labor unions whereas Pakistan isaround 150th place in income per capita, has high inflation and almostvery limited labor union power.
6. Rules
We now turn to the pattern of wage changes, which determines theway nominal disturbances are incorporated into wages which in turndetermines the persistence of real effects of aggregate nominal pertur-bations. The results in Table 5 indicate that almost 77% of firms usepurely time-dependent rules and an additional 13% follow these rulesunder normal circumstances. This finding is consistent with Euro-areasurveys but there 61% used time-dependent rules. However, in the
-0.45
-0.4
-0.35
-0.3
-0.25
-0.2
-0.15
-0.1
-0.05
0
0.05
Quarters
Fig. 1. The impact of an interest-rate shock on the output gap (y − y*).
Table 5Time and state dependent wage revision rules (percentage).
Time dependent State dependent Both
Pakistan 77.3 9.8 12.9By socio-occupationWhite collar 73.8 12.9 13.4Skilled blue collar 79.1 9.3 11.5
300 W. Ahmed et al. / Economic Modelling 38 (2014) 296–304
non-euro area the picture is different with only 34% of managersclaiming to follow these rules.
The existence of time-dependent rules implies that wage changesmay be concentrated in specific months. This is important, as theexact timing of wage decisions and shocks co-determine the strengthof shock transmission.17 Relative to other surveys, there is strongevidence for the concentration of wage changes. Indeed 83% of firms re-vise wages in a given month whereas only 54% of firms do so in Druantet al. (2012).We also askedmanagers exactlywhichmonths they preferthe most and the results show that wage changes are clustered aroundJuly (the start of fiscal year) or January (the beginning of the financialyear).
To sum up, we learn that wages are rigid in Pakistan but less so thanfound in comparable surveys in the European economies. Nominalwages in themanufacturing sector are less rigid than in the services sec-tor. When wages do change, they do so at a 12month time interval andon a set date typically at the start of the financial (January) or the fiscalyear (June).
7. Asking about wage rigidity theories
We now address reasons for wage rigidity. For this assessment, wehave the benefit of decades of research on theories of wage rigidity. Inmost cases, the empirical validity of these theories is not easy to assessas the available data is often not sufficient to distinguish between indi-vidual theories. For example it is not possible to quantify the notion ofmorale, shirking or fairness. As a result, Kaufman (1984) and Blinderand Choi (1990) initiated a distinct strand of literature by askingwage-setters directly about what prevents them from cutting wages,based on a selection of theories proposed by economists.18
Based on these theories, we presentedmanagerswith a series of shortstatements in common language and asked them to rank the importanceof those statements fromvery “important,” “important,” “ofminor impor-tance” to “not important” (scaled from1 to4 respectively) for thedecision
17 Olivei and Tenreyro (2008) find that the adjustment to shocks actually depends on thetiming of wage changes and economic disturbances. They show that monetary policy in-novations in Japan that occur during the first half of the year, whenmost wages are reset,have a relatively smaller effect on output than those occurring later in the year.18 Other notable contributions using thismethodology,mostly for developed countries, areCampbell and Kamlani (1997), Agell and Lundborg (1995) for Sweden, Babecky et al. (2009)and Zoega and Karlsson (2006) for Iceland.
not to cut wages. The statements are taken from Druant et al. (2012) inorder to facilitate a comparisonwith studies ofmore developed countires.Table 6 reports the weighted mean scores along with an internationalcomparison.
The overall results indicate that the efficiencywagemodel, in partic-ular adverse selection (quit version), considerations of morale (giftexchange), relative wages and the shirking models as the top threedeterrents to cuttingwages. However, a detailed look at the data revealsother interesting results.
The adverse selection model remained the most important for wagerevisions, with 84.2% of firms ranking it as a high importance factor(either as important or very important). These firms avoid loweringwages out of fear of losing their better workers. However, we foundless successwith the hire-version of the adverse selectionmodel, comingin at fifth place, still around 60% of firms considered it a high importancefactor. Labor morale, which includes the gift-exchange model, is the sec-ond highest ranked theory preventing wage cuts, 81.7% of firms rankedthat either important or very important. The third and fourth relevanttheories are relative wage concerns and the wage–effort relationship;the two theories are statistically indistinguishable. Collective wageagreements received the weakest support of the models and this sup-ports the conventional wisdom that wages are predominantly negotiat-ed in an individual wage-bargaining' system. The turnover-trainingmodel came third last, which implies that concerns about keeping pro-ductive individuals override a desire to save on training costs overall.
Unskilled blue collar 78.9 5.1 16.1By economic activityManufacturing 80.3 5.0 14.7Services 73.1 16.3 10.6By firm sizeSmall 76.6 10.9 12.5Medium 83.7 7.0 9.3Large 77.6 2.6 19.8
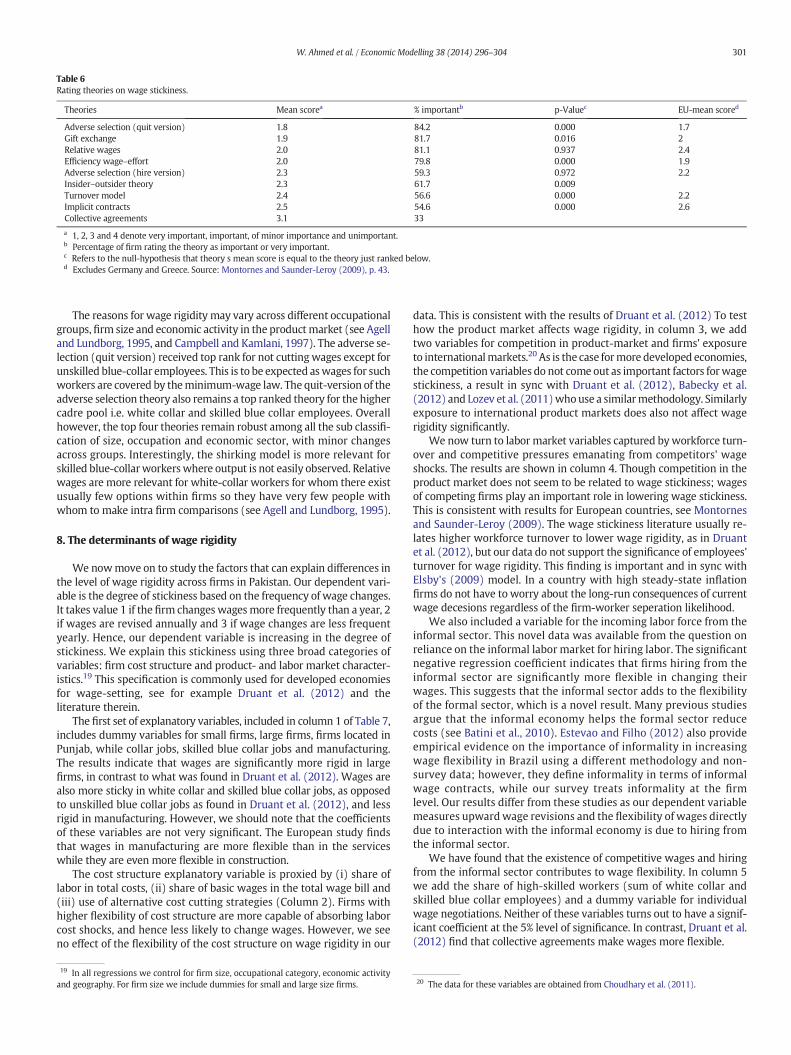
Table 6Rating theories on wage stickiness.
Theories Mean scorea % importantb p-Valuec EU-mean scored
Adverse selection (quit version) 1.8 84.2 0.000 1.7Gift exchange 1.9 81.7 0.016 2Relative wages 2.0 81.1 0.937 2.4Efficiency wage–effort 2.0 79.8 0.000 1.9Adverse selection (hire version) 2.3 59.3 0.972 2.2Insider–outsider theory 2.3 61.7 0.009Turnover model 2.4 56.6 0.000 2.2Implicit contracts 2.5 54.6 0.000 2.6Collective agreements 3.1 33
a 1, 2, 3 and 4 denote very important, important, of minor importance and unimportant.b Percentage of firm rating the theory as important or very important.c Refers to the null-hypothesis that theory s mean score is equal to the theory just ranked below.d Excludes Germany and Greece. Source: Montornes and Saunder-Leroy (2009), p. 43.
301W. Ahmed et al. / Economic Modelling 38 (2014) 296–304
The reasons for wage rigidity may vary across different occupationalgroups, firm size and economic activity in the productmarket (see Agelland Lundborg, 1995, and Campbell and Kamlani, 1997). The adverse se-lection (quit version) received top rank for not cuttingwages except forunskilled blue-collar employees. This is to be expected aswages for suchworkers are covered by theminimum-wage law. The quit-version of theadverse selection theory also remains a top ranked theory for the highercadre pool i.e. white collar and skilled blue collar employees. Overallhowever, the top four theories remain robust among all the sub classifi-cation of size, occupation and economic sector, with minor changesacross groups. Interestingly, the shirking model is more relevant forskilled blue-collarworkerswhere output is not easily observed. Relativewages are more relevant for white-collar workers for whom there existusually few options within firms so they have very few people withwhom to make intra firm comparisons (see Agell and Lundborg, 1995).
8. The determinants of wage rigidity
We nowmove on to study the factors that can explain differences inthe level of wage rigidity across firms in Pakistan. Our dependent vari-able is the degree of stickiness based on the frequency of wage changes.It takes value 1 if the firm changes wagesmore frequently than a year, 2if wages are revised annually and 3 if wage changes are less frequentyearly. Hence, our dependent variable is increasing in the degree ofstickiness. We explain this stickiness using three broad categories ofvariables: firm cost structure and product- and labor market character-istics.19 This specification is commonly used for developed economiesfor wage-setting, see for example Druant et al. (2012) and theliterature therein.
The first set of explanatory variables, included in column 1 of Table 7,includes dummy variables for small firms, large firms, firms located inPunjab, while collar jobs, skilled blue collar jobs and manufacturing.The results indicate that wages are significantly more rigid in largefirms, in contrast to what was found in Druant et al. (2012). Wages arealso more sticky in white collar and skilled blue collar jobs, as opposedto unskilled blue collar jobs as found in Druant et al. (2012), and lessrigid in manufacturing. However, we should note that the coefficientsof these variables are not very significant. The European study findsthat wages in manufacturing are more flexible than in the serviceswhile they are even more flexible in construction.
The cost structure explanatory variable is proxied by (i) share oflabor in total costs, (ii) share of basic wages in the total wage bill and(iii) use of alternative cost cutting strategies (Column 2). Firms withhigher flexibility of cost structure are more capable of absorbing laborcost shocks, and hence less likely to change wages. However, we seeno effect of the flexibility of the cost structure on wage rigidity in our
19 In all regressions we control for firm size, occupational category, economic activityand geography. For firm size we include dummies for small and large size firms.
data. This is consistent with the results of Druant et al. (2012) To testhow the product market affects wage rigidity, in column 3, we addtwo variables for competition in product-market and firms' exposureto internationalmarkets.20 As is the case formore developed economies,the competition variables do not come out as important factors forwagestickiness, a result in sync with Druant et al. (2012), Babecky et al.(2012) and Lozev et al. (2011)whouse a similarmethodology. Similarlyexposure to international product markets does also not affect wagerigidity significantly.
We now turn to labor market variables captured byworkforce turn-over and competitive pressures emanating from competitors' wageshocks. The results are shown in column 4. Though competition in theproduct market does not seem to be related to wage stickiness; wagesof competing firms play an important role in lowering wage stickiness.This is consistent with results for European countries, see Montornesand Saunder-Leroy (2009). The wage stickiness literature usually re-lates higher workforce turnover to lower wage rigidity, as in Druantet al. (2012), but our data do not support the significance of employees'turnover for wage rigidity. This finding is important and in sync withElsby's (2009) model. In a country with high steady-state inflationfirms do not have to worry about the long-run consequences of currentwage decesions regardless of the firm-worker seperation likelihood.
We also included a variable for the incoming labor force from theinformal sector. This novel data was available from the question onreliance on the informal labor market for hiring labor. The significantnegative regression coefficient indicates that firms hiring from theinformal sector are significantly more flexible in changing theirwages. This suggests that the informal sector adds to the flexibilityof the formal sector, which is a novel result. Many previous studiesargue that the informal economy helps the formal sector reducecosts (see Batini et al., 2010). Estevao and Filho (2012) also provideempirical evidence on the importance of informality in increasingwage flexibility in Brazil using a different methodology and non-survey data; however, they define informality in terms of informalwage contracts, while our survey treats informality at the firmlevel. Our results differ from these studies as our dependent variablemeasures upwardwage revisions and the flexibility of wages directlydue to interaction with the informal economy is due to hiring fromthe informal sector.
We have found that the existence of competitive wages and hiringfrom the informal sector contributes to wage flexibility. In column 5we add the share of high-skilled workers (sum of white collar andskilled blue collar employees) and a dummy variable for individualwage negotiations. Neither of these variables turns out to have a signif-icant coefficient at the 5% level of significance. In contrast, Druant et al.(2012) find that collective agreements make wages more flexible.
20 The data for these variables are obtained from Choudhary et al. (2011).
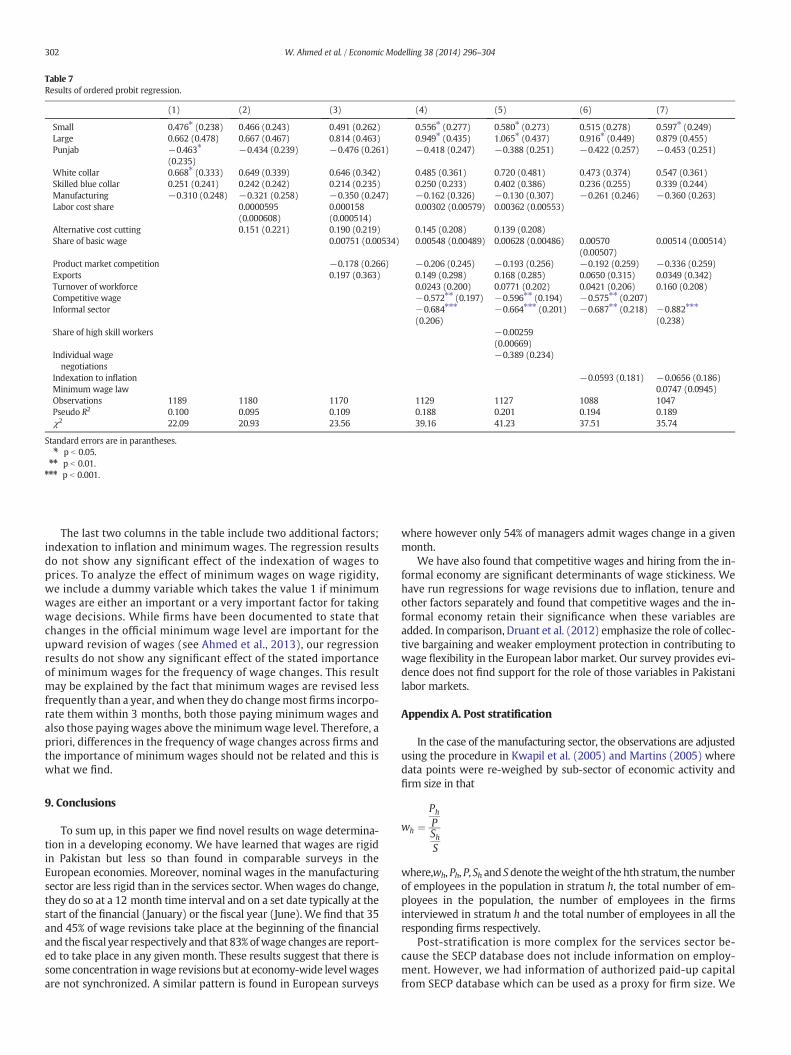
Table 7Results of ordered probit regression.
(1) (2) (3) (4) (5) (6) (7)
Small 0.476⁎ (0.238) 0.466 (0.243) 0.491 (0.262) 0.556⁎ (0.277) 0.580⁎ (0.273) 0.515 (0.278) 0.597⁎ (0.249)Large 0.662 (0.478) 0.667 (0.467) 0.814 (0.463) 0.949⁎ (0.435) 1.065⁎ (0.437) 0.916⁎ (0.449) 0.879 (0.455)Punjab −0.463⁎
(0.235)−0.434 (0.239) −0.476 (0.261) −0.418 (0.247) −0.388 (0.251) −0.422 (0.257) −0.453 (0.251)
White collar 0.668⁎ (0.333) 0.649 (0.339) 0.646 (0.342) 0.485 (0.361) 0.720 (0.481) 0.473 (0.374) 0.547 (0.361)Skilled blue collar 0.251 (0.241) 0.242 (0.242) 0.214 (0.235) 0.250 (0.233) 0.402 (0.386) 0.236 (0.255) 0.339 (0.244)Manufacturing −0.310 (0.248) −0.321 (0.258) −0.350 (0.247) −0.162 (0.326) −0.130 (0.307) −0.261 (0.246) −0.360 (0.263)Labor cost share 0.0000595
(0.000608)0.000158(0.000514)
0.00302 (0.00579) 0.00362 (0.00553)
Alternative cost cutting 0.151 (0.221) 0.190 (0.219) 0.145 (0.208) 0.139 (0.208)Share of basic wage 0.00751 (0.00534) 0.00548 (0.00489) 0.00628 (0.00486) 0.00570
(0.00507)0.00514 (0.00514)
Product market competition −0.178 (0.266) −0.206 (0.245) −0.193 (0.256) −0.192 (0.259) −0.336 (0.259)Exports 0.197 (0.363) 0.149 (0.298) 0.168 (0.285) 0.0650 (0.315) 0.0349 (0.342)Turnover of workforce 0.0243 (0.200) 0.0771 (0.202) 0.0421 (0.206) 0.160 (0.208)Competitive wage −0.572⁎⁎ (0.197) −0.596⁎⁎ (0.194) −0.575⁎⁎ (0.207)Informal sector −0.684⁎⁎⁎
(0.206)−0.664⁎⁎⁎ (0.201) −0.687⁎⁎ (0.218) −0.882⁎⁎⁎
(0.238)Share of high skill workers −0.00259
(0.00669)Individual wagenegotiations
−0.389 (0.234)
Indexation to inflation −0.0593 (0.181) −0.0656 (0.186)Minimum wage law 0.0747 (0.0945)Observations 1189 1180 1170 1129 1127 1088 1047Pseudo R2 0.100 0.095 0.109 0.188 0.201 0.194 0.189χ2 22.09 20.93 23.56 39.16 41.23 37.51 35.74
Standard errors are in parantheses.⁎⁎ p b 0.05.⁎⁎⁎⁎ p b 0.01.⁎⁎⁎⁎⁎⁎ p b 0.001.
302 W. Ahmed et al. / Economic Modelling 38 (2014) 296–304
The last two columns in the table include two additional factors;indexation to inflation and minimum wages. The regression resultsdo not show any significant effect of the indexation of wages toprices. To analyze the effect of minimum wages on wage rigidity,we include a dummy variable which takes the value 1 if minimumwages are either an important or a very important factor for takingwage decisions. While firms have been documented to state thatchanges in the official minimum wage level are important for theupward revision of wages (see Ahmed et al., 2013), our regressionresults do not show any significant effect of the stated importanceof minimum wages for the frequency of wage changes. This resultmay be explained by the fact that minimum wages are revised lessfrequently than a year, andwhen they do changemost firms incorpo-rate them within 3 months, both those paying minimum wages andalso those paying wages above theminimumwage level. Therefore, apriori, differences in the frequency of wage changes across firms andthe importance of minimum wages should not be related and this iswhat we find.
9. Conclusions
To sum up, in this paper we find novel results on wage determina-tion in a developing economy. We have learned that wages are rigidin Pakistan but less so than found in comparable surveys in theEuropean economies. Moreover, nominal wages in the manufacturingsector are less rigid than in the services sector. When wages do change,they do so at a 12 month time interval and on a set date typically at thestart of the financial (January) or the fiscal year (June). We find that 35and 45% of wage revisions take place at the beginning of the financialand thefiscal year respectively and that 83% ofwage changes are report-ed to take place in any given month. These results suggest that there issome concentration inwage revisions but at economy-wide levelwagesare not synchronized. A similar pattern is found in European surveys
where however only 54% of managers admit wages change in a givenmonth.
We have also found that competitive wages and hiring from the in-formal economy are significant determinants of wage stickiness. Wehave run regressions for wage revisions due to inflation, tenure andother factors separately and found that competitive wages and the in-formal economy retain their significance when these variables areadded. In comparison, Druant et al. (2012) emphasize the role of collec-tive bargaining and weaker employment protection in contributing towage flexibility in the European labor market. Our survey provides evi-dence does not find support for the role of those variables in Pakistanilabor markets.
Appendix A. Post stratification
In the case of the manufacturing sector, the observations are adjustedusing the procedure in Kwapil et al. (2005) and Martins (2005) wheredata points were re-weighed by sub-sector of economic activity andfirm size in that
wh ¼Ph
PShS
where,wh, Ph, P, Sh and Sdenote theweight of thehth stratum, the numberof employees in the population in stratum h, the total number of em-ployees in the population, the number of employees in the firmsinterviewed in stratum h and the total number of employees in all theresponding firms respectively.
Post-stratification is more complex for the services sector be-cause the SECP database does not include information on employ-ment. However, we had information of authorized paid-up capitalfrom SECP database which can be used as a proxy for firm size. We
303W. Ahmed et al. / Economic Modelling 38 (2014) 296–304
therefore split firms in services sector on the basis of authorizedpaid-up capital as small, medium and large firms according to lessthan Rs.15000000, Rs.15000000–50000000 and greater thanRs.50000000 respectively. The responses for the services sector in thispaper are therefore reported by post stratification using the followingweights
wh ¼Ch
Coho
where wh, wCh, C oh and o denote hth stratum weight, the paid-upcapital of the firm in the population in stratum h the total paid-upcapital of firms in the population frame, the paid-up capital of thefirms interviewed in stratum h and the total paid-up capital of thefirms in the sample.
Appendix B. DSGE simulations
To understand the importance of the stickiness parameters, both thewage and the price stickiness parameters are plugged into a dynamicstochastic general equilibrium model (DSGE) in order to generate theoutput response (from a steady state) to a monetary policy shock. Astandard DSGE model by Smets and Wouters (2007) is utilized for thispurpose. This model involves:
(i) Households with infinite life horizon, deriving utility fromconsumption and leisure,
(ii) time-varying habit formation in consumption,(iii) labor unions have bargaining power inwage setting, allowing for
Calvo type nominal wages stickiness,(iv) households rent capital to firms and decide how much to save
and howmuch to consume given the rental price and the adjust-ment costs they face in accumulating capital,
(v) firms maximize their profits by producing differentiated goods
Table A1Parameter values.
Parameters Values
EU Pakistan
Depreciation rate 0.025 0.025Steady state mark up in labor market 1.5 1.5Steady state share of govt. in output 0.18 0.18Curvature of Kimball goods aggregator 10 10Curvature of Kimball labor aggregator 10 10Capital share in production 0.19 0.19Steady state growth of economy 1.0043 1.0043Discount factor 0.9901 0.9901Intertemporal elasticity of substitution 1.38 1.38Steady state inflation 1.0078 1.0078Fixed cost 1.6 1.6Impact of TFP shock on fiscal shock 0.52 0.52Elasticity of adjustment costs 5.74 5.74External formation index 0.7 0.7Elasticity of labor supply 1.83 1.83
Bold denotes parameter values that differ from Smets and Wouters (2007).
given input prices, and set the price of their products in accor-dance with Calvo price stickiness,
(vi) when not optimizing, firms partially index their prices to past in-flation rates,
(vii) monetary authorities follow a Taylor type rule.
This model is rich in the sense that it incorporates a variety offeatures, such as sticky nominal prices and wages, habit formation inconsumption, the cost of adjusting capital, variable capital utilizationand fixed costs in production, hence providing an empirical frameworkto gauge the relative important of different frictions.21
A wage stickiness parameter for Pakistan that is calculated usinginformation taken from Table 4 and coupled with a price stickinessparameter for Pakistan taken from Choudhary et al. (2011). The samemeasures are obtained for the EU to provide a comparison. We thensimulate the model using different combinations of these two parame-ters i.e. (i) flexible wages and flexible prices, (ii) sticky wages and flex-ible prices, (iii)flexiblewages and sticky prices, (iv) relatively less stickyprice and sticky wage (Pakistan's case) and (v) both sticky price andwage (EU case). All other parameters are shown in the table belowand are taken from Smets and Wouters (2007). To simulate themodel we used Smets and Wouters' Dynare Code which is freelyavailable.
The figure in Section 5 shows the impulse responses of the outputgap following a one standard-deviation interest-rate shock for theabove five scenarios. As a result, we confirm Smets and Wouter's(2007) result that price stickiness is more important than wage sticki-ness for monetary policy to have an impact on real output. This is thereason that monetary policy is less effective in Pakistan (relatively lesssticky price and sticky wages) as compared to the EU case (whereboth prices and wages are sticky). The comparison shows that the im-pact is both bigger and longer lasting in the EU than in Pakistan. Thisprovides micro-founded evidence that monetary policy is less effectivein developing countries like Pakistan than in the developed economies,in spite of Pakistan having comparable levels of wage stickiness.
21 Detail of the model is readily available in Smets and Wouters (2007).
Parameters Values
EU Pakistan
Degree of price indexation 0.54 0.54Variable capital utilization parameter 2.04 2.04Taylor rule response to inflation 0.81 0.81Degree of interest rate smoothing 0.08 0.08Taylor rule response to output gap 0.22 0.22Taylor rule response to output gap 0.95 0.95TFP persistence 0.22 0.22Preference shock persistence 0.97 0.97Fiscal shock persistence 0.71 0.71Labor supply shock persistence 0.7165 0.7165Asset price shock persistence 1 1Moving average term in wage inflation shock 0.54 0.54Wage stickiness index (Calvo) 0.8 0.78Price stickiness index (Calvo) 0.75 0.25Degree of wage indexation 0.58 0.58
References
Agell, J., Lundborg, P., 1995. Theories of pay and unemployment: survey evidence fromSwedish Manufacturing firms. Scand. J. Econ. 97 (2), 295–307.
Ahmed,W., Choudhary, M., Khan, S., Mahmood, S., Zoega, G., 2013. “Sticky wages in a de-veloping country: evidence from structured interviews in Pakistan,” manuscript.
Álvarez, Luis J., Emmanuel Dhyne, M., Hoeberichts, C., Kwapil, H.L., Bihan, P., Lünnemann,F., Martins, R., Sabbatini, H., Stahl, P., Vermeulen, J. Vilmunen, 2006. Sticky prices inthe Euro area: a summary of new micro-evidence. J. Eur. Econ. Assoc. 4 (2–3),575–584.
Amirault, D., Kwan, C., Wilkinson, G., 2005. A survey of the price setting behaviour ofCanadian firms. Bank of Canada Review, Winter 2004–2005, pp. 29–40.
Asplund, M., Eriksson, R., Friberg, R., 2000. Price adjustments by a gasoline retail chain.Scand. J. Econ. 102 (1), 101–121.
Babecky, J., Du Caju, P., Kosma, T., Lawless, M., Messina, J., Rroom, T., 2009. DownwardNominal and Real Wage Rigidity: Survey Evidence from European Firms. EuropeanCentral Bank.
Babecky, Jan, Du Caju, P., Kosma, T., Lawless, Messina, J., Rõõm, T., 2012. How do Europeanfirms adjust their labour costs when nominal wages are rigid? Labour Econ. 19 (5),792–801.
Batini, N., Levine, P., Lotti, E., 2010. The costs and benefits of informality. School ofEconomics Discussion Papers 0211, School of Economics, University of Surrey.
304 W. Ahmed et al. / Economic Modelling 38 (2014) 296–304
Bertola, Giuseppe, Dabusinskas, Aurelijus, Hoeberichts, Marco, Izquierdo, Mario,Kwapil, Claudia, Montornès, Jeremi, Radowski, Daniel, 2012. Price, wage and employ-ment response to shocks — evidence from the WDN survey. Labour Econ. 19 (5),783–791.
Bewley, T.F., 1999. Why Wages Don't Fall During a Recession. Harvard University Press.Bils, M., Klenow, P., 2004. Some evidence on the importance of sticky prices. J. Polit. Econ.
112, 947–985.Blinder, A.S., Choi, D.H., 1990. A shred of evidence on theories ofwage stickiness. Q. J. Econ.
105 (4), 1003–1015.Blinder, A.S., Canetti, E.R.D., Lebow, D.E., Rudd, J.B., 1998. Asking About Prices: A New
Approach to Understanding Price Stickiness. Russell Sage Foundation, New York.Campbell III, C.M., Kamlani, K.S., 1997. The reasons for wage rigidity: evidence from a
survey of firms. Q. J. Econ. 112 (3), 759–789.Card, D., Hyslop, D., 1996. Does Inflation grease the wheels of the labor market? National
Bureau of Economic Research Working Paper Series, No. 5538.Cecchetti, S.G., 1986. The frequency of price adjustment: a study of the newsstand prices
of magazines. J. Econ. 31 (3), 255–274.Choudhary, M.A., Naeem, S., Faheem, A., Haneef, N., Pasha, F., 2011. Formal Sector Price
Discoveries: Results from aDeveloping Country. School of Economics. University of Surrey.Christiano, J.C., Eichenbaum, M., 2005. Nominal rigidities and dynamic effects of a shock
to monetary policy. J. Polit. Econ. 113 (1), 1–45.Druant, Martine, Fabiani, Silvia, Kezdi, Gabor, Lamo, Ana, Martins, Fernando, Sabbatini,
Roberto, 2012. Firms' price and wage adjustment in Europe: survey evidence onnominal stickiness. Labour Econ. 19 (5), 772–782.
Elsby, M.W.L., 2009. Evaluating the economic significance of downward nominal wagerigidity. J. Monet. Econ. 56 (2), 154–169.
Estevao, M., Filho, D.C., 2012. Institutions, Informality, and Wage Flexibility: Evidencefrom Brazil. International Monetary Fund.
Fabiani, S., Loupias, C., Martins, F., Sabbatini, R., 2007. Pricing Decisions n the Euro Area:How Firms set Prices and Why. Oxford University Press, Inc.
Fregert, K., Jonung, L., 1986. Monetary regimes and the length of wage contracts. Unpub-lished, University of Lund.
Galuscak, K., Keeney, M., Nicolitsas, D., Smets, F., Strzelecki, P., Vodopivec, M., 2010. TheDetermination of Wages of Newly Hired Employees—Survey Evidence on InternalVersus External Factors. European Central Bank.
Hall, S., Walsh, M., Yates, A., 2000. Are UK companies' prices sticky? Oxf. Econ. Pap. 52 (3),425–446.
Kaufman, R.T., 1984. On wage stickiness in Britain's competitive sector. Br. J. Ind. Relat. 22(1), 101–112.
Kwapil, C., Baumgartner, J., Scharler, J., 2005. The price-setting behavior of Austrian firms -Some survey evidence. Working Paper No 464, European Central Bank.
Lozev, I., Vladova, Z., Paskaleva, D., 2011. Wage-setting behaviour of bulgarianFirms: evidence from survey data, Discussion paper No. 87. Bulgarian NationalBank.
Martins, P., 2005. The Inter-Industry Wage Structure of U.S. Multinationals. Econ. Bull 10(1), 1–7.
Montornes, J., Saunder-Leroy, J.B., 2009. Wage-setting behavior in France: additionalevidence from an ad-hoc survey. Working Paper Series No 1102. EuropeanCentral Bank.
Olivei, G., Tenreyro, S.D., 2008. Wage setting patterns and monetary policy: internationalevidence. CEP Discussion Papers dp0872. Centre for Economic Performance, LSE.
Rotemberg, J.J., 1982. Sticky prices in the United States. J. Polit. Econ. 90 (6), 1187–1211.Smets, F., Wouters, R., 2007. Shocks and frictions in US business cycles: a Bayesian DSGE
approach. Am. Econ. Rev. 97 (3), 586–606.Zoega, G., Karlsson, T., 2006. Does wage compression explain rigid money wages? Econ.
Lett. 93 (1), 111–115.