Embed Size (px)
Citation preview

38th European Regional Science Association CongressAugust 28 to September 1, Vienna
Determinants of Regional Variations in the Rate of Profit
An Empirical Analysis for Austrian Manufacturing 1972-1992
Christian RammerDepartment of Regional Studies
Business Division Systems Research Technology-Economy-EnvironmentAustrian Research Centre Seibersdorf
A-2444 SeibersdorfTel: +43-2254-780-3889Fax: +43-2254-780-3888
e-mail: [email protected]
Abstract
The profit rate represents a central concept in economics and is commonly seen as one of the most accurate indicators of
economic vitality of firms, industries, and regions. The profit rate is expected to influence a number of economic
processes, such as capital flows, technological change, and long-term shifts in economic activities. In regional
economics, spatial variations in profitability are supposed to guide investment over space which affects the speed of
regional accumulation and regional economic structures. Thus, differences in regional profit rates may be a major source
for differences in regional economic development. An analysis of factors determining the regional level of profitability
might deepen the understanding of regional development processes.
Despite the theoretical attention which is paid to the rate of profit in regional economics there is a significant lack in
empirical studies. A major reason might be the poor quality or even absence of adequate data. In this paper, an attempt
is made to measure profit rates for Austrian regions on a highly disaggregated regional level (97 districts) and a 21-year
period (1972-1992). An explanatory conceptual model is employed in order to identify variables which affect regional
profit rate variations. Three groups of determinants are distinguished: structural characteristics of a regional economy
(production technology, market structures, capital-labour-relations), spatial characteristics of a regional economy (i.e.
transactions costs and spatial externalities) and firm- and location-specific efficiencies (in terms of production process,
market success and wage bargaining). The model is estimated by the means of multiple regression analysis. The
empirical results indicate that variables characterising firm- and location specific efficiencies explain the highest
proportion of the variance in regional profit rates. Structural characteristics of a regional economy play an important
role in explaining regional profit rate variations, too. Explicit spatial variables seem to be of little significance, however.
2
ERSA’98 C. Rammer: Determinants of Regional Variations in the Rate of Profit
1. Introduction
The profit rate might be viewed as the most accurate indicator for the competitiveness of firms and
economic aggregates (such as industries, regions and nations) in a capitalist economy. Defined as
the ratio of profits obtained on capital advanced in a certain period of time, it measures the success
of the capitalist accumulation process. Consequently, the profit rate is a central variable in
economics in order to explain investment, innovation patterns, technological shifts and long-term
economic changes in almost all schools of thought (see Duménil and Levy 1993; Howard 1983;
Pasinetti 1974; Aglietta 1979; Wallerstein 1979).
In standard regional economic models, the profit rate explains capital flows among regions and
regional investment patterns and is therefore seen as a crucial variable for regional economic
development (see for example Armstrong and Taylor 1992; Borts and Stein 1964; Siebert 1969,
Richardson 1973): As capital tends to be allocated in economic activities which are expected to
generate the highest revenue per capital input, regional economies which show advantageous
conditions for profitable capital allocation will attract additional capital inflows to the disadvantage
of less profitable regions. Such capital allocation behaviour will contribute to an uneven speed of
capital accumulation and may result in different speeds of regional economic growth (see Webber
1987, 1989. 1996, 1997). Despite its central role in regional economic theory, empirical analysis of
regional profit rate variations, its determinants and its impacts on regional economic development
are widely missing (some exceptions are Rigby 1990, 1991 for Canadian regions and Fothergrill et
al. 1984; Bayldon et al. 1984; Coombes et al. 1991 for some UK-regions).
A major reason for this shortcoming might be seen in the lack of adequate data on a sufficiently
disaggregated regional level. In this paper, an attempt is made to empirically analyse the
determinants of regional variations in profit rates by using data on manufacturing profitability in 97
Austrian regions for the time period 1972-1992. The analysis is based on an explanatory conceptual
model which distinguishes three groups of variables expected to affect regional profit rates:
structural characteristics of a regional economy (i.e. production technology, market structures,
capital-labour relations), spatial characteristics of a regional economy (i.e. transactions costs and
spatial externalities) and firm- and location-specific efficiencies (in terms of production process,
market success and wage bargaining). Each group of determinants is represented by a set of
variables designed to seize different theoretically relevant aspects. The aim of the model is to
identify the contribution of the variables considered to deviations of regional profit rates from the
national average. The analysis is static and cross-sectional of nature, although changes in the
relative significance of variables over time are considered by using a 21-year time series for
analysis.

3
ERSA’98 C. Rammer: Determinants of Regional Variations in the Rate of Profit
Special efforts are undertaken to generate consistent data on profit rates on a highly disaggregated
regional level for the time period analysed. A regional capital model is developed and estimated in
order to calculate regional capital stock data. Profits are measured by employing a gross profit
concept which does not refer to balance-sheet surplus data but rather covers all types of profits
(including capital taxes, land rent and interests on outside capital). In the following section, the
theoretical framework of the empirical analysis will be discussed. Section 3. describes the data base
of the empirical analysis. In section 4., estimation results of the conceptual model are presented. The
main findings of the analysis finish the paper.
2. A Conceptual Model
An analysis of regional profit rate variations is an analysis of variations in the average profitability
of firms in different regions. In order to identify determinants of regional profit rates variations it
makes sense to start with a discussion of profitability variations among firms. In industrial
economics, there is a long debate on the sources of profit rates variations and their behaviour over
time and space (see Stigler 1963; Schwalbach 1985; Mueller 1986; Semmler 1984). In dynamic
competitive capitalist economies, differences in the economic success of individual firms are likely
to occur: Product innovation may allow for higher product prices and the achievement of extra
profits. Process innovation will reduce production costs and raise profits given a certain market
price. Market dynamics will change supply-demand relations, affect input and output prices for
firms and thus change profit margins. Disputes between workers and capitalists on the level of
wages and working conditions will affect production costs and productivity and change distribution
relations between labour and capital over a firms’ total income.
In general, the different sources of differences in firms’ profitability may be attributed to three types
of arguments. They refer to the realisation, production and distribution side of economic activities,
respectively (see Howard 1983; Duménil and Lévy 1993):
• Market structure and profitability: In a fully competitive economy, any occurring profit rate
variations among firms should be equalised by the competition process: Markets which show
higher profitability prospects will attract additional firms to entry the market (i.e. lead to an
inflow of capital) which will result in increased supply and falling prices. Together with an
enlarged stock of capital, profit rates in these markets are likely to fall (although market entries
may cause counteractive effects, such as an increased speed of technological change in the
industry, improved production efficiencies in established firms or a raise in positive externalities,
which keep profit rates above average). In the case of oligopoly market structures, i.e. if there are
barriers to entry the market and/or there is a regime of restricted supply in order to sustain high
market prices, prices may be kept significantly above production costs and allow for sustaining
4
ERSA’98 C. Rammer: Determinants of Regional Variations in the Rate of Profit
extra profits (see Mueller 1990a; Geroski and Machin 1993; Grabowski and Mueller 1978).
Oligopoly market structures are likely to occur if firm concentration in an industry is high, if
there is an administrative restriction of new entries, if market entry is associated with
extraordinary high costs or if there is a ’natural monopoly’.
A special case of market structures which lead to (temporary) extra-profits is monopoly power
due to product innovation which was especially stressed by Schumpeter (1926, 1939) as a major
source for above average profits. Successful market introduction of a new product (with a higher
use-value than alternative products) should allow for the realisation of a market price
significantly higher than production costs which both compensate the innovation efforts and
guarantee an ’innovation rent’ for the innovator.
• Production technology and profitability: Assuming competitive markets (with given input and
output prices for all firms), a firm may obtain a profit advantage vis-à-vis other firms if it is able
to produce a unit of output at lower costs, i.e. to produce more efficient. If input prices are fixed,
a better production technology and/or organisation will be the major source for higher production
efficiency. Improvements in production technology may take a variety of forms such as a more
effective combination of input factors in the production process, the exploitation of scale
economies and economies of scope or the development of new production techniques (see
Grabowski and Mueller 1978). These improvements correspond to Schumpeter’s (1926, 1939)
concept of process innovation and organisational innovation.
Furthermore, the production technology will affect profitability of firms in different industries in
the case of industry-specific capital intensities. Industry variations in capital intensity may stem
from different techniques of material processing which require specific ratios of capital to labour
inputs and show specific capital and labour productivity patterns. If constant returns to scale are
assumed, more capital-intensive industries should show lower profit rates.
• Capital-labour relations and profitability: In the case of fully competitive goods markets and
uniform production technologies, profitability may still vary among firms due to differences in
wage rates, i.e the input costs for a unit of labour, and differences in physical labour productivity,
i.e. the physical output per input of labour (under a given production technology). Such
differences can be attributed to differences in the ability of workers to obtain higher wages and
improved working conditions, and differences in the ability of firms (respectively their
managers) to increase the working intensity per hour worked (see Braverman 1974). Variables
affecting these abilities are - among others - the organisational strength of workers (degree of
unionism), the structure of the labour market (degree of unemployment) and political settings
(industrial law etc.) (see Glyn and Sutcliffe 1972).
The bargaining of the wage rate - in relation to labour productivity (nominal output per unit of
labour) - may be regarded as the main variable determining the distribution of a firm's net
5
ERSA’98 C. Rammer: Determinants of Regional Variations in the Rate of Profit
income on capital and labour. In capitalist economies, wage rates are not the result of technical
relations between input and output quantities (as proposed in neoclassical wage theory) but of
negotiations between workers and firms, influenced by economic fundamentals, social norms
and political regulations. Distribution relations within a firm, and subsequently profitability, thus
heavily depends on the outcome of these negotiations and the bargaining power of the parties
involved.
From a regional perspective, there are several reasons why the sources for profit rate variations
among firms mentioned above will vary on a regional level (see Harvey 1982; Sheppard and Barnes
1990; Peet and Thrift 1990; Storper and Walker 1989):
• Regional economic structures: As a result of the historical development of a region and its
position within the system of spatial division of labour, regions are specialised on certain
economic activities. They show specific factor availabilities, a certain type of production
technology with associated paths of technological change, and the firms located in a region are
confronted with certain market structures. There is a large body of literature on the spatial factors
affecting technological change and the firms' possibilities for successful innovation (see Malecki
1991). On the base of a sectoral profit cycle model (with innovation opportunities, corporate
strategies, market demands and market structures, and production technologies as the main
variables) Markusen (1985) has formulated the spatial manifestations of such a profit cycle
showing that profit rates will vary systematically between regions with different specialisation
patterns. The economic and social development in a region will also result in distinct social
structures, reproduction levels for workers, regional labour market structures, degrees of
unionism etc. which all may affect regional wage rates (see Peet 1983).
• Transaction costs: In a spatial economy, uniform prices for inputs, outputs and labour as well as
uniform production technologies do not guarantee uniform rates of profits among all firms as
long as costs for delivering and supplying goods required for the production process appear.
These costs are termed transaction costs and depend on the input and output structure of a firm,
goods-specific transportation costs and the locations of supply and demand (see Sheppard and
Barnes 1990; Sheppard 1987, 1990). The more distant supply and demand locations are the
higher will be transaction costs. Classical industrial location theory (see Weber 1929) especially
refers to this factor as determining firm location behaviour.
• Spatial externalities: Different locations offer different types and intensities of externalities
which positively or negatively affect production costs, technological change and market
opportunities at the firm level. Externalities may stem from infrastructure supply, the number
and variety of other firms located nearby (such as producer services), large diversified labour

6
ERSA’98 C. Rammer: Determinants of Regional Variations in the Rate of Profit
markets or the potential to cooperate with and learn from other actors (which may be
summarised as urbanisation economies). There may be, however, agglomeration diseconomies
such as congestion costs in transportation, land shortage (in the case of expansion plans) or high
land costs.
Regional economic structures (and the underlying historical path of regional development),
transactions costs and agglomeration economies will directly affect firm profitability through their
effects on production costs, technological change and market access. Furthermore, there will be
indirect effects of these ’location-specific’ characteristics on the profitability of a region’s firms.
They create a specific regional milieu and build a framework for every day decisions of firms and
the utilisation of location advantages resulting in different firm-specific levels of efficiency
profitability.
In order to empirically investigate the determinants of regional variations in manufacturing
profitability, a conceptual model is employed which shall allow for the analysis of the impact of
each of the factors discussed above on regional profit rates. Regional profit rate variations are
assumed to be influenced by three groups of determinants:
• structural characteristics of a regional economy, i.e. the aggregated characteristics of the
manufacturing firms in a region in terms of production technology, market structure and capital-
labour relations,
• spatial characteristics of a regional economy, i.e. the direct effects of the location such as
transaction costs and spatial externalities,
• firm- and location-specific efficiencies, i.e. the ability of firms located in a region to realise
efficient production processes, high market success (in terms of extra profits) and advantageous
wage bargaining, given the structural characteristics of the regional economy as a framework.
Figure 1: A conceptual model for analysing the determinant of regional profit rate variations
variations inregional
rates of profit
variations in structural characteristicsof regional economies
production technology
marketstructure
capital-labourrelations
variations in spatial characteristicsof regional economies
transaction costs
urbanisationeconomies
agglomerationdiseconomies
variations in firm- and location specific efficiencies
production process
marketsuccess
wagebargaining

7
ERSA’98 C. Rammer: Determinants of Regional Variations in the Rate of Profit
Figure 1 shows the basic structure of the model. The spatial characteristics are expected to affect
both the structural characteristics of a regional economy (i.e. its industry structure and its position in
the spatial division of labour) and the firm- and location-specific efficiencies. The latter will also be
influenced by the regional economic structure which affects, for example, corporate market
strategies and technological opportunities. In the following, for each group of determinants the
variables used for the empirical testing of the conceptual model are discussed. The selection and
definition of the variables especially refers to the situation in the manufacturing sector of the
Austrian regional economies in the time period under cover as this being the focus of empirical
study.
The structural characteristics of a regional economy shall represent the effects of the aggregated
production technology employed in a region, the average market structures a region’s firms are
confronted with, and the structural aspects of a region affecting the wage bargaining process. In
Table 1 the variables and the associated empirical indicators used for this purpose are listed. The
selection of variables is based on theoretical considerations but strongly influenced by the
availability of empirical indicators on the regional level of analysis in order to measure these
variables. Because of lack of data, some theoretically important aspects had to be taken out of
consideration.
The aggregate production technology applied in a region mainly affects regional profitability via its
effects of physical productivity. If production in a certain region is more efficient, physical output
per unit of input will exceed that of other regions. If input prices and labour costs are identical in all
regions, this productivity advantage should result in higher profitability. In principal, production
efficiency depends on the quality of the factors of production employed and the way of how these
factors are combined in the production process. In literature, a wide range of indicators is proposed
for measuring these aspects. Due to data restrictions, the following four indicators are used here:
First, the input factor relation (capital input to labour input relation) should reflect the degree of
mechanisation of the production process. It is assumed that a high amount of capital employed per
unit of labour (i.e. a high capital intensity) reflects a high degree of mechanisation. A high capital
intensity in a region will, however, have a positive effect on the region’s profitability vis-à-vis other
regions only if higher capital intensity is associated with higher capital productivity (under ceteris
paribus conditions). In general, this will be the case if there are increasing returns to capital.
Second, the smooth of production organisation is measured by the turnover time of capital which is
defined as the relation of inventories to the total costs of production and indicates the average
duration for producing one unit of output. A short turnover time of capital is an indicator for a well-
organised process of production as capital is tied up in production only for a short time. Third, the
quality of human capital employed in production is measured – in the absence of more adequate

8
ERSA’98 C. Rammer: Determinants of Regional Variations in the Rate of Profit
indicators - by the means of a simple skill indicator, namely the share of salaried employees. In
Austrian manufacturing, salaried employees are mainly engaged in managerial, administrative and
R&D-oriented tasks. A high share of this category of labour is assumed to reflect a more
sophisticated production process which generally requires well educated labour. Fourth, the quality
of the stock of capital advanced in production is represented by the speed of capital renewal (i.e.
gross fixed capital investment as a share of the total stock of fixed capital). It is assumed that new
investment (both substitutive and expansive investment) always uses the newest technology
available and, therefore, a high investment ratio will reflect a technologically relatively up-to-date
stock of capital.
Table 1: Variables and empirical indicators used for representing structural characteristics of a regional economy asdeterminants of regional variations in the rate of profit
Structural Characteristics Variables Empirical Indicators
Production Technology Input Factor Relation Capital Intensity (capital advanced perhour worked)
Production Organisation Turnover Time of Capital (inventories tototal costs of production ratio)
Quality of Human Capital Labour Skills (employment share ofsalaried employees)
Renewal Speed of Capital Investment Ratio (gross investment perunit of capital stock)
Market Structure Market Demand Dynamics Capacity Utilisation Ratio(effective output per potential output)
Relevance of Protected Markets Employment Share in Sectors withImport Protection
Relevance of Oligopoly Power Employment Share in Sectors with HighFirm Concentration
Relevance of Product Innovations Patent Intensity (applied patents pernumber of employees)
Barriers to Market Entry Firm Dynamic (employment share innewly founded and closed plants)
Capital-Labour Relations Minimum Reproduction Level Hypothetical Minimum Wage Level based onCollective Agreement
Relevance of Discriminated Workers Employment Share of Women
Labour Market Structure Unemployment Ratio (registeredunemployed per number of employees)
Bargaining Power of Workers Employment Share in Small Private Owned Firms
Bargaining Power of Workers Employment Share in State-Owned Firms
The market structure a regional economy is confronted with represents the aggregate market
conditions for the individual firms in a region. In general, market structures refer to the demand side
(from the perspective of the regional firms) and should reflect market dynamics and competition.
Special attention is paid to market characteristics which support firms in gaining extra profits (such

9
ERSA’98 C. Rammer: Determinants of Regional Variations in the Rate of Profit
as protection from potential competitors, oligopoly supply structures, barriers to market entries,
advantages in market access vis-à-vis other firms, relevance of product innovation). Given the sever
data restrictions on the regional level, the following indicators are used in order to represent the
average market structure of a regional economy: General market dynamics, which indicate the
significance of market fluctuations, are measured in terms of capacity utilisation ratio (effective
output as a percentage of potential output). A low capacity utilization ratio indicates problems in the
realisation of the values produced in a region which may be caused by declines in demand and/or
declines in market shares. In the case of sharp, short-term declines (e.g. due to exogenous shocks)
low levels of capacity utilisation are usually associated with a growing share of fixed costs and
build-up of inventories and may lead to reduced profitability.
In order to cover different aspects of market power, three indicators are used. The regional share of
sectors with import protection shall represent the significance of protected market, a phenomenon
relevant to the Austrian economy in the whole period of analysis. Although deregulation and market
liberalisation started during the 70s (EC-EFTA treaties) some sectors kept protected until Austrias
joining the EU in 1995. The relevance of oligopoly power is measured in terms of the regional share
of sectors with high firm concentration. Firm concentration is measured in terms of industry-
specific concentration ratios and refers to the market share of the four largest firms within a certain
industry. This indicator is widely used in empirical studies on market power (see Mueller 1986,
1990b; Cubbin and Geroski 1990; Aiginger 1993; Salinger 1984; Smirlock et al. 1984). It is
assumed that highly concentrated markets show oligopoly pricing behaviour and that all firms active
in a highly concentrated markets profit from oligopoly prices.
The effect of temporary monopoly market power due to product innovation on profitability is
extremely difficult to measure. While there is little doubt that successful market introduction of new
products should have positive effects on the actual profitability of the innovator, the aggregated
effect on regional profitability depends, among others, on the quantitative significance of the
innovation in total regional turnover, on the preceding costs associated with the innovation, and on
the market demand for the new product. In the absence of adequate data, a crude indicator – patent
intensity – is used to seize at least some aspects of innovation impacts on profitability. However, the
patent intensity indicator (i.e. number of applied patents per employee) also covers process
innovation whose profitability effects are less clear than in the case of product innovation.
Furthermore, there are further shortcomings: patent application behaviour varies systematically
between fields of technology, there is strategic patenting, and the quality of patents differ extremely
(see Grilliches 1990).
Another market related variable relevant for regional profitability are barriers to market entries. If
there are no barriers to entry into a market temporary extra-profits of firms already being inside the
10
ERSA’98 C. Rammer: Determinants of Regional Variations in the Rate of Profit
market will erode and a competitive equilibrium price (and, in consequence, a competitive
equilibrium rate of profit) will prevail. On the other side, institutional or cost-related barriers to
entry (such as high investment, research or marketing costs) may hinder new firms to entry and
allow for sustaining extra profits. In order to measure barriers to entry in a proper way, information
on entry barriers for all markets relevant to a regional economy would be necessary. In the absence
of these detailed information, regional firm dynamic (employees in newly founded and in closed
firms as a percentage of total regional employment) is used as an indicator. It is assumed that new
firm formation and closures of firms mainly take place on markets with little barriers to entry (i.e.
competitive markets). If a region shows an above average firm dynamic it is likely that competitive
markets are more important to that regional economy than in regions with a low firm dynamic. On
the other side, low firm dynamic may be associated with rigid market structures if a region’s stock
of firm persevere in relatively closed market segments.
Capital-labour relations attempt to comprise structural aspects of a regional economy which are
relevant to the wage bargaining process in a region and the determination of the regional wage level.
Four variables are distinguished: the minimum reproduction level in a region, the regional
significance of socially discriminated groups of workers within the regional work force, the
structure of the regional labour market with special regard to intra-labour competition due to high
unemployment levels, and structural aspects affecting the bargaining power of workers in wage
negotiations on the firm level. The minimum reproduction level in a region shall indicate the costs
at least necessary to reproduce the labour employed given the socially accepted minimum standard
of living in a society. It is mainly influenced by the national level of social development, but varies
between regions due to different costs for housing, food, social reproduction etc. In the absence of
detailed regional information on the price level for different commodities constituting the average
basket of reproduction commodities, an indirect indicator is used, i.e. the (industry-specific)
minimum wage level based on collective agreement between unions and capital representatives
weighted by industry-shares in regional employment. This indicator might be termed hypothetical
minimum wage level. In the case of Austria, collective wage agreements are reached on industry
levels with nation-wide validity for all firms. In a given industry, it represents the minimum wage
level for one unit of labour (differentiated by levels of qualification) which no firm can legally
undercut. Usually, this minimum wage level represents the starting point for firm-specific
negotiations on individual wages and other forms of labour remuneration.
The regional significance of socially discriminated groups of workers is used to cover the extent to
which firms attempt to lower wage costs by employing members of discriminated groups, e.g.
groups which have to accept a lower level of reproduction than the average despite an average
productive potential of their labour power. In the context of Austria in the period under
consideration, women and foreign workers are the most important discriminated groups on the

11
ERSA’98 C. Rammer: Determinants of Regional Variations in the Rate of Profit
labour market. Due to data restrictions the regional share of discriminated groups of workers is
observed for women, only. The structure of the regional labour market comprehends several aspects
which are likely to affect regional wage rates. With respect to determinants of profitability, the
aspect of intra-labour competition seems of particular relevance. If supply of labour exceeds
demand and regional unemployment raises (given restrictions to outmigration), firms will gain from
a stronger position in wage bargaining processes and may depress wage levels. An adequate
indicator is the general rate of unemployment in a region (both for the manufacturing and non-
manufacturing sector).
A widely used indicator for the wage bargaining power of workers is the unionisation ratio, i.e. the
percentage of worker organised within unions. However, no regionally disaggregated data for the
manufacturing sector are available in Austria. In order to cover this aspect in the model, firm-
structure variables are used. The regional share of employment in small private owned firms should
indicate the difficulties for workers to unionisation and representation of their interests in such firm
environments. On the other side, the regional share of employment in state owned firms (of what
size ever) should indicate favourable firm environments for unionisation which are likely to result
in considerably high unionisation rates in state owned firms. It is assumed that the possibility for
union activities has positive effects on wage levels and consequently affect firm profitability
negatively .
Table 2: Variables and empirical indicators used for representing spatial characteristics of a regional economy asdeterminants of regional variations in the rate of profit
Spatial Characteristics Variables Empirical Indicators
Transaction Costs Average (Spatial) Market Distance Travel Time to Important Market Locations(weighted by their relative significance)
Availability of Express Traffic Transport Infrastructure Density (length ofmotorways and main railway lines per unitof settlement area)
Spatial Externalities Urbanisation Economies Firm Potential (number of firms inmanufacturing and producer services within30 min. travel time)
The spatial characteristics of a regional economy should represent the effects of variables on firm
profitability which are directly determined by the location and spatial structure of a region.
Transaction costs and spatial externalities may be considered among the most important of these
variables (see Table 2). Transaction costs contribute to spatial variations in production prices even
in the case of uniform input prices and labour costs for all producers and will affect regional profit
rates (see Sheppard 1987, 1990; Sheppard and Barnes 1990). In general, transaction costs consist of
two aspects: the spatial structure of suppliers and customers of a region’s firms (and the
corresponding supply and distribution of commodities), and the quality of the transport system
12
ERSA’98 C. Rammer: Determinants of Regional Variations in the Rate of Profit
determining the transport costs per unit of commodity and distance. In order to measure the first
aspect, a market accessibility indicator is used representing the average distance (measured in terms
of road travel time) to the most important market locations, each weighted by their relative
economic significance. Because of lack of data, no region-specific weights of the economic
significance of markets are available so that average weights for total Austrian manufacturing are
applied for each region. The aspect of transport system quality is represented by the availability of
express traffic infrastructure, i.e. the length of motorways and main railway lines per unit of
settlement area, and shall indicate the stage of development of the regional transport system.
Urbanisation economies refer to positive externalities stemming from the proximity to other firms
and result, among others, in cost advantages and favourable preconditions for innovative activities.
Spatial clustering of firm activities support inter-firm cooperation, knowledge spillovers and human
capital development, a large number of suppliers and customers ease the utilisation of scale
economies and economies of scope (see Krugman 1991, 1994). These advantages may contribute to
higher firm profitability. A firm potential measure (number of firms in manufacturing and producer
services within a 30 minutes travel time area) is used in order represent this aspect in the conceptual
model. Spatial clustering of economic activities can cause agglomeration diseconomies, too, which
may affect profitability negatively due to higher costs. Such cost raising effects of agglomerations
are, for example, high land costs, land shortage and congestion costs due to capacity shortages in
transport infrastructure. The former will affect profitability only in the case that land rent is
conceptualised as a cost factor rather than a profit component. Due to lack of data, no adequate
empirical indicator can be constructed for agglomeration diseconomies. Thus, this aspect of spatial
characteristics remains unrepresented in the model.
The structural and spatial characteristics of a regional economy distinguished above are expected to
affect firm profitability via two main channels: through nominal factor productivity (output in
monetary units per unit of factor inputs) and through the wage rate (remuneration for all labour
inputs per unit of labour). The effects of factor productivity and the wage rate on the level of the
rate of profit can be shown by an analysis of definitory relations. The rate of profit r (r=P/K; P
being profits and K being capital advanced) can be decomposed into five components: the nominal
labour productivity y (y=Y/L; Y being net output in monetary units which is equal to net income,
and L being labour input); the nominal capital productivity z (z=Y/K), the wage rate w (w=W/L; W
being wages); the profit share q (q=P/Y); and the wage share v (v=W/Y). By definition
ti
tit
i
ti
ti
ti vq
wzyr ⋅⋅⋅⋅≡ 1 [1]
All variables refer to a certain region i and period of time t. The variables characterising the
distribution of total income between capital and labour, q and v, are both determined by the wage
13
ERSA’98 C. Rammer: Determinants of Regional Variations in the Rate of Profit
rate w and labour productivity y, as income (output) Y is by definition the sum of wages W and
profits P:
ti
tit
i
ti qv
y
w−≡≡ 1 [2]
Thus, the rate of profit is determined by the productivity of labour and capital inputs and the wage
rate. The higher the level of factor productivity and the lower the level of wages per unit of labour
(both compared to other regions), the higher will be the regional profit rate. The three aspects of
structural characteristics (production technology, market structure, capital-labour relations) and the
spatial characteristics of regional economies contribute in certain ways and to certain extents to the
level of factor productivity and the wage rate. The wage rate is supposed to be affected first of all by
the capital-labour relations prevailing in a region (although some indirect effects of production
technology and spatial characteristics may be postulated, too). Factor productivity, however, is
assumed to be mainly influenced by production technology, market structures and spatial
characteristics. In order to discuss the effects of these groups of variables, another definitory
analysis is useful. The total output Y is defined as the total turnover less all costs of production C
except wages W (i.e. material supply, capital depreciation, transport, energy etc.). The turnover is
the product of physical output Q weighted by the average market price for one unit of output p:
)( ti
ti
ti
ti
ti WCQpY −−⋅≡ [3]
Per unit of factor inputs L and K, [3] transforms into
),(
)(
),(),( ti
ti
ti
ti
ti
ti
ti
tit
iti
ti
ti
ti
KLf
WC
KLf
Qp
KLf
Y −−≡ [4]
where ),( ti
ti
ti KLf represents the functional relation of the input factors labour and capital in
determining output specific to region i in time period t. The production technology applied in a
region mainly affects factor productivity via the level of physical gross factor productivity, i.e. the
physical gross output Q per unit of factor inputs L and K. The level of ‘material productivity’, i.e.
the quantity of materials (measured in monetary units: C-W) handled per unit of factor inputs L and
K in the production process, will be positively affected by the production technology applied, too.
Its major determinant, however, is assumed to be the costs of material inputs necessary in
production which are affected by a firm’s position on the supply market as well as by transaction
costs and agglomeration diseconomies. The higher these costs are, the lower will be the level of
factor productivity, all other variables being constant. Market structures are assumed to have a
significant effect on the price p of a physical unit of output achieved at the market which positively
14
ERSA’98 C. Rammer: Determinants of Regional Variations in the Rate of Profit
affects factor productivity. Externalities due to urbanisation economies should contribute to factor
productivity via increased physical productivity (because of favourable conditions for innovation)
and via lower costs of production.
The structural and spatial characteristics of a regional economy discussed above are expected to
explain a certain fraction of the level of factor productivity and the wage rate, respectively, being
observed in a certain region i in period t. There are, however, other factors determining these
variables not covered by the structural and spatial characteristics. These variables are termed firm-
and location specific efficiencies and refer
� first, to the ability of firms located in region i to raise the level of factor productivity above the
level which might be expected because of the structural and spatial characteristics of region i,
and,
� second, to the ability of capital (and labour, respectively), to lower (raise) the level of the wage
rate below (above) the level which might be expected because of the structural and spatial
characteristics of region i.
The efficiency variables are measured on the base of a regional factor productivity model and a
regional wage rate model. Efficiency variables indicate the deviation of the observed factor
productivity z and wage rate w, respectively, in region i in period t from the expected values:
ti
tit
iz
z
ze
ˆ= [5a]
ti
tit
iw
w
we
ˆ= [5b]
where ti
we is the productivity efficiency and ti
we is the wage efficiency in region i in period t. The
expected values for factor productivity tiz are derived from the parameters estimated by a factor
productivity model with the following principal structure:
),,( ti
ti
ti
ti SEMSPTfz = [6]
where tiPT represents structural aspects of the production technology applied in region i in period t
(see Table 1), tiMS represents structural aspects of the average market structure a region i is
confronted with in period t (see Table 1), and tiSE represents aspects of spatial externalities which
are specific to region i in period t (see Table 2). Model [6] will be estimated over all regions i and
all periods of time t, producing global coefficients for the variables considered (see Section 3).
These global parameters are used together with the observed values for the individual variables in
region i and period t in order to calculate the expected factor productivity tiz . For the expected wage
15
ERSA’98 C. Rammer: Determinants of Regional Variations in the Rate of Profit
rate in region i and period t ( tiw ) the same procedure is applied, employing a wage rate model of the
following principal structure:
)( ti
ti CLRfw = [7]
where tiCLR represents structural aspects of the capital-labour relations prevailing in region i in
period t (see Table 1).
3. Data Sources
In this section, the operationalisation of regional profit rates (as dependent variable of the model
discussed above) and of the independent model variables are discussed. The model is estimated for
Austrian manufacturing for the time period 1972 to 1992 on a year-to-year base. The period under
consideration covers the last phase of the post-war prosperity in Austria which ended in 1975 with a
sharp recession, followed by a ten year period of relatively low rates of economic growth. From
1987 to 1992, another period of high growth rates could to be observed. Regions i are defined as 97
administrative districts representing a very detailed regional base. The manufacturing sector is
defined as all firms having their main economic activity in production but excluding electricity
production and construction industry. Firms with more than one location are registered at each
location separately.
The rate of profit is defined as the sum of profits P realised in period t by firms in region i per unit
of capital advanced K:
ti
tit
iK
Pr = [8]
Within this general definition, there are several alternatives for operational specification with
respect to the categories of profits and capital considered. In this analysis, the rate of profit is
specified as general rate of profit in the productive sector. All categories of capital advanced in
productive activities (stock of fixed capital and circulating capital) are considered regardless to the
owners of capital (i.e. the profit rate refers to both own and outside capital). Consequently, profits
contain interest payments on outside capital as well as taxes paid on profits. However, no capital
advanced in financial activities (i.e. stock of securities, holdings, shares in other enterprises etc.) is
considered, the associated flows of profits are excluded of the sum of profits in [8]. Furthermore,
the rate of profit is defined under the assumption of maintaining the capital substance, i.e. capital
16
ERSA’98 C. Rammer: Determinants of Regional Variations in the Rate of Profit
depreciation is excluded from profits assuming average rates of depreciation at a fully utilised stock
of capital. The stock of capital advanced in production is estimated at costs of replacement.
Profits are a flow variable and are measured for calendar years. Capital advanced is a stock variable
and is measured by the capital advanced in the average of period t taking a linear average of fixed
and circulating capital at the beginning and at the end of a calendar year. Data on profits and on
circulating capital (stock of inventories) are taken from official sources1. Data on fixed capital are
not available and had to be estimated employing a regional capital stock model. The model is based
on a perpetual inventory method using a semilogistic survival function for gross capital formation
(see Almon et al. 1974). Two types of capital are distinguished (structures and machines) each
showing their own rates of depreciation. According to the industry mix of a region i, region specific
rates of depreciation are considered. Premature withdrawal of capital due to plant closures is
incorporated using information on employees in plants closed as a weight (assuming average capital
intensities in closed plants). In order to estimated the stock of fixed capital in each region i for the
time period 1972-1992, an initial capital stock for the year 1971 had to be calculated. For this
purpose, information on the industry mix, on industry specific capital intensities and on the
deviations of actual capital intensities in region i from those expected by the industry mix were
used. A detailed discussion of the model and the data used is given in Rammer (1995, 1997a).
In order to measure the various independent variables of the model discussed in 2., considerable
efforts have been undertaken. Due to space restrictions, a detailed discussion of the sources of data
and the methods of measurement is not possible. The following discussion therefore restricts to a
short characterisation of the operational definition of each independent variable listed in Table 1
and 2. All data are taken from official sources (Austrian Statistical Office) if not indicated
otherwise. All variables measured in monetary units are at constant prices.
� Capital intensity (cin): total capital advanced (K) per hour worked (L). K is the sum of fixed and
circulating capital. L is calculated using regional data on total employment in manufacturing (E)
and the average annual hours worked per employee in individual industries j (jh), weighted bythe regional employment share of each industry (jbi): )(∑ ⋅⋅=
j
tij
tj
ti
ti bhEL .
� Turnover time of capital (tot): circulating capital (ZK) to total production costs (C) ratio. ZK
represents the average stock of inventories in period t, production costs C cover all costs for
material supply, energy, transport, depreciation and wages.
� Labour skills (lsk): share of salaried employees (SAE) in total employment (E).
� Investment ratio (inv): gross investment I per unit of fixed capital stock FK. Gross investment
covers all investment in fixed capital. FK represents the average stock of fixed capital
(structures, machinery) in period t, empirical values for FK stem from the regional capital stock
model. 1 Annual Statistics on Manufacturing (Industrie- und Großgewerbestatistik), Austrian Statistical Office, 1972 to 1992
17
ERSA’98 C. Rammer: Determinants of Regional Variations in the Rate of Profit
� Capacity utilisation ratio (cut): effective output Y per potential output PY. Potential output PY is
derived from a regional capacity utilisation model which is based on a capital coefficient
approach (see for example Anderson and Rigby 1989) and controls that the sum of the potential
output over all regions i equals the known sum of potential output in total Austrian
manufacturing for each period t.
� Employment share in sectors with import protection (imp): share of employees in protected
sectors (PRE) in total employment (E). Sectors with import protection are characterised by tariff
and non-tariff barriers to trade and by very low export and import ratios. Sectoral base is the 3-
digit level, the identification of protected sectors is carried out on a annual base although most
sectors are identified as import protected either in all years or in none.
� Employment share in sectors with high firm concentration (con): share of employees in highly
concentrated sectors (HCE) in total employment (E). Sectors with a high firm concentration are
identified using a 4-firm-concentration ratio (share in turnover of the four largest firms in a
sector). All sectors showing a share of more than 0,4 are classified as highly concentrated. Due
to data restrictions, the identification can be carried out for the years 1976, 1983, 1988 and 1991
only. For all other years, employment shares are calculated via linear interpolation.
� Patent intensity (pat): number of applied patents to total employment (E). The number of patents
applied at the Austrian Patent Office is taken from Fischer et al. (1994). However, data are not
available before 1987 so that this indicator can be considered for a subperiod, only.
� Firm dynamic (dyn): share of employees in newly founded and closed plants (FCE) in total
employment (E). Information for FCE is provided by official sources.
� Hypothetical minimum wage level based on collective agreement (col): Average minimum wage
rate in industry j as a result of nation-wide collective wage bargaining (colwj) weighted by theemployment share of industry j in region i: ∑ ⋅=
j
tij
tj
colti bwcol
� Employment share of women (wom): share of female employees (FEE) in total regional
employment (E).
� Unemployment Ratio (une): registered unemployed as a share of the total number of employees
in the regional economy (covering all manufacturing and service sectors).
� Employment share in small private owned firms (pri): share of employees in private owned
firms with less than 100 employees (SPE) in total employment (E). Information on ownership of
firms is derived from several studies on firm ownership in Austria in the 70ies and 80ies by the
Austrian Chamber of Workers and refer to the years 1973 and 1981. For 1991 results from the
study of Rammer (1996) are taken. Information on the firm size of private owned firms can be
derived from official census statistics for the years mentioned. For all other years values for pri
were calculated by linear interpolation.
� Employment share in state owned firms (sta): share of employees in state owned firms (STE) in
total employment (E). Information on STE stems from the same source as mentioned above.
18
ERSA’98 C. Rammer: Determinants of Regional Variations in the Rate of Profit
� Travel time to important market locations (trt): average travel time d by car to market locations
m which are the capital towns of the nine Austrian Länder and to main cities in neighbouring
countries2 (Munich for Germany, Milan for Italy, Zurich for Switzerland, Budapest for Hungary,
Prague for Czech Republic, Bratislava for Slovakia, Ljubljana for Yugoslavia and its successor
states), each location weighted by its relative economic significance for Austrian manufacturing
sales (measured in terms of the GDP-share g of the associated region and nation, respectively, in
total GDP of Austria and its neighbouring countries, weighted by the region’s or nation’s sharein total manufacturing sales s): t
mm
tm
tim
ti sgdtrt ⋅⋅= ∑ .
� Transport infrastructure density (tra): length of motorways and main railway lines per unit of
settlement area.
� Firm potential (fip): number of firms in manufacturing and producer services within 30 minutes
travel time. Because non-linear relations between firm potential and urbanisation economies are
assumed, firm potential enters the model in logarithmic form.
In order to measure firm- and locations specific efficiencies, a regional factor productivity model
and a regional wage rate model had to be estimated which generated parameter estimates taken for
the calculation of the expected factor productivity and wage rate in region i. The following formal
structure for the regional factor productivity model is employed:
ti
zti
ti
ti
ti
ti
ti
ti
ti
ti
ti
tfipdyn
conimrcutinvlsktotcinz
εβββββββββββ
+⋅+⋅+⋅+
⋅+⋅+⋅+⋅+⋅+⋅+⋅+=
1098
76543210
)ln([9]
where β0 to β10 are parameters and zε is an independent and normally distributed error term. A time
trend variable t is introduced in order to cover exogenous technological change incorporated in
factors of production and being identical in all regions i. [9] is estimated over 97 regions i and 21
years t. Total factor productivity z is measured by employing a very general operational concept, i.e.
the ratio of output (Y) to weighted inputs labour (L) and capital (K) (see Dollar and Wolff 1994):
ti
ti
ti
ti
tit
iKqLv
Yz
⋅+⋅= [10]
where v represents the share of wages in total output, q represents the share of profits in total output,
v, q ≤ 1 and v + q = 1 by definition. L is measured in terms of hours worked, Y and K are measured
at constant prices, but values for K being transformed in such a way that the value of K summed up
over all regions i equals the value of L summed up over all regions. The operationalisation of the
independent variables is described above. The estimated parameters for the constant (β0) and the ten
2 Data for
md are derived from a Geographical Information System located at the Department of Economic and Social Geography,
Vienna University of Economics.
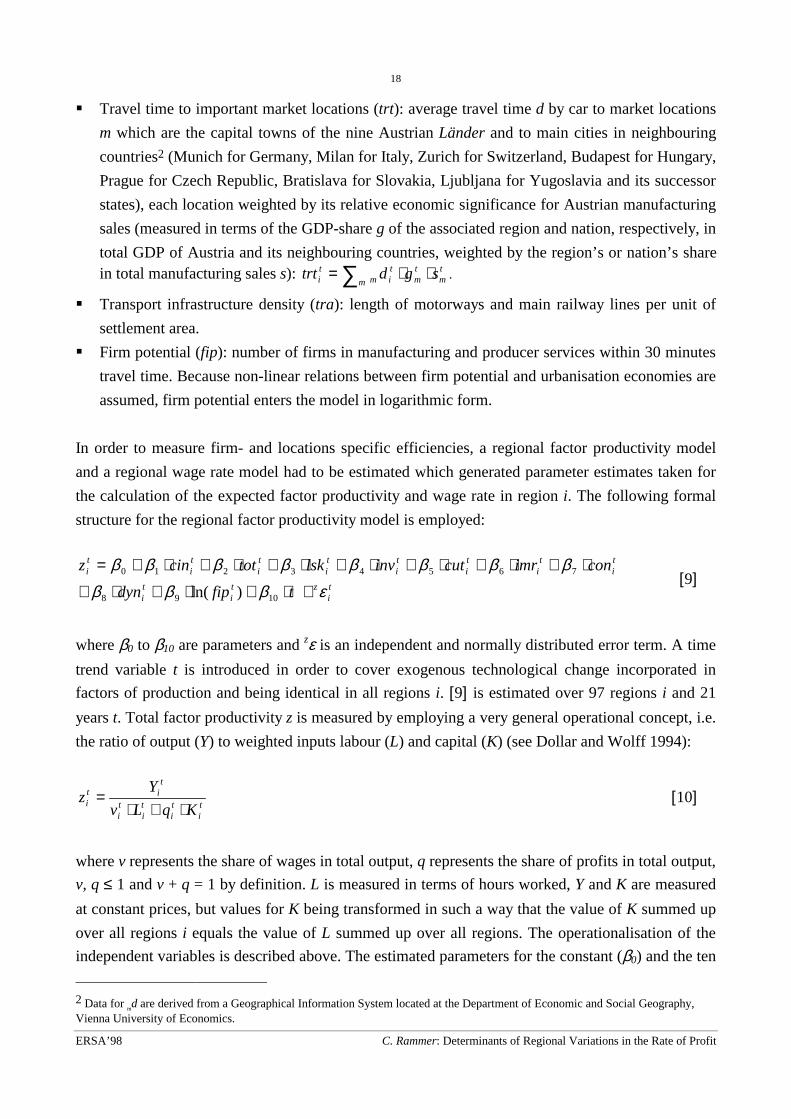
19
ERSA’98 C. Rammer: Determinants of Regional Variations in the Rate of Profit
independent variables (including T-statistics for the level of statistical significance) of the model are
reported in Table 3. All coefficients show the anticipated signs and most are statistically significant
at a 0.01 level, except turnover time of capital and employment share in sectors with high firm
concentration which show no statistically significant influence upon factor productivity, and except
capital intensity which is significant at a 0.1 level, only. R2-adjusted as a goodness-of-fit measure is
at a satisfactory level of 0.61.
Table 3: Parameter estimated and T-values for the total factor productivity model
Variable Parameter estimate T-value
Constant -90.05 -14.07**
Capital Intensity 0.01 1.74*Turnover Time of Capital -1.38 -0.29Labour Skills 57.86 7.07**Investment Ratio 86.43 6.69**Capacity Utilisation Ratio 139.22 21.74**Employment Share in Sectors with Import Portection 11.61 3.88**Employment Share in Sectors with High Firm Concentration 5.91 1.27Firm Dynamic -59.54 -3.71**Firm Potential (logarithm) 3.47 7.35**Time Trend 3.04 35.71**
R2-adjusted 0.61Number of Observations 2,037
* statistically significant at the 0.1 level** statistically significant at the 0.01 level
The wage rate model is estimated on the base of the following formal structure:
ti
wti
ti
ti
ti
ti
ti stapriunewomcolw εχχχχχχ +⋅+⋅+⋅+⋅+⋅+= 543210 [11]
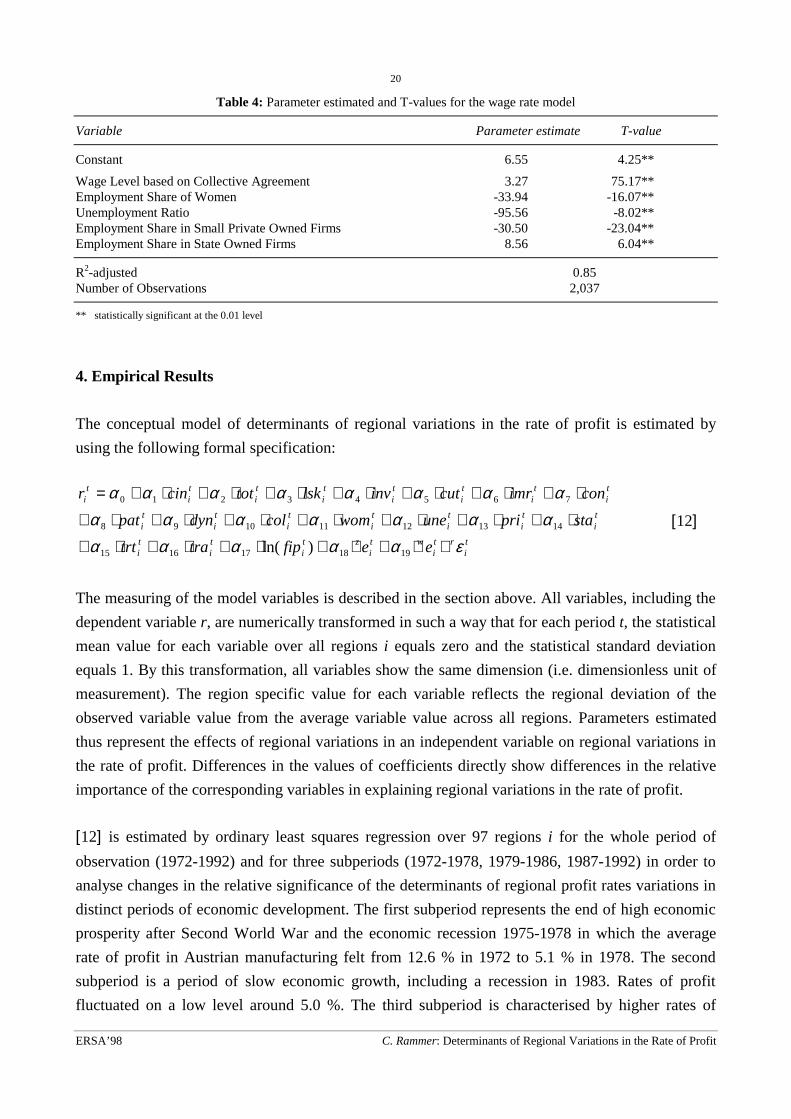
where χ0 to χ5 are parameters and wε is an independent and normally distributed error term. [11] isestimated over 97 regions i and 21 years t. The operationalisation of the model variables is
described above. The estimated parameters for the constant (χ0) and the five independent variables
(including T-statistics for the level of statistical significance) of the model are reported in Table 4.
All coefficients are statistically significant at the 0.01 level and show the anticipated signs. R2-
adjusted is 0.85, i.e. the wage rate model employed is able to explain 85 % of the variance in
regional wage rates.
The parameters estimated for the regional factor productivity model and the regional wage rate
model are used to calculate expected values for total factor productivity ( z ) and the wage rate ( w )
in region i and period t. Efficiency measures represent the ratio of the observed values for z and w,
respectively, to the expected values in each region and year (see[5a] and [5b]).
20
ERSA’98 C. Rammer: Determinants of Regional Variations in the Rate of Profit
Table 4: Parameter estimated and T-values for the wage rate model
Variable Parameter estimate T-value
Constant 6.55 4.25**
Wage Level based on Collective Agreement 3.27 75.17**Employment Share of Women -33.94 -16.07**Unemployment Ratio -95.56 -8.02**Employment Share in Small Private Owned Firms -30.50 -23.04**Employment Share in State Owned Firms 8.56 6.04**
R2-adjusted 0.85Number of Observations 2,037
** statistically significant at the 0.01 level
4. Empirical Results
The conceptual model of determinants of regional variations in the rate of profit is estimated by
using the following formal specification:
ti
rti
wti
zti
ti
ti
ti
ti
ti
ti
ti
ti
ti
ti
ti
ti
ti
ti
ti
ti
ti
eefiptratrt
stapriunewomcoldynpat
conimrcutinvlsktotcinr
εαααααααααααα
αααααααα
+⋅+⋅+⋅+⋅+⋅+
⋅+⋅+⋅+⋅+⋅+⋅+⋅+
⋅+⋅+⋅+⋅+⋅+⋅+⋅+=
1918171615
141312111098
76543210
)ln(
[12]
The measuring of the model variables is described in the section above. All variables, including the
dependent variable r, are numerically transformed in such a way that for each period t, the statistical
mean value for each variable over all regions i equals zero and the statistical standard deviation
equals 1. By this transformation, all variables show the same dimension (i.e. dimensionless unit of
measurement). The region specific value for each variable reflects the regional deviation of the
observed variable value from the average variable value across all regions. Parameters estimated
thus represent the effects of regional variations in an independent variable on regional variations in
the rate of profit. Differences in the values of coefficients directly show differences in the relative
importance of the corresponding variables in explaining regional variations in the rate of profit.
[12] is estimated by ordinary least squares regression over 97 regions i for the whole period of
observation (1972-1992) and for three subperiods (1972-1978, 1979-1986, 1987-1992) in order to
analyse changes in the relative significance of the determinants of regional profit rates variations in
distinct periods of economic development. The first subperiod represents the end of high economic
prosperity after Second World War and the economic recession 1975-1978 in which the average
rate of profit in Austrian manufacturing felt from 12.6 % in 1972 to 5.1 % in 1978. The second
subperiod is a period of slow economic growth, including a recession in 1983. Rates of profit
fluctuated on a low level around 5.0 %. The third subperiod is characterised by higher rates of

21
ERSA’98 C. Rammer: Determinants of Regional Variations in the Rate of Profit
growth and an increase in the average rate of profit up to 6.4 %. The full model given in [12] can be
estimated for the latest subperiod, only. For the first and second subperiod and the whole period, the
patent intensity variable pat has to be dropped due to missing data.
Table 5 reports the estimation results. All models show a high R2-adjusted value and explain
between 89 and 94 % of the variance in regional profit rates. Most variables entering the model
equation have a statistically significant influence on regional profit rates variations at the 0.01 level.
The signs of the coefficients being statistically highly significant have the anticipated direction.
Because of data transformation, the constant coefficient is zero by definition. The main findings
may be summarised as follows:
Table 5: Determinants of regional variations in the rate of profit: parameters estimated (T-values in parenthesis),differentiated by subperiods
Variable Subperiods Total Period1972-1978 1979-1986 1987-1992 1972-1992
Constant 0.00 (0.00) 0.00 (0.00) 0.00 (0.00) 0.00 (0.00)
Variables of Production TechnologyCapital Intensity 0.13 (6.8)** 0.24 (14.7)** 0.14 (7.8)** 0.17 (14.5)**
Turnover Time of Capital -0.07 (-4.9)** -0.03 (-3.2)** -0.05 (-4.3)** -0.04 (-5.3)**
Labour Skills 0.11 (5.5)** 0.10 (6.4)** 0.10 (7.1)** 0.11 (9.9)**
Investment Ratio 0.24 (18.0)** 0.18 (17.1)** 0.11 (10.5)** 0.19 (24.8)**
Variables of Market StructureCapacity Utilisation Ratio 0.54 (40.1)** 0.40 (38.0)** 0.36 (34.7)** 0.43 (58.7)**
Empl. Sh. in Sect. w. Import Protection 0.13 (6.1)** 0.12 (6.8)** 0.03 (1.8)* 0.10 (8.9)**
Empl. Sh. in Sect. w. High Firm Concentration 0.02 (1.1) 0.04 (3.1)** 0.14 (10.4)** 0.04 (4.2)**
Patent Intensity -.- (-.-) -.- (-.-) 0.01 (0.7) -.- (-.-)
Firm Dynamic -0.13 (-9.9)** -0.11 (-10.5)** -0.04 (-4.3)** -0.09 (-11.8)**
Variables of Capital-Labour RelationsMin. Wage Level based on Collect. Agreem. -0.16 (-7.0)** -0.18 (-9.9)** -0.17 (-10.5)** -0.15 (-12.2)**
Employment Share of Women 0.30 (15.7)** 0.30 (19.6)** 0.25 (15.3)** 0.28 (26.5)**
Unemployment Ratio 0.05 (3.2)** 0.04 (3.0)** 0.06 (4.5)** 0.05 (5.6)**
Empl. Sh. in Small Private Owned Firms 0.33 (15.0)** 0.26 (15.5)** 0.19 (12.5)** 0.25 (21.8)**
Empl. Sh. in State Owned Firms 0.04 (1.9)* -0.01 (-0.8) -0.02 (-1.2) -0.01 (-0.7)
Variables of Spatial CharacteristicsAverage Market Distance 0.03 (1.8)* 0.01 (0.6) 0.01 (0.4) 0.01 (1.2)
Availability of Express Traffic 0.02 (1.0) -0.01 (-0.4) -0.01 (-0.3) -0.01 (-1.3)
Firm Potential (logarithm) 0.22 (12.5)** 0.24 (17.2)** 0.21 (14.6)** 0.21 (20.9)**
Variables of Firm- and Location-Specific EfficienciesProductivity Efficiency 0.84 (54.4)** 0.85 (67.2)** 0.95 (79.6)** 0.86 (99.7)**
Wage Efficiency -0.31 (-17.8)** -0.37 (-25.9)** -0.53 (-31.3)** -0.35 (-35.5)**
R2-adjusted 0.89 0.93 0.94 0.90Number of Observations 679 776 582 2,037
* statistically significant at the 0.1 level** statistically significant at the 0.01 level
� All coefficients of variables used to represent the level of production technology applied in a
region are highly significant and show the anticipated signs. Regional variations in capital
intensity (as a measure for the mechanisation of production) and investment ratio (as a measure

22
ERSA’98 C. Rammer: Determinants of Regional Variations in the Rate of Profit
of capital renewal and, subsequently, of the technological advance of the production technology
applied) show a relatively high (and positive) influence upon regional variations in the rate of
profit. The positive effect of the capital intensity variable indicate that higher levels of capital to
labour ratios need not coincide with lower levels in the rate of profit, as orthodox neoclassical
production theory would imply. It rather supports arguments of new growth theory (Romer
1986, 1990, 1994; Lucas 1988, 1990; Grossman and Helpman 1991) that economies of scale
and externalities in knowledge allow for increasing returns on capital even in the case of
increased capital intensities.
Labour skills (i.e. the share of salaried employees) as well as turnover time of capital (as a proxy
for the efficiency of factor combination in the production process) show lower coefficients but
both are highly significant. The positive coefficient for the share of salaried employees is in so
far remarkable as salaried employees normally are paid better and thus a high share of this
category of workers raise production costs. Moreover, there are strong arguments that a high
share of salaried employees reflect unproductive use of labour (see Moseley 1986; Gordon
1995; Weisskopf 1979). In the case of Austrian manufacturing in the period considered,
however, salaried employees seem to be assigned efficiently and the productivity gains of
employing higher skilled labour have exceeded the associated rise in wages.
Differentiated by subperiods, some variations in the parameter values estimated can be
observed. The effect of investment ratio decreases over time indicating either a decreasing
productivity (and subsequently profitability) raising effect of new technology incorporated in
fixed capital investment or a diminishing relevance of regional productivity levels for the level
of regional profit rates. The latter might be caused by regional convergence processes in the
level of technology applied in manufacturing (while no clear regional convergence in
profitability levels can be observed, see Rammer 1997a).
� Concerning market structure variables, the capacity utilisation ratio has by large the strongest
effect on regional profitability variations. It reflects variations in the level of demand for
commodities produced in a region and its positive influence upon profitability seems highly
reasonable: High capacity utilisation should allow for a reduction in the share of fixed cost in
total costs per unit of output and increases the ability to raise output prices as high capacity
utilisation is normally associated with demand excess on markets.
Firm dynamic shows the expected negative influence upon regional profitability. Manufacturing
in regions with high shares of newly founded and/or closed firms seems to be oriented on more
competitive markets (i.e. with low barriers to entry), or it is specialised on stages in sectoral
cycles with low profitability but high rates of entries into or exits out of a sector – such as the
‘competition stage’ in the early phase of sectoral development or the ‘decline phase’ at its end
23
ERSA’98 C. Rammer: Determinants of Regional Variations in the Rate of Profit
(see Markusen 1985; Koritz 1992). Differentiated by subperiods, the effect of firm dynamic on
profitability is clearly diminishing.
Patent intensity can be observed for the latest subperiod, only, and show no significant effect on
profitability. This result may be attributed to operational weaknesses of this indicator (see
Grilliches 1990) as patents applied cover both product and process inventions, need not lead to
innovation, if innovation follows the effects on profitability may have a considerable time lack
(while expenditures for successful innovation cause higher costs in the actual period anyway)
and by far not all innovation activities result in patent applications. Furthermore, the regional
level of patent intensity may be strongly influenced by a few (eventually small) firms while the
effect of these firms on regional profitability will be minor (even in the case of high firm-
specific profit rates).
Concerning the two measures for market power – employment share in sectors with import
protection and employment share in sectors with high firm concentration – interesting results
could be derived. In the 70s and 80s, high regional shares of sectors being supported by import
protection positively affect regional profitability, the coefficients show high values and are
statistically highly significant. Until the early 70s, large parts of the Austrian manufacturing
sector enjoyed import protection (such as food, mining, textiles, steel, construction, vehicles)
although markets were successively opened to the EC from 1973 on (within the EC-EFTA
framework). The consequences of market opening for firm profitability seem to have a
considerably time lack, as the effect of this variable diminished not before the late 80s. In the
last subperiod, its influence upon profitability is still positive, but with a clearly lower relative
impact and on a low level of statistical significance.
With respect to the second indicator of market power, a reverse pattern can be observed.
Regional variations in the share of sectors with high firm concentration had no statistically
significant effect on regional profitability variations in the first subperiod considered. During the
80s until the early 90s, its impact increased substantially. This development may indicate a trend
toward increased monopoly power in the course of accelerated merger and acquisition activities
in global capitalism since the mid of the 80s, whereby Austria fully participated in this process,
mainly as passive actor.
� Capital-labour relations have a relevant impact for explaining regional variations in profitability.
All coefficients except one show high levels of significance and the anticipated signs. The
(hypothetical) minimum wage level has a negative effect on regional profitability while the
employment share of women, the unemployment ratio (as an indicator for the competition
among workers on the regional labour market) and the share of employees in small private
owned firms (as an indicator for the ability of workers to unionise) have positive effects. These
affects are stable over time and coefficients do vary only slightly in their absolute values
between subperiods.
24
ERSA’98 C. Rammer: Determinants of Regional Variations in the Rate of Profit
Its worthwhile to mention that regional variations in the share of women in total employment
hava a considerably strong influence upon regional profitability variations. This indicates that
the low level of wages paid to women (compared to the average wage rate) seems not to be
justified by correspondingly lower levels of productivity (which is commonly argued by human
capital theory) but rather reflects an intensive exploitation of female labour for the benefit of
higher firm profitability. The high coefficient for the employment share in small private owned
firms represents the favourable conditions for capitalists to labour exploitation in such
environments where unionisation is difficult and paternalistic management styles impede the
realisation of workers’ interests, especially concerning higher wages.
The only capital-labour relations variable not being statistically significant in the model for the
whole period considered is the employment share in state owned firms. This result is surprising
because state ownership in firms is expected to increase the ability of workers to unionisation
contributing to a higher wage level and to coincide with a comparably low priority to profit
maximisation to the favour of securing and expanding employment. A partial analysis showed a
strong negative effect of regional variations in this variable on regional profit rate variations in
all periods (correlation coefficient of –0.34 to –0.40, significant at the 0.01 level). Within the
multiple regression model employed, there is, however, no separate (and statistically significant)
negative effect of state ownership. In the first subperiod, the model estimates even a positive
influence upon regional variations in the rate of profit. Lower profitability in regions with high
shares of state owned firms seems to result from other structural characteristics such as the
industry-mix and the resulting minimum wage level (which is, however, affected by the extent
of state ownership in a sector), low rate of unemployment (at least until the mid of the 80s), a
low share of female employees, a low investment ratio or a low firm potential.
� Spatial characteristics of a regional economy seem to have little direct relevance for explaining
regional variations in profitability. Among the three variables distinguished, the two variables
used to represent transaction costs (average market distance, availability of express traffic) are
statistically not significant, except average market distance in the first subperiod which shows a
positive coefficient at a 0.1 level of significance (i.e. regional profit rates tend to increase with
the average distance of a region to its markets which might support the hypothesis of protected
markets and low competition in this phase). One has to take into consideration, however, that
this variable is measured on the assumption that all regions have the same spatial market
structure like Austrian manufacturing in total. Empirical studies for particular years show that
this assumption is highly unrealistic (see Rammer 1997b). In fact, regions tend to specialise on
markets where they experience competitive advantages – such as lower transaction costs – and
thus will show spatially different market areas. Consequently the market distance indicator used
here may not represent the actual spatial market structure of the regions considered in an
appropriate way.
25
ERSA’98 C. Rammer: Determinants of Regional Variations in the Rate of Profit
Firm potential shall represent cost reducing and innovation/knowledge production supporting
effects of spatial clustering of economic activities and has a strong and highly significant effect
on regional profit rate variations. As firm potential is large in urban areas (both in the centres of
agglomerations and in the surrounding areas), this indicates a positive effect of agglomerations
on profitability compared to rural areas (given the different structural characteristics of these
regions and the possible different firm- and location-specific efficiencies). As no variables for
controlling agglomeration diseconomies such as high land costs, congestion costs and land
shortage are considered, the estimation results suggests a predominance of positive
agglomeration economies over locational diseconomies in urban areas with respect to firm
profitability (see Coombes et al. 1991; Fothergrill et al. 1985; Bayldon et al. 1984).
� The most important group of determinants (in terms of the absolute value of parameter
coefficients) are, however, firm- and location specific efficiencies. The productivity efficiency
indicator shows the highest coefficient of all variables considered in each of the four periods. It
shall represent the ability of firms located in a certain region to raise total factor productivity
beyond the level which one may expect due to the structural characteristics of the region’s firms
and some spatial characteristics of their regional economy. This ability is assumed to depend on
efficiency both in the production process and on the market, i.e. to effectively combine factors
of production given the quantitative and qualitative characteristics of the factors, and to
successfully compete on the market given general market structure characteristics a region’s
firms are confronted with. There are, however, no possibilities to empirically indicate to which
extent the two efficiency sources determine the productivity efficiency observed in a region.
The wage efficiency refers to the ability of workers (and firms, respectively) to raise (lower) the
wage rate above (below) the level which will be expected due to structural characteristics of a
region. The relative influence of this efficiency variable is less powerful but seems to increase
over time (as the coefficient in the first subperiod is lowest and in the last one highest).
An analysis of the absolute values of coefficients allow for an estimation of the relative significance
of each group of determinants distinguished for explaining regional variations in the rate of profit.
Both for the three subperiods and the total period considered the two variables representing firm-
and location specific efficiencies are able to explain the largest portion of the variance in regional
profit rates. Their relative contribution is between 28 % and 40 % and increases in later subperiods.
Variables of capital-labour relations are able to explain about 19 % to 21 % of total variance with a
low tendency of decreasing relevance for explaining profit rates variations over subperiods. The
variables used to represent the market structures a region’s firms are confronted with show a similar
relative contribution of 16 % to 21 % with lower values in later superiods. Variables of the
production technology applied in a region explain between 11 % and 15 % of total variance in
26
ERSA’98 C. Rammer: Determinants of Regional Variations in the Rate of Profit
regional profit rates. The contribution of variables representing spatial characteristics is about 6 %
in all subperiods. 6 % to 11 % of the total variance remains unexplained by the model employed.
5. Summary
In this paper, an attempt was made to analyse the determinants of regional variations in profit rates.
The profit rate might be viewed as an appropriate indicator for the competitiveness of regional
economies and is expected to affect regional growth and development. High profitability will
stimulate internal regional investment and the inflow of capital from other regions while low
profitability may be a starting point for regional economic decline. An analysis of the determinants
of regional profitability and the variation of firm profit rates over space may produce insights in
factors governing regional development and in the sources for regional differences in the success of
capitalist profit maximisation efforts.
Determinants of regional profit rate variations were analysed on the base of an explanatory
conceptual model which distinguished three groups of variables: structural characteristics of a
regional economy (i.e. production technology, market structures, capital-labour relations), spatial
characteristics of a regional economy (i.e. transactions costs and spatial externalities) and firm- and
location-specific efficiencies (in terms of production process, market success and wage bargaining).
For empirical analysis, data of the Austrian manufacturing sector were used to generate regional
profit rates (representing the average profitability of firms located in a certain region) for a 21 year
time period. By the means of multiple OLS-regression analysis, the relative contribution of a total of
19 independent variables to the explanation of the variance in regional profit rates was estimated. In
order to cover changes in the relative contribution over time, considered to deviations of regional
profit rates from the national average. The analysis is static and cross-sectional of nature, although
changes in the relative significance of variables over time are considered by using a 21-year time
series for analysis.
The estimation results show that the various structural aspects of a regional economy in terms of
production technologies applied, market structures a region’s firms are confronted with, and capital-
labour relations are able to explain about 50 to 55 % of the variance in regional profit rates. Among
the variables considered, variables of capital-labour relations (such as the share of socially
discriminated workers employed, the ability of workers to unionisation and the minimum
reproduction level in a region) and of market structures (such as fluctuations in demand, protection
from competitors, oligopoly market power, barriers to market entries) are of higher significance
than those representing the production technology applied in a region (degree of mechanisation,
quality of labour and capital inputs). Spatial characteristics of a regional economy, which cover the
27
ERSA’98 C. Rammer: Determinants of Regional Variations in the Rate of Profit
transaction cost position with respect to markets and externalities due to spatial clustering are of
minor relevance and explain about 7 % of the variance. The remaining variance in regional profit
rates may attributed mainly to firm- and location specific efficiencies. They indicate the ability of
firms located in a certain region to raise factor productivity above, and lower wage rates below, the
level expected due to structural and spatial characteristics of a region. As factor productivity and
wage rates and the main variables determining the level of the rate of profit higher efficiency
directly translate to higher profitability. The sources for regional variations in efficiency might be of
various nature and are not analysed in this paper. It may be speculated, however, that innovation
activities, organisational efficiency, marketing efforts and firm specific regimes of labour
exploitation (e.g. methods of raising labour productivity through more intensive utilisation of
working capacities) might be possible sources.
References
Aglietta, M. (1979): A Theory of Capitalist Regulation. London and New York: Verso
Aiginger, K. (1993): Collusion, concentration and profits. An empirical confrontation of an old story and a supergameimplication. Empirica 20, 159-173
Almon, C., L.M. Buckler, L.M. Horwitz and T. Reimbold (1974): Interindustry Forecasts of the American Economy.Lexington, Ma.: Lexington Books
Anderson, W.P. and D.L. Rigby (1989): Estimating capital stocks and capital ages in Canada’s regions: 1961-1981.Regional Studies 23, 117-126
Armstrong, H. and J. Taylor (1993): Regional Economics and Policy. Second Edition. New York: HarvesterWheatsheaf
Baldwin, W.L. and J.T. Scott (1987): Market Structure and Technological Change. London: Harwood AcademicPublishers
Bayldon, R., A. Woods and N. Zafiris (1984): Inner city versus new towns: a comparison of manufacturingperformance. Oxford Bulletin of Economics and Statistics 46, 21-19
Borts, G.H. and J.L. Stein (1964): Economic Growth in a Free Market. New York: Columbia University Press
Braverman, H. (1974): Labor and Monopoly Capital. The Degradation of Work in the Twentieth Century. New York:Monthly Review Press
Coombes, M.G., D.J. Storey, R. Watson and P. Wynarczyk (1991): The influence of location upon profitability andemployment change in small companies. Urban Studies 28, 723-734
Cubbin, J. and P.A. Geroski (1990): The persistence of profits in the United Kingdom. In: D.C. Mueller (ed.): TheDynamics of Company Profits. An International Comparison, 147-168. Cambridge, Ma.: Cambridge UniversityPress
Dollar, D. and E.N. Wolff (1994): Capital intensity and TFP convergence by industry in manufacturing, 1963-1985. In:W.J. Baumol, R.R. Nelson and E.N. Wolff (eds): Convergence of Productivity. Cross-National Studies andHistorical Evidence, 197-224. Oxford et al.: Oxford University Press
Duménil, G. and D. Lévy (1993): The Economics of the Profit Rate. Competition, Crises and Historical Tendencies inCapitalism. Aldershot: Edward Elgar
Fischer, M.M., J. Fröhlich and H. Gassler (1994): An exploration into the determinants of patent activities. Someempirical evidence for Austria. Regional Studies 28, 1-12
Fothergrill, S., G. Gudgin, M. Kitson and S. Monk (1985): Differences in the profitability of the UK manufacturingsector between conurbations and other areas. Scottish Journal of Political Economy 32, 72-91
Glyn, A. and B. Sutcliffe (1972): British Capitalism, Workers and the Profit Squeeze. London: Penguin
28
ERSA’98 C. Rammer: Determinants of Regional Variations in the Rate of Profit
Gordon, D.M. (1995): Underpaid workers, bloated corporations: two pieces in the puzzle of U.S. economic decline.New York: Lecture presented at the New School of Social Research, April 5, 1995
Grabowski, H.G. and D.C. Mueller (1978): Industrial research and development, intangible capital stocks, and firmprofit rates. Bell Journal of Economics 9, 328-343
Grilliches, Z. (1990): Patent statistics as economic indicators: a survey. Journal of Economic Literature 28, 1661-1707
Grossman, G.M. and E. Helpman (1991): Innovation and Growth in the Global Economy. Cambridge, Ma.: MIT Press
Harvey, D. (1982): The Limits to Capital. Chicago: University of Chicago Press
Howard, M. (1983): Profits in Economic Theory. London: Macmillan
Koritz, D. (1992): Profit cycles, competition an the limits of regional policy. Review of Radical Political Economics 24,91-97
Krugman, P. (1981): Trade, accumulation and uneven development. Journal of Development Economics 8, 149-161
Krugman, P. (1991): Geography and Trade. Cambridge, Ma.: MIT Press
Krugman, P. (1994): Complex landscapes in economic geography. American Economic Review 84, 412-416
Lucas, R.E. (1988): On the mechanics of economic development. Journal of Monetary Economics 22, 3-42
Lucas, R.E. (1990): Why doesn’t capital flow from rich to poor countries? American Economic Review, Papers andProceedings 80, 92-96
Markusen, A. (1985): Profit Cycles, Oligopoly and Regional Development. Cambridge, Ma.: MIT Press
Moseley, F. (1985): The rate of surplus value in the postwar US economy: a critique of Weisskopf’s estimates.Cambridge Journal of Economics 9, 57-79
Mueller, D.C. (1986): Profits in the Long Run. Cambridge, Ma.: Cambridge University Press
Mueller, D.C. (ed.) (1990a): The Dynamics of Company Profits. An International Comparison. Cambridge, Ma.:Cambridge University Press
Mueller, D.C. (1990b): Profits and the process of competition. In: D.C. Mueller (ed.): The Dynamics of CompanyProfits. An International Comparison, 1-14. Cambridge, Ma.: Cambridge University Press
Peet, R. (1983): The relations of production and the relocation of Unites States manufacturing industry since 1960.Economic Geography 59, 112-143
Peet, R. and N. Thrift (1990) (eds.): New Models in Geography. London: Routledge
Rammer, C. (1995): Regionale Kapitalausstattung in Österreich. (Regional capital stocks in Austria). Vienna:Department of Economic and Social Geography, Vienna University of Economics (= WSG Discussion Paper 46)
Rammer, C. (1996): Ausländische Produktionsstätten in Österreich Anfang der 90er Jahre. (Foreign branch plants inAustria in the early 90s). Informationen über Multinationale Konzerne 2/96, 9-21
Rammer, C. (1997a): Zur Erklärung regionaler Profitratenunterschiede. Konzeptionelle und empirische Modelle für dieösterreichische Sachgüterproduktion. (Determinants of regional variations in the rate of profit. Conceptual andempirical models for Austrian manufacturing). Unpublished Ph.D. thesis, University of Vienna
Rammer, C. (1997b): Regionale Exportspezialisierung in Österreich. (Regional export specialisation in Austria).Mitteilungen der Österreichischen Geographischen Gesellschaft 139, 171-196
Richardson, H.W. (1973): Regional Growth Theory. London: Macmillan
Rigby, D.L. (1990): Technical change and profits in Canadian manufacturing: a regional analysis. The CanadianGeographer 35, 353-366
Rigby, D. (1991): The existence, significance, and persistence of profit rate differentials. Economic Geography 67, 210-222
Romer, P.M. (1986): Increasing returns and long-run growth. Journal of Political Economy 94, 1002-1037
Romer, P.M. (1990): Endogenous technological change. Journal of Political Economy 98, 71-102
Romer, P.M. (1994): The origins of endogenous growth. Journal of Economic Perspectives 8, 3-22
Schumpeter, J. (1926): Theorie der wirtschaftlichen Entwicklung. Eine Untersuchung über Unternehmergewinn,Kapital, Kredit, Zins und den Konjunkturzyklus. 2. Auflage. Berlin: Duncker & Humblot
Schumpeter, J. (1939): Business Cycles: A Theoretical, Historical and Statistical Analysis of the Capitalist Process. 2Bände. New York and London: McGraw-Hill
29
ERSA’98 C. Rammer: Determinants of Regional Variations in the Rate of Profit
Schwalbach, J. (ed.) (1985): Industry Structure and Performance. Berlin: Edition Sigma
Semmler, W. (1984): Competition, Monopoly and Differential Profit Rates. New York: Columbia University Press
Sheppard, E. (1987): A Marxian model of the geography of production and transportation in urban and regionalsystems. In: C. Bertuglia, G. Leonardi, S. Occelli, G. Rabino, R. Tadei and A. Wilson (eds.): Urban Systems:Contemporary Approaches to Modelling, 189-250. London: Croom Helm
Sheppard, E. (1990): Transportation in a capitalist space economy: transportation demand, circulation time andtransportation innovations. Environment and Planning A 22, 1007-1024
Sheppard, E. and T.J. Barnes (1990): The Capitalist Space Economy. Geographical Analysis after Ricardo, Marx andSraffa. London: Unwin Hyman
Siebert, H. (1969): Regional Economic Growth: Theory and Practice. Scranton: International Textbooks
Stigler, J.E. (1963): Capital and Rates of Return in Manufacturing. Princeton: Princeton University Press
Storper, M. and MR. Walker (1989): The Capitalist Imperative. Oxford: Basil Blackwell
Wallerstein, I. (1982): The Capitalist World-Economy. Cambridge: Cambridge University Press
Webber, M. (1987a): Rates of profit and interregional flows of capital. Annals of the Association of AmericanGeographers 77, 63-75
Webber, M.J. (1989): Capital flows and rates of profit. Review of Radical Political Economics 21, 113-135
Webber, M. (1990): Profitability and capital accumulation in Canadian manufacturing industries. Environment andPlanning A 22, 1051-1071
Webber, M. (1996): Profitability and growth in multiregion systems: theory and a model. Economic Geography 72, 335-352
Webber, M. (1997): Profitability and growth in multiregion systems: prologue to a historical geography. EconomicGeography 73, 405-426
Weber, A. (1929): Theory of the Location of Industries. Chicago: University of Chicago Press
Weisskopf, T. (1979): Marxian crisis theory and the rate of profit in the postwar U.S. economy. Cambridge Journal ofEconomics 3, 341-378


![VARIATIONS GOLDBERG [ARIA et 30 variations] · Title: VARIATIONS GOLDBERG [ARIA et 30 variations] Author: Bach, Johann Sebastian - Arranger: Montreuille, Pierre - Publisher: Montreuille,](https://img.pdfslide.us/doc/110x75/610885d0028fe95f64358299/variations-goldberg-aria-et-30-variations-title-variations-goldberg-aria-et.jpg)