Embed Size (px)
Citation preview
IOSR Journal of Humanities And Social Science (IOSR-JHSS)
Volume 21, Issue 10, Ver. 1 (October.2016) PP 10-24
e-ISSN: 2279-0837, p-ISSN: 2279-0845.
www.iosrjournals.org
DOI: 10.9790/0837-2110011024 www.iosrjournals.org 10 | Page
Determinants of Profitability in the Insurance Sector in Kenya: A
Case of Composite Insurance Companies
Wasike, Andrew Ngoya, EMBA The Management University of Africa, Nairobi, Kenya
ABSTRACT:- The main objective of this study was to establish the determinants of profitability in the
insurance sector in Kenya. In spite of the sector recording significant growth in gross written premium during
the period 2010 to 2014, the state of profitability remained a matter of concern. Low solvency and liquidity
ratios could mean that the financial health of the sector was in doubt. Hence, the sector’s ability to meet both
short-term and long-term financial commitments and obligations could be called into question. Moreover, this
could be an indicator that while companies endeavoured to expand their market shares, they gave little attention
to profitability objectives. So, it was important to identify the determinants of profitability in the insurance
sector. This study was an attempt to explore factors that had direct significant influence on the companies’
profitability for the period 2014 and 2015. The study drew the sample of the study from 10 insurance companies
out the possible11 composite insurance companies. Qualitative primary data was collected using questionnaires
administered through a combination of judgemental and snowball sampling methods and the response rate
achieved was 65% (or 28 respondents out of the possible 43). Quantitative secondary data was obtained from
annual financial statements of the insurance companies and the success rate achieved was 90.9% (or 10
companies out possible 11). Collected data was processed and analysed by descriptive statistical techniques such
as frequency distribution tables, descriptive summary statistics, and scatter plots derived with the help of
Statistical Package for Social Sciences (SPSS version 20) to explain the nature and extent of relationship
between the dependent variable, profitability, and the independent variables: claim costs, commission expenses,
reinsurance costs, and market penetration. From the Ordinary Least Squares (OLS) econometric regression
analysis, the research study demonstrated that the independent variables were important and significant
predictors of profitability ratio by 90.1% which implied that on a one to one relationship between the variables,
the regression model was very well defined and that linearity between the dependent and independent variables
existed at a significant level. The study established that claims costs, reinsurance cost, and market penetration
were negatively related to profitability whilst commission expenses were positively related to profitability.
Keywords: Composite Insurance Companies, Determinants, Profitability,
I. INTRODUCTION 1.1 Nature of the problem
The state of profitability in Kenya’s insurance sector was a matter of concern. The insurance sector had been
growing progressively at annual average of 20.3 percent between 2010 and 2014. However, in the same period,
profitability had declined by annual average of 13.1 percent. This had caused apprehension about profitability
and the general shape of financial wellbeing of the insurance sector. Macro environmental factors such as inter-
est rates, inflation, consumer tastes and preferences, technology, fraud, non-traditional competition from banks,
and controlled investment opportunities all weighed down heavily on the sector. Within the micro environment,
intensive price competition, escalation of claims costs, fraud, low penetration, and high reinsurance costs all had
negative impact on profitability. Consequently, it was necessary for insurance companies to show eagerness to
better understand the determinants of profitability in order to create sustain and preserve the ability to deploy
available resources profitably in their trading activities to mitigate the risk of insolvency.
1.2 Previous studies
Profit and profitability are sometimes used interchangeably but, in real sense are not synonyms (Ma-
hboob, 2015) [1]
have attracted scholarly attention for many years. And without exception, scholars and re-
searchers alike agree that profitability is the lifeline for “for-profit” organisations and may be used as a tool for
measuring the success of economic objectives, social objectives and managerial efficiency. But still, there was
no consensus on the best common tools of evaluating and measuring profitability and to that extent rendered the
process to wide discretion and subjectivity.
Determinants of Profitability in the Insurance
DOI: 10.9790/0837-2110011024 www.iosrjournals.org 11 | Page
Regarding the insurance sector in particular, Wright (1992) [2]
argued that measurement of profitability
was difficult in comparison to other financial institutions because of the unique accounting system applied to
insurance. During a particular year, the insurance company would not know how much profit or loss it recorded
since only 40% of incurred claims were paid by close of the year, thus, 60% incurred claims were carried for-
ward to the succeeding underwriting year. Boadi, Antwi, and Lartey (2013) [3]
affirmed the difficulties in meas-
uring profitability. The researchers stated that insurers’ profitability was influenced by a host of factors includ-
ing actual mortality, investment earnings, scale of policyholder dividends or bonus, and taxation all of which
depended on fair premium that was adequate to cover claims costs, administrative underwriting expenses and
reasonable profit. However, according to Olalekan and Dansu (2014) [4]
the outcome of fair premium could only
be achieved through very high level of accuracy in the underwriter’s predictions.
This research study sought to address the issue of how profitability could be predicted by answering
four research questions two of which, questions (i) and (iv), had been answered only partly by previous studies
while questions (ii) and (iii) had not been addressed at all. Studies to establish whether there was any relation-
ship between education / literacy on insurance penetration and density especially in India established no rela-
tionship; but, Rani and Shankar (2014) [5]
established a weak relationship. Though penetration and density was a
dependent variable and education / literacy level was independent variable, there was still need to establish why,
for example, Taiwan and South Africa with literacy levels of 98.5 and 94.3 per cent respectively led United
Kingdom with literacy level of 99.2 per cent. Based on both India and global statistics in premium growth the
more fundamental question would be, what explained the fast pace of growth that was not necessarily accompa-
nied by or driven by higher and deeper market penetration and density?
Concerning claims costs which had been alternatively referred to as underwriting risk, risk retention or
loss ratio, the studies established a relationship with profitability. But, in the case of Dey, Adhikari and Bardhan
(2015) [6]
, Burca and Batrinca (2014) [7]
, and Mehari and Aemiro (2013) [8]
, all confirmed the existence of an
indirect association which could be measured through return on equity (ROE) and return on assets (ROA) as
proxies. Malik (2011) [9]
established that there was a direct connection between claims costs and profitability. A
study utilizing liquidity as the surrogate for profitability (Baodi, Antwi & Lartey, 2013) [3]
also established that a
direct association existed.
However, according to Popper (1959) [10]
the real challenge here was that the proxies could only ex-
plain profitability but not predict it even though prediction of events was one of the goals of science. With this knowledge in mind, this research proposed to identify the effects of claims costs, commission ex-
penses, reinsurance costs, and market penetration on profitability of insurance companies in Kenya and what
needed to be done so that the contribution of this research can be: first, prove or disprove results of previous
empirical studies regarding profitability; second, derive, estimate and specify a profitability model for insurance
sector and third, verify and evaluate the forecasting or predictive power of the specified model.
II. RESEARCH PROBLEM The state of profitability in Kenya’s insurance sector was a matter of concern. A close scrutiny of the
companies’ annual financial statements revealed that solvency and liquidity ratios were low which pointed to
poor financial health in the sector. Profitability was a key financial performance measure and yet there was no
absolute consensus on the tools of measuring it. Previous empirical studies concerning the subject matter had
employed Return On Assets (ROA) and Return On Equity (ROE) as preferred proxies for evaluating financial
performance. However, both proxies were indirect measurements which had no relationship with the profit
function, P=TR - TC. So, these proxies could only explain profitability but could predict it (Popper, 1959) [10]
.
Current practice had yet to embraced claims costs, commission expenses, reinsurance costs, and market
penetration as direct tools of measuring profitability. The concern was elevated by the fact that in the five years
between 2010 and 2014, the combined (life & general) gross written premium grew by 20.3%; earnings from
investments and other income increased by 6.5%; assets increased by 16.3%. The incurred net claims increased
by 25.8%; commissions increased by 21%; reinsurance premium ceded out increased by 26.6%; and liabilities
increased by 15.6%.; but, combined profitability before taxation decreased by 13.1%.
To reverse this downward trend in profitability and maintain high returns on investors’ equity, assets
and high solvency and liquidity ratios, players in the sector would have to understand how to measure profitabil-
ity more objectively than it was presently. The long-term survival of the sector in general and in particular, of
individual firms would depend on how effectively companies set out their plans for and implementation of prof-
itability objectives. The sector contributed between 2.95 per cent and 3.44 per cent to national economy but, in
relation to other main sectors, insurance was small. However, in the entire economy there was no other sector
that could play its role. For that reason, while industry players sought to better understand the factors that influ-
enced profitability, the sector should be protected against adverse elements in the micro and macro environ-
ments which impacted negatively on profitability.At the moment, the methods of evaluation appeared to have
failed to establish exactly how the proxies influenced profitability hence the persistence of low solvency and
Determinants of Profitability in the Insurance
DOI: 10.9790/0837-2110011024 www.iosrjournals.org 12 | Page
liquidity ratios in the sector. With this knowledge in mind, this research proposed to identify the effects of
claims costs, commission expenses, reinsurance costs, and market penetration on profitability of insurance
companies in Kenya and what needed to be done to stimulate and sustain stronger solvency and liquidity ratios.
The findings of this research would form the basis of developing a long-term universal solution to the present
problem.
1.3 Objectives of the study
The general objective of the study was to establish the determinants of profitability in the insurance sector in
Kenya focusing on composite companies, thus, those lisenced to transact both life and general business. The
study would specifically seek to:
i. Evaluate how claims costs affected profitability.
ii. Examine how commission expenses influenced profitability.
iii. Establish how reinsurance costs influenced profitability.
iv. Assess how market penetration influenced profitability.
1.4 Research Questions
The study would seek to answer the following questions:
i. What was the effect of claims costs on profitability?
ii. What was the effect of commission expenses on profitability?
iii. What was the effect of reinsurance costs on profitability?
iv. What was the effect of market penetration on profitability?
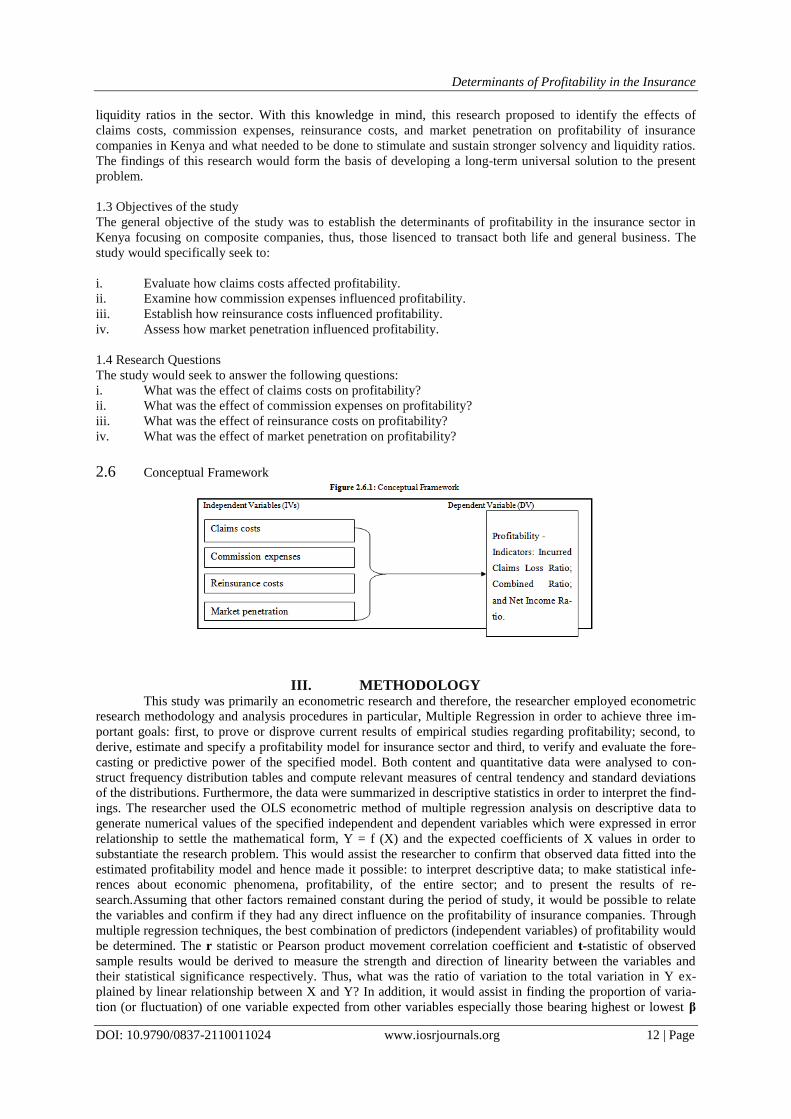
2.6 Conceptual Framework
III. METHODOLOGY This study was primarily an econometric research and therefore, the researcher employed econometric
research methodology and analysis procedures in particular, Multiple Regression in order to achieve three im-
portant goals: first, to prove or disprove current results of empirical studies regarding profitability; second, to
derive, estimate and specify a profitability model for insurance sector and third, to verify and evaluate the fore-
casting or predictive power of the specified model. Both content and quantitative data were analysed to con-
struct frequency distribution tables and compute relevant measures of central tendency and standard deviations
of the distributions. Furthermore, the data were summarized in descriptive statistics in order to interpret the find-
ings. The researcher used the OLS econometric method of multiple regression analysis on descriptive data to
generate numerical values of the specified independent and dependent variables which were expressed in error
relationship to settle the mathematical form, Y = f (X) and the expected coefficients of X values in order to
substantiate the research problem. This would assist the researcher to confirm that observed data fitted into the
estimated profitability model and hence made it possible: to interpret descriptive data; to make statistical infe-
rences about economic phenomena, profitability, of the entire sector; and to present the results of re-
search.Assuming that other factors remained constant during the period of study, it would be possible to relate
the variables and confirm if they had any direct influence on the profitability of insurance companies. Through
multiple regression techniques, the best combination of predictors (independent variables) of profitability would
be determined. The r statistic or Pearson product movement correlation coefficient and t-statistic of observed
sample results would be derived to measure the strength and direction of linearity between the variables and
their statistical significance respectively. Thus, what was the ratio of variation to the total variation in Y ex-
plained by linear relationship between X and Y? In addition, it would assist in finding the proportion of varia-
tion (or fluctuation) of one variable expected from other variables especially those bearing highest or lowest β
Determinants of Profitability in the Insurance
DOI: 10.9790/0837-2110011024 www.iosrjournals.org 13 | Page
coefficients. This would confirm whether the variables were highly, poorly or not correlated with each other at
all and how the dataset was closest to the line of best fit so that the predictive power and certainty of the esti-
mated profitability model could be assured. The main objective of this research was to improve or set new a
model and techniques that could be adopted for universal application in measuring profitability in the insurance
sector. The findings of this study could form a simple but realistic model for practitioners and other stakeholders
who might have encountered difficulty in the past in their endeavors of evaluating profitability of insurance
companies.
Therefore, the study used descriptive analysis to process the collected data and it employed multiple regression
analysis model, given by: Y = β0 + β1X1 + β2X2 + β3X3 + β4X4 + ℮
Where:
Y represents the dependent or response variable → (profitability of insurance sector)
β0 represents intercept, predicted value of Y if X = 0
β1, β2, β3, β4 represent regression coefficients, that is, the relative strength of the predictors or explanatory va-
riables on a scale of -1 to 1
X1 represents claims costs
X2 represents commission expenses
X3 represents reinsurance costs
X4 represents market penetration
℮ represents the part of Y not explained by X (residual) which is the difference between actual value of depen-
dent variable and its predicted value. This can arise due to: omitted variables, measurement errors, disturbance
or random shock associated with ordered time, for example, GDP (t) could be said to be stationery if its mean
and variance are constant over time, thus, time invariant. The notations above representing the dependent and
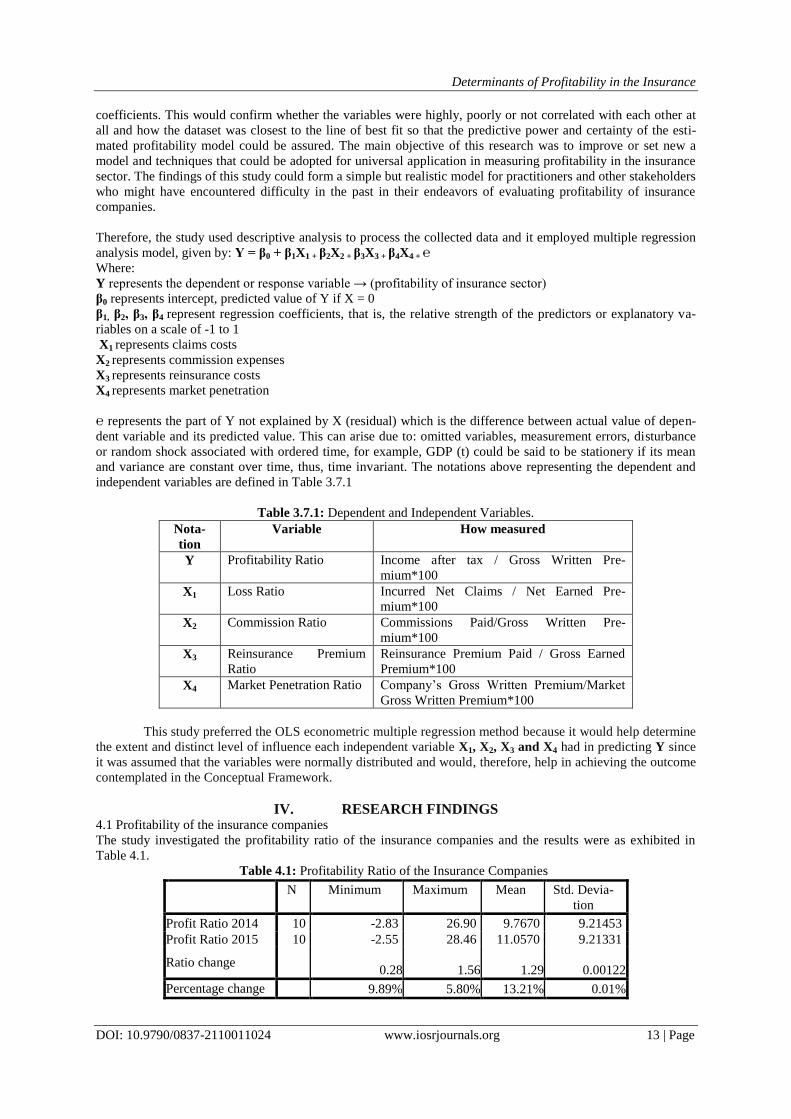
independent variables are defined in Table 3.7.1
Table 3.7.1: Dependent and Independent Variables.
Nota-
tion
Variable How measured
Y Profitability Ratio Income after tax / Gross Written Pre-
mium*100
X1 Loss Ratio Incurred Net Claims / Net Earned Pre-
mium*100
X2 Commission Ratio Commissions Paid/Gross Written Pre-
mium*100
X3 Reinsurance Premium
Ratio
Reinsurance Premium Paid / Gross Earned
Premium*100
X4 Market Penetration Ratio Company’s Gross Written Premium/Market
Gross Written Premium*100
This study preferred the OLS econometric multiple regression method because it would help determine
the extent and distinct level of influence each independent variable X1, X2, X3 and X4 had in predicting Y since
it was assumed that the variables were normally distributed and would, therefore, help in achieving the outcome
contemplated in the Conceptual Framework.
IV. RESEARCH FINDINGS 4.1 Profitability of the insurance companies
The study investigated the profitability ratio of the insurance companies and the results were as exhibited in
Table 4.1.
Table 4.1: Profitability Ratio of the Insurance Companies
N Minimum Maximum Mean Std. Devia-
tion
Profit Ratio 2014 10 -2.83 26.90 9.7670 9.21453
Profit Ratio 2015 10 -2.55 28.46 11.0570 9.21331
Ratio change 0.28 1.56 1.29
0.00122
Percentage change 9.89% 5.80% 13.21% 0.01%
Determinants of Profitability in the Insurance
DOI: 10.9790/0837-2110011024 www.iosrjournals.org 14 | Page
Results in Table 4.1 reveal that profitability ratio for the year 2014 averaged at 9.767 while that of 2015 aver-
aged at 11.057 which is an indication of improved performance by 13.21%. It can also be observed that some
insurance companies recorded negative profitability ratios during the year 2014 and 2015 as shown by the
minimum values. For both minimum and maximum profitability ratios, insurance companies recorded better
profitability ratios in year 2015 compared to year 2014. This is an indication that the companies have a positive
trend in profitability though at a slow pace. Further, it can be observed that there exists a large disparity in prof-
itability ratio among the companies. This disparity is manifested in the large standard deviations for both year
2014 (sd=9.215) and year 2015 (sd=9.213). Dispersion for the two years remained almost the same with only
0.01% change. This implies that companies that had been performing poorly remained on the poor performance
path while good performers continued performing well. Therefore, it means that non-price driven competition
within the insurance sector in Kenya is very low hence innovation and creativity are probably insignificant or
non-existent.
4.1.1 Loss Ratio
The study collected data on incurred claims (paid claims + reserves for outstanding claims) by insurance com-
panies for the business written (risks accepted) during the years 2014 and 2015.
Table 4.3: Loss Ratio of the Insurance Companies
N Minimum Maximum Mean Std. Devia-
tion
Loss Ratio 2014 10 27.00 75.99 51.6680 13.44889
Loss Ratio 2015 10 37.00 71.00 54.9390 12.01809
Ratio change 10 -4.9899 3.271 -1.4308
Percentage
change
37.04% 6.57% 6.33% -10.64%
Results in the Table 4.3 show that loss ratio for the year 2015 (m=54.93) was higher than that of year 2014
(m=51.668) representing 6.33% increase. An increase in loss ratio is a dreadful representation of the perform-
ance of insurance companies since it usually meant that previous gains in profitability are wiped out by the in-
curred claims. However, there was a significant reduction in disparity as far as loss ratio is concerned. This im-
plies that insurance companies that made significant losses in 2014 posted improved results pulling closer to
those that had posted lower losses. The Association of British Insurers (2007) [11]
stated that if the loss ratio was
above 1 or 100 per cent then the insurance company was unprofitable and in poor financial health because it
would be paying out more money in claims than money received in premiums; and, if ratio was 0.20, or 20 per
cent then the company was considered profitable and in excellent financial health. Indeed, Burca and Batrinca
(2014) [7]
argued that even though underwriting risk had a strong negative influence on the insurers’ profitabil-
ity, it was the best way of measuring the stability and effectiveness of the insurers underwriting activities.It can,
therefore, be explained that the insurance companies in Kenya had not been operating profitably at a combined
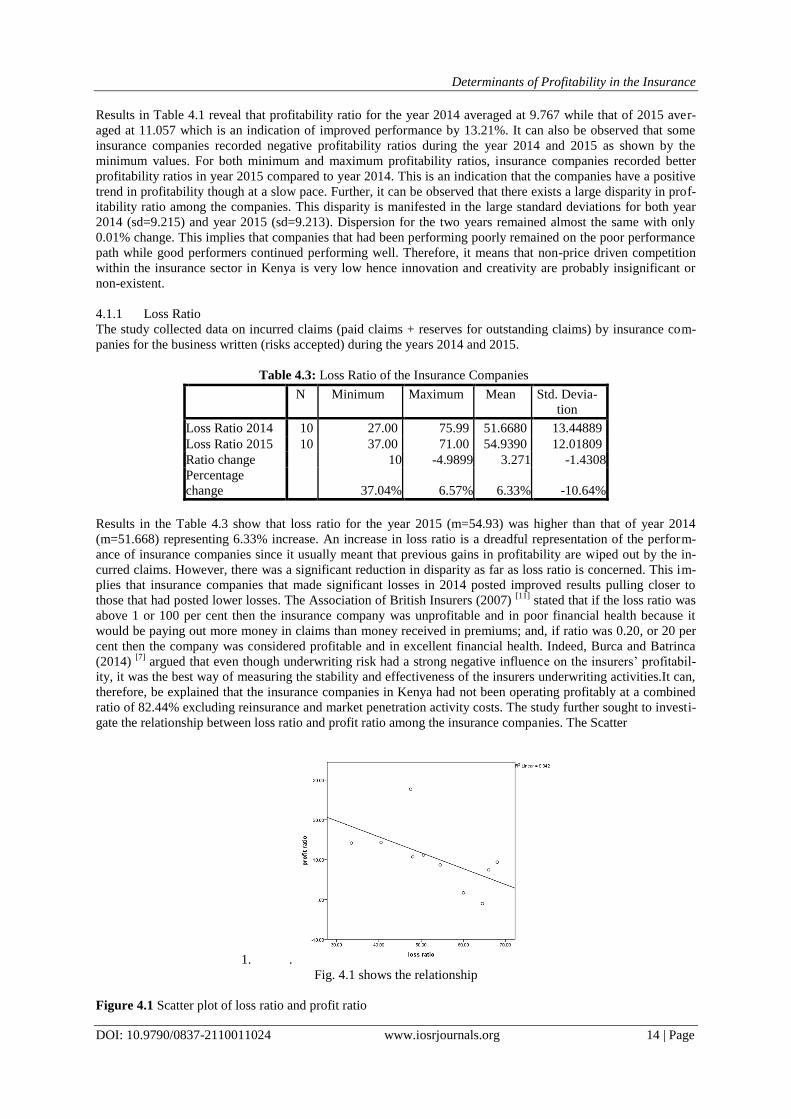
ratio of 82.44% excluding reinsurance and market penetration activity costs. The study further sought to investi-
gate the relationship between loss ratio and profit ratio among the insurance companies. The Scatter
1. .
Fig. 4.1 shows the relationship
Figure 4.1 Scatter plot of loss ratio and profit ratio
Determinants of Profitability in the Insurance
DOI: 10.9790/0837-2110011024 www.iosrjournals.org 15 | Page
The scatter plot shows that there existed a negative relationship between loss ratio and profit ratio in the insur-
ance sector. This implies that an increase in loss ratio led to a reduction in profit ratio, a precarious situation and
a threat to long-term survival of insurance companies. Companies should pay greater attention to what Taleb
(2001) [9] termed as The Black Swan Events phenomenon that showed the possibility to expect the impossible
or improbable which cause significant negative consequences; thus, justifying the view that business forecasting
largely on the basis of past events experience alone offered limited predictive power and scope. The relationship
is shown in Table 4.4.
Table 4.4: Correlations of Profit Ratio and Loss Ratio
Profit Ratio Loss Ratio
Profit ratio
Pearson Correlation 1 -.585
Sig. (2-tailed) .076
N 10 10
Loss ratio
Pearson Correlation -.585 1
Sig. (2-tailed) .076
N 10 10
Results in Table 4.4 show that loss ratio was negatively related to profit ratio (r= -0.585), an implication that
loss ratio was a negative predictor of profitability of insurance companies. However, the negative influence of
loss ratio on profit ratio was not statistically significant (p=0.076>0.05) at 95% confidence interval. This implies
that though loss ratio was a negative predictor, its effects of profit ratio may not be weighty in isolation. How-
ever, when asked to rate the extent of the impact of claims costs on the profitability of the insurance companies,
the findings established from respondents were as shown in Table 4.5.
Table 4.5: Extent of Impact of Claims on Profitability
Profitability Frequency Percent
Great extent 17 61
Some extent 7 25
Neutral 3 11
Little extent 0 0
Not at all 1 3
Total 28 100
4.4.2 Operation expenses
Operational costs encompass management expenses, miscellaneous expenses, salaries and other remunerations.
The study examined the operational costs incurred by the insurance companies to establish whether they had a
significant influence on the profitability. Table 4.6 exhibits the results.
Table 4.6: Descriptive Statistics of Operational Costs
N Minimum Maximum Mean Std. Devia-
tion
Ops Exps 2014 10 11.49 44.12 25.9520 10.12073
Ops Exps 2015 10 15.18 50.26 27.5160 10.67851
Change recorded 3.69 6.14 1.564 0.55778
Percentage change 32.11% 13.92% 6.03% 5.51%
From the results, it can be demonstrated that insurance companies incurred more operational costs (m=27.5160)
in the year 2015 than in the year 2014 (m=25.952). This may be a negative reflection of the insurance sector’s
level of efficiency; it may also imply that companies were incurring high operational expenses due to utilizing
outdated or inappropriate methods and means of prospecting and generating business revenue; hence overall
income might be strained by expenditures on redundant operating systems.
However, it is also possible to improve profit ratio through prudent increase of operational expenses. The rela-
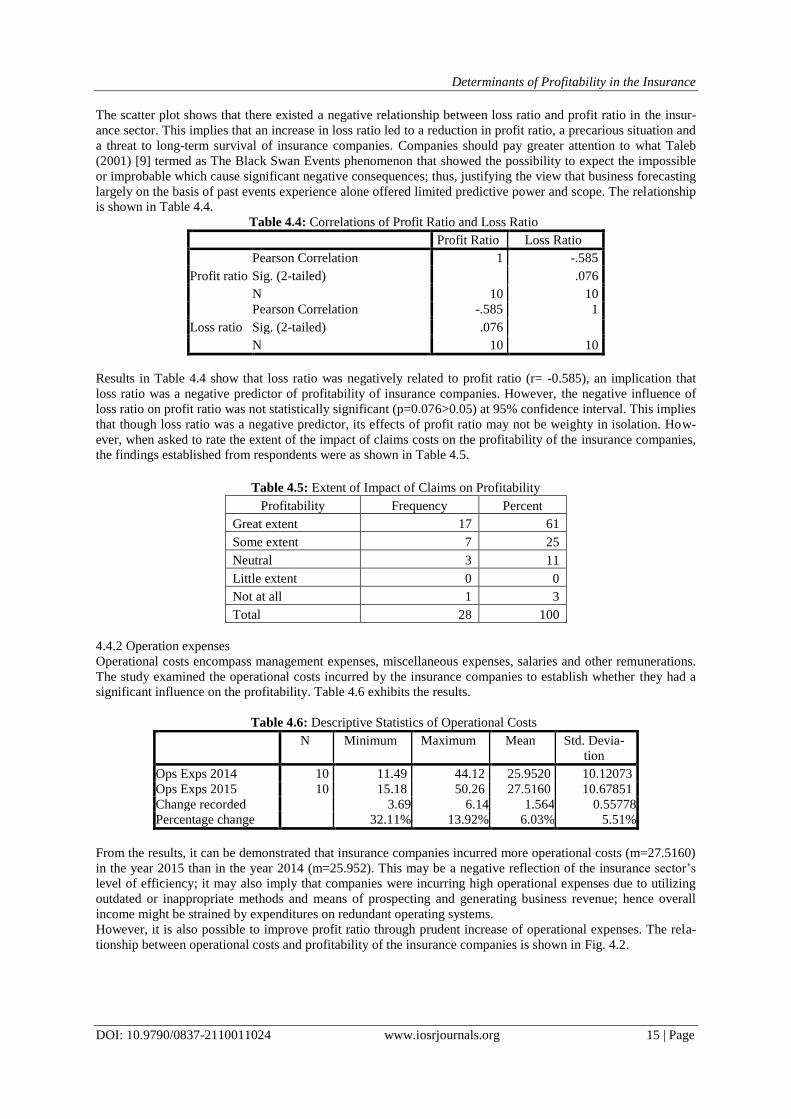
tionship between operational costs and profitability of the insurance companies is shown in Fig. 4.2.
Determinants of Profitability in the Insurance
DOI: 10.9790/0837-2110011024 www.iosrjournals.org 16 | Page
Figure 4.2 Scatter plot on operational expenses and profit ratio
The Scatter plot shows that profit ratio increased with increase in operational expenses. This implies that despite
increasing expenses, the insurance companies still managed to increase their profit ratios. Furthermore, this sce-
nario shows that insurance companies can make wise decisions that capitalize on available opportunities until
the point when the law of “Diminishing Marginal Productivity” sets in. Table 4.7 exhibits the significance of
this relationship.
Table 4.7: Correlations of Profit Ratio and Operational Expenses
Profit Ratio Operational Expenses
Profit Ratio
Pearson Correlation 1 .231
Sig. (2-tailed) .521
N 10 10
Operational Ex-
penses
Pearson Correlation .231 1
Sig. (2-tailed) .521
N 10 10
It can be observed that though operational expenses influenced profit ratio positively (r=0.231), the relationship
was not statistically significant (p=0.521>0.05) at 95% confidence interval. This implies that changes in opera-
tional expenses did not lead to obvious changes in profit ratio of Kenyan insurance companies for the period
under study.
4.4.3 Commission Expenses
Commission expenses are mostly incurred by insurance companies through payments made to sales and market-
ing teams, agents and insurance brokers. The study investigated the variable to determine whether it had signifi-
cant influence on profit ratio. Table 4.8 displays the results of the descriptive statistics analyzed from the records
of commissions paid by the insurance companies under study for the specified period.
Table 4.8: Descriptive Statistics of Commission Expenses
N Minimum Maxi-
mum
Mean (in
Ksh Million)
Std. Deviation
Comm Exps 2014 10 8.19 18.13 12.7240 2.84534
Comm Exps 2015 10 8.76 20.53 13.0720 3.26552
Change recorded 10 0.57 2.4 0.348 0.42018
Percentage change 6.96% 13.24% 2.73% 14.77%
Determinants of Profitability in the Insurance
DOI: 10.9790/0837-2110011024 www.iosrjournals.org 17 | Page
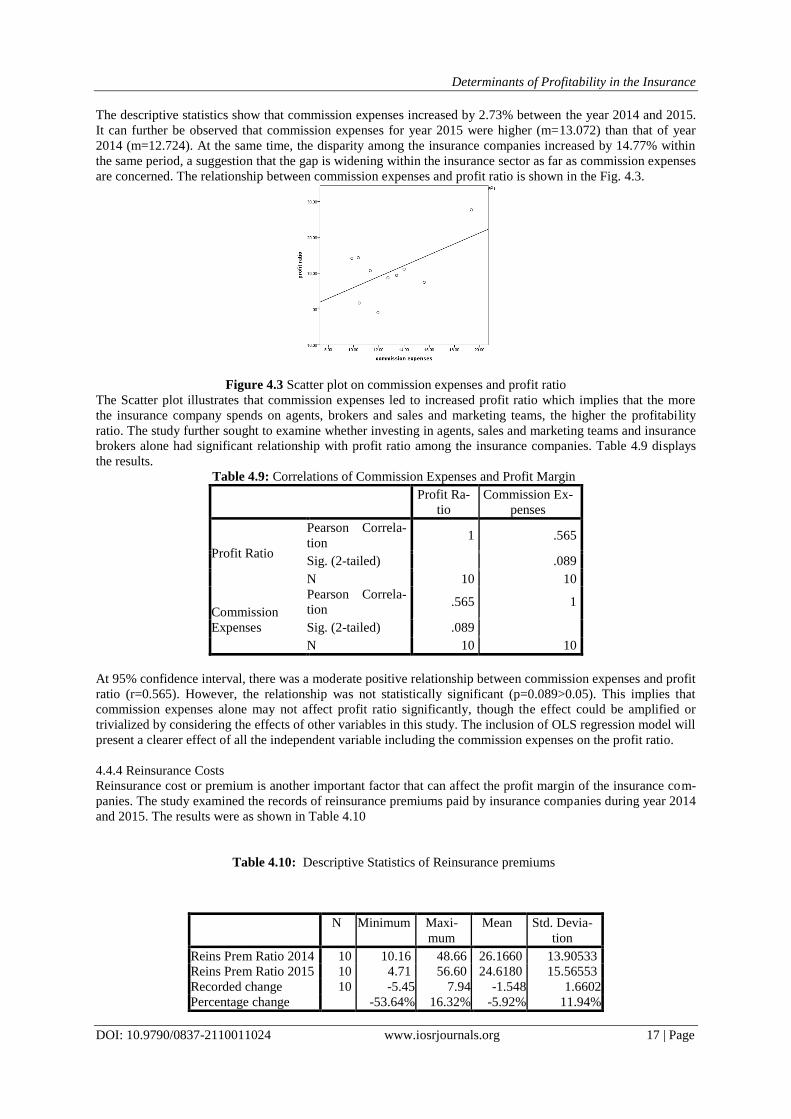
The descriptive statistics show that commission expenses increased by 2.73% between the year 2014 and 2015.
It can further be observed that commission expenses for year 2015 were higher (m=13.072) than that of year
2014 (m=12.724). At the same time, the disparity among the insurance companies increased by 14.77% within
the same period, a suggestion that the gap is widening within the insurance sector as far as commission expenses
are concerned. The relationship between commission expenses and profit ratio is shown in the Fig. 4.3.
Figure 4.3 Scatter plot on commission expenses and profit ratio
The Scatter plot illustrates that commission expenses led to increased profit ratio which implies that the more
the insurance company spends on agents, brokers and sales and marketing teams, the higher the profitability
ratio. The study further sought to examine whether investing in agents, sales and marketing teams and insurance
brokers alone had significant relationship with profit ratio among the insurance companies. Table 4.9 displays
the results.
Table 4.9: Correlations of Commission Expenses and Profit Margin
Profit Ra-
tio
Commission Ex-
penses
Profit Ratio
Pearson Correla-
tion 1 .565
Sig. (2-tailed) .089
N 10 10
Commission
Expenses
Pearson Correla-
tion .565 1
Sig. (2-tailed) .089
N 10 10
At 95% confidence interval, there was a moderate positive relationship between commission expenses and profit
ratio (r=0.565). However, the relationship was not statistically significant (p=0.089>0.05). This implies that
commission expenses alone may not affect profit ratio significantly, though the effect could be amplified or
trivialized by considering the effects of other variables in this study. The inclusion of OLS regression model will
present a clearer effect of all the independent variable including the commission expenses on the profit ratio.
4.4.4 Reinsurance Costs
Reinsurance cost or premium is another important factor that can affect the profit margin of the insurance com-
panies. The study examined the records of reinsurance premiums paid by insurance companies during year 2014
and 2015. The results were as shown in Table 4.10
Table 4.10: Descriptive Statistics of Reinsurance premiums
N Minimum Maxi-
mum
Mean Std. Devia-
tion
Reins Prem Ratio 2014 10 10.16 48.66 26.1660 13.90533
Reins Prem Ratio 2015 10 4.71 56.60 24.6180 15.56553
Recorded change 10 -5.45 7.94 -1.548 1.6602
Percentage change -53.64% 16.32% -5.92% 11.94%
Determinants of Profitability in the Insurance
DOI: 10.9790/0837-2110011024 www.iosrjournals.org 18 | Page
The results show that reinsurance premium for the year 2014 exceeded that of 2015 by 5.92% which is actually
a decline. However, considering the minimum and maximum reinsurance premium values, it can be explained
that insurance companies that paid low reinsurance premium in 2014 reduced it further by 53.64% in 2015 while
those who paid huge premium in 2014 increased further by 16.32% in 2015. Furthermore, the standard devia-
tions increased by 11.94% during the same period, an indication that the gap that existed among the insurance
companies with regard to reinsurance premium continued to widen in 2015. In fact, the study identified two
insurance companies whose reinsurance premiums appeared to defy conventional logic which anticipates that:
as the insurance company’s market share increased, the need for reinsurance protection hence reinsurance pre-
mium also increased in proportional terms and the reverse was also true. However, in the case of the two com-
panies, one company increased its market share by 74% and yet its reinsurance premium ratio declined by 69%;
while in the case of the second company, its market share declined by 24% and yet its reinsurance premium ra-
tio increased by 16%.
These distortions may point to a bigger underlying problems regarding: the quality of business underwritten by
insurance companies; their pricing strategies and discipline in the market; the type and structure of reinsurance
treaties they purchased; and finally the insurance companies’ loss ratios. The study further explored the relation-
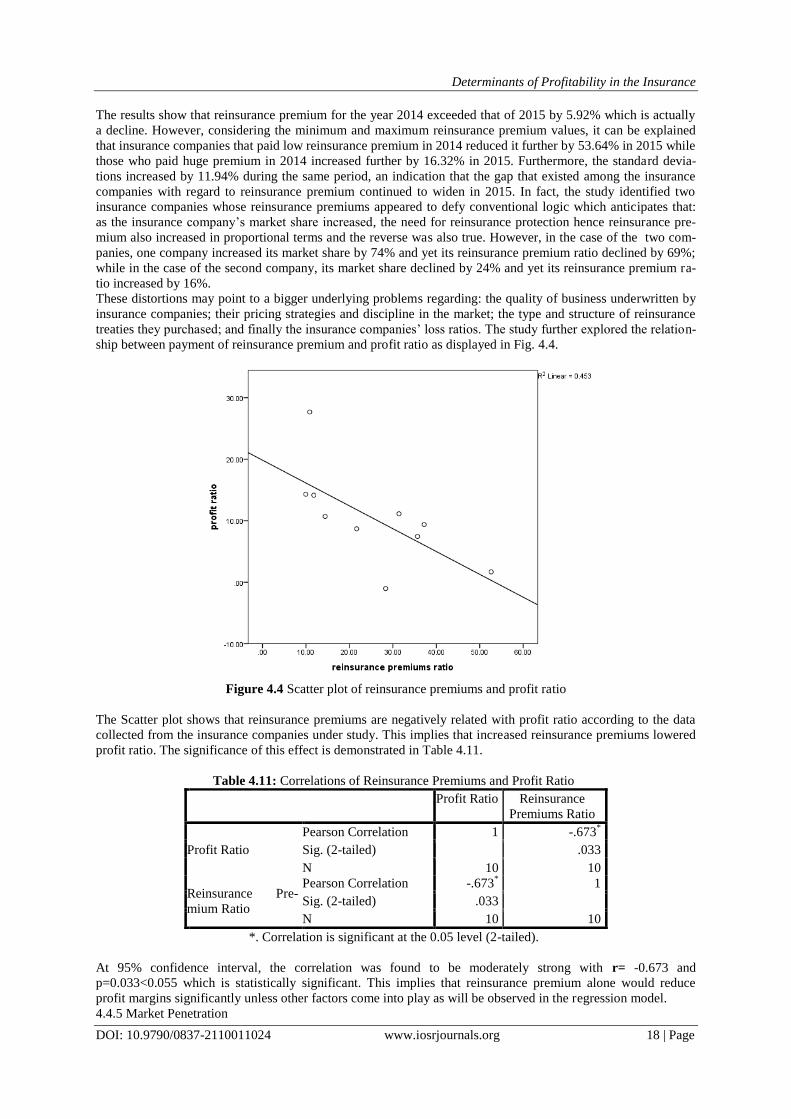
ship between payment of reinsurance premium and profit ratio as displayed in Fig. 4.4.
Figure 4.4 Scatter plot of reinsurance premiums and profit ratio
The Scatter plot shows that reinsurance premiums are negatively related with profit ratio according to the data
collected from the insurance companies under study. This implies that increased reinsurance premiums lowered
profit ratio. The significance of this effect is demonstrated in Table 4.11.
Table 4.11: Correlations of Reinsurance Premiums and Profit Ratio
Profit Ratio Reinsurance
Premiums Ratio
Profit Ratio
Pearson Correlation 1 -.673*
Sig. (2-tailed) .033
N 10 10
Reinsurance Pre-
mium Ratio
Pearson Correlation -.673* 1
Sig. (2-tailed) .033
N 10 10
*. Correlation is significant at the 0.05 level (2-tailed).
At 95% confidence interval, the correlation was found to be moderately strong with r= -0.673 and
p=0.033<0.055 which is statistically significant. This implies that reinsurance premium alone would reduce
profit margins significantly unless other factors come into play as will be observed in the regression model.
4.4.5 Market Penetration
Determinants of Profitability in the Insurance
DOI: 10.9790/0837-2110011024 www.iosrjournals.org 19 | Page
The study further explored market share of different insurance companies to establish the trend between year
2014 and 2015 and also to establish if it affected profit ratios significantly. Table 4.12 displays the descriptive
statistics collected from the selected insurance companies.
Table 4.12: Descriptive Statistics of Market Penetration
N Minimum Maximum Mean Std. Deviation
Market Share 2014 10 .36 9.21 2.9430 3.08233
Market Share 2015 10 .38 8.86 2.5130 2.63972
Recorded change 10 0.02 -0.350 -0.43 -0.44261
Percentage change 5.56% -3.80% -14.61% -14.36%
The market share reduced by 14.61% from year 2014 to 2015, which implies that insurance companies were
either facing competition from other non-traditional organizations that were not initially offering insurance ser-
vices such as the banks or lost their business to bigger companies in the market or both current and potential
customers opted to be self-insured. At the same time, the dispersion reduced by 14.36%, an indication that in-
surance companies that had low market share improved their position in the market to catch up with the ones
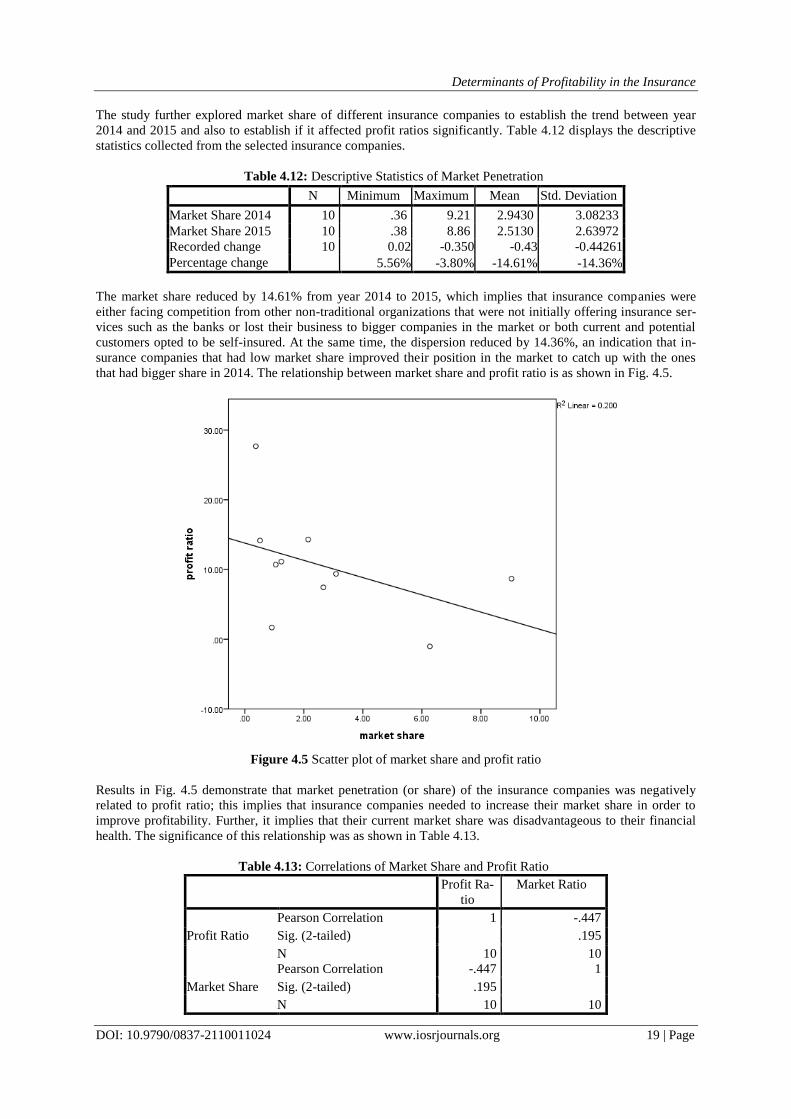
that had bigger share in 2014. The relationship between market share and profit ratio is as shown in Fig. 4.5.
Figure 4.5 Scatter plot of market share and profit ratio
Results in Fig. 4.5 demonstrate that market penetration (or share) of the insurance companies was negatively
related to profit ratio; this implies that insurance companies needed to increase their market share in order to
improve profitability. Further, it implies that their current market share was disadvantageous to their financial
health. The significance of this relationship was as shown in Table 4.13.
Table 4.13: Correlations of Market Share and Profit Ratio
Profit Ra-
tio
Market Ratio
Profit Ratio
Pearson Correlation 1 -.447
Sig. (2-tailed) .195
N 10 10
Market Share
Pearson Correlation -.447 1
Sig. (2-tailed) .195
N 10 10
Determinants of Profitability in the Insurance
DOI: 10.9790/0837-2110011024 www.iosrjournals.org 20 | Page
Table 4.13 shows that the Pearson correlation (r= -0.447) was not statistically significant (p=0.195>0.05) at 95%
confidence interval but, it implies that though market share led to negative profitability ratio especially as mar-
ket share tended to increase, its effects may not be significant when considered in isolation.
4.5 OLS econometric model specification
Table 4.14: OLS Econometric Model Summary
Model R R Square Adjusted R
Square
Std. Error of the
Estimate
1 .949a .901 .823 3.28675
a. Predictors: (Constant), market share, reinsurance premium ratio,
commission expenses, loss ratio
From the model summary, it can be shown that market share, reinsurance premiums ratio, commission expenses
and loss ratio predict profitability by a margin of 90.1% represented by the value of R-square. Further, it can be
observed that other factors beyond the scope of this study predicted profit ratio by 9.9%. Nevertheless, the vari-
ables under this study had higher prediction level than previous studies cited in literature review which indicates
that the study focused on relevant determinants of profitability in insurance sector.
Table 4.15: ANOVAa
Model Sum of Squares df Mean Square F Sig.
1
Regression 493.996 4 123.499 11.432 .010b
Residual 54.014 5 10.803
Total 548.010 9
a. Dependent Variable: profit ratio
b. Predictors: (Constant), market share, reinsurance premium ratio, commission expenses,
loss ratio
It can be explained that market share, reinsurance premium ratio, commission expenses and loss ratio signifi-
cantly predicted profit ratio (p=0.01<0.05) at 95% confidence interval. Therefore, it illustrates that it was not by
sheer chance that these variables affected profitability of insurance companies in Kenya. Moreover, the results
show that the OLS regression model was very well defined and that the linearity between the independent and
dependent variable existed at significant level.
Table 4.16: Coefficientsa
Model Unstandardized
Coefficients
Stan-
dardized
Coeffi-
cients
t Sig.
B Std.
Error
Beta
1
(Constant) 10.281 6.765 1.520 .189
Loss Ratio -.341 .224 -.500 -
1.524 .188
Commission
Expenses 1.779 .482 .659 3.694 .014
Reinsurance
Premium Ratio -.130 .158 -.236 -.826 .446
Market Share -.482 .522 -.174 -.923 .398
a. Dependent Variable: profit ratio
Therefore, the estimated econometric regression model is:
Y= 10.281 - 0.341X1 + 1.779X2 - 0.13X3 - 0.482X4 + e
Results of the regression coefficients show that only commission expenses (p=0.014<0.05) significantly pre-
dicted profit margins according to the data collected from the insurance companies under study. A unit increase
in commission expenses would lead to 1.779 improvements in profit ratio. This implies that if the insurance
companies had a large pool of well managed and coordinated sales and marketing teams, insurance brokers and
agents, the chances of improving profit ratio were high.It can further be observed that loss ratio (p=0.188>0.05),
reinsurance premium (p=0.446>0.05) and market share (p=0.398>0.05) each in isolation did not have adequate
Determinants of Profitability in the Insurance
DOI: 10.9790/0837-2110011024 www.iosrjournals.org 21 | Page
threshold to influence profit ratio of the insurance companies under study. However, a unit increase in loss ratio
would reduce profit margin by 0.341; a unit increase in reinsurance premium would lead to 0.13 a reduction in
profit ratio and a unit reduction in market share would reduce the profit ratio of insurance companies by 0.482.
This implies that insurance companies should monitor these variables carefully while encouraging more ex-
penses on agents and sales marketers in order to improve their profitability. The relationship between brokers
and agents was considered to be a very important non-price factor which helped with regard to: creating demand
for insurance products and services, maintaining insurance companies’ visibility, facilitating price discovery,
spreading product information, and filing knowledge gaps between sellers and buyers. In fact, the Chartered
Insurance Institute and Ernest Young (2012) reported that 80% of profitable insurance companies in the UK
were those that worked with brokers.
V. CONCLUSIONS The general objective of the study was to establish the factors that determined profitability in compo-
site insurance companies in Kenya. Specifically, the study was to evaluate how claims costs, commission ex-
penses, reinsurance costs, and market penetration influenced profitability. The study findings were that the inde-
pendent variables influenced profitability up to significant level of 90.1% and therefore, are proven to be more
effective tool of predicting and measuring profitability. At 95% confidence interval, the p value (p=0.01<0.05)
was statistically significant. The findings showed R-square value of 0.901which proved that claims costs (coef-
ficient = -0.341), commission expenses (coefficient = 1.779), reinsurance costs (coefficient = -0.13), and market
penetration (coefficient = -0.482) were important predictors of profitability in insurance sector. At 95% confi-
dence interval, the total direct (or 1 to 1 relationship) effects of the coefficients of determination of independent
variables accounted for 90.1% of all variations in the dependent variable, profitability. Only 9.9% of variations
could be explained by factors either outside the scope of this study, scope of data, measurement errors or ran-
dom disturbances caused by omitted variables. With specific reference to omitted variables, when operational
(management) expenses were introduced to the model the R-square value changed to 0.941 at 95% confidence
interval. Though not statistically significant (p=0.521>0.05) at 95% confidence interval, management expenses
influenced profitability ratio positively (r=0.231). So, each variable in the model was well supported in terms of
strength and direction of linearity between the variables. The R2 (0.901) signifies that: 90.1% of the observa-
tions are explained by the model; 9.9% of the observations were not explained by the model or were accounted
for by the error term; 90.1% of dependent variable was explained by the independent variables; and finally, the
model was a good one because of the small differences between observed data and the data predicted by the
linear model. Therefore, the dataset obeyed basic assumptions and created a reliable relationship between the
variables as illustrated by the parameter estimates. The estimated model could be accepted as a superior alterna-
tive to ROA and ROE for predicting profitability of the insurance sector.Although some of the previous studies
cited in the literature review had partly investigated research questions i and iv, that is, variables X1 (loss ratio or
underwriting risk) and X4 (market penetration) they had not fully resolved the research problem. Because, con-
cerning the relationship of loss ratio to ROA and ROE, the proxies for profitability, Mwangi and Murigu (2015) [12]
established a positive relationship (coefficient = 0.026); Dey and Bardhan (2015) [6]
established a significant
positive relationship (coefficient = 1.059); Burca and Batrinca (2014) [7]
established a significant negative rela-
tionship (coefficient = -0.101678); Maeri and Aemiro (2013) [8]
established a negative relationship (coefficient =
-0.1787326); Boadi et al (2013) [3]
established a positive relationship (coefficient = 0.34); and Malik (2011) [9]
established a negative relationship (coefficient = -0.047). The findings of this study about the nature of relation-
ship of loss ratio to profitability was in agreement with studies by Burca and Batrinca (2014) [7]
, Maeri and Ae-
miro (2013) [8]
and Malik (2011) [9]
. However, the point of departure was that in this study, the evaluated inde-
pendent variables that had a direct bearing to the Total Cost component of the profit function while ROA and
ROE had no relationship with it at all. But, the positive coefficients for incurred claims loss ratio in the studies
by Mwangi and Murigu (2015) [12]
, Dey and Bardhan (2015) [6]
, and Boadi et al (2013) [3]
were rather confusing
if unusual occurrence and could only mean that the insurance company received claims notifications, put up
reserves (costs) on them and did not make any payments out. Nevertheless, at the close of the year the compa-
nies adjusted the reserves downward or closed off a number of claims which ended in a positive movement re-
flected in the financial statements. Otherwise the anticipated relationship between loss ratio and profitability was
always negative.
With regard to research questions ii (variable X2 – commission expenses), the results showed an in-
crease by 2.73% from 2014 to 2015 and an increase in disparity by 14.77%. This meant that the gap in commis-
sion expenses among insurance companies had widened. Insurance companies continued to pay out all forms of
incentives to business intermediaries in the effort to increase top line (or market share) apparently without much
regard to the impact of contribution by specific distribution channels to profitability. The moderate positive rela-
tionship to profit ratio (r=0.565, table 4.9) needs to be checked by insurance companies for sustainability in the
medium-term and long-term.
Determinants of Profitability in the Insurance
DOI: 10.9790/0837-2110011024 www.iosrjournals.org 22 | Page
Concerning research question iii (variable X3 – reinsurance costs), results of a comparison between year 2015
and year 2014 shows a decline of 5.92% but, the disparity among insurance companies increased by 11.94%.
The study observed two insurance companies with curious if unconventional movements in their reinsurance
cost schedules. At 95% confidence interval, the correlation between reinsurance costs and profitability was
moderately strong (r= -0.673) and was statistically significant (p=0.033<0.055). This implied that an increase in
reinsurance costs alone would cause significant decline in profitability unless other factors came into play.
Finally, examination of the four variables in the research objectives confirm that: the specified econometric
model not only addressed the original research problem substantially by illustrating that the estimated model
was very well defined and that linearity between the independent and dependent variables existed at significant
level but also suggested its superiority over the ROA and ROE approaches adopted in previous studies. There-
fore, the short-term and long-term implications of the results are that the specified model could be a better alter-
native device to the problem of evaluating and measuring profitability in the insurance sector.
5.4 Recommendations
In view of the above research findings, results and conclusions, the following recommendations were
made. 5.4.1 Recommendations for Improving this StudyInitially, it was hoped that the research study would
collect a larger sample size (5 years from 2011 to 2015) of qualitative data but there were challenges of time and
completeness of data. Future research, based on expanded dataset could be necessary. The benefit of this would
be helping improve the predictive power, validity, and reliability of the estimated OLS econometric regression
model developed by this study.
5.4.2 Recommendations for Future Research
The following recommendations are offered for related research in the field of insurance awareness,
education, and socio-economic relevance and previous studies.This study provides a basis for concluding that
while there were mixed findings regarding the effects of consumer education, personal income, price of product,
brand reputation, company size, and convenience of access to products, it was clear that all of them contributed
in varying proportions. Therefore, their real statistical significance ought to be established. The benefit of this
could be aiding development of a unique model for evaluating market penetration as tool for measuring the state
of sector development. Results of three previous studies cited in literature review with regard to claims loss ratio
established a positive relationship to profitability. Such result is rather confusing and unusual occurrence. The
anticipated relationship between loss ratio and profitability should always be negative, thus, a unit of increase in
incurred claims ratio, causes a decline in profitability ratio. Therefore, the findings in the studies of: Mwangi
and Murigu (2015), Dey and Bardhan (2015), and Boadi et al (2013) ought to be verified. The benefit of this
would be a basis to clear the vagueness that may now exist in the body of empirical knowledge.
5.4.3 Recommendations for Insurance Companies
The population demographics are in permanent state of change. A series of longitudinal studies, based
on this model to investigate and establish the true drivers of market penetration will be necessary. A credible
data base containing vital statistics (age, education, profession, occupation, income, and family size) of past and
current consumers of insurance products and services should be built up. The benefit of this is that public
awareness and education initiatives would now be targeted at specific groups based on need.
At 95% confidence interval, the OLS econometric regression model summary demonstrates that claims costs,
commission expenses, reinsurance costs, and market penetration are important and significant
predictors of profitability upto 90.1%. Adoption of the model as a standard tool for forecasing, implementing,
evaluating, and measuring profitability in their companies is recommended. The benefit of this approach will
totally eliminate the possibility of corrective but, reactive steps and actions that are usually taken after the event.
Considering the findings regarding the influence of claims costs and market penetration of profitability, over-
whelming majorities of respondents representing 61 percent and 58 percent respectively stated that those va-
riables strongly influenced profitability. A company that was growing but in limited market space and depth or
vice versa, was unlikely to contain its claims costs. Therefore, business planners should of necessity incorporate
claims costs and market penetration ratios in their planning templates. The benefit of this would help companies
to appreciate the reality that growth opportunities were not an unlimited phenomenon. So, based on other unique
considerations they must select optimal market share ratio. Results and findings have shown a wide gap in
commission expenses among insurance companies. Indeed, between 2014 and 2015 figures the disparity is very
high (14.77%). The reporting criterion for commission expenses ought to be reviewed, simplified, and reported
as an autonomous item. The benefit of this would be helping companies to appreciate the true impact of this
business cost and its sustainability. Results have shown that reinsurance costs, though bearing a moderate posi-
tive relationship to profitability has the most significant singularly influence on profitability. Therefore, insur-
Determinants of Profitability in the Insurance
DOI: 10.9790/0837-2110011024 www.iosrjournals.org 23 | Page
ance companies should review the architecture of their reinsurance treaties to ensure that they directly respond
to the risk profiles, actual capacity needs, realistic business growth aspirations, relative stable markets offering
the capacities, and appropriateness of prevailing costs. The benefit of this is to ensure that the companies’ rein-
surance costs are proportionate to the risks reinsures are exposed to.
With regard to claims settling record in the sector, the majority of respondents representing 71% stated that it
was average which is condemnation bearing in mind the basis of recommendation 3 above. Therefore, insurance
companies must rise to the challenge of earning intimate confidence of consumers through products and service
that are relevant and reliable to the promise of financial security. The benefit of this would be to increase the
company’s market shares due to repeat sales and enduring customer loyalties.
5.4.4 Recommendations for Policy Makers and Regulators
The estimated OLS econometric regression model has superior prediction power, validity, and reliabili-
ty relative to ROA and ROE. The regulatory authority should issue a policy guideline requiring all sector play-
ers to adopt it as a standard tool for evaluating and measuring profitability in the insurance sector. The benefit of
such action would be to totally eliminate current discretion and subjectivity about how profitability is measured
and expressed in the financial statements.This study has established the determinants of profitability in the in-
surance sector. So, the Insurance Regulatory Authority should fund necessary research initiatives aimed at un-
raveling at main causes underlying: low market penetration ratio to GDP; and the perpetual low solvency and
liquidity ratios in the industry. The benefit of this would be: identifying market barriers hindering sector growth
and contribution to national economy; resolving solvency and liquidity challenges for healthier financial condi-
tion and long-term sector survival which is not necessarily guaranteed by higher capitalization requirements.
The practice of reporting commission expenses as the sum of commissions paid and commissions received
from reinsurers was erroneous; commission paid to business distributors was a direct expense while reinsurance
commission received was an optional income at negotiated rates but was subject to profitable performance of
the reinsurance treaty. The two should be treated as autonomous items. The benefit of this is to help insurance
companies recognize in their financial statements the actual impact of commission expenses.
Even though solvency and liquidity ratios are functions of claims costs, the regulatory authority has
generally addressed claims settling ability and performance as a consumer protection issue rather than a struc-
tural or systemic challenge. A change of approach should foresee a fine balance between consumerism and the
need to preserve insurance industry collective need commercial freedom, innovation, and economic develop-
ment for the greater good of GDP.
Most insurance companies and even the regulator report commission expenses item within the general manage-
ment expenses heading. Therefore, isolating the data can be a tedious exercise. However, it was shown that
though operational (management) expenses influenced profit ratio positively (r=0.231) the relationship was not
statistically significant (p=0.521>0.05) at 95% confidence interval. So, taken in isolation it implies that changes
in operational expenses did not lead to observable changes in profit ratio. In this regard, more variables should
be added to this model to compare the results.
REFERENCES [1] Mahboob, A. (2015). A Comparative Study on Profitability of SBI and HDFC. International Journal of
Management and Social Science Research Review 1, no. 10: 35 – 39. E-ISSN-2349 – 6746, ISSN – 2349-
6738.
[2] Wright, K. M. (1992, p. 33). The Life Insurance Industry in the United States: An Analysis of Economic
and Regulatory Issues. Country Economics Department, the World Bank.
[3] Boadi, E. K., Antwi, S. & Lartey, V. C. (2013). Determinants of profitability of insurance firms in Ghana.
International Journal of Business and Social Research (IJBSR) 3, 3: 43 – 50.
[4] Olalekan, T. Y. & Dansu, S. (2014). Effects of Claim Cost on Insurers’ Profitability in Nigeria.
[5] Rani, T. & Shankar, H. (2014). General insurance business in India – A study on what its performance
indicates? Scholars Journal of Economics, Business and Management 1, no. 9: 392 – 399.
[6] Dey, N. B., Adhikari, K., & Bardhan, M. R. (2015). Factors determining financial performance of life
insurance companies of India – An empirical study. EPRA International Journal of Economic and Busi-
ness Review 3, 8: 42 – 48. E-ISSN: 2347 – 9671, p- ISSN: 2349 – 0187.
[7] Burca, Ana-Maria & Batrinca, G. (2014). The determinants of financial performance in the Romanian
insurance market. International Journal of Academic Research in Accounting, Finance and Management
Sciences 4, 1: 299 – 308. E-ISSN: 2225 – 8329, P-ISSN: 2308 – 0337.
[8] Mehari, D. and Aemiro, T. (2013). Firm Specific Factors that Determine Insurance Companies’
Performance in Ethiopia. European Scientific Journal April 2013 edition 9, No. 10. ISSN: 1857 – 7881
(Print) e – ISSN 1857 – 7431.
Determinants of Profitability in the Insurance
DOI: 10.9790/0837-2110011024 www.iosrjournals.org 24 | Page
[9] Malik H. (2011). Determinants of insurance companies’ profitability: An analysis of insurance sector of
Pakistan. Academic Research International 1, 3: 315 – 321.
[10] Popper, K. (1959). The Logic of Scientific Discovery (English ed). London and New York. Routledge
Classics.
[11] Association of British Insurers (2007: pp. 9-10). Profitability and Concentration in the UK General Insur-
ance Market. ABI Research Department.
[12] Mwangi, Mirie & Murigu, Jane Wanjugu (2015). The determinants of financial performance in general
insurance companies in Kenya. European Scientific Journal (January 2015 edition) 11, no. 1: 288 – 297.
ISSN: 1857 -7881 (print) e – 1857 - 7431.