Embed Size (px)
Citation preview
1
Determinants of Capital Structure: A Long Term Perspective
Chinmoy Ghosh School of Business, University of Connecticut, Storrs, CT 06268, USA, e-mail:
Milena Petrova* Whitman School of Management, Syracuse University, Syracuse, NY 13244, USA, e-mail:
Adam Wang Whitman School of Management, Syracuse University, Syracuse, NY 13244, USA, e-mail:
Abstract
We examine whether market and operating performance have a long lasting effect on firms’ use of leverage We design a weighting scheme that captures the effect of profitability during the periods when the firm rebalances its leverage. Our results show that the constructed variable, weighted average historical profitability, has a strong negative impact on the firm’s current capital structure. This impact is robust for small vs. large firms, high vs. low growth firms and is not influenced by market conditions. Our findings imply that the firm’s capital structure is to a large extent the outcome of accumulating historical operating profits.
Keywords: capital structure, profitability, trade-off theory, pecking order theory
JEL classification: G30; G32
*Contact author: e-mail: [email protected], phone: (315) 396-3366
2
Determinants of Capital Structure: A Long Term Perspective
We examine whether market and operating performance have a long lasting effect on firms’ use of leverage We design a weighting scheme that captures the effect of profitability during the periods when the firm rebalances its leverage. Our results show that the constructed variable, weighted average historical profitability, has a strong negative impact on the firm’s current capital structure. This impact is robust for small vs. large firms, high vs. low growth firms and is not influenced by market conditions. Our findings imply that the firm’s capital structure is to a large extent the outcome of accumulating historical operating profits.
Introduction
What drives the corporate use of debt financing and firms’ setting of financial
policy is a fundamental question in finance that has attracted voluminous theoretical and
empirical research. Three main theories have been advanced to explain capital structure:
the trade-off theory, pecking order theory, and market timing theory. While these theories
make different predictions regarding the existence of optimal target structure, recent
research has focused its attention on the cost associated with adjustment to target capital
structure (Fischer, Heinkel and Zechner (1989), Leary and Roberts, (2005)) and on the
speed of adjustment to target (Hovakimian, Opler and Titman (2001), Leary and Roberts
(2005), Flannery and Rangan (2006), Strebulaev (2007), and Huang and Ritter (2009)).
However, the factors influencing firm’s choice of financial policy remain an empirical
issue. While many studies focus on the short-term determinants of use of debt (one period
lagged variables), few have examined the effect on leverage of stylized factors over long
periods of time (Baker and Wurgler (2002) and Kayhan and Titman (2007)).
3
This paper attempts to understand whether market and operating performance
have a long lasting effect on firms’ use of leverage and whether the changes in capital
structure due to operating profits can accumulate in the long run.
Early tests to disentangle the three theories involved regressing firms’ observed
leverage ratios against contemporaneous values of various traditional proxies for
information asymmetry, market inefficiencies, and transaction costs. Overall, the
findings of these studies are mixed, establishing only a small number of factors related to
leverage that are empirically robust (Frank and Goyal (2009)). A significant finding of
this line of literature is the consistently negative relation between leverage ratio and
profitability, a result Strebulaev (2007) characterizes as a “major failure of the trade-off
model.” Most studies show a negative relationship between lagged or average profits and
debt ratios (Titman and Wessels (1988), Baker and Wurgler (2002), Huang and Ritter
(2009), and Kayhan and Titman (2007)). A negative effect of profitability on leverage is
consistent with the pecking order theory, as firms prefer internally generated funds over
external financing and profitable firms will tend to generate more internal funds and use
less debt. While, the observed relationship is not consistent with the static trade-off
theory, which implies that profitable firms use more debt to maximize interest tax shields,
it is not inconsistent with the dynamic trade-off theory, as firms with higher growth
opportunities may retain funds and distribute them at later periods.
The illusive search for optimal capital structure under the static model motivated
more recent studies to focus on the long-term behavior of debt ratio (Baker and Wurgler
(2002), Welch (2004) and Kayhan and Titman (2007)). Trade-off theory posits that since
managers strive to rebalance away short-term deviations from the optimal leverage ratio,
4
no factor has persistent long-term effect on debt ratios. In contrast, neither pecking order
nor market timing theory is inconsistent with persistent impacts. However, while pecking
order theory posits that firms prefer debt to equity when raising external equity, market
timing theory predicts that profitable firms with high market-to-book ratios tend to issue
more equity. As such, in the dynamic setting, under pecking order, long-term debt ratios
would reflect firms’ financing deficit; under market timing, debt ratio is inversely related
to the average historical market-to-book ratio.
In this paper, we examine the effect of profitability on leverage and its persistence
over time using data from 1950 – 2008. As previously noted, leverage-profitability
negative relationship is the most pervasive regularity in capital structure research. It is a
powerful result that allows us to disentangle the trade-off and pecking order theories.
However, despite the strong effect of profitability on leverage, the issue of its persistence
remains largely unexplored. Tests of persistence and speed of adjustment are useful to
further separate the trade-off, pecking order, and market timing theories.
We employ Fama-MacBeth regression analysis, where the dependent variable is
the current book leverage or market leverage and the independent variable of interest is
the weighted average of historical profits. We design a weighting scheme for historical
profits that captures the effect of profitability during the periods when the firm rebalances
its leverage through issuance or retirement of debt or equity. Specifically, the more effort
is required to rebalance the effect of its earnings on leverage during a year, the higher is
the weight given to the firm’s profit in that year. The effort to counter-balance the
profitability effect is measured by the adjustment through external financing activities,
the net debt issuance minus the net equity issuance. Our results show that the weighted

5
average historical profitability over the firm’s entire history has a strong negative impact
on the firm’s current capital structure measured by either book leverage or market
leverage. The impact of weighted average historical profitability remains economically
and statistically significant, after controlling for previously identified determinants of
capital structure, such as one-period lagged profitability, tangibility, firm size, and
market-to-book ratio. This impact is also robust to small versus large firms, and firm
with and without credit ratings, high and low M/B ratios. In addition, this effect is not
influenced by market conditions.
We further compare the explanatory power of weighted average historical profits
in a regression model, which includes previously identified capital structure determinants.
We find that the firm’s weighted average historical profitability accounts for a greater
amount of cross-sectional variation in leverage than the combined effect of all lagged
leverage determinants identified by Rajan and Zingales (1995). Our findings indicate
that the current leverage, to a large extent, can be viewed as the cumulative result of
firm’s historical profits.
Our results remain robust when we include firm fixed effects and additional
control variables, such as the weighted average of past market-to-book ratio used by
Baker and Wurgler (2002). The results also hold over different sample periods. Frank and
Goyal (2009) report that one lagged profits become less important in determining the
current leverage after 1980s. We perform the analysis for two subsamples: one including
all firms from 1950 to 1989 and a second one, including firms during 1990 – 2008. We
find that the strong negative relation between leverage and the weighted average
historical profits is economically and statistically significant for both subsamples.
6
Furthermore, this strong negative relation cannot be attributed to survivorship bias, as we
estimate our regression model for firms surviving through the period of 1970 to 1989 and
firms exiting during that period and obtain similar results.
What are the implications of our findings within the context of the current state of
research on capital structure? Market-to-book ratio and stock returns have been found to
have persistent effects on leverage ratio (Baker and Wurgler (2002), and Welch (2004)).
The conclusions in these studies have been challenged, however. Hovakimian (2006)
argues that the persistently negative effect of market-to-book ratio is consistent also with
the notion that firms with high growth opportunities maintain low debt ratios to retain the
option to issue securities in the future. In addition, several authors report that the speed
of adjustment is too fast to be consistent with persistence. Our evidence of the persistent
effect of profitability on leverage raises new questions about the trade-off model. Neither
the static, nor the modified trade-off theory with partial adjustment can be reconciled
with the evidence of strong long lasting negative effect of weighted average historical
profits on capital structure.
The rest of this paper is organized as follows. Section I describes the data, sample
and variable constructions; Section II reports results of long term effect of weighted
average historical profits on firm capital structure; Section III compares the explanatory
power of the weighted average historical profits and lagged leverage determinants;
Section IV checks the robustness of the main findings; Section V discusses the
interpretations for our major results; and finally section VI concludes the paper.
7
I. Background Literature
Under the trade-off theory, an optimal capital structure exists, which captures the
trade-off between the benefits of borrowing (tax-deductibility of interest payments)
against the costs associated with financial distress, and debt overhang. Any deviation
from the optimal capital structure is transient and firms quickly rebalance to move capital
structure back to the optimal level. An important implication of the trade-off theory is
that profitable firms use more debt to maximize the tax benefit. Hence, profitability and
debt should be positively related. Further, since firms rapidly reverse any deviation from
the optimal capital structure by undertaking the appropriate financing action, any change
in the firm’s debt-equity mix does not persist over time.
According to the pecking order theory, to minimize costs stemming from
information asymmetry, firms prefer to use internal capital first, followed by risky debt,
and finally equity. Pecking order theory predicts that since profitable firms generate
more internal funds, they issue less debt. Further, firms with high financing deficit, and
need for external capital to fund investment opportunities have high debt ratios. However,
there is no optimal capital structure, and observed leverage ratios are the cumulative
effect of firms’ information asymmetry, profitability, and investment opportunities. So,
firms reveal no strong inclination to reverse leverage changes induced by financing needs
and earnings growth.
Finally, the equity market timing theory posits that managers issue equity when
the market is overvalued, and issue debt when the market is undervalued. Similar to the
pecking order theory, market timing theory does not predict an optimal capital structure;
8
rather, current debt ratios are dependent on the history of firms’ financing choices
dictated by the state of the stock market. However, recent research (Alti (2006) and
Hovakimian (2006)) presents evidence that the effect of market timing on capital
structure is not long lasting. In essence, both pecking order and market timing theories
are consistent with persistent effects of relevant factors on leverage ratios.
The early tests of trade-off theory estimate regression models of leverage ratio
against firm characteristics including size, profitability, tangibility of assets, and growth
opportunities. The results are mixed. Consistent support for trade-off theory draws from
the positive effect of size and value of assets on leverage ratio (Titman and Wessels
(1988), Rajan and Zingales (1995), and Chang and Dasgupta (2009)). Corroborative
support derives from the evidence that firm’s debt-equity choice is influenced by
deviations from long-term target leverage (Jalilvand and Harris (1984), Hovakimian,
Opler and Titman (2001)). An alternative perspective is presented by Shyam-Sunder and
Myers (1999) who argue that to minimize cost of information asymmetry, firms will
avoid selling equity, and prefer issuing debt. The authors show that net debt issues bear a
strong correspondence to financing deficit, which they interpret as consistent with the
pecking order theory. However, Frank and Goyal (2003) present two pieces of evidence
that are inconsistent with the implications of pecking order. First, net equity financing
tracks financing deficit closely, net debt issues do not. Second, the effect of conventional
trade-off variables is not wiped out by financing deficit in a nested model incorporating
the conventional regressions and the pecking order.
Baker and Wurgler’s paper (2002) on the effect of market-to-book ratios on
leverage refocused the capital structure literature in two directions. First, it formally
9
established the impact of equity market valuation on firms’ debt-equity choice, and
confirmed the anecdotal evidence that managers time equity issues to exploit high market
valuations. More significantly, the study demonstrated that the market timing effect is
persistent over time; market-to-book ratios from 5-10 years past had significant effect on
current leverage ratio. The persistent impact of any firm characteristic on leverage ratio
is an important result because it contradicts the notion that firms rebalance away any
deviations from the target leverage. While several authors (Hovakimian (2006)) have
provided evidence that the negative relation between market-to-book and leverage ratio is
consistent also with the notion that high market-to-book ratio firms have high growth
opportunities and tend to have lower leverage ratios to preserve financial slack, the
evidence on persistence has been the theme of a series of recent studies. Following the
Baker and Wurgler study, several authors including Welch (2004), and Kayhan and
Titman (2007)) have used the partial adjustment model to find that fluctuations in
market-to-book ratios, cash flows, investment opportunities, and stock returns lead to
significant deviations from the target leverage ratio, and capital structures move back to
the target level albeit at a slow rate. Related to the issue of persistence, authors have
examined the speed of adjustment in leverage ratio aftershocks to the system caused
deviation from the target. The intense interest in this issue stems from the fact that
persistence and speed of adjustment afford a direct test of the implications of alternative
theories of capital structure. Under the trade-off theory, firms gradually adjust to the
target level; so, there should be no persistent effects. The pecking order theory implies
that no optimal capital structure exits and currently observable leverage ratios depend on
the history of the firm. Equity market timing theory leads to similar implications.
10
Our objective is to provide additional evidence to this growing literature by
testing the persistence of the effect of profitability on capital structure. Previous
literature provides evidence for a negative relationship between lagged or average profits
and leverage (Titman and Wessels (1988), Baker and Wurgler (2002), Huang and Ritter
(2009), and Kayhan and Titman (2007)). The static trade-off theory predicts that
profitable firms, facing lower financial distress costs and enjoying potentially higher
benefits from debt, due to the larger interest tax shield, will have higher levels of debt.
This implies that the observed negative relationship of profitability and leverage is not
consistent with the static trade-off theory. In addition, the agency theory (Jensen (1986))
posits that the benefits of debt will be greater for mature firms with higher free cash flows,
as higher leverage and commitment to pay interest will preclude managers from wasting
corporate resources, by investing in value destroying projects. However, the dynamic
trade-off theory suggests that firms with higher growth opportunities may retain funds,
rather than distributing them, which implies that a negative relation between profitability
and leverage may be observed for firms with high growth opportunities. Finally, the
negative effect of profitability on leverage is consistent with the pecking order theory, as
firms prefer internally generated funds over external financing and profitable firms will
tend to generate more internal funds and use less debt.
Kayhan and Titman (2007) present some evidence on the long-term persistence of
the impact of profitability on leverage. The authors use the sum of past earnings over the
last 5 and 5 – 10 years preceding the current period to examine the persistence of
profitability. Their results show that the relation between 5-year cumulative profitability
and leverage is relatively weak and even weaker for earlier periods. More interestingly,
11
they find that in market leverage regressions, the effect of profitability is positive,
contrary to the notion that profitable firms use less debt.
We examine the long term persistence in the profitability-leverage relationship. In
contrast to Kayhan and Titman, we use the weighted average of historical profits. We
believe that the weighted average scheme captures the effect of changes in profitability
more accurately. Since the purpose of partial adjustment models is to examine the extent
to which firms adjust to the target leverage, and the speed of adjustment, it is important to
focus on the periods when firms actually adjust by issuing or retiring debt or equity.
Leary and Roberts (2005) find that in about 75% of their quarterly observations, firms are
inactive in their financing initiatives. As noted by Hovakimian and Li (2010), during the
passive periods, changes in capital structure are induced only by changes in profitability
with no adjustment, whereas during active financing periods, speed of adjustment is as
high as one. The effect of profitability is thus path dependent and a simple sum will tend
to underestimate the true impact of changes in profitability. Our weighting scheme is
designed to capture the most influential historical profits.
Lemmon, Roberts and Zender (2008) report that variations in capital structure are
primarily driven by factors that remain stable for long periods of time, although a
transitory component makes some secondary contributions to the evolution of capital
structure. By design, the weighted average historical profits over long period are
relatively stable and also capture the recent variations in profitability. As such, the
superior explanatory power of weighted average historical profits on current capital
structure is intuitive.
12
II. Data and Variable Constructions
A. Data and Descriptive Statistics
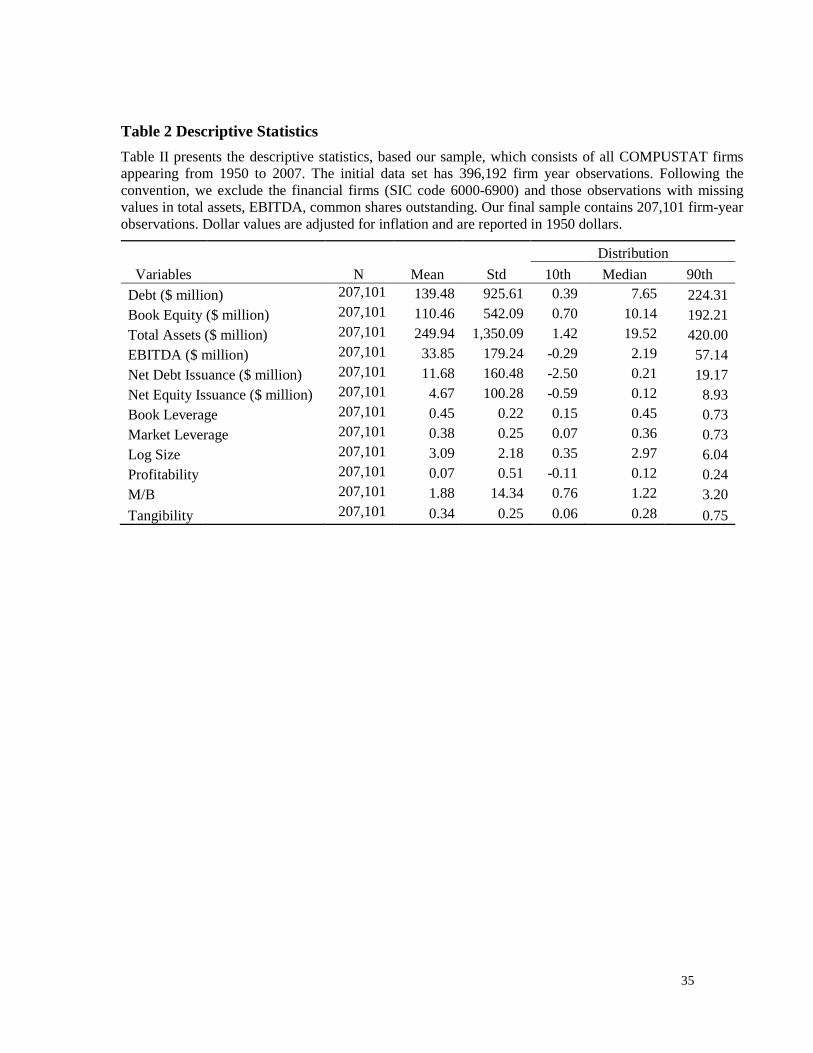
Our sample is drawn from all COMPUSTAT firms appearing from 1950 to 2008.
The initial data set has 396,192 firm year observations. Following the convention, we
exclude financial firms (SIC code from 6000 to 6900), and firm observations with
missing values in total assets, EBITDA, and common shares outstanding. We also
exclude observations with total debt to total assets ratio less than 0 or greater than 1. This
yields our final sample, consisting of 207,101 firm-year observations.
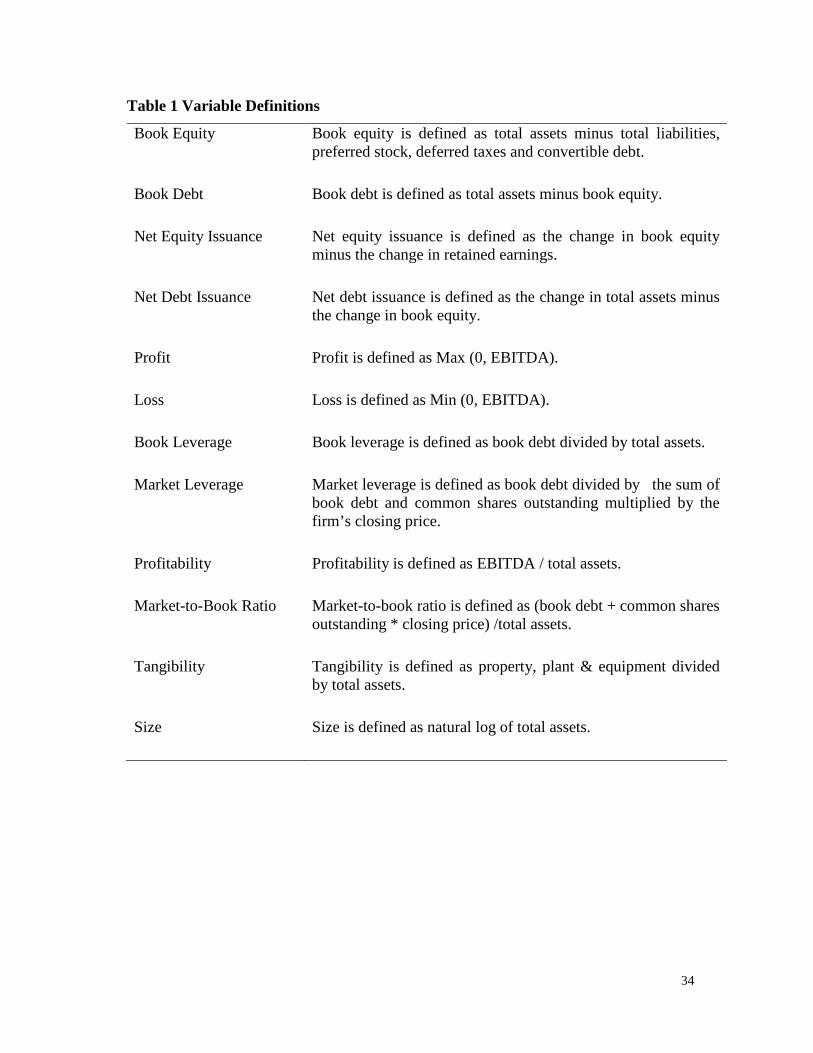
Detailed variable definitions are provided in Table 1. We follow Fama and French
(2002) for all of our variable definitions. Book leverage is defined as the book value of
total liabilities divided by total assets, while market leverage is defined as the book value
of total liabilities divided by the sum of book value of total liabilities and the market
value of equity. We define the book value of total liabilities as total assets minus total
book value of equity, and define book value of equity as total assets less total liabilities
(Item 181) and preferred stock (Item 10) plus deferred taxes (Item 35) and convertible
debt (Item 79).
Net equity issuance and net book debt issuance describe the external financing
activities of a firm. We define the net equity issuance as the change in book value of
equity less the change in retained earnings (Item 36) and define net debt issuance as the
changes in total assets less the changes in book value of equity.
[Insert Table 1]
13
Table 2 reports the descriptive statistics of our sample. On average firms have a
book leverage of 45% and a market leverage of 38%, with mean M/B ratio of 1.88 and
profitability of 7%.
[Insert Table 2]
III. The Long-term Effects of Historical Profitability on Capital
Structure
The main purpose of this paper is to examine the long-run effect of operating
results on capital structure. Previous literature recognizes the short-term impact of
operating results on capital structure (Titman and Wessels (1988), Rajan and Zingales
(1995), Mackay and Phillips (2005)). Several studies have established the significance of
one-period lagged profitability as a determinant of capital structure. In part A of this
section, we examine the average size of firm’s profits /losses and whether firms counter
balance the profitability effect by external financing activities; in part B, we construct a
variable to measure the historical profitability over the firm’s history and conduct
regression analysis including this new variable; in part C we study the persistence of the
long-term profitability effect.
A. Non-parametric Study of the Long-term Profitability Effect
Changes of capital structure derive from two sources. The first source is internal
operating results, profits or losses, and the second is external financing activities - debt
issuance or retirement, and equity sales or repurchase. As noted by Hovakimian and Li
(2011), a firm’s operating profits (losses) increase (decrease) its value of equity, which
leads to a decrease (increase) in leverage, if the firm does not counter balance the effect
14
of profitability by using external financing. Previous literature documents that in the
short run, operating profits indeed reduce the firm leverage, indicating that firms
insufficiently respond to changes in capital structure induced by operating results.
Kayhan and Titman (2007), among others, interpret the negative relationship between the
leverage and profitability as the result of partial adjustment, and document that changes
in capital structure tend to reverse in the following five years, at least partially. In order to
study the cumulative effect of profitability, it is necessary to examine the size of capital
structure change due to operating results over the long time period.
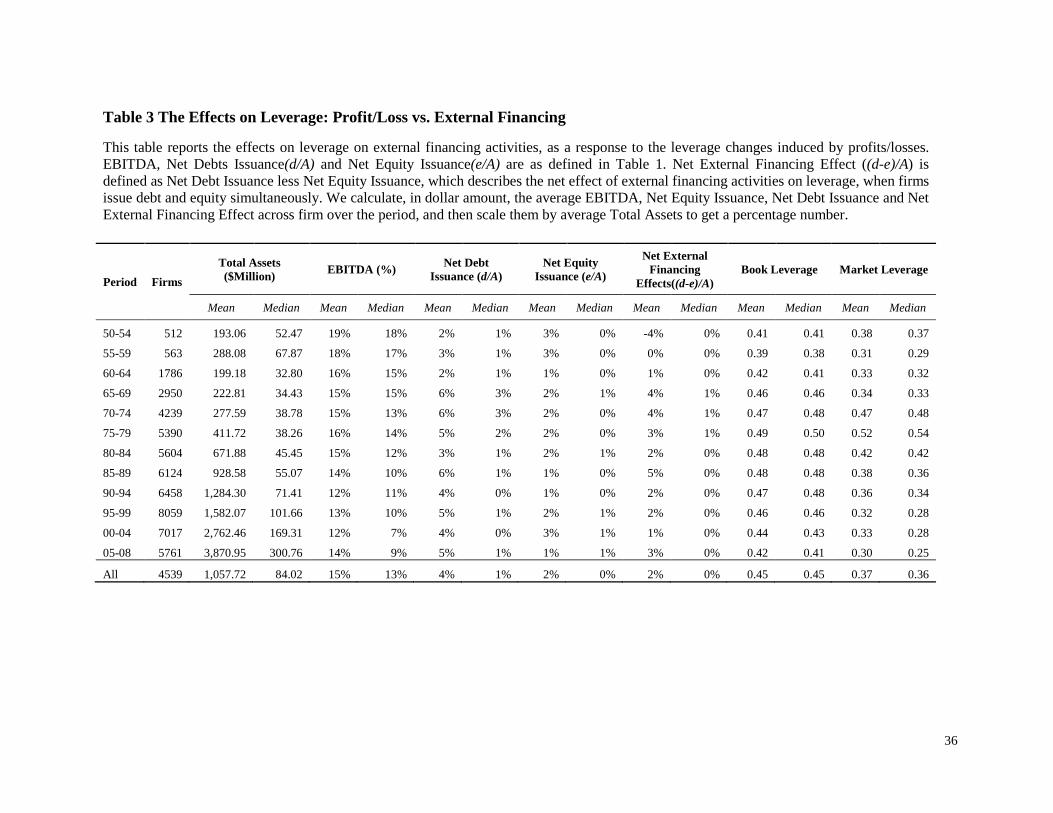
Table III reports the size of operating results and the magnitude of external
financing activities. The size of operating results is measured by average EBITDA
divided by average total assets. We report the magnitude of external financing using three
variables - net debt issuance (d), net equity issuance (e), and net external financing (d-e).
Definitions of net debt issuance and net equity issuance are provided in Table 1. The
external financing (d-e) describes the net effect of external financing on leverage. We
calculate, in dollar amount, the averages of EBITDA, net equity issuance, net debt
issuance and net external financing effect across firms over 5-year period, and then scale
them by the average total assets in that period to get the percentage number.
[Insert Table 3]
From Table 3, we note that the 5-year average EBITDA/TA has been stable
during the last 60 years. It ranges from 12% to 19% with a mean of 15%. Net debt
increases at an average rate of 4% of total assets per year, while net equity increases at a
rate of 2% of total assets per year. Conceivably, firms issue more debt than equity to
15
counter balance the automatic changes in leverage due to operating profits. However, the
external financing activities respond insufficiently to the changes in leverage due to
profits. If we hold profits and net equity issuance constant, firms should issue debt up to
14% of total assets to fully counter-balance away the profitability effect (we calculate the
leverage effect of profits by using the average leverage ratio of 45%). Therefore, it is
reasonable to believe that the profit effect on leverage can accumulate in the long run.
While the summary statistics give us some insight on the long term effect of
profitability on leverage, we cannot conclude whether such a relationship exists as mean
statistics can be misleading in some extreme cases. For example, if profits accumulate
only in those firms with zero leverage, then the historical profits have no effect on the
current leverage at all. To investigate the long-term effect of historical profits on current
leverage more precisely, in the next section we conduct multiple regression analysis, in
which the dependent variable is the book or market leverage ratio and the weighted
average of historical profits is the main explanatory variable.
B. Leverage Regression Study on the Long-term Profitability
Effects
a. Measuring the Historical Profitability
In order to study the accumulated effect of historical profitability, we construct a
new variable - the weighted average of profits over the firm’s history. The weighting
scheme is designed to capture the most influential historical profits in the firm’s history.
Specifically, the more effort is required for a firm to counter balance the effect of profit
on leverage in a year, the more influence the profit in that year exerts on the firm’s long-
16
term leverage, and thus the more weight is put on the profit in that year. The effort to
counter balance the profitability effect is measured by the relative external financing
activities, the net debt issuance minus the net equity issuance. The formula of the
weighted average historical profits is as follows:
𝑃𝑟𝑜𝑓𝑟𝑒𝑓𝑤𝑎,𝑖𝑡−1 = ∑ 𝑑𝑖𝑠−𝑒𝑖𝑠∑ (𝑑𝑖𝑟−𝑒𝑖𝑟)𝑡−1𝑟=0
𝑡−1𝑠=0 𝑝𝑟𝑜𝑓𝑖𝑠 (1)
where the summation is taken starting from the first year that the firm appears in
the COMPUSTATs dataset. The variable 𝑝𝑟𝑜𝑓𝑖𝑡 represents profitability in period t,
measured by EBITDA divided by total assets; 𝑑𝑖𝑡 is the net debt issuance in period t
scaled by total assets; 𝑒𝑖𝑡 is the net equity issuance scaled by the total assets. The
difference of 𝑑𝑖𝑡 − 𝑒𝑖𝑡 describes the outcome of debt-vs.-equity decision. A positive value
of (𝑑𝑖𝑡 − 𝑒𝑖𝑡) implies that a firm issued more debt than equity, indicating an effort to
balance away the effect of profit on leverage. If firms are rational in the long run, then the
rebalance effort signals that the corresponding profit has long-term influence on firm
leverage, otherwise the firm need not take any action. In such a weighting scheme, the
weighted average of historical profits is better in describing the firm profit path than a
series of lagged profits or a simple moving average of historical profits, because the
weighting scheme of the 𝑝𝑟𝑜𝑓𝑟𝑒𝑓𝑤𝑎,𝑖𝑡 can, not only pick up the influential profits in the
firm history, but also reduce the noise in the time series of 𝑝𝑟𝑜𝑓𝑖𝑡, which may stem from
the short-term fluctuation of profits or from earnings management.
In calculation, we follow Baker and Wurgler (2002) and set the weight (𝑑𝑖𝑡 − 𝑒𝑖𝑡)
to zero to ensure that total weights are increasing, when the difference is negative. Also
we ignore the observations with positive (𝑑𝑖𝑡 − 𝑒𝑖𝑡), but negative profits, in order to
17
isolate the effect of profits. We also exclude those outliers which have the profits or
losses more than 1.5 times total assets.
b. Leverage Regression Analysis
In order to study the long term relation between the leverage and historical profits,
we conduct the traditional Fama-MacBeth leverage regression. We use the book and
market leverage as dependent variable and use the relative external finance weighted
average of historical profits as the main explanatory variable. We also introduce, as
control variables, the Rajan and Zingales (1995) one lag leverage determinants, market-
to-book ratio, tangibility, profitability and natural logarithm of firm size. Variable
definitions are provided in Table 1. Inclusion of one lag profit controls for the effect of
current profitability, such that 𝑃𝑟𝑜𝑓𝑟𝑒𝑓𝑤𝑎,𝑖 𝑡−1 could reflect the long-term effect of
historical profits more precisely. Furthermore, our design includes firm fixed effects to
distinguish whether the relation between the weighted average historical profits,
𝑃𝑟𝑜𝑓𝑟𝑒𝑓𝑤𝑎,𝑖 𝑡−1, is due to an unidentified firm characteristic or a path-dependent property.
The regression model can be summarized as follows:
𝐿𝑒𝑣𝑒𝑟𝑎𝑔𝑒𝑖𝑡 = 𝑎 + 𝑏𝑃𝑟𝑜𝑓𝑟𝑒𝑓𝑤𝑎,𝑖𝑡−1 + 𝑐𝑋𝑖𝑡−1 + 𝜀𝑖𝑡 (2)
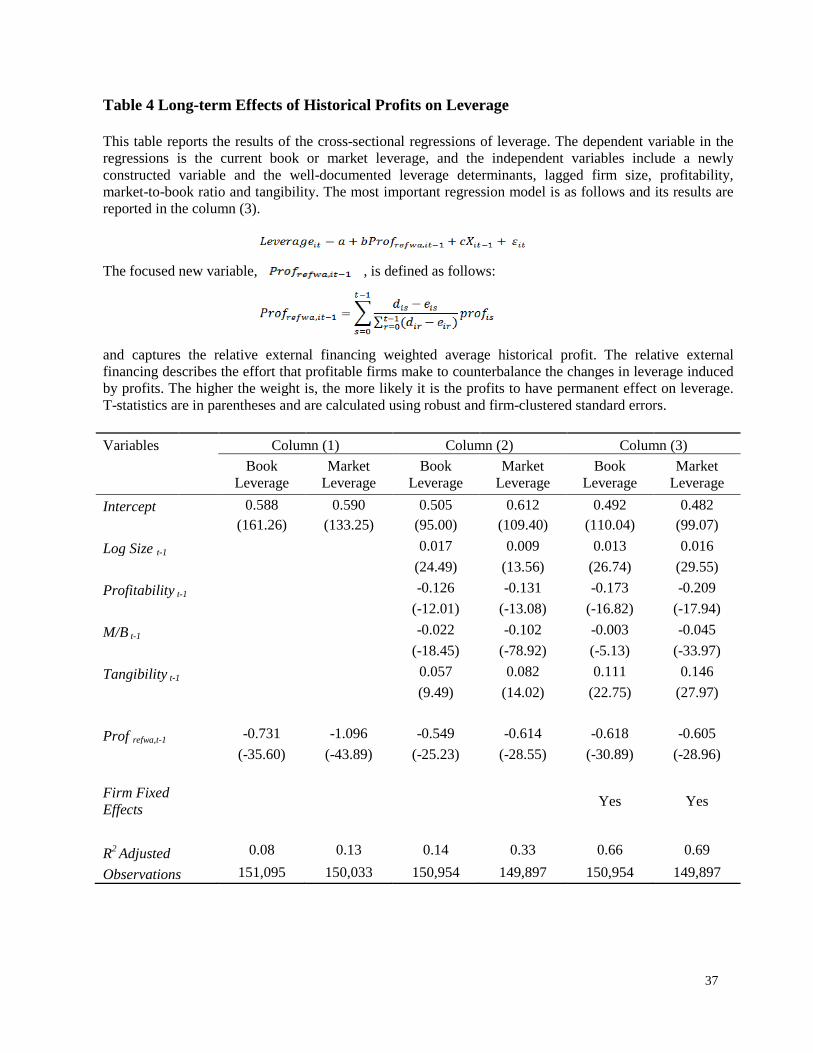
Table IV reports the Fama-MacBeth regressions of book leverage and market
leverage on the main explanatory variable, weighted average historical profitability,
𝑃𝑟𝑜𝑓𝑟𝑒𝑓𝑤𝑎,𝑖 𝑡−1 , and the control variables, lagged market-to-book ratio, tangibility,
profitability and natural logarithm of firm size. Column (1) reports the results of the
univariate regression with the 𝑃𝑟𝑜𝑓𝑟𝑒𝑓𝑤𝑎,𝑖 𝑡−1 as the only regressor; the model in column
18
(2) includes four control variables; and that in column (3) includes both the control
variables and firm fixed effects. The calculated t-statistics are based on robust and firm-
clustered standard errors. The results show that the weighted average historical
profitability, 𝑃𝑟𝑜𝑓𝑟𝑒𝑓𝑤𝑎,𝑖 𝑡−1, is significantly and negatively related to leverage, measured
by either book or market debt to assets ratio. The relationship is statistically significant at
the one percent level, no matter whether the regression model includes additional control
variables and firm fixed effects. Overall market based leverage regressions yield a better
fit. The weighted average profitability variable alone explains 13% in the variation of
market debt to total assets ratio.
[Insert Table 4]
The weighted average historical profit, 𝑃𝑟𝑜𝑓𝑟𝑒𝑓𝑤𝑎,𝑖 𝑡−1 is not only statistically
significant, but also economically important. In the model of column (2), a one standard
deviation increase in weighted average historical profit is associated with 4.36 percentage
points decrease in book leverage ratio (from 46.22 percent, the mean book leverage, to
41.86 percent) and 4.88 percentage points decrease in market leverage ratio (from 31.05,
the mean market leverage, to 26.17 percent) . The weighted average historical profit is
the most economically important determinant for book leverage and the second-most
important one for market leverage after the current market-to-book ratio
Table IV demonstrates that the relationship between weighted average historical
profitability and current leverage is statistically significant and economically important,
and that the strong negative relationship is probably not due to unobservable,
idiosyncratic firm-specific factors since this relationship remains significant after
19
controlling for firm fixed effects. To flesh out the conclusion of the long-term effect of
historical profitability on leverage, we conduct a persistence study in the next section,
following the methodology in Baker and Wurgler (2002).
C. Persistence Study on the Long-term Profitability Effects
We examine the persistence of long-term profitability effect on leverage by
conducting the following Fama MacBeth leverage regression:
𝐿𝑒𝑣𝑒𝑟𝑎𝑔𝑒𝑖𝑡+𝜏 = 𝑎1 + 𝑏1𝑃𝑟𝑜𝑓𝑟𝑒𝑓𝑤𝑎,𝑖𝑡−1 + 𝑐1(𝑚𝑏
)𝑒𝑓𝑤𝑎,𝑖𝑡−1 + 𝑑1𝐿𝑜𝑔(𝑠𝑖𝑧𝑒)𝑖𝑡−1 +
𝑒1𝑃𝑟𝑜𝑓𝑖𝑡−1 + 𝑓1𝑇𝑎𝑛𝑔𝑖𝑖𝑡−1 + 𝑔1(𝑚𝑏
)𝑖𝑡−1 + 𝜀𝑖𝑡+𝜏 (3)
𝐿𝑒𝑣𝑒𝑟𝑎𝑔𝑒𝑖𝑡+𝜏 =
𝑎2 + 𝑏2𝑃𝑟𝑜𝑓𝑟𝑒𝑓𝑤𝑎,𝑖𝑡−1 + 𝑐2(𝑚𝑏
)𝑒𝑓𝑤𝑎,𝑖𝑡+𝜏−1 + 𝑑2𝐿𝑜𝑔(𝑠𝑖𝑧𝑒)𝑖𝑡+𝜏−1 + 𝑒2𝑃𝑟𝑜𝑓𝑖𝑡+𝑡−1 +
𝑓2𝑇𝑎𝑛𝑔𝑖𝑖𝑡+𝜏−1 + 𝑔2(𝑚𝑏
)𝑖𝑡+𝜏−1 + 𝜀𝑖𝑡+𝜏 (4)
Equation (3) studies the effect of weighted average historical profits until current
time, 𝑃𝑟𝑜𝑓𝑟𝑒𝑓𝑤𝑎,𝑖𝑡−1 , on the future leverage, 𝐿𝑒𝑣𝑒𝑟𝑎𝑔𝑒𝑖𝑡+𝜏 , (see Rajan and Zingales
(1995)) and weighted average historical market-to-book ratio (Baker and Wurgler (2002));
while equation (4) studies the relation between 𝑃𝑟𝑜𝑓𝑟𝑒𝑓𝑤𝑎,𝑖𝑡−1 and future leverage,
𝐿𝑒𝑣𝑒𝑟𝑎𝑔𝑒𝑖𝑡+𝜏 , when controlling for future control variables. The methodology is
borrowed from Baker and Wurgler (2002). Table 5 reports the results. For brevity, we
only report the coefficients of current profits and weighted average historical profits, 𝑏
and 𝑒, which are the focus of this paper. The t-statistics are reported in the parentheses,
and are based on robust standard error clustered in firms.

20
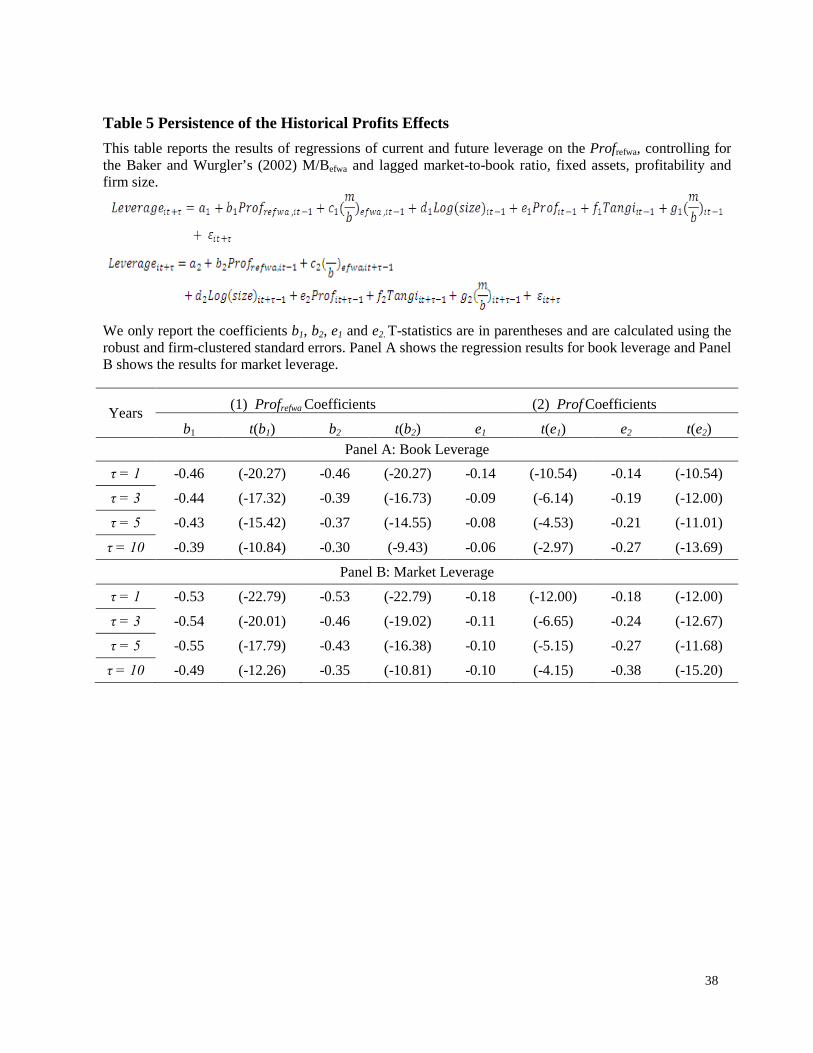
Column (1) in Table 5 reports the effect of weighted average historical profits
over the firm history on future leverage, from the year the firm first appears in the
COMPUSTAT dataset until current time. The results show that the coefficients of the
weighted average historical profits in the above two regression models remain
statistically significant for different 𝜏, from 1 to 10 years, when controlling for Rajan and
Zingales (1995) determinants at current time or in the future up to 10 years later. In
addition, the magnitude of the coefficients of the weighted average historical profitability
declines when 𝜏 increases, but at a very slow pace. For example, the coefficient of
𝑃𝑟𝑜𝑓𝑟𝑒𝑓𝑤𝑎,𝑖𝑡−1 in the regression of equation (3) with 𝜏 = 1 is -0.46 for book leverage and
-0.53 for market leverage, and the coefficient of 𝑃𝑟𝑜𝑓𝑟𝑒𝑓𝑤𝑎,𝑖𝑡−1 in the regression with
𝜏 = 10 declines to -0.39 for book leverage and -0.49 for market leverage, accounting for
85 percent and 92 percent, respectively, of the coefficient size in the regression when
𝜏 = 1. Column (2) in Table 5 reports the effect of current profits, and one-year lagged
profit on future leverage. The results show that current profits still have statistically
significant effect on future leverage in 10 years. However, the magnitude of the
coefficients of current profit declines rapidly as 𝜏 increases. For example, the coefficient
of 𝑃𝑟𝑜𝑓𝑖𝑡−1 for 𝜏 = 1 is -0.14 for book leverage and -0.18 for market leverage, and the
coefficient of 𝑃𝑟𝑜𝑓𝑖𝑡−1 for 𝜏 = 10 declines to -0.06 for book leverage and -0.10 for
market leverage.
[Insert Table 5]
The results in Table 5 reinforce the findings that the long-term effect of historical
profits is very persistent. The persistence is due to the accumulation of the effect of the
21
profits in every period of the firm history. Although the effect of past profitability on
future leverage in a specific year declines rapidly as time passes, the accumulated effect
of weighted average historical profitability on future leverage remains very stable. This
leads us to conclude that to a large extent, the current leverage of a firm is the cumulative
outcome of its past operating results. Overall, the weighted average historical
profitability over the entire firm history is an important determinant of leverage. In the
next section, we compare the explanatory power of the weighted average profitability,
with that of previously identified one period lagged leverage determinants.
IV. Long-term Determinants vs. One-period Lagged Determinants
Studies on long-term evolution of capital structure in Lemmon, Roberts and
Zender (2008) find that the capital structure of firms is path-dependent, calling for
determinants, which can capture the specific historical experiences of firms. Baker and
Wurgler (2002) define a long-term determinant, the external financing weighted average
of historical market-to-book ratio, (𝑚𝑏
)𝑒𝑓𝑤𝑎,𝑖𝑡−1 . They find a strong negative relation
between historical market values and firm leverage, and their findings are confirmed in
later papers (Hovakimian (2006), and Kayhan and Titman (2007)). While the variable of
(𝑚𝑏
)𝑒𝑓𝑤𝑎,𝑖𝑡−1 , the weighted average past market-to-book ratios, captures the historical
experience of firms in the equity market, the weighted average past profit, 𝑃𝑟𝑜𝑓𝑟𝑒𝑓𝑤𝑎,𝑖 𝑡−1,
used in this paper, captures the historical experience of firms in product markets. We can
expect the two long-term determinants, 𝑃𝑟𝑜𝑓𝑟𝑒𝑓𝑤𝑎,𝑖𝑡−1 and(𝑚𝑏
)𝑒𝑓𝑤𝑎,𝑖𝑡−1, to have stronger
explanatory power in capital structure than the one-period-lagged determinants. We
investigate this hypothesis in this section.
22
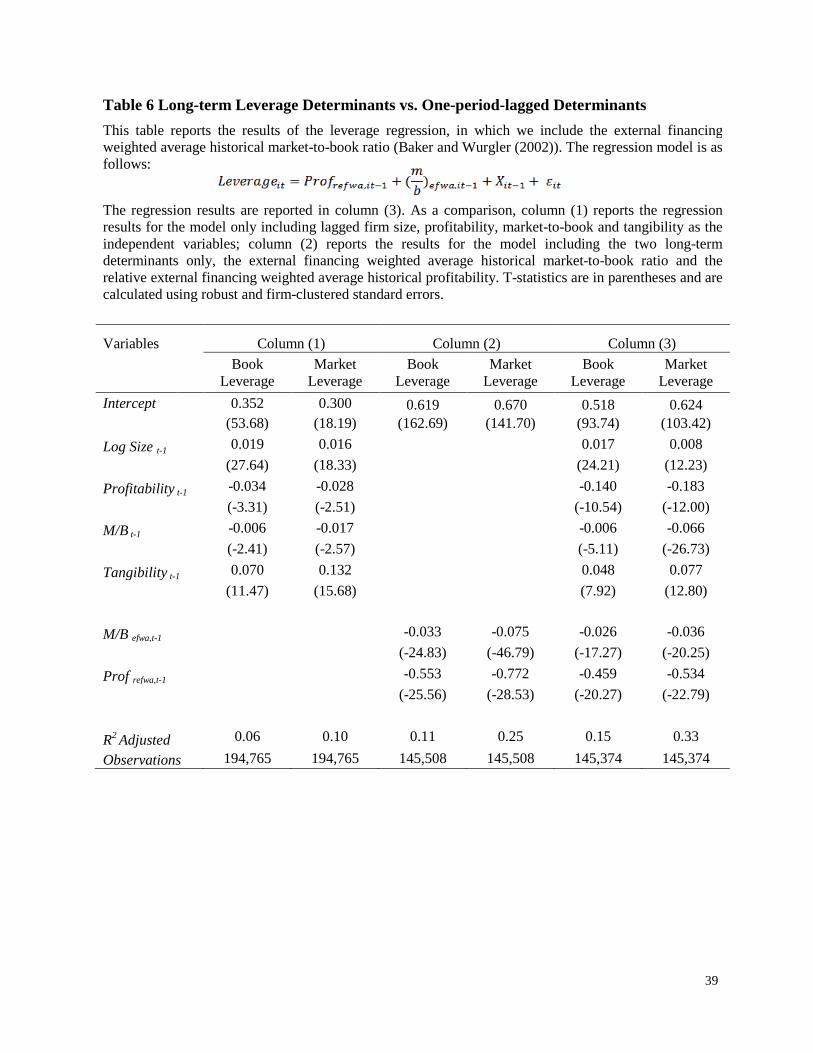
First, we conduct the traditional leverage regression on the Rajan and Zingales
(1995) lagged determinants as a benchmark. The results are reported in column (1) of
Table 6. Consistent with literature, the lagged profitability and market-to-book ratio have
statistically significant negative effect on book and market leverage, and the lagged firm
size and asset tangibility have significant positive effect on leverage. The adjusted 𝑅2 are
0.06 for book leverage and 0.10 for market leverage. The adjusted 𝑅2 statistics are
somewhat different from those reported in previous studies, possibly because we use a
sample with a longer time span. Note that in column (1) of Table 4, we show that the
adjusted 𝑅2 of the univariate regression on the weighted average historical profits,
𝑃𝑟𝑜𝑓𝑟𝑒𝑓𝑤𝑎,𝑖𝑡−1 , is 0.08 for book leverage and 0.13 for market leverage. Clearly, the
weighted average historical profitability, the long term determinant proposed in this study
does a better job to describe the cross-sectional variation in leverage than the combined
effect of the other four determinants. This result suggests that weighted average historical
profitability, 𝑃𝑟𝑜𝑓𝑟𝑒𝑓𝑤𝑎,𝑖𝑡−1 , captures important aspects of a firm’s historical leverage
ratio.
[Insert Table 6]
Second, we conduct the leverage regression on the two long term determinants,
𝑃𝑟𝑜𝑓𝑟𝑒𝑓𝑤𝑎,𝑖𝑡−1 and (𝑚𝑏
)𝑒𝑓𝑤𝑎,𝑖𝑡−1 . The results are reported in column (2) of Table 6.
Consistent with our expectation, both long term determinants have statistically significant
negative effect on book or market leverage. The adjusted 𝑅2 is 0.11 for the book leverage
and 0.25 for the market leverage, double the corresponding number in the regression
including the lagged determinants only. Further, adding (𝑚𝑏
)𝑒𝑓𝑤𝑎,𝑖𝑡−1 in the regression
23
with 𝑃𝑟𝑜𝑓𝑟𝑒𝑓𝑤𝑎,𝑖𝑡−1 improves the model’s explanatory power. Adjusted 𝑅2 increases
from 0.08 to 0.11 for the book leverage regression and from 0.13 to 0.25 for the market
leverage regression. Including 𝑃𝑟𝑜𝑓𝑟𝑒𝑓𝑤𝑎,𝑖𝑡−1 in the regression on (𝑚𝑏
)𝑒𝑓𝑤𝑎,𝑖𝑡−1 also
improves the explanatory power of the model. In an unreported study, the adjusted 𝑅2
increases from 0.07 to 0.13 for the book leverage model and from 0.19 to 0.25 for the
market leverage model. This result shows that each of the two long term determinants
provides significant information on the current leverage of the firm under different
perspectives.
Finally, we include in the leverage regression all the above long term
determinants and lagged determinants. The purpose of such an experiment is to study the
extent to which the two long term determinants provide the same information as the one-
period-lagged determinants. If the long term determinants contain some of the
information of the one-period lagged determinants, the adjusted 𝑅2 for the model
including both long-term and one-lag determinants will be less than the sum of the
adjusted 𝑅2 for the model including long-term determinants only and the model including
one-lag determinants only. The larger the overlap in information is, the larger the loss of
the adjusted 𝑅2 will be. We report the regression results in column (3) of Table 6.
The results show that both long-term determinants, 𝑃𝑟𝑜𝑓𝑟𝑒𝑓𝑤𝑎,𝑖𝑡−1 and
(𝑚𝑏
)𝑒𝑓𝑤𝑎,𝑖𝑡−1 , remain significant after controlling for the four additional leverage
determinants. More importantly, the adjusted 𝑅2for the model including both long-term
and one-period-lagged determinants is 0.15 for book leverage and 0.33 for market
leverage, almost equal to the sum of the adjusted 𝑅2 for the model including long-term
24
determinants only and for the model including one-lag determinants only. This result
shows that the long-term leverage determinants are almost orthogonal to the one-lag
determinants, indicating that the long-term determinants provide new information that the
one-lag determinants do not contain.
By design, the weighted average historical profits, as well as the weighted
average market-to-book ratio (Baker and Wurgler (2002)) remain stable in the long term,
and evolve slowly. The above properties of long term determinants fit observations of
Lemmon, Roberts and Zender (2008) on the evolution of capital structure. Such fit can
explain the high explanatory power of the long-term determinants on firm capital
structure. More significantly, the long-term leverage determinants, in a large part,
supplement the orthogonal information to the one-period-lagged leverage determinants.
V. Robustness Checks
In the previous sections we show that the weighted average historical profitability
over the entire firm history is strongly and negatively associated with the current firm
leverage level, and that the negative relation remains significant after controlling for
other leverage determinants, including the weighted average historical market-to-book
ratio, the long-term leverage determinant used Baker and Wurgler (2002). We also show
that including firm fixed effects in the leverage regression models does not change our
results. In this section, we investigate the robustness of the strong relation between
leverage and the weighted average historical profitability.
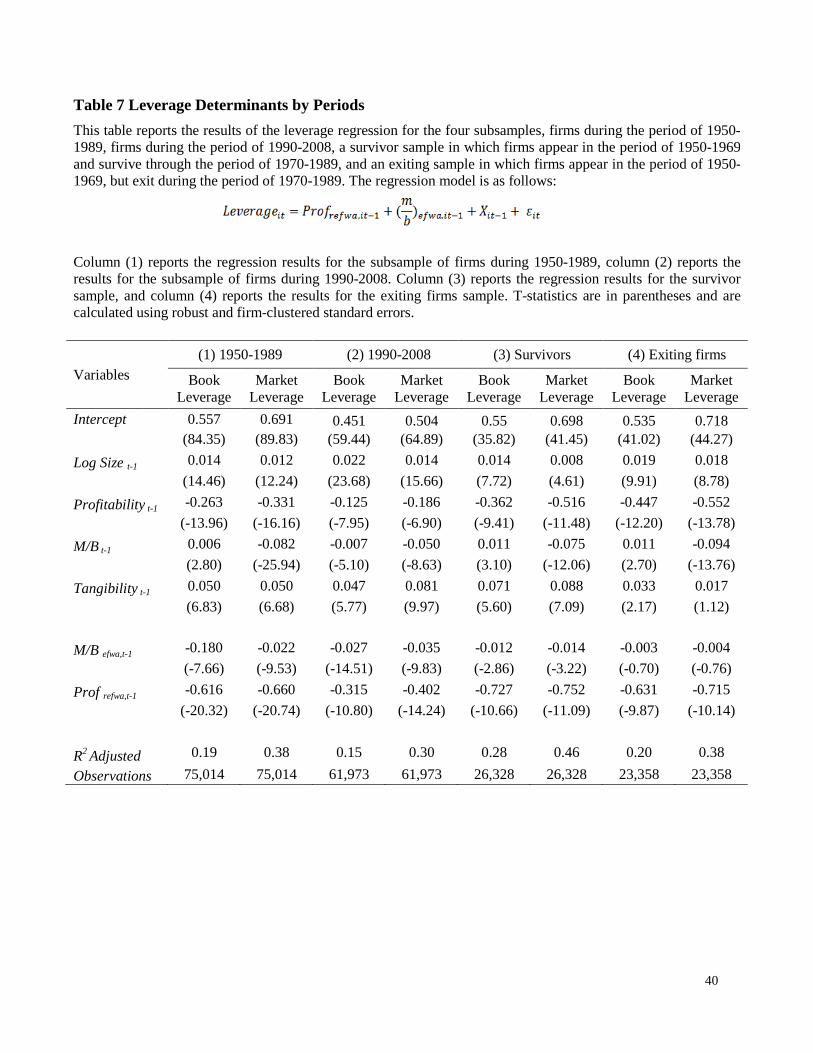
First, we examine whether our findings hold over different periods of time, since
Frank and Goyal (2009) report that the impact of profitability on leverage declined after
25
1980s. We divide our sample into two subsamples: firms during the period of 1950-1989
and firms during the period of 1990-2008. Next, for each subsample, we conduct the
leverage regression including the weighted average historical profitability, the long-term
determinant of Baker and Wurgler (2002) and other leverage determinants as independent
variables. The results are reported in the column (1) and (2) of the Table 7. For both
subsamples, the coefficients of weighted average historical profitability are negative and
statistically significant. However, the magnitude of the coefficient of the weighted
average historical profits declines after 1980s, consistent with the observation of Frank
and Goyal (2009).
[Insert Table 7]
Second, we check the robustness of the findings in this paper for survivor bias.
The observed long-term effect of historical profitability on capital structure maybe a
result of a survivorship bias, since it is reasonable to assume that the firms that survive
during the sample period will accumulate more profits than the firms that exit the sample
during the period studied. To investigate the importance of survivorship bias, we form
two subsamples, the survivor sample in which firms survive through 1970 to 1989 and
the exitor sample in which firms exit the COMPUSTATs between 1970 and 1989. We
conduct the leverage regression on these two subsamples. The results are reported in
columns (3) and (4) in Table 7.
The regression results show that the effect of the weighted average historical
profits, 𝑃𝑟𝑜𝑓𝑟𝑒𝑓𝑤𝑎,𝑖𝑡−1 remain statistically significant for both sub-samples, surviving and
exiting firms, and the magnitude of the coefficient of 𝑃𝑟𝑜𝑓𝑟𝑒𝑓𝑤𝑎,𝑖𝑡−1 remains stable. The
26
results suggest that survivorship bias does not play an important role in the long-term
effect of historical profitability.
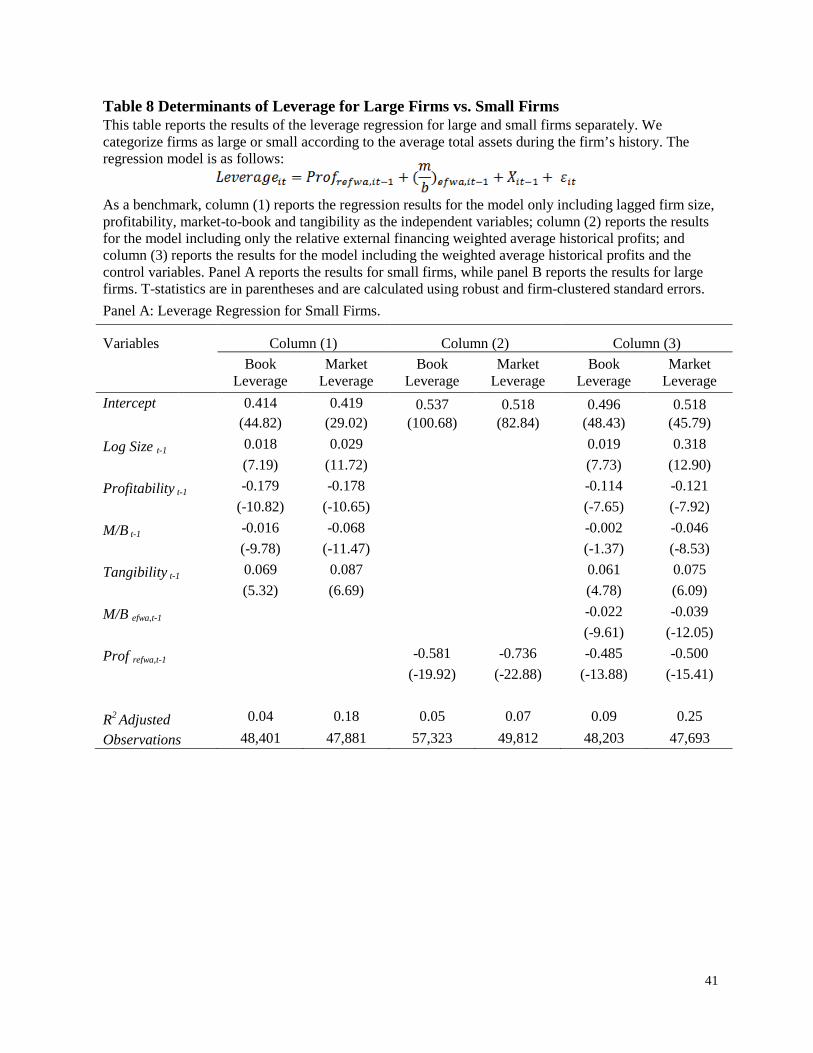
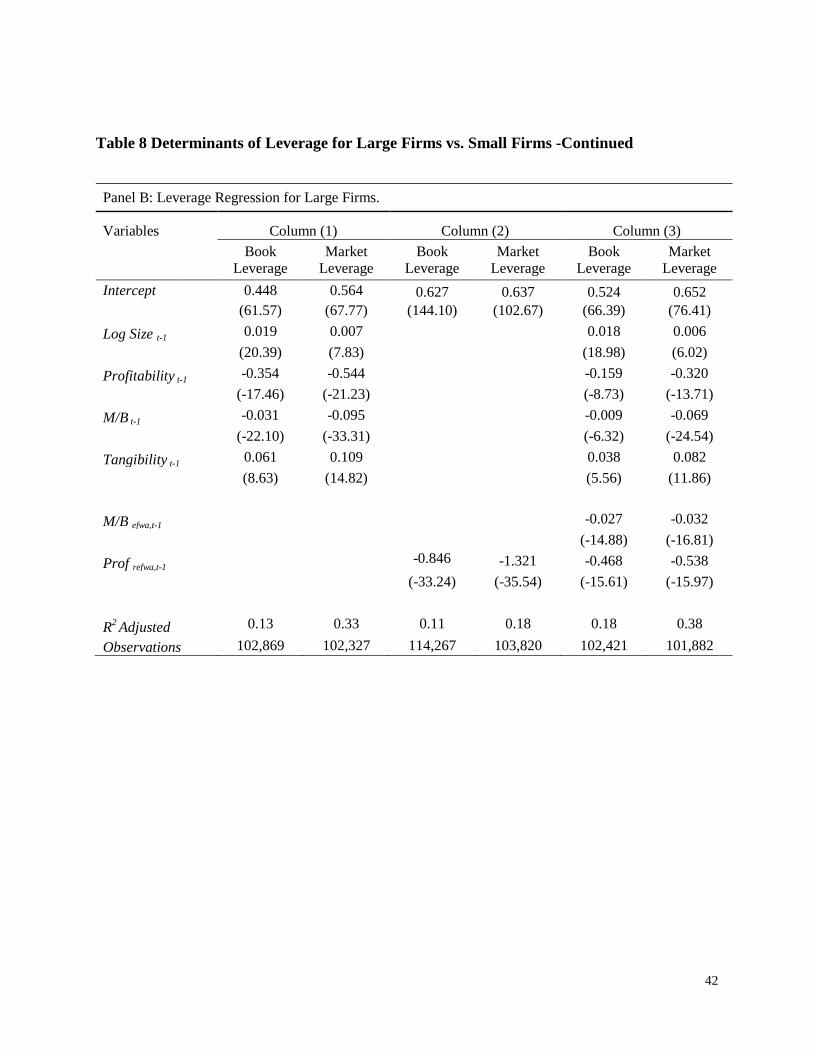
We further examine whether the effects observed differ for small vs. large firms.
Since larger firms tend to be more mature and diversified, they face lower distress costs.
Hence, trade-off theory predicts a positive relationship between firm size and leverage.
Similarly, agency theory predicts larger benefits of higher debt for larger mature firms.
The pecking order theory generally predicts the opposite relation as larger firms tend to
be more transparent, face lower asymmetric information costs, and therefore will be more
likely to issue equity than smaller firms. Panel A of Table 8 reports the results for small
firms, while Panel B of Table 8, reports the regression statistics for large firms. The
coefficient on the variable of interest, the weighted average profitability is the same for
small and large firms, which implies that the influence of firm historic profitability is the
same for small vs. large firms. However, based on the coefficient of the lagged
profitability variable, we observed that the negative relation between lagged profitability
and leverage is much more pronounced for larger firms than smaller firms in the short run,
which implies that in the short run larger firms tend to retain profits more than smaller
firms. This is likely related to small firms being higher growth firm and having larger
external financing needs.
[Insert Table 8]
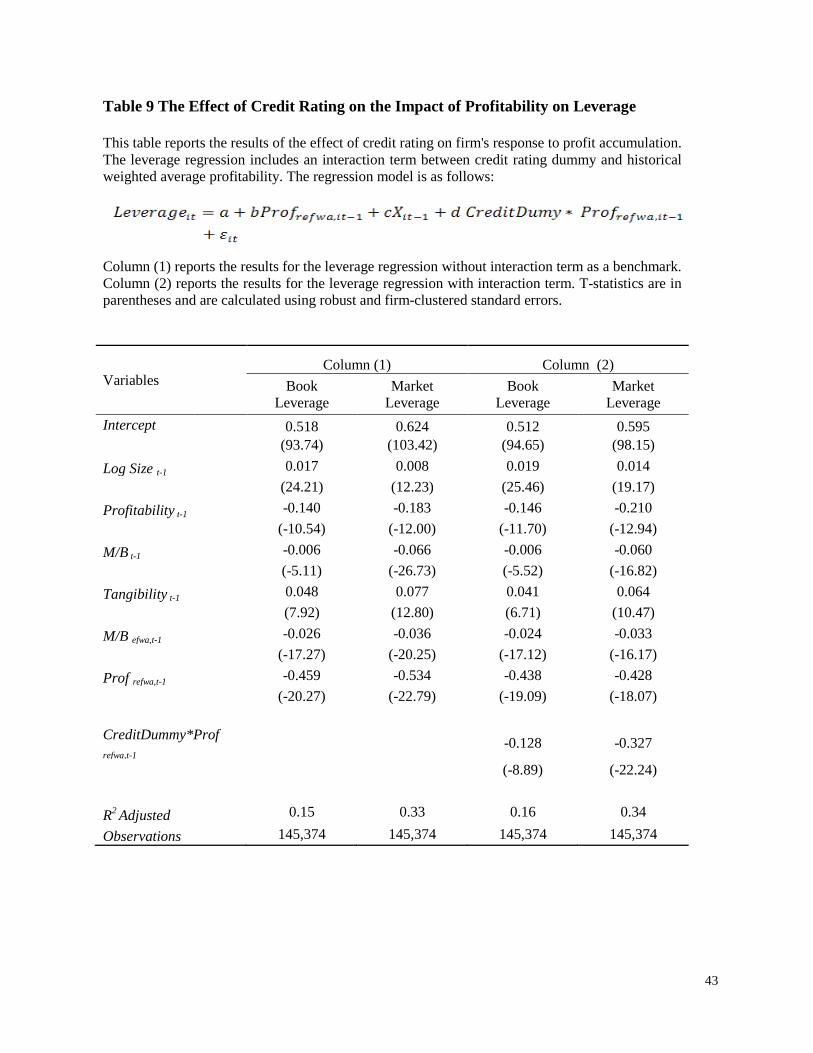
Credit ratings have a significant impact on the financing policy decision (Flannery
(1986), Kale and Noe (1990), Graham and Harvey (2001) and Kisgen (2006)). Graham
and Harvey (2001) report in their study that credit rating is the second most important
27
debt policy factor after financial flexibility. Many firms issue short-term debt when they
expect they credit ratings to improve in the future (Ibid.). We explore whether
profitability affects leverage differently for firms with credit ratings vs. firms without
credit ratings. Our results are presented in Table 9. The interaction term between credit
rating dummy and historical weighted average profitability is negative and significant
indicating that the negative relationship between leverage and profitability is statistically
and economically larger for firms with credit ratings. If firms with credit ratings have
easier access to the external capital markets and lower cost of debt, we will expect that
the effect of profitability will be diminished for such firm, which suggests a positive
coefficient on the interaction variable. However, firms with credit ratings tend to also be
more transparent, due to increased attention by analysts and hence may face lower
adverse selection and asymmetric information and can issue equity at a lower cost. Based
on the observed negative coefficient the second effect seems to be dominating the first
one.
[Insert Table 9]
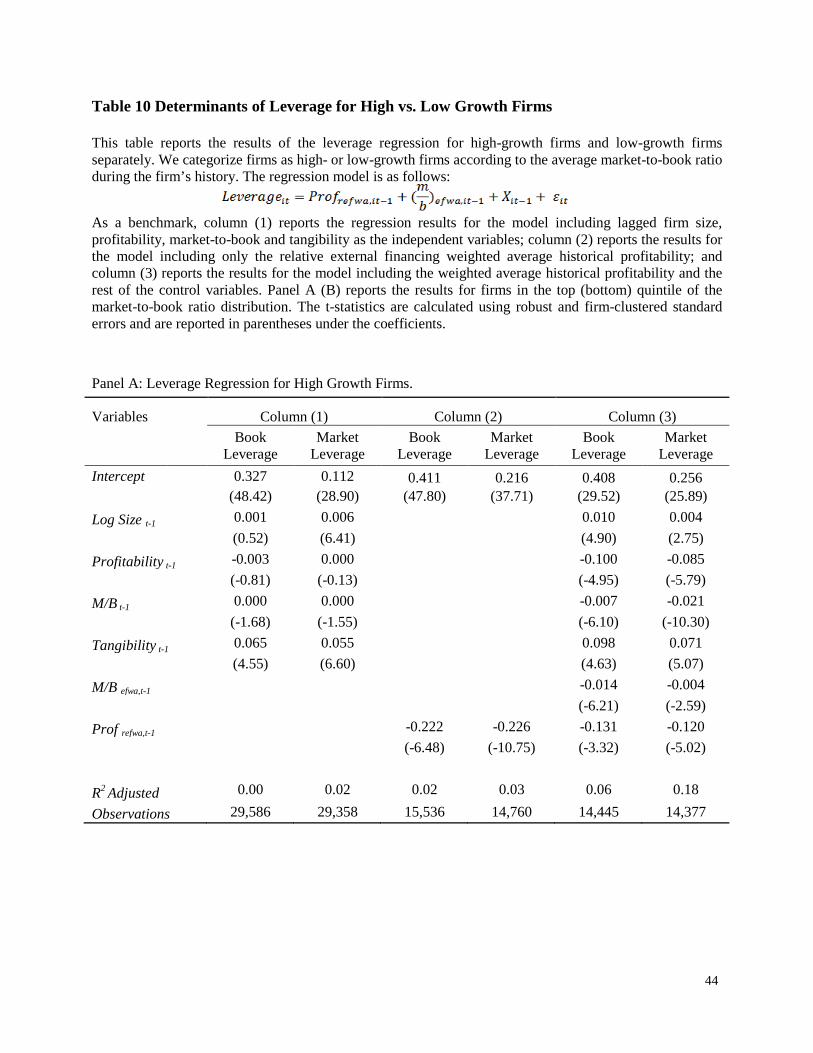
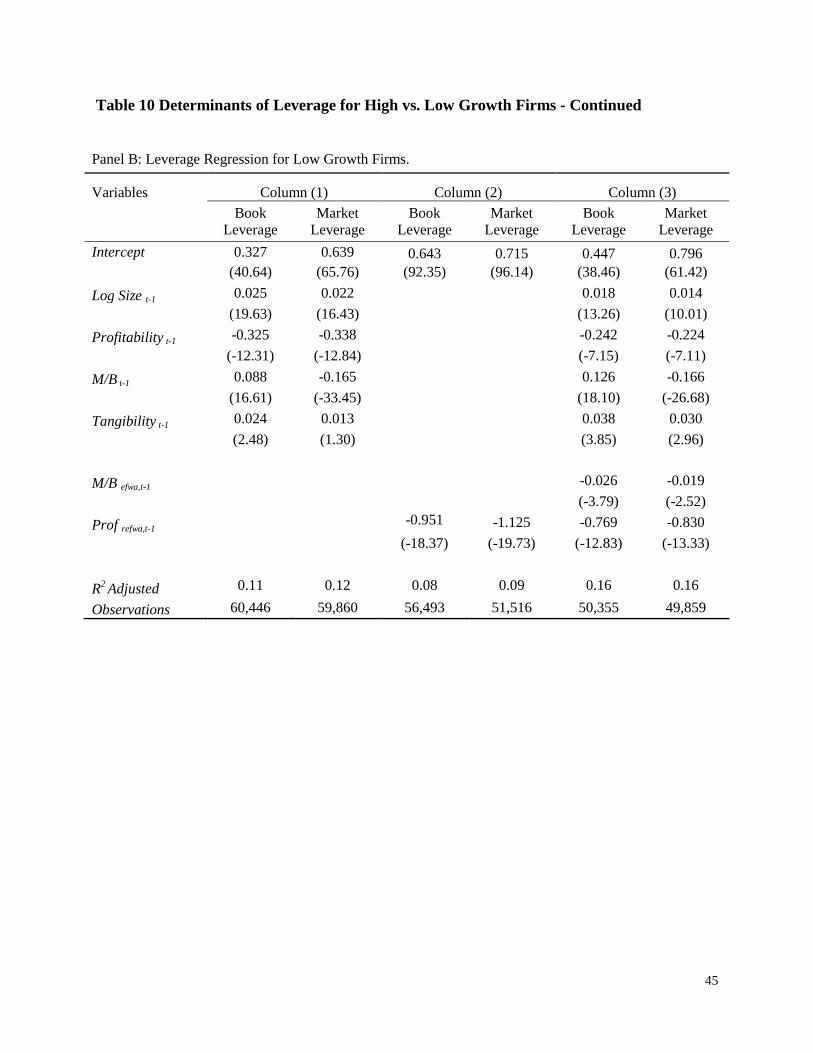
Next we examine whether the observed relationship between weighted average
profitability and leverage differs for high vs. low growth firms. We categorize firms as
high or low growth according to the average market-to-book ratio during the firm history.
The high-growth (low) firms’ subsample includes firms with an M/B ratio in the fifth
(first) quintile in the distribution of the average M/B ratio. Dynamic trade-off theory
suggests that firms with higher growth opportunities may retain funds, rather than
distributing them, which implies that a negative relation between profitability and
leverage may be observed for firms with high growth opportunities. If this is the case,
28
then we should observe a large negative relationship between the profitability variables
and leverage for the high growth firms. Our results exhibited in Table 10 do not support
this expectation. The coefficients on the weighted average profitability as well as lagged
profitability are smaller in the leverage regression for high growth firms. This means that
dynamic trade-off theory cannot explain the negative relationship between historical
weighted average returns and leverage.
[Insert Table 10]
Finally, we also investigate whether weighted average profitability impacts
differently leverage during different market conditions. Market timing theory posits that
managers issue equity when the market is overvalued and debt when the market is
undervalued. Barker and Wurgler (2002), using as a proxy for market valuation the
historical weighted M/B ratio, present evidence that the effect of market timing is long
lasting. Furthermore, Welch (2004) argues that stock price effects on leverage are large
and last for at least several years. These studies have been recently challenged by two
steams of literature. First, several authors have shown that the long-term effects of M/B
ratio and stock returns on leverage are not inconsistent with dynamic trade-off theory
(Hennessy and Whited (2005) and Strebulaev (2007). In addition, another stream of
literature (Alti (2006) and Hovakimian (2006)) presents evidence that the effect of market
timing on capital structure is not long lasting. We analyze the relationship between
weighted average historical profitability and leverage for hot and cold issues markets.
Hot issue market is defined as a market when the number of IPOs is larger than the
average over the period examines, whereas, cold market, is defined as one where the
number of IPO offerings is smaller than the mean for the total period. We obtain data on
29
the number and volume of IPOs by years from Prof. Jay Ritter’s site. IPO issues data is
only available starting in 1980. Our analysis is displayed in Table 11. The coefficient on
the variable of interest, 𝑃𝑟𝑜𝑓𝑟𝑒𝑓𝑤𝑎,𝑖𝑡−1, is the same in both subsamples, which shows that
market timing does not have an effect on the relationship between weighted average
profitability and leverage.
[Insert Table 11]
VI. Discussion
The above sections show that the negative relation between firm leverage and the
weighted average historical profitability over the entire firm’s history is strong and robust,
indicating that the changes in capital structure due to operating results can accumulate in
long term. Why do firms passively accept the accumulation of the changes in capital
structure? The findings in this paper raise a new challenge for trade-off theories of capital
structure. Holding other things constant, the increase of profitability will decrease the
leverage ratio, deviating from the optimal level, if the optimal leverage doesn’t change. In
fact, increasing of firm’s profits calls for larger tax shield and reduces the concern of
bankruptcy, and thus increases the level of optimal leverage, making the deviation more
severe. Trade-off theory predicts that firms will adjust their leverage ratio to counteract
the effect of higher profitability and that there is no long-term effect or there is a positive
effect of past higher profits on leverage level. Such prediction contradicts the findings in
this paper. In addition, trade-off theory with adjustment costs can accommodate the short-
term effect of historical profits on capital structure, but fails to explain the long-term
effect of historical profits.
30
Pecking order theory predicts that profitability decreases the leverage ratio since
the management prefers internal capital accumulation. The findings in this paper provide
evidence supporting the notion that firms prefer internal capitals to external financing
even in a very long term. However, whether firms prefer debt to equity in the long term
needs more careful consideration, since the preference of debt to equity has been recently
challenged by a number of studies (Kayhan and Titman (2007), Huang and Ritter (2009),
and Chang and Dasgupta (2009)). Further investigation of this issue goes beyond the
main purpose of this paper.
VII. Conclusion
It is well documented that profitability has negative effect on firm capital
structure in short term. This paper studies the question of whether the changes in capital
structure due to operating profits can accumulate in the long run. We find that firms do
not take sufficient action to counter balance the changes in their capital structure due to
operating profits, and thus the current leverage is, to a large extent, the outcome of
accumulating past profits over the firm’s history.
Lemmon, Roberts and Zender (2008) report that the evolution of capital structure
over very long term is dominated by a stable long-term component with a secondary
transition component and that previously identified leverage determinants fail to capture
the above properties of capital structure. The weighted average historical profit variable
constructed in this paper has similar properties to the long term evolution of capital
structure and has superior explanatory power for cross sectional leverage level.
31
References
Alti A. How Persistent Is the Impact of Market Timing on Capital Structure?
Journal of Finance 2006; 61:1681–1710.
Baker M., Wurgler J. Market Timing and Capital Structure. Journal of Finance
2002; 57: 1– 32.
Chang X., Dasgupta S. Target Behavior and Financing: How Conclusive Is the
Evidence? Journal of Finance 2009; 64:1767–1796.
Fischer E.O., Heinkel R., Zechner J. Dynamic Capital Structure Choice: Theory
and Tests. Journal of Finance 1989; 44:19–40.
Flannery M.J. Asymmetric Information and Risky Debt Maturity Choice. Journal
of Finance 1986; 41:19–37.
Flannery M.J., Rangan K.P. Partial Adjustment toward Target Capital Structures.
Journal of Financial Economics 2006; 79:469–506.
Frank M.Z., Goyal V.K. Capital Structure Decisions: Which Factors are Reliably
Important? Financial Management 2009; 38:1–37.
Frank M.Z., Goyal V.K. Testing the Pecking Order Theory of Capital Structure.
Journal of Financial Economics 2003; 67:217–248.
Fama E.F., French K.R. Testing Trade-off and Pecking Order Predictions about
Dividends and Debt. Review of Financial Studies 2002; 15:1–33.
32
Graham J.R., Harvey C.R. The Theory and Practice of Corporate Finance:
Evidence from the Field. Journal of Financial Economics 2001; 60: 187–243.
Hennessy C.A., Whited T.A. Debt Dynamics. Journal of Finance 2005; 60:1129–
1165.
Hovakimian A. Are Observed Capital Structures Determined by Equity Market
Timing? Journal of Financial and Quantitative Analysis 2006; 41: 221–243.
Hovakimian A., Li G. In Search of Conclusive Evidence: How to Test for
Adjustment to Target Capital Structure. Journal of Corporate Finance 2011; 17: 33–44.
Hovakimian A., Li G. Is the Partial Adjustment Model a Useful Tool for Capital
Structure Research? Review of Finance 2010; 1–22.
Hovakimian A., Opler, T., Titman, S., The Debt-Equity Choice. Journal of
Financial and Quantitative Analysis 2001; 36:1–24.
Huang R., Ritter J.R. Testing Theories of Capital Structure and Estimating the
Speed of Adjustment. Journal of Financial and Quantitative Analysis 2009; 44:237–271.
Jalilvand A., Harris R.S. Corporate Behavior in Adjusting to Capital Structure and
Dividend Targets: An Econometric Study. Journal of Finance 1984; 39:127–145.
Kale J.R., Noe T.H. Risky Debt Maturity Choice in Sequential Game Equilibrium.
Journal of Financial Research 1990; 13:155–165.
Kayhan A., Titman S. Firms’ Histories and Their Capital Structure, Journal of
Financial Economics 2007; 83:1–32.
33
Kisgen D.J. Credit Ratings and Capital Structure. Journal of Finance 2006;
61:1035–1072.
Leary M.T., Roberts M.R. Do Firms Rebalance Their Capital Structures? The
Journal of Finance 2005; 60:2575 – 2619.
Lemmon M.L., Roberts M.R., Zender J.F. Back to the Beginning: Persistence and
the Cross-Section of Corporate Capital Structure. The Journal of Finance 2008; 63:1575–
1607.
Mackay P., Phillips G. How Does Industry Affect Firm Financial Structure?
Review of Financial Studies 2005; 18:1433–1466.
Rajan R.G., Zingales L. What Do We Know about Capital Structure: Some
Evidence from International Data. Journal of Finance 1995; 50:1421–1460.
Shyam-Sunder L., Myers S.C. Testing Static Tradeoff against Pecking Order
Models of Capital Structure. Journal of Financial Economics 1999; 51:219–244.
Strebulaev I.A., Do Tests of Capital Structure Theory Mean What They Say?
Journal of Finance 2007; 62:1747–1787.
Titman S., Wessels R. The Determinants of Capital Structure Choice. Journal of
Finance 1988; 43:1–21.
Welch I. Capital Structure and Stock Returns. Journal of Political Economy 2004;
112:106–131.
34
Table 1 Variable Definitions
Book Equity Book equity is defined as total assets minus total liabilities, preferred stock, deferred taxes and convertible debt.
Book Debt Book debt is defined as total assets minus book equity.
Net Equity Issuance Net equity issuance is defined as the change in book equity minus the change in retained earnings.
Net Debt Issuance Net debt issuance is defined as the change in total assets minus the change in book equity.
Profit Profit is defined as Max (0, EBITDA).
Loss Loss is defined as Min (0, EBITDA).
Book Leverage Book leverage is defined as book debt divided by total assets.
Market Leverage Market leverage is defined as book debt divided by the sum of book debt and common shares outstanding multiplied by the firm’s closing price.
Profitability Profitability is defined as EBITDA / total assets.
Market-to-Book Ratio Market-to-book ratio is defined as (book debt + common shares outstanding * closing price) /total assets.
Tangibility Tangibility is defined as property, plant & equipment divided by total assets.
Size Size is defined as natural log of total assets.
35
Table 2 Descriptive Statistics Table II presents the descriptive statistics, based our sample, which consists of all COMPUSTAT firms appearing from 1950 to 2007. The initial data set has 396,192 firm year observations. Following the convention, we exclude the financial firms (SIC code 6000-6900) and those observations with missing values in total assets, EBITDA, common shares outstanding. Our final sample contains 207,101 firm-year observations. Dollar values are adjusted for inflation and are reported in 1950 dollars.
Variables
N Mean Std Distribution
10th Median 90th Debt ($ million) 207,101 139.48 925.61 0.39 7.65 224.31 Book Equity ($ million) 207,101 110.46 542.09 0.70 10.14 192.21 Total Assets ($ million) 207,101 249.94 1,350.09 1.42 19.52 420.00 EBITDA ($ million) 207,101 33.85 179.24 -0.29 2.19 57.14 Net Debt Issuance ($ million) 207,101 11.68 160.48 -2.50 0.21 19.17 Net Equity Issuance ($ million) 207,101 4.67 100.28 -0.59 0.12 8.93 Book Leverage 207,101 0.45 0.22 0.15 0.45 0.73 Market Leverage 207,101 0.38 0.25 0.07 0.36 0.73 Log Size
207,101 3.09 2.18 0.35 2.97 6.04
Profitability
207,101 0.07 0.51 -0.11 0.12 0.24 M/B
207,101 1.88 14.34 0.76 1.22 3.20
Tangibility 207,101 0.34 0.25 0.06 0.28 0.75
36
Table 3 The Effects on Leverage: Profit/Loss vs. External Financing
This table reports the effects on leverage on external financing activities, as a response to the leverage changes induced by profits/losses. EBITDA, Net Debts Issuance(d/A) and Net Equity Issuance(e/A) are as defined in Table 1. Net External Financing Effect ((d-e)/A) is defined as Net Debt Issuance less Net Equity Issuance, which describes the net effect of external financing activities on leverage, when firms issue debt and equity simultaneously. We calculate, in dollar amount, the average EBITDA, Net Equity Issuance, Net Debt Issuance and Net External Financing Effect across firm over the period, and then scale them by average Total Assets to get a percentage number.
Period Firms Total Assets ($Million) EBITDA (%) Net Debt
Issuance (d/A) Net Equity
Issuance (e/A)
Net External Financing
Effects((d-e)/A) Book Leverage Market Leverage
Mean Median Mean Median Mean Median Mean Median Mean Median Mean Median Mean Median
50-54 512 193.06 52.47 19% 18% 2% 1% 3% 0% -4% 0% 0.41 0.41 0.38 0.37
55-59 563 288.08 67.87 18% 17% 3% 1% 3% 0% 0% 0% 0.39 0.38 0.31 0.29
60-64 1786 199.18 32.80 16% 15% 2% 1% 1% 0% 1% 0% 0.42 0.41 0.33 0.32
65-69 2950 222.81 34.43 15% 15% 6% 3% 2% 1% 4% 1% 0.46 0.46 0.34 0.33
70-74 4239 277.59 38.78 15% 13% 6% 3% 2% 0% 4% 1% 0.47 0.48 0.47 0.48
75-79 5390 411.72 38.26 16% 14% 5% 2% 2% 0% 3% 1% 0.49 0.50 0.52 0.54
80-84 5604 671.88 45.45 15% 12% 3% 1% 2% 1% 2% 0% 0.48 0.48 0.42 0.42
85-89 6124 928.58 55.07 14% 10% 6% 1% 1% 0% 5% 0% 0.48 0.48 0.38 0.36
90-94 6458 1,284.30 71.41 12% 11% 4% 0% 1% 0% 2% 0% 0.47 0.48 0.36 0.34
95-99 8059 1,582.07 101.66 13% 10% 5% 1% 2% 1% 2% 0% 0.46 0.46 0.32 0.28
00-04 7017 2,762.46 169.31 12% 7% 4% 0% 3% 1% 1% 0% 0.44 0.43 0.33 0.28
05-08 5761 3,870.95 300.76 14% 9% 5% 1% 1% 1% 3% 0% 0.42 0.41 0.30 0.25
All 4539 1,057.72 84.02 15% 13% 4% 1% 2% 0% 2% 0% 0.45 0.45 0.37 0.36
37
Table 4 Long-term Effects of Historical Profits on Leverage
This table reports the results of the cross-sectional regressions of leverage. The dependent variable in the regressions is the current book or market leverage, and the independent variables include a newly constructed variable and the well-documented leverage determinants, lagged firm size, profitability, market-to-book ratio and tangibility. The most important regression model is as follows and its results are reported in the column (3).
The focused new variable, , is defined as follows:
and captures the relative external financing weighted average historical profit. The relative external financing describes the effort that profitable firms make to counterbalance the changes in leverage induced by profits. The higher the weight is, the more likely it is the profits to have permanent effect on leverage. T-statistics are in parentheses and are calculated using robust and firm-clustered standard errors.
Variables Column (1) Column (2) Column (3)
Book Leverage
Market Leverage
Book Leverage
Market Leverage
Book Leverage
Market Leverage
Intercept
0.588 0.590 0.505 0.612 0.492 0.482
(161.26) (133.25) (95.00) (109.40) (110.04) (99.07)
Log Size t-1 0.017 0.009 0.013 0.016
(24.49) (13.56) (26.74) (29.55)
Profitability t-1 -0.126 -0.131 -0.173 -0.209
(-12.01) (-13.08) (-16.82) (-17.94)
M/B t-1 -0.022 -0.102 -0.003 -0.045
(-18.45) (-78.92) (-5.13) (-33.97)
Tangibility t-1 0.057 0.082 0.111 0.146
(9.49) (14.02) (22.75) (27.97)
Prof refwa,t-1 -0.731 -1.096 -0.549 -0.614 -0.618 -0.605
(-35.60) (-43.89) (-25.23) (-28.55) (-30.89) (-28.96)
Firm Fixed Effects Yes Yes
R2 Adjusted 0.08 0.13 0.14 0.33 0.66 0.69
Observations 151,095 150,033 150,954 149,897 150,954 149,897
38
Table 5 Persistence of the Historical Profits Effects
This table reports the results of regressions of current and future leverage on the Profrefwa, controlling for the Baker and Wurgler’s (2002) M/Befwa and lagged market-to-book ratio, fixed assets, profitability and firm size.
We only report the coefficients b1, b2, e1 and e2. T-statistics are in parentheses and are calculated using the robust and firm-clustered standard errors. Panel A shows the regression results for book leverage and Panel B shows the results for market leverage.
Years (1) Profrefwa Coefficients (2) Prof Coefficients
b1 t(b1) b2 t(b2) e1 t(e1) e2 t(e2) Panel A: Book Leverage
τ = 1 -0.46 (-20.27) -0.46 (-20.27) -0.14 (-10.54) -0.14 (-10.54)
τ = 3 -0.44 (-17.32) -0.39 (-16.73) -0.09 (-6.14) -0.19 (-12.00)
τ = 5 -0.43 (-15.42) -0.37 (-14.55) -0.08 (-4.53) -0.21 (-11.01)
τ = 10 -0.39 (-10.84) -0.30 (-9.43) -0.06 (-2.97) -0.27 (-13.69)
Panel B: Market Leverage
τ = 1 -0.53 (-22.79) -0.53 (-22.79) -0.18 (-12.00) -0.18 (-12.00)
τ = 3 -0.54 (-20.01) -0.46 (-19.02) -0.11 (-6.65) -0.24 (-12.67)
τ = 5 -0.55 (-17.79) -0.43 (-16.38) -0.10 (-5.15) -0.27 (-11.68)
τ = 10 -0.49 (-12.26) -0.35 (-10.81) -0.10 (-4.15) -0.38 (-15.20)
39
Table 6 Long-term Leverage Determinants vs. One-period-lagged Determinants This table reports the results of the leverage regression, in which we include the external financing weighted average historical market-to-book ratio (Baker and Wurgler (2002)). The regression model is as follows:
The regression results are reported in column (3). As a comparison, column (1) reports the regression results for the model only including lagged firm size, profitability, market-to-book and tangibility as the independent variables; column (2) reports the results for the model including the two long-term determinants only, the external financing weighted average historical market-to-book ratio and the relative external financing weighted average historical profitability. T-statistics are in parentheses and are calculated using robust and firm-clustered standard errors.
Variables Column (1) Column (2) Column (3)
Book Leverage
Market Leverage
Book Leverage
Market Leverage
Book Leverage
Market Leverage
Intercept
0.352 0.300 0.619 0.670 0.518 0.624
(53.68) (18.19) (162.69) (141.70) (93.74) (103.42) Log Size t-1 0.019 0.016 0.017 0.008
(27.64) (18.33) (24.21) (12.23) Profitability t-1 -0.034 -0.028 -0.140 -0.183
(-3.31) (-2.51) (-10.54) (-12.00) M/B t-1 -0.006 -0.017 -0.006 -0.066
(-2.41) (-2.57) (-5.11) (-26.73) Tangibility t-1 0.070 0.132 0.048 0.077
(11.47) (15.68) (7.92) (12.80)
M/B efwa,t-1 -0.033 -0.075 -0.026 -0.036
(-24.83) (-46.79) (-17.27) (-20.25) Prof refwa,t-1 -0.553 -0.772 -0.459 -0.534
(-25.56) (-28.53) (-20.27) (-22.79)
R2 Adjusted 0.06 0.10 0.11 0.25 0.15 0.33 Observations 194,765 194,765 145,508 145,508 145,374 145,374
40
Table 7 Leverage Determinants by Periods This table reports the results of the leverage regression for the four subsamples, firms during the period of 1950-1989, firms during the period of 1990-2008, a survivor sample in which firms appear in the period of 1950-1969 and survive through the period of 1970-1989, and an exiting sample in which firms appear in the period of 1950-1969, but exit during the period of 1970-1989. The regression model is as follows:
Column (1) reports the regression results for the subsample of firms during 1950-1989, column (2) reports the results for the subsample of firms during 1990-2008. Column (3) reports the regression results for the survivor sample, and column (4) reports the results for the exiting firms sample. T-statistics are in parentheses and are calculated using robust and firm-clustered standard errors.
Variables (1) 1950-1989 (2) 1990-2008 (3) Survivors (4) Exiting firms
Book Leverage
Market Leverage
Book Leverage
Market Leverage
Book Leverage
Market Leverage
Book Leverage
Market Leverage
Intercept
0.557 0.691 0.451 0.504 0.55 0.698 0.535 0.718
(84.35) (89.83) (59.44) (64.89) (35.82) (41.45) (41.02) (44.27) Log Size t-1 0.014 0.012 0.022 0.014 0.014 0.008 0.019 0.018
(14.46) (12.24) (23.68) (15.66) (7.72) (4.61) (9.91) (8.78) Profitability t-1 -0.263 -0.331 -0.125 -0.186 -0.362 -0.516 -0.447 -0.552
(-13.96) (-16.16) (-7.95) (-6.90) (-9.41) (-11.48) (-12.20) (-13.78) M/B t-1 0.006 -0.082 -0.007 -0.050 0.011 -0.075 0.011 -0.094
(2.80) (-25.94) (-5.10) (-8.63) (3.10) (-12.06) (2.70) (-13.76) Tangibility t-1 0.050 0.050 0.047 0.081 0.071 0.088 0.033 0.017
(6.83) (6.68) (5.77) (9.97) (5.60) (7.09) (2.17) (1.12)
M/B efwa,t-1 -0.180 -0.022 -0.027 -0.035 -0.012 -0.014 -0.003 -0.004
(-7.66) (-9.53) (-14.51) (-9.83) (-2.86) (-3.22) (-0.70) (-0.76) Prof refwa,t-1 -0.616 -0.660 -0.315 -0.402 -0.727 -0.752 -0.631 -0.715
(-20.32) (-20.74) (-10.80) (-14.24) (-10.66) (-11.09) (-9.87) (-10.14)
R2 Adjusted 0.19 0.38 0.15 0.30 0.28 0.46 0.20 0.38 Observations 75,014 75,014 61,973 61,973 26,328 26,328 23,358 23,358
41
Table 8 Determinants of Leverage for Large Firms vs. Small Firms This table reports the results of the leverage regression for large and small firms separately. We categorize firms as large or small according to the average total assets during the firm’s history. The regression model is as follows:
As a benchmark, column (1) reports the regression results for the model only including lagged firm size, profitability, market-to-book and tangibility as the independent variables; column (2) reports the results for the model including only the relative external financing weighted average historical profits; and column (3) reports the results for the model including the weighted average historical profits and the control variables. Panel A reports the results for small firms, while panel B reports the results for large firms. T-statistics are in parentheses and are calculated using robust and firm-clustered standard errors. Panel A: Leverage Regression for Small Firms.
Variables Column (1) Column (2) Column (3)
Book Leverage
Market Leverage
Book Leverage
Market Leverage
Book Leverage
Market Leverage
Intercept
0.414 0.419 0.537 0.518 0.496 0.518
(44.82) (29.02) (100.68) (82.84) (48.43) (45.79) Log Size t-1 0.018 0.029 0.019 0.318
(7.19) (11.72) (7.73) (12.90) Profitability t-1 -0.179 -0.178 -0.114 -0.121
(-10.82) (-10.65) (-7.65) (-7.92) M/B t-1 -0.016 -0.068 -0.002 -0.046
(-9.78) (-11.47) (-1.37) (-8.53) Tangibility t-1 0.069 0.087 0.061 0.075
(5.32) (6.69) (4.78) (6.09) M/B efwa,t-1 -0.022 -0.039
(-9.61) (-12.05) Prof refwa,t-1 -0.581 -0.736 -0.485 -0.500
(-19.92) (-22.88) (-13.88) (-15.41)
R2 Adjusted 0.04 0.18 0.05 0.07 0.09 0.25 Observations 48,401 47,881 57,323 49,812 48,203 47,693
42
Table 8 Determinants of Leverage for Large Firms vs. Small Firms -Continued
Panel B: Leverage Regression for Large Firms.
Variables Column (1) Column (2) Column (3)
Book Leverage
Market Leverage
Book Leverage
Market Leverage
Book Leverage
Market Leverage
Intercept
0.448 0.564 0.627 0.637 0.524 0.652
(61.57) (67.77) (144.10) (102.67) (66.39) (76.41) Log Size t-1 0.019 0.007
0.018 0.006
(20.39) (7.83) (18.98) (6.02) Profitability t-1 -0.354 -0.544 -0.159 -0.320
(-17.46) (-21.23) (-8.73) (-13.71) M/B t-1 -0.031 -0.095 -0.009 -0.069
(-22.10) (-33.31) (-6.32) (-24.54) Tangibility t-1 0.061 0.109 0.038 0.082
(8.63) (14.82) (5.56) (11.86)
M/B efwa,t-1 -0.027 -0.032
(-14.88) (-16.81) Prof refwa,t-1
-0.846 -1.321 -0.468 -0.538
(-33.24) (-35.54) (-15.61) (-15.97)
R2 Adjusted 0.13 0.33 0.11 0.18 0.18 0.38 Observations 102,869 102,327 114,267 103,820 102,421 101,882
43
Table 9 The Effect of Credit Rating on the Impact of Profitability on Leverage This table reports the results of the effect of credit rating on firm's response to profit accumulation. The leverage regression includes an interaction term between credit rating dummy and historical weighted average profitability. The regression model is as follows:
Column (1) reports the results for the leverage regression without interaction term as a benchmark. Column (2) reports the results for the leverage regression with interaction term. T-statistics are in parentheses and are calculated using robust and firm-clustered standard errors.
Variables Column (1) Column (2)
Book Leverage
Market Leverage
Book Leverage
Market Leverage
Intercept
0.518 0.624 0.512 0.595
(93.74) (103.42) (94.65) (98.15) Log Size t-1 0.017 0.008 0.019 0.014
(24.21) (12.23) (25.46) (19.17) Profitability t-1 -0.140 -0.183 -0.146 -0.210
(-10.54) (-12.00) (-11.70) (-12.94) M/B t-1 -0.006 -0.066 -0.006 -0.060
(-5.11) (-26.73) (-5.52) (-16.82) Tangibility t-1 0.048 0.077 0.041 0.064
(7.92) (12.80) (6.71) (10.47) M/B efwa,t-1 -0.026 -0.036 -0.024 -0.033
(-17.27) (-20.25) (-17.12) (-16.17) Prof refwa,t-1 -0.459 -0.534 -0.438 -0.428
(-20.27) (-22.79) (-19.09) (-18.07)
CreditDummy*Prof refwa,t-1
-0.128 -0.327
(-8.89) (-22.24)
R2 Adjusted 0.15 0.33 0.16 0.34
Observations 145,374 145,374 145,374 145,374
44
Table 10 Determinants of Leverage for High vs. Low Growth Firms This table reports the results of the leverage regression for high-growth firms and low-growth firms separately. We categorize firms as high- or low-growth firms according to the average market-to-book ratio during the firm’s history. The regression model is as follows:
As a benchmark, column (1) reports the regression results for the model including lagged firm size, profitability, market-to-book and tangibility as the independent variables; column (2) reports the results for the model including only the relative external financing weighted average historical profitability; and column (3) reports the results for the model including the weighted average historical profitability and the rest of the control variables. Panel A (B) reports the results for firms in the top (bottom) quintile of the market-to-book ratio distribution. The t-statistics are calculated using robust and firm-clustered standard errors and are reported in parentheses under the coefficients.
Panel A: Leverage Regression for High Growth Firms.
Variables Column (1) Column (2) Column (3)
Book Leverage
Market Leverage
Book Leverage
Market Leverage
Book Leverage
Market Leverage
Intercept
0.327 0.112 0.411 0.216 0.408 0.256
(48.42) (28.90) (47.80) (37.71) (29.52) (25.89) Log Size t-1 0.001 0.006 0.010 0.004
(0.52) (6.41) (4.90) (2.75) Profitability t-1 -0.003 0.000 -0.100 -0.085
(-0.81) (-0.13) (-4.95) (-5.79) M/B t-1 0.000 0.000 -0.007 -0.021
(-1.68) (-1.55) (-6.10) (-10.30) Tangibility t-1 0.065 0.055 0.098 0.071
(4.55) (6.60) (4.63) (5.07) M/B efwa,t-1 -0.014 -0.004
(-6.21) (-2.59) Prof refwa,t-1 -0.222 -0.226 -0.131 -0.120
(-6.48) (-10.75) (-3.32) (-5.02)
R2 Adjusted 0.00 0.02 0.02 0.03 0.06 0.18
Observations 29,586 29,358 15,536 14,760 14,445 14,377
45
Table 10 Determinants of Leverage for High vs. Low Growth Firms - Continued
Panel B: Leverage Regression for Low Growth Firms.
Variables Column (1) Column (2) Column (3)
Book Leverage
Market Leverage
Book Leverage
Market Leverage
Book Leverage
Market Leverage
Intercept
0.327 0.639 0.643 0.715 0.447 0.796
(40.64) (65.76) (92.35) (96.14) (38.46) (61.42) Log Size t-1 0.025 0.022
0.018 0.014
(19.63) (16.43) (13.26) (10.01) Profitability t-1 -0.325 -0.338 -0.242 -0.224
(-12.31) (-12.84) (-7.15) (-7.11) M/B t-1 0.088 -0.165 0.126 -0.166
(16.61) (-33.45) (18.10) (-26.68) Tangibility t-1 0.024 0.013 0.038 0.030
(2.48) (1.30) (3.85) (2.96)
M/B efwa,t-1 -0.026 -0.019
(-3.79) (-2.52) Prof refwa,t-1
-0.951 -1.125 -0.769 -0.830
(-18.37) (-19.73) (-12.83) (-13.33)
R2 Adjusted 0.11 0.12 0.08 0.09 0.16 0.16
Observations 60,446 59,860 56,493 51,516 50,355 49,859
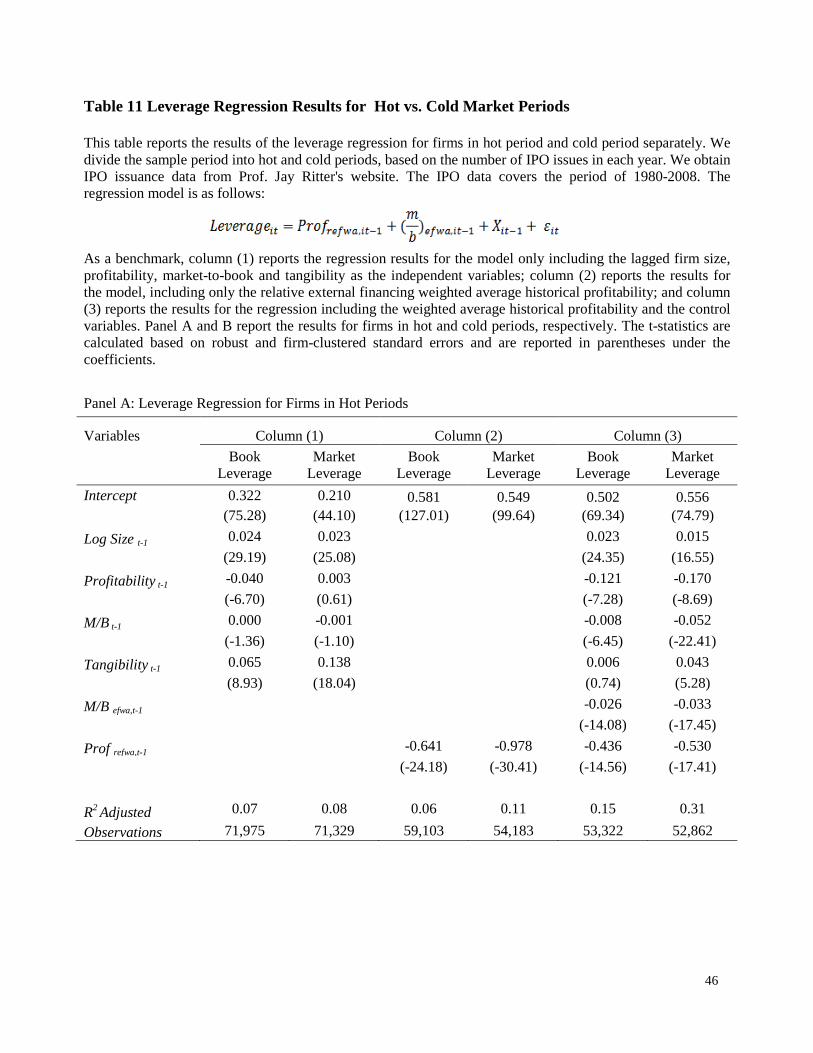
46
Table 11 Leverage Regression Results for Hot vs. Cold Market Periods This table reports the results of the leverage regression for firms in hot period and cold period separately. We divide the sample period into hot and cold periods, based on the number of IPO issues in each year. We obtain IPO issuance data from Prof. Jay Ritter's website. The IPO data covers the period of 1980-2008. The regression model is as follows:
As a benchmark, column (1) reports the regression results for the model only including the lagged firm size, profitability, market-to-book and tangibility as the independent variables; column (2) reports the results for the model, including only the relative external financing weighted average historical profitability; and column (3) reports the results for the regression including the weighted average historical profitability and the control variables. Panel A and B report the results for firms in hot and cold periods, respectively. The t-statistics are calculated based on robust and firm-clustered standard errors and are reported in parentheses under the coefficients.
Panel A: Leverage Regression for Firms in Hot Periods
Variables Column (1) Column (2) Column (3)
Book Leverage
Market Leverage
Book Leverage
Market Leverage
Book Leverage
Market Leverage
Intercept
0.322 0.210 0.581 0.549 0.502 0.556
(75.28) (44.10) (127.01) (99.64) (69.34) (74.79) Log Size t-1 0.024 0.023 0.023 0.015
(29.19) (25.08) (24.35) (16.55) Profitability t-1 -0.040 0.003 -0.121 -0.170
(-6.70) (0.61) (-7.28) (-8.69) M/B t-1 0.000 -0.001 -0.008 -0.052
(-1.36) (-1.10) (-6.45) (-22.41) Tangibility t-1 0.065 0.138 0.006 0.043
(8.93) (18.04) (0.74) (5.28) M/B efwa,t-1 -0.026 -0.033
(-14.08) (-17.45) Prof refwa,t-1 -0.641 -0.978 -0.436 -0.530
(-24.18) (-30.41) (-14.56) (-17.41)
R2 Adjusted 0.07 0.08 0.06 0.11 0.15 0.31 Observations 71,975 71,329 59,103 54,183 53,322 52,862
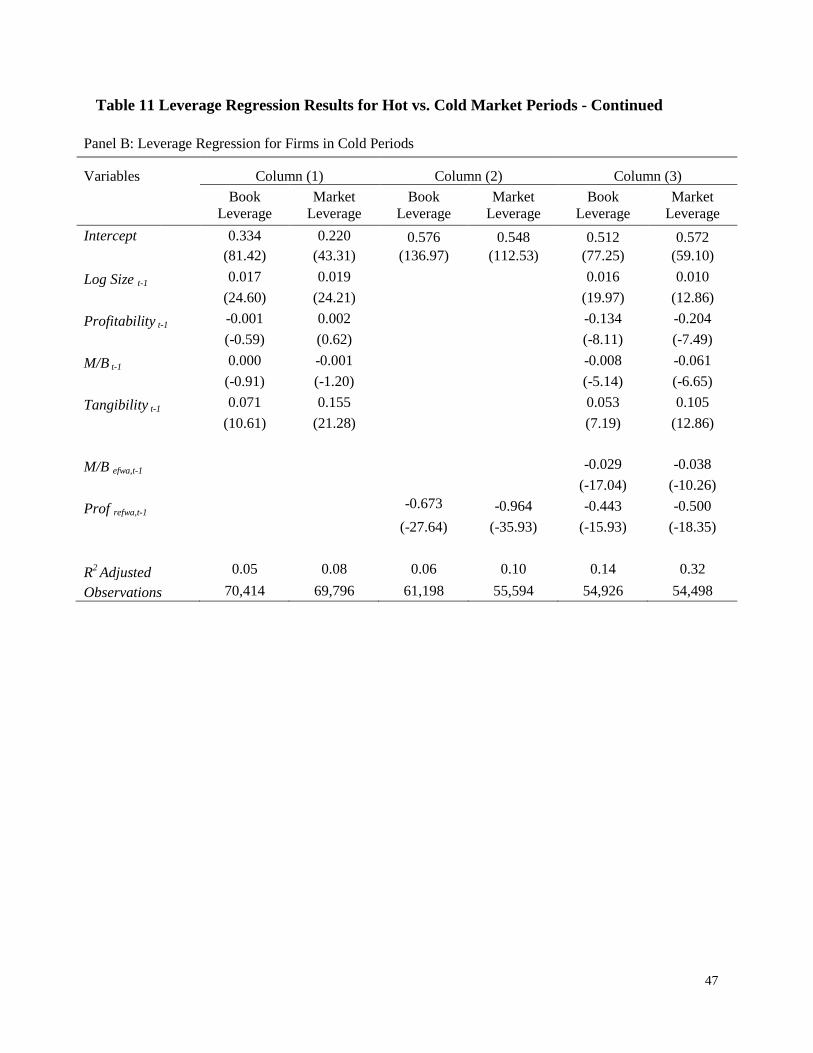
47
Table 11 Leverage Regression Results for Hot vs. Cold Market Periods - Continued
Panel B: Leverage Regression for Firms in Cold Periods
Variables Column (1) Column (2) Column (3)
Book Leverage
Market Leverage
Book Leverage
Market Leverage
Book Leverage
Market Leverage
Intercept
0.334 0.220 0.576 0.548 0.512 0.572
(81.42) (43.31) (136.97) (112.53) (77.25) (59.10) Log Size t-1 0.017 0.019
0.016 0.010
(24.60) (24.21) (19.97) (12.86) Profitability t-1 -0.001 0.002 -0.134 -0.204
(-0.59) (0.62) (-8.11) (-7.49) M/B t-1 0.000 -0.001 -0.008 -0.061
(-0.91) (-1.20) (-5.14) (-6.65) Tangibility t-1 0.071 0.155 0.053 0.105
(10.61) (21.28) (7.19) (12.86)
M/B efwa,t-1 -0.029 -0.038
(-17.04) (-10.26) Prof refwa,t-1
-0.673 -0.964 -0.443 -0.500
(-27.64) (-35.93) (-15.93) (-18.35)
R2 Adjusted 0.05 0.08 0.06 0.10 0.14 0.32 Observations 70,414 69,796 61,198 55,594 54,926 54,498