Embed Size (px)
Citation preview

3117
CHAPTER 5
DETERMINANTS OF CAPITAL STRUCTURE
This chapter explains the variation in the behavior of leverage caused by the
exogenous variables included in the study. The panel regression has been used for observing
the relationship among capital structure and other independent variables. Two measures of
leverage (endogenous variables) i.e., Total Debt to Total Assets and Debt-Equity Ratio have
been used to study the effect of exogenous variables on the capital structure decision.
Exogenous variables include size, growth, profitability, tangibility, age, earnings variability,
debt service capacity, dividend payout ratio, liquidity, non-debt tax shields, degree of
operating leverage, price-earnings ratio, promoter shareholdings, tax rate and uniqueness. The
study is conducted over a period of ten years from 2001-02 to 2010-11 to find out whether
the variations in determinants influence the capital structure in the selected industries. The
chapter intends to justify another objective that whether the factors affecting capital structure
significantly vary amongst the sample companies. For the purpose of analyzing the effect of
selected exogenous variables on the capital structure decision, the following regression
equations have been developed:
LR1 = b0 + b1SZ + b2GR + b3PROF + b4TANG + b5AG + b6EV + b7DSC + b8DPR + b9LIQ +
b10NDTS + b11DOL + b12P/E + b13PH + b14TR + b15UNIQ
LR2 = b0 + b1SZ + b2GR + b3PROF + b4TANG + b5AG + b6EV + b7DSC + b8DPR + b9LIQ +
b10NDTS + b11DOL + b12P/E + b13PH + b14TR + b15UNIQ
Where,
LR1 = Total Debt to Total Assets Ratio
LR2 = Debt-Equity Ratio
SZ = Size Measured in Terms of Assets
GR = Growth Measured in Terms of Assets
PROF = Profitability
TANG = Tangibility
AG = Age of Firm
EV = Earnings Variability

3118
DSC = Debt Service Capacity
DPR = Dividend Payout Ratio
LIQ = Liquidity
NDTS = Non-debt Tax Shield
DOL = Degree of Operating Leverage
P/E = Price-earnings Ratio
PH = Promoter Shareholdings
TR = Tax Rate
UNIQ = Uniqueness
The definition and measurements used for all variables have been explained in the
chapter on research methodology. This chapter has been divided into three sections. First
section uncovers the relationship among total debt to total assets with the regressors used in
this study. Second section establishes the relationship of debt-equity ratio with the
independent variables included in this study and the last sections summarizes and concludes
the results.
5.1 DETERMINANTS OF CAPITAL STRUCTURE (TOTAL DEBT TO TOTAL
ASSETS) (LR1)
This section deals with an examination of the empirical relationship of various
selected independent variables with leverage measured in terms of Total Debt to Total Assets.
The relationship has been studied with the help of panel regression. The analysis has been
done for Traditional, Modern and Combined Data. In order to know the effect of specific
industry on leverage, industry-wise analysis has been presented for selected industries in this
study. The panel regression has been run on selected industries for a period of ten years from
2001-02 to 2010-11. Variance Inflation Factor (VIF) test has been used to check the presence
of multi collinearity. It is observed from the results of VIF test that size measured in terms of
assets with size measured in terms of sales, growth measured in terms of assets with growth
measured in terms of sales and cash flow coverage ratio with debt service capacity have high
level of correlation, hence, to get the reliable results three variables, i.e., size measured in
terms of sales, growth measured in terms of assets and cash flow coverage have been dropped
from analysis. VIF results for the remaining variables have been found below the prescribed
level. Hausman’s Specification test has been used to check the suitability of model for

3119
analysis and then, on basis of significance of model, only appropriate models has been
presented here for analyzing the impact of exogenous variables on capital structure.
The panel regression analysis has been used to establish the relationship of all the
selected variables with total debt to total assets ratio for a period of ten years from 2001-02 to
2010-11 for Traditional, Modern and Combined Data and then specific analysis for different
industries included in study. First of all, the comparison has been made among Traditional
and Modern along with Combined Data and then results from all the industries selected for
this study have been discussed.
Table 5.1 presents the results of Random-effects regression for determinants of capital
structure in Traditional Industries. The model has been selected on the recommendation of
Hausman’s Specification test.
Table 5.1: Random-effects Regression Results for
Determinants of Capital Structure (Total Debt to Total Assets)
in Traditional Industries
R-sq: within = 0.1801between = 0.0075
overall = 0.0781
Number of observations = 930Number of groups = 93Wald chi2 (15) = 146.67Prob > chi2 = 0.0000
Variable Regression CoefficientsSize (Assets) -0.059 (4.72)*Growth (Assets) -0.078 (5.63)*Profitability 0.069 (0.56)Tangibility -0.245 (2.24)**Age -0.001 (1.61)Earnings Variability 0.001 (0.52)Debt Service Capacity -0.001 (0.65)Dividend Payout Ratio -0.001 (0.26)Liquidity -0.018 (2.05)**Non-debt Tax Shield 7.390 (8.10)*Degree of Operating Leverage -0.001 (0.50)Price-earnings Ratio 0.001 (0.32)Promoter Holdings -0.001 (2.08)**Tax Rate -0.034 (0.52)Uniqueness -0.006 (0.30)Cons 0.533 (6.68)Durbin-Watson Test= 1.307
** indicates significance at 5 per cent level
* indicates significance at 1 per cent level
Note: The figures given in parentheses indicate the z-values.
3120
Hausman’s Specification test has been used for checking the suitability of model for
interpretation. The value of Hausman’s Specification test has been found negative, hence,
null hypothesis of difference in coefficients not systematic cannot be rejected indicating the
suitability of Random-effects model for this data. VIF test has been applied to check the
presence of multi collinearity in the model, the value of which is below the level of 10 for all
the selected variables, therefore, model is free from the problem of multi collinearity. The
value of Durbin-Watson test is 1.307, indicating that there is no problem of auto correlation.
Wald chi-square is 146.67 and p-value of 0.0000 shows the validity and significance of
model. The value of R-square is .0781, indicates that the model has explained 7.81 per cent
variation in leverage. It is observed from the table that size, growth, tangibility, age, debt
service capacity, dividend payout ratio, liquidity, degree of operating leverage, promoter
shareholdings, tax rate and uniqueness have negative relationship with leverage but
statistically significant in respect of size and growth only with a z-value of 4.72 and 5.63
respectively, both with a p-value of 0.0000 which shows the significance at .01 level whereas
relation has been found statistically significant in case of tangibility, liquidity and promoter
shareholdings with z-value of 2.24, 2.05 and 2.08 respectively at .05 level. Profitability, non-
debt tax shield and price-earnings ratio have positive relation with leverage but statistically
significant in respect of non-debt tax shield only with a z-value of 8.10 at .01 level. The
negative significant relation of size, liquidity and tangibility with leverage has been
supporting the predictions of Pecking Order theory and negative relation of growth with
leverage has supporting Static Trade-off theory of capital structure.
Table 5.2 shows the Fixed-effects regression results for determinants of capital
structure in Modern Industries. The value of Hausman’s Specification test has recommended
the use of Fixed-effects regression model for the data from Modern Industries.
The value of Hausman’s Specification test is 93.90, which is statistically significant at
.01 level, therefore, rejecting the null hypothesis in favour of Fixed-effects regression model
for this data. The VIF test indicates the absence of multi collinearity in the model. The value
of F-test is 9.26 with a p-value of 0.0000 shows that model has been statistically significant.
The value of R-square (within) is 0.2870, means 28.70 per cent of variation in leverage has
been explained by the independent variables selected for the present study. The significant
negative relation of size and tangibility has supporting the predictions of Pecking Order
Theory. Age and non-debt tax shield has been positively related to leverage and relation has
been statistically significant with a t-value of 3.97 and 6.83 respectively at .01 level. The

3121
relation of growth, profitability, dividend payout ratio, price-earnings ratio, promoter
shareholdings, tax rate and uniqueness has been found positive with leverage but relation has
not been statistically significant. Earnings variability, debt service capacity, liquidity and
degree of operating leverage have negative insignificant relation with leverage.
Table 5.2: Fixed-effects Regression Results for
Determinants of Capital Structure (Total Debt to Total Assets)
in Modern Industries
R-sq: within = 0.2870between = 0.0595
overall = 0.0353
Number of observations = 400Number of groups = 40F (15,345) = 9.26Prob > F = 0.0000
Variable Regression CoefficientsSize (Assets) -1.222 (5.30)*Growth (Assets) 0.013 (0.21)Profitability 1.047 (1.42)Tangibility -1.878 (3.50)*Age 0.154 (3.97)*Earnings Variability -0.001 (1.31)Debt Service Capacity -0.001 (0.23)Dividend Payout Ratio 0.032 (1.12)Liquidity -0.001 (0.01)Non-debt Tax Shield 21.016 (6.83)*Degree of Operating Leverage -0.001 (0.42)Price-earnings Ratio 0.001 (0.39)Promoter Holdings 1.110 (1.58)Tax Rate 0.362 (0.68)Uniqueness 0.029 (0.17)Cons 2.136 (2.94)Durbin-Watson Test= 0.911
* indicates significance at 1 per cent level
Note: The figures given in parentheses indicate the t-values.
Table 5.3 shows the Random-effects regression results for determinants of capital
structure for Combined Data. The value of Hausman’s Specification test has recommended
the use of Random-effects regression model for Combined Data from all the industries
included in the sample.
The value of Hausman’s Specification test is -2118.49, supporting the non rejection of
null hypothesis. Therefore, Random-effects model has been considered appropriate for
interpretation. The value of VIF test for all variables is less than 1.39, indicating absence of
multi collinearity in model. The value of Durbin-Watson test is 1.021, which is within the

3122
range of 1 to 3. Wald chi-square test has been used for checking the significance of model.
The value of Wald test is 138.40, which is statistically significant at .01 level. The model has
explained 8.45 per cent variation in leverage with the help of selected independent variables.
It is observed from the table that non-debt tax shield, dividend payout ratio, price-earnings
ratio, tax rate and uniqueness have positive relation with leverage whereas all other selected
variables have negative relation with leverage. But the relation has been statistically
significant in case of size, tangibility and non-debt tax shield with a z-value of 3.24, 3.64 and
9.81 respectively at .01 level and in case of liquidity with a z-value of 2.58 at .05 level. The
significant negative relation of size, tangibility and liquidity with leverage is supporting
Pecking Order Theory.
Table 5.3: Random-effects Regression Results for
Determinants of Capital Structure (Total Debt to Total Assets)
for Combined Data
R-sq: within = 0.1721between = 0.0143
overall = 0.0845
Number of observations = 1330Number of groups = 133Wald chi2 (15) = 138.40Prob > chi2 = 0.0000
Variable Regression CoefficientsSize (Assets) -0.110 (3.24)*Growth (Assets) -0.011 (0.37)Profitability -0.087 (0.42)Tangibility -0.502 (3.64)*Age -0.001 (1.26)Earnings Variability -0.001 (0.33)Debt Service Capacity -0.001 (1.24)Dividend Payout Ratio 0.001 (0.21)Liquidity -0.034 (2.58)**Non-debt Tax Shield 10.132 (9.81)*Degree of Operating Leverage -0.001 (0.30)Price-earnings Ratio 0.001 (0.85)Promoter Holdings -0.001 (1.61)Tax Rate 0.148 (1.20)Uniqueness 0.006 (0.14)Cons -0.110 (3.24)Durbin-Watson Test= 1.021
** indicates significance at 5 per cent level
* indicates significance at 1 per cent level
Note: The figures given in parentheses indicate the z-values.
3123
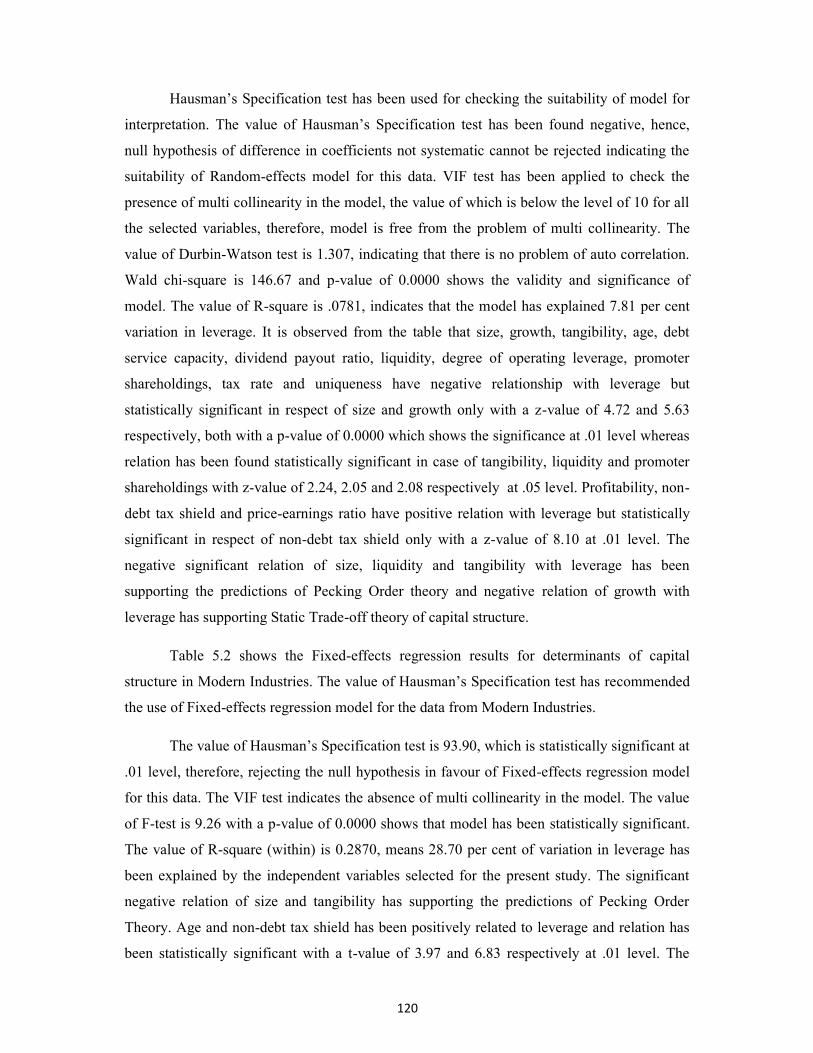
The value of Hausman’s Specification test has recommended the use of Fixed-effects
regression model for Chemical Industry. Therefore, the results of Fixed-effects regression
have been displayed in table 5.4.
Table 5.4: Fixed-effects Regression Results for
Determinants of Capital Structure (Total Debt to Total Assets)
in Chemical Industry
R-sq: within = 0.3058between = 0.0317
overall = 0.0316
Number of observations = 230Number of groups = 23F (15,192) = 5.64Prob > F = 0.0000
Variable Regression CoefficientsSize (Assets) 0.139 (3.62)*Growth (Assets) -0.012 (0.84)Profitability -0.418 (2.33)**Tangibility 0.266 (3.35)*Age -0.023 (5.18)*Earnings Variability 0.001 (2.21)**Debt Service Capacity -0.001 (4.54)*Dividend Payout Ratio 0.001 (0.04)Liquidity 0.009 (1.87)***Non-debt Tax Shield -3.574 (3.25)*Degree of Operating Leverage 0.001 (1.32)Price-earnings Ratio -0.001 (0.15)Promoter Holdings 0.339 (4.28)*Tax Rate -0.042 (0.55)Uniqueness -0.256 (0.76)Cons 0.464 (3.32)Durbin-Watson Test= 0.968
*** indicates significance at 10 per cent level
** indicates significance at 5 per cent level
* indicates significance at 1 per cent level
Note: The figures given in parentheses indicate the t-values.
Fixed-effects and Random-effects regression model have been applied on data,
thereafter coefficients are compared to get the value of Hausman’s test, which recommends
the Fixed-effects model for interpretation. The F-statistics is 5.64 and p-value is 0.0000
shows the validity and significance of the model. Therefore, model is fit for interpretation. R-
square (within) is .3058 which divulges that model has explained 30.58 per cent variation in
leverage with the help of present model. Size, tangibility and promoter shareholdings have
positive relation with leverage whereas age, debt service capacity and non-debt tax shield

3124
have negative relation with leverage. The p-value for all these variables is less than 0.001
which shows that all above relations has been found statistically significant at .01 level.
Earnings variability and liquidity have direct relation with leverage and relation has been
statistically significant with t-value of 2.21 and 1.87 at .05 and .10 level respectively.
Profitability has a reverse relationship with leverage. Profitability has a t-statistics of -2.33
with a p-value of 0.021 which indicates that the relationship between leverage and
profitability has been statistically significant at .05 level. All the remaining variables
included in the present study have turned out to be statistically insignificant for determining
capital structure in Chemical Industry.
Table 5.5: Fixed-effects Regression Results for
Determinants of Capital Structure (Total Debt to Total Assets)
in Drugs & Pharmaceutical Industry
R-sq: within = 0.2658between = 0.4846
overall = 0.4115
Number of observations = 310Number of groups = 31F (15,264) = 6.37Prob > F = 0.0000
Variable Regression CoefficientsSize (Assets) 0.106 (1.77)***Growth (Assets) 0.017 (0.71)Profitability -0.504 (4.70)*Tangibility 0.071 (0.86)Age -0.010 (1.94)***Earnings Variability -0.001 (0.48)Debt Service Capacity -0.001 (0.02)Dividend Payout Ratio -0.010 (0.60)Liquidity 0.017 (2.00)**Non-debt Tax Shield -1.454 (1.87)***Degree of Operating Leverage 0.001 (0.93)Price-earnings Ratio 0.001 (0.45)Promoter Holdings 0.241 (2.44)**Tax Rate 0.142 (2.39)**Uniqueness -0.773 (2.79)*Cons 0.137 (1.01)Durbin-Watson Test= 0.895
*** indicates significance at 10 per cent level
** indicates significance at 5 per cent level
* indicates significance at 1 per cent level
Note: The figures given in parentheses indicate the t-values.

3125
Table 5.5 shows the Fixed-effects regression results for determinants of capital
structure in Drugs & Pharmaceutical Industry. The value of Hausman’s Specification test has
recommended the use of Fixed-effects regression model for Drugs & Pharmaceutical
Industry.
The results of Hausman’s test have supported the Fixed-effects model for available
data from Drugs & Pharmaceutical Industry. The F-statistics is 6.37 and p-value is 0.0000
which shows that model is statistically significant. The model has explained 26.58 per cent of
variation in leverage by any variation in independent variables taking place within firms. The
relation of size with leverage has been found positive and statistically significant with a t-
value of 1.77 at .10 level. This relation supports the prediction of Static Trade-off theory. The
beta coefficient of profitability is -0.5044 revealing that with one unit of change in
profitability, the leverage has been decreased by 0.5044 units. Profitability has a t-statistics of
4.70 with p-value of 0.0000 which indicates that the relationship between leverage and
profitability has been found statistically significant at .01 level. The relationship of age and
non-debt tax shield has been found to be negative and statistically significant at .10 level. The
table demonstrates the relationship of uniqueness with leverage as negative and statistically
significant at .01 level. The relationship of liquidity, promoter shareholdings and tax rate has
been found to be positive with leverage and statistically significant at .05 level. All other
variables have turned out to be statistically insignificant for determining the capital structure
in Drug & Pharmaceutical Industry.
Table 5.6 gives an idea about the determinants of capital structure in Fertilizer
Industry. The Hausman’s Specification test has recommended the use of Fixed-effects
regression model in Fertilizer Industry. Therefore, the results of Fixed-effects regression for
Fertilizer Industry have been exhibited in the table.
Hausman’s Specification test has been applied for selection of appropriate model for
available data from Fertilizer Industry. The null hypothesis of Hausman’s Specification test,
i.e., “differences in coefficients not systematic” is rejected, thus, advocating the use of Fixed-
effects model. The F-statistics is 7.35 with a p-value of 0.0000 which shows the validity and
significance of model. The value of Durbin-Watson test is 1.403 indicates that the auto
correlation is not a problem for this model. The model explains 62.56 per cent of variation in
leverage has been due to change in independent variables over time for a given company. The
table reveals that the profitability has negative beta coefficient with p-value of 0.016

3126
indicating that negative relation among leverage and profitability has been statistically
significant at .05 level. The relation of tangibility and earnings variability with leverage has
been found to be positive and statistically significant at .01 and .05 level respectively. Debt
service capacity and non-debt tax shield have negative relations with leverage and t-value of -
4.40 and -3.60 is statistically significant at .01 level. Promoter shareholding has negative
relation with leverage and relation with a t-value of -1.97 is statistically significant at .10
level. The relations of size, age, liquidity, degree of operating leverage and price-earnings
ratio with leverage have been found negative whereas growth, dividend payout ratio, tax rate
and uniqueness have positive relation with leverage but these relations has not been
statistically significant. Therefore, it can be stated that these variables has not played an
important role in determining the capital structure in Fertilizer Industry.
Table 5.6: Fixed-effects Regression Results for
Determinants of Capital Structure (Total Debt to Total Assets)
in Fertilizer Industry
R-sq: within = 0.6256between = 0.4326
overall = 0.4875
Number of observations = 90Number of groups = 9F (15,66) = 7.35Prob > F = 0.0000
Variable Regression CoefficientsSize (Assets) -0.097 (1.48)Growth (Assets) 0.018 (0.62)Profitability -0.685 (2.46)**Tangibility 0.487 (3.04)*Age -0.001 (0.42)Earnings Variability 0.001 (2.65)**Debt Service Capacity -0.004 (4.40)*Dividend Payout Ratio 0.002 (0.08)Liquidity -0.046 (1.34)Non-debt Tax Shield -7.044 (3.60)*Degree of Operating Leverage -0.001 (1.06)Price-earnings Ratio -0.001 (0.49)Promoter Holdings -0.003 (1.97)***Tax Rate 0.037 (0.40)Uniqueness 0.573 (1.16)Cons 1.122 (2.79)Durbin-Watson Test= 1.403
*** indicates significance at 10 per cent level
** indicates significance at 5 per cent level
* indicates significance at 1 per cent level
Note: The figures given in parentheses indicate the t-values.

3127
Table 5.7 shows the Random-effects regression results for determinants of capital
structure in Iron & Steel Industry. The value of Hausman’s Specification test has
recommended the use of Random-effects regression model in Iron & Steel Industry.
Table 5.7: Random-effects Regression Results for
Determinants of Capital Structure (Total Debt to Total Assets)
in Iron & Steel Industry
R-sq: within = 0.4259between = 0.7854
overall = 0.5616
Number of observations = 210Number of groups = 21Wald chi2 (15) = 248.54Prob > chi2 = 0.0000
Variable Regression CoefficientsSize (Assets) -0.046 (2.43)**Growth (Assets) 0.046 (1.33)Profitability -0.599 (3.04)*Tangibility -0.256 (2.06)**Age -0.002 (2.32)**Earnings Variability 0.001 (1.04)Debt Service Capacity -0.001 (2.61)*Dividend Payout Ratio -0.077 (0.79)Liquidity -0.008 (0.49)Non-debt Tax Shield 12.607 (10.55)*Degree of Operating Leverage -0.002 (3.20)*Price-earnings Ratio 0.001 (1.32)Promoter Holdings 0.084 (0.93)Tax Rate -0.007 (0.13)Uniqueness -0.151 (0.41)Cons 0.476 (4.32)Durbin-Watson Test= 0.747
** indicates significance at 5 per cent level
* indicates significance at 1 per cent level
Note: The figures given in parentheses indicate the z-values.
Hausman’s Specification test has been applied to check the appropriateness of model
and VIF test has been applied to check the multi collinearity among independent variables.
The value of VIF for all independent variables has been found below 5, hence, there should
not be any problem of multi collinearity in model. Hausman’s test has recommended the
Random-effects model for data from Iron & Steel Industry. It is demonstrated through R-
square (overall) in the table that 56.16 per cent of variation in capital structure has been
explained by model. The relation of size, tangibility and age with leverage has been found to
be negative and statistically significant at .05 level whereas negative relation of profitability,

3128
debt service capacity and degree of operating leverage with leverage has been statistically
significant at .01 level. All these relations are consistent with the predictions of Pecking
Order theory. The relation of non-debt tax shield with leverage has been found to be positive
and z-value of 10.55 with a p-value 0.0000 shows that relation is statistically significant at
.01 level. All other variables have been found statistically insignificant in determining the
capital structure in Iron & Steel Industry during study period.
Table 5.8 presents the Random-effects regression results for determinants of capital
structure in Computer & IT Industry. The value of Hausman’s Specification test has
recommended the use of Random-effects regression model for the data from Computer & IT
Industry.
Table 5.8: Random-effects Regression Results for
Determinants of Capital Structure (Total Debt to Total Assets)
in Computer & IT Industry
R-sq: within = 0.4482between = 0.2691
overall = 0.4057
Number of observations = 230Number of groups = 23Wald chi2 (15) = 146.09Prob > chi2 = 0.0000
Variable Regression CoefficientsSize (Assets) -0.545 (3.19)*Growth (Assets) 0.001 (0.20)Profitability 0.481 (0.55)Tangibility -7.170 (8.40)*Age 0.001 (0.19)Earnings Variability 0.001 (0.18)Debt Service Capacity -0.001 (0.81)Dividend Payout Ratio 0.144 (2.75)*Liquidity -0.052 (1.37)Non-debt Tax Shield 35.059 (8.51)*Degree of Operating Leverage -0.001 (0.75)Price-earnings Ratio 0.001 (3.54)*Promoter Holdings 0.381 (0.64)Tax Rate -0.294 (0.33)Uniqueness -1.175 (0.36)Cons 2.066 (2.68)Durbin-Watson Test= 0.997
* indicates significance at 1 per cent level
Note: The figures given in parentheses indicate the z-values.
The value of Hausman’s Specification test is 9.62 with a p-value of 0.5651 which fails
to reject the null hypothesis. Therefore, Random-effects model has been considered

3129
appropriate for Computer & IT Industry. The value of Wald chi-square test has been
statistically significant at .01 level specifying the validity and robustness of model. The VIF
values are below 3 revealing absence of multi collinearity among regressors used in present
model. Durbin-Watson value is very close to 1 indicating auto correlation is within limits.
The beta coefficient for size displays negative relation with leverage and tangibility has also
been showing negative sign of relation with leverage. The relation of size and tangibility has
been found statistically significant at .01 level supporting the predictions of Pecking Order
theory. The relationship of dividend payout ratio, non-debt tax shield and price-earnings ratio
with leverage has been found to be positive and t-values of 2.75, 8.51 and 3.54 with p-values
of 0.0000 shows that these relations are statistically significant at .01 level. Growth,
profitability, age, earnings variability and promoter shareholdings has been found to be
positively related to leverage whereas debt service capacity, liquidity, degree of operating
leverage, tax rate and uniqueness has been found to be negatively related with leverage but all
these relations has not been statistically significant.
Table 5.9 shows the Random-effects regression results for determinants of capital
structure in Media & Entertainment Industry. The value of Hausman’s Specification test has
recommended the use of Random-effects regression model in Media & Entertainment
Industry.
The negative value for Hausman’s Specification test did not reject the null hypothesis,
therefore, Random-effects model has been considered appropriate for Media & Entertainment
Industry. Thus, Random-effects regression results have been exhibited in the table. VIF
values for all regressors are below 4 which points out the absence of multi collinearity in
model. The Durbin-Watson test value is 1.13 which specifies that the auto correlation is
within limits. The relation of size has been found to be positive with leverage and p-value of
0.044 shows that relation has been statistically significant at .05 level. The relation of size
with leverage has supported the expectations of Static Trade-off theory. The significant
negative relation of age with leverage has been supporting the predictions of Pecking Order
theory. Earnings variability has negative relation with leverage as expected by Static Trade-
off and Pecking Order theory. Firms with greater variability in their earnings prefer lesser
amount of debt in their capital structure, as it will be difficult for them to pay fixed amount of
interest and principal repayments with unstable earnings. The relations of dividend payout
ratio and promoter shareholdings with leverage have been found to be negative and
statistically significant at .10 level. Other regressors included in the study have not been

3130
statistically significant for determining the capital structure of Media & Entertainment
Industry.
Table 5.9: Random-effects Regression Results for
Determinants of Capital Structure (Total Debt to Total Assets)
in Media & Entertainment Industry
R-sq: within = 0.3303between = 0.1911
overall = 0.2876
Number of observations = 90Number of groups = 9Wald chi2 (15) = 29.87Prob > chi2 = 0.0124
Variable Regression CoefficientsSize (Assets) 0.093 (2.01)**Growth (Assets) 0.001 (0.35)Profitability 0.078 (0.36)Tangibility 0.159 (1.14)Age -0.005 (2.04)**Earnings Variability -0.001 (3.00)*Debt Service Capacity 0.001 (0.25)Dividend Payout Ratio -0.001 (1.71)***Liquidity -0.028 (1.33)Non-debt Tax Shield 0.529 (0.66)Degree of Operating Leverage -0.001 (0.59)Price-earnings Ratio -0.001 (0.22)Promoter Holdings -0.004 (1.96)***Tax Rate -0.194 (1.24)Uniqueness -0.012 (0.09)Cons 0.217 (1.02)Durbin-Watson Test= 1.130
*** indicates significance at 10 per cent level
** indicates significance at 5 per cent level
* indicates significance at 1 per cent level
Note: The figures given in parentheses indicate the z-values.
Table 5.10 throws a light on the determinants of capital structure in
Telecommunication Industry. The value of Hausman’s Specification test has recommended
the use of Fixed-effects regression model for Telecommunication Industry.
The value of Hausman’s Specification test is 131.23 and p-value is 0.0000 which
rejects the null hypothesis in favour of Fixed-effects model as appropriate for
Telecommunication Industry. Therefore, results of Fixed-effects regression model have been
displayed in the table for interpretation. The F-statistics is 5.39 and p-value is 0.0000 which

3131
Table 5.10: Fixed-effects Regression Results for
Determinants of Capital Structure (Total Debt to Total Assets)
in Telecommunication Industry
R-sq: within = 0.6274between = 0.0133
overall = 0.0813
Number of observations = 70Number of groups = 7F (15,48) = 5.39Prob > F = 0.0000
Variable Regression CoefficientsSize (Assets) 0.271 (4.20)*Growth (Assets) 0.055 (1.43)Profitability 0.532 (1.57)Tangibility -0.216 (1.40)Age -0.017 (1.96)***Earnings Variability -0.001 (4.67)*Debt Service Capacity -0.001 (0.73)Dividend Payout Ratio 0.014 (0.42)Liquidity -0.021 (1.85)***Non-debt Tax Shield 2.692 (2.87)*Degree of Operating Leverage -0.001 (0.44)Price-earnings Ratio -0.001 (1.51)Promoter Holdings 1.153 (3.91)*Tax Rate -0.108 (0.64)Uniqueness 0.026 (1.36)Cons -1.430 (5.48)Durbin-Watson Test= 1.526
*** indicates significance at 10 per cent level
* indicates significance at 1 per cent level
Note: The figures given in parentheses indicate the t-values.
shows that the model is statistically significant at .01 level. VIF values for all regressors has
been found less than 10, thus, multi collinearity is not a problem for this model. The value of
Durbin-Watson is 1.52 which points out that the model is not suffering from auto correlation.
The relation of size with leverage has been consistent with Static Trade-off theory which
indicates that size of the firm has been positively related to debt financing because the direct
bankruptcy cost is well diversified in large firms. The negative relation of age with debt
financing has been found consistent with the Pecking Order theory. Earnings variability has
been found to be negatively related to leverage as per the expectations of Static Trade-off and
Pecking Order theory. The relationship among liquidity and leverage has been found to be
negative and statistically significant at .10 level. The table reveals positive relation of non-
debt tax shield and promoter shareholdings with leverage and relation has been statistically

3132
significant at .01 level. All the remaining regressors have turned out to be statistically
insignificant in determining capital structure in Telecommunication Industry.
Table 5.11 shows the Fixed-effects regression results for determinants of capital
structure in Transport Industry. The value of Hausman’s Specification test has recommended
this model.
Table 5.11: Fixed-effects Regression Results for
Determinants of Capital Structure (Total Debt to Total Assets)
in Transport Industry
R-sq: within = 0.4273between = 0.2670
overall = 0.2864
Number of observations = 100Number of groups = 10F (15,75) = 3.73Prob > F = 0.0001
Variable Regression CoefficientsSize (Assets) 0.135 (3.12)*Growth (Assets) -0.003 (0.44)Profitability -0.325 (1.85)***Tangibility 0.206 (1.31)Age -0.032 (3.60)*Earnings Variability -0.001 (2.07)**Debt Service Capacity 0.001 (0.25)Dividend Payout Ratio 0.003 (0.59)Liquidity -0.008 (0.73)Non-debt Tax Shield 0.347 (0.44)Degree of Operating Leverage 0.001 (0.67)Price-earnings Ratio -0.001 (0.94)Promoter Holdings -0.023 (0.17)Tax Rate -0.108 (0.92)Uniqueness -0.002 (0.26)Cons 0.301 (1.73)Durbin-Watson Test= 1.292
*** indicates significance at 10 per cent level
** indicates significance at 5 per cent level
* indicates significance at 1 per cent level
Note: The figures given in parentheses indicate the t-values.
The Fixed-effects model has been selected on the basis of output produced by
Hausman’s Specification test. Therefore, results of Fixed-effects regression model have been
presented in table for interpretation. VIF test results indicate absence of multi collinearity in
model and Durbin-Watson test discloses that model is free from auto correlation. The F-
statistics is 3.73 and p-value is 0.0001 which shows the validity and significance of model.

3133
The model has explained 42.73 per cent of variation in leverage due to variation in
independent variables within the firms over the period of study. The relation of size has been
found to be positive with leverage and statistically significant at .01 level. The relation of
size with leverage has been found consistent with expectations of Static Trade-off theory. The
beta coefficient for profitability discloses that with a unit change in profitability, leverage will
decline by 0.3250 units. The t-value for profitability is -1.85 with a p-value of 0.068 specifies
that relation has been statistically significant at .10 level. Negative relation of profitability
with leverage has supported the predictions of Pecking Order theory. According to this
theory, highly profitable firms use internal funds for financing and use debt if need arises.
Hence, Pecking Order theory expects negative relation of profitability with leverage. Age has
negative relation with leverage and relation has been found statistically significant at .01
level. Mature firms have sufficient funds to meet their financial requirements, hence, negative
relation has been expected between age and leverage as per Pecking Order theory. Earnings
variability also has negative relation with leverage and p-value of 0.042 indicating that
relation has been statistically significant at .05 level. All other regressors have turned out to
be statistically insignificant for determining the capital structure in Transport Industry.
5.2 DETERMINANTS OF CAPITAL STRUCTURE (DEBT-EQUITY RATIO)
(LR2)
This section explains the empirical relationship of various selected independent
variables with leverage measured in terms of debt-equity ratio. The Fixed-effects and
Random-effects regression for panel data has been used for establishing relationship among
leverage and regressors. The analysis has been done for Traditional, Modern and Combined
Data, thereafter, industry-wise analysis has been presented for industries selected in this
study. The panel regression has been run on selected industries for a period of ten years from
2001-02 to 2010-11. Variance Inflation Factor (VIF) test has been used to check the presence
of multi collinearity. VIF results for the regressors used in this model have been found below
the prescribed level. Hausman’s Specification test has been used to check the suitability of
model for analysis and then on basis of significance of model, only appropriate models have
been presented here for analyzing the impact of exogenous variables on capital structure.
Hausman’s Specification test has been applied to check the suitability of model for
Traditional Industries. The results of Hausman’s test favours the use of Fixed-effects

3134
regression model, therefore, the Fixed-effects regression results for Traditional Industries has
been exhibited in table 5.12.
Table 5.12: Fixed-effects Regression Results for
Determinants of Capital Structure (Debt-equity Ratio)
in Traditional Industries
R-sq: within = 0.0440Between = 0.0075overall = 0.0002
Number of observations = 930Number of groups = 93F (15,822) = 2.52Prob > F = 0.0012
Variable Regression CoefficientsSize (Assets) -0.158 (2.68)*Growth (Assets) 0.067 (0.66)Profitability 0.534 (0.94)Tangibility 0.214 (0.40)Age -0.002 (0.75)Earnings Variability -0.001 (3.79)*Debt Service Capacity -0.001 (0.23)Dividend Payout Ratio -0.001 (1.19)Liquidity 0.024 (0.63)Non-debt Tax Shield -3.198 (0.76)Degree of Operating Leverage -0.001 (0.06)Price-earnings Ratio 0.001 (1.82)***Promoter Holdings 0.023 (1.48)Tax Rate -0.128 (0.47)Uniqueness -0.148 (1.80)***Cons 0.666 (1.51)Durbin-Watson Test= 1.558
*** indicates significance at 10 per cent level
* indicates significance at 1 per cent level
Note: The figures given in parentheses indicate the t-values.
The F-statistics is 2.52 and p-value is 0.0012 which signifies that model is statistically
significant at .01 level. The table shows that the Durbin-Watson test value is 1.55 which is
within permissible range of 1 to 3, therefore, auto correlation can not be a problem for this
model. VIF test indicates that multi collinearity is not causing any problem. The value of R-
square (within) displays that 4.40 per cent of variation in leverage has been explained due to
variation in independent variables within the firms during time period covered in present
study. The relation of size with leverage has been found to be negative and t-value is 2.68
with p-value 0.008 signify that the relation has been statistically significant at .01 level
supporting the Pecking Order theory. The negative relation of earnings variability with
leverage has been found statistically significant and as per the expectations of Static Trade-

3135
off and Pecking Order theory. The relation of price-earnings ratio with leverage has been
found positive and statistically significant at .10 level. The negative relation of uniqueness
with leverage has been found negative and statistically significant at .10 level and consistent
with the expectations of Static Trade-off theory. The relation of all other independent
variables included in this study with leverage has not been statistically significant.
Hausman’s Specification test has been applied to check the suitability of model and
the value of Hausman’s Specification test has recommended the use of Fixed-effects
regression model for the data from Modern Industries. Therefore, Fixed-effects regression
results for determinants of capital structure in Modern Industries have been exhibited in table
5.13.
Table 5.13: Fixed-effects Regression Results for
Determinants of Capital Structure (Debt-equity Ratio)
in Modern Industries
R-sq: within = 0.1641between = 0.0789
overall = 0.0040
Number of observations = 400Number of groups = 40F (15,345) = 4.51Prob > F = 0.0000
Variable Regression CoefficientsSize (Assets) -2.848 (4.57)*Growth (Assets) -0.115 (0.65)Profitability -1.849 (0.93)Tangibility 2.583 (1.78)***Age 0.374 (3.55)*Earnings Variability -0.001 (2.11)**Debt Service Capacity 0.001 (0.18)Dividend Payout Ratio 0.167 (2.11)**Liquidity -0.068 (0.61)Non-debt Tax Shield 20.629 (2.48)**Degree of Operating Leverage -0.001 (0.70)Price-earnings Ratio -0.001 (1.22)Promoter Holdings 3.399 (1.79)***Tax Rate -1.828 (1.26)Uniqueness -0.085 (0.19)Cons 4.797 (2.43)Durbin-Watson Test= 0.925
*** indicates significance at 10 per cent level
** indicates significance at 5 per cent level
* indicates significance at 1 per cent level
Note: The figures given in parentheses indicate the t-values.
3136
The value of Hausman’s test is 39.99 with a p-value of 0.0000 which supports the
rejection of null hypothesis in favour of Fixed-effects regression model. The F-statistics is
4.51 with a p-value of 0.0000 which signifies the validity of model. The model has explained
16.41 per cent of variation in leverage due to change in independent variables within a
company over time. The relation of size with leverage has been found to be negative and
statistically significant at .01 level as consistent with Pecking Order theory. The tangibility
has a positive sign of polarity with leverage and relation has been found statistically
significant at .10 level as consistent with the expectations of Static Trade-off theory. The beta
coefficient for tangibility is 2.58 which shows that with a unit change in tangibility, the
leverage has been increased by 2.58 units. The relation of earnings variability with leverage
has been found negative and p-value 0.036 indicates that the relation has been statistically
significant at .05 level. This negative relation between earnings variability and leverage has
been expected by most of researcher and consistent with Pecking Order and Static Trade-off
theory. Dividend payout ratio and non-debt tax shield have been found to be positively
related with leverage and relation has been statistically significant at .05 level. Promoter
shareholdings have positive relation with leverage and relation has been statistically
significant at .10 level. The relation of all other independent variables with leverage has not
been statistically significant, therefore, these variables have not been considered important in
determining the capital structure in Modern Industries.
Table 5.14 shows the Fixed-effects regression results for determinants of capital
structure in Combined Data from all the industries included in sample. The value of
Hausman’s Specification test has recommended the use of Fixed-effects regression model for
this particular data.
The value of Hausman’s Specification test is 37.99 and p-value of 0.0001 signifies the
rejection of null hypothesis in favour of Fixed-effects model for Combined Data of industries
included in the present study. Therefore, results of Fixed-effects regression model have been
presented for interpretation. The value of Durbin-Watson test is 2.44 which reveal that model
is not sufferings from auto correlation. The value of VIF for all regressors is below 10
indicating that multi collinearity is within control. It is revealed from the table that debt
service capacity, non-debt tax shield, price-earnings ratio and promoter shareholdings have
positive relation with leverage whereas all other variables have shown negative relation. The
negative relation of growth with leverage has been statistically significant at .10 level and
consistent with the Static Trade-off theory and complex version of Pecking Order theory. The

3137
non-debt tax shield has been found to be positively related to leverage contradicting the
predictions of Static Trade-off theory. Except these two variables no other variable has been
found to be statistically significant to determine the capital structure for Combined Data from
all the industries included in sample.
Table 5.14: Fixed-effects Regression Results for
Determinants of Capital Structure (Debt-equity Ratio)
in Combined Industries
R-sq: within = 0.0343between = 0.0102
overall = 0.0057
Number of observations = 1330Number of groups = 133F (15,1182) = 2.80Prob > F = 0.0003
Variable Regression CoefficientsSize (Assets) -0.364 (1.19)Growth (Assets) -0.346 (1.90)***Profitability -0.311 (0.21)Tangibility -0.309 (0.26)Age -0.001 (0.01)Earnings Variability -0.001 (0.84)Debt Service Capacity 0.001 (0.19)Dividend Payout Ratio -0.001 (0.05)Liquidity -0.028 (0.30)Non-debt Tax Shield 34.695 (4.25)*Degree of Operating Leverage -0.001 (0.51)Price-earnings Ratio 0.001 (0.74)Promoter Holdings 0.011 (0.32)Tax Rate -0.625 (0.80)Uniqueness -0.216 (0.89)Cons 1.576 (1.02)Durbin-Watson Test= 2.449
*** indicates significance at 10 per cent level
* indicates significance at 1 per cent level
Note: The figures given in parentheses indicate the t-values.
Table 5.15 shows the Fixed-effects regression results for determinants of capital
structure in Chemical Industry. The value of Hausman’s Specification test has recommended
the use of Fixed-effects regression model for the data from Chemical Industry.
The Fixed-effects regression model has been selected on the basis of Hausman’s
Specification test, whose value is 51.37 and p-value is small enough to reject the null
hypothesis. The r ejection of null hypothesis favours Fixed-effects model over Random-

3138
Table 5.15: Fixed-effects Regression Results for
Determinants of Capital Structure (Debt-equity Ratio)
in Chemical Industry
R-sq: within = 0.2918between = 0.0245
overall = 0.0257
Number of observations = 230Number of groups = 23F (15,192) = 5.27Prob > F = 0.0000
Variable Regression CoefficientsSize (Assets) 0.368 (1.67)***Growth (Assets) 0.031 (0.36)Profitability -2.497 (2.44)**Tangibility 1.696 (3.74)*Age -0.104 (3.97)*Earnings Variability 0.001 (1.47)Debt Service Capacity -0.003 (3.17)*Dividend Payout Ratio -0.028 (0.58)Liquidity 0.050 (1.71)***Non-debt Tax Shield -24.546 (3.91)*Degree of Operating Leverage 0.001 (0.85)Price-earnings Ratio 0.001 (0.46)Promoter Holdings 2.179 (4.81)*Tax Rate 0.160 (0.36)Uniqueness -1.011 (0.53)Cons 2.205 (2.77)Durbin-Watson Test= 0.947
*** indicates significance at 10 per cent level
** indicates significance at 5 per cent level
* indicates significance at 1 per cent level
Note: The figures given in parentheses indicate the t-values.
effects model. Therefore, Fixed-effects model has been exhibited in the table for
interpretation. The F-statistics is 5.27 and p-value of 0.0000 which discloses that model is
significant and fit for interpretation. The model explains 29.18 per cent of variation in
leverage due to change in independent variables within companies over the time period
selected for present study. The relation of size has been found to be positive with leverage
and t-value is 1.67 with a p-value 0.096 which shows that relation has been statistically
significant at .10 level. Profitability has been negatively related to leverage and relation has
been statistically significant at .05 level. Age, debt service capacity and non-debt tax shield
have been found to be negatively related to leverage and relations have been statistically
significant at .01 level. The relation of tangibility and promoter shareholdings with leverage
has been found to be positive and statistically significant at .01 level. The study has observed

3139
positive sign of coefficient for liquidity and p-value of 0.089 shows that relation has been
statistically significant at .10 level. All other regressors included in model have been found to
be statistically insignificant for determining the capital structure in Chemical Industry.
The value of Hausman’s Specification test is 11.39 and p-value is .4962 which is not
small enough to reject the null hypothesis. Therefore, Random-effects model has been
considered appropriate for Drugs & Pharmaceutical Industry and presented for interpretation
in table 5.16.
Table 5.16 Random-effects Regression Results for
Determinants of Capital Structure (Debt-equity Ratio)
in Drugs & Pharmaceutical Industry
R-sq: within = 0.2024between = 0.6479
overall = 0.4654
Number of observations = 310Number of groups = 31Wald chi2 (15) = 115.13Prob > chi2 = 0.0000
Variable Regression CoefficientsSize (Assets) 0.031 (0.28)Growth (Assets) 0.175 (1.50)Profitability -3.149 (6.16)*Tangibility 0.233 (0.65)Age -0.011 (3.44)*Earnings Variability 0.001 (0.86)Debt Service Capacity -0.001 (0.18)Dividend Payout Ratio -0.088 (1.01)Liquidity -0.015 (0.36)Non-debt Tax Shield -4.726 (1.29)Degree of Operating Leverage 0.001 (1.09)Price-earnings Ratio -0.001 (0.63)Promoter Holdings 0.136 (0.43)Tax Rate 0.507 (1.74)***Uniqueness -3.291 (3.01)*Cons 1.588 (2.72)Durbin-Watson Test= 0.964
*** indicates significance at 10 per cent level
* indicates significance at 1 per cent level
Note: The figures given in parentheses indicate the z-values.
The value of Wald chi square test is significant at .01 level, which advocates the
validity and significance of model. It is observed from the table that 46.54 per cent of
variation has been explained by this model. The relation of profitability and age has been
found to be negatively related to leverage and statistically significant at .01 level. These

3140
relations are consistent with expectations of Pecking Order theory. Tax rate has been found to
be positively related to leverage whereas uniqueness has been negatively related to leverage
and statistically significant at .10 and .01 level respectively. These results have been
consistent with predictions of Static Trade-off theory. All other independent variables
included in the study turn out to be insignificant for determining the capital structure in Drugs
& Pharmaceutical Industry.
The value of Hausman’s Specification test has recommended the use of Random-
effects regression model for Fertilizer Industry. Therefore, Random-effects regression results
for determinants of capital structure in Fertilizer Industry have been exhibited in Table 5.17.
Table 5.17: Random-effects Regression Results for
Determinants of Capital Structure (Debt-equity Ratio)
in Fertilizer Industry
R-sq: within = 0.5185between = 0.8312
overall = 0.5855
Number of observations = 90Number of groups = 9Wald chi2 (15) = 104.54Prob > chi2 = 0.0000
Variable Regression CoefficientsSize (Assets) -1.420 (4.60)*Growth (Assets) -0.084 (0.28)Profitability -13.485 (5.12)*Tangibility 2.079 (1.88)***Age -0.001 (0.29)Earnings Variability 0.002 (3.01)*Debt Service Capacity -0.023 (2.81)*Dividend Payout Ratio 0.402 (1.19)Liquidity 0.188 (0.66)Non-debt Tax Shield -24.460 (1.96)***Degree of Operating Leverage -0.001 (0.08)Price-earnings Ratio -0.011 (2.11)**Promoter Holdings -0.017 (3.89)*Tax Rate 0.372 (0.43)Uniqueness -11.230 (3.54)*Cons 10.594 (6.74)Durbin-Watson Test= 1.587
*** indicates significance at 10 per cent level
** indicates significance at 5 per cent level
* indicates significance at 1 per cent level
Note: The figures given in parentheses indicate the z-values.

3141
The Random-effects regression model has been selected on the recommendation of
Hausman’s Specification test. The value of Hausman’s test is 12.49 and p-value is 0.3283
which shows that null hypothesis of difference in coefficients not systematic can not be
rejected. Therefore, Random-effects model has been considered appropriate for the data from
this particular industry. All the values of VIF test are below 10, therefore, multi colloinearity
is not a problem for this model. The Wald chi square value is 104.54 and p-value of 0.0000
supports the validity and significance of model. The R-square reveals that 58.55 per cent of
variation has been explained by the model. The impact of size, profitability and debt service
capacity on leverage has been found to be negative and statistically significant at .01 level.
These results are consistent as per the expectations of Pecking Order theory. Whereas the
negative significant relation of uniqueness and non-debt tax shield has supporting the
predictions of Static Trade-off theory. The coefficient for tangibility shows the positive
relationship with leverage and supporting the predictions of Static Trade-off theory. The
relation of price earnings and promoter shareholdings with leverage has been found to be
negative and statistically significant at .05 and .01 level respectively.
The value of Hausman’s Specification test has recommended the use of Fixed-effects
regression model for Iron & Steel Industry. Therefore, Random-effects regression results for
determinants of capital structure in Iron & Steel Industry have been exhibited in table 5.18.
From the results of Hausman’s Specification test, it has been discovered that Fixed-effects
model should be appropriate for interpretation in case of Iron & Steel Industry. The F-
statistics is 5.45 and p-value of 0.0000 confirms the validity of model for interpretation. The
VIF values for all regressors are below 5, indicating that there is no severe collinearity in
model. The R-square (within) discloses that 31.95 per cent of variation in leverage of a
particular company over time has been explained by model. The relation of size with leverage
has been found to be positive and statistically significant at .05 level and consistent as per
Static Trade-off theory. The table reveals that the coefficients for age, earnings variability
and uniqueness have been found to be negative and their respective p-values confirm the
statistical significance of these variables at .01 level. The degree of operating leverage and
promoter shareholdings has been found to be positively related with leverage and statistically
significant at .10 and .01 level respectively. Other variables considered for this study has
been found to be statistically insignificant in determining capital structure in Iron & Steel
Industry during the study period.

3142
Table 5.18: Fixed-effects Regression Results for
Determinants of Capital Structure (Debt-equity Ratio)
in Iron & Steel Industry
R-sq: within = 0.3195between = 0.1964
overall = 0.1273
Number of observations = 210Number of groups = 21F (15,174) = 5.45Prob > F = 0.0000
Variable Regression CoefficientsSize (Assets) 0.955 (2.60)**Growth (Assets) -0.389 (1.01)Profitability -3.488 (1.62)Tangibility 0.544 (0.30)Age -0.204 (2.93)*Earnings Variability -0.001 (3.56)*Debt Service Capacity -0.001 (0.09)Dividend Payout Ratio 0.653 (0.61)Liquidity -0.176 (0.84)Non-debt Tax Shield -24.062 (1.64)Degree of Operating Leverage 0.012 (1.88)***Price-earnings Ratio -0.001 (0.64)Promoter Holdings 7.377 (3.94)*Tax Rate -1.042 (1.63)Uniqueness -29.813 (2.92)*Cons 3.274 (1.33)Durbin-Watson Test= 0.899
*** indicates significance at 10 per cent level
** indicates significance at 5 per cent level
* indicates significance at 1 per cent level
Note: The figures given in parentheses indicate the t-values.
Table 5.19 shows the Fixed-effects regression results for determinants of capital
structure in Computer & IT Industry. The value of Hausman’s Specification test has
recommended the use of Fixed-effects regression model in Computer & IT Industry.
The value of Hausman’s Specification test is 47.78 and p-value is small enough to
reject the null hypothesis in favour of Fixed-effects regression model for Computer & IT
Industry. The value of R-square (within) discloses that 54.86 per cent of variation in leverage
over time within a company has been explained by model. The table displays that size and
tangibility have negative sign of relationship with leverage and statistically significant at .01
level. These relations are consistent with the predictions of Pecking Order theory. Age has
positive sign of relationship with leverage and statistically significant at .01 level

3143
contradicting the expectations of Pecking Order theory. The relationship among earnings
variability and leverage has been found to be negative and statistically significant at .10 level
consistent with Static Trade-off and Pecking Order theory. Dividend payout ratio and non-
debt tax shield have positive relations with leverage and statistically significant at .01 level.
The promoter shareholdings have positive relation with leverage whereas tax rate have
negative relations and both these relations has been statistically significant at .10 level.
Higher tax rate motivates the firms to use higher level of debt in their capital structure to
avail maximum amount of tax benefit and increase the amount available for equity
shareholders. Static Trade-off theory has also been expecting positive relation between tax
rate and leverage. Other variables included in this study have been found to be statistically
insignificant in determining the capital structure in Computer & IT Industry.
Table 5.19: Fixed-effects Regression Results for
Determinants of Capital Structure (Debt-equity Ratio)
in Computer & IT Industry
R-sq: within = 0.5486between = 0.0128
overall = 0.0920
Number of observations = 230Number of groups = 23F (15,192) = 15.56Prob > F = 0.0000
Variable Regression CoefficientsSize (Assets) -2.787 (4.81)*Growth (Assets) -0.009 (0.68)Profitability -0.276 (0.18)Tangibility -12.912 (7.00)*Age 0.392 (4.18)*Earnings Variability -0.001 (1.85)***Debt Service Capacity -0.001 (0.74)Dividend Payout Ratio 0.733 (7.63)*Liquidity 0.027 (0.34)Non-debt Tax Shield 47.627 (5.73)*Degree of Operating Leverage 0.001 (1.08)Price-earnings Ratio 0.001 (1.45)Promoter Holdings -3.365 (1.88)***Tax Rate 3.663 (1.95)***Uniqueness 4.006 (0.49)Cons 5.022 (2.25)Durbin-Watson Test= 1.161
*** indicates significance at 10 per cent level
* indicates significance at 1 per cent level
Note: The figures given in parentheses indicate the t-values.
3144
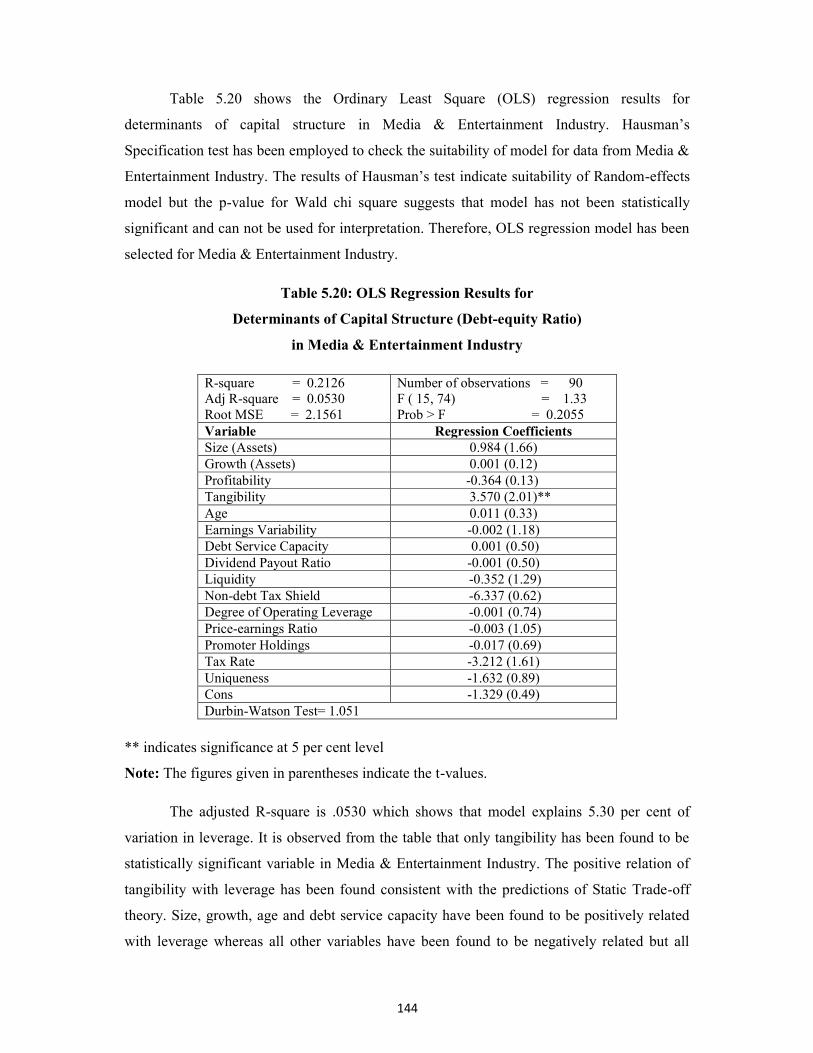
Table 5.20 shows the Ordinary Least Square (OLS) regression results for
determinants of capital structure in Media & Entertainment Industry. Hausman’s
Specification test has been employed to check the suitability of model for data from Media &
Entertainment Industry. The results of Hausman’s test indicate suitability of Random-effects
model but the p-value for Wald chi square suggests that model has not been statistically
significant and can not be used for interpretation. Therefore, OLS regression model has been
selected for Media & Entertainment Industry.
Table 5.20: OLS Regression Results for
Determinants of Capital Structure (Debt-equity Ratio)
in Media & Entertainment Industry
R-square = 0.2126Adj R-square = 0.0530Root MSE = 2.1561
Number of observations = 90F ( 15, 74) = 1.33Prob > F = 0.2055
Variable Regression CoefficientsSize (Assets) 0.984 (1.66)Growth (Assets) 0.001 (0.12)Profitability -0.364 (0.13)Tangibility 3.570 (2.01)**Age 0.011 (0.33)Earnings Variability -0.002 (1.18)Debt Service Capacity 0.001 (0.50)Dividend Payout Ratio -0.001 (0.50)Liquidity -0.352 (1.29)Non-debt Tax Shield -6.337 (0.62)Degree of Operating Leverage -0.001 (0.74)Price-earnings Ratio -0.003 (1.05)Promoter Holdings -0.017 (0.69)Tax Rate -3.212 (1.61)Uniqueness -1.632 (0.89)Cons -1.329 (0.49)Durbin-Watson Test= 1.051
** indicates significance at 5 per cent level
Note: The figures given in parentheses indicate the t-values.
The adjusted R-square is .0530 which shows that model explains 5.30 per cent of
variation in leverage. It is observed from the table that only tangibility has been found to be
statistically significant variable in Media & Entertainment Industry. The positive relation of
tangibility with leverage has been found consistent with the predictions of Static Trade-off
theory. Size, growth, age and debt service capacity have been found to be positively related
with leverage whereas all other variables have been found to be negatively related but all
3145
relations has been statistically insignificant. Hence, it can be promulgated that tangibility has
found to be the only variable to influence the capital structure in Media & Entertainment
Industry.
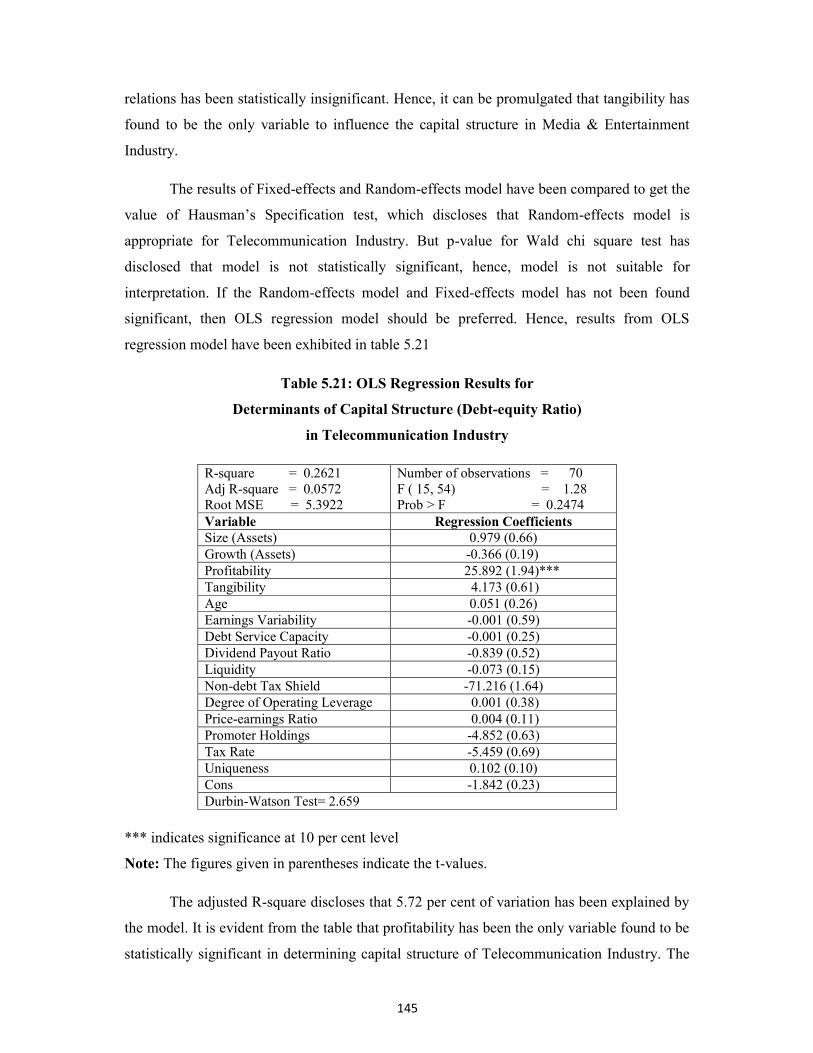
The results of Fixed-effects and Random-effects model have been compared to get the
value of Hausman’s Specification test, which discloses that Random-effects model is
appropriate for Telecommunication Industry. But p-value for Wald chi square test has
disclosed that model is not statistically significant, hence, model is not suitable for
interpretation. If the Random-effects model and Fixed-effects model has not been found
significant, then OLS regression model should be preferred. Hence, results from OLS
regression model have been exhibited in table 5.21
Table 5.21: OLS Regression Results for
Determinants of Capital Structure (Debt-equity Ratio)
in Telecommunication Industry
R-square = 0.2621Adj R-square = 0.0572Root MSE = 5.3922
Number of observations = 70F ( 15, 54) = 1.28Prob > F = 0.2474
Variable Regression CoefficientsSize (Assets) 0.979 (0.66)Growth (Assets) -0.366 (0.19)Profitability 25.892 (1.94)***Tangibility 4.173 (0.61)Age 0.051 (0.26)Earnings Variability -0.001 (0.59)Debt Service Capacity -0.001 (0.25)Dividend Payout Ratio -0.839 (0.52)Liquidity -0.073 (0.15)Non-debt Tax Shield -71.216 (1.64)Degree of Operating Leverage 0.001 (0.38)Price-earnings Ratio 0.004 (0.11)Promoter Holdings -4.852 (0.63)Tax Rate -5.459 (0.69)Uniqueness 0.102 (0.10)Cons -1.842 (0.23)Durbin-Watson Test= 2.659
*** indicates significance at 10 per cent level
Note: The figures given in parentheses indicate the t-values.
The adjusted R-square discloses that 5.72 per cent of variation has been explained by
the model. It is evident from the table that profitability has been the only variable found to be
statistically significant in determining capital structure of Telecommunication Industry. The
3146
positive significant relationship among profitability and leverage has been consistent with
Static Trade-off theory. The relation of size, tangibility, age, degree of operating leverage and
price-earnings ratio has been found to be positive with leverage whereas other independent
variables included in study have negative sign of relationship with leverage. But none of the
variables except profitability has been found to be statistically significant to influence capital
structure in Telecommunication Industry.
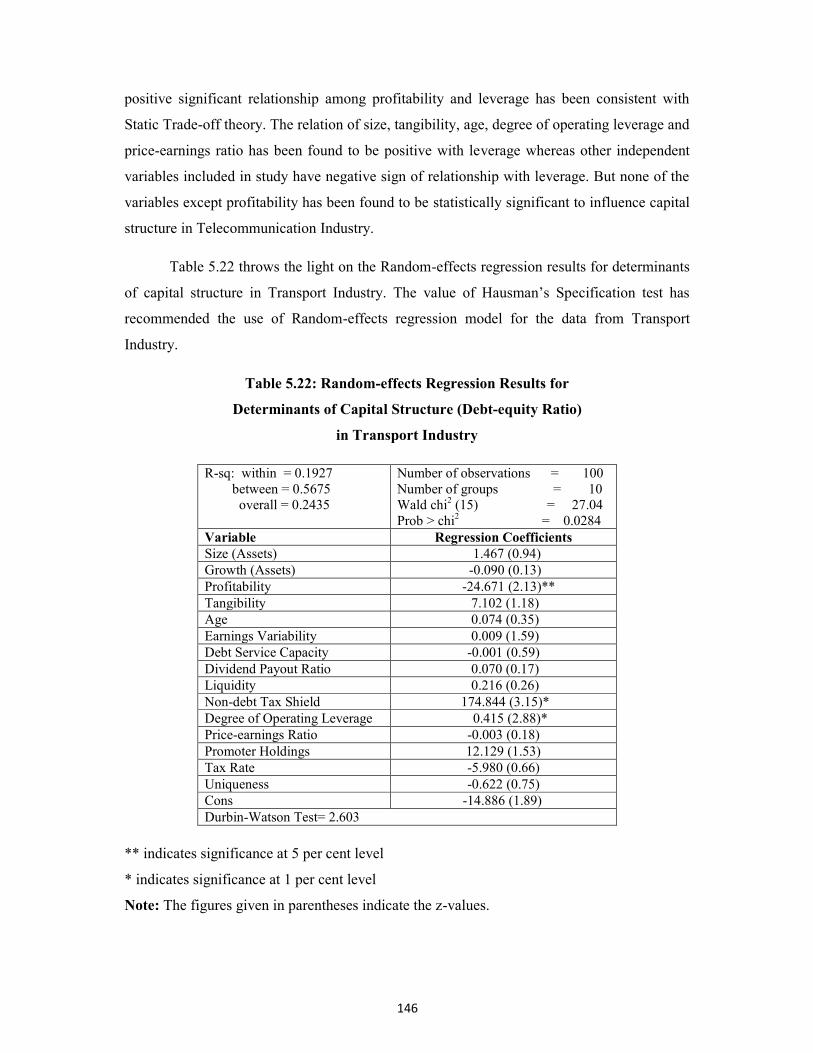
Table 5.22 throws the light on the Random-effects regression results for determinants
of capital structure in Transport Industry. The value of Hausman’s Specification test has
recommended the use of Random-effects regression model for the data from Transport
Industry.
Table 5.22: Random-effects Regression Results for
Determinants of Capital Structure (Debt-equity Ratio)
in Transport Industry
R-sq: within = 0.1927between = 0.5675
overall = 0.2435
Number of observations = 100Number of groups = 10Wald chi2 (15) = 27.04Prob > chi2 = 0.0284
Variable Regression CoefficientsSize (Assets) 1.467 (0.94)Growth (Assets) -0.090 (0.13)Profitability -24.671 (2.13)**Tangibility 7.102 (1.18)Age 0.074 (0.35)Earnings Variability 0.009 (1.59)Debt Service Capacity -0.001 (0.59)Dividend Payout Ratio 0.070 (0.17)Liquidity 0.216 (0.26)Non-debt Tax Shield 174.844 (3.15)*Degree of Operating Leverage 0.415 (2.88)*Price-earnings Ratio -0.003 (0.18)Promoter Holdings 12.129 (1.53)Tax Rate -5.980 (0.66)Uniqueness -0.622 (0.75)Cons -14.886 (1.89)Durbin-Watson Test= 2.603
** indicates significance at 5 per cent level
* indicates significance at 1 per cent level
Note: The figures given in parentheses indicate the z-values.

3147
The value of Hausman’s Specification test is 17.68 and p-value is .1702 that do not
reject the null hypothesis regarding differences in coefficients not systematic. So, Random-
effects model has been favoured over Fixed-effects model. Therefore, Random-effects
regression results have been presented in the table. VIF values for all independent variables
are below 3, hence, collinearity can not cause any problem for this model. The R-square
discloses that 24.35 percent of variation in leverage has been explained by the model. The p-
value for Wald chi square is .0284 which is small enough to signify the model for
interpretation. It is observed from the table that profitability has been found to be negatively
related to leverage and statistically significant at .05 level. The Pecking Order theory is also
expecting negative relation of profitability and leverage. The relations of non-debt tax shield
and degree of operating leverage with leverage have been found positive and statistically
significant at .01 level. Among the other regressors, the variables, growth, debt service
capacity, price-earnings ratio, tax rate and uniqueness have been found to be negatively
related with leverage whereas all other have shown positive relations. But these relations
have not been statistically significant for determining the capital structure in Transport
Industry.
5.3 SUMMARY AND FINDINGS
Two different measures of leverage have been used in this study. The impact of
different determinants on these two measures has been discussed in previous two sections. In
this section, the researcher provides the summary of results for different industries included
in sample.
It is observed from the empirical analysis that relation of size has been found to be
positive in Traditional Industries and Modern Industries as well as for Combined Data. The
relation of size has been significant at .01 level in all three models. The relation of size with
leverage has been found to be negative in Fertilizer Industry, Iron & Steel Industry and
Computer & IT Industry but statistically significant in Iron & Steel and Computer & IT
Industry only at .05 and .01 level respectively. The negative sign of this effect supports the
Pecking Order theory and various empirical researches viz., Titman and Wessels (1988),
Rajan and Zingales (1975), Booth, et al. (2001) and Datta and Agarwal (2009). It is worth to
make note that in Chemical, Drugs & Pharmaceutical, Media & Entertainment,
Telecommunication and Transport Industry, the relationship between size and leverage has
positive sign. The results illustrate that the bigger the company in terms of assets, the larger
3148
amount of debt it has in its capital structure. The findings has been consistent with Static
Trade-off theory and empirical findings by Baral (2004), Bevan and Danbolt (2002), Gaud, et
al. (2003), Pandey (2000), Taub (1975) etc. The risk of bankruptcy for a bigger company is
less than a smaller company. The reason behind this could be that the large companies being
‘too big to fail’, since they operate in large scales and more diversified (Akdal, 2011).
Therefore, smaller companies tend to borrow less than larger ones.
The relation of growth with leverage has been negative and significant in Traditional
Industries whereas in Modern Industries, relation has been positive and insignificant. The
growth has been found to be negatively related to leverage in Chemical and Transport
Industry whereas positive in remaining industries. Negative relationship of growth and
leverage has been consistent with previous empirical studies i.e., Bevan and Danbolt (2002),
Gaud, et al. (2003) and Jong, et al. (2007). It is observed from the regression results that six
of the selected industries have positive sign but none of the relations has been statistically
significant which shows that growth has no significant effect on leverage.
Profitability has been measured by the ratio of Earnings before Interest and Taxes
(EBIT) to total assets. The regression results of different models have shown that profitability
has been positively related with leverage in Traditional and Modern Industries but the
relation is negative for Combined Data. The relation has not been statistically significant in
either case. From different industries, the relation of profitability with leverage has been
found to be negative and statistically significant in Chemical, Drugs & Pharmaceutical,
Fertilizer, Iron & Steel and Transport Industry whereas positive insignificant in other three
industries. The negative relation of profitability with leverage has been supporting the
expectations of Pecking Order theory. According to Pecking Order theory, companies with
high profits prefer retained earnings as a primary source of financing new investments. These
findings imply that profitable firms prefer internal financing rather than external financing.
The results are in line with the findings of past studies of Harris and Raviv (1991), Rajan and
Zingales (1995), Booth, et al. (2001), Bevan and Danbolt (2002), Gaud, et al. (2003), Jong, et
al. (2007) and Pandey (2001).
The results from different regression models indicate that there exists mix type of
relations among tangibility and leverage in different models. The relationship among
tangibility and leverage has been found to be negative and statistically significant at .05 level
for Traditional Industries and at .01 level for Modern and Combined data. The relation of

3149
tangibility with leverage has been found to be negative for Iron & Steel, Computer & IT and
Telecommunication Industries and positive in remaining five industries selected for the
present study. But the relation has been statistically significant for Chemical, Fertilizer, Iron
& Steel and Computer & IT Industries only. The positive relations between tangibility and
leverage are consistent with Static Trade-off theory which suggests that companies having
higher collateral assets are more likely to have high level of debt ratios. The views in favour
of this are that tangible assets are easy to collateralize and therefore, it decreases the agency
cost of debt (Rajan and Zingales, 1995). Also studies of Titman and Wessels (1988), Gaud, et
al. (2003), Pandey, et al. (2000), Oztekin (2008) and Pathak (2011) have found evidences in
support of this relation. The negative sign of relationship among tangibility and leverage
implies that firms with larger tangibility of assets will have lower financial leverage. This
view is as per the expectations of Pecking Order theory and several research studies i.e.,
Cuong and Canh (2012), Eldomiaty (2007), Jong, et al. (2007) and Pandey (2001) have also
supported this relation.
Age has negative relation with leverage in Traditional Industries whereas positive and
significant in Modern Industries. Regression results for Combined Data also disclosing
negative sign of relationship of age with leverage. From the specific analysis of industries,
Computer & IT Industry has positive relation with leverage whereas all remaining industries
have negative relation. A large number of empirical studies such as Cuong and Canh (2012)
and Frydenberg (2004) have found negative relation among age and leverage as consistent
with Pecking Order theory. It implies that debt levels should decrease with the increase in
the age of enterprise. Conversely, several researchers suggest that lower information
imbalances will result in higher debt levels. The debt owners will be more likely to lend
capital to enterprises that they have better understanding rather than enterprises they have
little knowledge about. The positive relation of age and leverage has been consistent with
previous empirical studies i.e., Garg and Shekhar (2002), Mojtahedzadeh and Nejati (2009),
Rafiq (2008) and Zaheer, et al. (2011).
The expected sign of relationship among earnings variability and leverage has been
found to be negative because high risk companies are supposed to have higher chances of
bankruptcy risk. The relation of earnings variability with leverage has been found positive in
Traditional Industries as against the expected relation whereas negative in Modern Industries
and Combined Data. These results are consistent with the Pecking Order and Static Trade-off
theory. The relation of earnings variability with leverage has been negative and statistically

3150
significant in Media & Entertainment, Telecommunication and Transport Industries as in line
with empirical studies of Bhatt (1980), Titman and Wessels (1988), Kumar, et al. (2012), Qiu
and La (2008) and Eldomiaty (2007). The positive sign of relationship has been observed in
Chemical and Fertilizer Industry as in line with Sarvanam (2006) and Lakshmi (2010).
The relation of debt service capacity with leverage has been observed as negative for
Traditional, Modern and Combined Data. The relation has also been negative for industry
specific analysis in all industries except Media & Entertainment and Transport Industry. But
the relation has been statistically significant in respect of Chemical, Fertilizer and Iron &
Steel Industry only. Negative relation of debt service capacity with leverage confirms to the
prediction of Pecking Order theory and consistent with the views of Bhatt (1980),
Mojtahedzadeh and Nejati (2009) and Pandey, et al. (2000). The positive relation of debt
service capacity with leverage has been consistent with Static Trade-off theory and in line
with the views of Kumar, et al. (2012), Barol (2004) and Garg and Shekhar (2002).
The relation of dividend payout ratio with leverage has been found to be negative in
Traditional Industries and positive in case of Modern Industries and Combined Data. But no
relation has been statistically significant means dividend payout has not been an important
determinant of capital structure in either case. From the specific analysis of industries
included in sample, the relation of dividend payout ratio with leverage has been negative in
case of Drugs & Pharmaceutical Industry, Iron & Steel Industry and Media & Entertainment
Industry whereas positive in all remaining industries included in study. The relation has been
statistically significant in Computer & IT and Media & Entertainment Industry at .01 and .10
level respectively.
The ratio of current assets to current liabilities has been used as a proxy of liquidity.
The companies with high level of liquidity have more liquid assets and hence, less amount of
debt is required which results in lower leverage. Therefore, negative relation is expected
between liquidity and leverage. The negative relation between liquidity and leverage has been
observed in Traditional, Modern and Combined Data. But relation has been statistically
significant in Traditional and Combined Data at .05 level which implies that liquidity has
been a significant factor in determining the capital structure in Traditional Industries whereas
insignificant in Modern Industries. The relation between liquidity and leverage is supporting
the views of Pecking Order theory and in line with Akdal (2011), Waliullah and Nishant
(2008), Oztekin (2008) and Myers (1977). From industry wise analysis, all industries except

3151
Chemical and Drugs & Pharmaceutical Industries have negative sign of relations among
liquidity and leverage. The positive sign of relation has been consistent with Static Trade-off
theory and in line with Jong, et al. (2007).
Static Trade-off theory points out that the companies with higher non-debt tax shield
tend to have lesser amount of debt rather than other companies. Therefore, reverse relation is
expected between non-debt tax shield and leverage. From the regression results, it has been
observed that non-debt tax shield has been found to be positively related with leverage in
Traditional, Modern and Combined Data. The findings are contradicting the expectations of
Static Trade-off theory but positive relation among them has been supported by
Mojtahedzadeh and Nejati (2009), Rafiq, et al. (2008), Kakani and Reddy (1998) and Salawu
and Agboola (2008). From the regression results of different industries, Chemical, Drugs &
Pharmaceutical and Fertilizer Industries have negative sign of relationship with leverage and
consistent with Static Trade-off theory. In addition, these findings are consistent with past
empirical studies such as, Oztekin (2008), Rao and Lukose (2001), Qian, et al. (2007) and
Shah and Khan (2007). Positive sign of relationship has been observed in Iron & Steel,
Computer & IT, Media & Entertainment, Telecommunication and Transport Industries as
against the expectations of Static Trade-off theory.
The relation of degree of operating leverage has been found to be negatively related to
leverage in Traditional, Modern and Combined Data. But relation has not been statistically
significant in either case. The relation of degree of operating leverage with leverage has been
found to be negative in all specific industries included in sample except Chemical, Drugs &
Pharmaceutical and Transport Industries. The negative relation has been statistically
significant in Iron & Steel Industry only, hence, it can be stated that degree of operating
leverage has not been significant factor in determining the capital structure of selected
industries. The negative relation has been expected by Static Trade-off and Pecking Order
theory.
The price-earnings ratio has been found to be positively related to leverage in
Traditional and Modern Industries along with Combined Data. But these relations has not
been statistically significant in any model, implies that price-earnings ratio has not been a
significant determinant of capital structure in Indian corporate sector. From the specific
analysis of industries, the relation of price-earnings with leverage has been found to be
positive in Drugs & Pharmaceutical, Irion & Steel and Computer & IT Industries whereas

3152
negative in remaining industries. But relation has been statistically significant at .01 level in
respect of Computer & IT Industry only.
Only a few studies have included promoter shareholdings in their empirical work. The
relation of promoter shareholdings with leverage has been found to be negative and
statistically significant in regard of Traditional Industries whereas relation has been positive
but statistically insignificant in case of Modern Industries. The relation among them has been
found negative but statistically insignificant for Combined Data from all the industries
included in the sample. From the industry wise analysis, it has been found that relation
between promoter shareholdings and leverage has been found negative in Fertilizer, Media &
Entertainment and Transport Industry whereas positive in other cases. The relation has been
significant in Chemical, Drugs & Pharmaceutical, Fertilizer, Media & Entertainment and
Telecommunication Industries. The findings for Traditional Industries are consistent with
Lakshmi (2010) whereas positive sign is in line with Sarvanam (2006) and Qian, et al. (2007)
The impact of tax rate on capital structure has been negative in Traditional Industries
whereas positive in Modern and Combined Data from all the industries included in sample.
But these relations has not been statistically significant in any model, so it can be stated that
tax is not an important consideration for designing the capital structure in Indian corporate
sector. The findings are consistent with Titman and Wessels (1988) and Bradley, et al.
(1984), they found no effect of tax on capital structure. From the different industries, the
relation of tax rate has been found to be positively related with leverage in Drugs &
Pharmaceutical and Fertilizer Industries whereas negatively related in all remaining industries
included in sample. The positive relation of tax rate with leverage has been statistically
significant in Drugs & Pharmaceutical Industry only. The results are consistent with Static
Trade-off theory and in line with Afza and Hussain (2011), Datta and Agarwal (2009) and
Eldomiaty (2007). The negative relation of tax rate with leverage is supported by Taub
(1975) and Jong, et al. (2007).
The uniqueness has been found to be negatively related to leverage in Traditional
Industries whereas positively related in case of Modern and Combined Data. The positive
relation between uniqueness and leverage has been observed in Fertilizer and
Telecommunication Industry whereas negative in all the remaining industries. The negative
relation has been statistically significant at .01 level in Drugs & Pharmaceutical Industry
only. The relation is consistent with Static Trade-off theory and also in line with Titman and

3153
Wessels (1988), Pandey, et al. (2000) and Mojtahedzadeh and Nejati (2009). The
insignificant positive relation is consistent with finding of Eldomiaty (2007), Kakani and
Reddy (1998) and Frydenberg (2004).
The variables has been found to be significant for Traditional Industries are size,
growth, tangibility, liquidity, non-debt tax shield and promoter shareholdings whereas for
Modern Industries, size, tangibility, age and non-debt tax shield has been found to be
significant. From the regression analysis of specific industries, it is revealed that size and
non-debt tax shield have been found most significant variables for determining the capital
structure of sample industries.
The results for determinants of debt-equity ratio have been summarized in the
forthcoming section. It is generally agreed that size is positively associated with leverage.
Large firms are more diversified and have stable cash flows, hence, the probability of
bankruptcy for larger firms are lower as compared with smaller firms. It is observed from the
table that relation of size has been found to be negative in Traditional Industries and Modern
Industries as well as for Combined Data. The relation of size with leverage has been
statistically significant at .01 level in Traditional and Modern Industries but not statistically
significant for Combined Data. The relation of size with leverage has been found to be
negative in Fertilizer Industry and Computer & IT Industry and statistically significant at .01
level. The negative sign of relations among size and leverage supports the Pecking Order
theory and various empirical researches viz., Titman and Wessels (1988), Rajan and Zingales
(1975), Booth, et al. (2001) and Datta and Agarwal (2009). The relationship between size and
leverage has been observed as positive in Chemical, Iron & Steel, Drugs & Pharmaceutical,
Media & Entertainment, Telecommunication and Transport Industry. The results illustrate
that the bigger the company in terms of assets, the larger amount of debt it has in its capital
structure. The findings are consistent with Static Trade-off theory and empirical findings by
Baral (2004), Bevan and Danbolt (2002), Gaud, et al. (2003), Pandey (2000), Taub (1975)
etc.
The relation of growth with leverage has been found to be positive in Traditional
Industries whereas in Modern Industries relation has been found to be negative but both these
relations have been statistically insignificant. The growth has been positively related to
leverage in Chemical, Drugs & Pharmaceutical and Media & Entertainment Industry whereas
negative in remaining industries. Negative relation of growth with leverage has been

3154
statistically significant at .10 level for Combined Data. Hence, it can be stated that growth has
not been considered an important factor in determining the capital structure for specific
industries included in sample. Negative relationship of growth and leverage is consistent with
previous empirical studies i.e., Bevan and Danbolt (2002), Gaud, et al. (2003), Shah and
Hijazi (2004), Datta and Agarwal (2009) and Jong, et al. (2007).
Theoretical predictions of different models do not provide consistent results regarding
relationship between profitability and leverage. Trade-off theory argue that profitable firms
have greater needs to shield income from corporate tax and should borrow more than less
profitable firms whereas Pecking Order theory suggests an inverse relationship between
profitability and leverage. As per the Pecking Order theory, firms prefer internal financing to
external financing. This preference leads firms to use retained earnings first and then move to
external financing only when retained earnings are not sufficient. The regression results of
models have shown that profitability has been positively related with leverage in Traditional
but negatively in Modern and Combined Data. The relation has not been statistically
significant in either case. Hence, it can be stated that profitability has not been considered as
an important factor for determining capital structure in Indian corporate sector. From
different industries, the relation of profitability with leverage has been found to be negative
and statistically significant in Chemical, Drugs & Pharmaceutical, Fertilizer and Transport
Industry whereas positive significant in Telecommunication Industry. Remaining three
industries have negative sign of relationship between profitability and leverage. The negative
relation of profitability with leverage has been consistent with the predictions of Pecking
Order theory. Most empirical studies confirm the negative relation between profitability and
leverage (see Titman and Wessels (1988), Harris and Raviv (1991), Rajan and Zingales
(1995), Booth, et al. (2001), Bevan and Danbolt (2002), Gaud, et al. (2003), Jong, et al.
(2007) and Pandey (2001)) whereas the positive relationship are rarely supported by
empirical studies.
The results from regression indicate that there exists mix type of relations among
tangibility and leverage in different models. The relationship among tangibility and leverage
has been found to be positive for Traditional and Modern Industries and negative for
Combined Data from all industries included in sample. But the relation has been statistically
significant in Modern Industries only. The relation of tangibility with leverage has been
found to be negative for Computer & IT Industry and positive in remaining seven industries
selected for present study. But the relation has been statistically significant for Chemical,

3155
Fertilizer, Computer & IT and Media & Entertainment Industries only. The positive relations
between tangibility and leverage are consistent with Static Trade-off theory which suggests
that companies with higher collateral assets are more likely to have high level of debt ratios.
As tangible assets are easy to collateralize and therefore, it decrease the agency cost of debt
(Rajan and Zingales, 1995). Also studies of Myers (1977), Fama and French (2000), Titman
and Wessels (1988), Gaud, et al. (2003), Pandey, et al. (2000), Oztekin (2008) and Pathak
(2011) have found evidences to support this relation. The negative sign of relationship among
tangibility and leverage implies that firms with larger tangibility of assets will have lower
financial leverage. This view is as per the expectations of Pecking Order theory and
consistent with several research studies i.e., Cuong and Canh (2012), Eldomiaty (2007), Jong,
et al. (2007) and Pandey (2001).
Age has negative relation with leverage in Traditional and Combined Data whereas
positive and statistically significant in Modern Industries. Therefore, it can be stated that age
has been considered as important determinant of capital structure in Modern Industries only.
From the specific analysis of industries, Computer & IT, Media & Entertainment,
Telecommunication and Transport Industries have shown positive relation among age and
leverage whereas all remaining industries have shown negative relation. But the relation has
been statistically significant for Chemical, Drugs & Pharmaceutical, Iron & Steel and
Computer & IT Industries only. Many empirical studies such as Cuong and Canh (2012) and
Frydenberg (2004) found negative relation among age and leverage as consistent with
Pecking Order theory. It implies that debt levels should decrease with the increase in the age
of enterprise. Conversely, several researchers suggest that lower information imbalances will
result in higher debt levels. Therefore, the debt owners will be more likely to lend capital to
enterprises that they have better understanding rather than to enterprises, they have little
knowledge about. The positive relation of age and leverage has been consistent with previous
empirical studies i.e., Garg and Shekhar (2002), Mojtahedzadeh and Nejati (2009), Rafiq
(2008) and Zaheer, et al. (2011).
The inverse relationship between volatility and leverage has been expected because
high risk companies are supposed to have higher chances of bankruptcy risk. The relation of
earnings variability with leverage has been negative in Traditional, Modern and Combined
Data as per the expectations of the Pecking Order and Static Trade-off theory. The relation
has been statistically significant for Traditional as well as for Modern industries. The relation
of earnings variability with leverage has also been found negative for Iron & Steel, Computer
3156
& IT, Media & Entertainment and Telecommunication Industries as in line with empirical
studies of Bhatt (1980), Titman and Wessels (1988), Kumar, et al. ( 2012), Qiu and La
(2008), Eldomiaty (2007) and Waliullah and Nishat (2008). The positive sign of relationship
have been observed in Chemical, Drugs & Pharmaceutical, Fertilizer and Transport Industry
as in line with Sarvanam (2006) and Lakshmi (2010). The regression results indicate that
earnings variability has been observed as important factor in designing capital structure by
Fertilizer, Iron & Steel and Computer & IT industries.
The relation of debt service capacity with leverage has been observed as negative for
Traditional Industry but positive for Modern and Combined Data. But these relations have
not been statistically significant in any case. The relation has also been found negative for
industry specific analysis in all industries except Media & Entertainment Industry. But the
relation has been statistically significant in respect of Chemical and Fertilizer Industries.
Negative relation of debt service capacity with leverage confirms to the prediction of Pecking
Order theory and consistent with the views of Bhatt (1980), Mojtahedzadeh and Nejati (2009)
and Pandey, et al. (2000). The positive relation of debt service capacity with leverage has
been consistent with Static Trade-off theory and in line with the views of Kumar, et al.
(2012), Barol (2004) and Garg and Shekhar (2002).
The relation of dividend payout ratio with leverage has been found to be negative in
Traditional and Combined Data and positive in case of Modern Industries. But relation has
been statistically significant in Modern Industries only which means dividend payout ratio
has not been found as an important determinant of capital structure in Traditional Industries.
From the specific analysis of different industries, the relation of dividend payout ratio with
leverage has been found to be negative in case of Fertilizer, Drugs & Pharmaceutical, Media
& Entertainment and Telecommunication Industry whereas positive in all the remaining
industries included in present study. The relation has been statistically significant in
Computer & IT Industry at .01 level.
As suggested by Pecking Order theory, firms are likely to create liquid reserves from
retained earnings. Therefore, firms will have no need to raise external funds and negative
relation has been expected between liquidity and leverage. The negative relation has been
observed in Modern and Combined Data whereas positive in Traditional Industries. But no
relation has been statistically significant. The negative relation has been supporting the views
of Pecking Order theory and in line with Akdal (2011), Waliullah and Nishat (2008),

3157
Oztekin(2008) and Myers (1977) whereas positive relation has been supported by Static
Trade-off theory and in line with Jong, et al. (2007). From industry wise analysis, Chemical,
Fertilizer, Computer & IT and Transport Industries have revealed positive sign of relations
between liquidity and leverage and negative in remaining four industries. The relation has
been statistically significant in Chemical Industry only.
As suggested by Static Trade-off theory that companies with higher non-debt tax
shield tend to have less amount of debt rather than other companies. Therefore, reverse
relation has been expected between non-debt tax shield and leverage as per the Static Trade-
off theory. From the regression results, it is observed that non-debt tax shield has been found
to be positively related to leverage in Modern and Combined Data whereas negative in
Traditional Industries. Therefore, findings for Traditional Industries are consistent with the
expectations of Static Trade-off theory. Whereas positive relation between non-debt tax
shield and leverage are contradicting the views of Static Trade-off theory but this view has
been supported by Mojtahedzadeh and Nejati (2009), Rafiq, et al. (2008), Kakani and Reddy
(1998) and Salawu and Agboola (2008). From the regression results of specific industries,
Computer & IT and Transport Industries have shown positive sign of relationship between
non-debt tax shield and leverage but all other industries have been showing negative sign of
relation between them. Negative relations between non-debt tax shield and leverage are
consistent with past empirical studies such as, Oztekin (2008), Rao and Lukose (2001), Qian,
et al. (2007) and Shah and Khan (2007).
The relation of degree of operating leverage has been negatively related to leverage in
Traditional, Modern and Combined Data. But relation has not been statistically significant in
either case. All industries included in sample have found to be positively related to leverage
except Fertilizer and Media & Entertainment Industries. The positive relation has been
statistically significant in Iron & Steel and Transport Industry only. The findings regarding
positive relations confirm to the findings of Baral (2004), Kumar, et al. (2012), Bhatt (1980)
and Venkatesan (1983). The negative relation is expected by Static Trade-off and Pecking
Order theory.
The price-earnings ratio has been found to be positively related to leverage in
Traditional and Combined Data whereas the relation has been found negative in Modern
Industries. But the relation has been statistically significant at .10 level in Traditional
Industries only. From the specific analysis of industries, the relationship between price-

3158
earnings ratio has been found to be positive in Chemical, Computer & IT and
Telecommunication Industries whereas negative in remaining industries. But relation has
been statistically significant at .05 level in case of Fertilizer Industry only.
The relation of promoter shareholdings with leverage has been found to be positive
and statistically significant in regard of Modern Industries whereas relation is positive but
statistically insignificant in case of Traditional and Combined Data. From the industry wise
analysis of regression results, it has been found that relation between promoter shareholdings
has been found to be negative in Fertilizer, Computer & IT, Media & Entertainment and
Telecommunication Industries whereas positive in other cases. The relation has been
statistically significant in Chemical, Fertilizer, Iron & Steel and Computer & IT Industries.
The positive relation of promoter shareholdings with leverage for Traditional, Modern and
Combined Data has been consistent with the findings of Sarvanam (2006) and Qian, et al.
(2007).
As the interest from loan is tax deductible, firms with higher taxable income ought to
be having more debt to benefit from tax shield (Niu, 2008). The impact of tax rate on capital
structure has been observed as negative in Traditional, Modern and Combined Data. The
negative relation is in line with Taub (1975) and Jong, et al. (2007). But these relations has
not been statistically significant in any model, thus, it can be stated that tax is not an
important consideration for designing the capital structure for Indian corporate sector. The
findings are consistent with Titman and Wessels (1988) and Bradley, et al. (1984), as they
found no effect of tax on capital structure. From the different industries, Chemical, Drugs &
Pharmaceutical, Fertilizer and Computer & IT Industries reveal the positive relation between
tax and leverage whereas all other industries have shown negative relation. The positive
relation of tax rate with leverage has been statistically significant in Drugs & Pharmaceutical
Industry only. The results are consistent with Static Trade-off theory and in line with Afza
and Hussain (2011), Datta and Agarwal (2009) and Eldomiaty (2007).
The uniqueness has been found to be negatively related to leverage in Traditional,
Modern and Combined Data. The relation has been statistically significant in Traditional
Industries only. The positive relation between uniqueness and leverage has been observed in
Computer & IT and Telecommunication Industry whereas negative in all remaining
industries. The negative relation has been statistically significant at .01 level in Drugs &
Pharmaceutical, Fertilizer and Iron & Steel Industries only. The relation has been consistent

3159
with Static Trade-off theory and also in line with Titman and Wessels (1988), Pandey, et al.
(2000) and Mojtahedzadeh and Nejati (2009). The insignificant positive relation is consistent
with the findings of Eldomiaty (2007), Kakani and Reddy ((1998) and Frydenberg (2004).
The variables found to be significant for determining capital structure in different
industries vary amongst the sample industries. It is observed from the analysis that size,
growth, earnings variability, price-earnings ratio and uniqueness turns out to be significant
for Traditional Industries whereas size, tangibility, age, earnings variability, dividend payout
ratio, non-debt tax shield and promoter shareholdings has been found to be statistically
significant for Modern Industries.
By comparing the results from both the measures used for present study, it is revealed
that both measures provide different results. The relation of size, growth, tangibility,
liquidity, non-debt tax shield and promoter shareholdings with leverage has been found to be
statistically significant by using total debt to total assets model whereas only size, earnings
variability, price-earnings ratio and uniqueness has been found to be statistically significant
by using debt-equity model in Traditional Industries. In Modern Industries, size, tangibility,
age and non-debt tax shield has been found to be statistically significant by using total debt to
total assets model whereas size, tangibility, age, earnings variability, dividend payout ratio,
non-debt tax shield and promoter shareholdings have turned out be statistically significant
variables by using debt-equity model.