Embed Size (px)
Citation preview

Susquehanna UniversityScholarly Commons
Senior Scholars Day 2017 Senior Scholars Day
Apr 25th, 1:40 PM - 2:00 PM
Determinants of Anti-Immigrant SentimentsJames GombasSusquehanna University
Follow this and additional works at: http://scholarlycommons.susqu.edu/ssd
This Event is brought to you for free and open access by Scholarly Commons. It has been accepted for inclusion in Senior Scholars Day by anauthorized administrator of Scholarly Commons. For more information, please contact [email protected].
Gombas, James, "Determinants of Anti-Immigrant Sentiments" (2017). Senior Scholars Day. 21.http://scholarlycommons.susqu.edu/ssd/2017/oralpresentations/21

Gombas 1
Determinants of Anti-Immigrant Sentiments throughout Europe
James Gombas
Senior Seminar
Dr. Peterson
5/2/17

Gombas 2
Abstract
Given the current refugee crises from political unrest around the world there has been
increasing opposition towards immigration in both rhetoric and policy changes. In order to address this
phenomenon this paper builds off of several well researched theories including how economic security,
educational attainment, threat to culture, and the availability of information play a role in developing
one’s view on immigrants. Using data collected from the European Social Survey (ESS) I test these
theories in order to see which is the most statistically significant in determining one’s opposition or
favorability of immigrants. This paper attempts to progress the understanding of how anti-immigrant
sentiments are fostered and provides insight as to how policy changes may help address this issue.
Introduction
Immigration has become one of the most important and highly salient issues in recent years. As
the debate about immigration has come to the forefront of politics, the rise of anti-immigrant
sentiments has also become an issue. Through research, I found some of the main determinants that
lead to anti-immigrant sentiments throughout the world and offer policy suggestions that could help
mitigate the rise of such sentiments. Today’s news is saturated with articles slamming “refugees” as a
single group bent on destroying civil society such as the recent article titled “Stockholm terror: Sweden
will 'never go back' to mass immigration, PM reacts” (Foxnews, 2017). News such as this offers no
context and serves only to fuel anti-immigrant sentiments around the world.
The rise of anti-immigrant sentiments poses significant policy concerns to countries and by
better understanding what influences people to develop negative feelings towards immigrants,
governments can create legislation that addresses those concerns. A more concrete understanding of
what drives these sentiments will help mitigate conflict between groups as well as create a more just
society. Additionally, the rise of anti-immigrant sentiments have led to the formation of often

Gombas 3
exclusionary and hostile legislation, especially in countries such as the United States (Kiehne, 2014).
Through research, I examined some of the root causes of these sentiments and what determinates are
more likely to lead to such attitudes. Many studies have been conducted which have examined the rise
of anti-immigrant sentiments which have resulted in a number of theories. These theories include
economic stability, education, cultural norms and the availability of information. For my research, I
specifically examined whether the educational attainment and the availability of information on
immigrant numbers and consequences are better determinants of anti-immigrant sentiments than
cultural norms and socioeconomic status.
History/Background
Anti-immigrant sentiments and political parties have risen in popularity and then fallen
throughout the world overtime. While recently these parties seem to be rising in popularity due to
security or economic concerns, I think that this research could help dispel those feelings. Over the past
few years’ anti-immigrant parties and politicians in the U.S. commonly cite arguments about economic
and security for the justification of anti-immigrant attitudes. Contrary to this argument research has
been conducted which found that immigrants do not have an adverse effect on host economies. In
Europe, anti-immigrant political parties cite the same sorts of arguments in defense of their policy
choices even when those choices may not be the best for the economic reality in a specific state. By
better understanding the determinants of anti-immigrant sentiments, it would be easier to mitigate the
effects of anti-immigrant and exclusionary policies that threaten to be the norm. Being able to address
the underlying causes of anti-immigrant sentiments is imperative to creating comprehensive
immigration policy that is both fair and beneficial to host economies and immigrants.
The current refugee crisis in Europe sparked by the continued unrest and conflict, specifically in
Syria and Iraq has led to more than one million refugees entering Europe (Europa.eu, 2016). This has led

Gombas 4
to considerable debate about what should be done to accommodate refugees fleeing from war and
other atrocities. This sudden influx of refugees has also created an atmosphere that has allowed anti-
immigrant sentiments to flourish. Since immigration was already such a salient issue, the refugee crisis
only exacerbated the existing problem that needs considerable research to help mitigate anti-immigrant
sentiments. Headlines such as “'Get out of France': Paris police tear gassing refugees and stealing
blankets in freezing conditions, report reveals” are prevalent and help illustrate the intense debate over
immigration (Dearden, 2017). These are not isolated sentiments and other countries are experiencing
the rise of similar sentiments and movements such as a headline from Hungary reading “Migrant crisis:
Hungarian referendum off to a 'xenophobic' start” (Womack, 2016). Additionally, violence against
immigrants has been steadily increasing with Germany recording nearly ten attacks against immigrants a
day in 2016 (Aljazeera, 2017). These headlines and numbers help illustrate how dire the situation is and
how a better understanding of how one cultivates an anti-immigrant sentiment is essential to
combatting the violence and strife that currently consumes the immigration debate.
An anti-immigrant sentiment, or a desire to have less or no immigration coupled with not
wanting to live near or next to a foreign worker or immigrant is a complex issue that is fostered through
a variety of variables. Economic wellbeing, symbolic threat to culture, level of education, and the
availability of information about immigrant numbers and consequences all play a role in this
development however, some play a larger role than others. To better understand what determinant is
more important I examine a number of existing studies and use the variables that have already been
proven to play a role to see which is most significant. Using the same dataset that the individual studies
use, I was able to draw overarching conclusions that offer a better statistical analysis of which
determinants are more likely to result in anti-immigrant sentiments.
Literature Review

Gombas 5
Over the years’ considerable research has gone into the study of what the main determinants of
anti-immigrant sentiments are. For a long time most research disregarded other determinates and
focused solely on the idea that economic threat and security were the main determinates of anti-
immigrant sentiments. This theory has been challenged in recent works with many authors and
researchers looking beyond economic threat to explore what else may be driving the formation of such
sentiments. I explore a number of existing theories that have shown to have something to do with the
development of anti-immigrant sentiments. By examining how economic threat and security,
educational attainment, cultural threat, and the availability of information all play a role in the
formation of anti-immigrant sentiments I am able to evaluate which determinates are most significant in
the development of anti-immigrant sentiments.
Economic Threat/Security
While recent research points to economic threat and security as not the main determinant,
there is clearly some linkage between the economy and anti-immigrant sentiments. Rather than being
the main determinate research has found that opinion about immigration is largely unrelated to
economic circumstances but more closely linked to cultural and national identities and the
overestimation of immigrant numbers and consequences (Sides and Citrin, 2007; Sides and Citrin, 2008;
Hainmueller and Hopkins, 2014; Citrin, Green, Muste, and Wong, 1997; Sniderman, Hagendoorn, and
Prior, 2004). This is a common theme among recent research with many researchers finding that while
economic threat and security play a role in the formation of such sentiments it is not the best predictor
(Sides and Citrin, 2007; Sides and Citrin, 2008). Additionally, it was found that contrary to the traditional
model of labor-market competition higher levels of educational attainment are correlated with less anti-
immigrant sentiments, regardless of employment status or sector of employment (Hainmueller and
Hiscox, 2007).

Gombas 6
While much of the recent research seems to disprove the idea of economic threat as the main
determinant there are studies that show correlation. A recent study has shown that overall as GDP rises
so do average attitudes concerning immigration (Brenner and Fertig, 2006).
Educational Attainment
One theory that has seen considerable study is how the level of educational attainment
correlates to the formation of anti-immigrant attitudes. One such study that looked at how educational
attainment affects ones’ propensity to have an anti-immigrant sentiments was conducted by
Hainmueller and Hiscox. In this study Hainmueller and Hiscox found that higher levels of educational
attainment were associated with higher levels of ethnic and racial tolerance as well as an acceptance of
cultural diversity (Hainmueller and Hiscox, 2007). This piece helped empirically show the validity for
educational attainment as a determinant for the rise of anti-immigrant sentiments. Furthering the
argument for educational attainment is a study, which found that those with a primary education were
much more likely to harbor an anti-immigrant sentiment than their peers who went onto secondary
education or further (Nikolaj Malchow-Møller, Jakob Roland Munch, Sanne Schroll and Jan Rose
Skaksen, 2009). Additional support for this theory is the work conducted by Elisa Rustenbach which also
found a positive correlation between anti-immigrant sentiments and educational attainment
(Rustenbach, 2010). Going beyond the idea of simple education as the main determinant was a study
which helped point that not only educational attainment but also parental education on norms and
differences were the main determinants (Brenner and Fertig, 2006). This is an interesting theory and
helps show it may not be only the educational attainment but something about education that helps
foster more tolerant views.

Gombas 7
Existing research has shown that educational attainment plays a significant role in the formation
of anti-immigrant sentiments. Educational attainments fostered a higher level of racial and ethnic
tolerance amongst respondents (Hainmueller and Hiscox, 2007; Rustenbach, 2010; Brenner and Fertig,
2006). These findings were reiterated in an article that explained how highly educated people in white-
collar jobs are significantly more likely to hold pro-immigration sentiments (Haubert and Fussell, 2006).
This higher level of ethnic and racial tolerance was the same regardless if an individual was in a high-
skilled or low-skilled job (Hainmueller and Hiscox, 2007). This furthers the idea that education level is
imperative in the formation of ideas and opinions about immigration regardless of an individual’s skill
set or place in the economy. Through analysis of these studies, it is clear that educational attainment is
a valid theory for being the main determinant of anti-immigrant sentiments however it is important to
look at a number of empirically supported theories.
Cultural Threat
Another theory postulated was the discrepancy between realistic threats to welfare and
symbolic threats to an individual’s worldview. This theory also found to discredit older research by
empirically showing that symbolic threats to ones’ worldview are considerably more statistically
significant in determining the prevalence of anti-immigrant sentiments than realistic threats to one’s
welfare and economic considerations (Kiehne, 2014; Sniderman, Hagendoorn, and Prior, 2004). The
theory did not completely discredit the idea that economic threats to welfare are involved in the
formation of anti-immigrant sentiments however; it found that the symbolic threats are much more
significant.
The theory that the symbolic threat to one’s culture is the main determinant has been broached
by a number of authors who have found empirical evidence that supports its plausibility. In fact, it was
found that how important values and identity are to the public show a positive correlation between

Gombas 8
anti-immigrant sentiments (Sides and Citrin, 2007; Hainmueller and Hopkins, 2014). This is postulated
as being the case since immigrants are outsiders and therefore elicit hostility from natives who have a
strong emotional attachment to their homeland and people (Sides and Citrin, 2007). Additionally, it was
found that there is more support that anti-immigrant views are associated with values and beliefs that
“foster animosity toward foreigners and foreign cultures and that are most prevalent among less
educated individuals” (Hainmueller and Hiscox, 2007). Furthering the idea of a threat to culture as the
main determinant was a study that found that the clearest predictor of anti-immigrant sentiments came
from a lack of trust and societal integration from the introduction of new cultures (Rustenbach, 2010).
Availability of Information
The availability of information on immigrant numbers and consequences has shown to be
another indicator for the rise of anti-immigrant sentiments. It was found that different levels of
information affected sentiments towards immigration and showed how the public throughout the
European Union and around the world vastly overestimated the levels of immigration in their own
countries (Sides and Citrin, 2007; Sides and Citrin, 2008; Hopkins, Sides, and Citrin, 2016). Following this
finding the authors proposed that those who overestimate levels of immigration are much more likely to
harbor anti-immigrant sentiments (Sides and Citrin, 2007; Hopkins, Sides, and Citrin, 2016). Supporting
this idea was another study that found that increasing the level of legitimate information about the
consequences and levels of immigration would help decrease the level of anti-immigrant sentiments
(Hainmueller and Hiscox, 2007). These findings were mirrored in multiple studies with another finding
that a larger part in forming the public’s opinion is the availability of information (Nikolaj Malchow-
Møller, Jakob Roland Munch, Sanne Schroll and Jan Rose Skaksen, 2009). Another survey study also
found that when respondents were asked about levels of immigration and supposed consequences they
overestimated such numbers and were more likely to have negative views about immigration (Sides and
Citrin, 2008; Hopkins, Sides, and Citrin, 2016). After respondents were given accurate information

Gombas 9
concerning immigrant numbers and consequences, they were much more likely to be in favor of
immigration (Transatlantic Trends: Immigration, 2010).
Hypothesis
My hypothesis is that the main determinants for the existence of an anti-immigrant sentiment
will be the level of educational attainment and the availability of information and that they will prove to
be the most statistically significant determinants. As such, I believe that individuals with higher levels of
education and that have a greater availability of information will hold less of an anti-immigrant
sentiment than individuals with less education and a lower availability of information. While I believe
that these two determinants will be the most significant I also believe that there will be correlation
between economic and cultural threat. I believe that a higher level of education and a greater
availability of information will result in a lower prevalence of anti-immigrant sentiments. I also believe
that the more one feels economically secure will result in a lower prevalence of anti-immigrant
sentiments. In regards to cultural threat I believe that the more important one’s culture is to a
respondent will result in a higher prevalence of anti-immigrant sentiments.
Methodology
In order to find out what the main determinant of anti-immigrant sentiments is in Europe I use
round seven of the European Social Survey (ESS) data from 2014. The data for this round was collected
from twenty-two European countries over the period of early 2014 to mid-2015. The survey size for
each country and question differs slightly though the ESS used a formula based on the population of
persons over the age of fifteen in each country in order to collect a valid and comprehensive sample size
in each country. Many of the studies that have come up with sound theories have used earlier rounds of
the ESS so using the newest round would offer a coherent and sound analysis to determine the main
determinant of anti-immigrant sentiments. Using this data, I am able to cross someone’s proclivity

Gombas 10
towards harboring anti-immigrant sentiments with a number of variables. These variables include level
of educational attainment, economic wellbeing and security, availability of information on immigrant
numbers and consequences, as well as the importance of cultural norms and traditions and how that
may influence anti-immigrant sentiments. The ESS collected data on each of these variables and
includes respondents throughout Europe. This will allow me to use data from a variety of countries,
each experiencing slightly different conditions.
The fact that the ESS surveyed a number of countries with varying economic and demographic
situations helps ensure that the data that I analyze is not skewed for a specific country. The results,
which I find through analysis, offer a broad look at what drives anti-immigrant sentiments throughout
Europe.
Existing research has shown that many variables are involved in the formation of anti-immigrant
sentiments however the education level of an individual as well as the availability of information about
immigrant numbers and consequences appear to be key in the development of anti-immigrant
sentiments. I believe that as an individual attains more education they become more open to
immigration due to increased exposure to new ideas and people. As an individual is exposed to new
ideas and cultures their inherent fear and distrust of immigrants will decrease due to exposure. This
finding has been supported by research showing that more educated respondents tend to be
significantly less racist (Hainmueller and Hiscox, 2007). Additionally, this could be explained by the fact
that more educated respondent’s value cultural diversity and inclusion more than less educated
respondents (Hainmueller and Hiscox, 2007) (Brenner and Fertig, 2006). Since immigration is tied to
many political campaigns actual information about immigrant numbers and consequences has been
politicized and capitalized on by politicians. Politicians across the spectrum use immigration as a tool to
get votes, which has made it difficult for the public to get unbiased information about the actual level of
immigration and the impact that it may have. Studies have found that the public overestimates the level

Gombas 11
and impact that immigration will have on a given state (Sides and Citrin, 2007) (Kiehne, 2014). While the
effect that the overestimation of immigrant numbers and consequences needs to be studied further
there is empirical proof that those who receive information concerning immigration respond differently
than those who do not. It was found that individuals given legitimate information about immigrant
numbers believe that there are not too many immigrants within their countries as opposed to those
who are not given information (Transatlantic Trends: Immigration 2010). Due to the empirical evidence
that both the level of education and the availability of information influence the development of anti-
immigrant sentiments I believe that more study must be conducted to see if they are the main
determinants.
To differentiate from previous research, I use the newest data from the ESS. Additionally,
previous studies have looked at one or two of my chosen variables but never the number of variables
that I have chosen against each other. Drawing on previous research, I chose a collection of variables
that all have shown to have some empirical evidence towards the formation of anti-immigrant
sentiments. By taking multiple studies and theories into account I am able to better identify the main
determinates of anti-immigrant sentiments.
I conduct an observational study using data collected in round seven of the European Social
survey (ESS). Conducting an observational study allows me to analyze the data found in each individual
state and then compare how each state relates to one another. I am then able to see which variable is
most significant in the formation of anti-immigrant sentiments and whether those variables change
based on the demographics and socioeconomic conditions of a certain state. I conducted a series of
descriptive statistics to show that there is indeed correlation between my chosen variables. Once I
found proof that there is indeed correlation I ran a series of multivariate regression models to assess
which variable is the most statistically significant.

Gombas 12
In order to measure the existence of an anti-immigrant sentiment I consider a number of issues.
While an anti-immigrant sentiment is a rather broad and cumbersome idea it could be narrowed down
by utilizing the existing data and studies which have drawn on such data. To this end, I define an anti-
immigrant sentiment using four different survey questions from the ESS. Using four survey questions
allows for consideration of multiple facets of an anti-immigrant sentiment. The ESS has a plethora of
responses to questions such as this, which will allow me to cross those sentiments with variables such as
education level, availability of information, importance of culture, and economic stability.
Existing research has shown how many variables play a role in the formation of anti-immigrant
sentiments however, some have been empirically proven to be more of a determinant than others.
While it would be difficult to control for every single variable involved in the formation of anti-
immigrant sentiments I would account for those that have previously shown to play a large role.
Specifically, I would consider the educational level of an individual measured by the amount of formal
schooling that they attained. An additional variable is the availability of information surrounding
immigrant numbers and consequences. To test this I use a question, which asks the respondent how
much time they spend watching television about current events and politics. Another variable is the
existence of cultural norms and how/if certain cultural norms foster more animosity towards
immigration. To test how the importance of culture may influence the development of anti-immigrant
sentiments I will use questions that ask about the importance of a respondent’s cultural identity and the
importance of following traditions and customs. To assess how the economic situation of a respondent
determines the existence of anti-immigrant sentiments I will use questions found in the ESS that ask
respondents about their perception of the national economy, and how they feel about their household
income. These questions offer a comprehensive overview of what drives anti-immigrant sentiments
throughout Europe. After collecting and analyzing the data, I am able to show which variables are
significant with developing anti-immigrant sentiments.

Gombas 13
I believe that the hypotheses that educational attainment, cultural norms, economic stability,
and the availability of information are the leading determinants in the development of anti-immigrant
sentiments is sound and backed up by previous research. After examining how each of these plays a
role in the development of anti-immigrant sentiment it is easier to see which one is more statistically
significant. Given the previous research on the subject, it is clear that there is a credible causal
mechanism between anti-immigrant sentiments and education and information. It also seems highly
unlikely that more information and education would lead to higher levels of anti-immigrant sentiments
since it has been shown that those with higher levels of education are less racist and more in favor of
immigration (Hainmueller and Hiscox, 2007). Existing research has also shown that there is covariation
between increased levels of educational attainment and knowledge about immigrant numbers and
consequences that are associated with lower levels of anti-immigrant sentiments (Hainmueller and
Hiscox, 2007,Transatlantic Trends: Immigration 2010, Sides and Citrin, 2007).
The data collected in the surveys that I utilize is ordinal in nature. This help differentiate for the
level of education in such a scale starting with no formal education and leading up to a doctoral degree.
This helps show how increases in educational attainment affect the prevalence of anti-immigrant
sentiments. The same sort of ordinal measurement is used to determine the amount or lack thereof of
information that a respondent has on the actual level and consequences of immigration. To help
determine how much cultural homogeneity matters to an individual I also use an ordinal form of
measurement. By showing how important cultural homogeneity, traditions, and customs are to a
respondent in relation with the level of anti-immigrant sentiments one will have a clear understanding
of how it affects the development of such sentiments. Using an ordinal scale of measurement when
determining an individual’s opinion on immigration is important since it allows for statistical
interpretation of how each determinant affects the prevalence of anti-immigrant sentiments and which
are more likely to give rise to such opinions.

Gombas 14
` Considerable evidence points to the fact that the economic well-being is not the main
determinant in creating anti-immigrant views and instead a lack of education fosters these ideals and
views. While many who hold anti-immigrant views are experiencing a form of economic hardship those
same individuals are generally less educated. The interesting fact noted by Sides and Citrin was that
those who were more educated yet kept outside of the labor force or experiencing economic hardship
were less likely to harbor anti-immigrant views. Based on these studies it is clear that higher levels of
education tend to lead citizens to accept new cultures and customs while at the same time welcoming
immigrants (Hainmueller and Hiscox, 2007). While there are many determinates that can lead to anti-
immigrant sentiments it appears the main source of these views comes from a lack of education
throughout the world.
While the data available disproves the notion that anti-immigrant sentiments are driven only by
economic interests other determinants seem to be the respondents education level and available
information it is unable to account for the cultural gap that exists between populations. There is a clear
link between anti-immigrant sentiments with a number of variables however, it is difficult to pinpoint
individuals who may be educated yet hold onto inherent racism and ethnocentric ideals. Additionally,
some individuals may respond more positively towards questions regarding immigration due to a social
desirability standpoint.
In addition, these findings help disprove the traditional theory that economic interests are the
main determinant in the rise of anti-immigrant sentiments. The fact that considerable research has
shown that the economy plays a smaller role than was previously thought helps support the theory that
other factors are more important. To look beyond economic interests creates a situation where there
are a large number of variables that all play a part. While this in itself makes it more difficult to find the
main determinants it is clear that symbolic threats to an individual’s worldview are more salient
predictors of an anti-immigrant sentiment than realistic threats to welfare (Kiehne, 2014). In light of

Gombas 15
this, it is important to look at a variety of variables to better asses which are the most significant in the
development of anti-immigrant sentiments.
Variables and Measurement
Dependent Variable
The dependent variable is whether a respondent holds an anti-immigrant sentiment. While
there are a number of ways to measure the existence of an anti-immigrant sentiment, I chose the
following questions from round seven of the ESS in order to have a concrete understanding of whether a
respondent holds such a sentiment. In order to hold an anti-immigrant sentiment a respondent must
have responded negatively to any or all of the following questions from round seven of the ESS.
The first question I chose to determine whether a respondent held an anti-immigrant question
asked them how they felt about people of the same race or ethnicity as the majority of people within
their country to immigrate. Table 1 shows the distribution of these responses with the majority of
people believing that some should be allowed to immigrate
*Full frequency table available in appendix A
In Contrast to the first question, the second question attempts to show whether respondents
felt differently about immigrants of a race or ethnicity that is not the majority in their country. Table 2

Gombas 16
shows the distribution of answers for this question. An interesting take away from this table is that
those who believed that many immigrants of the same race or ethnicity should be allowed to immigrate
was almost halved when asked if many immigrants of another race or ethnicity should be allowed to
immigrate.
*Full Frequency table for this question available in appendix B
The third question that I chose asked the respondents whether they felt that immigrants as a
whole made the country a better or worse place to live. I chose this question since it forced the
respondent to place how they felt on a scale giving a rough idea of how they viewed immigrants and
immigration itself. What is interesting about the responses to this question as seen in table 3 is that the
vast majority of respondents were right in the middle and did not have strong feelings about immigrants
one way or another.
*Full frequency table for this question available in appendix C

Gombas 17
The last question that I chose to measure an anti-immigrant sentiment was how they felt
immigrants impacted the culture within their respective countries. Mirroring the results in the previous
question it is quite apparent that most respondents were ambivalent or believed that refugees enriched
the cultural life within their states. Table 4 displays the distribution of responses for this question.
*Full frequency table available in appendix D
Independent Variables
The following independent variables were chosen based off of previous research which has
shown that certain variables play a role in the formation of anti-immigrant sentiments. Each of these
variables represents a facet of the formation of anti-immigrant sentiments and by examining each it will
be easier to see which variable is the most statically significant determinant in the formation of such
sentiments. The chosen variables consist of economic threat and security, educational attainment,
cultural threat, and availability of information. The following questions were also drawn from round
seven of the ESS encompassing twenty-two European countries.

Gombas 18
Economic threat/Security
The first question I chose to examine how the economy plays a role in the development of anti-
immigrant sentiments was how the respondent felt about the national economy. I thought that this was
an important distinction since it shows how the common person views the economy, often without the
knowledge to have an informed opinion. As illustrated in table 5 most people were nether extremely
satisfied or extremely dissatisfied, however the trend was that more people were satisfied with the
economy than dissatisfied.
*Full frequency table available in appendix E
The other question that I chose to evaluate the impact of the economy on the rise of anti-
immigrant sentiments focused in on the individual rather than how the individual viewed the national
economy. This question asked the respondent how they themselves felt able to live with their current
income. An interesting take from the distribution of the responses in table 6 is how most people were
either coping or living comfortably with their current income.

Gombas 19
*Full frequency table available in appendix F
Educational Attainment
To assess how educational attainment affects the rise of anti-immigrant sentiments I chose a
question that asked the respondent what the highest level of education was that they completed. Table
7 shows the distribution of these results.
*Full frequency table available in appendix G
Cultural Threat
In order to see how the threat to culture posed by immigrants influences a respondent’s feelings
concerning immigration I chose a question that asked the respondent to evaluate how important culture
was to themselves. The responses, shown in table 8, were not surprising and showed that traditions
and customs are rather important to the majority of respondents.

Gombas 20
*Full frequency table available in appendix H
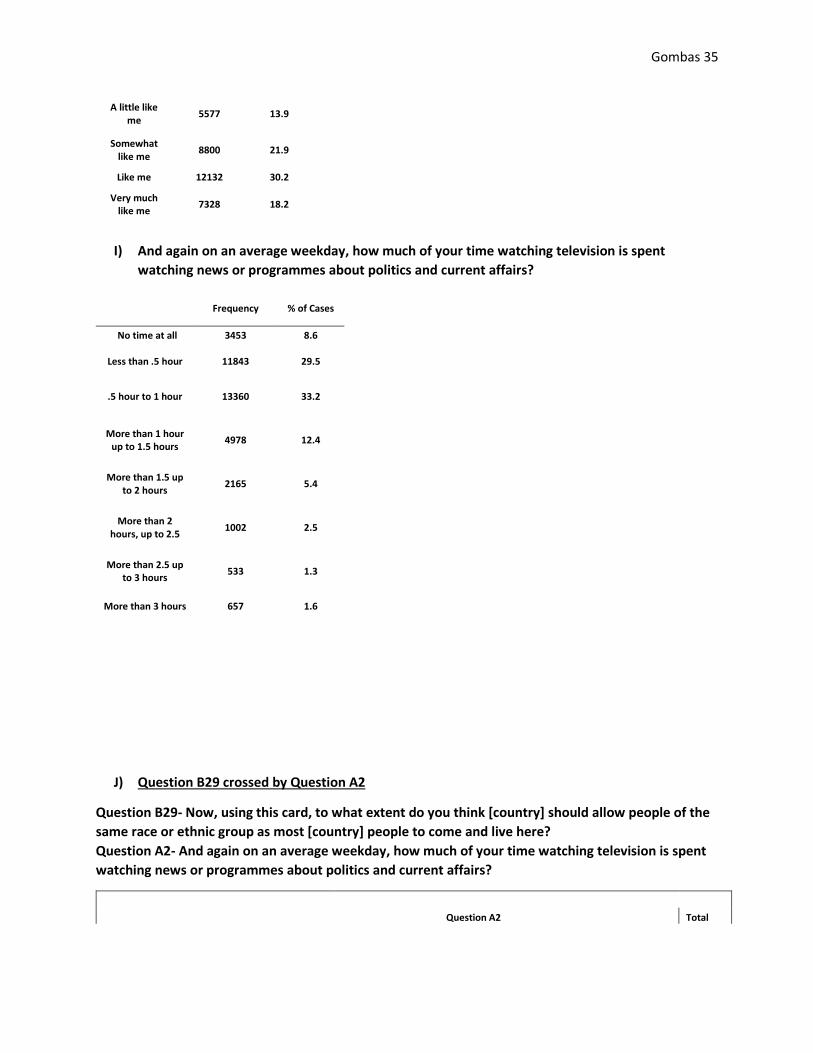
Availability of Information
To see how the availability of information influences a respondent’s views on immigration I
chose the following question that attempted to see how much time a respondent spent watching TV
and news about current events and politics. A rather imprecise test of knowledge the ESS did not
include a survey question that explicitly tested the respondent’s knowledge of refugee numbers and
impacts. Since I still felt as though it was an important variable I included this question to attempt to
see how the availability of information impacts the rise of anti-immigrant sentiments. Table 9 shows the
distribution for how much time people watch TV on current events on an average weekday.

Gombas 21
*Full frequency table available in appendix I
Control Variables
In addition to the independent variables that I utilize, I include a number of control variables in
my regression models to help validate my findings. The control variables that I chose to include were
the age of the respondent, whether the respondent belongs to a minority group, and their placement on
a left to right political scale. Additionally, I clustered the findings on countries and used robust standard
errors in my regression models.
Analysis and Findings
After gathering all of the survey data from the ESS on the chosen variable I began to run a series
of descriptive statistics in SPSS. Using the first survey question1 that helped measure the existence of an
anti-immigrant sentiment I conducted crosstabs for each of my chosen independent variables. The
results from these crosstabs were in line with my hypothesis and helped show that there was indeed
correlation between my independent variables and the existence of an anti-immigrant sentiment.
1 Question B29- Now, using this card, to what extent do you think [country] should allow people of the same race or ethnic group as most [country] people to come and live here?

Gombas 22
With only a series of five crosstabs I was able to see a number of interesting trends emerge.
Chief among these trends is the way that TV watching about current events impacted one’s propensity
to want to allow immigrants into the country. While I was trying to find a survey question that would
help test the level of knowledge that a respondent has I ended up using a question that focused on how
much TV they watch on current events and politics. This rather imprecise question resulted in data that
ran counter to my hypothesis in that those respondents who watched more TV about current events
and politics were less likely to favor immigration2.
The next crosstab that I looked at examined how one’s feelings about their household income
impacted their feelings about allowing immigrants into the country. Congruent to my hypothesis this
crosstab3 showed that as one views their household income as more positive they are more open
towards the idea of immigration. This finding was also supported by the next crosstab4 which I viewed
in which as one is more satisfied with the national economy they are more in favor of immigration as a
whole.
Another one of my hypothesis was proved by the crosstab between immigration and
educational attainment. This crosstab presented a rather stark image which showed how much of an
impact education has on whether someone is in favor of immigration or not. This was one of the most
striking examples of one of my variables playing a significant role in the development of such sentiments
with less than 3.5% of those with a Master’s degree or higher wanting no immigration while 21.2% of
those with less than secondary education wanting no immigration5.
2 See appendix J for crosstab 3 See appendix K for crosstab 4 See appendix L for crosstab 5 See appendix M for crosstab

Gombas 23
The last crosstab that I looked at was how culture impacted one’s views towards immigration.
In this crosstab another one of my hypothesis was proved true by the way that those who felt that
traditions and customs were more important were less in favor of immigration whereas those who
didn’t view them as that important were more open to immigration.6
Since the correlation between my independent variables and the first question that defined my
dependent variable was so strong I expected there to be correlation amongst all of my chosen questions
to define an anti-immigrant sentiment. In light of this, I moved beyond a series descriptive statistics and
ran a multivariate regression model in STATA with robust standard errors that tested all of my
dependent variable measures against my independent variables at once. These results were quite
insightful and helped explain what is statistically significant in developing an anti-immigrant sentiment.
Table 10 is the finalized multivariate regression table examining the four survey questions I chose as well
as the five independent variable and included control variables.
The results from my regression table indicate a number of intriguing discoveries. Beginning with
the education variable, results help show that educational attainment has a highly significant positive
relationship across all models. In this case, that means that as one has higher educational attainment
they will be more favorable towards immigrants. Each of the questions I chose to measure the existence
of an anti-immigrant sentiment showed a highly significant relationship at the 0.01 level with
educational attainment. These results support my hypothesis and show that education is clearly
significant in determining ones propensity to view immigrant as good or bad.
The next variable assessed was the availability of information. While the question used to asses
a respondents level of knowledge was not the best, some conclusions are still clear. Models one and
two showed that the availability of information was found to have a positive relationship and be highly
6 See appendix N for crosstab

Gombas 24
significant at the 0.01 level. Model four showed that the availability of information had a positive
relationship and was significant at the 0.05 level. This means that as one watches more television about
politics and current events they will respond more positively towards immigrants. The only model that
did not show the availability of information to be significant was model three. While one of the
measures that I chose for determining the presence of an anti-immigrant sentiment did not show
significance, the other three models were consistent with my hypothesis. While the question used was
not a perfect gauge of a respondent’s level of knowledge it is clear that watching more television about
current events and politics resulted in a lower prevalence of anti-immigrant sentiments. The other
striking outcome of this finding is that when looking at the correlation between this variable and the
prevalence of anti-immigrant sentiments there is negative relationship, meaning more television
watching is correlated with a higher prevalence of anti-immigrant sentiments. When controlling for age,
minority status, and political ideology while clustering on countries this effect goes away.
The cultural threat variable showed results consistent with my hypothesis showing a highly
significant negative relationship at the 0.01 level across all four models. This means that as a
respondent views following traditions and customs within their country as more important they will
have a higher prevalence of anti-immigrant sentiments. These results help show that threat to culture
plays a powerful role in the development of anti-immigrant sentiments and is congruent with previous
studies and my hypothesis.
In regards to household economic threat, results showed a highly significant positive
relationship at the 0.01 level across all models. These findings were consistent with my hypothesis and
showed that as a respondent felt more confident in their ability to live comfortably with their current
income they were less likely to hold anti-immigrant sentiments. These findings were reverberated in the
question assessing a respondent’s perception of the national economy with all models showing a
positive highly significant relationship at the 0.01 level. These findings were also consistent with my

Gombas 25
hypothesis and showed how as one perceives the national economy as better they will be less likely to
hold anti-immigrant sentiments. Both of these findings show that the economy still plays a powerful
role in the development of anti-immigrant sentiments.
Table 10: OLS Regression table for each of the survey questions used to describe dependent variable
(1) (2) (3) (4)

Gombas 26
VARIABLES
Immigrants make country worse or
better place to live?
Immigrants enrich or undermine cultural life?
Immigrants of same race or ethnicity as majority
allowed to immigrate?
Immigrants of different race or ethnicity than majority allowed
to immigrate?
Education 0.205** 0.263** 0.0806** 0.0785**
(0.0252) (0.0265) (0.00518) (0.00668)
Availability of Information 0.0780** 0.0697** 0.00224 0.0165*
(0.0194) (0.0202) (0.00602) (0.00746)
Cultural Threat -0.0930** -0.135** -0.0388** -0.0493**
(0.0320) (0.0380) (0.00678) (0.00926)
Household Economic Threat 0.188** 0.183** 0.0960** 0.0999**
(0.0510) (0.0584) (0.0146) (0.0180)
National Economic Threat 0.197** 0.187** 0.0582** 0.0539**
(0.0241) (0.0404) (0.0179) (0.0156)
Age -0.00981** -0.00776** -0.00130 -0.00477**
(0.00130) (0.00160) (0.00102) (0.000626)
Minority 0.425* 0.226 -0.0181 0.0292
(0.189) (0.212) (0.0604) (0.0623)
Ideology -0.141** -0.190** -0.0482** -0.0697**
(0.0298) (0.0418) (0.0101) (0.00967)
Constant 4.366** 5.170** 1.607** 1.655**
(0.293) (0.340) (0.0996) (0.115)
Observations 31,473 31,598 31,718 31,699
R-squared 0.141 0.143 0.129 0.147 OLS Regression table clustered on countries with Robust standard errors in parentheses ** p<0.01, * p<0.05,

Gombas 27
The results from the OLS regression model that I used were not surprising and helped support
all of my original hypotheses. When controlling for age, whether the respondent belonged to a minority
group, ideology on a left to right political scale, and clustered on countries the discrepancies noticed in
the earlier crosstabs were not as important. As such in the crosstabs it appeared that as a respondent
watched more TV on current events and politics they were less likely to be in favor of immigrants but
when controlling for the aforementioned factors this was found to not be true.
While these results do not offer a complete picture as to what the single most important factor
in the development of anti-immigrant sentiments is, they offer a number of empirically backed up
theories which help explain how these sentiments are fostered. Without a doubt, it is clear that
educational attainment, availability of information, threat to culture, and economic threat all play an
important role in the development of anti-immigrant sentiments. While there are other factors which
play a role in the formation of anti-immigrant sentiments the results which I have found are consistent
with previous research and help explain some of the important determinants of anti-immigrant
sentiments.
Conclusion
In an increasingly integrated world the issue of immigration can no longer be ignored. The
current migrant crisis in Europe is a prime example of why more needs to be done in order to
understand how anti-immigrant sentiments are fostered. By better understanding what drives the
formation of anti-immigrant sentiments more could be done to combat their rise. Anti-immigrant
sentiments foster anger and resentment at wide swaths of people and encourage the formation of
exclusionary groups and legislation. Having a better understanding of the determinants would allow
policy makers to pursue policies that mitigate the effects of such sentiments. The findings from my
research support my hypotheses and show that educational attainment, availability of information,

Gombas 28
threat to culture, and economic threat are all statistically significant in the development of anti-
immigrant sentiments.
The results which I have found help support the evidence that previous authors have theorized
however since they were all included in a multivariate regression model I was able to look at a number
of prevailing theories and show that there is not one single variable that needs to be fixed to mitigate
the effects of anti-immigrant sentiments. Rather than a single variable or problem that needs
addressing to stem the formation of anti-immigrant sentiments, a multi-faceted approach is necessary.
These results can help policy makers and leaders develop comprehensive strategies that
focusing on increasing education and knowledge about the impact and level of immigration while also
encouraging cultural immersion to familiarize citizens with other peoples and cultures. Education, the
availability of information, threat to culture and economic threat could all be addressed through this
way. Since all of these variables have been found to be significant creating programs that only address
one aspect of an anti-immigrant sentiment will not be sufficient towards the goal of eradicating anti-
immigrant sentiments.
Furthering this research with data from North America, South America, Asia, and Africa could
bolster these findings and help policy makers around the world develop inclusive and fair policy. The
deep divide concerning immigration should not be politicized to the extent that it is but rather talked
about in an unbiased way which ensures the best for everyone. Immigration has always been around
and rather than trying to stop immigration we should look forward and see how integration and
openness could benefit the world. The high rate of immigration and refugees entering Europe should be
a wakeup call for politicians and rather than sparking fear and barring immigration, politicians should
seek to remedy the fear and anxiety that sparks anti-immigrant attitudes.
References:

Gombas 29
• "'10 attacks a day' against refugees, shelters in 2016." www.aljazeera.com, 27 Feb. 2017,
www.aljazeera.com/news/2017/02/attacks-day-refugees-shelters-2016-
170226170920171.html. Accessed 28 Feb. 2017.
• "Stockholm terror: Sweden will 'never go back' to mass immigration, PM reacts." foxnews.com,
FOX, 10 Apr. 2017, <www.foxnews.com/world/2017/04/10/stockholm-terror-sweden-will-
never-go-back-to-mass-immigration-pm-reacts.html.> Accessed 13 Apr. 2017.
• "The EU and the refugee crisis." www.europa.eu,
<publications.europa.eu/webpub/com/factsheets/refugee-crisis/en/>. Accessed 10 Feb. 2017.
• "Transatlantic Trends: Immigration." trends.gmfus.org 2010,
<trends.gmfus.org/files/archived/immigration/doc/TTI2010_English_Key.pdf>. Accessed 10 Dec.
2016.
• J. B., & Fertig, M. (2006). Identifying the Determinants of Attitudes Towards Immigrants - A
Structural Cross-Country Analysis. SSRN Electronic Journal. doi:10.2139/ssrn.929087
• Dearden, Lizzie. 2017. “Get out of France': Paris police tear gassing refugees and stealing
blankets in freezing conditions report reveals." Independent. 11 Feb
http://www.independent.co.uk, <www.independent.co.uk/news/world/europe/refugee-crisis-
paris-migrants-france-police-sleeping-bags-blankets-violence-refugee-rights-data-
a7575376.html.> Accessed 27 Feb. 2017.
• Hainmueller, Jens, and Daniel Hopkins. 2014. "Public Attitudes Toward Immigration." Annual
Review of Political Science, vol. 17, 10 Feb. 2014, pp. 225-49,
https://web.stanford.edu/~jhain/Paper/ARPS2014.pdf. Accessed 25 Feb. 2017
• HAINMUELLER, JENS, and MICHAEL J. HISCOX. 2010 “Attitudes toward Highly Skilled and Low-
Skilled Immigration: Evidence from a Survey Experiment.” The American Political Science Review,
vol. 104, no. 1, pp. 61–84. www.jstor.org/stable/27798540.

Gombas 30
• Hainmueller, Jens, and Michael J. Hiscox. 2007. “Educated Preferences: Explaining Attitudes
toward Immigration in Europe.” International Organization, vol. 61, no. 2, 2007, pp. 399–442.
www.jstor.org/stable/4498150.
• Haubert, Jeannie, and Elizabeth Fussell. 2006. “Explaining Pro-Immigrant Sentiment in the U.S.:
Social Class, Cosmopolitanism, and Perceptions of Immigrants.” The International Migration
Review, vol. 40, no. 3, 2006, pp. 489–507. www.jstor.org/stable/27645614
• Hopkins, Daniel J. and Sides, John and Citrin, Jack. 2016. The Muted Consequences of Correct
Information About Immigration. Available at SSRN: https://ssrn.com/abstract=2798622
• Jack Citrin , Donald P. Green , Christopher Muste , and Cara Wong. 1997. "Public Opinion
Toward Immigration Reform: The Role of Economic Motivations," The Journal of Politics 59, no.
3 (Aug., 1997): 858-881.
• Kiehne, Elizabeth. 2014. “Examining Predictors of Anti-Immigrant Sentiment.”
• Malchow-Møller, Nikolaj et al. 2009. “Explaining Cross-Country Differences in Attitudes Towards
Immigration in the EU-15.” Social Indicators Research, vol. 91, no. 3, 2009, pp. 371–390.
www.jstor.org/stable/27734840.
• Rustenbach, Elisa. “Sources of Negative Attitudes toward Immigrants in Europe: A Multi-Level
Analysis.” 2010. The International Migration Review, vol. 44, no. 1, 2010, pp. 53–77.
www.jstor.org/stable/20681745.
• Sides, John, and Jack Citrin. 2008. "Immigration and the Imagined Community in Europe and the
United States." Political Studies Association, vol. 56, no. 1, Mar. 2008, pp. 33-56,
onlinelibrary.wiley.com/doi/10.1111/j.1467-9248.2007.00716.x/abstract. Accessed 25 Feb.
2017.

Gombas 31
• Sides, John, and Jack Citrin. 2007. “European Opinion about Immigration: The Role of Identities,
Interests and Information.” British Journal of Political Science, vol. 37, no. 3, 2007, pp. 477–504.
www.jstor.org/stable/4497304.
• Sniderman, Paul, Louk Hagendoorn, and Markus Prior. 2004 "Predisposing Factors and
Situational Triggers: Exclusionary Reactions to Immigrant Minorities." American Political Science
Review, vol. 98, no. 1, Feb. 2004, pp. 35-49, https://www.cambridge.org/core/services/aop-
cambridge-core/content/view/S000305540400098X. Accessed 25 Feb. 2017.
• Womack, Helen. "Migrant crisis: Hungarian referendum off to a 'xenophobic'
start." http://www.smh.com.au, 17 Sept. 2016, www.smh.com.au/world/migrant-crisis/migrant-
crisis-hungarian-referendum-off-to-a-xenobophic-start-20160916-grhv47.html. Accessed 27 Feb.
2017.
Appendix:
A) Now, using this card, to what extent do you think [country] should allow people of the same
race or ethnic group as most [country] people to come and live here?

Gombas 32
B) How about people of a different race or ethnic group from most [country] people?
C) Is [country] made a worse or a better place to live by people coming to live here from other
countries?
D) And, using this card, would you say that [country]'s cultural life is generally undermined or
enriched by people coming to live here from other countries?
Frequency % of
Cases
Cultural life undermined
1549 3.9
Frequency % of Cases
Allow None 2633 6.6
Allow a Few 8672 21.6
Allow Some 18070 45
Allow Many 9804 24.4
Total 39179 97.5
Missing 1006 2.5
Frequency % of Cases
Allow None 5141 12.8
Allow a Few 12318 30.7
Allow Some 16207 40.3
Allow Many 5456 13.6
Total 39122 97.4
Missing 1063 2.6
Frequency % of Cases
Worse place to
live1705 4.2
1 1101 2.7
2 2403 6
3 3637 9.1
4 4015 10
5 11809 29.4
6 4087 10.2
7 4305 10.7
8 3340 8.3
9 1087 2.7
Better place to
live1175 2.9

Gombas 33
1 1016 2.5
2 2115 5.3
3 3154 7.8
4 3237 8.1
5 7899 19.7
6 4395 10.9
7 5888 14.7
8 5241 13
9 2087 5.2
Cultural life enriched
2252 5.6
E) On the whole how satisfied are you with the present state of the economy in [country]?
Frequency % of Cases
Extremely dissatisfied
2498 6.2
1 1592 4
2 3483 8.7
3 4811 12
4 4901 12.2
5 6451 16.1
6 5171 12.9
7 5074 12.6
8 3697 9.2
9 1161 2.9
Extremely satisfied
695 1.7
F) Which of the descriptions on this card comes closest to how you feel about your household's
income nowadays?
Frequency % of
Cases
Very Difficult 2146 5.3
Difficult 6506 16.2

Gombas 34
Coping 18364 45.7
Living comfortably
12793 31.8
G) What is the highest level of education you have successfully completed?
Frequency % of
Cases
Less than lower secondary
4085 10.2
Lower secondary
6760 16.8
Lower tier upper
secondary 7213 17.9
Upper tier upper
secondary 7094 17.7
Advanced vocational, sub-degre
5671 14.1
BA Level 4366 10.9
MA Level or higher
4730 11.8
H) Now I will briefly describe some people. Please listen to each description and tell me how much
each person is or is not like you. Use this card for your answer. Tradition is important to
her/him. She/he tries to follow the customs handed down by her/his religion or her/his family.
Frequency % of Cases
Not like me at all
1449 3.6
Not like me 3787 9.4
Gombas 35
A little like me
5577 13.9
Somewhat like me
8800 21.9
Like me 12132 30.2
Very much like me
7328 18.2
I) And again on an average weekday, how much of your time watching television is spent
watching news or programmes about politics and current affairs?
Frequency % of Cases
No time at all 3453 8.6
Less than .5 hour 11843 29.5
.5 hour to 1 hour 13360 33.2
More than 1 hour up to 1.5 hours
4978 12.4
More than 1.5 up to 2 hours
2165 5.4
More than 2 hours, up to 2.5
1002 2.5
More than 2.5 up to 3 hours
533 1.3
More than 3 hours 657 1.6
J) Question B29 crossed by Question A2
Question B29- Now, using this card, to what extent do you think [country] should allow people of the
same race or ethnic group as most [country] people to come and live here?
Question A2- And again on an average weekday, how much of your time watching television is spent
watching news or programmes about politics and current affairs?
Question A2 Total

Gombas 36
No Time at All < Than .5
Hour
.5 Hour to 1 Hour
>1 Hour up to 1.5 Hours
>1.5 Hours uo to 2 Hours
>2 Hours up to 2.5 Hours
>2.5 Hours up to 3 Hours >3 Hours
Allow None 375 754 762 307 120 65 43 73 2499
15.00% 30.20% 30.50% 12.30% 4.80% 2.60% 1.70% 2.90% 100.00%
Allow a Few 805 2579 2918 1072 490 230 115 169 8378
Question B29 9.60% 30.80% 34.80% 12.80% 5.80% 2.70% 1.40% 2.00% 100.00%
Allow Some 1354 5346 6313 2330 1005 431 230 240 17249
7.80% 31.00% 36.60% 13.50% 5.80% 2.50% 1.30% 1.40% 100.00%
Allow Many 818 2872 3061 1140 499 253 133 160 8936
9.20% 32.10% 34.30% 12.80% 5.60% 2.80% 1.50% 1.80% 100.00%
Total 3352 11551 13054 4849 2114 979 521 642 37062
9.00% 31.20% 35.20% 13.10% 5.70% 2.60% 1.40% 1.70% 100.00%
Relationship Between A2 and B29
Chi-square
211.737
Degrees of freedom
21
P-value
0
K) Question B29 crossed by Question F42
Question B29- Now, using this card, to what extent do you think [country] should allow people of the
same race or ethnic group as most [country] people to come and live here?
Question F42-Which of the descriptions on this card comes closest to how you feel about your
household's income nowadays?
Question F42 Total
Very Difficult Difficult Coping Living Comfortably
Allow None 379 659 1144 407 2589
14.60% 25.50% 44.20% 15.70% 100.00%
Allow a Few 547 1788 4354 1916 8605 Question B29 6.40% 20.80% 50.60% 22.30% 100.00%

Gombas 37
Allow Some 679 2527 8361 6352 17919
3.80% 14.10% 46.70% 35.40% 100.00%
Allow Many 463 1288 4083 3890 9724 4.80% 13.20% 42.00% 40.00% 100.00%
Total 2068 6262 17942 12565 38837 5.30% 16.10% 46.20% 32.40% 100.00%
L) Question B29 crossed by Question B21
Question B29- Now, using this card, to what extent do you think [country] should allow people of the
same race or ethnic group as most [country] people to come and live here?
Question B21- On the whole how satisfied are you with the present state of the economy in
[country]?
M) Question B29 crossed by Question F15
Question B29- Now, using this card, to what extent do you think [country] should allow people of the
same race or ethnic group as most [country] people to come and live here?
Question F15- What is the highest level of education you have successfully completed?
Relationship Between A2 and B29
Chi-square 211.737
Degrees of
freedom 21
P-value 0
Question B21 Total
Extremely
Dissatisfied 1 2 3 4 5 6 7 8 9
Extremely
Satisfied
Allow None 436 215 334 354 268 399 212 188 96 29 23 2554
17.10% 8.40% 13.10% 13.90% 10.50% 15.60% 8.30% 7.40% 3.80% 1.10% 0.90% 100.00%
Allow a Few 625 417 943 1244 1172 1511 1003 847 558 146 88 8554
Question B29 7.30% 4.90% 11.00% 14.50% 13.70% 17.70% 11.70% 9.90% 6.50% 1.70% 1.00% 100.00%
Allow Some 859 568 1394 2102 2275 2982 2573 2503 1781 547 298 17882
4.80% 3.20% 7.80% 11.80% 12.70% 16.70% 14.40% 14.00% 10.00% 3.10% 1.70% 100.00%
Allow Many 481 344 705 981 1067 1398 1306 1472 1205 418 267 9644
5.00% 3.60% 7.30% 10.20% 11.10% 14.50% 13.50% 15.30% 12.50% 4.30% 2.80% 100.00%
Total 2401 1544 3376 4681 4782 6290 5094 5010 3640 1140 676 38634
6.20% 4.00% 8.70% 12.10% 12.40% 16.30% 13.20% 13.00% 9.40% 3.00% 1.70% 100.00%
Relationship Between B21 and B29
Chi-square 1804.441
Degrees of
freedom 30
P-value 0

Gombas 38
Question F15 Total
< Lower
Secondary Lower
Secondary
Lower Tier Upper
Secondary
Upper Tier Upper
Secondary
Advanced Vocational Sub Degree
BA Level
>=MA Level
Allow None 554 613 557 440 242 119 92 2617 21.20% 23.40% 21.30% 16.80% 9.20% 4.50% 3.50% 100.00%
Allow a Few 1224 1713 1766 1672 1055 575 595 8600 Question B29 14.20% 19.90% 20.50% 19.40% 12.30% 6.70% 6.90% 100.00%
Allow Some 1527 2985 3339 3173 2704 2051 2185 17964 8.50% 16.60% 18.60% 17.70% 15.10% 11.40% 12.20% 100.00%
Allow Many 629 1239 1422 1612 1559 1534 1757 9752 6.40% 12.70% 14.60% 16.50% 16.00% 15.70% 18.00% 100.00%
Total 3934 6550 7084 6897 5560 4279 4629 38933 10.10% 16.80% 18.20% 17.70% 14.30% 11.00% 11.90% 100.00%
N) Question B29 crossed by Question Ha-u
Question B29- Now, using this card, to what extent do you think [country] should allow people of the
same race or ethnic group as most [country] people to come and live here?
Question Ha-u-Now I will briefly describe some people. Please listen to each description and tell me
how much each person is or is not like you. Use this card for your answer. Tradition is important to
her/him. She/he tries to follow the customs handed down by her/his religion or her/his family.
Question Ha-U Total
Not Like Me At
All Not Like
Me A Little Like Me
Somewhat Like Me Like Me
Very Much Like
Me
Allow None 85 191 281 496 777 677 2507 3.40% 7.60% 11.20% 19.80% 31.00% 27.00% 100.00%
Allow a Few 247 648 1029 1845 2833 1816 8418 Question B29 2.90% 7.70% 12.20% 21.90% 33.70% 21.60% 100.00%
Allow some 557 1746 2640 4189 5636 2958 17726 3.10% 9.80% 14.90% 23.60% 31.80% 16.70% 100.00%
Relationship Between F15 and B29
Chi-square 2173.286
Degrees of freedom 18
P-value 0

Gombas 39
Allow Many 528 1122 1506 2084 2594 1677 9511 5.60% 11.80% 15.80% 21.90% 27.30% 17.60% 100.00%
Total 1417 3707 5456 8614 11840 7128 38162 3.70% 9.70% 14.30% 22.60% 31.00% 18.70% 100.00%
Relationship Between HA-U and B29
Chi-square 528.284
Degrees of freedom 15
P-value 0