Embed Size (px)
Citation preview
DETERMINANT FACTORS OF TUNA CANNERIES PERFORMANCE IN INDONESIA AND THAILAND: A COMPARATIVE PERSPECTIVE
BY
MR. MUHAMMAD SHOBARUDDIN
A THESIS SUBMITTED IN PARTIAL FULFILLMENT OF THE REQUIREMENTS FOR THE DEGREE OF MASTER OF ARTS (ASIA-PACIFIC STUDIES)
THAMMASAT INSTITUTE OF AREA STUDIES THAMMASAT UNIVERSITY
ACADEMIC YEAR 2018 COPYRIGHT OF THAMMASAT UNIVERSITY
Ref. code: 25616066090108XWU

(1) Thesis Title DETERMINANT FACTORS OF TUNA CANNERIES
PERFORMANCE IN INDONESIA AND THAILAND: A COMPARATIVE PERSPECTIVE
Author Mr Muhammad Shobaruddin Degree Master of Arts (Asia-Pacific Studies) Major Field/Faculty/University Master of Arts (Asia-Pacific Studies)
Thammasat Institute of Area Studies Thammasat University
Thesis Advisor Assistant Professor Sunida Aroonpipat, Ph.D. Academic Year 2018
ABSTRACT
Since the 1970s, canned tuna industries have been proliferating in Southeast Asian countries, especially in Thailand and Indonesia. Thailand has remarkable performance in developing this industry instead of its competitors including Indonesia. This research mainly objected to comparing key factors influencing the competitiveness of tuna canneries based in Indonesia and Thailand. Diamond Models initiated by Michael Porter was adopted as a conceptual framework. Diamond Models analyzed competitive advantages of industries in a country, by analyzing internal factors, namely factor conditions; demand condition; related and supporting industries; and firm’s strategy and rivalry. Then, external factor measures government intervention and chance which determined by importers. By comparing both internal and external factors of competitive advantages, this work found that the major determinant factors of Thai tuna canneries development are raw materials access, strategic colocation, and effective government interventions. To foster the canned tuna industry’s competitiveness, Indonesia should learn from Thailand. Keywords: Tuna canneries, Diamond model, Competitive advantage, Indonesia, Thailand
Ref. code: 25616066090108XWU

(2)
ACKNOWLEDGEMENT
Alhamdulillah wa syukurillah. Thanks to Allah SWT with his mercies and blessings I can reach the point where I accomplished my Master Degree. Besides to my parents Mr. Zuhdi and Mrs. Rubi’ah, I would like to take this opportunity to express my deepest appreciation for the following respectful people and institution.
Firstly, I would like to express my sincere thanks and gratitude to my respectable advisor, Asst. Prof. Sunida Aroonpipat, Ph.D. for her generous supports and tireless guidances in motivating me to overcome the tough times and finish this Master thesis completely. In addition, I am thankful to my respected committee members, Assoc. Prof. Chanin Mephokee, Ph.D., and Assoc. Prof. Thamavit Terdudomtham, Ph.D., for their critical comments and important recommendations.
Secondly, I would like to express my appreciation to Asst. Prof. Suphat Suphachalasai, Ph.D., the Director of Master of Arts in Asia Pacific Studies (MAPS), Thammasat University for granting me this valuable scholarship. I also would like to send my thanks to the staffs, especially Phi Joy and Phi Zai who always assist me to solve my problems both in academic and non-academic life.
Thirdly, I am also thankful to all MAPS’s globally-recognized professors who help me to expand my knowledge and point of view toward the world. The last, I express million thanks to all of my beloved classmates for their great support and lesson.
Mr. Muhammad Shobaruddin
Ref. code: 25616066090108XWU

(3)
TABLE OF CONTENTS
Page ABSTRACT (1) ACKNOWLEDGEMENT (2) LIST OF TABLES (7) LIST OF FIGURES (8) LIST OF ABBREVIATIONS (9) CHAPTER 1 INTRODUCTION 1
1.1 Introduction 1
1.2 Research Questions 2
1.3 Research Objectives 2 CHAPTER 2 REVIEW OF LITERATURE AND METHODOLOGY 3
2.1 Literature Review 3
2.1.1 Introduction 3
2.1.2 Porter’s Diamond Model 3
2.1.3 Determinant Factor of Tuna Canneries Development 5
2.1.3.1 Factor Condition 5
2.1.3.2 Demand Condition 6
2.1.3.3 Related and Supporting Industries 7
2.1.3.4 Firm Strategy, Structure, and Rivalry 8
2.1.3.5 Chance 9
Ref. code: 25616066090108XWU
(4)
2.1.3.6 Government Intervention 10
(1) Import Tariff Duty 11
(2) Raw Tuna Import Quota 11
2.1.4 Conclusion 11
2.2 Conceptual Framework 12
2.3 Research Methodology and Scope 13
2.4 Tentative Thesis Chapter 14 CHAPTER 3 NTERNAL AND EXTERNAL FACTORS OF CANNED TUNA INDUSTRIES 15
DEVELOPMENT IN INDONESIA AND THAILAND
3.1 Overview of Tuna Canneries in Indonesia and Thailand 15
3.1.1 History of Tuna Canning Industry 15
3.1.2 Process Description of Canned Tuna 16 3.1.2.1 Preliminary operations 16 3.1.2.2 Processing 17 3.1.2.3 Final Operations 17 3.1.2.4 Auxiliary Operations 17
3.1.3 Development of Canned Tuna Industries in Indonesia 19 3.1.4 Development of Canned Tuna Industries in Thailand 23
3.2 Factor Condition 27 3.2.1 Indonesia 27
3.2.1.1 Labor Cost 27 3.2.1.2 Raw Material 27
3.2.2 Thailand 28 3.2.2.1 Labor Cost 28 3.2.2.2 Raw Material 29
3.3 Demand Condition 30 3.3.1 America 30 3.3.2 European Union 31 3.3.3 Japan 32
Ref. code: 25616066090108XWU

(5)
3.4 Related and Supporting Industries 33 3.4.1 Indonesia 33
3.4.1.1 Operating Tuna Vessels 33 3.4.1.2 Fisheries Facilities 35
3.4.2 Thailand 35 3.4.2.1 Operating Tuna Vessels 35 3.4.2.2 Supporting Facilities 38
3.5 Firm’s Structure, Strategy, and Rivalry 38 3.5.1 Structure 38
3.5.1.1 Canned tuna processors in Indonesia 38 3.5.1.2 Canned tuna processors in Thailand 40
3.5.1 Strategy 42 3.5.2 Rivalry 44
3.6 Chance 44 3.7 Government Intervention 46
3.7.1 Negotiation for Trade Agreement 46 3.7.2 Regulating Raw Material Access 46
3.8 Conclusion 47 CHAPTER 4 FINDINGS AND ANALYSES: THE INFLUENCE OF INTERNAL AND 48
EXTERNAL FACTORS TOWARD COMPETITIVE ADVANTAGE OF CANNED TUNA INDUSTRIES IN INDONESIA AND THAILAND
4.1 Comparison in Factor Conditions 48 4.2 Comparison in Demand Condition 50 4.3 Comparison in Related and Supporting Industry 54 4.4 Comparison in Firm’s Structure, Strategy, and Rivalry 56 4.5 Comparison in Chances 59
4.5.1 European Union 60 4.5.2 United States 60 4.5.3 Japan 61
Ref. code: 25616066090108XWU

(6)
4.6 Comparison in Government Intervention 62 4.6.1 Negotiating import tariff duty 62 4.6.2 Policy of raw tuna import 65
4.7 Analysis 66 4.7.1 Fishing 66 4.7.2 Processing 67 4.7.3 Export Distribution 69
4.8 Conclusion 72 CHAPTER 5 CONCLUSIONS AND RECOMMENDATIONS 73
5.1 Conclusions 73 5.2 Recommendations 76
REFERENCES 77 BIOGRAPHY 82
Ref. code: 25616066090108XWU
(7)
LIST OF TABLES
Tables Page 3.1 Indonesian canned tuna export 2006-2016 22 3.2 Thai canned tuna export 2006-2016 25 3.3 Indonesian captured tuna from 2011 to 2016. 28 3.4 Wage per hour among canned tuna producers 29 3.5 Fresh/frozen tuna imported by Thailand (2012-2016) 29 3.6 American import of canned tuna 31 3.7 Canned tuna imported by 5 selected EU countries. 32 3.8 Japanese imported canned tuna 33 3.9 Operating tuna vessels in Indonesia 34 3.10 Fishing Port in Indonesia 35 3.11 Domestic tuna vessels of Thailand 36 3.12 Foreign tuna vessels landing in Phuket, Thailand 37 3.13 Indonesian tuna canneries 39 3.14 Three major tuna canneries in Thailand 40 3.15 Revenue and market shares of tuna canneries in Thailand 41 3.16 List of standards enacted by the three major canned tuna importers 45 3.17 List of tariff rates imposed by the three canned tuna importers 46 4.1 Canned tuna traded inflow by three major importers 50 4.2 Fishing Port in Indonesia 55
Ref. code: 25616066090108XWU

(8)
LIST OF FIGURES Figures Page
2.1 Diamond Model of Michael Porter (1990) 12 3.1 Canning fish production process 18 3.2 Indonesian canned tuna exported product 23 3.3 Thai canned tuna exported products 26 4.1 Comparison of canned tuna export in the American market 51 4.2 Comparison of canned tuna export in the EU market 52 4.3 Comparison of canned tuna export in the Japanese market 53 4.4 Indonesian canned tuna production chains 71 4.5 Thai canned tuna production chains 71
Ref. code: 25616066090108XWU

(9)
LIST OF ABBREVIATIONS
Symbols/Abbreviations Terms APIKI ASEAN ASTUIN BPS C CCSBT DGCF EEZ EU FAO FDI FTA GHPs GSP HACCP HOL IEU-CEPA IJEPA ILO IMF IMFB IOT
Asosiasi Pengusaha Ikan Kaleng Indonesia Association of Southeast Asian Nations Asosiasi Industri Tuna Indonesia Badan Pusat Statistik Celcius Commission for the Conservation of Southern Bluefin Tuna Directorate General of Capture Fisheries Exclusive Economic Zone European Union Food Agricultural Organization Foreign Direct Investment Free Trade Agreement Good Hygiene Practices Generalized System of Preference Hazard Analysis and Critical Control Point High Organic Load Indonesia-European Union Comprehensive Economic Partnership Agreement Indonesia-Japan Economic Partnership Agreement International Labor Organizations International Monetary Fund Indonesian Marine Fisheries Book Indian Ocean Tuna
Ref. code: 25616066090108XWU

(10) Symbols/Abbreviations Terms IUU JTEPA KTN LOL MMAF MoU MT NLFS NTB PIC PPML RFMOs RoO SIMP SPS UK UN Comtrade UNCLOS US WCPO WWTP
Illegal, Unregulated, and Unreported Japan-Thailand Economic Partnership Agreement Komite Tuna Nasional Low Organic Load Ministry of Marine and Fishery Memorandum of Understanding Metric Ton National Labor Forces Survey Non-Tariff Barriers Pacific Island Countries Poison Pseudo Maximum Likelihood Regional Fisheries Management Organizations Rules of Origin Sanitary and Pre-Sanitary the Western and Central Pacific Ocean United Kingdom United Nations Commercial Trade United Nations Convention of the Law on the Sea United States Western and Central Pacific Ocean Waste Water Treatment Plant
Ref. code: 25616066090108XWU
1
CHAPTER 1 INTRODUCTION
1.1 Introduction
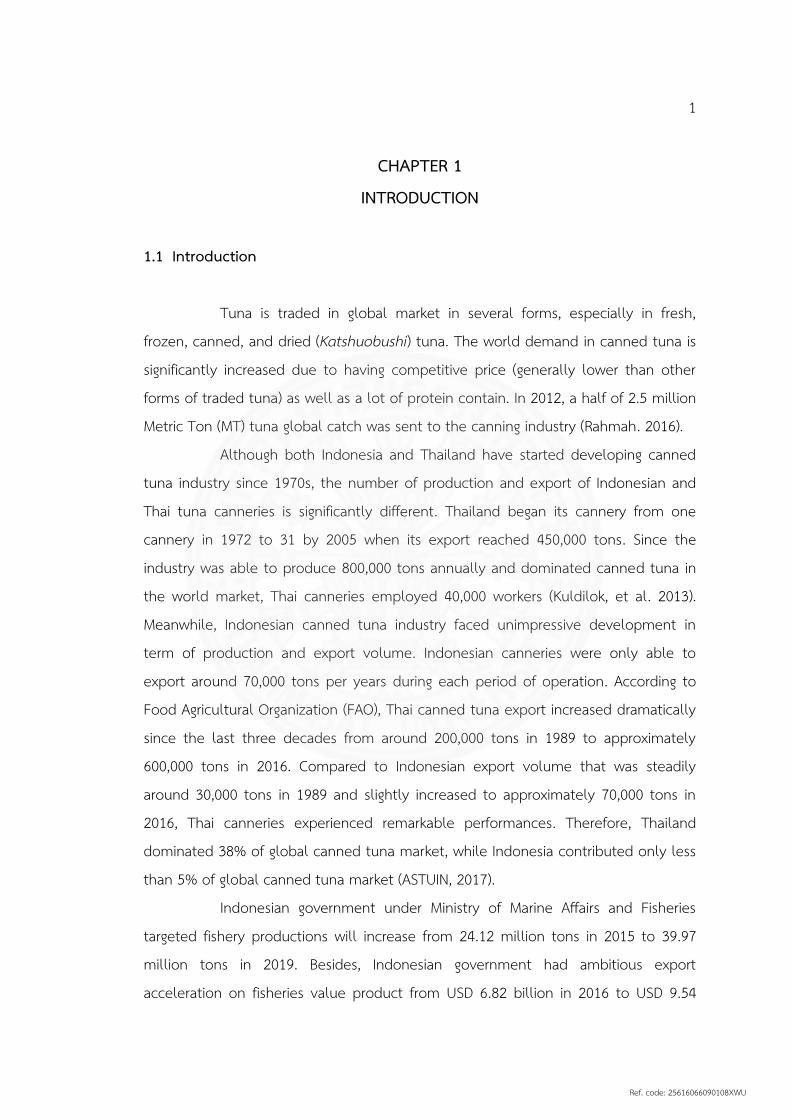
Tuna is traded in global market in several forms, especially in fresh,
frozen, canned, and dried (Katshuobushi) tuna. The world demand in canned tuna is significantly increased due to having competitive price (generally lower than other forms of traded tuna) as well as a lot of protein contain. In 2012, a half of 2.5 million Metric Ton (MT) tuna global catch was sent to the canning industry (Rahmah. 2016).
Although both Indonesia and Thailand have started developing canned tuna industry since 1970s, the number of production and export of Indonesian and Thai tuna canneries is significantly different. Thailand began its cannery from one cannery in 1972 to 31 by 2005 when its export reached 450,000 tons. Since the industry was able to produce 800,000 tons annually and dominated canned tuna in the world market, Thai canneries employed 40,000 workers (Kuldilok, et al. 2013). Meanwhile, Indonesian canned tuna industry faced unimpressive development in term of production and export volume. Indonesian canneries were only able to export around 70,000 tons per years during each period of operation. According to Food Agricultural Organization (FAO), Thai canned tuna export increased dramatically since the last three decades from around 200,000 tons in 1989 to approximately 600,000 tons in 2016. Compared to Indonesian export volume that was steadily around 30,000 tons in 1989 and slightly increased to approximately 70,000 tons in 2016, Thai canneries experienced remarkable performances. Therefore, Thailand dominated 38% of global canned tuna market, while Indonesia contributed only less than 5% of global canned tuna market (ASTUIN, 2017).
Indonesian government under Ministry of Marine Affairs and Fisheries targeted fishery productions will increase from 24.12 million tons in 2015 to 39.97 million tons in 2019. Besides, Indonesian government had ambitious export acceleration on fisheries value product from USD 6.82 billion in 2016 to USD 9.54
Ref. code: 25616066090108XWU

2
billion in 2019 (Indonesian Marine and Fisheries Book, 2017). According to this information, author is interested to focus on canned tuna industries development in Indonesia since this commodity is important to Indonesian fisheries as well as possessing higher export value. In addition, tuna had significantly contributed to Indonesian national income, it becomes second largest exporting fisheries commodity after shrimp with export value more than 406 million USD in 2016 (IMFB, 2017).
By comparing Indonesian and Thai tuna canneries development, this study will be important to find factors which are influencing tuna canneries acceleration in both countries. Moreover, Thailand who leads global canned tuna market is an appropriate role model for Indonesia to boost its canned tuna industries. This research will utilize Diamond Model of Michael Porter (1990) as guidance in explaining competitive advantages of canned tuna processors in both analyzed nations.
1.2 Research Questions
This research mainly attempts to answer about how the internal and
external factors of competitive advantages influence tuna canneries development in Indonesia and Thailand?
1.3 Research Objectives
This research objected to: 1.3.1 To analyze the internal determinant factors which have influence
to the competitiveness of canned tuna industries in Indonesia and Thailand. 1.3.2 To analyze the external determinant factors which have influence
to the competitiveness of canned tuna industries in Indonesia and Thailand. 1.3.3 To compare the internal and external determinant factors affecting
the competitiveness of canned tuna industries in Indonesia and Thailand.
Ref. code: 25616066090108XWU

3
CHAPTER 2 REVIEW OF LITERATURE AND METHODOLOGY
2.1 Literature Review
2.1.1 Introduction
There are a lot of scholars who researched the performance of tuna canneries especially in Indonesia and Thailand since these two countries significantly contribute to canned tuna trade in global market. This literature review is composed by 5 points that begins with introduction. The second point explains competitive advantage of nation from Porter’s diamond model perspective. The following point is discussion about determinant factors of canneries development. Then it will be continued by additional determinant factors which possess external influences. The last part of literature review summarizes all points.
2.1.2 Porter’s Diamond Model Diamond model was introduced by Michael E. Porter (1990) to
measure industrial competitiveness in a certain country. In order to gain competitiveness, an industry must possess competitive advantages in the form of either lower production cost or differentiated product that leads to premium price. In the other words, competitive advantage is the firm’s ability in producing goods or services which are cheaper or better than its competitors. Then, to sustain the advantages, firm must achieve more competitive advantages through providing higher quality product or service and producing it more efficiently.
Diamond model measures the competitive advantage of industry mainly influenced by four determinant factors. Firstly, factor condition; measuring nation capabilities in providing factor of production such as skilled worker and infrastructure which are crucial in promoting industrial development. Secondly, demand condition which calculating domestic demand toward company’s product or services. Thirdly, related and supporting industries; the availability or unavailability of supplier industries or related industries in the country which are globally
Ref. code: 25616066090108XWU

4
competitive. Fourthly, firm strategy, structure, and rivalry; the conditions in the nation about how government stakeholder establish, organize, and manage firms, as well as domestic competition level. In addition, diamond model perspective measures two external factors which also influence national competitive advantage, namely chance and government intervention.
Porter speculated that competitive advantages defined as firm ability in making product in more efficient way instead of its competitors. Companies obtain competitiveness when (1) their domestic headquarter allows and supports the most rapid accumulation of specialized assets and skills, (2) their domestic headquarter provides appropriate information and knowledge towards products and process requirements, and (3) all parties including owners, managers, and employees have the same objectives to support intense commitment and sustained investment (Porter, 1990).
Those competitive indicators are resulted from four internal and two external factors which interconnected each other. The diamond model is a mutually reinforcing system. One of the determinant factors will significantly influence contingent of the others. To illustrate, demand condition will not impact to competitiveness unless the firm’s rivalry is sufficient to cause firms to respond them. Advantage in a determinant enables to create or boost advantages in others. Advantage in every determinant is not prerequisite for firm’s competitiveness. Instead, the linkages of advantages in many determinants impact on self-reinforcing benefits which hinder foreign rivals to nullify or replicate it.
The two external factors, namely chance and government intervention are also crucial in this system. Chance comes from development outside the control of company, such as pure inventions, breakthrough in basic technologies, wars, external political development, and major shift in foreign demand. Chance creates unsustainability that can alter or reshape structure of company and allow one nation’s company to replace another’s. They have held an essential role in shifting competitive advantages in many industries.
The other external factor that can influence firm’s competitiveness is government. Government can improve or detract from the national advantages.
Ref. code: 25616066090108XWU
5
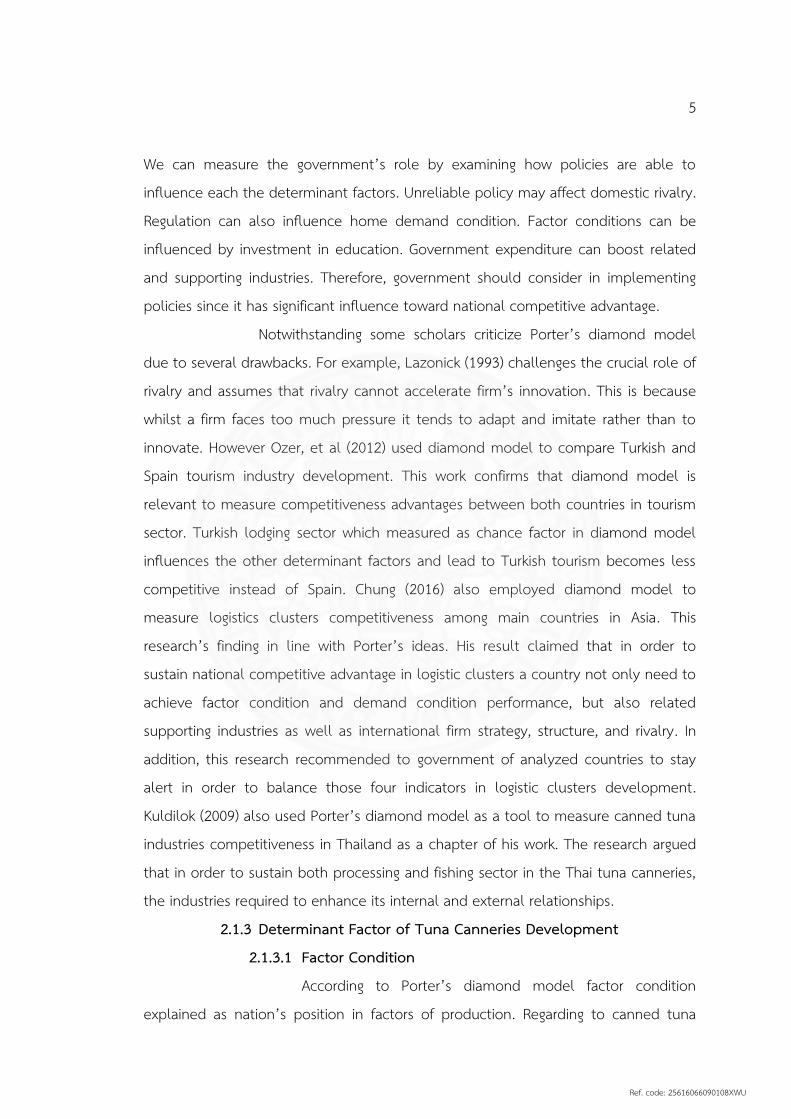
We can measure the government’s role by examining how policies are able to influence each the determinant factors. Unreliable policy may affect domestic rivalry. Regulation can also influence home demand condition. Factor conditions can be influenced by investment in education. Government expenditure can boost related and supporting industries. Therefore, government should consider in implementing policies since it has significant influence toward national competitive advantage.
Notwithstanding some scholars criticize Porter’s diamond model due to several drawbacks. For example, Lazonick (1993) challenges the crucial role of rivalry and assumes that rivalry cannot accelerate firm’s innovation. This is because whilst a firm faces too much pressure it tends to adapt and imitate rather than to innovate. However Ozer, et al (2012) used diamond model to compare Turkish and Spain tourism industry development. This work confirms that diamond model is relevant to measure competitiveness advantages between both countries in tourism sector. Turkish lodging sector which measured as chance factor in diamond model influences the other determinant factors and lead to Turkish tourism becomes less competitive instead of Spain. Chung (2016) also employed diamond model to measure logistics clusters competitiveness among main countries in Asia. This research’s finding in line with Porter’s ideas. His result claimed that in order to sustain national competitive advantage in logistic clusters a country not only need to achieve factor condition and demand condition performance, but also related supporting industries as well as international firm strategy, structure, and rivalry. In addition, this research recommended to government of analyzed countries to stay alert in order to balance those four indicators in logistic clusters development. Kuldilok (2009) also used Porter’s diamond model as a tool to measure canned tuna industries competitiveness in Thailand as a chapter of his work. The research argued that in order to sustain both processing and fishing sector in the Thai tuna canneries, the industries required to enhance its internal and external relationships.
2.1.3 Determinant Factor of Tuna Canneries Development 2.1.3.1 Factor Condition
According to Porter’s diamond model factor condition explained as nation’s position in factors of production. Regarding to canned tuna
Ref. code: 25616066090108XWU

6
industries, Campling and Doherty (2007) compared labor cost in some canned tuna exporters. According to the research, Thai canneries have better competitiveness in term of labor cost at around US$0.65 per hour, whereas Mauritius and the Seychelles at around US$0.90 and US$1.90 respectively. This research found that low labor cost accelerated canned tuna industries development in Thailand. The lower labor cost meaning that production cost should be lower and lead to more competitive price of product.
This finding was supported by Kuldilok, et al. (2013) which argued that low labor cost becomes the key competitive advantages of Thai tuna canneries. Compared to the other competitors by citing the data from ILO (2003), labor wages in Thai was around US$152 per month, this is lower than labor wages in the other canned tuna exporters such as Spain (US$1,829), Ecuador (US$332), Seychelles (US$523), and the Philippines (US$230). However Kuldilok, et al. mentioned that Indonesia was the only canned tuna exporter which had lower labor cost rather than Thailand, it was around US$94 per month.
Another aspect categorized as production factors in canned tuna development is frozen tuna. Julintron, A. and Chalatrawat, S. (2007) explained that Thailand imported approximately 82% of raw tuna materials, while the rest at around 18% is relied of local vessel caught. Aramwatananont (2010) cited that Thai canneries accessed raw tuna materials mainly from fleets operated in the Western and Central Pacific Ocean (WCPO) such as Taiwan, South Korea, United States, and Vanuatu. Indian Ocean Tuna (IOT) stated that the average share for Skipjack/Yellowfin in the cost of the final canned tuna was around 46%. Consequently, the lower raw tuna price will enable the canneries to have better competitive advantages of production cost and vice versa.
2.1.3.2 Demand Condition Porter argued that composition of domestic demand
determines how industry perceive, interpret, and respond to consumer’s needs. Countries obtain competitiveness in industry or industry segments where the domestic demand enables domestic industries a clearer and earlier picture of
Ref. code: 25616066090108XWU

7
consumer’s needs than external competitor can obtain. Nevertheless, Porter explained that demand may come from domestic or global demand.
In term of canned tuna particularly in Indonesia and Thailand domestic demand is less influencing since the industry concerned to foreign market or export oriented. According to UN Comtrade complied by ASTUIN (2016) Indonesian canned tuna product mostly are served to foreign market, such as Saudi Arabia, Japan, the United States, and the United Kingdom. Thai canned tuna product mostly also supplies to global market, particularly in America, Egypt, Australia, European Union, and Japan (FAO, 2016). Although the majority of canned tuna consumers mainly in America, Australia, Canada Egypt, European Union, and Japan. Nevertheless, the majority of canned tuna products are produced by six major exporters, namely Thailand, Ecuador, Spain, China, Indonesia, and Mauritius (FAO, 2016).
In addition, Campling (2015) assessed emerging alternative canned tuna market for canned tuna exporters from Pacific Island Countries (PIC). Campling measured potency of alternative canned tuna market include Australia, China, Japan, Latin America, Middle East and North Africa, South Africa, and Russia. This research analyzed 5 factors: dynamic of market demand, existing suppliers, tariff and duty preferences available to PICs, non-tariff measures, and freight cost, found that no clear market opportunity was apparent for PIC exporters. Campling measured that future global demand of canned tuna will likely start from Middle East, Latin America, and Eastern Europe. The new comer markets that continuously increased allow canned tuna exporters to expand their market as well as boost its production and selling which enhance competitiveness.
2.1.3.3 Related and Supporting Industries Porter assumed that the presence of competitive industries
in a country that are related often promotes new competitive industries. In term of canned tuna industries, can industries become crucial that determine the competitiveness of canned tuna processors. Campling and Doherty investigated can price in Mauritius, the Seychelles, and Thailand and found that can price in Thailand was 25% cheaper than in Mauritius and the Seychelles. This impact to price
Ref. code: 25616066090108XWU
8
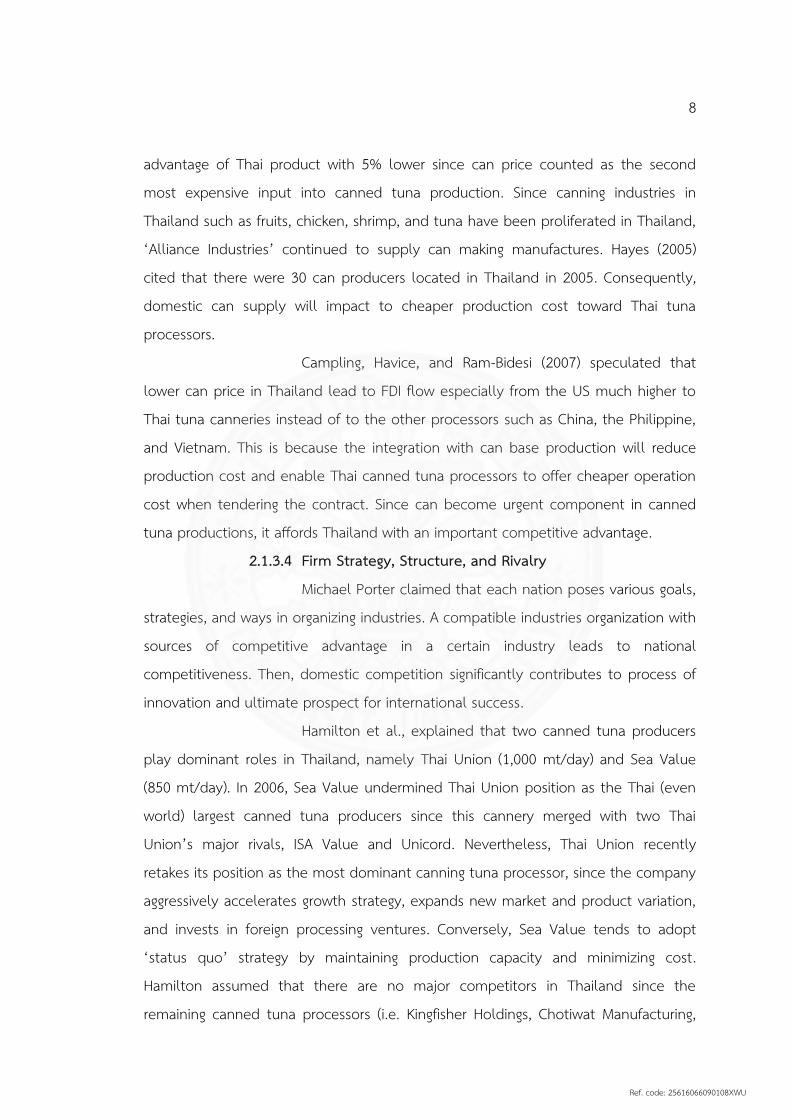
advantage of Thai product with 5% lower since can price counted as the second most expensive input into canned tuna production. Since canning industries in Thailand such as fruits, chicken, shrimp, and tuna have been proliferated in Thailand, ‘Alliance Industries’ continued to supply can making manufactures. Hayes (2005) cited that there were 30 can producers located in Thailand in 2005. Consequently, domestic can supply will impact to cheaper production cost toward Thai tuna processors.
Campling, Havice, and Ram-Bidesi (2007) speculated that lower can price in Thailand lead to FDI flow especially from the US much higher to Thai tuna canneries instead of to the other processors such as China, the Philippine, and Vietnam. This is because the integration with can base production will reduce production cost and enable Thai canned tuna processors to offer cheaper operation cost when tendering the contract. Since can become urgent component in canned tuna productions, it affords Thailand with an important competitive advantage.
2.1.3.4 Firm Strategy, Structure, and Rivalry Michael Porter claimed that each nation poses various goals,
strategies, and ways in organizing industries. A compatible industries organization with sources of competitive advantage in a certain industry leads to national competitiveness. Then, domestic competition significantly contributes to process of innovation and ultimate prospect for international success.
Hamilton et al., explained that two canned tuna producers play dominant roles in Thailand, namely Thai Union (1,000 mt/day) and Sea Value (850 mt/day). In 2006, Sea Value undermined Thai Union position as the Thai (even world) largest canned tuna producers since this cannery merged with two Thai Union’s major rivals, ISA Value and Unicord. Nevertheless, Thai Union recently retakes its position as the most dominant canning tuna processor, since the company aggressively accelerates growth strategy, expands new market and product variation, and invests in foreign processing ventures. Conversely, Sea Value tends to adopt ‘status quo’ strategy by maintaining production capacity and minimizing cost. Hamilton assumed that there are no major competitors in Thailand since the remaining canned tuna processors (i.e. Kingfisher Holdings, Chotiwat Manufacturing,
Ref. code: 25616066090108XWU

9
Co., Tropical Canning, Pattaya Food Industries) only able to produce around 300 mt/day.
Unlike Thailand whose canned tuna processors are dominated by two major canneries, Indonesian tuna canneries possess equal production capacity approximately 5,000 to 30,000 mt per annum for major 6 processors and 1,000 to 6,000 mt per annum for minor processors (Hamilton, 2011). Campling, Havice, and Ram-Bidesi (2007) argued that Indonesian tuna canneries split up across the country increase transshipment cost between processors and market access. Meanwhile, Thai tuna canneries which concentrated in Bangkok as industrial cluster provide the processors with very competitive sea-freight rates. Moreover, the development of specialized container terminal improves efficiencies in the loading and offloading of vessels.
2.1.3.5 Chance Porter speculated that chance hold crucial roles in
determining national competitive advantage due to its ability to create unsustainability that enables to shift competitive position. Chance can erode the advantage of existing rivals and create the potential that a new nation industry can replace them to obtain competitive advantage in response to novel and different condition. According to this definition, non-tariff barrier (NTB) measurement / standard becomes external factor that influence tuna canneries development.
Campling and Doherty’s research revealed that the EU authorities alleged that Thai canned tuna product mostly failed to comply EU Sanitary and Pre-Sanitary (SPS) requirement, it means that tuna raw materials processed by Thai canneries caught by unreliable vessels. This information is supported by Greenpeace (2016), it confirmed that some of Southeast Asian tuna canneries failed to comply traceability and sustainability procedure in accessing raw materials. The research was conducted in some major tuna canneries in Indonesia, Thailand and the Philippine.
This comparative survey work aimed to measure sustainability and traceability in accessing raw materials on the canneries in those three major canned tuna exporters in ASEAN. More than two-third of the largest tuna
Ref. code: 25616066090108XWU

10
canneries in Indonesia, Thailand, and the Philippine involved to this survey which lead to higher degree of communication and more corroboration data provided. According to the research survey, the top 12 tuna canneries in Thailand, the major 16 tuna canneries in Indonesia, as well as the biggest nine canned tuna companies in the Philippine failed to reach ‘good category’ with a score of 70/100 or higher. Thus, this work suggests that major canned tuna companies in Southeast Asia (Indonesia, Thailand, and the Philippine) possess similar challenges in term of sustainability and traceability which need future trajectory in order to protect marine ecosystem and environment.
The failures in complying traceability and sustainability access in obtaining raw tuna encouraged some canned tuna importers enacted stricter standards toward imported canning tuna product which influence the trade volume of this commodity. Rahmah (2016) researched trade flows and the impact of standard imposition towards three major canned tuna exporters in Asia, namely Indonesia, Thailand, and the Philippine. This research employs annual export value of tuna from those three countries to 50 export destination countries from 2000 to 2013. According to the result from gravity analysis with Poison Pseudo Maximum Likelihood (PPML) method the stricter standard imposition reduces canned tuna trade flow from those three countries.
Julintron & Chalatarawat (2007) researched the impact of rules of origin (RoO) to Thai seafood industry found that restrictive RoO may enforce company to use raw materials from more sustainable and traceable sources. Consequently, it will increase production cost and reduce firm’s competitiveness, then at the same time diminish consumer’s welfare.
2.1.3.6 Government Intervention According to Porter’s diamond model, government
intervention also contributes to national competitive advantage. Porter speculated that government can intervene (and be intervened by) each of the four internal determinants either positively or negatively.
Ref. code: 25616066090108XWU
11
(1) Import Tariff Duty In canned tuna industries, government’s roles in negotiating
import tariff duty become crucial factor which determine tuna canneries development. Campling (2015) found that tariff duty significantly benefits to canned tuna exporter to boost the export volume and value in Japanese market. The most two competitive canned tuna exporters, namely Thailand and Philippine already have preferential tariff to Japanese market. Canned tuna exported by Thai processors dominated Japanese market due to zero tariff duty for this product under Japan Thailand Economic Partnership Agreement (JTEPA) implemented in 2007. Then, Philippine enjoys preferential tariff of 1.2% of canned yellow fin and tuna loins. Meanwhile, Indonesia as the other canned tuna exporter to Japan is imposed 7.5% tariff costs. Campling assumed that various tariff duty significantly influenced export volume and value from canned tuna producer to Japan. The elimination of import tariff will accelerate demand condition of canned tuna product and impact to higher price competitiveness than its rivals.
(2) Raw Tuna Import Quota Hamilton, et al researched that one of determinant factors
of massive Thai tuna canneries development is Thai government policy in allowing raw tuna imports. In the absence of sizeable domestic purse seine fishing fleet, Thai government allows Thai canneries to import frozen tuna from the other country that enables canneries produce canned tuna as much as their capacity. Unlike Thai government, Indonesian government as cited by Ginoga (2017) allows domestic tuna canneries import raw materials 20% of total production capacity. As a result, some Indonesian canneries are able to produce only 50% of their total capacity. The lower raw tuna reservoir leads to lower production capacity of canned tuna processors and influence industry competitiveness to serve demand.
2.1.4 Conclusion According to diamond model initiated by Michael Porter, national
competitive advantage influenced by four major factors and two additional external factors which interconnected each other. In case of canned tuna industry, existing related researches revealed that Indonesian and Thai tuna canneries possess
Ref. code: 25616066090108XWU

12
similarities as well as differences of competitive advantages. However, there is no specific work which comprehensively scrutinized tuna canneries development in Indonesia and Thailand.
2.2 Conceptual Framework
Fundamentally, this conceptual framework introduces diamond model to
analyze the competitiveness of canned tuna industries based in Indonesia and Thailand in systematic and comprehensive way. The figure below depicts how each determinant factor interconnected each other and leads to competitive advantage of a company.
Figure 2.1 Diamond Model of Michael Porter (1990)
Ref. code: 25616066090108XWU

13
2.3 Research Methodology and Scope
This study designed in a qualitative method in order to investigate the factors influencing canned tuna industries development in Indonesia and Thailand by comparing determinant factors of canneries development in both countries using porter’s diamond model. There are several reasons why author interests to compare tuna canneries in Indonesia and Thailand. Firstly, both Indonesia and Thailand started tuna canning industries in the same period (1970s). However, both countries have different performances in term of production and export volume. Secondly, Indonesia and Thailand possess similar comparative advantages in terms of low labor cost in this industrial sector. The last, as ASEAN members both countries involved multilateral free trade agreement with ASEAN’s trading partners. Besides, both countries conducted bilateral Free Trade Agreement (FTA) with major canned tuna importers such as Japan and Australia. Those reasons confirm that comparing tuna canneries development in Indonesia and Thailand should be relevant.
This work specifically analyzed the competitive advantages of both canned tuna producers in 10 years period of time between 2008 and 2017. This is due to several reasons. The first, European Union as major importer started imposing Generalized System of Preference Plus in 2007 toward canned tuna product from the two analyzed countries which significantly impact to canned tuna traded flow into the EU (Campling & Doherty, 2007). The second, both countries officially ratified Free Trade Agreement particularly with Japan in 2007 which should be positively influence the competitiveness of canned tuna product (Rahmah, 2016). Lastly, the availability of information and data about canned tuna which were produced and traded by Indonesia and Thailand.
The research mainly utilized the secondary data through a library research approach, including Indonesian Marine Fishery Book (IMFB), Food Agricultural Organization (FAO), International Monetary Fund (IMF), Indonesian Tuna Association Industries (ASTUIN), Thammasat University e-Journals Library and online news or articles. In additions, the data collection also obtained from interview with industrial experts and government officers. Nonetheless, author will conduct direct or indirect
Ref. code: 25616066090108XWU

14
interview to the informants due to the author’s limited budget and research period. Therefore, some informants located outside Thailand will be interviewed by email or the other online communication tools.
The scope of study focused on the comparison of determinant factors behind canned tuna industries development in Indonesia and Thailand. The determinant factors obtained based on diamond model perspective of Michael Porter.
2.4 Tentative Thesis Chapter
This thesis will proceed as follow Chapter 1 :
a. Introduction b. Research Questions c. Research Objectives
Chapter 2 : a. Literature Review b. Conceptual Framework c. Research Methodology
Chapter 3 : Internal and external factors of canned tuna industries development in Indonesia and Thailand
Chapter 4 : The influence of internal and external factors toward competitive advantage of canned tuna industries in Indonesia and Thailand
Chapter 5 : Conclusion
Ref. code: 25616066090108XWU
15
CHAPTER 3 INTERNAL AND EXTERNAL FACTORS OF CANNED TUNA INDUSTRIES
DEVELOPMENT IN INDONESIA AND THAILAND 3.1 Overview of Tuna Canneries in Indonesia and Thailand
This chapter explains about the internal and external factors of tuna
canneries based in Indonesia and Thailand. Initially, the general overview of canned tuna industries in both analyzed countries are provided.
3.1.1 History of Tuna Canning Industry
In 1822, the first Sardine cannery was established in France. Then the French company started to expand their production in Portugal, Algeria, Spain, and Morocco in the 1860s and 1870s (Miyake, et al., 2010). During the 1880s and the 1900s, the sardine canneries faced a short supply of raw materials. Therefore, they began to use tuna albacore since 1860s as their canning material product (Miyake, et al.).
Spanish canned tuna processors also started to use albacore in the beginning of 20th century. The expansion of tuna canneries commenced when Spain tuna fishing vessels were developed in the late 1960s to early 1970s. The industry propagated in line with the development of the purse seine fishery and currently Spain is one of the few European countries whose major tuna canneries still operated (Miyake, et al.).
In 1917, American company commenced canning operation in Hawaii where the packed Bigeye and Pacific Bluefin are produced. Then tuna canneries had expanded to the Atlantic coast and the Pacific Northwest (United States Department of Labor, 2003, Miyake, et al.). When baitboat tuna fishing faced rapid development in the 1950s, the west coast tuna canning production significantly increased in the following two decades. During that time, canned light meat tuna (any tuna species except albacore) was traded as a low-priced replacement for
Ref. code: 25616066090108XWU
16
canned salmon and then promoted as low fat and healthy protein dietary. Unfortunately, the US tuna canneries experienced “low cost competition” in terms of labor wages from Japan in 1970 and later from Thailand and other Asian states (Miyake, et al.). Consequently, American tuna canneries moved their production to low labor cost countries such as Southeast Asian countries.
Between 1990 and 2001, almost all of canned tuna processors based in the US and Puerto Rico closed down caused by high labor cost and withdrawal of the US fishing fleet operated in the Eastern Pacific Ocean due to high operation costs as well as problem with dolphin mitigation (Miyake, et al.). As a result, some Southeast Asian countries like Indonesia, Thailand, and the Philippines replaced American canning processors bases as the new major canned tuna processors.
3.1.2 Process Description of Canned Tuna Generally canned fish production is classified into the following
four main stage processes (Bugallo et al., 2013); 3.1.2.1 Preliminary operations
First of all, raw tuna is checked at the reception. The raw materials can be received either in fresh or frozen form, before it will be stored in refrigerated rooms. In order to maintain the flesh as in a normal condition, frozen fish needs to be thawed before processing to get the optimum cutting temperature. Then, it is transferred to the washing process, where the fish de-headed, cut, and eviscerated, either manually or automatically. Some small fish undergoes chemical peeling to erode the skin and improve the taste of the final product.
After the raw materials have been prepared, it will be washed to remove unimportant components. Then, raw materials are cooked in metallic grills. Labeling and suitable storage are required for ingredients according to the reception date. For the next step, the ingredients are mixed in the heating tank
(at 80-90C) for trimming process. When the mixtures are ready, it is moved to the filling line dispensers. Empties are properly stored, while not required and are washed before using.
Ref. code: 25616066090108XWU

17
3.1.2.2 Processing During processing step, cooking becomes the most crucial
treatment since it can alter texture, color, and moisture content of the product. Raw
materials are usually cooked at 90-100C and atmospheric pressure around 45-60 minutes for slices and 120-180 minutes for full pieces. Then, the cooked product should be washed and cooled, which may take several hours. Refrigeration may be used to reduce the cooling time. After that, unwanted parts such as head, fins, and bones are removed by hand. Meanwhile the pieces are cut or chopped for canning.
The further stage is fish canning and trimming additions. Canning takes place when the raw materials reach a suitable temperature. Then, trimming additions are made regarding to different types of covering liquids such as vegetable oils, brine, sauces, vinegar, and other additional materials through a dosing vacuum machine.
3.1.2.3 Final Operations In the final step, tins are vacuum-packed and sealed. After
that it needs to be washed, sterilized, cooled, washed and dried. Lastly, tins are packed and stored until delivery.
3.1.2.4 Auxiliary Operations Auxiliary operations are composed of these activities; first,
cleaning and maintenance to ensure the facilities are in healthy and safe conditions. Second, washroom services should be provided for staff of the installation. Third, boiler and heating services to produce the steam are required in cooking and in sterilization. Fourth, waste management which involves a relevant system or an authorized manager is needed to deal with the waste generated during the whole process. The last, Waste Water Treatment Plant (WWTP) to deal with the two waste water streams both a HOL (high organic load) and a LOL (low organic load), by means of aerobic and anaerobic digestion, among other essential technologies exists.
Ref. code: 25616066090108XWU

18
Figure 3.1 Canning fish production process Sources: Author’s elaboration
Ref. code: 25616066090108XWU

19
3.1.3 Development of Canned Tuna Industries in Indonesia Sunoko and Huang (2013) classified the development of Indonesian
tuna fisheries into five stages. Initially, foreigners introduced tuna fisheries in the early 19th century. The second stage, Indonesia developed its national fisheries, and conducted bilateral relationship through access agreement and chartering schemes to the next stage. The fourth stage, Indonesia is involved in the design of tuna development program. The final stage, Indonesia is included to cooperation with the other countries.
In 1905, Japanese foreign vessels came to Indonesia to catch tuna which was classified by Sunoko and Huang as the first stage in the Indonesian fisheries development. McElroy (1989) classified foreign skipjack/tuna fishing vessels into three waves, which represent fishing methods namely pole and line, longline, and purse seine. The first wave, the foreign tuna vessels started operation in the Maluccus (Maluku) in 1905. The catch peaked in 1974 when pole and line vessels from Japan operating with mostly 250 gt vessels, caught over 60,000 MT of skipjack. However, after 1974 this wave significantly decreased due to high fishing costs and problem of access which affected live-bait supplies. Then the second wave started in 1965 when more foreign tuna vessels from Japan, Taiwan, and Korea operated in the Indian and Pacific Ocean EEZs and in the Banda Sea. This second wave was predicted to reach a peak between 1975 and 1977, when the total foreign vessels longline catch taken within the 200 miles of Indonesia averaged in 7,100 MT, with Japanese vessels contributed around 5,000 MT. The third wave commenced to operate in 1974 by operating tuna purse seiners in North Irian Jaya. In 1980, 14 Japanese vessels caught approximately 25,000 MT of skipjack in this area. During the five-year period between 1983 and 1988, 39 Japanese purse seiners fleet caught around 40,000-60,000 MT/year and it was estimated that half of them were taken in the Indonesian marine territory.
Sunoko and Huang estimated that domestic regulation and infrastructure development become the second stage of fisheries development in Indonesia. This stage was signed by the construction of domestic longline fisheries in 1945 by Pusat Jawatan Perikanan Laut under the Directorate of Fisheries and the
Ref. code: 25616066090108XWU
20
Ministry of Agriculture. Then, the commercial fishing activity was initiated by BPU Perikanan in 1962, a state company with the vessel “Minadjaya I” (167 GT) and “Minadjaya II” (185 GT). Between 1969 and 1974, the government revitalized a couple of state companies, i.e. P.N. Perikani Sulut/Tengah and Perum Perikanan Maluku in order to develop national fisheries. In 1984, PT Perikanan Samodra Besar exported 48.8 t of fresh tuna for US$ 220,203 with the assistance of Japanese experts (Simorangkir, 2000). Then, the government established Nizam Zachman fishing port which served tuna longline vessels and enabled them to accelerate fresh tuna export. The government also had a concern on research and training. There were two research and training vessels, “Tuna I” and “Tuna II”, which were built in 1969. Japan assisted funding for the training vessel “Madidahang” to the Jakarta Fishery Academy in 1974. The Jakarta Fishery Academy provides formal education consisting of diploma programs on marine and fisheries under the Ministry of Agriculture. Then, the academy changed its name to the Fishery University in 1993. Since 2000 the university offered four programs including fishing technology (fishing technology and fisheries machine), fish processing technology, aquatic resources management, and fisheries extension.
The third stage of fisheries development in Indonesia was conducting an international cooperation. In order to create mutual benefit with foreign vessels, Indonesian government enacted The Banda Sea Agreement I (1968-1975). This was the first agreement that allowed for foreign vessels operation in Indonesian marine territory (Sunoko & Huang, 2013). This agreement was revised into the Banda Sea Agreement II in 1975 and the Banda Sea Agreement III in 1979. The revision enacted a new regulation from the government which required foreign investors through joint venture. Indonesia attempted to conduct a joint venture with South Korean government in the early 1970s.
Following Sunoko and Huang, the fourth stage of Indonesian fishery development was the domestic enhancement program in the 2000s. Under the Presidential Regulation 7/2005, the government enacted the National Medium-term Development 2004-2009. It was composed into seven programs related to tuna development, which include (1) the policy of data and information reliabilities; (2)
Ref. code: 25616066090108XWU

21
the construction of fishing port amenities; (3) the upgrading of tuna fishing vessels; (4) improvement in handling systems, quality, added value, and competitiveness; (5) the endowment of the tuna fishing industry; (6) law enforcement and international engagement; (7) increasing research and development, human resources, and regulatory and budgetary provisions (Sunoko & Huang, 2013).
The last stage of Indonesian fisheries development was the engagement to international agreements. Indonesia ratified UNCLOS (United Nations Convention of the Law on the Sea) 1982 in 1985. Indonesian marine territory is also covered by the three tuna RFMOs (Regional Fisheries Management Organizations) including the IOTC (Indian Ocean Tuna Commission), CCSBT (Commission for the Conservation of Southern Bluefin Tuna), and WCPFC (Western and Central Pacific Fisheries Commission).
Based on the data provided by UN Comtrade, Indonesia was able to export canned tuna commodity of more than 47,000 mt with a trade value of roughly 130 million USD in 2006. Then, the export experienced resurgence in the following five years which was able to sell nearly 70,000 mt and trade value doubled to 280 million USD than in 2006. Between 2012 and 2016, the canned tuna export commodity remains stable around 70,000 mt with trade value in approximately 280 to 350 million USD.
Ref. code: 25616066090108XWU

22
Table 3.1 Indonesian canned tuna export 2006-2016
Year Volume (MT) Value (USD)
2006 47,092 129,790,247 2007 52,430 151,941,915 2008 46,849 174,341,368 2009 55,193 190,172,564 2010 54,767 186,178,006 2011 69,989 279,150,989 2012 72,184 351,534,881 2013 74,512 374,967,318 2014 70,814 311,834,057 2015 73,675 294,983,738 2016 68,548 278,972,503
Sources: UN Comtrade Database
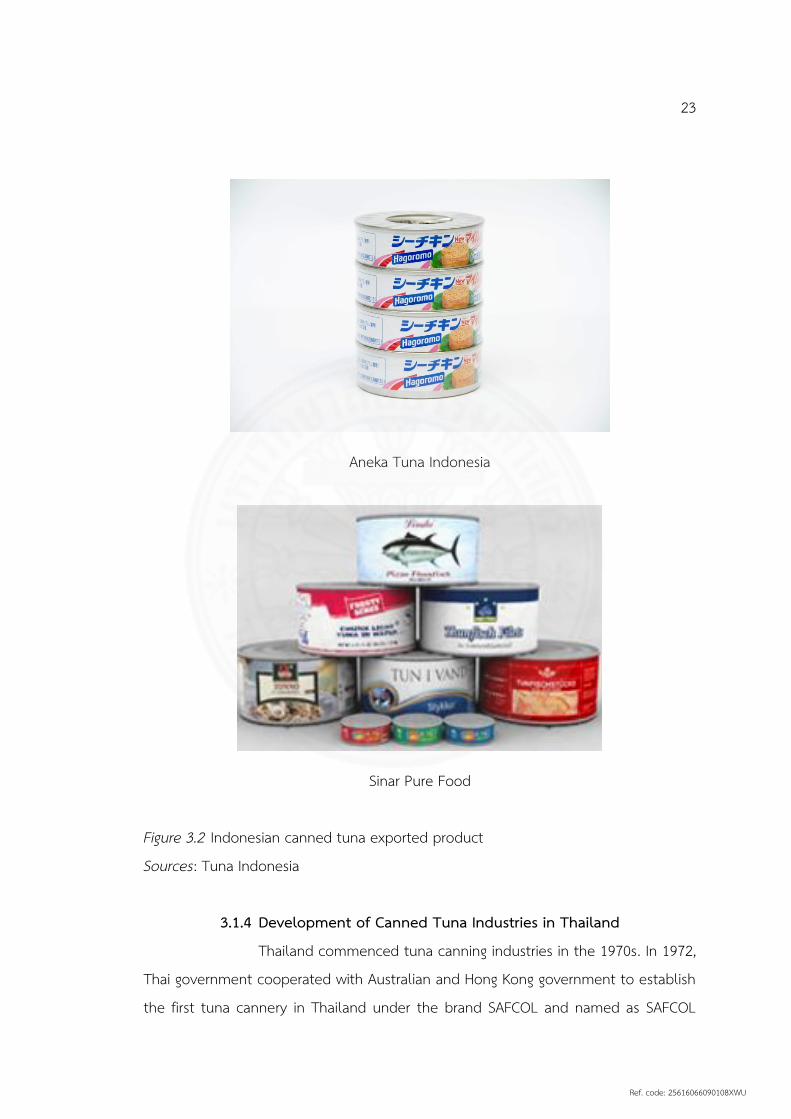
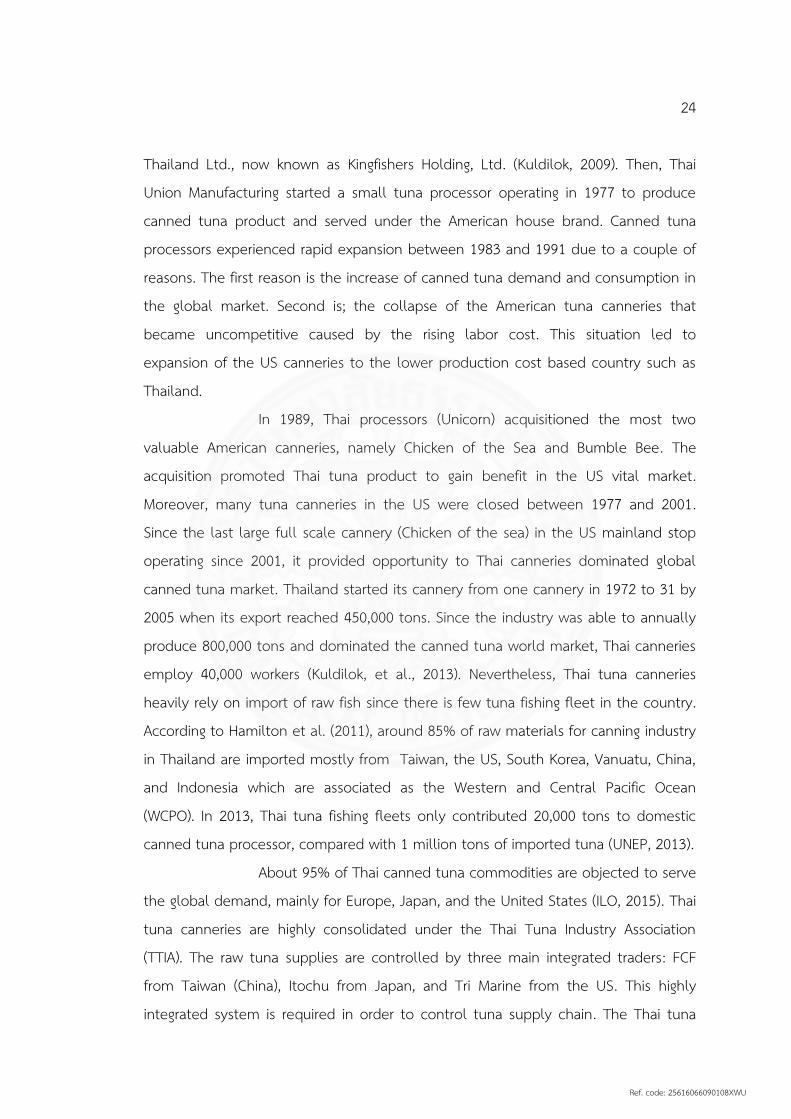
The Indonesian canned tuna products are varied in order to be compatible with global consumer’s preferences, i.e. Aneka Tuna Indonesia as one of major Indonesian tuna canneries has Sunbell Tuna Katsuo, Sunbell Tuna Maguro, Hagoromo Sea Chicken, and Skipjack Falkes (Aneka Tuna Indonesia, 2019). Aneka Tuna Indonesia exported its product mostly to Japan, Europe, Middle East, Australia, Canada, Africa, and tiny portion for domestic market. Another Producer namely Sinar Pure Food has Skipjack/Yellowfin Chunk in oil and brine as its popular exported product (Sinar Pure Foods, 2019). Similar to its competitor, Sinar Pure Foods sell its product mostly to Europe, Japan, USA, and Middle East.
Ref. code: 25616066090108XWU
23
Aneka Tuna Indonesia
Sinar Pure Food Figure 3.2 Indonesian canned tuna exported product Sources: Tuna Indonesia
3.1.4 Development of Canned Tuna Industries in Thailand
Thailand commenced tuna canning industries in the 1970s. In 1972, Thai government cooperated with Australian and Hong Kong government to establish the first tuna cannery in Thailand under the brand SAFCOL and named as SAFCOL
Ref. code: 25616066090108XWU
24
Thailand Ltd., now known as Kingfishers Holding, Ltd. (Kuldilok, 2009). Then, Thai Union Manufacturing started a small tuna processor operating in 1977 to produce canned tuna product and served under the American house brand. Canned tuna processors experienced rapid expansion between 1983 and 1991 due to a couple of reasons. The first reason is the increase of canned tuna demand and consumption in the global market. Second is; the collapse of the American tuna canneries that became uncompetitive caused by the rising labor cost. This situation led to expansion of the US canneries to the lower production cost based country such as Thailand.
In 1989, Thai processors (Unicorn) acquisitioned the most two valuable American canneries, namely Chicken of the Sea and Bumble Bee. The acquisition promoted Thai tuna product to gain benefit in the US vital market. Moreover, many tuna canneries in the US were closed between 1977 and 2001. Since the last large full scale cannery (Chicken of the sea) in the US mainland stop operating since 2001, it provided opportunity to Thai canneries dominated global canned tuna market. Thailand started its cannery from one cannery in 1972 to 31 by 2005 when its export reached 450,000 tons. Since the industry was able to annually produce 800,000 tons and dominated the canned tuna world market, Thai canneries employ 40,000 workers (Kuldilok, et al., 2013). Nevertheless, Thai tuna canneries heavily rely on import of raw fish since there is few tuna fishing fleet in the country. According to Hamilton et al. (2011), around 85% of raw materials for canning industry in Thailand are imported mostly from Taiwan, the US, South Korea, Vanuatu, China, and Indonesia which are associated as the Western and Central Pacific Ocean (WCPO). In 2013, Thai tuna fishing fleets only contributed 20,000 tons to domestic canned tuna processor, compared with 1 million tons of imported tuna (UNEP, 2013).
About 95% of Thai canned tuna commodities are objected to serve the global demand, mainly for Europe, Japan, and the United States (ILO, 2015). Thai tuna canneries are highly consolidated under the Thai Tuna Industry Association (TTIA). The raw tuna supplies are controlled by three main integrated traders: FCF from Taiwan (China), Itochu from Japan, and Tri Marine from the US. This highly integrated system is required in order to control tuna supply chain. The Thai tuna
Ref. code: 25616066090108XWU
25
canneries need a strong monitoring mechanism and decent labor regulation, since their main importers encouraged Thai tuna canneries to achieve and maintain its high quality product as well as proper labor standard on their operations (ILO, 2016).
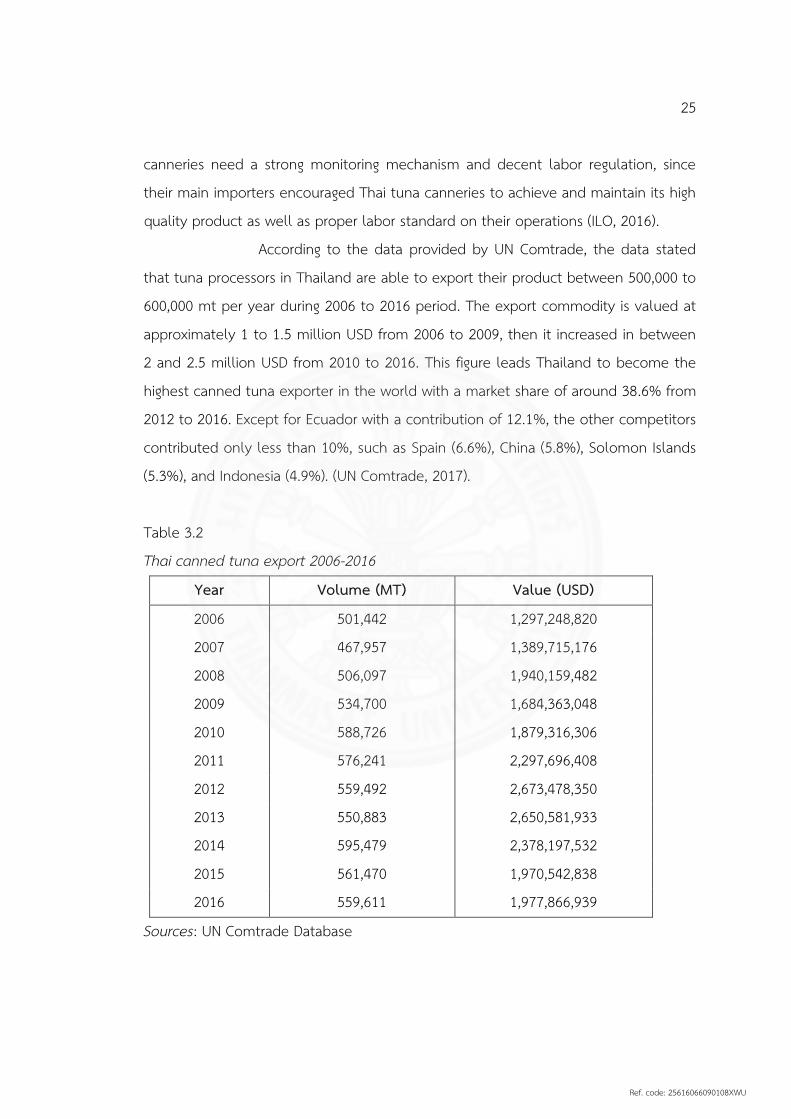
According to the data provided by UN Comtrade, the data stated that tuna processors in Thailand are able to export their product between 500,000 to 600,000 mt per year during 2006 to 2016 period. The export commodity is valued at approximately 1 to 1.5 million USD from 2006 to 2009, then it increased in between 2 and 2.5 million USD from 2010 to 2016. This figure leads Thailand to become the highest canned tuna exporter in the world with a market share of around 38.6% from 2012 to 2016. Except for Ecuador with a contribution of 12.1%, the other competitors contributed only less than 10%, such as Spain (6.6%), China (5.8%), Solomon Islands (5.3%), and Indonesia (4.9%). (UN Comtrade, 2017).
Table 3.2 Thai canned tuna export 2006-2016
Year Volume (MT) Value (USD)
2006 501,442 1,297,248,820 2007 467,957 1,389,715,176 2008 506,097 1,940,159,482 2009 534,700 1,684,363,048 2010 588,726 1,879,316,306 2011 576,241 2,297,696,408 2012 559,492 2,673,478,350 2013 550,883 2,650,581,933 2014 595,479 2,378,197,532 2015 561,470 1,970,542,838 2016 559,611 1,977,866,939
Sources: UN Comtrade Database
Ref. code: 25616066090108XWU

26
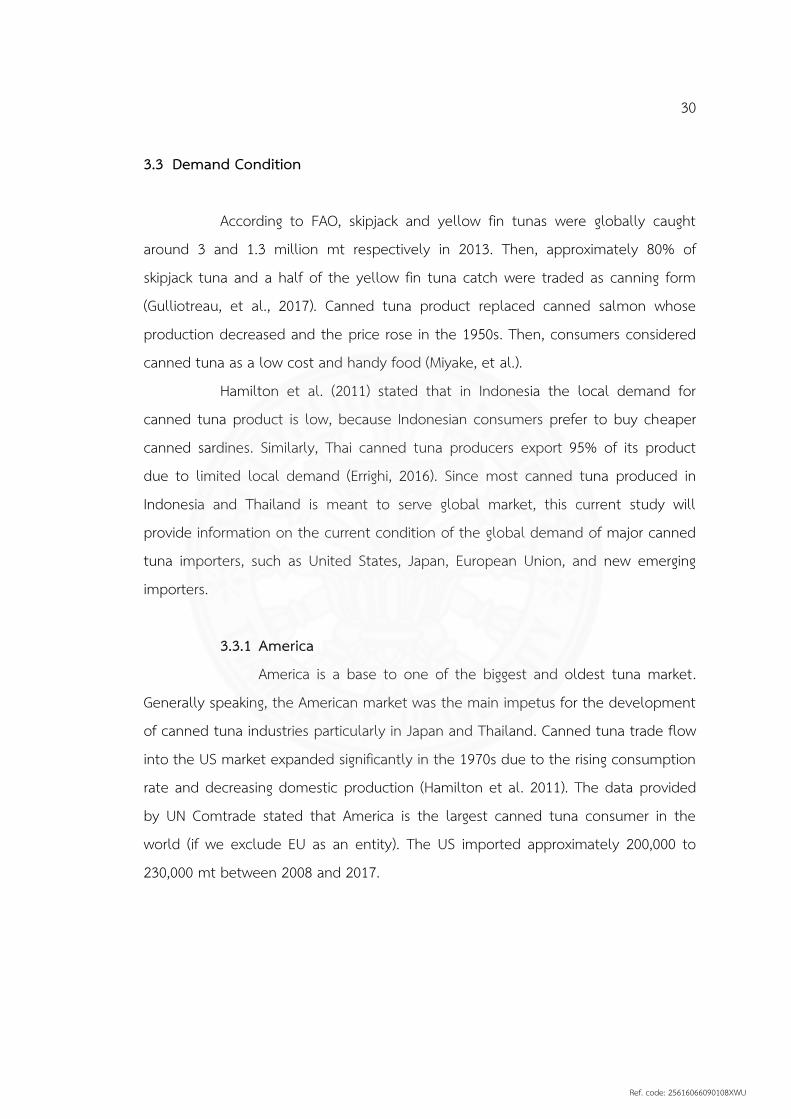
Thai canned tuna products are diversified into three major global brands. This diversification is aimed to expand the market in the three continents, North America, Europe, and Asia Pacific.
Thai Union exported product for North American market
Thai Union exported product for European market
Thai Union exported product for Asia Pacific market
Figure 3.3 Thai canned tuna exported products Sources: Thai Union annual report
Ref. code: 25616066090108XWU

27
3.2 Factor Condition
3.2.1 Indonesia 3.2.1.1 Labor Cost
Indonesia poses abundance of labor force since the country is counted as the fourth biggest population in the world. According to the National Labor Forces Survey (NLFS) 2017 conducted by Statistic Indonesia (Badan Pusat Statistik/BPS), the labor forces concept used the ILO recommendation which are divided into two components; a working age group and a non-working age group. Then, the working age population is divided into two categories based on their current activities; those in the labor forces (employment) and those not in the labor forces (unemployment) (BPS, 2017).
According to a survey in 2017, approximately 262.41 million people populated in Indonesia with the working age population amounted to 192.08 million people. Ministry of Marine and Fishery estimated that there are 44 canned tuna industries in Indonesia which hire a total of 26,400 employees (MMAF, 2017).
3.2.1.2 Raw Material Indonesia is a maritime country contributed as the second
highest exporting country on fisheries. Located between Hindia and Pacific oceans, Indonesia poses huge number of Tuna resources. Based on the letter of the Indonesian Geospatial Information Agency No. 13-3.4/SESMA/16D/07 /2014, the Indonesian fishing potency of all kinds is about 9.932 million tons in 2016 while its Total Allowable Catch (TAC) is estimated at 80% amounting to about 7.945 million tons annually (Indonesian Marine Fisheries Book, 2016). Meanwhile, Indonesian fisheries production in 2016 is around 6 million tons, meaning that some sea areas in Indonesia are still counted as under exploited.
Tuna always become a potential commodity in the Indonesian fisheries product since these kinds of fisheries dominated the Indonesian fisheries production. Based on the data compiled by Indonesian Marine Fishery Book (2017), the Indonesian is estimated to capture tuna of around 1 million tons annually
Ref. code: 25616066090108XWU

28
between 2011 and 2016. The catch composed of three main tuna species, namely tuna, skipjack tuna, and eastern little tuna.
Table 3.3 Indonesian captured tuna from 2011 to 2016
Species year/ton
2011 2012 2013 2014 2015 2016*
Tuna 241,364 275,778 305,435 313,873 255,452 250,900 Skipjack Tuna
372,211 429,024 481,014 496,682 415,060 400,850
Eastern Little Tuna
415,331 432,138 451,048 515,571 524,387 539,320
Total 1,028,906 1,136,940 1,237,497 1,326,126 1,194,899 1,191,070 * Preliminary figures Source: Pusadatin, 2017., IMFB, 2017.
3.2.2 Thailand 3.2.2.1 Labor Cost
Tuna canning industries in Thailand face limited domestic workforce, consequently they rely on migrant workers. Campling and Doherty estimated the data from Thai government office which stated around 50% of labor in Thai tuna processors are migrant worker from Myanmar. Migrant workers from Laos and Cambodia also hired on Thai canneries sectors (Kuldilok, 2009). Nevertheless, labor cost in Thailand still much lower compared to the other canned tuna canneries in the world.
Ref. code: 25616066090108XWU

29
Table 3.4 Wage per hour among canned tuna producers
Country Wage US$/hour US- California and Puerto Rico 5.15 US- American Samoa 3.26 Seychelles 1.90 Mauritius 0.90 Ecuador 0.77 Thailand 0.66
Sources: Kuldilok (2009), Ababouch & Catarci (2008), and Campling & Doherty (2007).
3.2.2.2 Raw Material Since Thailand has limited domestic tuna fishing vessels, the
canneries need to import 85% of their raw tuna materials for canning industry and mostly are imported from Taiwan, the US, South Korea, Vanuatu, China, and Indonesia to fulfill their production capacity (Hamilton, et al., 2011). Between 2012 and 2016 the raw materials imported by Thai canneries significantly increased from roughly 4,700 mt in 2012 to more than 10,000 mt 2016. During the periods, Yellowfin and Skipjack tuna dominated the tuna species which were imported.
Table 3.5 Fresh/frozen tuna imported by Thailand (2012-2016)
Year Yellowfin
tunas Skipjack/stripe-bellied bonito
Big eye Tunas, skipjack
& bonito Total
Import (MT)
2012 3,562 64 944 1,175 4,737 2013 2,175 804 399 4,305 6,480 2014 3,593 1,114 114 2,041 5,634 2015 5,653 1 1,290 418 6,071 2016 3,119 301 575 7,248 10,367
Source: UN Comtrade Database
Ref. code: 25616066090108XWU
30
3.3 Demand Condition According to FAO, skipjack and yellow fin tunas were globally caught
around 3 and 1.3 million mt respectively in 2013. Then, approximately 80% of skipjack tuna and a half of the yellow fin tuna catch were traded as canning form (Gulliotreau, et al., 2017). Canned tuna product replaced canned salmon whose production decreased and the price rose in the 1950s. Then, consumers considered canned tuna as a low cost and handy food (Miyake, et al.).
Hamilton et al. (2011) stated that in Indonesia the local demand for canned tuna product is low, because Indonesian consumers prefer to buy cheaper canned sardines. Similarly, Thai canned tuna producers export 95% of its product due to limited local demand (Errighi, 2016). Since most canned tuna produced in Indonesia and Thailand is meant to serve global market, this current study will provide information on the current condition of the global demand of major canned tuna importers, such as United States, Japan, European Union, and new emerging importers.
3.3.1 America
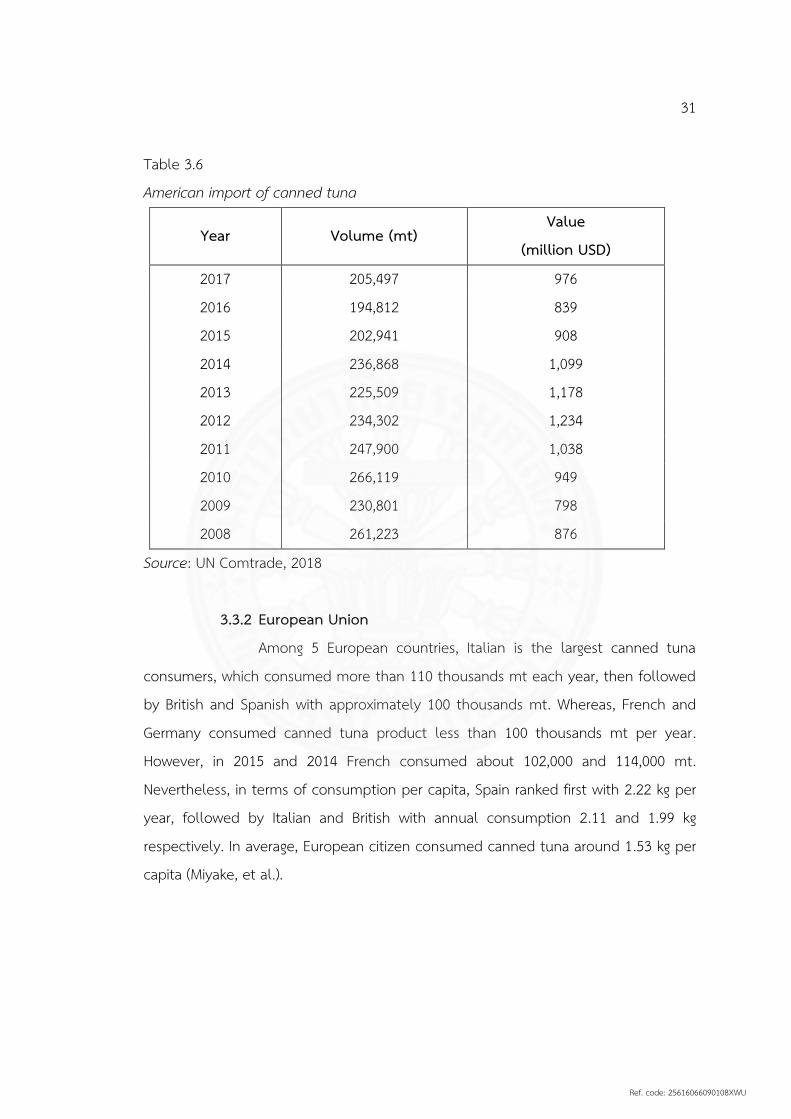
America is a base to one of the biggest and oldest tuna market. Generally speaking, the American market was the main impetus for the development of canned tuna industries particularly in Japan and Thailand. Canned tuna trade flow into the US market expanded significantly in the 1970s due to the rising consumption rate and decreasing domestic production (Hamilton et al. 2011). The data provided by UN Comtrade stated that America is the largest canned tuna consumer in the world (if we exclude EU as an entity). The US imported approximately 200,000 to 230,000 mt between 2008 and 2017.
Ref. code: 25616066090108XWU
31
Table 3.6 American import of canned tuna
Year Volume (mt) Value
(million USD)
2017 205,497 976 2016 194,812 839 2015 202,941 908 2014 236,868 1,099 2013 225,509 1,178 2012 234,302 1,234 2011 247,900 1,038 2010 266,119 949 2009 230,801 798 2008 261,223 876
Source: UN Comtrade, 2018
3.3.2 European Union Among 5 European countries, Italian is the largest canned tuna
consumers, which consumed more than 110 thousands mt each year, then followed by British and Spanish with approximately 100 thousands mt. Whereas, French and Germany consumed canned tuna product less than 100 thousands mt per year. However, in 2015 and 2014 French consumed about 102,000 and 114,000 mt. Nevertheless, in terms of consumption per capita, Spain ranked first with 2.22 kg per year, followed by Italian and British with annual consumption 2.11 and 1.99 kg respectively. In average, European citizen consumed canned tuna around 1.53 kg per capita (Miyake, et al.).
Ref. code: 25616066090108XWU

32
Table 3.7 Canned tuna imported by 5 selected EU countries.
Year
Country
2017 2016 2015 2014 Vol. (mt)
Val. (Mil.USD)
Vol. (mt)
Val. (Mil.USD)
Vol. (mt)
Val. (Mil.USD)
Vol. (mt)
Val. (Mil.USD)
Italy 129,575 746 114,934 639 105,937 621 122,439 805
UK 107,846 512 114,087 465 112,648 506 104,299 545 Spain 121,839 622 95,057 405 115,932 461 97,186 504
France 99,692 517 90,843 414 102,664 474 114,043 634 Germany 84,017 378 68,727 271 78,522 327 76,607 371
Source: UN Comtrade, 2018
Miyake, et al., classified European consumers into the following three categories;
(1) Northern European countries (UK and Germany) consume cheap skipjack product (in oil or brine) mostly imported from Southeast Asian countries.
(2) Southern European countries (Italy and Spain) are both processors as well as importers of yellow fin at higher prices.
(3) France is categorized as intermediate market where the two types of products are consumed. The most popular product being “thon au naturel”, which is canned tuna in brine that is only cooked once after being packed, and the cooking process is named as “raw pack” among packers.
3.3.3 Japan As a traditional market for canned tuna product, Japan imported
canned tuna approximately between 50,000 and 60,000 mt annually. According to the data provided by UN Comtrade this figure has remained stable since 2008. This is because Japanese has the tendency to consume tuna product either as fresh or cooked such as canning tuna (Miyake, et al.)
Ref. code: 25616066090108XWU

33
Table 3.8 Japanese imported canned tuna
Year Volume
(mt) Value
(million USD)
2017 62,962 346 2016 60,396 299 2015 54,538 270 2014 54,256 297 2013 53,630 339 2012 55,870 366 2011 52,959 305 2010 47,364 227 2009 49,538 239 2008 52,139 289
Source: UN Comtrade, 2018
In addition, the global demand of canned tuna product also comes from new emerging consumers, such as Australia and China (Campling, 2015).
3.4 Related and Supporting Industries
Related and supporting industries are defined as the industries that
coordinated and cooperated in the value chain of canned tuna productions or those that are included as complementary products. The main related industries are cold storage, shipping, ports, packaging, logistics, and the fishing sectors (Kuldilok, 2013).
3.4.1 Indonesia
3.4.1.1 Operating Tuna Vessels Domestic vessels are categorized as supporting industries,
since it supplies raw materials to Indonesian canned tuna factories. Indonesian tuna
Ref. code: 25616066090108XWU

34
vessels are multi-gear and multi-species by nature and largely artisanal in scale, conversely the large industrial tuna fleets (purse seine and longline) operating throughout most of the WCPO eastern Indonesia. The amount of artisanal non-powered fishing vessels of all type number is 200,000, which is equal to the number of inboard and outboard powered vessels (Hamilton, et al.). Indonesian tuna vessels mostly operated in the Five zones of pacific deep water such as Sulawesi, Maluku, Halmahera, Ceram, Flores, Banda Sea, and parts of the far western pacific ocean.
Indonesian Marine Fisheries Book (2017) reported that the total number of fishing vessels is approximately 600,000 which operated in the country.
Table 3.9 Operating tuna vessels in Indonesia CATEGORY AND SIZE
OF BOAT YEAR AVERAGE OF INCREASE (%)
2011 2012 2013 2014 2015 2011-2015 TOTAL 581,845 616,690 639,708 625,633 568,329 -0.41
NON POWERED BOAT 170,938 172,333 175,510 165,066 143,135 -4.14 OUTBOARD MOTOR 225,786 245,819 237,625 238,010 246,882 2.36 INBOARD MOTOR 185,121 198,538 226,573 222,557 178,312 0.07
SIZE OF BOAT
< 5 GT 123,748 137,587 151,939 153,493 117,848 -0.15 5-10 GT 35,877 37,694 46,358 41,374 39,429 3.15
10-20 GT 13,201 11,563 15,208 14,301 10,515 -3.35 20-30 GT 8,022 7,611 8,782 9,578 7,680 -0.12
30-50 GT 914 917 1,074 1,029 825 -1.64 50-100 GT 1,801 1,641 1,727 1,766 1,435 -5.03
100-200 GT 1,204 1,167 1,127 840 571 -16.00 > 200 GT 354 338 358 176 9 -36.08
Source: Indonesian Marine Fisheries Book, 2017
Ref. code: 25616066090108XWU

35
3.4.1.2 Fisheries Facilities The majority of Indonesian fishing ports are managed by the
Directorate General of Capture Fisheries (DGCF) and are classified as one of four types depending on port capacity, the size of the vessels it can accommodate, the geographical range of fishing activity of those vessels, and the volume of fish landing that routinely occurs at the port. According to the Ministerial Regulation (Permen KP Nomor PER.08/MEN/2012 on Fishing Port) there are four types of fishing port which are located separately across the country:
Table 3.10 Fishing Port in Indonesia Category Type Amount
Class A Pelabuhan Perikanan Samudera (PPS)/ Oceanic Fishing Port 7 Class B Pelabuhan Perikanan Nusantara (PPN)/ Archipelagic Fishing
Port 16
Class C Pelabuhan Perikanan Pantai (PPP)/ Coastal Fishing Port 44 Class D Pangkalan Pendaratan Ikan (PPI)/ Fish Landing Place 1023
Source: Indonesian Marine Fisheries Book, 2017
3.4.2 Thailand 3.4.2.1 Operating Tuna Vessels
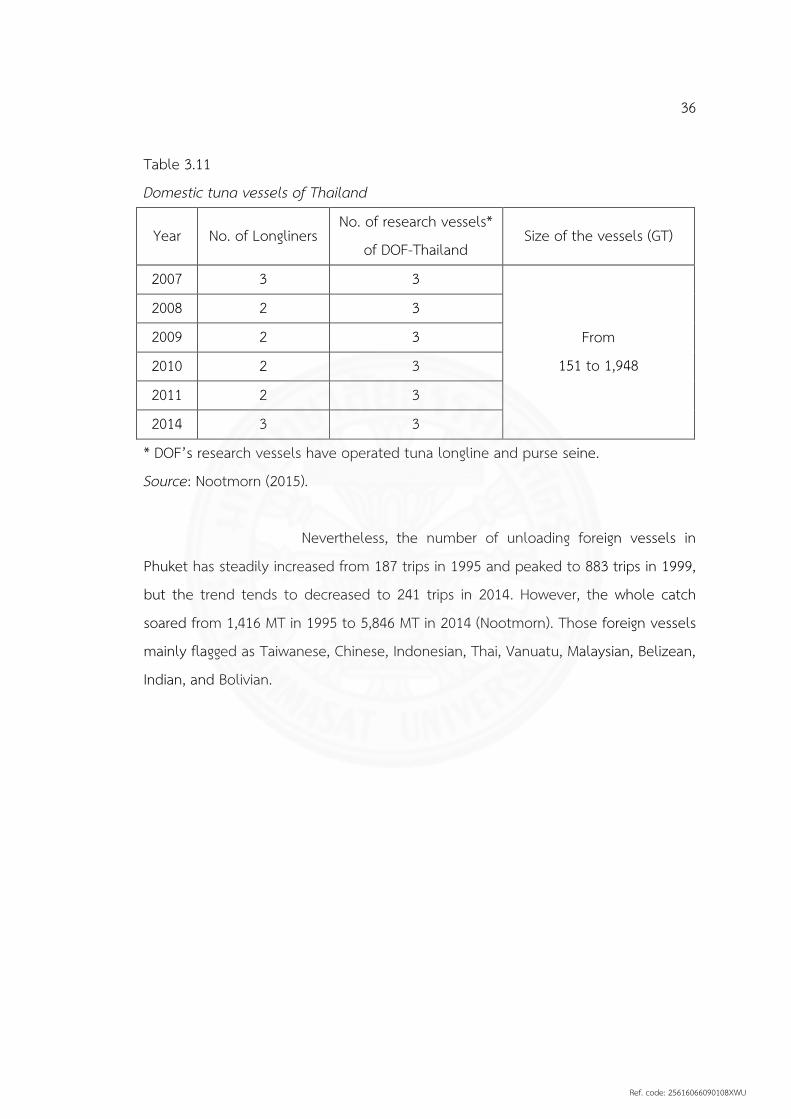
Domestic tuna vessels in Thailand are limited. Therefore, canned tuna factories mostly rely on import in accessing raw materials as explained in the previous sub-chapter. Nootmorn (2015) estimated that only three Thai tuna long-liners operated in the Indian Ocean in 2007 and 2014. Thai tuna vessels have caught around 295.23; 607.69; 373.44; 470.41; 307.74; and 571.91 tons in each year during the period between 2009 and 2014. Those vessels mostly catch some tuna species, such as bigeye tuna (T. obesus), yellowfin tuna (T. albacores), and albacore tuna.
Ref. code: 25616066090108XWU
36
Table 3.11 Domestic tuna vessels of Thailand
Year No. of Longliners No. of research vessels*
of DOF-Thailand Size of the vessels (GT)
2007 3 3
From 151 to 1,948
2008 2 3 2009 2 3
2010 2 3
2011 2 3 2014 3 3
* DOF’s research vessels have operated tuna longline and purse seine. Source: Nootmorn (2015).
Nevertheless, the number of unloading foreign vessels in
Phuket has steadily increased from 187 trips in 1995 and peaked to 883 trips in 1999, but the trend tends to decreased to 241 trips in 2014. However, the whole catch soared from 1,416 MT in 1995 to 5,846 MT in 2014 (Nootmorn). Those foreign vessels mainly flagged as Taiwanese, Chinese, Indonesian, Thai, Vanuatu, Malaysian, Belizean, Indian, and Bolivian.
Ref. code: 25616066090108XWU

37
Table 3.12 Foreign tuna vessels landing in Phuket, Thailand Year Taiwan China Indonesia Thailand Malaysia Belizean
2000 2,285 mt of 439 landings
738 mt of 200 landings
95 mt of 27 landings
n.a. n.a. n.a.
2001 2,948 mt of 529 landings
918 mt of 258 landings
414 mt of 69 landings
n.a. n.a. n.a.
2002 3,776 mt of 556 landings
820 mt of 210 landings
401 mt of 50 landings
n.a. n.a. n.a.
2003 4,399 mt of 496 landings
25 mt of 5 landings
572 mt of 62 landings
n.a. n.a. n.a.
2004 4,031 mt of 463 landings
403 mt of 48 landings
883 mt of 71 landings
n.a. n.a. n.a.
2005 5,060 mt of 444 landings
4 mt of 2 landings
889 mt of 71 landings
n.a. n.a. n.a.
2006 3,224 mt of 315 landings
n.a. 1,609 mt of 127 landings
n.a. n.a. n.a.
2007 5,262 mt of 427 landings
5 mt of 1 landings
1,191 mt of 60 landings
18 mt of 5 landings
n.a. n.a.
2008 5,565 mt of 446 landings
1 mt of 1 landings
2,109 mt of 85 landings
n.a. 38 mt of 1 landings
n.a.
2009 3,793 mt of 383 landings
n.a. 2,988 mt of 137 landings
n.a. 40 mt of 1 landings
n.a.
2010 5,138 mt of 425 landings
n.a. 1,924 mt of 85 landings
n.a. n.a. 2,168 mt of 65 landings
2011 2,828 mt of 241 landings
n.a. 1,026 mt of 60 landings
n.a. 144 mt of 9 landings
1,557 mt of 63 landings
2012 3,509 mt of 194 landings
n.a. 2,853 mt of 95 landings
n.a. n.a. 662 mt of
26 landings
2013 2,210 mt of 149 landings
n.a. 2,028 mt of 77 landings
n.a. n.a. 470 mt of
14 landings
2014 1,203 mt of 129 landings
n.a. 2,310 mt of 75 landings
n.a. n.a. 113 mt of 4 landings
Source: Nootmorn (2015).
Ref. code: 25616066090108XWU
38
3.4.2.2 Supporting Facilities Puttipokin (2001) assumed that the competitive advantage of
Thai canned tuna industries is obtained from sophisticated supporting industries and modern infrastructure. First, some large processors keep their frozen tuna in efficient cold storage before processing. Second, canning factories are mainly located close to the ports for efficient transshipment. Third, there are about 20 companies which produce fish can. Moreover, Can processors increase to 30 companies in 2005 (Hayes).
3.5 Firm’s Structure, Strategy, and Rivalry
In terms of firm structure, Indonesian and Thai tuna processors have
different patterns. The Indonesian canned tuna industries have equal production capacity, while Thai canned tuna industries are oligopolistic market (Hamilton). Consequently, dominant producers in Thailand become price leaders, while other smaller companies are price-followers (Kuldilok, 2013). The tuna canneries in Indonesia have been explained in the previous chapter to be categorized as small and medium producers, which were separated across the country, while the tuna canneries in Thailand are dominated by the two processors namely Thai Union and Sea Value.
3.5.1 Structure
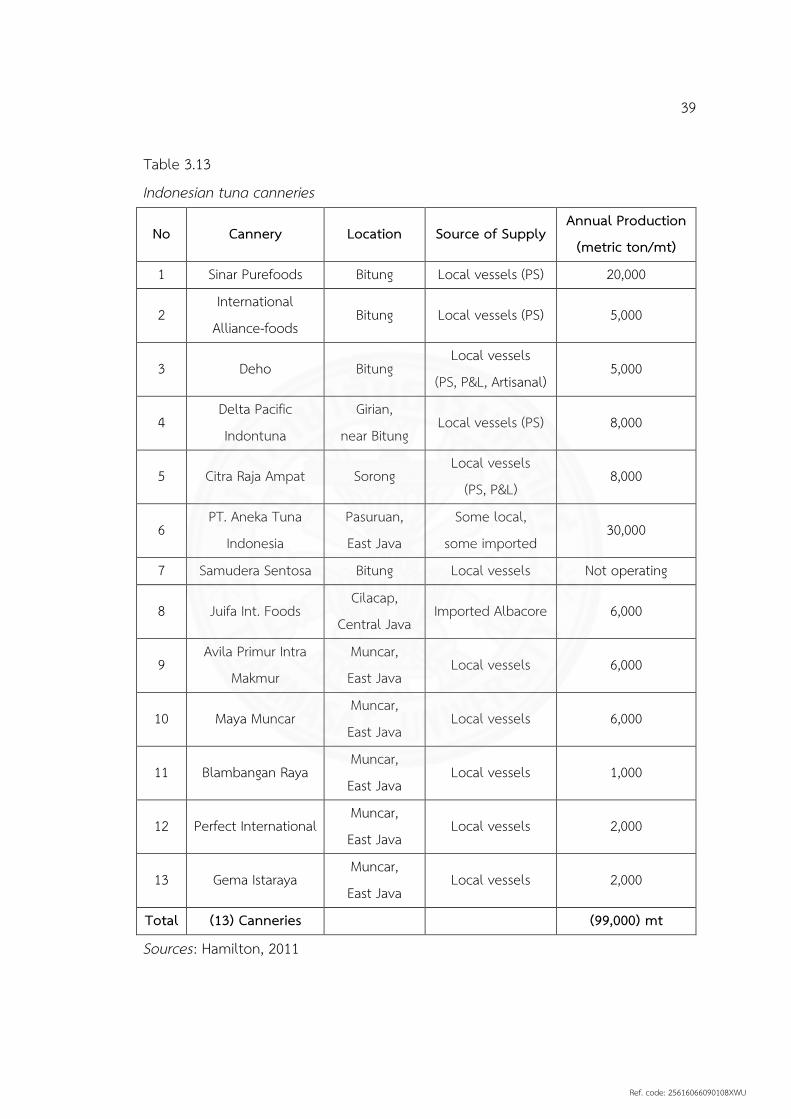
3.5.1.1 Canned tuna processors in Indonesia Indonesian tuna canneries are situated in East Java, Bitung,
Bali, Sorong and Biak. There are at least 13 operating canned tuna processors in the country which process primarily tuna, with an estimated annual production approximately 100,000 mt (Hamilton, 2011).
Ref. code: 25616066090108XWU
39
Table 3.13 Indonesian tuna canneries
No Cannery Location Source of Supply Annual Production
(metric ton/mt)
1 Sinar Purefoods Bitung Local vessels (PS) 20,000
2 International
Alliance-foods Bitung Local vessels (PS) 5,000
3 Deho Bitung Local vessels
(PS, P&L, Artisanal) 5,000
4 Delta Pacific Indontuna
Girian, near Bitung
Local vessels (PS) 8,000
5 Citra Raja Ampat Sorong Local vessels
(PS, P&L) 8,000
6 PT. Aneka Tuna
Indonesia Pasuruan, East Java
Some local, some imported
30,000
7 Samudera Sentosa Bitung Local vessels Not operating
8 Juifa Int. Foods Cilacap,
Central Java Imported Albacore 6,000
9 Avila Primur Intra
Makmur Muncar, East Java
Local vessels 6,000
10 Maya Muncar Muncar, East Java
Local vessels 6,000
11 Blambangan Raya Muncar, East Java
Local vessels 1,000
12 Perfect International Muncar, East Java
Local vessels 2,000
13 Gema Istaraya Muncar, East Java
Local vessels 2,000
Total (13) Canneries (99,000) mt
Sources: Hamilton, 2011
Ref. code: 25616066090108XWU
40
3.5.1.2 Canned tuna processors in Thailand Unlike the Indonesian tuna canneries which are dispersedly
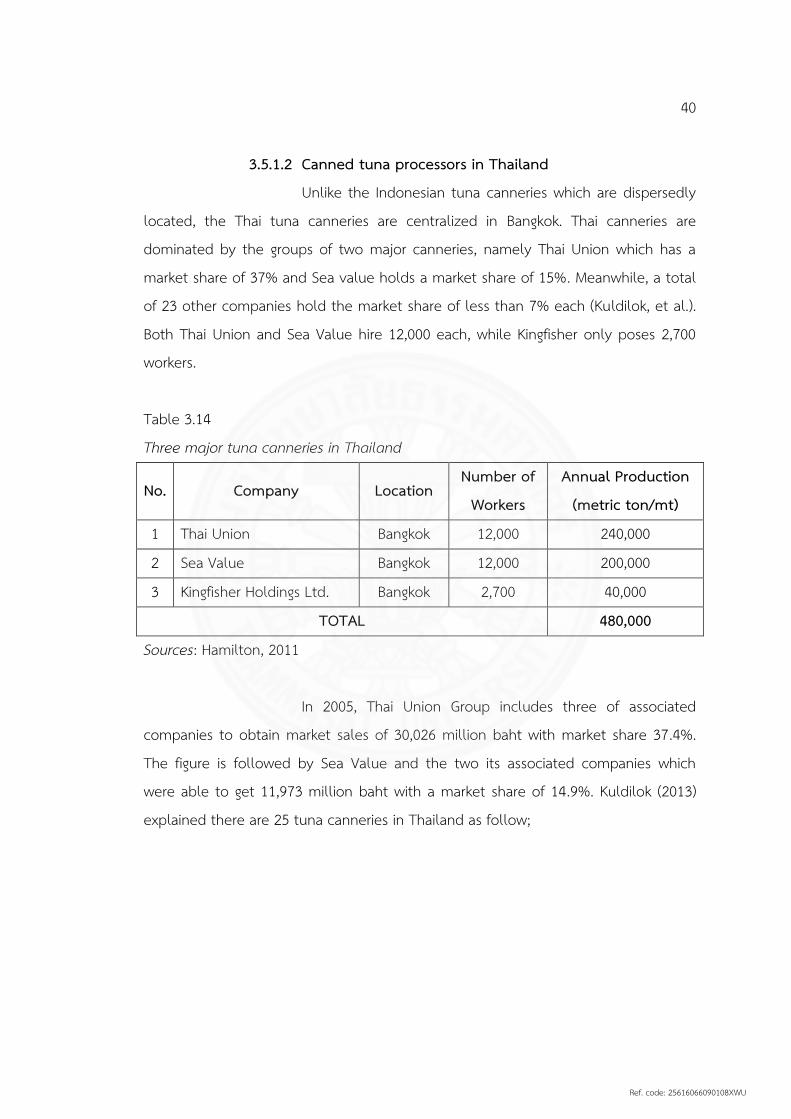
located, the Thai tuna canneries are centralized in Bangkok. Thai canneries are dominated by the groups of two major canneries, namely Thai Union which has a market share of 37% and Sea value holds a market share of 15%. Meanwhile, a total of 23 other companies hold the market share of less than 7% each (Kuldilok, et al.). Both Thai Union and Sea Value hire 12,000 each, while Kingfisher only poses 2,700 workers.
Table 3.14 Three major tuna canneries in Thailand
No. Company Location Number of
Workers Annual Production
(metric ton/mt) 1 Thai Union Bangkok 12,000 240,000
2 Sea Value Bangkok 12,000 200,000
3 Kingfisher Holdings Ltd. Bangkok 2,700 40,000 TOTAL 480,000
Sources: Hamilton, 2011
In 2005, Thai Union Group includes three of associated companies to obtain market sales of 30,026 million baht with market share 37.4%. The figure is followed by Sea Value and the two its associated companies which were able to get 11,973 million baht with a market share of 14.9%. Kuldilok (2013) explained there are 25 tuna canneries in Thailand as follow;
Ref. code: 25616066090108XWU

41
Table 3.15 Revenue and market shares of tuna canneries in Thailand
No Company Sales 2005
(Million Baht) Market shares
(%) 1. Thai Union Group Co., Ltd. 30,026 37.4 a. Thai Union Frozen Products Public Co., Ltd. b. Thai Union Manufacturing Co., Ltd. c. S.C.C. Frozen Seafood Co., Ltd.
2. Sea Value Co., Ltd. 11,973 14.9 d. I.S.A. Value Co., Ltd. e. Unicord Co., Ltd
3. Chotiwat Manufacturing Co., Ltd. 5,192 6.5 4. Southeast Asian Packaging and Canning Co., Ltd. 4,439 5.5 5. Pattaya Food Co., Ltd 4,248 5.3 6. Kingfisher Holding Limited Co., Ltd. 3,886 4.8 7. Tropical Canning (Thailand) Public Co., Ltd. 3,044 3.8 8. Golden Prize Canning Co., Ltd. 2,868 3.6 9. R.S. Cannery Co., Ltd. 2,495 3.1 10. Asian Seafood Coldstorage (Suratthani) Co., Ltd. 1,882 2.3 11. M.M.P. International Co., Ltd. 1,717 2.1 12. HI-Q Food Product Co., Ltd. 1,652 2.1 13. Siam Tin Food Product Co., Ltd. 1,364 1.7 14. Pattani Food Industries Co., Ltd. 1,233 1.5 15. Sea Horse Public Co., Ltd. 895 1.1 16. Premier Canning Industry Co., Ltd. 818 1.0 17. Aurora Pouch Canning Industry Co., Ltd. 568 0.7 18. Pan Asia (1981) Co., Ltd. 559 0.7 19. Samui Co., Ltd. 534 0.7 20. P.B. Fishery Product Co., Ltd. 433 0.5 21. Mahachai Marine Product Co., Ltd. 178 0.2 22. Kiat Charoen Food Co., Ltd. 124 0.2 23. S.P.A. International Food Group Co., Ltd. 99 0.1 24. S.V. Food Co., Ltd. 95 0.1 25. Sirinan Food Co., Ltd. 47 0.1
Sources: Kuldilok, 2013
Ref. code: 25616066090108XWU
42
3.5.1 Strategy Thai canneries are engaged in several complex-production export
strategies. Research and Development as well as product innovation have become a major strength of the Thai industries since 1990. In addition, new product lines are developed by Thai companies and proposed to the big brands as innovative value added products (Campling, et al., 2007). Diversification of production is another strategy implemented by the canned tuna industry in Thailand. The majority of canneries do not solely produced canned tuna. They are all diversified into either the processing of other seafood, in order to allow Thai canneries to cross-subsidize between different production lines.
Thai Union as a leading tuna canneries plan to accelerate growth through strategic acquisitions, which will strengthen sourcing, production, and brand distribution across the world (Thai Union, 2015). This strategy has been collated into six basic pillars for its development.
The first is innovation. A strategic cornerstone for Thai Union is to drive forward cutting-edge technological advancements and innovative solutions that promote a competitive and sustainable seafood business. To find the most innovative product that is suitable to consumer’s demand, the company developed fundamental research platform.
The second is sustainability development. It means that the company concerns about the Environmental, Social, and Governance (ESG) in operating the business by promoting sustainability of supply chains and creating shared value in the communities.
The third is the strategy to ensure seafood value chain from sourcing to processing and manufacturing of raw materials and ingredients into finished product. Thai Union has built a global network of facilities which all operates to the highest quality standard and norm. In order to maintain its competitiveness of production cost the company uses operational excellent devices like, Kaizen, Six Sigma, or Hoshin Kanri.
Furthermore, merger and acquisition become the fourth strategy of the Thai Union. The company is allowed to expand its production bases and product
Ref. code: 25616066090108XWU

43
categories. The company systematically determines its target and collaborates with professionals to identify synergies that can be realistically created. Then the company would be addressed as part of 100-day plan post acquisition.
Thai Union also concerns about human capital development as their fifth strategy. A talent development program is designed to support the company’s leadership and strategy. These programs include cross functional project, stretched assignment, job rotation, international exposure program, coaching/ feedback, and classroom training programs.
The last strategy is securing continuous access to sufficient and sustainable raw material. In order to maintain stock availability and price volatility Thai Union developed an expansive flexible global sourcing network, buying from reliable traders, and buying country fishing licenses to gain control on fish availability.
On the other hand, the Indonesian tuna canneries tend to rely on the government’s roles in terms of determining strategy. According to Indonesian Tuna Factory stated that the government renews its policy to boost the Tuna industries. The first policy is the creation of the six new sub-sectors inside the fish product processing, in which foreign investor can invest. The next policy is about providing new equipment for fishing, storing, as well as facilities for processing for example ships with modern equipment and cooling storage. In addition, tuna canneries such as Aneka Tuna Indonesia and Sinar Pure Food, send their staff to access training development in Japan in order to improve the human resources of these two companies.
Nevertheless, several reasons remain the constraints of canned tuna development in Indonesia. Colocation is the main problem which limits raw materials as well as world market access. Indonesian canned tuna industries are situated in several locations, such as East Java, Bitung, Bali, Sorong, and Biak (Hamilton, et al., 2011).
In terms of Research and Development, Indonesian canneries have collaborated with national universities to increase their labor capacity especially in managerial and technology application. Besides, the government also established the National Tuna Commission (Komite Tuna Nasional/ KTN) to deal with any constraints
Ref. code: 25616066090108XWU

44
in exporting Indonesian canned tuna product to other countries. In addition, KTN comprehensively and systematically coordinated with the national stakeholders related to tuna production. The main goal of KTN is developing tuna industries by providing production and research policies (Cahya, 2010).
3.5.2 Rivalry Potential emerging canned tuna producers may jeopardize the
existing canned tuna processors, especially for those which are located not neighboring the EEZs with abundant tuna resources such as China, Vietnam, and the Republic of Korea (Miyake, et al., 2010).
3.6 Chance
Kuldilok (2013) estimated that chance or usually defined as uncontrollable
external factors, comes from the requirement from the importers, such as the requirement of standards and rules of origin. In the international market, exporters need to comply with particular standards and regulations in order for its product to be compatible with the requirements in the target market.
These conditions lead to the standards and regulations enacted by major canned tuna importing countries, such as Europe, US, and Japan. Consequently, exporters should comply with the standards and regulations in order to sell their canned tuna product to those importers. The table below explains the standards and regulations related to canned tuna product enacted by three major importers:
Ref. code: 25616066090108XWU

45
Table 3.16 List of standards enacted by the three major canned tuna importers
Country Standard Requirements
EU
Directive 2001/22/EC; Maximum Residual Limits (MRLs) of chemical contaminant and pesticide residue, including heavy metals (Cadmium, Lead, and Mercury). EC No 1881/2006; veterinary drugs and pesticide residue as well as histamine through Directive 91/493.
In 2002, the European Union (EU) enacted the regulation on Minimum Residual Performance Limits (MRPLs) to specify minimum concentration levels of detectable residue.
Since 2010, the EU attempted to combat IUU fishing through traceability of all marine products to hold catch certificates (EC 1005/2008).
US
Maximum residual limits of chemical contaminants and pesticide residue, including heavy metals (Cadmium, Lead, Arsenic, and Mercury), pesticide residue, and histamines through US Food and Drug Administration
HACCP became compulsory for importing to the US enacted since 1998
Dolphin safe label implemented since 2013
Japan
Maximum residual limits of chemical contaminants and pesticide residue, including heavy metals (mercury and methyl mercury), PCB, veterinary drugs, antioxidants, coloring, and bleaching agents under Food Sanitation Law.
The Food Safety Basic Law (FSBL) was established in 2003 to restrict substances without MRLs to zero tolerance.
Source: Rahmah (2016).
Ref. code: 25616066090108XWU

46
3.7 Government Intervention Government intervention means the government’s effort related to
regulations and institutions in supporting the development of fisheries sector and canned tuna industries on the economic development and environmental sustainability (Fatma, 2015). According to Porter's diamond model, government intervention has an impact to the national competitive advantage either positively or negatively.
3.7.1 Negotiation for Trade Agreement
The majority of canned tuna product is imported by the US, EU, and Japan. Both measured countries, Indonesia and Thailand conducted bilateral agreements with those main importers. Nevertheless, the import tariff duties which are enacted by importers to Indonesian and Thai producers are varied.
Table 3.17 List of tariff rates imposed by the three canned tuna importers
Partner Tariff rates (%)
Indonesia Thailand Japan 7.5 0
US 6-12.5 6-12.5 EU 20-24 24
Source: Campling, et al. (2007); Campling (2016); Rahmah (2016).
3.7.2 Regulating Raw Material Access Based on the previous section, Indonesian tuna canneries rely on
local vessels in accessing raw materials. However, the uncertainty of fishing catch leads to raw material shortages. According to APIKI (Association of Canned Tuna Industries in Indonesia), it claimed that the government allows for the import of raw materials to reach 20% of its production capacity. Unlike Indonesian canneries which rely on local vessels for raw materials access, Thai canneries depend on import due to its limited fishing vessels and sea territories. According to Hamilton (2011), around
Ref. code: 25616066090108XWU
47
85% of raw materials for canning industry in Thailand are imported mostly from Taiwan, the US, South Korea, Vanuatu, China, and Indonesia which associated as the Western and Central Pacific Ocean (WCPO).
3.8 Conclusion
This chapter explains the big picture of tuna canneries development in
Indonesia and Thailand. Historically, canned fish industry started in France and propagated among European countries in 1822. It begun with sardines as the raw materials before tuna albacore was used in 1860s (Miyake, et al., 2010). Then, canned tuna industries expanded to the US in 1917. Since then, the US canned tuna company experienced “low cost competition” in terms of labor wages compared to Japan and Thailand, and canned tuna production shifted to Asian countries, including Indonesia, Thailand, and the Philippines.
General overview of tuna canneries performance in the global market shows that both producers have significant differences. Despite both producers commenced developing tuna canneries in the same period; Indonesia in 1974 and Thailand in 1972, their export capacities are in contrast. According to the data provided by UN Comtrade, Indonesian canned tuna processors exported 62,000 mt annually between 2006 and 2016 with an export value approximately 247 million USD per annum. Meanwhile, Thai tuna canneries were able to transship their product to the global market around 545,000 mt per year valued in more than 2 billion USD during the same analyzed period.
The competitiveness factors of tuna canneries development according to the diamond model’s perspective are that both countries possessed similarities and differences. Mainly, the analyzed countries are different in accessing workforce and raw materials. Related and supporting industries also differ between Indonesia and Thailand. Then, cannery’s structure and strategy as well as government intervention have different pattern. Nevertheless, the competitiveness factors are similar in the three factors, namely demand condition, rivalry, and chance / standards.
Ref. code: 25616066090108XWU

48
CHAPTER 4 FINDINGS AND ANALYSES: THE INFLUENCE OF INTERNAL AND EXTERNAL
FACTORS TOWARD COMPETITIVE ADVANTAGE OF CANNED TUNA INDUSTRIES IN INDONESIA AND THAILAND
Based on the overview in the chapter III related to tuna canneries
development, this chapter discusses, compares, and analyzes how the internal and external factors influence the tuna canneries performance in Indonesia and Thailand. According to M. Porter each of the determinants singly and jointly contributes to or detracts the national advantages. The determinant of national advantage constitutes a complex system, due to a lot of national characteristic influencing competitive success (Porter, 1990). 4.1 Comparison in Factor Conditions
In this section, the analytical comparison of Indonesian and Thai tuna canneries development was performed under the sub-parameters of the factor condition of diamond model. Based on the obtained data, labor cost and raw materials were the measured aspect of factor condition. According to ILO (2014) minimum labor wage in Indonesia is 174 USD per month, lower than in Thailand with 357 USD per month. In addition, the Indonesian tuna canneries are supplied by abundant domestic workers, while Thailand hires migrant workers from neighboring countries such as Myanmar and Cambodia. Campling and Doherty (2007) estimated the data from the Thai government office which stated that around 50% of labor in Thai tuna processors are migrant worker from Myanmar. Migrant workers from Laos and Cambodia were also hired in Thai canneries sectors (Kuldilok, 2009). Migrant workers have an impact on higher labor cost due to the transaction cost involved in sourcing migrant workers, which includes transport to Thailand, agency service fee, local government registration, and housing (Hamilton, et al. 2011). Therefore,
Ref. code: 25616066090108XWU
49
Indonesian canned tuna processors have better competitiveness since the country is able to supply abundance of cheap labor force compared to Thailand.
However, Kuldilok argued that the lower labor cost in Thailand compared to the US leads to major tuna canneries in the US and Japan shut down their processors and import canned tuna product from Thailand. The low labor cost in Thai tuna industry has been promoting the country to become the highest canned tuna exporter in the world. Nonetheless, the competitiveness was predicted as being unable to sustain in the future due to the increase in labor cost and higher living standard (Kuldilok, 2013).
Raw material access is also counted as a factor condition influencing the performance of canned tuna processors. Indonesian canned tuna canneries rely on domestic raw material caught by local vessels. However, although Indonesian tuna fishing vessels supply abundant raw materials, some of the tuna catch were transported to global market due to a more accessible landing port (Hamilton, et al.). Then, Indonesian tuna also were not well-managed because of several issues such as the limitation or less developed port facilities and sea-freight which impact to low quality of tuna (Apridar, 2014).
Meanwhile, Thai canned tuna processors imported around 85% of raw tuna since the number of domestic tuna vessels was limited. The unpredictable of imported raw materials price has influenced the canned tuna processing in Thailand. The raw materials for canned tuna are mainly received from skipjack and yellowfin prices. Thailand is the largest importer of frozen tuna and skipjack price was determined by Bangkok market, while yellowfin price is determined in Italy. This uncertainty of these two raw tuna leads to higher production costs which makes Thailand has competitive disadvantages compared to its competitors (Kuldilok, 2013a). Even though Thailand hold preeminent position in the global canned tuna market with 692,870 tons annually, its profit eroded since imported raw materials are counted for 70% of the production costs (Errighi, 2016). However, the strategic geographical location for dispatching leads Thailand to access low cost supplies of raw tuna both from the Pacific and Indian ocean (Campling & Doherty, 2007). Moreover, the majority of Thai tuna canneries are based in and around Bangkok
Ref. code: 25616066090108XWU

50
which allow them to import raw materials as well as export their final product efficiently. 4.2 Comparison in Demand Condition
Domestic demand of canned tuna product in both Indonesia and Thailand are limited. Therefore, tuna canneries in the two analyzed countries rely on global demand. Around 95% of Thai canned tuna products are supplied to global market particularly to Europe, Japan, and the United States (Asia Foundation & ILO, 2015). According to the data provided by UN Comtrade, the three major canned tuna importers namely the US, European Union (Italy, UK, Spain, France, and Germany), and Japan remain stable in consuming canned tuna during the last four years (see. Table 4.1.). Those three importers are the main export destination countries for the Thai and Indonesian canned tuna product (Hamilton, et al., 2011). In general, the global demand of canned tuna product has consistently escalated, which benefit the canned tuna processors to boost their export volume and value.
Table 4.1 Canned tuna traded inflow by three major importers
Country
2017 2016 2015 2014 Volume
(mt) Value (mil
USD) Volume
(mt) Value (mil
USD) Volume
(mt) Value
(mil USD) Volume
(mt) Value (mil
USD) The EU 542,969 2,775 483,468 2,194 515,703 2,389 514,574 2,859 The US 205,497 976 194,812 839 202,941 908 236,868 1,099
Japan 62,962 346 60,396 299 54,538 270 54,256 297
Source: UN Comtrade, 2018
American market is the largest and the oldest canned tuna market in the world. The US demand for canned tuna product has rapidly expanded since the 1970s due to the increased consumption and decreasing domestic production. Thailand is the largest canned tuna exporter to American market (Hamilton, et al.).
Ref. code: 25616066090108XWU

51
According to the data provided by UN Comtrade, Thai canned tuna export to the American market is around 10 fold than Indonesian export during ten years period of time. Canned tuna product from Thailand dominated between 40% and 50% in the US market.
Figure 4.1 Comparison of canned tuna export in the American market Source: UN Comtrade, 2018
In the European market, the per capita consumption of canned tuna
product is stabilizing with 1.38 kg annually in 2008. Spanish is the highest canned tuna consumer with 3.1 kg in a year, followed by Italian and British 2.33 and 2.15 kg respectively (Hamilton, et al.). Canned tuna consumption in Europe is predicted to continuously grow and considered as a mature canned tuna market. Since 2002, canned tuna supply in EU has shifted from domestic/ regional production to non-EU member countries, including Thailand and Indonesia. The top 13 canned tuna supplier enjoyed free duty access either under GSP+ or interim EPAs, with the exception of three Southeast Asian producers namely Indonesia, Thailand, and the Philippines. Nevertheless, Thailand was able to double its canned tuna export to European market between the periods of 2000 to 2009, the Philippines has also increased its shares by around 23% over the same period. Meanwhile, Indonesia lost
0
50,000
100,000
150,000
200,000
250,000
300,000
2008 2009 2010 2011 2012 2013 2014 2015 2016 2017
The US Import Thai Export Indonesian Export
Ref. code: 25616066090108XWU

52
its export share by 16% (Hamilton, et al.). However, according to the data provided by UN Comtrade, in terms of volume, the Indonesian canned tuna export experienced an increase from 9,591 mt in 2008 to around 20,000 mt in 2014, but it then gradually decreased to about 13,000 in 2017. In contrast, although the Thai canned tuna product is still higher than the Indonesian export to the EU market, its share tends to decreased during the last decade from 61,643 mt in 2008 to 28,266 mt in 2017.
The declining export share of the Thai product to the EU is caused by migrant labor issues in Thai fisheries. International mass media such as the Guardian, New York Times, and Associated Press published that migrant workers in the Thai fishing industry often sacrifice from inappropriate payment, less freedom, and being abused (Hodal & Kelly, 2014). In response to these issues, the European Union issued a “yellow card” warning to the Thai fishing industries. The European parliament also intends to ban importing Thai fishing products if Thailand fails to clean the industry. Furthermore, the US also ranked Thailand on its “Tier 2” watch list which just one rank below the worst rating, in its latest human trafficking issues (Smith, 2018). Consequently, Thai canned tuna processors experience more challenges in accessing European market.
Figure 4.2 Comparison of canned tuna export in the EU market Source: UN Comtrade, 2018
0
100,000
200,000
300,000
400,000
500,000
600,000
2009 2010 2011 2012 2013 2014 2015 2016 2017
The EU Import Thai Export Indonesian Export
Ref. code: 25616066090108XWU

53
Generally, Japanese demand of canned tuna consumption significantly decreased in the last 30 years and at best, is stagnant. This is mainly caused by the low population growth, an ageing population, and changing consumer’s preferences for alternative protein sources (Campling, 2015). Thai canned tuna product dominated the Japanese market followed by Indonesia and the Philippines, while others are minor in comparison. Thailand has been the dominant supplier to Japan for almost twenty years and likely continues to grow, since the Japanese government gives tariff exemption to Thai product under the Japan-Thailand Economic Partnership agreement (Campling, 2015). Thai canned tuna export is around triple the Indonesian export into Japanese market during the last ten years in both volume and value.
Figure 4.3 Comparison of canned tuna export in the Japanese market Source: UN Comtrade, 2018
In addition, the global demand of canned tuna product also comes from new emerging consumers, such as Australia and China (Campling, 2015). Australia’s import of canned tuna product significantly increased by 47% from 41,875 mt in 2010 to 61,361 mt in 2014. Thailand dominates the Australian market by 90-97% share during 2010 to 2014, followed by Indonesia as the second largest supplier. Small
0
10,000
20,000
30,000
40,000
50,000
60,000
70,000
2009 2010 2011 2012 2013 2014 2015 2016 2017
The Japanese Import Thai Export Indonesian Export
Ref. code: 25616066090108XWU
54
volumes are also imported from the Philippines, South Korea, and China (UN Comtrade, 2015). In China, the increasing number of middle class economic group leads to rise of value-added and processed canned tuna product sold in the supermarket. Canned tuna imported by China almost doubled to 92% from 1,757 mt in 2010 to 3,382 mt in 2013. Moreover, the relative value of canned tuna import even rocketed at 267% growth, from 4.8 million USD in 2010 to 17.6 million USD in 2013 (UN Comtrade, 2015). Similar to the Australian market, the Chinese market is also dominated by canned tuna product processed in Thailand. 4.3 Comparison in Related and Supporting Industry
Related and supporting industries are defined as the companies that
coordinated and cooperated in the value chain of canned tuna productions or those that are included as complementary products. Cold storage, shipping, ports, packaging, logistics, and the fishing sectors are categorized as the major related industries in canned tuna industries (Kuldilok, 2013). Indonesian canned tuna industries are supported by around 600,000 tuna vessels operating across the country. Indonesian fishermen primarily capture tuna by angling, trolling lines, poles and lines, longlines, and purse seiners. In 1979, there were 18 tuna longline, 513 poles and lines, 1706 purse seine, and 32,538 troll line fishing boats operating in Indonesia. Then the number of operating vessels significantly increase in the next three decade to 10,345 tuna longliners, 12,727 pole and lines, 18,423 purse seiners, and 84,953 troll lines in 2009 (Sunoko & Huang, 2013). Nevertheless, the Indonesian government is still eager to accelerate the number of capturing tuna by enacting Ministry Regulation No Per.06/MEN/2010. The regulation is objected to endow fisherman, ensure food security, and also increase marine capture fisheries production at the level 0.5% annually from 2010 to 2014. In order to support this strategic plan, the government plans to build 1,000 vessels with a capacity of 30 GT each (MMAF, 2010).
Moreover, the abundant domestic tuna vessels are also supported by fishing ports which are separately located across the country, such as Bitung, Sorong,
Ref. code: 25616066090108XWU

55
Kendari, Ternate, Ambon, and Biak for Eastern Indonesia, and Muara Baru (Jakarta) as well as Telok Benoa (Bali) for Western Indonesia (Rahmah, 2016) According to the Ministerial Regulation (Permen KP Nomor PER.08/MEN/2012 on Fishing Port) there are four types of fishing port:
Table 4.2 Fishing Port in Indonesia Category Type Amount
Class A Pelabuhan Perikanan Samudera (PPS)/ Oceanic Fishing Port 7 Class B Pelabuhan Perikanan Nusantara (PPN)/ Archipelagic Fishing Port 16
Class C Pelabuhan Perikanan Pantai (PPP)/ Coastal Fishing Port 44
Class D Pangkalan Pendaratan Ikan (PPI)/ Fish Landing Place 1023
Source: Indonesian Marine Fisheries Book, 2017
Nevertheless, canned tuna processors as well as fishing port which are widely dispersed lead to higher transportation costs. Therefore, it influences the less competitiveness of production cost to Indonesian canned tuna industries (Hamilton, et al., 2011). The main competitive disadvantages include the inefficient and expensive product distribution within Indonesia, distance from the main markets, and relatively high international transshipment costs compared to major canned tuna exporter such as Thailand (Hamilton. et al.)
In the case of Thai tuna canneries, the number of domestic vessels is limited due to two reasons. The limited number of domestic vessels is caused by several issues. First, the investment cost of fishing vessels is really expensive. There are only two Thai tuna canneries that invested in fishing vessels (Kuldilok., 2013). The Thai Union Group invested in five fishing vessels -around 1,400 million Baht- which supply 8-10% of the total raw tuna for their company’s production in 2007 (The Thai Union Group, 2007; Kuldilok.,2013). Another cannery is Sea Value which invested about 1,000 million Baht in 2007 (Turakit, 2007; Kuldilok., 2013). Meanwhile, the other tuna processors are not able to invest in fishing vessels due to firm’s financial
Ref. code: 25616066090108XWU

56
abilities. Second, the number of fishermen, expert captain, and crew were scarce (Kuldilok., 2013).
Nonetheless, a huge number of foreign vessels particularly from Taiwan, China, Indonesia, Vanuatu, Malaysia, Belize, India, and Bolivia, supply abundant raw materials for Thai tuna canneries. The whole catch of foreign vessels unloaded in Phuket soared from 1,416 MT in 1995 to 5,846 MT in 2014 (Nootmorn, 2015). This indicated that limited domestic vessels do not negatively impact to Thai tuna processors’ competitiveness, since there are abundant raw materials supplied by foreign vessels.
Moreover, the Thai tuna industries are supported by sophisticated relating industries. Firstly, some large processors efficiently keep their frozen tuna in cold storage before processing. Secondly, canned tuna processors are mostly located close to the ports for efficient transshipment. Third, there are around 20 companies which produce can for canned tuna factories. Moreover, can processors increase to 30 companies in 2005 (Hayes, 2005). Those, supporting industries and facilities significantly escalate the competitiveness of tuna industries in Thailand (Puttipokin, 2001). Campling & Doherty (2007) estimated that lower can price in Thai industries will lead to 5% lower canned tuna product in Thailand than in Mauritius and the Seychelles. Moreover, cheaper can price also boost FDI in flow to canned tuna firms in Thailand particularly from the US investor (Campling, Havice, & Ram-Bidesi, 2007). 4.4 Comparison in Firm’s Structure, Strategy, and Rivalry
Michael Porter (1990) claimed that each nation poses various goals,
strategies, and ways in organizing industries. A compatible industries organization with sources of competitive advantage in a particular industry promotes national competitiveness. Then, domestic competition significantly contributes to process of innovation and ultimate prospect for international success.
In terms of firm structure, the Indonesian and Thai tuna processors have different patterns. The Indonesian canned tuna industries have equal production capacity, while Thai canned tuna industries are oligopolistic market (Hamilton, et al.).
Ref. code: 25616066090108XWU
57
Consequently, dominant producers in Thailand become the price leader, while other smaller companies are price-follower (Kuldilok, 2013). The two canned tuna producers play dominant roles in Thailand, namely Thai Union (1,000 mt/day) and Sea Value (850 mt/day). Unlike Thailand which canned tuna processors are dominated by two major canneries, the Indonesian tuna canneries possess equal production capacity of approximately 5,000 to 30,000 mt per annum for major 6 processors and 1,000 to 6,000 mt per annum for minor processors (Hamilton, 2011).
Thai canneries are engaged in several complex-production export strategies. Research and Development and product innovation became a major strength of the Thai industries since 1990 (Campling, et al., 2007). The biggest challenge of Thai tuna canneries is limited domestic raw material supply. Therefore, Thai tuna processors are centralized in Bangkok in order to ensure raw tuna trading company to sell their goods easily. This commercial guarantees essentially lock-in place Thailand’s dominance, as newly emerging exporter that do not have domestic supply such as Vietnam. Moreover, Thai tuna firms also cooperated with the Taiwanese (and other) tuna fleets to secure raw materials supply (Campling, et al.). Then, by centralizing the canneries in Bangkok, Thai tuna canneries get access of raw materials and export transshipment effectively and efficiently.
Diversification of production is another strategy implemented by the canned tuna industry in Thailand. The majority of canneries do not solely produce canned tuna. They are all diversified into other processed seafood, in order to allow for Thai canneries to cross-subsidize between different production lines. Then, if canned tuna price drops, the firm can still obtain profitability through another product while maintaining the economies of scale through canned tuna production (Campling, et al., 2007).
In contrast, Indonesian tuna canneries which are situated separately in East Java, Bali, Sorong, and Biak lead to the difficulties in accessing raw materials as well as export transshipment. Hamilton argued that widely dispersed unloading ports and relatively high international transportation cost are the main constraints which affect Indonesian canned industry to be less competitive than other exporters. Nevertheless, in terms of Research and Development, Indonesian canneries have
Ref. code: 25616066090108XWU

58
collaborated with national universities to increase labor capacity, especially in managerial and technology application. Besides, government also established the National Tuna Commission (Komite Tuna Nasional/ KTN) to deal with any constraints in exporting Indonesian canned tuna product to the other countries. In addition, KTN has comprehensively and systematically coordinated with national stakeholders related tuna production. The main goal of KTN is to develop the tuna industries by providing production and research policies (Cahya, 2010).
Moreover, Thai tuna canneries such as Thai Union implemented comprehensive strategy from accessing raw materials, product innovation, research development as well as market expansion. In comparison, the two major Indonesian tuna canneries such as Aneka Tuna Indonesia and Sinar Pure Foods did not implement comprehensive and integrated strategies. Nevertheless, the companies are concerned about human resources development as well as research and development by cooperating with local and international expertise.
In case of rivalry, potential emerging canned tuna producers may jeopardize the existing canned tuna processors especially for those which are not located neighboring the EEZs with abundant tuna resources such as, China, Vietnam, and the Republic of Korea (Miyake, et al., 2010). China has processed tuna export doubled from 24,000 mt in 2010 to 83,000 mt in 2015. Market expansion for canned tuna was prominent in the African region. In volume, China canned tuna export almost equal to Indonesia (Anthonysamy, 2016). Vietnam is also considered as an emerging canned tuna exporter that has been developed since the early 2000s. Vietnam’s canned tuna export has constantly increased, especially to the US market which brought them as the third canned tuna supplier in the US, after Thailand and the Philippines in 2009 (Hamilton, et al., 2011).
Ref. code: 25616066090108XWU
59
4.5 Comparison in Chances
Porter assumed that chance holds crucial roles in determining competitiveness of an industry, due to its ability to create unsustainability which enables shifts in the competitive position. Chance can erode the advantage of existing competitors and create the potential that a new nation industry can replace them to obtain competitive advantage in response to novel and different condition. According to this definition, non-tariff barrier (NTB) measurement / standard becomes external factor which influence tuna canneries development.
Kuldilok (2013) estimated that chance or usually defined as uncontrollable external factors, come from importer’s requirements, such as requirement of standard and rules of origin. In the international market, exporters need to comply with particular standards and regulations in order for its product to be compatible with the requirement in the target market. In the fish and fishery trade, increasing complex standards have been established. The standards are aimed to avoid foodborne illness and increase consumer’s awareness of healthy and sustainable product (Rahmah, 2016). Meanwhile, as major canned tuna processors in the world, Indonesia and Thailand still fail in complying traceability and sustainability access in obtaining raw tuna (Greenpeace, 2016).
Government and private organizations enact certification and the implementation of food handling procedures (including for tuna) as a method to ensure consumers obtain certain level of quality and safety (Campling, et al., 2007). Theoretically, the methods protect consumers from the danger of food spoilage or contamination or to give consumer information about the variety of product. From a business point of view, they protect producer against potential litigation by consumers who might otherwise be impacted by these threat i.e. becoming sick as an impact of high level of histamine in tuna.
Ref. code: 25616066090108XWU

60
4.5.1 European Union The EU is by far the strictest market to enter in terms of the scale
and scope its requirement for food safety and quality standard. In addition to HACCP and public and private traceability regimes, there is an array of relevant procedures and related regulations on importing food products. The current basic framework for fisheries product is regulated by a series of directives that apply to primary producers of fisheries product. These directives require member state and exporters to put in place inspection and control system to ensure the safety of fisheries products, including the implementation of Good Hygiene Practices (GHPs) and Hazard Analysis and Critical Control Point (HACCP) system (Campling, et al., 2007).
In addition, EU regulation 466/2001 determines the maximum limits for heavy metal in a number of species of fish and shellfish, and EU regulation 2065/2001 on labeling information for fishery and aquaculture product requires a label to provide information on the trade name of the species, method of production (capture or aquaculture), and country of origin. Finally, the EU is developing a legal framework to regulate the development of eco-labels and voluntary certification and a guideline to monitor the claim (Campling, et al., 2007).
In terms of combating Illegal, Unregulated, and Unreported (IUU) fishing the EU enacted Council Regulation No. 1005/2008, which was officially implemented in 2010. Under this regulation, all fish imported by the EU member countries must be accompanied by a catch certificate verified by an authority of the vessel’s flag state (and qualifying RFMO if relevant). The EU can block fish imports from non-cooperating exporters (Bellman, et al., 2016). In 2015, the EU authority issued a yellow card to Thailand for not taking sufficient measures in the international fight against IUU fishing (European Commission, 2015).
4.5.2 United States Official standard enacted by the US government are significantly
more lenient than the EU import standard. However, there still are some strict policies that exporter to the American market should be aware of. For example, private traceability demands, particularly from major food retailers, present logistics, and technical problems for exporter and firm. Then, post 9/11 terrorist attack,
Ref. code: 25616066090108XWU

61
American government has created new “bio-terrorism legislation” which requires all domestic and foreign food suppliers to register with the FDA so that the organization can respond to an attack on the US food supply by accessing information about facilities and process of production.
In addition, consumers’ concern over mercury on tuna has led to several legal disputes over the safety and quality of mercury in tuna. The US Environmental Protection Agency (EPA) has issued an allowable reference dose, and several independent certifiers have started to test tuna product and label them as “safe” if they are below the reference dose (Campling, et al., 2007).
In dealing with IUU fishing, the American government implements ban on products from non-cooperating flag states under the Magnuson-Stevens Fishery Conservation and Management Reauthorization Act of 2006. If the exporters take insufficient action to comply with the regulation, the US may deny their vessels entry to the US port and/or ban import of fish product (Bellman, et al., 2016).
4.5.3 Japan The Japanese Agricultural Standard System requires that the labels
must have the name, country origin for fish, content quality, manufacturing date, and the preservation method for processed marine product (JETRO, 2005). Then, product quality is measured with consideration to the time between the capture and final sale and the packaging of tuna. There are a number of other complex attributes of product quality in the Japanese market that influence the commodity price (Campling, et al., 2007).
Besides, Rules of Origin (RoO) has significant influence on canned tuna trade flow. On one hand, RoOs are implemented as an evidence of the origin of a product, which goods are eligible for exempted/zero import tariff under free trade agreement (FTA) or under various trade preference schemes. On the other hand, RoO may be used as non-tariff barrier to trade or to protect some product or sectors from competition. Hence, in other word, negotiating RoO can be aimed at either facilitating or restricting trade (Julintron & Chalatarawat, 2007). Estevadeordal and Suominen (2005) assumed that RoO can increase both administrative cost and increase production cost to party applying them and as a result eliminate the benefit of FTA.
Ref. code: 25616066090108XWU
62
Bellman, et al. (2016) argued that food safety standard such as food certification and traceability in export market can lead to the formation of two categories of fisheries producers in developing countries. First, large-scale producers with capital are required to make investments to meet strict sanitary requirements in some import market destinations. Second, domestic and global demand of smaller-scale producers will be reduced. Then, Rahmah (2016) estimated that the imposition of standards by importers negatively impacts on canned tuna export from three major canned tuna exporters in ASEAN, namely Indonesia, Thailand, and the Philippines. The imposition of specific requirements will reduce 42.76% canned tuna export. Then, the national standard leads to 53.57% reduction of canned tuna export. When the importer enacts stricter standard, the reduction of canned tuna export is 70.91%. Hence, the stricter standard was enacted by importers impact to lower trade flow of canned tuna product. Nevertheless, the standard imposition indirectly has an impact on the improvement management system that would presumably improve the status of target stock and potentially the stock’s broader ecosystem (Bellman, et al., 2016).
4.6 Comparison in Government Intervention
4.6.1 Negotiating import tariff duty
Thailand fishery policies are objected to maintain its position as the world leading canned tuna producer. The Department of Fisheries attempts to maintain and increase the supply of raw tuna to Thai canneries (Kuldilok, 2013b). Thai government developed overseas fisheries by increasing catch capacity, technology for fishing vessels, and controlling and regulating fishing operation by conducting joint-venture partners with other coastal states (Kuldilok). The ministry of commerce supported the industry by encouraging new products and new exporters to meet with high global demand. Foreign trade policy is objected to accelerate competitiveness and the country has involved to several bilateral free trade area (FTA) whereby tariff rates were eroded.
Ref. code: 25616066090108XWU
63
Government intervention meaning that related regulations and related institution in supporting the development of fisheries sector and canned tuna industries on the economic development and environmental sustainability (Fatma, 2015). If we compared tariff duties imposed by three major importers, namely the EU, the US, and Japan toward canned tuna product from Indonesia and Thailand, Thailand has lower tariff duties (0%) to Japanese market instead of Indonesia (7.5%). Meanwhile, the tariff rate imposed by the EU and the US are similar at 20-24% and 6-12.5% respectively. The lower tariff rates are translated into higher export volume and value to the importers (Campling, 2015).
According to Indonesian Marine and Fisheries Book (2017), Indonesia and the EU are currently in the beginning process of negotiation on free trade of IEU-CEPA (Indonesia-European Union Comprehensive Economic Partnership Agreement). Indonesian Ministry of Marine and Fisheries should be able to secure the interest of this sector in the related agreement such as trade, service, and capacity building. Indonesia is conducting IEU-CEPA which aimed to make Indonesia as a fulcrum of the biggest fisheries production in the world especially through the following;
a) Improvement of FDI from European member countries into Indonesia
b) Transfer of science and technology as well as technical assistance of the EU
c) Market access expansion for Indonesian fisheries product into European market
d) The elimination of import tariff for Indonesian marine and fisheries product to market in Europe.
The import tariff imposed by the EU is the highest among the top three canned tuna importers (20-24%). Therefore, negotiating import tariff duty with the European Union becomes the main concern of the Indonesian government.
Moreover, the Indonesian government negotiation with the American government is also currently conducted. The Memorandum of
Ref. code: 25616066090108XWU

64
Understanding (MoU) of Maritime Cooperation and Plan of Action of Maritime Cooperation between Indonesian and the US has been agreed. Besides, eliminating import tariff, the biggest challenge of Indonesian fisheries product to the American market is meeting the standard of regulation regarding to the Seafood Import Monitoring Program (SIMP), Marine Mammal Protection Act, and Traceability (IMFB, 2017). As explained in the previous section, the regulation of standard has a negative influence on canned tuna trade flow, consequently importers should comply the regulation by upgrading its product and process of production.
Indonesia has also ratified a bilateral trade agreement with Japan under the Indonesia Japan Economic Partnership Agreement (IJEPA) in 2006 (MoFA, 2018). However, IJEPA still imposes import duty for Indonesian fisheries products of 3.5% for raw tuna and 7.5% for prepared or canned tuna. Meanwhile, Thailand under Japan Thailand Economic Partnership Agreement (JTEPA) can gradually eliminate import tariff duty for its product from 5.3% in 2007 then became zero duty as 2013 (Rahmah, 2016). According to the Director of Product Competitiveness Marine and Fishery Department, Nilanto Perbowo claims that Indonesia loss 12 million USD of potential revenue from fishery sector during 2017 (Katadata. 2017). The Indonesian government has started to renegotiate the IJEPA through general review since 2015. The general review is aimed to evaluate as well as adapt the agreement toward the current situation, therefore the agreement can promote reciprocal benefit for both countries. Furthermore, negotiation continued to the sixth general review of IJEPA on 29-30 November 2017 in Tokyo, Japan. However, the agreement is still unachieved. Consequently, both countries held the seventh general review on 28-30 March 2018 in Bali. According to press release from Ministry of Trade of Republic Indonesia, both countries targeted that the general review can be accomplished by the end of 2018 (Ministry of Trade of RI, 2017).
Moreover, in order to promote the Indonesian tuna product to Japan, the Indonesian government participated in 17th Japan International Seafood Technology Expo in 2015 (Ministry of Trade of RI, 2017). This strategy was aimed to convince Japanese consumers that Indonesian tuna products possess high quality
Ref. code: 25616066090108XWU
65
standard of Japanese market. Unfortunately, Indonesia did not participate in the following two years (2016 and 2017) of the expo.
Unlike Indonesia who is still negotiating import tariff elimination with the major importers, Thailand has already succeeded in negotiating with Japan and other importers such as Middle East, Canada, and Australia. Therefore, Thai canned tuna product has better competitive advantage in those import destination countries. Nevertheless, Thailand and Indonesia are still unsuccessful to negotiate with the European Union and the US. In this case, Thailand and Indonesia could cooperate to resolve the rules of origin barriers (Kuldilok, et al., 2013).
In terms of canned tuna industries, government’s roles in negotiating import tariff duty becomes a crucial factor which determines tuna canneries development. Campling (2015) found that the tariff duty has a significant benefit to canned tuna exporter to boost the export volume and value.
4.6.2 Policy of raw tuna import Government’s role in allowing raw materials import also
significantly influences the tuna canneries’ performance. The Indonesian government only allows tuna canneries to import raw materials as much as 20% of its production capacity. Therefore, when raw materials supplied by domestic vessels decreased, and some of Indonesian tuna canneries are only able to produce a half of their production capacity (Ginoga, 2017). In contrast, since Thai tuna canneries rely on 85% of raw materials import, the government has total support in accessing raw materials from global supply. Thai government also expands their overseas fishing fleets by cooperating with coastal states or joint venture partners (Kuldilok, 2013). Depending on imported raw materials allow Thai canneries enjoy huge number of raw material supplies, then, increase its productivity on maximum level.
Ref. code: 25616066090108XWU

66
4.7 Analysis Tuna canneries based in Indonesia and Thailand have different
competitive advantages according to the Diamond Model’s perspective. Therefore, canned tuna production and trade chains differ between both analyzed countries. Canned tuna supply chain is mainly divided into three main stages; fishery, processing (subdivided into loining and canning), and retail and distribution (Erighi, et al., 2016). The elaborated comparison of those differences is provided in the sections below.
4.7.1 Fishing
In Indonesia, tuna canneries obtained raw tuna from domestic vessels. According to the Indonesian Geospatial Information Agency No. 13-3.4/ SESMA/16D/07 /2014, the Indonesian fishing potency is around 9.932 million tons in 2016. Meanwhile, Indonesian fisheries production capacity is around 6 million tons, meaning that Indonesian fisheries possess huge potency to be developed. This condition positively influenced canned tuna chains to the country. Moreover, the number of tuna vessels are abundant, around 600,000 operate in the country which are supported by well-developed fishery facilities.
Nevertheless, the colocation of fishing spots as well as canned tuna processors which are separately located across the country have a negative impact on the raw materials access for domestic canned tuna industries. Hamilton argued that separated location impacts to higher transportation costs from fishing spot to the canned tuna producers. Therefore, tuna fishing vessels preferred to sell their catch to closer processor located in another country. In 2015, Indonesia exported frozen tuna for more than 70,000 ton, which contributed only 109.2 million USD (ASTUIN, 2015). Consequently, during the low catch season, Indonesian tuna canneries cannot produce as much as their capacity. However, the Thai government allows for tuna canneries to import raw materials leniently (Kuldilok, 2013), Indonesian government policy only allows tuna canneries to import raw materials as much as 20% of its production capacity. Ginoga (2017) found that during the low
Ref. code: 25616066090108XWU
67
season, the Indonesian tuna processors are only able to produce a half of its total production capacity.
In contrast, Thai domestic tuna vessels are limited, therefore tuna canneries need to import raw materials (accounted for 85%) to fulfill domestic tuna producers (Kuldilok, 2013). However, the Thai government which has a flexible policy on imported raw tuna subsidizes the limited raw tuna sources from domestic vessels. Thai tuna canneries are also supplied by foreign vessels which unloaded their catch in Phuket. Nootmorn (2015) estimated that around 5,846 MT raw tuna unloaded in Phuket were caught by vessels from Taiwan, China, and Indonesia. Hence, Thai tuna canneries have abundant raw tuna sources. In addition, Thailand’s geographical location is really strategic to access low cost raw tuna supplies from the Pacific and Indian oceans. This strategic location translates to the canneries’ ability to import year-round supply (Campling & Doherty, 2007).
Meanwhile, in terms of fishing traceability and sustainability, tuna processors based in Indonesia and Thailand both still failed to fulfill the standard. Greenpeace (2016) survey result showed that tuna canneries in Indonesia and Thailand are mostly still incompatible with traceable, sustainable, and equitable tuna supply chain. As a result, three major importers (United States, European Union, and Japan) enacted strict standard and rules of origin (RoO) toward canned tuna product from those two analyzed countries.
4.7.2 Processing Processing is the most important stage in canned tuna production
chains. It is composed into four main stages, namely preliminary operation, processing, final operation, and auxiliary operation (see point 3.2. in chapter III).
The huge number of low labor cost in Indonesia positively influences the production cost of canned tuna industry. Unlike in Indonesia, Thai tuna canneries faced complicated issues in accessing workforce to the industries. Thai tuna canneries need to hire migrant workers which are much more expensive since the employer needs to spend for transaction cost including transportation, accommodation, and service payment to the agency (Hamilton, 2011). Labor cost
Ref. code: 25616066090108XWU
68
became the vital issue since it counted 6-8% to final canned tuna product (Campling & Doherty, 2007).
Migrant labor issues in Thai fisheries are considered as the high concern for foreign countries, especially major importers of Thai fisheries product such as the EU and the US. In 2014, International mass media such as the Guardian, New York Times, and Associated Press published that migrant workers in Thai fishing industry often become the victims of inappropriate payment, less freedom, and being abused (Hodal & Kelly, 2014). In 2015, Asia Foundation and ILO also revealed that migrant workers, especially child labor in shrimp and seafood industries based in Thailand are more frequently exposed to occupational hazards such as work with fire, gas, and flames. Children who work in this industrial sector also experience more vulnerable condition such as being injured and suffering from health problems.
In responding these issues, the European Union issued a “yellow card” warning to Thai fishing industries. European parliament also intends to ban exporting Thai fishing products if the country fails to clean the industry. Furthermore, the US also ranked Thailand on its “Tier 2” watch list which is only one level below the worst rating, in its latest human trafficking issues (Smith, 2018).
Canned tuna processors are included as part of seafood industries which are monitored by the international and national related stakeholders, in terms of hiring migrant workers. Thai canneries relied on migrant worker due to limited native workforce (Hamilton et al., 2011). According to the data from ILO (2015), it is estimated that 200,000 or around 60% of employees in Thai canned tuna processors are migrant workers primarily from Myanmar. As tuna canning industries are categorized as labor intensive, low cost migrant worker benefits to the industries.
However, Thai canned tuna industries are positively supported by integrated relating industries such as modern cold storage, efficient transshipment due to strategic collocation, and can producers (Hayes., 2005). Campling and Doherty (2007) estimated that domestic can producers repress 5% to Thai canned tuna product. In contrast, Indonesian canned tuna is not supported by related industries such as can producers. Therefore, it negatively influences the competitiveness of Indonesian tuna canneries during the production stage.
Ref. code: 25616066090108XWU

69
In terms of research and development, Indonesia has developed 13 aquaculture development centers, a technical implementing unit under Directorate General of Aquaculture, and provided 10 research centers under the Agency of Marine and Fisheries & Research Development (MMAF, 2017). In addition, Indonesian fisheries also collaborated with national universities in order to accelerate the production capacity which is compatible with the traceable and sustainable production supply chains (Cahya, 2010). Similarly, Thai tuna canneries are also engaged with research and development institutions. The research platforms are professionally supervised by leading academic investigators with decades of research experience in the field of marine biotechnology, food science, bioprocess engineering, biomedical science, and nutritional science. This platform is meant to satisfy the fundamental need of global consumers’ (Thai Union, 2015). Well-integrated research and development positively contributed to the production process of canned tuna to be more efficient.
4.7.3 Export Distribution Transshipment process is the third stage of canned tuna production
supply chains. Campling and Doherty (2007) assumed that sea freight contributed 5-6% of canned tuna product. Therefore, the more efficient a country can transship their product the price of product could be lower. As previously explained, Thai strategic location gives benefit to the canneries in accessing raw materials, as well as to transship their canned tuna product to import destination countries. Thailand is located at the center of dynamic region of economic growth (Southeast and East Asia) which means that sea-freight routinely passes Thailand (Hamilton, 2011). It provides a key regional port both for intra-regional trade, as well as to and from major canned tuna market along the east-west global trade route, such as the EU, Japan, and the US (Campling & Doherty, 2007). Moreover, well-developed shipping industries which have existed since the early 1990s have created raised operational economies of scale and reduced transaction costs in the international trade in goods. It has contributed to the development of specialized dedicated container terminals that are able to improve efficiencies in the loading and offloading of vessels.
Ref. code: 25616066090108XWU

70
Conversely in Indonesia, colocation is the main problem which limits raw materials as well as world market access. Indonesian canned tuna industries are situated in several locations, such as East Java, Bitung, Bali, Sorong, and Biak (Hamilton, et al., 2011). Hamilton et al. (2011) argued that widely dispersed unloading ports and relatively high international transportation cost are the main constraints effected Indonesian canned industry less competitive than the other exporters.
As mentioned earlier, the three main importers (the EU, the US, and Japan) of canned tuna product are highly concerned about the Rules of Origin (RoO) and standards. Therefore, strict regulations are enacted by these three importers in order to ensure the product they consumed compatible with traceable and sustainable procedures. This regulation has a negative influence towards canned tuna export distribution from Indonesia and Thailand. The imposition of specific requirements will reduce 42.76% canned tuna export. Then, the national standard leads to 53.57% reduction of canned tuna export. When the importer enacts stricter standard, the reduction of canned tuna export is 70.91% (Rahmah, 2016). Nevertheless, global canned tuna consumers which significantly increased and expanded give positive impact to tuna canneries based in Indonesia and Thailand, since the two producers rely on global demand.
Then, government roles also contribute to canned tuna trade flow. Besides, government policy in allowing raw tuna import quota and the intervention in negotiating non-tariff barriers also crucial. As previously explained, Thai government conducted effective intervention in eliminating import tariff duty in Japanese market instead of Indonesian government. Nevertheless, both countries face the same challenge with the European and American markets where import tariff duty remains high at 20-24% and 6-12.5% respectively.
Ref. code: 25616066090108XWU

71
Figure 4.4 Indonesian canned tuna production chains Source. Author’s elaboration
Figure 4.5 Thai canned tuna production chains Source. Author’s elaboration
Ref. code: 25616066090108XWU
72
4.8 Conclusion
This chapter investigates how each determinant factor influenced the canned tuna industries competitiveness in Indonesia and Thailand. Generally, this chapter compares each determinant factors of canned tuna industries development between Indonesia and Thailand. Thai tuna canneries have better competitive advantages in the 6 measured factors instead of Indonesian.
Then, in the analysis part, each factor’s influences toward the production chains are elaborately provided. Thai strategic location and the government policy become the most significant key factors of canned tuna industries development in Thailand. This is because both factors significantly contributed to Thai canned tuna product. As cited by Campling and Doherty (2007), raw tuna contributed 39-40% in the price structure of canned tuna product. Then, sea-freight influenced 5-6% to canned tuna price. Moreover, Thai government intervention significantly influenced the canneries in obtaining raw materials as well as distributing their product to global market.
In the case of Indonesia, canneries collocation is the major reason why Indonesian canned tuna canneries are less developed compared to Thailand. Besides, government intervention also has a negative influence toward raw material access and global distribution.
Ref. code: 25616066090108XWU

73
CHAPTER 5 CONCLUSIONS AND RECOMMENDATIONS
This chapter provides overall conclusions as well as recommendations to
related stakeholders of tuna canneries in both analyzed countries. 5.1 Conclusions
To conclude, this part synthesizes the relationship between internal and
external factors of tuna canneries performance in Indonesia and Thailand. Then, it is followed by the conclusion of key determinant factors of tuna canneries in both countries.
In terms of factor condition which measured two analyzed aspects; labor cost and raw materials sources, Indonesia has a cheaper labor cost but limited raw material access compared to Thailand. In Indonesia, tuna canneries are supplied by abundant cheap domestic workforce, while Thai tuna canneries need to hire migrant workers from neighboring countries (i.e. Myanmar and Cambodia) which are more costly. Then, although the Indonesian tuna canneries are supplied by domestic tuna vessels, but the dispersed locations of tuna canneries and fishing spots lead to Indonesian tuna vessels unloaded their catch in other countries. Consequently, domestic tuna processors often lack of raw materials. Moreover, Indonesian government limits the canneries to import raw materials only 20% of production capacity. The limited raw materials have an impact on the inability of Indonesian tuna canneries to supply the global demand. In Thailand, although domestic tuna vessels are limited, there are a lot of foreign vessels, including Indonesian vessels, which unloaded their catch in Thai ports. In addition, lenient government policy in allowing raw tuna import also stimulates the canneries to access abundant raw tuna outside the country. As a result, Thai tuna canneries can supply global demand more than Indonesian tuna canneries.
Ref. code: 25616066090108XWU

74
Demand condition of canned tuna products from the two countries relies on global demand, particularly three major canned tuna consumers; the EU, the US, and Japan. Indonesian consumers preferred to consume cheaper sardines in oil instead of canned tuna (Hamilton, 2011). Similarly, 95% of Thai canned tuna product served the foreign market (Asia Foundation & ILO, 2015). Despite canned tuna consumption in the EU and the US tend to decline, and be stagnant in the Japanese market, the new emerging canned tuna consumers such as Australia and China can become potential markets of canned tuna product processed in Indonesia and Thailand. The stable demand from major importers as well as the expanded demand from the new emerging market will increase export volume and value of the product, and vice versa.
Furthermore, if related and supporting industries are compared, domestic tuna vessels hold significant role to Indonesian tuna canneries since the country have plenty of fishing spots. However, as previously explained, dispersed colocation leads to less impact to canned tuna competitiveness. Then, Indonesia was not supported by related supporting industries for canning process, such as can producers. On the other hand, there are about 50 can producers in 2005 which have supplied cans to Thai tuna processors (Hayes, 2005). Campling & Doherty (2007) estimated that the domestic supplied can will reduce canned tuna product around 5% instead of those who import it.
The two analyzed countries also differ in terms of structure and strategy, but similar in rivalry. The structure of Thai tuna canneries is oligopolistic which is dominated by the two major canneries, while the Indonesian tuna canneries have equal production capacity. Both producers are engaged in several complex-production strategies. Research and Development collaborated with related institutions to support the development of tuna canneries in those two countries. Nevertheless, Thai canneries determined their production bases to be centralized in Bangkok as a strategy to obtain raw tuna and access global demand in a more efficient way (Campling, et al., 2007). In contrast, the Indonesian tuna processors are separately located in East Java, Bali, Sorong, and Biak, which has an impact on inefficient raw material and market access (Hamilton, 2011). In case of rivalry, the
Ref. code: 25616066090108XWU
75
emerging canned tuna producers such as China, Vietnam, and Republic of Korea became the potential competitors for those two analyzed countries (Miyake, et al., 2010).
Chance became an external factor which negatively impacts on the competitiveness of canned tuna industries in Indonesia and Thailand. In the fishery trade sector the importers had increased complex standards and regulations (Rahmah, 2016). The strict standards and regulation reduce the demand of fishery product. Nevertheless, Bellman et al. (2016) assumed that the imposition of standard indirectly has an impact on the improvement management system that would presumably improve the status of target tuna stock and potentially the stock’s broader ecosystem.
Government interventions are also considered as important determinant factors. The two measured aspects are intervention in negotiating import tariff duty and regulation in allowing raw materials import. In terms of intervention in import tariff duty, the Thai government has succeeded in eliminating import tariff in the Japanese market, while the Indonesian government is still struggling to erode it. Nevertheless, both governments remain unsuccessful to eliminate import tariff in the European and American markets (Campling, 2015). Another aspect of government role’s in influencing the competitiveness of canned tuna industries is the raw materials import policy. Indonesia strictly limited raw tuna import to only 20% of the total production (Ginoga, 2017), while the Thai government leniently allows tuna canneries to import raw tuna as much as they need it (Kuldilok, 2013).
All in all, the major influence of rapid development of canned tuna industries in Thailand compared to another producer (such as Indonesia) is the accessibility of raw materials, strategic colocation, and effective government interventions.
Ref. code: 25616066090108XWU

76
5.2 Recommendations According to this comparative study the determinant factors of tuna
canneries development both in Indonesia and Thailand have been revealed. The Indonesian government ambitiously intends to increase fisheries production and export acceleration (IMFB, 2017). Besides, tuna canneries in both countries also face an obstacle to deal with strict standards and Rules of Origin (RoO) regulation. In order to assist the development of tuna canneries in both countries, this work propose the three main recommendations below.
Firstly, the Indonesian government should revise the policy of importing raw tuna to become more lenient. This is important for the domestic canneries to produce canned tuna as much as their production capacity. Then, since the colocation of tuna processors and tuna fishing spots are widely dispersed, the Indonesian government should provide well-developed fishing ports and transshipment facilities in order to accelerate the transportation from fishing spots to industries as well as erode the sea-freight cost.
Secondly, the Indonesian government should learn from Thai government in negotiating import tariff duty with Japanese government related to canned tuna product. Nevertheless, both Thai and Indonesian governments also need to negotiate with other two major importers namely the EU and the US to eliminate import tariff for canned tuna product. In addition, market expansion should be implemented by accessing new potentials market of canned tuna product, i.e. Australia, China, and the Middle East.
Lastly, the Indonesian and Thai government should evaluate and monitor their fishing sources in order to ensure traceable and sustainable methods. The government may collaborate with civil society or related international organizations such as Greenpeace. Traceability and sustainability are important in fisheries sectors since major canned tuna importers are highly concerned about it signed by the implementation of strict standards and RoO regulations.
Ref. code: 25616066090108XWU
77
REFERENCES Books Asia Foundation and ILO. (2015). Migrant and child labors in Thailand’s shrimp and
other seafood supply chains, labor condition and the decision to study or work. Final Report: Asia Foundations and ILO.
ASTUIN. (2017). World Top Fishery and Tuna Exporter 2012-2016. Asosiasi Tuna Indonesia.
Campling, Havice, & Ram-Bidesi. (2007). Pacific island countries, the global tuna industry and the international trade regime - a guidebook. South Pacific Forum Fisheries Agency (FFA).
Campling, L. (2015). Assessing alternative markets: Pacific Islands canned tuna & tuna loins. Pacific Islands Forum Fisheries Agency.
Campling, L., & Doherty, M. (2007). A comparative analysis of cost structure and SPS issues in canned tuna production in Mauritius/the Seychelles and Thailand: Is there a level playing field?. The Project Management Unit Regional Trade Facilitation Program.
Errighi, L. et al. (2016). Labor and social trend in Indonesia 2014-2015; strengthening competitiveness and productivity through decent work. ILO country office for Indonesia. International Labor Organization (ILO) Asia-Pacific working paper series.
Estevadeordal & Suominen. (2005). Multilateralism and regionalism: the new interface. United Nation conference on trade and development. UNCTAD/ DITC/TNCD/2004/7.
Greenpeace. (2016). From sea to can: 2016 southeast Asia canned tuna ranking. Greenpeace Southeast Asia.
Hamilton, et al. (2011). Market and industry dynamics in the global tuna supply chain. The Pacific Island Forum Agency.
Ref. code: 25616066090108XWU

78
Julintron, A., & Chalatrawat, S. (2007). Improvement to rules of origin under FTA arrangement for the Thai seafood industry. AUSAID. Trade Analysis and Reform Project (TARP).
McElroy, J.K. (1989). Indonesia’s tuna fisheries; past, present, & future prospect. Butterworth & Co (Publishers) Ltd.
Ministry of Marine and Affairs and Fisheries., JICA. (2017). Indonesian Marine and Fisheries Book.
Miyake, et al. (2010). Recent development in the tuna industry; stock, fisheries, management, trade, & markets. FAO UN.
National Labor Forces Survey. (2017). Laporan bulanan data sosial ekonomi (Monthly report social economic data). Badan Pusat Statistik.
Nootmorn, P. (2015). Thailand national report to the scientific committee of the Indian Ocean Tuna Commission, IOTC.
Porter, M. E. (1990). The competitive advantage of nations. New York: Free Press. UNEP. (2014). United Nations Environmental Program: Annual Report 2013. Articles Anthonysamy, S.M. (2016, May 23-25). Asian tuna trade and market. Infofish Tuna. Apridar. (2014). The competitiveness of Indonesian tuna export facing the ASEAN
economic community. Aceh International Journal of Social Sciences, 3 (1), 1-13. Bellman, C., et al. (2016). Global trade in fish and fishery product: An overview.
Marine Policy, 69, 181-188 Bugallo et al. (2013). Integrated environmental permit through best available
techniques: evaluation of the seafood and canning industry. Journal of Cleaner Production 47, 253-264.
Campling, L. (2016). Trade politics and global production of canned tuna. Marine Policy, 69, 220-228.
Chung, T.W. (2016). A study on logistics clusters competitiveness among Asia Main countries using the Porter’s diamond model. The Asian Journal of Shipping and Logistics, 32 (4), 257-264.
Ref. code: 25616066090108XWU

79
FAO UN. (2016). Globefish highlight; a quarterly update of world seafood market. Globefish FAO, 4th issue.
Fatma, E. (2015). Development of sustainable tuna processing industry using system dynamic simulation. Procedia Manufacturing 4, 107 - 114.
Gulliotreau, et al. (2017). Local, regional, & global market: what drives the tuna fisheries? Rev Fish Biol Fisheries 27, 909-929.
Kuldilok, S.K, et al. (2013). The export of competitiveness of the tuna industry in Thailand. British Food Journal 115.3
Lazonick, W. (1993). Industry clusters versus global webs: organizational capabilities in the American economy. Industrial and Corporate Change, 2(1), 1-24.
Ozer, K.O., et al. (2012). International competitive advantage of Turkish tourism industry: a comparative analysis of Turkey and Spain by using the diamond model of Porter. Procedia - Social and Behavioral Sciences, 58, 1064 - 1076
Sunoko, R. & Huang, H.W. (2013). Indonesia tuna fisheries development and future strategy. Marine Policy, 43, 174-183.
Thesis Cahya, I.N. (2010). Analisis daya saing ikan tuna Indonesia di pasar internasioanl.
(An analysis study of Indonesian tuna competitiveness in global market). (Minithesis). Bogor Agricultural Institute (IPB).
Ginoga, A.N. (2017). Analisis struktur perilaku dan kinerja industri pengolahan ikan dalam kaleng di Indonesia (periode tahun 1990-2014) (Structure analysis of behavior and work performance of canning fish processor in Indonesia (1990-2014). (Master Thesis). Bogor Agricultural Institute Catalogue.
Kuldilok, S.K. (2009). An economic analysis of the Thailand tuna fish industry. (Ph.D. Thesis), School of Agriculture, Food, & Rural Development, Newcastle University.
Puttipokin,P. (2001). An analysis of comparative and competitive advantage of Thailand canned tuna industry. (Ph.D. Thesis). Kasetsart University.
Ref. code: 25616066090108XWU
80
Rahmah, K.N. (2016). Trade flow analysis and the role of standard on canned tuna trade. (Master Thesis). Bogor Agricultural Institute Catalogue.
Electronic Media Aneka Tuna Indonesia. (2019). Retrieved from http://tunaindonesia.com EU Commission. (2018). Market access database. Retrieved from http://madb.
europa.eu/madb/euTariffs.htm?productCode=1604142100&country=TH Food Agricultural Organization. (2016). FAO Yearbook; fishery and aquaculture
statistic summary table. Retrieved from http://www.fao.org/fishery/docs/ STAT/summary/default.htm
Hadel, K. & Kelly, C. (2014). Revealed: Asian slave labor producing prawn for supermarket in US and UK. Retrieved from https://www.theguardian.com/ global-development/2014/jun/10/supermarket-prawns-thailand-produced-slave-labour.
Hayes, David (2005, December). ‘What next for the future?’. CanTech. Retrieved from http://www.cantechonline.com
Indonesia Tuna Factory. (2017). The important thing from tuna that you should know. Retrieved from Indonesiatunafactory.com
Indonesian Tuna Factory. (n.d.). Overview of Indonesia fish export commodity. Retrieved from https://www.indonesiatunafactory.com/
JETRO. (2005). EU Commission. Retrieved from http://europa.eu/rapid/press-release_IP-15-4806_en.htm
Michael Reily. (2017). Kejar Target Ekspor Ikan, KKP Lobi Jepang Bebaskan Bea Masuk (To Achieve Tuna Export Target, Indonesian Marine Fishery Lobby Japan to Elimininate Import Duty). Retrieved from https://katadata.co.id/berita/ 2017/09/07/kejar -target-ekspor-ikan-kkp-lobi-jepang-bebaskan-bea-masuk.
Ministry of Trade of RI. (2017). Lewat general review IJEPA, Indonesia perjuangkan akses pasar produk di Jepang (Indonesia is struggling to access Japanese market through general review of IJEPA. Press released. Retrieved from
Ref. code: 25616066090108XWU

81
http://www.kemendag.go.id/files/pdf/2017/08/30/lewat-general-review-ijepa-indonesia-perjuangkan-akses-pasar-produk-di-jepang-id0-1504102723.pdf
MoFA. (2018). The Ministry of Foreign Affairs of Japan. (2018). Joint Press Statement, Indonesia-Japan Economic Partnership Agreement. Retrieved from http://www.mofa.go.jp/region/asia-paci/indonesia/joint0611-2.html.
Setboonsarng, G., & Phillips, J. (2018). Seafood producer Thai Union’s FY profit jumps, beat estimate. Reuters. Retrieved from https://www.reuters.com /article/ thai-union-results/seafood-producer-thai-unions-fy-profit-jumps-beats-estimate-idUSL4N1Q61GF
Simorangkir, S. (2000). Perikanan Indonesia (Indonesia fisheries). Bali Post Sinar Pure Foods. (2019). Retrieved from http://sinarpurefoods.com/ Smith, N. (2018). Human trafficking and violence still rife in Thai fishing industry.
Retrieved from https://www.telegraph.co.uk/news/2018/01/23/human-traffickingand-violence-rife-thai-fishing-industry-uks/
Thai Union. (2015). Annual report. Retrieved from Thaiuinio.com The Thai Union Group. (2007). Thai Union Group invests Thai tuna vessels. Retrieved
from www.thaiuniongroup.com UN Comtrade Database. (2018). Retrieved from https://comtrade.un.org/ United States Department of Labor. (2003). The tuna processing industry in American
Samoa. Retrieved from www.dol.gov/esa/whd/as/sec3.htm.
Ref. code: 25616066090108XWU

82
BIOGRAPHY Name Mr. Muhammad Shobaruddin Date of Birth 28 March 1993 Educational Attainment 2011-2015: Bachelor of Islamic Law
Faculty of Sharia and Law Walisongo State Islamic University
Scholarship 2017-2018: TU Scholarship Recipient for Master of Arts in Asia Pacific Studies, Thammasat University 2011-2015: PBSB Scholarship from Ministry of Religious Affairs Republic of Indonesia 2014: International Entrepreneurship Training Program in Malaysia by Islamic Development Bank (IsDB)
Publications
Shobaruddin, M. (2018). New chapter of diplomatic relation between Indonesia-America under new contract of Freeport McMoran. Journal Natapraja, 6 (1). Available at ://journal.uny.ac.id/index.php/natapraja
Work Experiences July 2016 - August 2017: Counseling and English
teacher at Mahida Islamic High School April 2016 - November 2016: International ambassador of Dompet Dhuafa
Ref. code: 25616066090108XWU