Embed Size (px)
Citation preview

Deteriorating beam finite element for nonlinear analysis of concrete structures under corrosion
Fabio Biondinia* and Matteo Verganib
aDepartment of Civil and Environmental Engineering, Politecnico di Milano, Piazza Leonardo da Vinci, 32, Milan 20133, Italy;bR4M Engineering, Milan, Italy
(Received 15 November 2013; final version received 19 March 2014; accepted 24 June 2014; published online 23 September 2014)
A three-dimensional reinforced concrete (RC) deteriorating beam finite element for nonlinear analysis of concrete structuresunder corrosion is presented in this study. The finite element formulation accounts for both material and geometricalnonlinearity. Damage modelling considers uniform and pitting corrosion and includes the reduction of cross-sectional areaof corroded bars, the reduction of ductility of reinforcing steel and the deterioration of concrete strength due to splittingcracks, delamination and spalling of the concrete cover. The beam finite element is validated with reference to the results ofexperimental tests carried out on RC beams with corroded reinforcement. The application potentialities of the proposedformulation are shown through the finite element analysis of a statically indeterminate RC beam and a three-dimensional RCarch bridge under different damage scenarios and corrosion penetration levels. The results indicate that the design fordurability of concrete structures exposed to corrosion needs to rely on structural analysis methods capable to account for theglobal effects of local damage phenomena on the overall system performance.
Keywords: concrete structures; corrosion; damage modelling; nonlinear finite element analysis
1. Introduction
The structural performance of concrete structures is time-
dependent due to ageing and environmental damage
(Ellingwood, 2005). Damaging factors include the effects
of the diffusive attack from aggressive agents, such as
chlorides, which may involve corrosion of steel reinforce-
ment and deterioration of concrete (CEB, 1992). The
direct and indirect costs associated with steel corrosion
and related effects, in particular for concrete bridges
and viaducts, are generally very high (ASCE, 2013;
NCHRP, 2006). It is therefore of major importance to
promote a life-cycle design of durable concrete structures
and infrastructures (Frangopol, 2011; Frangopol &
Ellingwood, 2010).
The experimental evidence shows that the main effect
of corrosion is the reduction of the cross-sectional area of
the reinforcing steel bars (Gonzalez, Andrade, Alonso, &
Feliu, 1995; Zhang, Castel, & Franc�ois, 2009). Corrosion
can also significantly affect the ductility of steel bars and
lead to brittle failure modes (Almusallam, 2001;
Apostolopoulos & Papadakis, 2008). Moreover, the
formation of corrosion products can involve deterioration
of concrete due to propagation of splitting cracks (Vidal,
Castel, & Francois, 2004; Zhang et al., 2009), delamina-
tion and spalling of the concrete cover (El Maaddawy &
Soudki, 2007; Li, Zheng, Lawanwisut, & Melchers, 2007;
Pantazopoulou & Papoulia 2001). In addition, the
corrosion process may affect the steel–concrete bond
strength (Bhargava, Gosh, Mori, & Ramanujam, 2007;
Lundgren, 2007).
The local effects of reinforcement corrosion can be
limited based on simplified design criteria related to
threshold values for concrete cover, water–cement ratio,
amount and type of cement, among others (fib, 2006).
However, a life-cycle design of durable structures cannot
be based only on indirect evaluations of the effects of
damage, but it needs proper methodologies to take into
account the global effects of local damage phenomena on
the overall system performance under uncertainty. To this
aim, a probabilistic approach to lifetime assessment of
concrete structures in aggressive environment has been
proposed in previous works (Biondini, Bontempi,
Frangopol, & Malerba, 2004a, 2006). This approach relies
on general procedures and methods for time-variant
nonlinear and limit analysis of concrete structures under
static and seismic loadings (Biondini, Camnasio, &
Palermo, 2014; Biondini & Frangopol, 2008).
Nonlinear analysis of corroded concrete structures can
be based on complex two- or three-dimensional finite
element modelling (Sanchez, Huespe, Oliver, & Toro,
2010). This approach is useful to investigate local stress
distribution problems or to analyse the behaviour of
structural components and members. However, the
involved computational cost and the amount of data to
be managed make this approach impractical for the
analysis of entire structural systems, such as buildings and
q 2014 Taylor & Francis
*Corresponding author. Email: [email protected]
Structure and Infrastructure Engineering, 2015
Vol. 11, No. 4, 519–532, http://dx.doi.org/10.1080/15732479.2014.951863

bridges. A structural modelling based on beam finite
elements represents an effective alternative to obtain
sufficiently accurate results at an affordable computational
cost.
The formulation of beam finite elements for nonlinear
analysis of corroded concrete structures can refer to
lumped plasticity models, where nonlinearity is described
at the cross-sectional level within critical regions where
plastic hinges are expected to occur (Akiyama, Frangopol,
& Matsuzaki, 2011; Biondini et al., 2014), or distributed
plasticity models, where nonlinearity is defined at the
material level in terms of nonlinear constitutive laws of
concrete and steel (Biondini et al., 2004a). Compared to
lumped plasticity models, beam elements with distributed
plasticity usually provide higher accuracy and allow a
more detailed modelling of reinforcing steel corrosion and
concrete deterioration.
In this paper, the formulation of a three-dimensional
deteriorating reinforced concrete (RC) beam finite element
for nonlinear analysis of concrete structures under
corrosion is presented. The proposed formulation accounts
for both mechanical nonlinearity, associated with the
constitutive laws of the materials, and geometrical
nonlinearity, due to the second-order effects (Biondini,
2004; Biondini, Bontempi, Frangopol, & Malerba, 2004b;
Bontempi, Malerba, & Romano, 1995; Malerba, 1998).
Damage modelling considers uniform and localised
(pitting) corrosion and includes the reduction of cross-
sectional area of corroded bars, the reduction of ductility
of reinforcing steel and the deterioration of concrete
strength due to splitting cracks and spalling of concrete
cover (Biondini, 2011; Biondini & Vergani, 2012). In the
structural model, these effects are described through
damage indices and corrosion can selectively be applied to
damaged structural members with a different level of
penetration in each reinforcing bar.
The presented developments focus on the deterministic
evaluation of the structural effects of prescribed damage
patterns and corrosion penetration levels. However, it is
worth noting that the proposed formulation can be
extended to include the time factor in a lifetime scale by
modelling the diffusive process of aggressive agents
leading to corrosion initiation and damage propagation, as
well as to account for the uncertainty in material and
geometrical properties, in the physical models of the
deterioration process and in the mechanical and environ-
mental stressors. These extensions allow to incorporate the
nonlinear analysis in a probabilistic framework for life-
cycle assessment and design of concrete structures
exposed to corrosion (Biondini et al., 2004a, 2006).
The beam finite element is validated with reference to
the results of experimental tests carried out on RC beams
subjected to corrosion of steel reinforcement, including
accelerated corrosion (Rodriguez, Ortega, & Casal, 1997)
and natural corrosion (Castel, Franc�ois, & Arliguie, 2000;
Vidal, Castel, & Franc�ois, 2007). The application to a
statically indeterminate RC beam under different cor-
rosion scenarios and increasing levels of corrosion
penetration demonstrates the need of a proper evaluation
of the global effects of local damage on the overall system
performance. Finally, the three-dimensional nonlinear
structural analysis of a RC arch bridge under different
damage scenarios and corrosion penetration levels is
presented. The results highlight the effectiveness of the
proposed approach and its application potentialities in the
design and assessment of concrete structures exposed to
corrosion.
2. Corrosion modelling
Damage modelling includes the reduction of cross-
sectional area of corroded bars, the reduction of ductility
of reinforcing steel and the deterioration of concrete
strength due to splitting cracks, delamination and spalling
of the concrete cover. Although corrosion does not affect
significantly the yielding strength of reinforcing steel bars
(Apostolopoulos & Papadakis, 2008), a moderate
reduction of steel strength may be observed for corroded
bars with irregular distribution of cross-section loss (Du,
Clark, & Chan, 2005). This effect is not considered in the
applications studied in this paper, even though it could be
easily incorporated in the damage model. The deterio-
ration of steel-concrete bond strength and the effects of
the bond-slip of corroded steel bars are also not
investigated.
2.1. Reduction of the cross-section of reinforcing bars
The most relevant effect of corrosion is the reduction of
the cross-section of the reinforcing steel bars. By denoting
p as the corrosion penetration depth, the following
dimensionless corrosion penetration index d [ [0;1] is
introduced (Biondini & Vergani, 2012):
d ¼ p
D0
; ð1Þ
where D0 is the diameter of the steel bar. The area As of a
corroded bar can be represented as a function of the
corrosion penetration index as follows:
AsðdÞ ¼ ½12 dsðdÞ�As0; ð2Þ
where As0 ¼ pD02/4 is the area of the undamaged steel bar
and ds ¼ ds(d) is a dimensionless damage function which
provides a measure of cross-section reduction in the range
[0;1]. The damage function ds ¼ ds(d) depends on the
corrosion mechanism.
In carbonated concrete without relevant chloride
content, corrosion tends to develop uniformly on the
F. Biondini and M. Vergani520
reinforcing bars. Figure 1(a) shows a model of uniform
corrosion where the reduction of the bar cross-section
depends on the corrosion penetration depth p ¼ 2x. This
model is described by the following damage function:
ds ¼ dð22 dÞ: ð3Þ
In presence of chlorides, corrosion tends instead to
localise (pitting corrosion). This type of corrosion can be
characterised by means of a pitting factor R defined as the
ratio between the maximum depth xmax measured at pit and
the average penetration �x calculated indirectly from the
weight loss of the steel bar:
R ¼ xmax
�x: ð4Þ
Typical values of the pitting factor vary between 4 and
8 for natural corrosion and between 5 and 13 for
accelerated corrosion tests (Gonzalez et al., 1995).
Regarding spatial distribution, there is no evidence that
corrosion develops and propagates at concrete cracks.
Instead, it tends to develop randomly where there are
imperfections in the passive layer or interface defects
(Zhang et al., 2009).
Pits have irregular shape and the cross-section
reduction due to pitting corrosion is described through
simplified models. As an example, the model shown in
Figure 1(b) assumes a circular pitting surface with radius
equal to the maximum penetration depth p ¼ xmax
(Stewart, 2009; Val & Melchers, 1997). The model of
pitting corrosion shown in Figure 1(c) is related to a mixed
corrosion mechanism with a component of uniform
corrosion (Rodriguez, Ortega, Casal, & Diez, 1996).
With reference to the maximum penetration depth
p ¼ xmax, this model is described by the same damage
function ds ¼ ds(d) of uniform corrosion and, with a
pitting factor R ¼ 2, leads to the same steel mass loss. This
type of mixed corrosion mechanism can be found in
accelerated corrosion tests, but it is not suitable to
represent real cases where uniform or pitting corrosion are
predominant (Zhang et al., 2009).
2.2. Reduction of ductility of reinforcing bars
Corrosion may significantly reduce the ductility of
reinforcing steel bars. This is mainly related to the spatial
variability of the attack penetration. Tensile tests on
corroded bars show that for a quite limited mass loss
(about 13%), reinforcing steel behaviour may become
brittle (Almusallam, 2001). The results of experimental
tests reported in Apostolopoulos and Papadakis (2008)
indicate that ductility reduction is a function of the cross-
section loss. Based on the fitting of available experimental
results, the steel ultimate strain 1su of a corroded bar is
related to the damage index ds ¼ ds(d) as follows
(Biondini & Vergani, 2012):
1su ¼1su0; 0 # ds , 0:016
0:1521d20:4583s 1su0; 0:016 , ds # 1
(ð5Þ
where 1su0 is the steel ultimate strain of the undamaged bar.
2.3. Effects of corrosion on concrete
The effects of corrosion are not limited to damage of
reinforcing steel bars. In fact, particularly in case of uniform
corrosion (Val, 2007), the formation of corrosion products
may lead to the development of longitudinal cracks in the
concrete surrounding the corroded bars and, consequently, to
delamination and spalling of the concrete cover. This local
deterioration of concrete can effectively be modelled by
means of a degradation law of the effective resistant area of
the concrete matrix Ac (Biondini et al., 2004a):
Ac ¼ ½12 dcðdÞ�Ac0; ð6Þwhere Ac0 is the area of undamaged concrete and dc ¼ dc(d)is a dimensionless damage function which provides a
measure of concrete damage in the range [0;1]. However, in
this form, it may be not straightforward to establish a
relationship between the damage function dc and the
corrosion penetration index d.Alternatively, the effects of concrete deterioration can
be taken into account by modelling the reduction of
x
D0 D0
xmax
D0
(a) (b) (c)
Figure 1. Modelling of cross-section reduction of a corroded reinforcing steel bar: (a) uniform corrosion; (b) pitting corrosion withcircular pitting surface; and (c) pitting corrosion with a component of uniform corrosion.
Structure and Infrastructure Engineering 521

concrete compression strength fc due to longitudinal
cracking (Biondini & Vergani, 2012):
f c ¼ ½12 dcðdÞ�f c0; ð7Þ
where fc0 is the strength of undamaged concrete. The
reduced concrete strength fc can be evaluated as follows
(Coronelli & Gambarova, 2004):
f c ¼ f c0
1þ kð1’=1c0Þ ; ð8Þ
in which k is a coefficient related to bar diameter and
roughness (k ¼ 0.1 for medium-diameter ribbed bars), 1c0is the strain at peak stress in compression and 1’ is an
average (smeared) value of the tensile strain in cracked
concrete at right angles to the direction of the applied
stress.
The transversal strain 1’ is evaluated by means of the
following relationship:
1’ ¼ bf 2 bi
bi¼ Db
bi; ð9Þ
where bi is the width of the undamaged concrete cross-
section and bf is the width after corrosion cracking. The
increase of beam width Db can be estimated as follows:
Db ¼ nbarsw; ð10Þ
where nbars is the number of steel bars and w is the average
crack opening for each bar. Several studies investigated the
relationship between the amount of steel corrosion and the
crack opening w (Alonso, Andrade, Rodriguez, & Diez,
1998; Zhang et al., 2009). The following empirical model
is assumed (Vidal et al., 2004):
w ¼ kwðds 2 ds0ÞAs0; ð11Þ
in which kw ¼ 0.0575 (mm21) and ds0 is the amount of
steel damage necessary for cracking initiation. This
damage threshold is evaluated as follows:
ds0 ¼ 12 12R
D0
7:53þ 9:32c0
D0
� �£ 1023
� �2; ð12Þ
where c0 is the concrete cover.
The crack opening w increases with the expansion of
corrosion products up to a critical width wcr which
corresponds to the occurrence of delamination and
spalling of the concrete cover. Based on experimental
evidence, delamination and spalling can occur for crack
width in the range 0.1–1.0mm (Al-Harthy, Stewart, &
Mullard, 2011; Torres-Acosta & Martinez-Madrid, 2003;
Vu, Stewart, & Mullard, 2005). In this study, a critical
crack width wcr ¼ 1mm is conventionally assumed.
The reduction of concrete strength is generally applied
to the entire concrete cover (Coronelli & Gambarova,
2004). However, the longitudinal cracks pattern strongly
depends on the arrangement of reinforcing bars. Cracking
propagation induced by corrosion should be therefore
limited to the zones adjacent to the corroded bars. With
reference to a rectangular cross-section, Figure 2 shows a
model where the reduction of concrete strength is applied
only to a portion of concrete cover surrounding the
corroded bars (Biondini & Vergani, 2012).
The cross-section is subdivided in cells and each
concrete cell in the neighbourhood of a corroded bar is
subjected to damage if at least one of its vertices lies in the
intersection of the region surrounding the bar within a
radius equal to the cover thickness and the region outside
the centroidal circle passing through the bar. This model
allows to effectively reproduce the mechanism of spalling
of the concrete cover, characterised by inclined fracture
planes for wide bar spacing (Figure 2(a)) and parallel
fracture planes (i.e. delamination) for closely-spaced bars
(Figure 2(b)).
3. Formulation of a deteriorating three-dimensional
RC beam finite element
A three-dimensional RC beam finite element, capable to
incorporate the effects of corrosion, is presented. The
formulation assumes the linearity of the cross-sectional
strain field and neglects shear failures and bond-slip of
reinforcement. Mechanical nonlinearity, associated with
the constitutive laws of the materials, and geometrical
nonlinearity, due to the second-order effects, are taken into
account (Biondini, 2004; Biondini et al., 2004b; Bontempi
et al., 1995; Malerba, 1998).
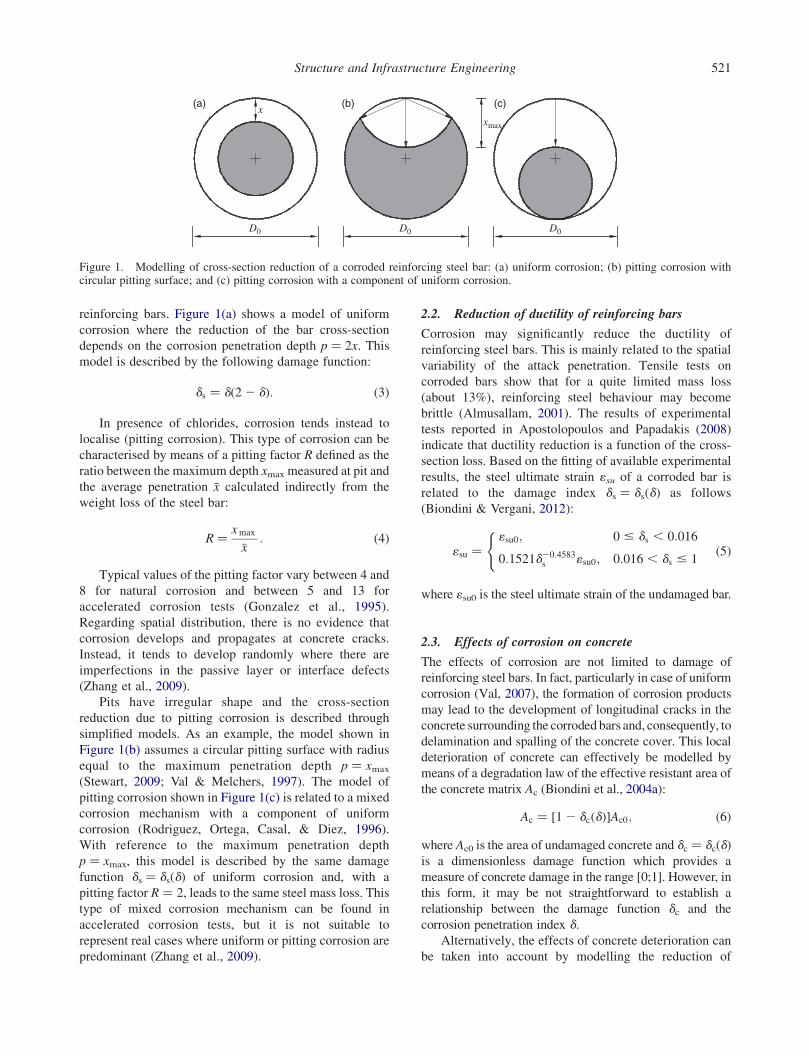
The local reference system (x0, y0, z0) of the beam finite
element and the components of the vector of nodal
(b)(a)
Concrete cell undergoing damage
Figure 2. Definition of the zones of concrete cover undergoingdamage: mechanism of cover spalling with (a) inclined fractureplanes for wide bar spacing, and (b) parallel fracture planes(delamination) for closely spaced bars.
F. Biondini and M. Vergani522
displacements s0 ¼ ½sTa jsTb �T ¼ ½u1 u2 j v1 wz1 v2 wz2 w1 wy1
w2 wy2�T are shown in Figure 3. The torsional degrees of
freedom are not explicitly included in the formulation
because torsion is assumed to be uncoupled from axial and
bending deformations. The material KM and geometrical
KG contributions to the element stiffness matrixK0 and thevector of nodal forces f0 equivalent to the applied loads
f0 5 f0(x0) are obtained by means of the principle of
virtual work, in the form of the virtual displacements, and
are evaluated by integration over the beam length l as
follows:
K0 ¼ KM þKG; ð13Þ
KM ¼ðl0
BTHB dx0; ð14Þ
KG ¼ðl0
NGTG dx0; ð15Þ
f 0 ¼ðl0
NTf 0 dx0; ð16Þ
where x 0 is the abscissa of the beam axis, H ¼ H(x0) is thecross-sectional stiffness matrix, N ¼ N(x0) is the axial
force, N ¼ N(x 0) is the matrix of axial Na ¼ Na(x0) and
bending Nb ¼ Nb(x0) displacement functions, B ¼ B(x 0)
and G ¼ G(x 0) are the corresponding compatibility
matrices:
N ¼Na 0
0 Nb
" #; ð17Þ
B ¼›Na
›x00
0 ›2Nb
›x02
26664
37775; ð18Þ
G ¼ 0›Nb
›x0
� �: ð19Þ
The matrix N ¼ N(x0) is defined by adopting the
Hermitian shape functions of a linear elastic beam having
uniform cross-sectional stiffness and loaded only at its
ends. However, due to material nonlinearity, the cross-
sectional stiffness distribution along the beam is non-
uniform even for prismatic members with uniform
reinforcement. The stiffness matrix H ¼ H(x0) is com-
puted by integration over the area of the composite cross-
section or by assembling the contributions of both concrete
Hc ¼ Hc(x0) and reinforcing steel Hs ¼ Hs(x
0):
H ¼ Hc þHs; ð20Þ
Hc ¼ðAc
�EcbTbdA; ð21Þ
Hs ¼X
m�Esmb
TmbmAsm; ð22Þ
where the symbol ‘m’ refers to the mth reinforcing bar
located at point ðy0m; z0mÞ in the centroidal principal
reference system (y0,z0) of the cross-section, �Ec ¼�Ecðx0; y0; z0Þ and �Esm ¼ �Esmðx0Þ are the secant moduli of
the materials, and b(y0,z0) ¼ [1 2y0 z0] is the linear
compatibility operator of the cross-sectional strain field.
In this study, the stress-strain law of concrete is described
by the Saenz’s law in compression and a bilinear softening
model in tension. For steel, a bilinear elastic-plastic model
in both tension and compression is assumed.
The damage effects associated with the corrosion
penetration index d are included in this formulation by
assuming As ¼ As(d) and 1su ¼ 1su(d) for the steel bars andfc ¼ fc(d) for the concrete to obtain the deteriorating
stiffness matrices H ¼ H(x0,d) and K0 ¼ K0(d) (Biondini,2011; Biondini & Vergani, 2012). It is worth noting that
corrosion can selectively be applied to damaged structural
elements with a different level of corrosion penetration for
each reinforcing bar.
The quantities which define the characteristics of the
beam finite element are evaluated by numerical inte-
gration. The volume of the element is subdivided in
prismatic isoparametric sub-domains having quadrilateral
cross-section, and each sub-domain is replaced by a grid of
points whose location depends on the adopted integration
rule (Bontempi et al., 1995). In particular, depending on
the function to be integrated and the geometry of the
problem, the Gauss-Legendre and the Gauss-Lobatto
schemes are used.
Finally, by assembling the stiffness matrix K0 and the
vectors of nodal forces f0 for all members in a global
reference system (x, y, z), the equilibrium of the structure
can be expressed as follows:
u1w1
z'
ϕz1
v1
ϕy1 l
y'
u2 x'w2
ϕz2
v2
ϕy2
Figure 3. Local reference system and nodal displacements ofthe beam finite element.
Structure and Infrastructure Engineering 523

Ks ¼ f; ð23Þ
where K ¼ K(s,d) is the overall stiffness matrix, s ¼ s(d)is the vector of nodal displacements and f is the vector of
applied nodal forces. This nonlinear equation system is
solved numerically by means of the secant method for
prescribed values of the corrosion penetration index d.
4. Validation of the RC beam finite element
The RC beam finite element is validated with reference to
experimental tests carried out on beams with corroded
reinforcement.
4.1. Beams subjected to accelerated corrosion tests
The experimental tests reported by Rodriguez et al. (1997)
are considered. The validation procedure refers to the two
type of beams shown in Figure 4. The beams were cast
adding calcium chloride to the mixing water, subjected to
an accelerated corrosion process with a current density of
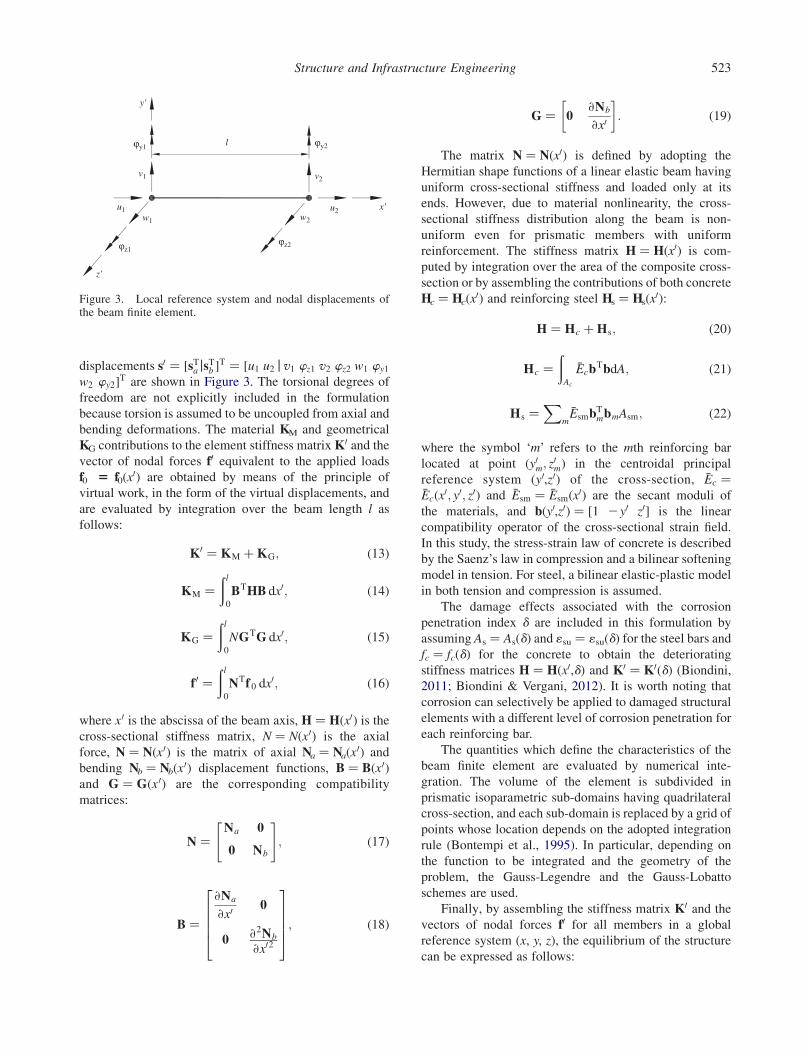
100mA/cm2 and finally loaded up to failure.
The beams type 11, with a lower reinforcement ratio,
showed a flexural failure with rupture of the tensile bars.
For beams type 31, with a higher reinforcement ratio, a
crushing failure of concrete in compression occurred. For
these beams, the average corrosion penetration depth �x, as
calculated indirectly from weight loss of the steel bars, and
the maximum penetration depth xmax measured at pits are
listed in Table 1. The mechanical properties of concrete
and steel are listed in Tables 2(a) and 3(a), respectively.
The structural symmetry of the model is exploited and
the half beam is discretised into six finite elements with five
Gauss-Lobatto sampling points in each element. The cross-
section is subdivided into 300 isoparametric sub-domains,
with a grid of 3 £ 3 Gauss-Lobatto sampling points in each
domain. The cross-sectional area of the corroded bars is
computed by assuming themodel of pitting corrosion shown
in Figure 1(c) with maximum penetration depth xmax for the
bars in tension, and uniform corrosion with penetration
depth x ¼ �x for the bars in compression (Table 1).
A comparison between the results of the nonlinear
analyses and the results of the tests is shown in Figure 5 in
terms of load versus midspan displacement diagrams. The
good agreement between experimental and numerical
results demonstrates the accuracy of the proposed
formulation, as well as its capability to capture the main
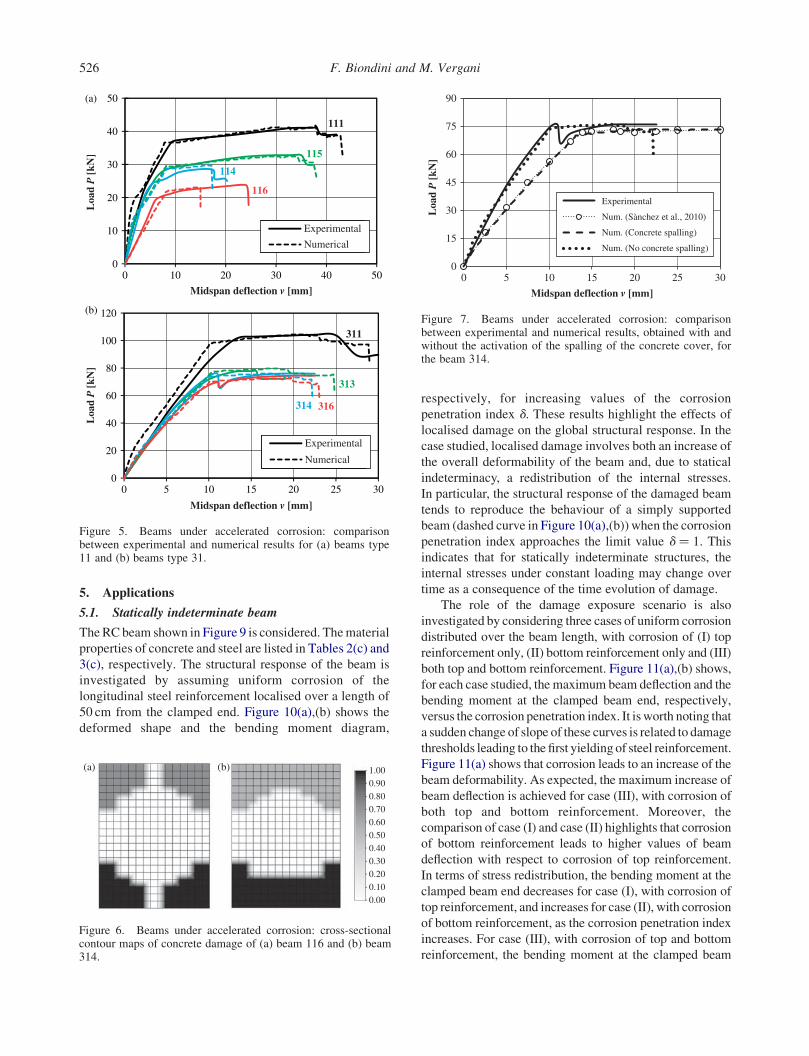
corrosion degradation mechanisms. With this regard,
Figure 6 shows the cross-sectional contourmaps of concrete
damage of the beams 116 and 314. Thesemaps highlight the
important role of the reinforcement layout for the
propagation of damage in the concrete cover. In fact, for
the beams type 11, the corrosion of the steel bars located at
the cross-section corners leads to a localised spalling along
inclined fracture planes (Figure 6(a)). For the beams type 31,
Table 1. Beams under accelerated corrosion: average corrosionpenetration depth, as calculated indirectly from weight loss of thecorroded steel bars, and maximum penetration depth measured atpits (value in parenthesis). Adapted from Rodriguez et al. (1997).
Beam type
Corrosion penetration depth (mm)
Tensile bars Compressive bars
114 0.45 (1.1) 0.52115 0.36 (1.0) 0.26116 0.71 (2.1) 0.48313 0.30 (1.3) 0.20314 0.48 (1.5) 0.26316 0.42 (1.8) 0.37
200
150
200
150
Stirrups Ø6/170
2Ø8
2Ø10
Beam type 11 Beam type 31
Stirrups Ø6/85
4Ø8
4Ø12
P/2 P/2150 800 400 800 150
Figure 4. Experimental tests on beams subjected to accelerated corrosion: geometrical dimensions (mm), testing scheme andcharacteristics of the cross-sections for beams type 11 and type 31. Adapted from Rodriguez et al. (1997).
F. Biondini and M. Vergani524

a similar pattern of localised damage would occur at the top
side of the cross-section for the steel bars arranged in pairs at
the corners. The corrosion of the four closely-spaced steel
bars at the bottom side leads instead to the delamination and
spalling of the entire concrete cover (Figure 6(b)).
However, it is worth noting that the lower values of
penetration depth of the bars in compression may be not
sufficient to induce the spalling of concrete cover. This is
illustrated inFigure 7,which shows the comparison between
experimental and numerical results obtained with and
without the activation of the spalling of the concrete cover at
the top side of the cross-section for the beam 314. If cover
spalling is activated, the numerical model underestimates
the stiffness associated with the initial branch of the load–
displacement diagram. As shown in Figure 7, these results
are also in good agreement with the numerical results
obtained by Sanchez et al. (2010). On the contrary, if cover
spalling is not activated, the numerical results of the finite
element analysis reproduce the initial branch of the load-
displacement diagram with good accuracy.
4.2. Beams subjected to natural corrosion tests
The experimental tests reported by Castel et al. (2000) and
Vidal et al. (2007), concerning beams subjected to natural
corrosion, are considered. The tested beams were exposed
to a salt fog (35 g/l of NaCl, corresponding to the salt
concentration of sea water) and subjected to a three-point
flexure up to collapse on a clear span of 2.8m. The beams
have rectangular cross-section 150mm £ 280mm. They
are reinforced with two bars with diameter f ¼ 12mm at
the bottom side in tension and two bars with diameter
f ¼ 6mm at the top side in compression, with a concrete
cover c0 ¼ 10mm. Based on the available information, the
mechanical properties listed in Tables 2(b) and 3(b) for
concrete and steel, respectively, are assumed. From the set
of tested specimens, a non corroded control beam (B1T)
and a beam after 14 years of exposure (B1CL) are
considered for the validation procedure.
In the structural model the beam is discretised into six
finite elements with five Gauss-Lobatto sampling points in
each element. The cross-section is subdivided into 200
isoparametric sub-domains, with a grid of 3 £ 3 Gauss-
Lobatto sampling points in each domain. The nonlinear
analysis of the corroded beam is performed by assuming a
steel cross-section loss of 22%, which corresponds to the
average value of the maximum cross-section losses
measured for the two tensile reinforcing steel bars in the
critical region at midspan (Castel et al., 2000). Figure 8
shows the comparison between experimental and numeri-
cal results in terms of load versus midspan displacement.
The comparison confirms that the proposed formulation is
able to reproduce with good accuracy the structural
response of noncorroded and corroded structures and to
provide a very accurate estimation of both the load carrying
capacity and the maximum displacement at failure.
Table 2. Mechanical properties of concrete: (a) beams under accelerated corrosion, (b) beams under natural corrosion, (c) staticallyindeterminate beam, (d) arch bridge.
Case study Element type fc (MPa) fct (MPa) Ec0 (GPa)
(a) Beams under accelerated corrosion tests Beam 111 50.0 4.1 37.3Beams 114-115-116 34.0 3.1 33.8Beam 311 49.0 4.1 37.1Beams 313-314-316 37.0 3.2 34.5
(b) Beams under natural corrosion tests Beam B1T 65.3 0.0 36.3Beam B1CL 63.4 0.0 35.0
(c) Statically indeterminate beam Beam 35.0 3.2 34.0(d) Arch bridge Arches & Deck 35.0 3.2 34.0
Table 3. Mechanical properties of steel: (a) beams under accelerated corrosion, (b) beams under natural corrosion, (c) staticallyindeterminate beam, (d) arch bridge.
Case study Element type fsy (MPa) fsu (MPa) Es (GPa) 1su
(a) Beams under accelerated corrosion tests Bars ø8 615 673 210 0.03Bars ø10 575 655 210 0.03Bars ø12 585 673 210 0.03
(b) Beams under natural corrosion tests Bars (B1T & B1CL) 500 500 210 0.06(c) Statically indeterminate beam Bars 440 440 210 0.01(d) Arch bridge Bars 440 440 210 0.01
IPN I-beams 275 275 210 0.10Ties 1600 1600 200 0.10
Structure and Infrastructure Engineering 525
5. Applications
5.1. Statically indeterminate beam
TheRC beam shown in Figure 9 is considered. Thematerial
properties of concrete and steel are listed in Tables 2(c) and
3(c), respectively. The structural response of the beam is
investigated by assuming uniform corrosion of the
longitudinal steel reinforcement localised over a length of
50 cm from the clamped end. Figure 10(a),(b) shows the
deformed shape and the bending moment diagram,
respectively, for increasing values of the corrosion
penetration index d. These results highlight the effects of
localised damage on the global structural response. In the
case studied, localised damage involves both an increase of
the overall deformability of the beam and, due to statical
indeterminacy, a redistribution of the internal stresses.
In particular, the structural response of the damaged beam
tends to reproduce the behaviour of a simply supported
beam (dashed curve in Figure 10(a),(b)) when the corrosion
penetration index approaches the limit value d ¼ 1. This
indicates that for statically indeterminate structures, the
internal stresses under constant loading may change over
time as a consequence of the time evolution of damage.
The role of the damage exposure scenario is also
investigated by considering three cases of uniform corrosion
distributed over the beam length, with corrosion of (I) top
reinforcement only, (II) bottom reinforcement only and (III)
both top and bottom reinforcement. Figure 11(a),(b) shows,
for each case studied, the maximum beam deflection and the
bending moment at the clamped beam end, respectively,
versus the corrosion penetration index. It is worth noting that
a sudden change of slope of these curves is related to damage
thresholds leading to the first yieldingof steel reinforcement.
Figure 11(a) shows that corrosion leads to an increase of the
beam deformability. As expected, the maximum increase of
beam deflection is achieved for case (III), with corrosion of
both top and bottom reinforcement. Moreover, the
comparison of case (I) and case (II) highlights that corrosion
of bottom reinforcement leads to higher values of beam
deflection with respect to corrosion of top reinforcement.
In terms of stress redistribution, the bending moment at the
clamped beam end decreases for case (I), with corrosion of
top reinforcement, and increases for case (II), with corrosion
of bottom reinforcement, as the corrosion penetration index
increases. For case (III), with corrosion of top and bottom
reinforcement, the bending moment at the clamped beam
0
10
20
30
40
50(a)
0 10 20 30 40 50
Loa
d P
[kN
]
Midspan deflection v [mm]
Experimental
Numerical
111
115
114
116
(b)
311
313
314
0
20
40
60
80
100
120
0 10 15 20 25 305
Loa
d P
[kN
]
Midspan deflection v [mm]
Experimental
Numerical
316
Figure 5. Beams under accelerated corrosion: comparisonbetween experimental and numerical results for (a) beams type11 and (b) beams type 31.
0
15
30
45
60
75
90
0 5 10 15 20 25 30
Loa
d P
[kN
]
Midspan deflection v [mm]
Experimental
Num. (Sànchez et al., 2010)
Num. (Concrete spalling)
Num. (No concrete spalling)
Figure 7. Beams under accelerated corrosion: comparisonbetween experimental and numerical results, obtained with andwithout the activation of the spalling of the concrete cover, forthe beam 314.
1.000.900.800.700.600.500.400.300.200.100.00
(b)(a)
Figure 6. Beams under accelerated corrosion: cross-sectionalcontour maps of concrete damage of (a) beam 116 and (b) beam314.
F. Biondini and M. Vergani526

end does not change for corrosion levels up to the threshold
value d ¼ 0.42 associated with the first yielding of top
reinforcement and decreases for increasing levels of
corrosion d . 0.42 up to collapse.
Based on the results of this application, it is clear that
design for durability of concrete structures cannot be
limited to simplified prescriptions associated with the
quality of the materials and structural details such as the
minimum concrete cover, but also needs to rely on
nonlinear structural analysis frameworks capable to take
into account the global effects of local damage phenomena
on the overall system performance.
5.2. Arch bridge
The structural response of a Nielsen type RC arch bridge
with the deck suspended by inclined steel ties is inves-
tigated under different damage scenarios and corrosion
penetration levels. Many structures of the same type were
built in Europe in the Thirties, with spans varying between
50 and 140m. Figure 12 shows the structural scheme and
the main dimensions of the arch bridge, as well as the
1.0
2.0
3.0
4.0
5.0
Corrosion penetration index δ
Corrosion of top and bottom reinforcement
Corrosion of top reinforcement
Corrosion of bottom reinforcement
Max
imum
def
lect
ion
v/v
0
0.0 0.2 0.4 0.6 0.8 1.0
0.0
0.5
1.0
1.5
2.0
Corrosion penetration index δ
0.0 0.2 0.4 0.6 0.8 1.0
Ben
ding
mom
ent
M/M
0
(a)
(b)
Figure 11. Statically indeterminate beam: damaged/undamagedratio of (a) maximum deflection and (b) bending moment at theclamped end of the corroded beam versus the corrosionpenetration index.
0
10
20
30
40
50
60
0 20 40 60 80 100
Loa
d P
[kN
]
Midspan deflection v [mm]
Experimental
Numerical
B1CL
B1T
≈70%
≈20%
Figure 8. Beams under natural corrosion: comparison betweenexperimental and numerical results.
2.5
2.0
1.5
1.0
0.5
0.00.0 0.5 1.0 1.5 2.0 2.5 3.0
0.0 0.5 1.0 1.5 2.0 2.5 3.0
Def
lect
ion
v [m
m]
Abscissa x [m]
δ
–60
–40
–20
0
20
40
60Ben
ding
mom
ent
M [
kNm
]
Abscissa x [m]
δ
(a)
(b)
Figure 10. Statically indeterminate beam: (a) deformed shapeand (b) bending moment diagram for different values ofcorrosion penetration depth (d ¼ 0, 0.2, 0.4, 0.6, 0.8, 1.0),compared with the limit case of undamaged simply supportedbeam (dashed curve).
4Ø16
4Ø16
(a) (b)
3.00m
50kN/m
500m
m
300mm
Figure 9. RC beam exposed to corrosion: (a) structural schemeand loading and (b) geometry of the cross-section andreinforcement layout.
Structure and Infrastructure Engineering 527

geometry, dimensions and reinforcement layout of the
structural members. The three-dimensional structural
model of the bridge is shown in Figure 13.
The span of the arch bridge is 90m, subdivided into 12
sub-spans by the anchoring points of the suspension ties.
The rise of the arches is 13m. The static scheme allows the
elimination of the horizontal thrust that is carried by
means of two IPN 600 European standard steel I-beams
inserted into the concrete main beams of the deck. The
bridge deck is stiffened by transversal ribs with
rectangular cross-section 250mm £ 640mm and 3.75m
spacing. The arches are connected by seven transversal T-
beams with top flange 700mm £ 200mm and beam web
200mm £ 400mm. The beams are located in correspon-
dence with the anchoring points of some ties and at
midspan, as shown in Figure 13. Further details about the
geometry and reinforcement layout of the transversal
beams of both deck and arches can be found in Vergani
(2010). The suspension ties are steel bars with diameter
f ¼ 70mm. The material properties of concrete and
different types of steel are listed in Tables 2(d) and 3(d),
respectively.
13 m
90 m
13 m
7 m
25
64
50
90
26
1616
700 cm
60
140 cm
6 Ø30
6 Ø30
26
90 cm
64
50
2 Ø20
2 Ø20
2 Ø12
2 IPN 600
ArchLateral beam
16
25
130 cm
64
3 Ø20
4 Ø20
Ø 12/20
Central beam
412
(a)
(b)
(c)
Figure 12. RC arch bridge exposed to corrosion: (a) structural scheme, (b) cross-section view of bridge deck and arches, and (c) cross-sections of the deck’s main beams and of the arches.
F. Biondini and M. Vergani528
The bridge deck is modelled by means of a grillage
formed by the three longitudinal main beams and 25
transversal beams. The structural response of the bridge is
analysed under the self weight g1 ¼ 8 kN/m2 and
g2 ¼ 21 kN/m of the deck and the arches, respectively,
and a live load q uniformly distributed over the deck area
and increased up to collapse. The load associated with
each grid unit 3.50m £ 3.75m of the deck grillage is
applied to the corresponding edge beam elements.
The effects of corrosion on the bridge structural
performance are investigated at the system level by
considering three damage scenarios with corrosion applied
separately to deck, arches and ties. The results of this type
of analyses allow to clarify which are the structural
elements that more significantly affect the structural
performance if exposed to corrosion. This information
could provide the basis to establish a hierarchy of
protection techniques, as well as to plan proper
maintenance actions and repair interventions.
The structural analyses are carried out by assuming
uniform corrosion for prescribed values of corrosion
penetration depth for reinforcing steel bars, IPN I-beams
and steel ties. For steel bars and steel ties, the damage level
is described by using the corrosion penetration index d.For the IPN I-beams, the level of corrosion is more
conveniently described in terms of cross-section loss as
follows:
dIPN ¼ 12AIPN
AIPN;0; ð24Þ
where AIPN is the area of the corroded steel beam, and
AIPN,0 is the corresponding value in the undamaged state.
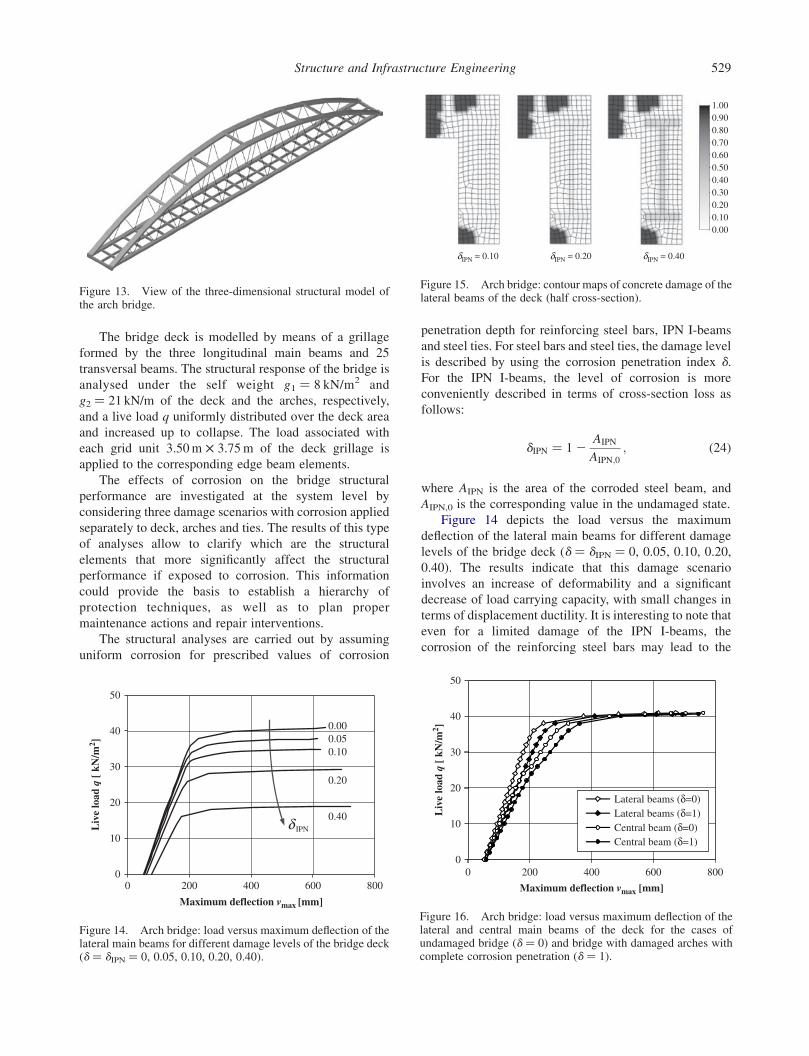
Figure 14 depicts the load versus the maximum
deflection of the lateral main beams for different damage
levels of the bridge deck (d ¼ dIPN ¼ 0, 0.05, 0.10, 0.20,
0.40). The results indicate that this damage scenario
involves an increase of deformability and a significant
decrease of load carrying capacity, with small changes in
terms of displacement ductility. It is interesting to note that
even for a limited damage of the IPN I-beams, the
corrosion of the reinforcing steel bars may lead to the
Figure 13. View of the three-dimensional structural model ofthe arch bridge.
1.000.900.800.700.600.500.400.300.200.100.00
δIPN = 0.40δIPN = 0.10 δIPN = 0.20
Figure 15. Arch bridge: contour maps of concrete damage of thelateral beams of the deck (half cross-section).
Liv
e lo
ad q
[ k
N/m
2 ]
0 200 400 600 800
Maximum deflection vmax [mm]
0
10
20
30
40
50
Lateral beams (δ=0)Lateral beams (δ=1)Central beam (δ=0)Central beam (δ=1)
Figure 16. Arch bridge: load versus maximum deflection of thelateral and central main beams of the deck for the cases ofundamaged bridge (d ¼ 0) and bridge with damaged arches withcomplete corrosion penetration (d ¼ 1).
0
10
20
30
40
50
0.000.050.10
0.20
0.40
0 200 400 600 800
Liv
e lo
ad q
[ k
N/m
2 ]
Maximum deflection vmax [mm]
δ IPN
Figure 14. Arch bridge: load versus maximum deflection of thelateral main beams for different damage levels of the bridge deck(d ¼ dIPN ¼ 0, 0.05, 0.10, 0.20, 0.40).
Structure and Infrastructure Engineering 529

spalling of the concrete cover, as shown by the cross-
sectional damage contour maps in Figure 15.
The effects of corrosion applied to the arches are
presented in Figure 16 in terms of load versus maximum
deflection of the lateral and central beams of the deck for the
cases of undamagedbridge (d ¼ 0) andbridgewithdamaged
arches with complete corrosion penetration (d ¼ 1). The
results show that the deterioration of the arches, which also
involves the spalling of the concrete cover, does not
significantly affect the structural performance.
Similar results are obtained when corrosion damage is
applied to the suspension steel ties with a corrosion
penetration depth up to d ¼ 0.60, as shown in Figure 17.
However, further cross-section reductions of the steel ties
involve a remarkable deterioration of both load carrying
capacity and ductility of the bridge structure, as shown in
Figure 17 for d ¼ 0.80, and lead to structural collapse
under dead load for a corrosion penetration depth d ¼ 0.87.
Figure 18 shows the effect of corrosion of the suspension
steel ties on the maximum deflection of the central main
beam of the deck under dead load (q ¼ 0) for increasing
values of corrosion penetration depth up to collapse.
6. Conclusions
A three-dimensional RC beam finite element for nonlinear
analysis of concrete structures exposed to corrosion has
been presented. The proposed formulation allows to model
the damage effects of uniform and pitting corrosion in
terms of reduction of cross-sectional area of corroded bars,
reduction of ductility of reinforcing steel, deterioration of
concrete strength and spalling of concrete cover. The beam
finite element has been validated with reference to
experimental tests carried out on RC beams subjected to
accelerated and natural corrosion. The comparison of
experimental and numerical results demonstrated the
accuracy of the proposed approach and its capability to
reproduce the effects of local corrosion damage on the
overall structural response. Moreover, the results of the
validation process highlighted the importance of a proper
modelling of the delamination and spalling of the con-
crete cover in compression to accurately predict the initial
branch of the load–displacement relationships.
The application to a statically indeterminate RC beam
under corrosion showed that design for durability of
concrete structures cannot be limited to simplified
prescriptions on the quality of the materials and structural
detailing, but also needs structural analysis methods
capable to take into account the global effects of local
damage phenomena on the overall performance of the
structure. Finally, the three-dimensional nonlinear struc-
tural analysis of a RC arch bridge under different damage
scenarios and corrosion penetration levels highlighted the
effectiveness and application potentialities of the proposed
formulation. In particular, it has been shown how damage
can selectively be applied to identify the structural
components and members that more significantly affect
the system performance when they are exposed to
corrosion. This information could provide the basis to
establish a hierarchy of protection techniques, as well as to
plan proper maintenance actions and repair interventions.
This study focused on the deterministic evaluation of the
effects associated with prescribed exposure scenarios and
corrosion penetration levels. However, the proposed
approach can be extended to account for the uncertainty
involved in the problem in probabilistic terms and to include
the time factor in a lifetime scale by modelling the diffusive
process of aggressive agents leading to corrosion initiation
and damage propagation, as described in Biondini et al.
(2004a, 2006).
Liv
e lo
ad q
[ k
N/m
2 ]
0 200 400 600 800
Maximum deflection vmax [mm]
0
10
20
30
40
50
δ = 0.0
δ = 0.6
δ = 0.8
Figure 17. Arch bridge: load versus maximum deflection of thecentral main beam of the deck for the cases of undamaged bridge(d ¼ 0) and bridge with damaged suspension steel ties withcorrosion penetration depth d ¼ 0.6 and d ¼ 0.8.
25
50
75
100
125
150
175
0.00 0.20 0.40 0.60 0.80 1.00
Max
imum
def
lect
ion
v max
[mm
]
Corrosion penetration index δ
Figure 18. Arch bridge: maximum deflection of the centralmain beam of the deck under dead load (q ¼ 0) versus thecorrosion penetration index for the case of bridge with damagedsuspension steel ties.
F. Biondini and M. Vergani530

Further developments are needed to include the
corrosion of the stirrups and the bond strength deterio-
ration in the damage model and to incorporate the effects
of shear behaviour, bond-slip of reinforcement and cyclic
loading in the formulation of the deteriorating beam finite
element. These factors can be particularly relevant for
seismic design and assessment of corroded concrete
structures (Akiyama et al., 2011; Biondini et al., 2014).
References
Akiyama, M., Frangopol, D.M., & Matsuzaki, H. (2011). Life-cycle reliability of RC bridge piers under seismic andairborne chloride hazards. Earthquake Engineering andStructural Dynamics, 40, 1671–1687.
Al-Harthy, A.S., Stewart, M.G., & Mullard, J. (2011). Concretecover cracking caused by steel reinforcement corrosion.Magazine of Concrete Research, 63, 655–667.
Almusallam, A.A. (2001). Effect of degree of corrosion on theproperties of reinforcing steel bars. Construction andBuilding Materials, 15, 361–368.
Alonso, C., Andrade, J., Rodriguez, J., & Diez, J.M. (1998).Factors controlling cracking of concrete affected byreinforcement corrosion. Materials and Structures, 31,435–441.
ASCE (2013). Report card for America’s infrastructure. Reston,VA: American Society of Civil Engineers.
Apostolopoulos, C.A., & Papadakis, V.G. (2008). Consequencesof steel corrosion on the ductility properties of reinforcementbar. Construction and Building Materials, 22, 2316–2324.
Bhargava, K., Gosh, A.K., Mori, Y., & Ramanujam, S. (2007).Corrosion-induced bond strength degradation in reinforcedconcrete – Analytical and empirical models. NuclearEngineering and Design, 237, 1140–1157.
Biondini, F. (2004). A three-dimensional finite beam element formultiscale damage measure and seismic analysis of concretestructures. 13th World Conference on Earthquake Engineer-ing (13 WCEE), Vancouver, BC, Canada, 1–6 August, Paperno. 2963.
Biondini, F. (2011). Cellular automata simulation of damageprocesses in concrete structures. In Y. Tsompanakis & B.H.V. Topping (Eds.), Soft computing methods for civil andstructural engineering, Chapter 10 (pp. 229–264). Stirling-shire: Saxe-Coburg.
Biondini, F., Bontempi, F., Frangopol, D.M., & Malerba, P.G.(2004a). Cellular automata approach to durability analysis ofconcrete structures in aggressive environments. ASCEJournal of Structural Engineering, 130, 1724–1737.
Biondini, F., Bontempi, F., Frangopol, D.M., & Malerba, P.G.(2004b). Reliability of material and geometrically nonlinearreinforced and prestressed concrete structures. Computers &Structures, 82, 1021–1031.
Biondini, F., Bontempi, F., Frangopol, D.M., & Malerba, P.G.(2006). Probabilistic service life assessment and mainten-ance planning of concrete structures. ASCE Journal ofStructural Engineering, 132, 810–825.
Biondini, F., Camnasio, E., & Palermo, A. (2014). Lifetimeseismic performance of concrete bridges exposed tocorrosion. Structure and Infrastructure Engineering, 10,880–900.
Biondini, F., & Frangopol, D.M. (2008). Probabilistic limitanalysis and lifetime prediction of concrete structures.Structure and Infrastructure Engineering, 4, 399–412.
Biondini, F., & Vergani, M. (2012). Damage modeling andnonlinear analysis of concrete bridges under corrosion. SixthInternational Conference on Bridge Maintenance, Safety andManagement (IABMAS 2012), Stresa, Italy, 8–12 July. InF. Biondini & D.M. Frangopol (Eds.), Bridge Maintenance,Safety, Management, Resilience and Sustainability. London:CRC Press/Balkema, Taylor & Francis Group.
Bontempi, F., Malerba, P.G., & Romano, L. (1995). Formula-zione diretta secante dell’analisi non lineare di telai in C.A./C.A.P. [Secant formulation of nonlinear analysis of RC/PCframes]. In Studi e Ricerche, Graduate School for ConcreteStructures ‘F.lli Pesenti’, Politecnico di Milano, Italy, 16,(in Italian) (pp. 351–386).
Castel, A., Franc�ois, R., & Arliguie, G. (2000). Mechanicalbehaviour of corroded reinforced concrete beams – Part 1:Experimental study of corroded beams. Materials andStructures, 33, 539–544.
CEB (1992). Durable concrete structures – Design guide.Comite Euro-international du Beton, Bulletin d’informationno. 183. London: Thomas Telford.
Coronelli, D., & Gambarova, P. (2004). Structural assessment ofcorroded reinforced concrete beams: Modeling guidelines.ASCE Journal of Structural Engineering, 130, 1214–1224.
Du, Y.G., Clark, L.A., & Chan, A.H.C. (2005). Residual capacityof corroded reinforcing bars. Magazine of ConcreteResearch, 57, 135–147.
El Maaddawy, T.A., & Soudki, K. (2007). A model for predictionof time from corrosion initiation to corrosion cracking.Cement and Concrete Composites, 29, 168–175.
Ellingwood, B.R. (2005). Risk-informed condition assessment ofcivil infrastructure: State of practice and research issues.Structure and Infrastructure Engineering, 1, 7–18.
fib (2006). Model code for service life design. Bulletin no. 34.Lausanne: federation internationale du beton/The Inter-national Federation for Structural Concrete.
Frangopol, D.M. (2011). Life-cycle performance, management,and optimization of structural systems under uncertainty:Accomplishments and challenges. Structure and Infrastruc-ture Engineering, 7, 389–413.
Frangopol, D.M., & Ellingwood, B.R. (2010). Life-cycleperformance, safety, reliability and risk of structural systems,Editorial. Structure Magazine, Joint Publication of NCSEA.CASE, SEI. Reedsburg, WI: C3Ink.
Gonzalez, J.A., Andrade, C., Alonso, C., & Feliu, S. (1995).Comparison of rates of general corrosion and maximumpitting penetration on concrete embedded steel reinforce-ment. Cement and Concrete Research, 25, 257–264.
Li, C.Q., Zheng, J.J., Lawanwisut, W., & Melchers, R.E. (2007).Concrete delamination caused by steel reinforcementcorrosion. ASCE Journal of Materials in Civil Engineering,19, 591–600.
Lundgren, K. (2007). Effect of corrosion on the bond betweensteel and concrete: An overview. Magazine of ConcreteResearch, 59, 447–461.
Malerba, P.G. (Ed.). (1998). Analisi limite e non lineare distrutture in calcestruzzo armato [Limit and nonlinearanalysis of reinforced concrete structures]. Udine (in Italian):International Centre for Mechanical Sciences (CISM).
NCHRP (2006). Manual on service life of corrosion-damagedreinforced concrete bridge superstructure elements. NationalCooperative Highway Research Program, Report 558.Washington, DC: Transportation Research Board.
Pantazopoulou, S.J., & Papoulia, K.D. (2001). Modeling cover-cracking due to reinforcement corrosion in RC structures.ASCE Journal of Engineering Mechanics, 127, 342–351.
Structure and Infrastructure Engineering 531

Rodriguez, J., Ortega, L.M., & Casal, J. (1997). Load carryingcapacity of concrete structures with corroded reinforcement.Construction and Building Materials, 11, 239–248.
Rodriguez, J., Ortega, L.M., Casal, J., & Diez, J.M. (1996).Corrosion of reinforcement and service life of concretestructures. In C. Sjostrom (Ed.), Durability of buildingmaterials and components (Vol. 1, pp. 117–126). London:E & FN Spon.
Sanchez, P.J., Huespe, A.E., Oliver, J., & Toro, S. (2010).Mesoscopic model to simulate the mechanical behavior ofreinforced concrete members affected by corrosion. Inter-national Journal of Solids and Structures, 47, 559–570.
Stewart, M.G. (2009). Mechanical behaviour of pitting corrosionof flexural and shear reinforcement and its effect onstructural reliability of corroding RC beams. StructuralSafety, 31, 19–30.
Torres-Acosta, A.A., & Martinez-Madrid, M. (2003). Residuallife of corroding reinforced concrete structures in marineenvironment. ASCE Journal of Materials in Civil Engineer-ing, 15, 344–353.
Val, D.V. (2007). Deterioration of strength of RC beams due tocorrosion and its influence on beam reliability. ASCE Journalof Structural Engineering, 133, 1297–1306.
Val, D.V., & Melchers, R.E. (1997). Reliability of deteriorating
RC slab bridges. ASCE Journal of Structural Engineering,
123, 1638–1644.
Vergani, M. (2010). Modellazione del degrado di strutture in
calcestruzzo armato soggette a corrosione [Damage model-
ing of reinforced concrete structures subjected to corrosion]
(Graduate thesis), Milan (in Italian): Politecnico di Milano.
Vidal, T., Castel, A., & Francois, R. (2004). Analyzing crack
width to predict corrosion in reinforced concrete. Cement
and Concrete Research, 34, 165–174.
Vidal, T., Castel, A., & Franc�ois, R. (2007). Corrosion process
and structural performance of a 17 years old reinforced
concrete beam stored in chloride environment. Cement and
Concrete Research, 37, 1551–1561.
Vu, K., Stewart, M.G., & Mullard, J. (2005). Corrosion-induced
cracking: experimental data and predictive models. ACI
Structural Journal, 102, 719–726.
Zhang, R., Castel, A., & Franc�ois, R. (2009). Concrete cover
cracking with reinforcement corrosion of RC beams during
chloride-induced corrosion process. Cement and Concrete
Research, 39, 1077–1086.
F. Biondini and M. Vergani532